Laser Direct Writing of Silver Clusters-Based Subwavelength ...
Upload
usherbrookeCategory
view
1download
0
Fabrication and THz loss measurementsof porous subwavelength fibers using a
directional coupler method
Alexandre Dupuis1, Jean-Francois Allard2, Denis Morris2,Karen Stoeffler1, Charles Dubois1, and Maksim Skorobogatiy1
www.photonics.phys.polymtl.ca
1 Ecole Polytechnique de Montreal, C.P. 6079, Centre-Ville Montreal, QC H3C 3A7, Canada
2 University of Sherbrooke, Department of Physics, Sherbrooke, QC J1K 2R1, Canada
Abstract: We report several strategies for the fabrication of poroussubwavelength fibers using low density Polyethylene plastic for low-lossterahertz light transmission applications. We also characterize transmissionlosses of the fabricated fibers in terahertz using a novel non-destructivedirectional coupler method. Within this method a second fiber is translatedalong the length of the test fiber to probe the power attenuation of a guidedmode. The method is especially suitable for measuring transmission lossesthrough short fiber segments, a situation in which standard cutback methodis especially difficult to perform. We demonstrate experimentally thatintroduction of porosity into a subwavelength rod fiber, further reducesits transmission loss by as much as a factor of 10. The lowest fiber lossmeasured in this work is 0.01cm−1 and it is exhibited by the 40% poroussubwavelength fiber of diameter 380 μm. For comparison, the loss of arod-in-the-air subwavelength fiber of a similar diameter was measured to be∼ 0.1cm−1, while the bulk loss of a PE plastic used in the fabrication ofsuch fibers is � 1cm−1. Finally, we present theoretical studies of the opticalproperties of individual subwavelength fibers and a directional coupler.From these studies we conclude that coupler setup studied in this paper alsoacts as a low pass filter with a cutoff frequency around 0.3THz. Consideringthat the spectrum of a terahertz source used in this work falls off rapidlybelow 0.25THz, the reported loss measurements are, thus, the bolometeraverages over the ∼ 0.25THz−0.3THz region.
© 2009 Optical Society of America
OCIS codes: (040.2235) Far infrared or terahertz; (060.2280) Fiber design and fabrication;(060.1810) Buffers, couplers, routers, switches, and multiplexers
References and links1. L.-J. Chen, H.-W. Chen, T.-F. Kao, J.-Y. Lu, and C.-K. Sun, “Low-loss subwavelength plastic fiber for terahertz
waveguiding”, Opt. Lett. 31, 306-308 (2006).2. R. Mendis and D. Grischkowsky, “Plastic ribbon THz waveguides,” J. Appl. Phys., 88, 4449-4451 (2000).3. A. Hassani, A. Dupuis, and M. Skorobogatiy, “Low Loss Microstructured Polymer THz Fibers,” Appl. Phys.
Lett. 92, 071101 (2008).4. K. Wang and M Mittleman, “Metal wires for terahertz wave guiding,” Nature 432, 376-379 (2004).
#108504 - $15.00 USD Received 9 Mar 2009; revised 27 Apr 2009; accepted 27 Apr 2009; published 29 Apr 2009
(C) 2009 OSA 11 May 2009 / Vol. 17, No. 10 / OPTICS EXPRESS 8012
5. R. Mendis and D. Grischkowsky, “THz interconnect with low-loss and low-group velocity dispersion,” IEEEMicro. Wireless Componen. Lett. 11, 444-446 (2001).
6. R. W. McGowan, G. Gallot, and D. Grischkowsky, “Propagation of ultrawideband short pulses of terahertz radi-ation through submillimeter-diameter circular waveguides,” Opt. Lett. 24, 1431-1433 (1999).
7. T. Hidaka, H. Minamide, H. Ito, J. Nishizawa, K. Tamura, and S. Ichikawa, “Ferroelectric PVDF cladding tera-hertz waveguide,” J. Lightwave Technol. 23, 2469-2473 (2005).
8. B. Bowden, J. A. Harrington, and O. Mitrofanov, “Fabrication of terahertz hollow-glass metallic waveguides withinner dielectric coatings,” J. Appl. Phys. 104, 093110 (2008).
9. J. A. Harrington, R. George, P. Pedersen, and E. Mueller, “Hollow polycarbonate waveguides with inner Cucoatings for delivery of terahertz radiation,” Opt. Express 12, 5263-5268 (2004).
10. T. Ito, Y. Matsuura, M. Miyagi, H. Minamide, and H. Ito, “Flexible terahertz fiber optics with low bend-inducedlosses,” J. Opt. Soc. Am. B 24, 1230-1235 (2007).
11. J.-Y. Lu, C.-P. Yu, H.-C. Chang, H.-W. Chen, Y.-T. Li, C.-L. Pan, and C.-K. Sun, “Terahertz air-core microstruc-ture fiber,” Appl. Phys. Lett. 92, 064105 (2008).
12. Y. F. Geng, X. L. Tan, P. Wang, and J. Q. Yao, “Transmission loss and dispersion in plastic terahertz photonicband-gap fibers,” Appl. Phys. B 91, 333-336 (2008).
13. M. Skorobogatiy and A. Dupuis, “Ferroelectric all-polymer hollow Bragg fibers for terahertz guidance,” Appl.Phys. Lett. 90, 113514 (2007).
14. A. Hassani, A. Dupuis, and M. Skorobogatiy, “Porous polymer fibers for low-loss Terahertz guiding,” Opt. Ex-press 16, 6340-6351 (2008).
15. S. Atakaramians, S. Afshar, B. M. Fischer, D. Abbott, and T. M. Monro, “Porous fibers: a novel approach to lowloss THz waveguides,” Opt. Express 16, 8845 (2008).
16. M. Nagel, A. Marchewka, and H. Kurz, “Low-index discontinuity terahertz waveguides,” Opt. Express 14, 9944-9954 (2006).
17. Y.-S. Jin, G.-J. Kim, and S.-Y. Jeon, “Terahertz Dielectric Properties of Polymers,” J. Korean Phys. Soc. 49,513-517 (2006).
18. A. Boudrioua and J. C. Loulergue, “New approach for loss measurements in optical planar waveguides,” Opt.Commun. 137, 37-40 (1997).
19. J.-Y. Lu, C.-C. Kuo, C.-M. Chiu, H.-W. Chen, Y.-J. Hwang, C.-L. Pan, and C.-K Sun, “THz interferometricimaging using subwavelength plastic fiber based THz endoscopes,” Opt. Express 16, 2494-2501 (2008).
20. H.-W. Chen, Y.-T. Li, C.-L. Pan, J.-L. Kuo, J.-Y. Lu, L.-J. Chen, and C.-K. Sun, “Investigation on spectral losscharacteristics of subwavelength terahertz fibers,” Opt. Lett. 32, 1017-1019 (2007).
21. A. Sengupta, A. Bandyopadhyay , B. F. Bowden, J. A. Harrington, and J. F. Federici, “Characterisation of olefincopolymers using terahertz spectroscopy,” Electronic Letters 42, 25 (2006).
22. J.-Y. Lu, C.-M. Chiu, C.-C. Kuo, C.-H. Lai, H.-C. Chang, Y.-J. Hwang, C.-L. Pan, and C.-K. Sun, “Terahertzscanning imaging with a subwavelength plastic fiber,” Appl. Phys. Lett. 92, 084102 (2008).
23. L. Tong, J. Lou, and E. Mazur, “Single-mode guiding properties of subwavelength-diameter silica and siliconwire waveguides,” Opt. Express 12, 1025 (2004).
24. M. Skorobogatiy and J. Yang, Fundamentals of Photonic Crystal Guiding (Cambridge University Press, 2009).
1. Introduction
In the past several years there have been promising technological demonstrations exploiting theterahertz (THz) frequency range for bio-medical sensing, spectroscopy, and non-invasive imag-ing applications. However, designing efficient waveguides for remote delivery of broadbandTHz radiation remains a challenging problem due to high absorption losses of most materialsin this spectral range. Many different designs have been investigated, including all-dielectric1–3
and metallized waveguides4–6 guiding by total internal reflection,1–3,7 metallic reflection,8–10
and photonic band gap.11–13 Of the many designs that have recently been explored, subwave-length dielectric wires,1 and subwavelength metallic wires,4 are among those with the lowestreported propagation losses (e.g. α � 0.01 cm−1 at ω=0.3 THz). The basic strategy for reduc-ing the waveguide propagation loss is to guide predominantly in the air because of its lowermaterial absorption loss. Thus, subwavelength dielectric wires act as a fiber core with a sub-stantial fraction of transmitted power guided in the surrounding air cladding. Such wires havevery delocalized modes, extending far into the air cladding, and are, thus, subjected to highcross-talk and large bending losses. The metallic wires guide using a Somerfeld wave confinedat the wire/air interface. Such a wave is also strongly delocalized in the air cladding, and thus
#108504 - $15.00 USD Received 9 Mar 2009; revised 27 Apr 2009; accepted 27 Apr 2009; published 29 Apr 2009
(C) 2009 OSA 11 May 2009 / Vol. 17, No. 10 / OPTICS EXPRESS 8013

is subject to the similar limitations as does a subwavelength dielectric wire. Additional com-plication for the metallic wires is that the guided mode is an azimuthally polarized surfaceplasmon making it difficult to excite with a regular linearly polarized emitter radiation. Overall,the simplicity of the fabrication process, and ease of input coupling has made the dielectricsubwavelength fiber an attractive technology for guiding THz light.
Recently, our group3,14 has proposed an improvement over the basic subwavelength fiberdesign by making the fiber core porous. Similar suggestion has later appeared also in.15 Theidea of adding holes into a subwavelength fiber is our extension of the earlier work of Nagel etal.16 In that work the authors have demonstrated that addition of a single subwavelength holeinto the center of a solid fiber core can result in strong field confinement inside such a hole.In this paper we consider a particular porous fiber design3 in which the fiber core diameteris comparable to the wavelength of transmitted light, while a periodic array of subwavelengthholes is inserted into the fiber core. Numerical simulations have demonstrated that the majorportion of THz power launched into such a porous fiber is confined within the air holes insideof the fiber core. As a result, coupling to the cladding environment is greatly reduced, whilethe modal absorption loss can be further reduced by a factor of 10 over the loss of a standardsubwavelength rod-in-the-air fiber of similar diameter. Moreover, when comparing porous fiberto the rod-in-the-air subwavelength fiber exhibiting the same transmission loss due to materialabsorption, we found that the effective refractive index of the porous fiber is significantly higherthan that of the rod-in-the-air fiber. Thus, the fundamental mode of a porous fiber is confinedstronger inside the fiber core, and it has a smaller modal area compared to the one of thefundamental mode of a comparable in loss standard subwavelength fiber. This, in turn, suggeststhat interaction with the cladding environment, as well as bending loss in porous fibers is muchsmaller than that in the rod-in-the-air fibers of comparable losses. Finally, as we demonstrateat the end of the paper, dispersion of a subwavelength porous fiber is much smaller than thedispersion of a standard rod-in-the-air fiber of similar diameter, which is again a major plus forthis new type of subwavelength fibers.
In this paper, we report on the fabrication and transmission loss measurements of severalporous subwavelength fibers, as well as rod-in-the-air fibers. We also present a novel andnon-destructive directional coupler (DC) method to measure the fiber transmission loss, thuscircumventing many technical problems encountered with the standard cutback measurementmethodology. We then demonstrate experimentally that porous fibers generally exhibit muchsmaller transmission losses than those of the rod-in-the-air fibers of comparable diameters. Fi-nally, we present finite element method (FEM) and semi-analytical simulations of the opticalproperties of the porous and rod-in-the-air subwavelength fibers, as well as a coupler based onsuch fibers. We further confirm our experimental findings with theoretical analysis.
2. Preform and fiber fabrication
All the fibers in this work were fabricated with linear low density polyethylene, Grade SclairFP120A, purchased from Nova Chemicals. Polyethylene (PE) is one of the polymers with thelowest material absorption losses17 (α < 2.5 cm−1 for ω < 2 THz). The test fiber diametersreported below are the averages of the fiber diameters at the two fiber ends. Variation of the testfiber diameter over its length was less than ±20μm for most of the fibers. The length of all thetest fibers was around 25cm.
Porous fibers were made using two different fabrication techniques. The first method is thestandard tube stacking technique. To achieve a fiber with a thin network of veins it is preferableto stack thin-walled tubes when making the fiber preform. Since such tubes were not availablecommercially, we fabricated thin-walled tubes (straws) by rolling 100 μm thick PE film withina 5 mm inner diameter metal tube followed by solidification and annealing in the oven. The
#108504 - $15.00 USD Received 9 Mar 2009; revised 27 Apr 2009; accepted 27 Apr 2009; published 29 Apr 2009
(C) 2009 OSA 11 May 2009 / Vol. 17, No. 10 / OPTICS EXPRESS 8014

g)NonPorousPE/PMMAPE Tubes
h)
i)
d)
e)
f)
a)
b)
c)
100μm 100μm 100μm
100μm 100μm 100μm
100μm 100μm 100μm
Porous Subwavelength Fibers for THz
PE rodPMMA rods
PE corePE straws
PE wrapping
epoxyend caps
Non PorousPE/PMMAPE Tubes
Porous THz Fiber Preforms
Fig. 1. Top: images of the three preform crossections. PE Tubes is a preform made bystacking 7 PE straws, which are then wrapped into several layers of PE film. Straw endswere sealed with epoxy resin for further drawing. PE/PMMA preform is made by densifi-cation of PE granules around 7 PMMA rods fixed inside a large PTFE tube. Finally, NonPorous preforms are made by densification of PE granules into a rod shape inside of a PTFEtube. Bottom: optical microscope images of the fiber cross-sections. a)-c) Porous PE fiberswith average diameters of 180, 240, and 325 μm made by stacking PE tubes. d)-f) PorousPE/PMMA fibers with average diameters of 285, 310, 380 μm made by dissolving PMMArods after drawing. g)-i) Non Porous rod-in-the-air PE fibers, with average diameters of220, 245, 410 μm.
resulting tubes had inner and outer diameters of 4.25 and 5 mm, respectively. Thus fabricatedstraws were subsequently stacked and an outer layer of PE film was rolled around the stack (seethe preform picture referred to as ”PE Tubes” in Fig. 1). The ends of the straws were sealed withepoxy glue to prevent hole collapse during drawing. This preform was then drawn into fiber at145oC and drawing speed of 0.5m/min. Whereas PE becomes soft at Tg ∼ 110oC, it only meltsand becomes drawable at higher temperatures. Trapping of air within the tubes only preventsthe complete hole collapse, while it does not prevent partial hole collapse (relative reduction ofthe hole size compared to the fiber diameter), which is an inherent feature of a drawing process,unless active hole pressurization is used. Therefore this type of fiber was drawn at a rather low
#108504 - $15.00 USD Received 9 Mar 2009; revised 27 Apr 2009; accepted 27 Apr 2009; published 29 Apr 2009
(C) 2009 OSA 11 May 2009 / Vol. 17, No. 10 / OPTICS EXPRESS 8015

temperature (145oC) in an attempt to reduce hole collapse (partial collapse). Cross-sections ofthe resultant fibers, designated as PE Tubes, are presented in Figs. 1(a)-(c). Using this fabri-cation method the porous microstructure was clearly achieved, however, the hole collapse wassignificant resulting in thick material veins.
The second method for the fabrication of porous PE fibers is a subtraction technique wherea part of a drawn all-solid fiber is dissolved in order to form air holes. We chose Poly(methylmethacrylate) (PMMA) as a sacrificial polymer as it can be easily dissolved in the tetrahy-drofuran (THF) solvent while leaving the PE plastic intact. The preform was fabricated in thefollowing manner. Seven PMMA rods (6.35 mm diameter), purchased from McMaster-CARR,were placed in a hexagonal array within a polytetrafluoroethylene (PTFE) tube (2.54 cm in-ner diameter) and the interstitial regions were filled with PE granules. Upon heating in theoven at 210oC, the PE granules densified around the PMMA tubes by forming a compositepreform (see the preform picture referred to as ”PE/PMMA” in Fig. 1). This preform was sub-sequently drawn into fiber at 210oC and drawing speed of 0.8m/min. Note that this arbitrarilyhigh temperature (210oC) was much higher than necessary (for PMMA Tg ∼ 140oC) in orderto insure that both polymers were melted enough to draw readily. Fiber segments of differentlengths and diameters were then submerged into the THF solvent for several days to etch awaythe PMMA inclusions. The fiber segments were subsequently left to dry for several days toallow solvent extraction by evaporation from within the fibers. Resulting fibers showed clearporous microstructure with thin material veins. Cross-sections of these fibers, designated as”PE/PMMA”, are presented in Figs. 1(d)-(f). The advantage of this technique is that hole col-lapse during drawing is avoided as fiber preform contains no holes.
A non porous fiber was fabricated using the same PE material as in the case of the two otherfibers. Granules were melted in a PTFE tube and compacted to remove air (see the preformpicture referred to as ”Non Porous” in Fig. 1). The preform was subsequently drawn into fiberat 160oC and drawing speed of 0.6m/min. The rod-in-the-air fibers (designated as ”Non Porous”in Figs. 1(g)-(i)) were then used as a benchmark for comparison with the porous fibers.
3. Directional coupler method for measuring fiber transmission loss
A standard technique for measuring fiber transmission loss is a cutback method. Within thismethod a direct power transmission through the fibers of different lengths is measured. Theinput end of the test fiber is fixed during the procedure, and all the cuts are performed at thefiber output end. By plotting transmission intensity versus fiber length on a log-log plot one canextract the fiber loss coefficient. The main advantage of this procedure is that it eliminates theneed to estimate the input coupling efficiency into the waveguide. While being a very powerfulmethod for measuring losses in telecommunication fibers, the standard cutback method have tobe modified to be applicable in the case of short fibers exhibiting high losses.
First of all, we note that the reference (background) signal, measured in the absence of a fiber,must be subtracted from the total signal, measured with the fiber in place, in order to obtain onlythe fiber contribution to the transmitted signal. In a typical cut-back setup where light sourceand a detector are well separated, such a background signal typically falls into the noise floorof a detector. However, in case of short fiber segments placed along a straight line between thelight source and detector, the background signal due to direct overlap of a remaining beam fromthe light source with a detector can be significant. If the background signal cannot be ignored,a direct approach is to attempt blocking the part of a beam not coupled into a waveguide byusing an aperture, or by inclining the waveguide so that the detector is out of the line of sightof a light source. If satisfactory blocking of the stray light from a light source is problematicone has to measure the background directly and subtract it from the measurement. In the caseof short length (∼25cm) subwavelength fibers that we sought to measure, the level of stray
#108504 - $15.00 USD Received 9 Mar 2009; revised 27 Apr 2009; accepted 27 Apr 2009; published 29 Apr 2009
(C) 2009 OSA 11 May 2009 / Vol. 17, No. 10 / OPTICS EXPRESS 8016

Fisherman's knot
Wikipedia
fsla
ser
BS
M L EPM1
PM2θTF
TF
θCF
BOL
CF
COUPFP
a)
0 0.6 1 2 1.8 2.4 30
0.5
1
Frequency (THz)
Sour
cepo
wer
[a.u
.]
Coupler holder
c)
PM1
PM2
BOL
COUP
CF
TFFP
b)
CF
TFTF
CF
Fig. 2. Experimental setup for measuring fiber transmission losses using the directionalcoupler method. a) Sketch of a setup. The directional coupler (COUP) assembly, consistingof a coupling fiber (CF) and a bolometer (BOL), is translated along the length of a test fiber(TF). Test fiber is placed at a θTF angle with respect to the axes of a focusing parabolicmirror (PM2), while coupling fiber is placed at θCF angle with respect to the test fiber. Suchplacement of the fibers is done to reduce background noise by insuring that the bolometeris placed outside of the THz light cone generated by the PM2 parabolic mirror. Also in thesketch - E: emitter, L: lens, M: mirror, BS: beam splitter. b) Photo of an experimental setup.Images of fibers are enhanced for visibility. Inset: THz source spectrum. c) Close-up viewof a directional coupler and a Fisherman’s knot used to space the two subwavelength fibersin a coupler.
light reaching the detector was relatively high, and our attempts to screen it were unsuccessfulbecause of the interference of a screen with highly delocalized in the air modes of the fibers.Therefore, we have resorted to direct measurements of the background signal.
Secondly, the cutback technique is a destructive method and is prone to errors due to varia-tions in the cleave quality and realignment of the fiber output end. This problem is especiallypronounced when working with a large input aperture THz bolometer. Because of the bolometerinternal optics, the amount of light actually sent onto the sensor surface is strongly dependent
#108504 - $15.00 USD Received 9 Mar 2009; revised 27 Apr 2009; accepted 27 Apr 2009; published 29 Apr 2009
(C) 2009 OSA 11 May 2009 / Vol. 17, No. 10 / OPTICS EXPRESS 8017
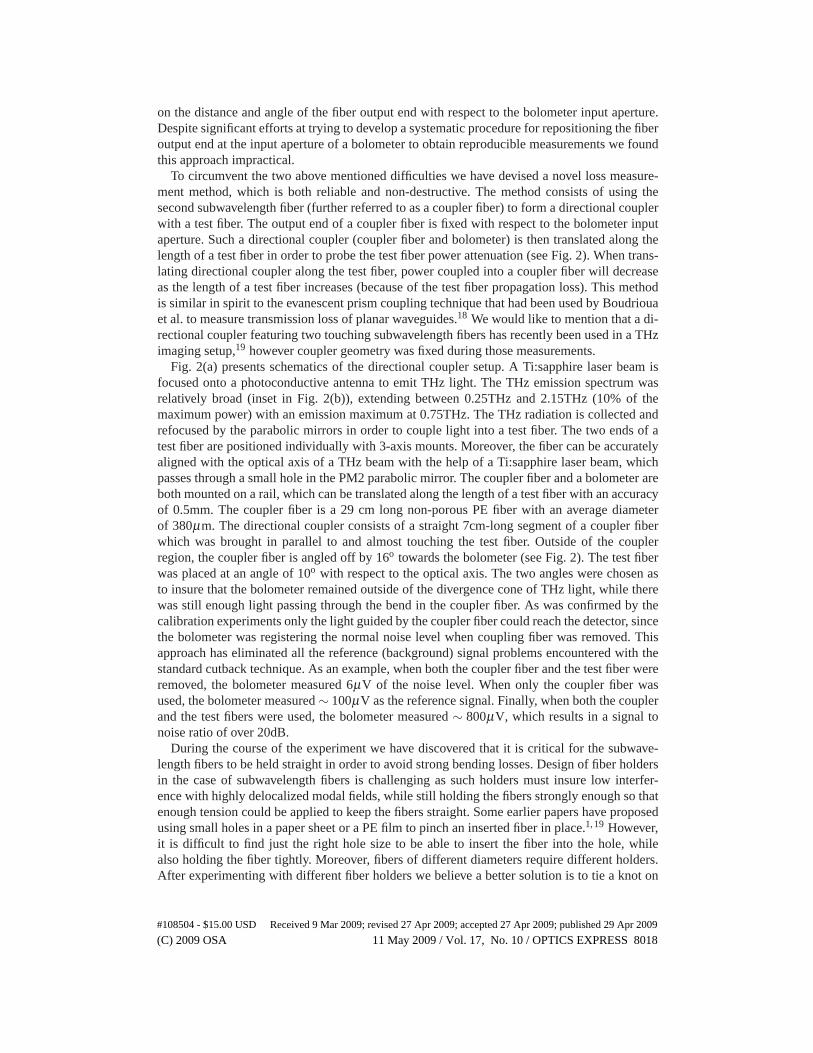
on the distance and angle of the fiber output end with respect to the bolometer input aperture.Despite significant efforts at trying to develop a systematic procedure for repositioning the fiberoutput end at the input aperture of a bolometer to obtain reproducible measurements we foundthis approach impractical.
To circumvent the two above mentioned difficulties we have devised a novel loss measure-ment method, which is both reliable and non-destructive. The method consists of using thesecond subwavelength fiber (further referred to as a coupler fiber) to form a directional couplerwith a test fiber. The output end of a coupler fiber is fixed with respect to the bolometer inputaperture. Such a directional coupler (coupler fiber and bolometer) is then translated along thelength of a test fiber in order to probe the test fiber power attenuation (see Fig. 2). When trans-lating directional coupler along the test fiber, power coupled into a coupler fiber will decreaseas the length of a test fiber increases (because of the test fiber propagation loss). This methodis similar in spirit to the evanescent prism coupling technique that had been used by Boudriouaet al. to measure transmission loss of planar waveguides.18 We would like to mention that a di-rectional coupler featuring two touching subwavelength fibers has recently been used in a THzimaging setup,19 however coupler geometry was fixed during those measurements.
Fig. 2(a) presents schematics of the directional coupler setup. A Ti:sapphire laser beam isfocused onto a photoconductive antenna to emit THz light. The THz emission spectrum wasrelatively broad (inset in Fig. 2(b)), extending between 0.25THz and 2.15THz (10% of themaximum power) with an emission maximum at 0.75THz. The THz radiation is collected andrefocused by the parabolic mirrors in order to couple light into a test fiber. The two ends of atest fiber are positioned individually with 3-axis mounts. Moreover, the fiber can be accuratelyaligned with the optical axis of a THz beam with the help of a Ti:sapphire laser beam, whichpasses through a small hole in the PM2 parabolic mirror. The coupler fiber and a bolometer areboth mounted on a rail, which can be translated along the length of a test fiber with an accuracyof 0.5mm. The coupler fiber is a 29 cm long non-porous PE fiber with an average diameterof 380μm. The directional coupler consists of a straight 7cm-long segment of a coupler fiberwhich was brought in parallel to and almost touching the test fiber. Outside of the couplerregion, the coupler fiber is angled off by 16o towards the bolometer (see Fig. 2). The test fiberwas placed at an angle of 10o with respect to the optical axis. The two angles were chosen asto insure that the bolometer remained outside of the divergence cone of THz light, while therewas still enough light passing through the bend in the coupler fiber. As was confirmed by thecalibration experiments only the light guided by the coupler fiber could reach the detector, sincethe bolometer was registering the normal noise level when coupling fiber was removed. Thisapproach has eliminated all the reference (background) signal problems encountered with thestandard cutback technique. As an example, when both the coupler fiber and the test fiber wereremoved, the bolometer measured 6μV of the noise level. When only the coupler fiber wasused, the bolometer measured ∼ 100μV as the reference signal. Finally, when both the couplerand the test fibers were used, the bolometer measured ∼ 800μV, which results in a signal tonoise ratio of over 20dB.
During the course of the experiment we have discovered that it is critical for the subwave-length fibers to be held straight in order to avoid strong bending losses. Design of fiber holdersin the case of subwavelength fibers is challenging as such holders must insure low interfer-ence with highly delocalized modal fields, while still holding the fibers strongly enough so thatenough tension could be applied to keep the fibers straight. Some earlier papers have proposedusing small holes in a paper sheet or a PE film to pinch an inserted fiber in place.1,19 However,it is difficult to find just the right hole size to be able to insert the fiber into the hole, whilealso holding the fiber tightly. Moreover, fibers of different diameters require different holders.After experimenting with different fiber holders we believe a better solution is to tie a knot on
#108504 - $15.00 USD Received 9 Mar 2009; revised 27 Apr 2009; accepted 27 Apr 2009; published 29 Apr 2009
(C) 2009 OSA 11 May 2009 / Vol. 17, No. 10 / OPTICS EXPRESS 8018

the fiber using a thin sewing thread. A knot holds the fiber tightly, remains low loss because ofthe small diameter of the thread, and easily accommodates fibers of different diameter. Note,however, that asymmetrical knots can apply torsion and bend the fiber tip. We therefore used asymmetrical Fisherman’s Knot and inserted the fiber between its two constituent simple knots(see inset in Fig. 2(c)). This technique was used to hold all the fibers. Finally, two knots wereused as separators between the test and coupler fibers to make sure that the distance betweenfibers in the coupler remained the same even when the coupler fiber was displaced along thetest fiber. The setup was aligned to ensure that during translations of the coupler the test fiberwas always just-touching the knots on the coupler fiber, while no extra bending was introducedat the coupler input and output ends (see Fig. 2 (c)). Finally, the knot size and, thus, the air gapbetween the two fibers was estimated to be ∼ 400μm in all the experiments.
0 1 2 3 4 5 60
1
2
3
4
5
x10-4
Δz [cm]
P[a
.u.]
PTotal d = 220 μmPRef d = 220 μm
0 2 4 6-10
-9.5
-9
-8.5
-8
Δz [cm]
ln(P
Fibe
r)
d = 220 μmFit
a) b)
Fig. 3. Example of the fiber attenuation measurement for a 220 μm average diameterrod-in-the-air fiber using the directional coupler method. a) Variation of power as a func-tion of a relative displacement (Δz) along the test fiber. Total and reference signals aremeasured with and without the test fiber, respectively. b) Fit of the fiber attenuation data(PFiber = PTotal − PRef).
Fig. 3 presents an example of the power attenuation measurement performed using the direc-tional coupler method. Fig. 3.(a) shows variation of power as a function of displacement (Δz)along the length of a test fiber. Note that the horizontal axis in the figure is not the absoluteposition from the input end of the test fiber, but the relative distance travelled by the coupleralong the test fiber. While the test fiber segments were ∼ 25cm in length, it is not necessaryto scan the entire length of the fiber in order to get enough points for the attenuation measure-ment. In our experiments we typically scanned between 6cm and 13cm of the test fiber. Thereference signal (red circles), measured by translating the coupler in the absence of a test fiber,is due to direct coupling of the THz light from the divergent cone produced by the parabolicmirror PM2 into the coupler fiber. The bolometer signal is modulated at 300 Hz and is sent toa lock-in amplifier. The values and error bars correspond to the average and standard deviationover the 500 bolometer measurements sampled over a ∼ 3min time span. The fiber transmis-sion is obtained by subtracting the reference signal from the signal measured with the test fiber(PFiber = PTotal−PRef). Fig. 3(b) shows the power attenuation in the test fiber as a function of thedisplacement (Δz) on a semi-logarithmic scale. The slope of the fit (PFiber(Δz)∼ e−αTF Δz) givesan estimate of the attenuation coefficient, in this case 0.21±0.05cm−1. Least squares linear fitwas used, taking into account the standard deviation of the ordinate values.
To understand how to interpret the experimental data presented in Fig. 3, let us begin byconsidering the case of a fixed wavelength at which both the test fiber and the coupler fiber
#108504 - $15.00 USD Received 9 Mar 2009; revised 27 Apr 2009; accepted 27 Apr 2009; published 29 Apr 2009
(C) 2009 OSA 11 May 2009 / Vol. 17, No. 10 / OPTICS EXPRESS 8019

are single moded. We denote PCF(z) to be the power measured at the end of a coupler fibertranslated over the distance z along the test fiber. We denote P0
TF to be the total power coupledinto the test fiber. We further assume that the coupling efficiency η between the two fibers isconstant along the whole length of a test fiber. Under these assumptions the test fiber attenuationcoefficient αTF , in principle, can be calculated from only two measurements:
PCF(z1) = η ·P0TF · exp(−αTF · z1 −αCF · zCF)
PCF(z2) = η ·P0TF · exp(−αTF · z2 −αCF · zCF)
α = 1z2−z1
ln(
PCF (z1)PCF (z2)
),
(1)
where αCF is the loss of a coupler fiber and zCF is the length of a coupler fiber. Equation (1) is asimple scaling law that describes a line on a semilog scale. While the strict minimum for fittinga line is two points, such a fit will be more accurate on multiple experimental points. The mainadvantage of the directional coupler method is that it is straightforward to measure many datapoints by simply displacing the coupler fiber along the test fiber (no cleaving or realignmentis required). This is an important part of the validation process as one can easily measure asmany points as deemed necessary for a satisfactory fit. Secondly, it should be noted that the useof a linear least squares fit yields maximum likelihood limits for the fitted slopes, which give amore accurate evaluation of the attenuation constant error bounds. These facts lead us to believethat the directional coupler method increases the accuracy and reliability of the loss estimatesin comparison to the propagation losses of subwavelength fibers previously determined by thecutback method.1
Strictly speaking, the data interpretation method expressed by (1) is only valid for a fre-quency resolved measurement. In our case we use a bolometer as a detector, therefore we couldonly register the spectral average of the power attenuation. This consideration is modified bythe fact that the 29cm-long coupler fiber (rod-in-the-air fiber), as well as the coupler itself actedeffectively as a low pass filter. Indeed, our theoretical simulations presented later in the papershow that two subwavelength fibers of 380μm diameter separated by 380μm air gap couplestrongly (at least 50% by power) only at frequencies smaller than ∼ 0.3THz, due to the other-wise strong confinement of the modal fields within the fiber cores. Moreover, absorption lossof the rod-in-the-air coupler fiber becomes sufficiently low (� 0.1cm−1) only at frequenciesbelow ∼ 0.3THz. Such low losses are required as a 29cm-long coupler fiber has to guide lightfrom the coupler all the way to the bolometer detector. Finally we show that the coupler fiberdispersion becomes low enough (� 1ps/(THz · cm)) only for frequencies below 0.25THz; asdispersion is directly related to the pulse spreading, low dispersion is necessary in order tomaintain high signal to noise ratio when transmitting over a significant distance. From theseconsiderations we conclude that the coupler fiber and evanescent coupler considered in thiswork act as the low-pass filters with a cut-off frequency in the 0.3THz range. Considering thatthe THz emission spectrum falls off rapidly below 0.25THz, the data presented in this paper canbe considered as a measurement of the fiber transmission losses in the near vicinity of 0.3THz.
4. Experimental results and discussion
The power attenuation of porous and non-porous subwavelength THz fibers of different di-ameter were measured using the directional coupler method. Each test fiber was first alignedwith the focal point of the PM2 parabolic mirror for input coupling and then brought parallelto the 7 cm straight segment of a coupler fiber. After every attenuation measurement, the testfiber was removed and the reference signal was acquired by displacing the coupler setup. Fig. 4presents the measured power attenuation as well as the data fits for each fiber type. Note slightvariation in the intensity of the reference signal from one measurement to another. We attribute
#108504 - $15.00 USD Received 9 Mar 2009; revised 27 Apr 2009; accepted 27 Apr 2009; published 29 Apr 2009
(C) 2009 OSA 11 May 2009 / Vol. 17, No. 10 / OPTICS EXPRESS 8020

such variations to the minor displacements of the coupler fiber, as well as small changes in theknot structure after the two subwavelength fibers were brought in mechanical contact with eachother.
0 2 4 6 8 10 12 140
1
2
3
4
5
6
7
8 x 10⁻⁴
Δz [cm]
P[a
.u.]
PTotal d = 220 μm
PTotal d = 245 μm
PTotal d = 410 μm
PRef d = 220 μm
PRef d = 245 μm
PRef d = 410 μm
a)
0 2 4 6 8 10 12 14-10
-9.5
-9
-8.5
-8
-7.5
-7
Δz [cm]
ln(P
Fibe
r)
d = 220 μmd = 245 μmd = 410 μmFit
0 2 4 6 80
1
2
3
4
5
6
7
8 x 10⁻⁴
Δ z [cm]
P[a
.u.]
PTotal d = 180 μm
PTotal d = 240 μm
PTotal d = 325 μm
PRef d = 180 μm
PRef d = 240 μm
PRef d = 325 μm
b)
0 1 2 3 4 5 6 7 8-10.5
-10
-9.5
-9
-8.5
-8
-7.5
-7
Δ z [cm]
ln(P
Fibe
r)
d = 180 μmd = 240 μmd = 325 μmFit
0 1 2 3 4 5 6 7 8-10
-9.5
-9
-8.5
-8
-7.5
Δ z [cm]
ln(P
Fibe
r)
d = 285 μmd = 310 μmd = 380 μmFit
0 2 4 6 80
1
2
3
4
5
x 10-4
Δ z [cm]
P[a
.u.]
PTotal d = 285 μm
PTotal d = 310 μm
PTotal d = 380 μm
PRef d = 285 μm
PRef d = 310 μm
PRef d = 380 μm
c)
Non Porous
PE Tubes
PE/PMMA
Fig. 4. Fiber loss measurements using the directional coupler method. Data is presented forall the porous and rod-in-the-air fibers of different diameters shown in Fig. 1. Plots on theleft show the Total and Reference signals measured with and without the test fiber. Plots onthe right show fits of the fiber attenuation data (PFiber = PTotal −PRef). a) Non Porous PEfibers. b) Porous PE/Tube fibers produced by straw stacking. c) Porous PE/PMMA fibersproduced by dissolving the PMMA rods.
Fig. 5 compiles the results presented in Fig. 4 by showing the measured attenuation coeffi-cient for fibers of different types as a function of the fiber diameter. Error bars correspond to themaximum likelihood limits of the fitted slopes considering the errors bars on the points of Fig.4 as standard deviations of normal distributions. From Fig. 5 we observe that all but one porousfibers exhibit smaller transmission losses than the rod-in-the-air fibers. We find that losses ofporous fibers increase as their diameter decreases.
To rationalize the results presented in Fig. 5 we note that the measured attenuation coeffi-cients are indicators of the total propagation loss which includes both material absorption andscattering on fiber imperfections. In our earlier work3 we showed that fiber porosity leads toadditional reduction in the subwavelength fiber absorption losses. Therefore, when comparing
#108504 - $15.00 USD Received 9 Mar 2009; revised 27 Apr 2009; accepted 27 Apr 2009; published 29 Apr 2009
(C) 2009 OSA 11 May 2009 / Vol. 17, No. 10 / OPTICS EXPRESS 8021

fibers of the same outer diameters, and under the assumption of comparable scattering loss, weexpect both porous fiber types to demonstrate losses smaller than those of the non-porous fibers.This overall tendency is confirmed in Fig. 5. Moreover, simulations of the next section suggestthat below 0.3THz, absorption loss of a PE/PMMA fiber should be about 10 times smaller thanabsorption loss of the rod-in-the-air fiber of a comparable diameter. Fig. 5, indeed, supports thisconclusion for the largest diameter PE/PMMA fiber.
Another interesting feature found in Fig. 5 is the increase in total fiber loss for smaller fiberdiameters. Although one expects the material attenuation loss to decrease when reducing thefiber diameter, this is overcompensated by the increase in the fiber scattering loss. Such lossesare due to modal scattering at various fiber defects, such as diameter fluctuations, impuritiesor kinks, and become more pronounced as the fiber diameter gets smaller. Moreover, for thecomparable fiber diameters, modal fields of the porous fibers are significantly more delocalizedthan the modal fields of a rod-in-the-air fiber. Therefore, for smaller fiber diameters we expecta stronger increase in the radiation loss of porous fibers compared to that for the rod-in-the-air fiber. We believe that this is what is observed for the PE/PMMA fiber, in particular (bluetriangles in Fig. 5). The effect of fiber diameter fluctuations on losses of subwavelength THzfibers has indeed been documented.20 By better controlling the fabrication process of porousfibers it should be possible to reduce the amount of fiber defects and, thus, reduce the radiationloss contribution.
0
0 .0 5
0 .1
0 .1 5
0 .2
0 .2 5
0 .3
1 5 0 2 0 0 2 5 0 3 0 0 3 5 0 4 0 0 4 5 0d fibe r [μm ]
α[c
m-1
]
Non -Porou sPE/ Tu be sPE/ PMMA
Fig. 5. Fiber attenuation coefficient as a function of the fiber diameter for various porousand non-porous PE subwavelength THz fibers.
From Fig. 5 we, therefore, conclude that all our measurements for the porous fibers are donein the regime where radiation loss becomes important. We also predict that when increasingthe diameter of porous fibers the radiation contribution to the total modal loss should decrease,while absorption loss should take over due to the onset of stronger modal confinement in thelarger diameter fiber cores.20 For non porous fibers we do observe in Fig. 5 the transition froma radiation dominated to the absorption dominated regime for the fiber diameters around 300−350μm. In fact, to support this statement we have performed one additional loss measurement
#108504 - $15.00 USD Received 9 Mar 2009; revised 27 Apr 2009; accepted 27 Apr 2009; published 29 Apr 2009
(C) 2009 OSA 11 May 2009 / Vol. 17, No. 10 / OPTICS EXPRESS 8022

(not shown on Fig. 5) for a non porous fiber of diameter 563μm for which the loss of 1cm−1 wasmeasured. We would also like to mention that in the literature there are several widely differentreported losses for bulk PE, ranging from ∼ 0.2cm−1 in Ref.21 to ∼ 2cm−1 in Ref.17 Ourmeasurements on non-porous fibers seem to support the value of the bulk PE loss of � 1cm−1.
We now comment on the relative losses of the two porous fiber types. From the fiber cross-sections we estimate d/Λ ∼ 0.32− 0.48 or porosity ∼ 8−18% for the PE/Tube fibers, andd/Λ ∼ 0.61−0.76 or porosity ∼ 29−45% for the PE/PMMA fibers. The higher porosity leadsus to expect lower absorption losses from the PE/PMMA fibers than from the PE/Tube fibers.From Fig. 5 we see that this conclusion holds for the PE/PMMA fiber of 380μm in diameter,while for the fibers of smaller diameters, losses of the PE/PMMA fibers are higher than thoseof the PE/Tube fibers. Although further studies are still needed to resolve the exact nature ofthis finding, we attribute it to higher radiation losses of the PE/PMMA fibers due to their higherporosity and stronger mode delocalization.
Finally, in passing, we comment on the bending loss of porous fibers. Qualitatively, poroussubwavelength fibers are highly sensitive to bending, similarly to their rod-in-the-air counter-parts. Theoretical simulations14 have shown, however, that bending loss of the porous fiberscan be significantly smaller than that of the rod-in-the-air fibers (when comparing fibers of sim-ilar absorption losses). Experimentally, it is exceedingly difficult to quantify the bending lossof a subwavelength fiber because of the modal evanescent fields that are strongly delocalizedoutside of a fiber core. Particularly, study of bending loss as a function of bending radius wouldrequire wrapping long (over several meters for subwavelength fibers) and uniform lengths offiber around circular mandrels of different radii. However, optical contact between a subwave-length fiber and a mandrel would lead to prohibitively high absorption and radiation losses dueto interference of the mandrel structure with evanescent fields of the fiber modes. At this time,we are still developing an experimental strategy for measuring bending loss of the subwave-length fibers, and therefore, we did not report fiber bending loss study in this paper.
Moreover, it can be also argued that for many applications of subwavelength fibers, theirbending loss could be a less important characteristics than, for example, a maximum deflectionangle in a kink introduced into the fiber structure. Indeed, in imaging applications involvingscanning of the fiber tip over the test surface, the fiber remains straight, while angle deflectionof the fiber tip is used for scanning. Lu et al., in particular, have carried out a systematic studyof loss as function of deflection angle for non porous subwavelength fibers.22 Qualitatively,we find that 25cm long fiber pieces can still transmit light even when deflected by as much as20deg.
5. Theoretical modelling of subwavelength fibers
In these last two sections we present theoretical modelling of the fundamental properties of theindividual subwavelength fibers and an evanescent fiber coupler. We start by calculating effec-tive refractive indices of the eigen modes of the free-standing porous and rod-in-the air fibers.Both fibers are assumed to have outer diameters of 380μm. Fiber material refractive index isthat of a low density polyethylene n = 1.516. Fiber material absorption loss is assumed to be1cm−1. In addition, porous fibers have 7 air holes of diameter dh = 95μm in their crossection.Hole-to-hole distance is taken to be Λ = 119μm.
From our simulations we first find that below ω = 0.53THz both subwavelength fibers aresingle moded. Dispersion relation and loss of a porous fiber are labelled as ”porous” in Figs.6(a,b) and are shown as blue solid lines, while those of a rod-in-the-air fiber are labelled as”rod” and are shown as red solid lines. Loss of a porous fiber becomes � 0.01cm−1 (100 timesless that that of a fiber material) when ω � 0.3THz, while in the same frequency range lossof a rod-in-the-air fiber becomes � 0.1cm−1. As experimentally measured loss of a porous
#108504 - $15.00 USD Received 9 Mar 2009; revised 27 Apr 2009; accepted 27 Apr 2009; published 29 Apr 2009
(C) 2009 OSA 11 May 2009 / Vol. 17, No. 10 / OPTICS EXPRESS 8023

0.2 0.25 0.3 0.35 0.4 0.45 0.5 0.5510−4
10−3
10−2
10−1
ω (THz)
n−1
poros-fiberrod-fiberspor (Ex)
spor (Ey)
s rod (Ex)
s rod (Ey)
single mode operation of the porous and rod-in-the-air fibers ω<0.53THz
cutoff for the spor supermodes
10−3
10−2
10−1
loss
(cm
)
−1
100
0.2 0.25 0.3 0.35 0.4 0.45 0.5 0.55ω (THz)
model fit
model fit
model fit
model fit
Max
0
0.50THz, neff=1.04535|Ex|
x (mm)
y (m
m)
0
1
-1 spor (Ex)
0.50THz, neff=1.22419|Ex|
y (m
m)
0
1
-1 s rod(Ex)
-1 0 1 2
x (mm)-1 0 1 2
0.36THz, neff=1.09085|Ex|
s rod (Ex)
x (mm)
y (m
m)
0
1
-1
y (m
m)
0
1
-1
-1 0 1 2
x (mm)-1 0 1 2
(Ex)spor
0.36THz, neff=1.00182|Ex|
0.28THz, nef f=1.02302|Ex|
s rod (Ex)
y (m
m)
0
1
-1x (mm)-1 0 1 2
0.28THz, nef f=1.00060|Ex|
por (Ex)
y (m
m)
0
1
-1x (mm)-1 0 1 2
0.28THz, nef f=1.02302|Ex|
rod (Ex)
y (m
m)
0
1
-1x (mm)-1 0 1 2
c)
a)
b)
coupler schematic
R T
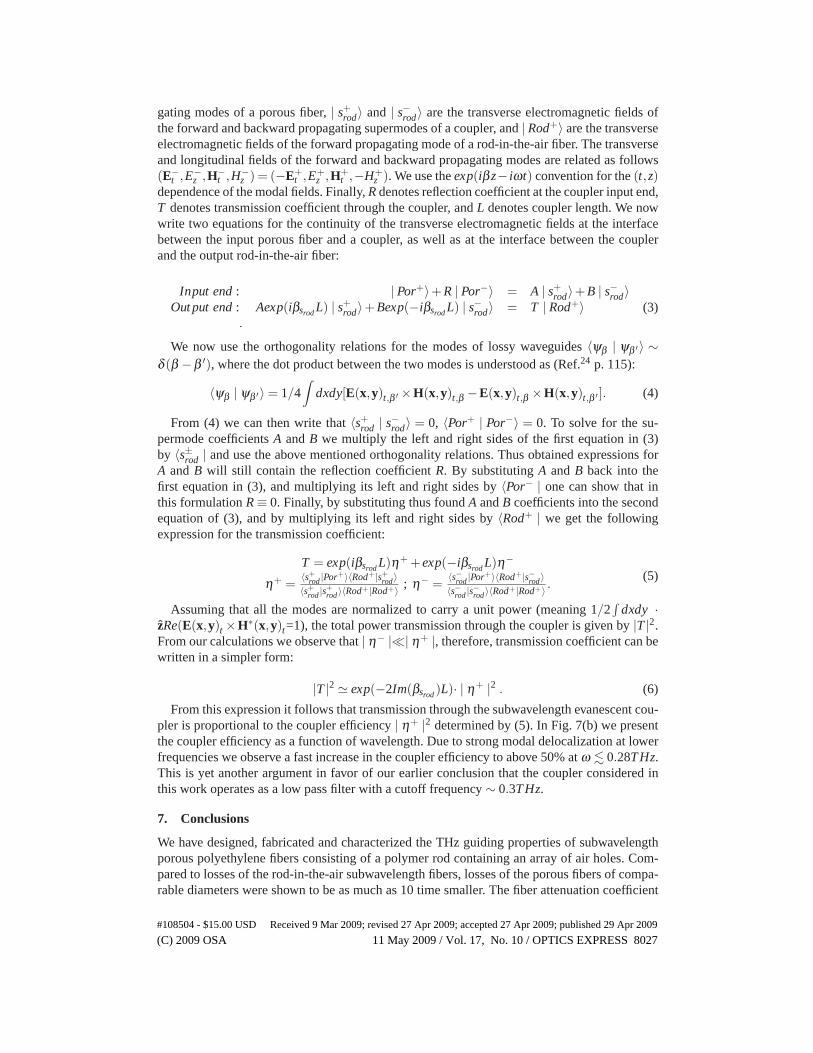
Fig. 6. Fundamental properties of a directional coupler made of two subwavelength fibers(porous and rod-in-the-air) of 380μm diameter separated by 380μm air gap. Both porousand rod-in-the air fibers are single moded at ω < 0.53THz. a) Refractive indices of theindividual fiber modes and corresponding coupler supermodes. Two of the four coupler su-permodes have a cut-off frequency of ω = 0.36THz, therefore below this frequency all theindividual fibers and a coupler are single moded. b) Modal losses, assuming fiber materialbulk absorption loss of 1cm−1. At any frequency losses of a porous fiber are significantlylower than these of a rod-in-the-air fiber. In a) and b), dotted lines show the theoreticalfits of the fiber refractive indices and losses derived using asymptotic formula (2). c) Fielddistributions in the fundamental modes of porous and rod-in-the-air fibers, as well as fielddistributions in the coupler supermodes at various frequencies. Observe strong couplingregime for ω � 0.35THz, and weak coupling regime at higher frequencies. Only linearlypolarized modes of X polarization are shown (dominant Ex component).
fiber is ∼ 0.01cm−1, while that of a rod-in-the-air fiber is ∼ 0.1cm−1, this logically indicatesthat our experimental measurements reflect fiber losses averaged over the low frequency rangeω � 0.3THz. Alternatively, we can reach the same conclusion by noticing that to arrive to abolometer detector, the radiation coupled from the test fiber via evanescent coupler into the cou-pler fiber has to first travel over 29cm-long rod-in-the-air fiber. To have less than 20dB loss overthe length of a coupler fiber (with a total 40dB power budget in our experiment) one requirespropagation loss of a coupler fiber smaller than 0.16cm−1, which is achievable at frequenciesbelow 0.28THz. Given that the spectral power of a THz source used in the experiment falls offrapidly below 0.25THz, we conclude that presented modal losses correspond to an averaged
#108504 - $15.00 USD Received 9 Mar 2009; revised 27 Apr 2009; accepted 27 Apr 2009; published 29 Apr 2009
(C) 2009 OSA 11 May 2009 / Vol. 17, No. 10 / OPTICS EXPRESS 8024

fiber loss in the relatively narrow 0.25THz−0.30THz range.In Figs. 6(a,b) in dashed lines we also show theoretical fits of the modal dispersion relations
and losses in the region of very low frequencies. As our simulations were performed using afinite element mode solver it was challenging to investigate the region of very low frequenciesdue to strong delocalization of modes of the subwavelength fibers (hence requiring very largecomputational cells). Complimentary to the FEM solver results, in the regime of subwavelengthguiding rk0 � 1, where r is a fiber radius, and k0 = 2π/λ is a free space wavevector, dispersionrelation of the fundamental HE11 mode of a rod-in-the-air fiber can be easily derived usingTaylor expansions of the governing eigen value equation (see, for example, eq. (9) of Ref.23).Particularly, by retaining all the terms up to the second order in a small parameter rk0 we canget:
ne f f −ncl =2
ncl(rk0)2 exp
(− n2
c +n2cl
n2cl(n
2c −n2
cl)2
(rk0)2
). (2)
In the expression above, ncl and nc are the cladding and core refractive indices respectively,and the formula is valid for any refractive index contrast as long as (ne f f −ncl)/ncl � 1. Notefrom Figs. 6(a,b) that (2) fits very well the real part of the modal refractive index of the rod-in-the-air fiber (as calculated using FEM solver) for all the frequencies ω < 0.35THz, except forthe lowest frequencies for which FEM results are somewhat unreliable. Moreover, fundamentalmode loss (imaginary part of the effective refractive index) is also fitted reasonably well bythe same formula in the same spectral region. For the rod-in-the-air fiber we used the same nc,ncl as for the FEM method (see the red dotted curves in Figs. 6(a,b)). Interestingly, dispersionrelation and loss of the fundamental mode of a subwavelength porous fiber can also be fittedwell with the same asymptotic expression (2). To get a good match, however, one needs to takeinto account porosity of the fiber core region. This can be done by choosing a smaller value forthe core refractive index nc, as well as by assuming a smaller loss of the fiber material. We findthat the best fit for the porous fiber dispersion relation and loss is achieved by taking nc = 1.24,and the core material absorption loss 0.5cm−1 (see the blue dotted curves in Figs. 6(a,b)).
0.29 0.3 0.31 0.32 0.33 0.34 0.350
0.05
0.1
0.15
0.2
0.25
0.3
0.35
0.4
0.45
0.5
ω (THz)
Cou
plin
g ef
ficie
ncy
|η |
(Ey)(Ex)
0.1 0.15 0.2 0.25 0.3 0.35 0.4 0.45 0.5 0.550
20
40
60
80
100
120
ω (THz)
D (p
s/(T
Hz
cm)
inout
0.28
D<1 ps/THz cm, ω<0.23 THz
D<1
ps/T
Hz
cm, ω
<0.1
7 TH
z
+ 2
Fig. 7. a) Fiber dispersion (solid lines) of the fundamental modes of a porous fiber anda rod-in-the-air fiber. Dispersion of a porous fiber is much smaller than that of a rod-in-the-air fiber for all frequencies. In dotted lines we show theoretical fit of the dispersionderived using asymptotic formula (2). b) Coupling efficiency of an evanescent coupler. Weassume all the incoming power in the fundamental mode of a porous fiber, while couplingefficiency is then defined as a power in the fundamental mode of an outgoing rod-in-the-airfiber.
Finally, by using dispersion relations from the FEM simulations and an asymptotic formula(2) we can calculate fiber dispersion D[ps/(THz · cm)] = d2β (ω)/d2ω (where β (ω) is the
#108504 - $15.00 USD Received 9 Mar 2009; revised 27 Apr 2009; accepted 27 Apr 2009; published 29 Apr 2009
(C) 2009 OSA 11 May 2009 / Vol. 17, No. 10 / OPTICS EXPRESS 8025

modal propagation constant) for the porous and rod-in-the-air fibers. In Fig. 7(a) fiber dispersionis presented as a function of frequency. We note that fiber dispersion reduces exponentially fastwith frequency in the regime of subwavelength guidance. Moreover, in this regime dispersionof the rod-in-the-air fiber is much higher that that of a porous fiber. To put the data shownin Fig. 7(a) in prospective we remind the reader that fiber dispersion is directly related to thepulse spreading. Particularly, assuming a temporal width of an input pulse τ0, after propagatingalong the length L of a fiber with dispersion D, the output pulse width will be Δτ = LD/τ0.Assuming that the average pulse power stays the same, spectral power density will decreaseroughly inversely proportional to the pulse width due to pulse spreading. This, in turn, canstrongly affect a signal to noise ratio. As an example, consider D = 1 ps/(THz · cm) and a30cm long fiber. For a typical 1ps-long THz input pulse, the output pulse width will then be30ps, thus decreasing a signal to noise ratio by ∼ 14dB. From Fig. 7(a) we see that dispersionof a porous fiber becomes less than 1 ps/(THz · cm) when ω � 0.23THz, while for the rod-in-the-air fiber it happens when ω � 0.17THz. This conclusion further supports our claim thata 29cm-long rod-in-the-air coupler fiber functions as a low pass filter. Indeed, for frequencieshigher than 0.2-0.3THz not only the fiber exhibits high attenuation loss, but it also exhibits highdispersion, which leads to further reduction of the signal to noise ratio due to pulse spreading.
6. Theoretical modelling of a directional coupler made of two subwavelength fibers
Finally, we investigate performance of an evanescent coupler operating at low frequencies atwhich both fibers making the coupler are guiding in a subwavelength regime. In Figs. 6(a,b) inthin solid curves with circles and crosses we present dispersion relations of the coupler super-modes. In what follows we only consider frequencies below 0.53THz at which both porous androd-in-the-air fibers are single moded. Due to mirror symmetry with respect to the X axis, cou-pler supermodes can be labelled as X or Y polarized depending whether the dominant compo-nent of their electric field is Ex or Ey. To indicate the supermode polarization, next to the modalname we also add in parenthesis the leading component of the electric field. Although X and Ypolarized modes of a coupler are not degenerate, from Figs. 6(a,b) we see that their dispersionrelations and losses remain very similar. In the frequency range 0.36THz < ω < 0.53THz thereare two types of supermodes. One mode labelled as ”spor” is a mode with most of its field lo-calized in the vicinity of a porous fiber. In the third row of Fig. 6(c) we present examples of thefield distributions in the X polarized fundamental mode of a porous fiber, as well as X polarizedspor supermodes of a coupler at three different frequencies. Interestingly, this supermode has acutoff at 0.36THz for both polarizations (see blue curves with crosses and circles in Fig. 6(a)).Therefore, below 0.36THz the coupler becomes single moded.
The second supermode of a coupler labelled as ”srod” is a mode with most of its field local-ized in the vicinity of a rod-in-the-air fiber. In the second row of Fig. 6(c) we present examplesof the field distributions in the X polarized srod supermodes at three different frequencies. No-tably, this supermode is a fundamental mode of a coupler and does not have a cutoff. Although,in principle, one of the polarizations of the srod supermode can have a cutoff at lower fre-quencies, in the 0.20THz < ω < 0.36THz frequency range the two polarizations are almostdegenerate (see red thin curves with crosses and circles in Fig. 6(a)). From the second row ofpictures in Fig. 6(c) we also conclude that when going to lower frequencies, the field of the srod
supermode gets strongly expelled from the core of a rod-in-the-air fiber. As a result, the fieldstarts having a substantial overlap with the porous fiber, thus leading to strong hybridization ofthe srod supermode.
The last question that we want to address is about the coupling efficiency of an evanescentcoupler studied experimentally in this paper. We first introduce the following notations. | Por+〉and | Por−〉 signify the transverse electromagnetic fields of the forward and backward propa-
#108504 - $15.00 USD Received 9 Mar 2009; revised 27 Apr 2009; accepted 27 Apr 2009; published 29 Apr 2009
(C) 2009 OSA 11 May 2009 / Vol. 17, No. 10 / OPTICS EXPRESS 8026
gating modes of a porous fiber, | s+rod〉 and | s−rod〉 are the transverse electromagnetic fields of
the forward and backward propagating supermodes of a coupler, and | Rod+〉 are the transverseelectromagnetic fields of the forward propagating mode of a rod-in-the-air fiber. The transverseand longitudinal fields of the forward and backward propagating modes are related as follows(E−
t ,E−z ,H−
t ,H−z ) = (−E+
t ,E+z ,H+
t ,−H+z ). We use the exp(iβ z− iωt) convention for the (t,z)
dependence of the modal fields. Finally, R denotes reflection coefficient at the coupler input end,T denotes transmission coefficient through the coupler, and L denotes coupler length. We nowwrite two equations for the continuity of the transverse electromagnetic fields at the interfacebetween the input porous fiber and a coupler, as well as at the interface between the couplerand the output rod-in-the-air fiber:
Input end : | Por+〉+R | Por−〉 = A | s+rod〉+B | s−rod〉
Out put end : Aexp(iβsrod L) | s+rod〉+Bexp(−iβsrod L) | s−rod〉 = T | Rod+〉
.(3)
We now use the orthogonality relations for the modes of lossy waveguides 〈ψβ | ψβ ′ 〉 ∼δ (β −β ′), where the dot product between the two modes is understood as (Ref.24 p. 115):
〈ψβ | ψβ ′ 〉 = 1/4∫
dxdy[E(x,y)t,β ′ ×H(x,y)t,β −E(x,y)t,β ×H(x,y)t,β ′ ]. (4)
From (4) we can then write that 〈s+rod | s−rod〉 = 0, 〈Por+ | Por−〉 = 0. To solve for the su-
permode coefficients A and B we multiply the left and right sides of the first equation in (3)by 〈s±rod | and use the above mentioned orthogonality relations. Thus obtained expressions forA and B will still contain the reflection coefficient R. By substituting A and B back into thefirst equation in (3), and multiplying its left and right sides by 〈Por− | one can show that inthis formulation R ≡ 0. Finally, by substituting thus found A and B coefficients into the secondequation of (3), and by multiplying its left and right sides by 〈Rod+ | we get the followingexpression for the transmission coefficient:
T = exp(iβsrod L)η+ + exp(−iβsrod L)η−
η+ = 〈s+rod |Por+〉〈Rod+|s+rod〉〈s+rod |s+rod〉〈Rod+|Rod+〉 ; η− = 〈s−rod |Por+〉〈Rod+|s−rod〉
〈s−rod |s−rod〉〈Rod+|Rod+〉 .(5)
Assuming that all the modes are normalized to carry a unit power (meaning 1/2∫
dxdy ·zRe(E(x,y)t ×H∗(x,y)t=1), the total power transmission through the coupler is given by |T |2.From our calculations we observe that | η− |�| η+ |, therefore, transmission coefficient can bewritten in a simpler form:
|T |2 � exp(−2Im(βsrod )L)· | η+ |2 . (6)
From this expression it follows that transmission through the subwavelength evanescent cou-pler is proportional to the coupler efficiency | η+ |2 determined by (5). In Fig. 7(b) we presentthe coupler efficiency as a function of wavelength. Due to strong modal delocalization at lowerfrequencies we observe a fast increase in the coupler efficiency to above 50% at ω � 0.28THz.This is yet another argument in favor of our earlier conclusion that the coupler considered inthis work operates as a low pass filter with a cutoff frequency ∼ 0.3THz.
7. Conclusions
We have designed, fabricated and characterized the THz guiding properties of subwavelengthporous polyethylene fibers consisting of a polymer rod containing an array of air holes. Com-pared to losses of the rod-in-the-air subwavelength fibers, losses of the porous fibers of compa-rable diameters were shown to be as much as 10 time smaller. The fiber attenuation coefficient
#108504 - $15.00 USD Received 9 Mar 2009; revised 27 Apr 2009; accepted 27 Apr 2009; published 29 Apr 2009
(C) 2009 OSA 11 May 2009 / Vol. 17, No. 10 / OPTICS EXPRESS 8027

was measured by a novel and non-destructive directional coupler method. In the vicinity of0.3THz, the loss of a 380μm diameter porous fiber with ∼ 40% porosity was measured to be0.01cm−1 = 4.34dB/m. Finally, we present theoretical studies of the optical properties of in-dividual subwavelength fibers and a directional coupler. From these studies we conclude thatcoupler setup studied in this paper also acts as a low pass filter with a cutoff frequency around0.3THz. Considering that the spectrum of a terahertz source used in this work falls off rapidlybelow 0.25THz, the reported loss measurements are, thus, the bolometer averages over the∼ 0.25THz−0.3THz region.
Acknowledgments
This work is supported in part by the Canada Research Chair program and the Canada Institutefor Photonic Innovations project FP3.
#108504 - $15.00 USD Received 9 Mar 2009; revised 27 Apr 2009; accepted 27 Apr 2009; published 29 Apr 2009
(C) 2009 OSA 11 May 2009 / Vol. 17, No. 10 / OPTICS EXPRESS 8028
Copyright © 2022 FDOKUMEN