
Effects of 4-nonylphenol on blood cells of the African catfish Clarias gariepinus (Burchell, 1822
2012 83EVALUATING δ18O PROFILES OF HARDHEAD CATFISH
CHAPTER 4EVALUATING δ18O PROFILES OF HARDHEAD
CATFISH AND ATLANTIC CROAKER OTOLITHSAS A METHOD OF DETERMINING
SEASONAL USE OF FISHESCarol E. Colaninno1
Documenting seasonal resource use among human populations is a central aspect of archae-ological research. For coastal locations of the southeastern United States, studies of seasonal resource use have focused on molluscs, and for good reason. Molluscs, including oysters (Cras-sostrea virginica) and hard clams (Mercenaria spp.), generally are abundant at these locations; there is a correlation between incremental for-mation and yearly, seasonal environmental os-cillations; and shell CaCO3 (calcium carbonate) precipitates in oxygen isotope equilibrium with the ambient water in which shell forms (Gross-man and Ku, 1986; Quitmyer, Jones, and Ar-nold, 1997; Andrus and Crowe, 2000; Andrus and Crowe, 2008). This allows researchers to examine patterns in incremental formations and the ratio of stable oxygen isotopes (18O/16O, ex-pressed as δ18O) at the terminal band and in prior bands to determine the season in which people captured the organism (Quitmyer, Hale, and Jones, 1985; Quitmyer, Jones, and Arnold, 1997; Andrus and Crowe, 2000, 2008; O’Brien and Thomas, 2008; Thompson and Andrus, 2011). These studies were instrumental in document-ing year-round occupations, as well as locations used seasonally (Quitmyer, Jones, and Arnold, 1997; Andrus and Crowe, 2008; Thompson and Andrus, 2011).
Although oyster and hard clam studies are es-sential for characterizing seasonal resource use, they do so for only two organisms, oysters and clams. Zooarchaeological research at coastal southeastern sites shows that over a hundred dif-ferent animals were used in the past, in addition to oysters and clams (Colaninno, 2010; Reitz et al.,
2010a: 54–57; Reitz et al., chap. 3, this volume). These resources include a diverse array of estua-rine fishes along with numerous other aquatic and terrestrial animals. Investigating seasonal use of nonmolluscan taxa, particularly fishes, provides further information about past land and estuarine use patterns, resource intensification, and social complexity. It is an area of research that largely is unexplored in the southeastern United States.
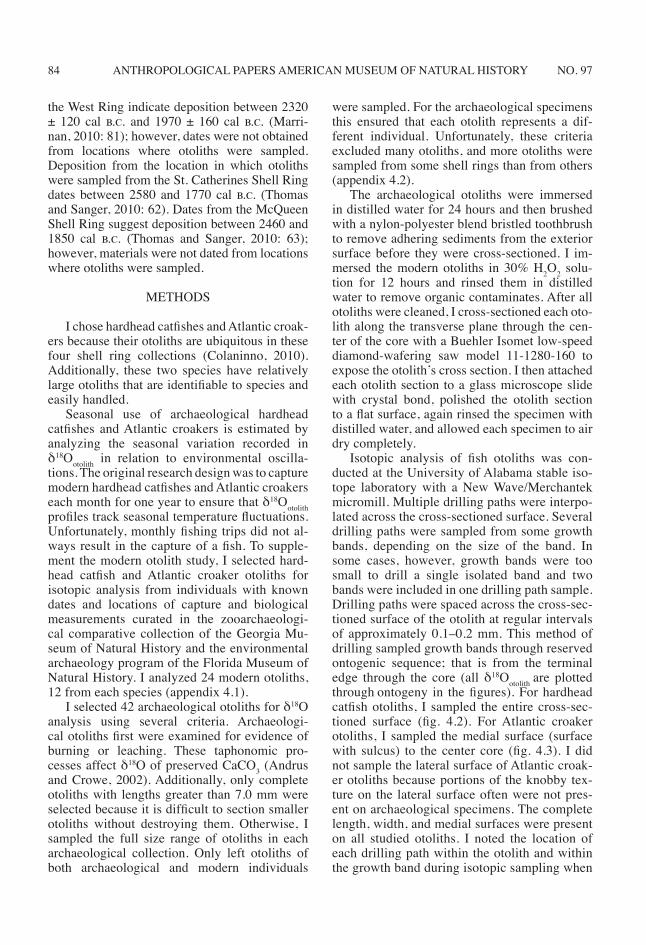
This chapter examines seasonal use of two fish species: hardhead catfish (Ariopsis felis) and Atlantic croaker (Micropogonias undu-latus). I examine δ18Ootolith profiles of modern hardhead catfishes and Atlantic croakers to de-termine whether δ18Ootolith profiles track seasonal temperature oscillations. Seasonal temperature oscillations observed in modern δ18Ootolith are applied to archaeological δ18Ootolith to determine past seasonal temperature oscillations and the season in which people captured these fishes. The archaeological otoliths are from four Late Archaic shell rings (2550–1000 cal b.c.) lo-cated on the Georgia coast: the Cannon’s Point (9GN57) and West rings (9GN76) of St. Simons Island, and the St. Catherines (9Li231) and Mc-Queen shell rings (9LIi648) of St. Catherines Island (fig. 4.1).
Shell rings are complex structures having in-tricate stratigraphic sequences representing mul-tiple cultural and natural processes (Marrinan, 2010: 80; Sanger and Thomas, 2010: 55; Kennett and Culleton, chap. 2, this volume; Thompson and Andrus, 2011). Radiocarbon dates indicate that otoliths from the Cannon’s Point Ring were deposited between 2760 ± 120 cal b.c. and 2200 ± 140 cal b.c. (Marrinan, 2010: 81). Dates from
ANTHROPOLOGICAL PAPERS AMERICAN MUSEUM OF NATURAL HISTORY 84 NO. 97
the West Ring indicate deposition between 2320 ± 120 cal b.c. and 1970 ± 160 cal b.c. (Marri-nan, 2010: 81); however, dates were not obtained from locations where otoliths were sampled. Deposition from the location in which otoliths were sampled from the St. Catherines Shell Ring dates between 2580 and 1770 cal b.c. (Thomas and Sanger, 2010: 62). Dates from the McQueen Shell Ring suggest deposition between 2460 and 1850 cal b.c. (Thomas and Sanger, 2010: 63); however, materials were not dated from locations where otoliths were sampled.
METHODS
I chose hardhead catfishes and Atlantic croak-ers because their otoliths are ubiquitous in these four shell ring collections (Colaninno, 2010). Additionally, these two species have relatively large otoliths that are identifiable to species and easily handled.
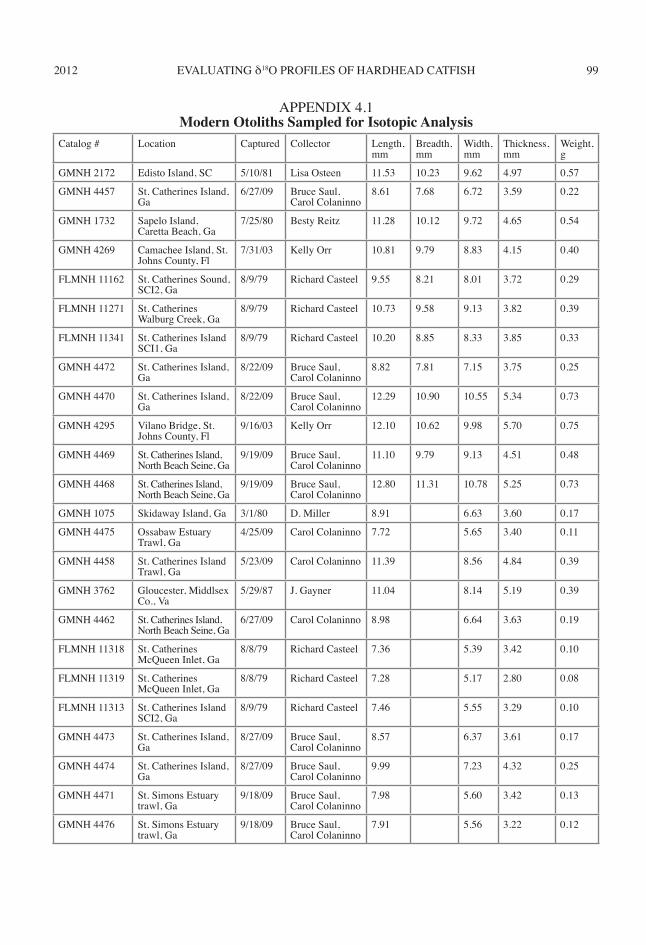
Seasonal use of archaeological hardhead catfishes and Atlantic croakers is estimated by analyzing the seasonal variation recorded in δ18Ootolith in relation to environmental oscilla-tions. The original research design was to capture modern hardhead catfishes and Atlantic croakers each month for one year to ensure that δ18Ootolith profiles track seasonal temperature fluctuations. Unfortunately, monthly fishing trips did not al-ways result in the capture of a fish. To supple-ment the modern otolith study, I selected hard-head catfish and Atlantic croaker otoliths for isotopic analysis from individuals with known dates and locations of capture and biological measurements curated in the zooarchaeologi-cal comparative collection of the Georgia Mu-seum of Natural History and the environmental archaeology program of the Florida Museum of Natural History. I analyzed 24 modern otoliths, 12 from each species (appendix 4.1).
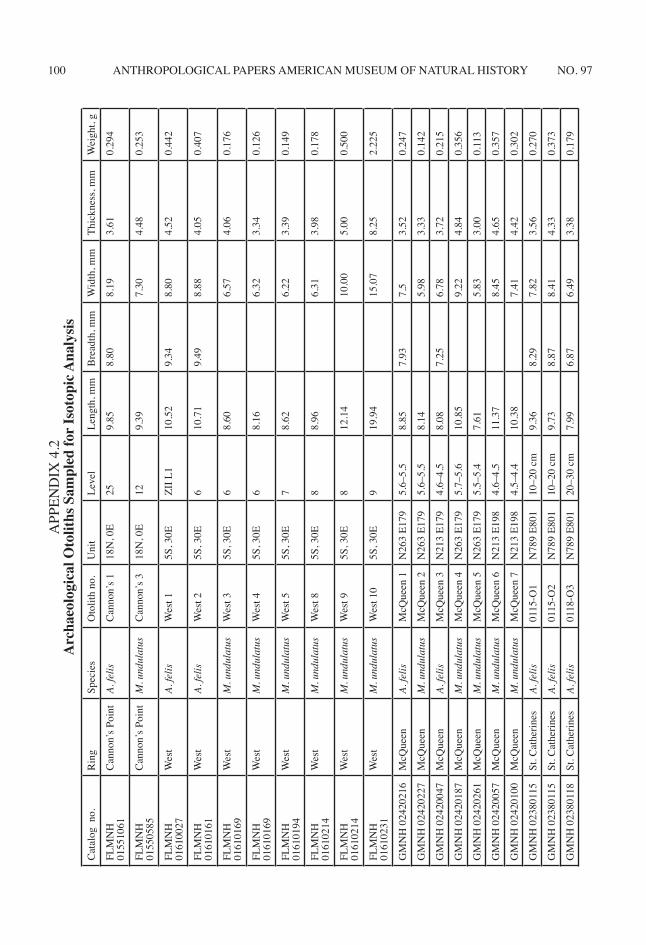
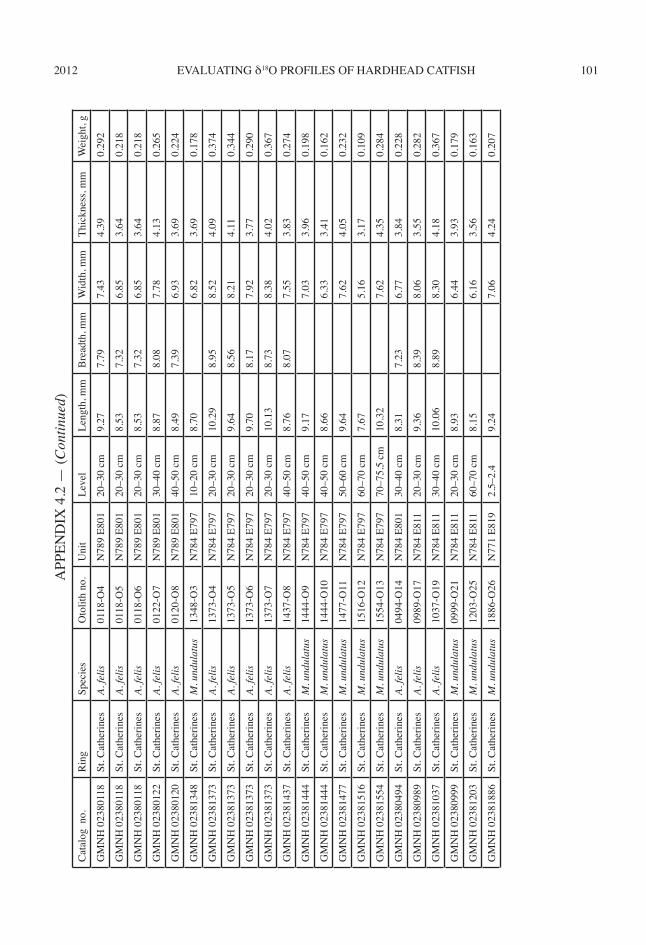
I selected 42 archaeological otoliths for δ18O analysis using several criteria. Archaeologi-cal otoliths first were examined for evidence of burning or leaching. These taphonomic pro-cesses affect δ18O of preserved CaCO3 (Andrus and Crowe, 2002). Additionally, only complete otoliths with lengths greater than 7.0 mm were selected because it is difficult to section smaller otoliths without destroying them. Otherwise, I sampled the full size range of otoliths in each archaeological collection. Only left otoliths of both archaeological and modern individuals
were sampled. For the archaeological specimens this ensured that each otolith represents a dif-ferent individual. Unfortunately, these criteria excluded many otoliths, and more otoliths were sampled from some shell rings than from others (appendix 4.2).
The archaeological otoliths were immersed in distilled water for 24 hours and then brushed with a nylon-polyester blend bristled toothbrush to remove adhering sediments from the exterior surface before they were cross-sectioned. I im-mersed the modern otoliths in 30% H2O2 solu-tion for 12 hours and rinsed them in distilled water to remove organic contaminates. After all otoliths were cleaned, I cross-sectioned each oto-lith along the transverse plane through the cen-ter of the core with a Buehler Isomet low-speed diamond-wafering saw model 11-1280-160 to expose the otolith’s cross section. I then attached each otolith section to a glass microscope slide with crystal bond, polished the otolith section to a flat surface, again rinsed the specimen with distilled water, and allowed each specimen to air dry completely.
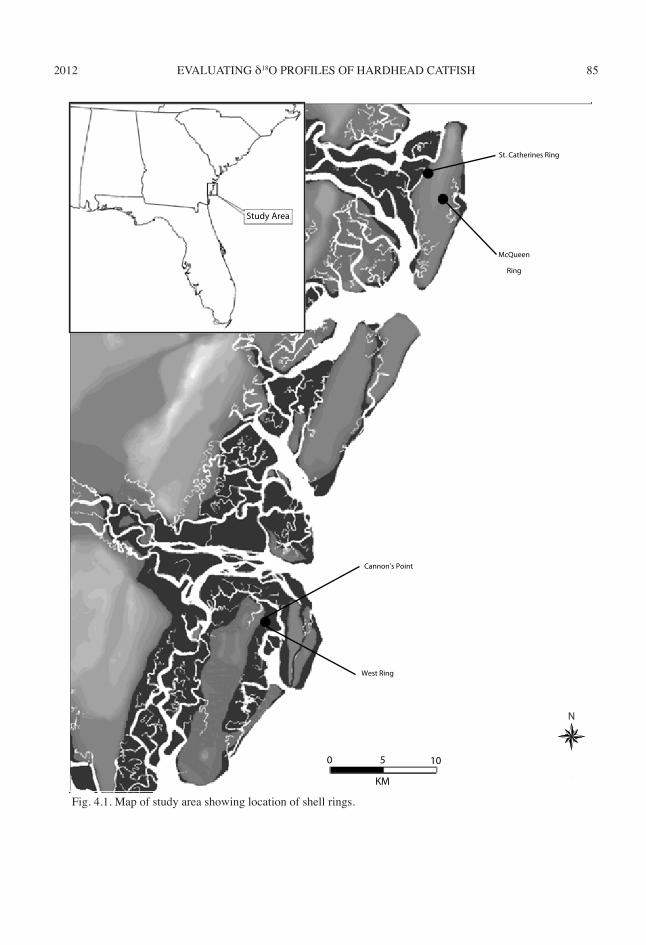
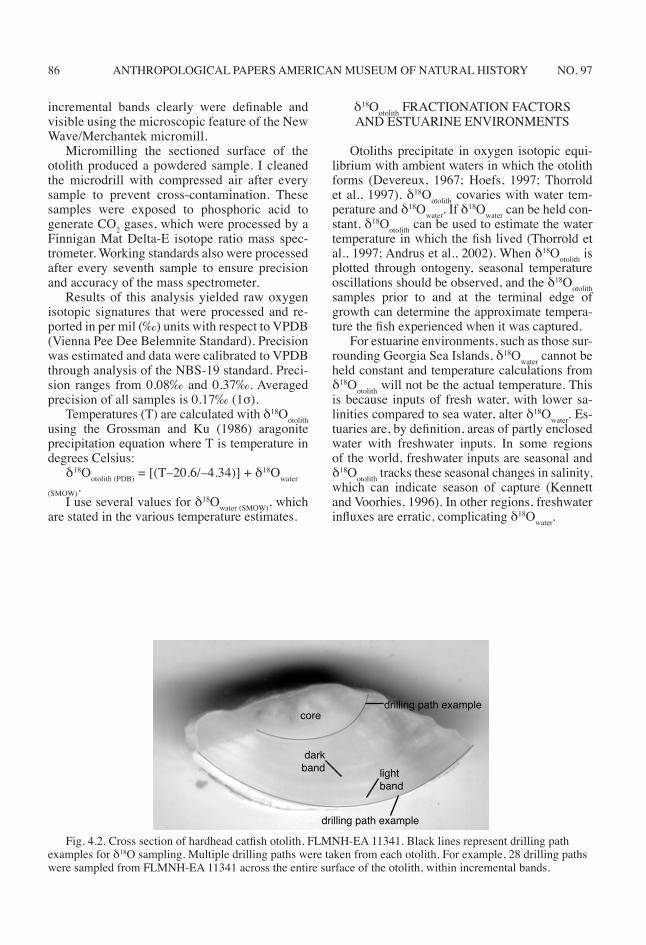
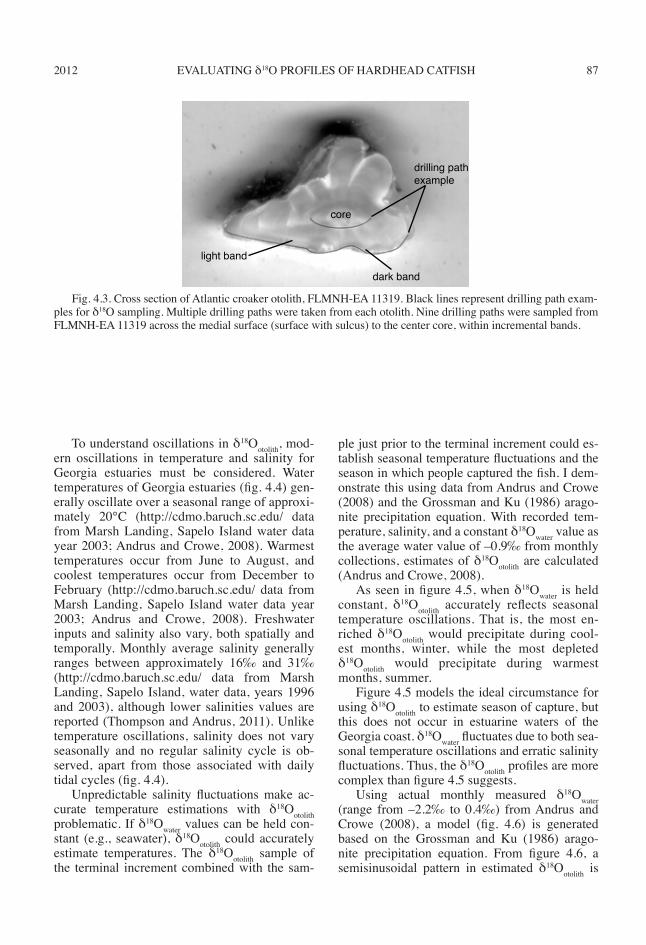
Isotopic analysis of fish otoliths was con-ducted at the University of Alabama stable iso-tope laboratory with a New Wave/Merchantek micromill. Multiple drilling paths were interpo-lated across the cross-sectioned surface. Several drilling paths were sampled from some growth bands, depending on the size of the band. In some cases, however, growth bands were too small to drill a single isolated band and two bands were included in one drilling path sample. Drilling paths were spaced across the cross-sec-tioned surface of the otolith at regular intervals of approximately 0.1–0.2 mm. This method of drilling sampled growth bands through reserved ontogenic sequence; that is from the terminal edge through the core (all δ18Ootolith are plotted through ontogeny in the figures). For hardhead catfish otoliths, I sampled the entire cross-sec-tioned surface (fig. 4.2). For Atlantic croaker otoliths, I sampled the medial surface (surface with sulcus) to the center core (fig. 4.3). I did not sample the lateral surface of Atlantic croak-er otoliths because portions of the knobby tex-ture on the lateral surface often were not pres-ent on archaeological specimens. The complete length, width, and medial surfaces were present on all studied otoliths. I noted the location of each drilling path within the otolith and within the growth band during isotopic sampling when
2012 85EVALUATING δ18O PROFILES OF HARDHEAD CATFISH
Fig. 4.1. Map of study area showing location of shell rings.
Study Area
0 5 10
KM
N
West Ring
Cannon’s Point
St. Catherines Ring
McQueen
Ring
ANTHROPOLOGICAL PAPERS AMERICAN MUSEUM OF NATURAL HISTORY 86 NO. 97
incremental bands clearly were definable and visible using the microscopic feature of the New Wave/Merchantek micromill.
Micromilling the sectioned surface of the otolith produced a powdered sample. I cleaned the microdrill with compressed air after every sample to prevent cross-contamination. These samples were exposed to phosphoric acid to generate CO2 gases, which were processed by a Finnigan Mat Delta-E isotope ratio mass spec-trometer. Working standards also were processed after every seventh sample to ensure precision and accuracy of the mass spectrometer.
Results of this analysis yielded raw oxygen isotopic signatures that were processed and re-ported in per mil (‰) units with respect to VPDB (Vienna Pee Dee Belemnite Standard). Precision was estimated and data were calibrated to VPDB through analysis of the NBS-19 standard. Preci-sion ranges from 0.08‰ and 0.37‰. Averaged precision of all samples is 0.17‰ (1σ).
Temperatures (T) are calculated with δ18Ootolith using the Grossman and Ku (1986) aragonite precipitation equation where T is temperature in degrees Celsius:
δ18Ootolith (PDB) = [(T–20.6/–4.34)] + δ18Owater
(SMOW).I use several values for δ18Owater (SMOW), which
are stated in the various temperature estimates.
δ18Ootolith FRACTIONATION FACTORSAND ESTUARINE ENVIRONMENTS
Otoliths precipitate in oxygen isotopic equi-librium with ambient waters in which the otolith forms (Devereux, 1967; Hoefs, 1997; Thorrold et al., 1997). δ18Ootolith covaries with water tem-perature and δ18Owater. If δ
18Owater can be held con-stant, δ18Ootolith can be used to estimate the water temperature in which the fish lived (Thorrold et al., 1997; Andrus et al., 2002). When δ18Ootolith is plotted through ontogeny, seasonal temperature oscillations should be observed, and the δ18Ootolith samples prior to and at the terminal edge of growth can determine the approximate tempera-ture the fish experienced when it was captured.
For estuarine environments, such as those sur-rounding Georgia Sea Islands, δ18Owater cannot be held constant and temperature calculations from δ18Ootolith will not be the actual temperature. This is because inputs of fresh water, with lower sa-linities compared to sea water, alter δ18Owater. Es-tuaries are, by definition, areas of partly enclosed water with freshwater inputs. In some regions of the world, freshwater inputs are seasonal and δ18Ootolith tracks these seasonal changes in salinity, which can indicate season of capture (Kennett and Voorhies, 1996). In other regions, freshwater influxes are erratic, complicating δ18Owater.
drilling path example
lightband
darkband
coredrilling path example
Fig. 4.2. Cross section of hardhead catfish otolith, FLMNH-EA 11341. Black lines represent drilling path examples for δ18O sampling. Multiple drilling paths were taken from each otolith. For example, 28 drilling paths were sampled from FLMNH-EA 11341 across the entire surface of the otolith, within incremental bands.
2012 87EVALUATING δ18O PROFILES OF HARDHEAD CATFISH
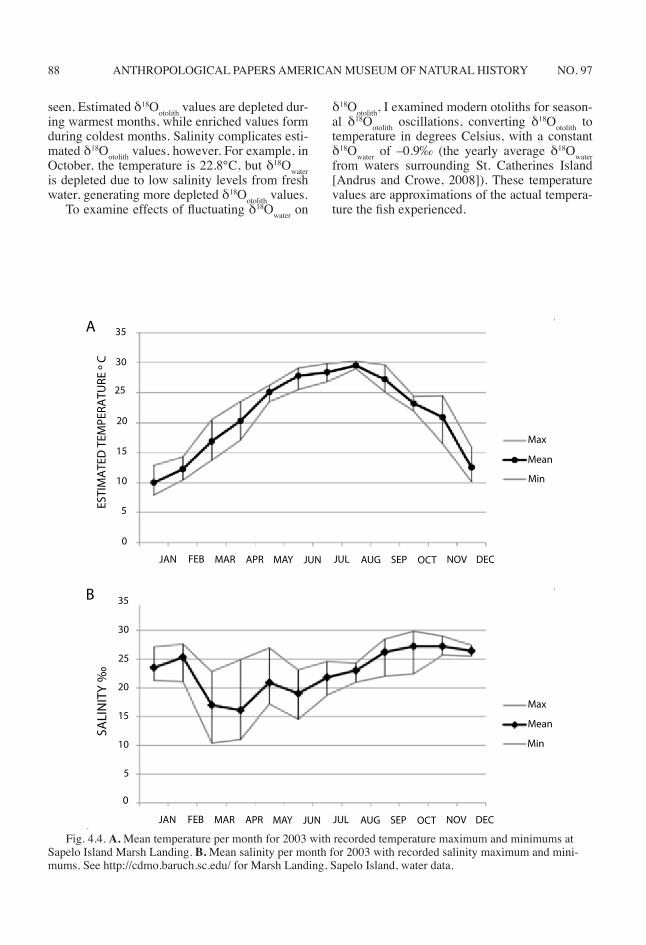
To understand oscillations in δ18Ootolith, mod-ern oscillations in temperature and salinity for Georgia estuaries must be considered. Water temperatures of Georgia estuaries (fig. 4.4) gen-erally oscillate over a seasonal range of approxi-mately 20°C (http://cdmo.baruch.sc.edu/ data from Marsh Landing, Sapelo Island water data year 2003; Andrus and Crowe, 2008). Warmest temperatures occur from June to August, and coolest temperatures occur from December to February (http://cdmo.baruch.sc.edu/ data from Marsh Landing, Sapelo Island water data year 2003; Andrus and Crowe, 2008). Freshwater inputs and salinity also vary, both spatially and temporally. Monthly average salinity generally ranges between approximately 16‰ and 31‰ (http://cdmo.baruch.sc.edu/ data from Marsh Landing, Sapelo Island, water data, years 1996 and 2003), although lower salinities values are reported (Thompson and Andrus, 2011). Unlike temperature oscillations, salinity does not vary seasonally and no regular salinity cycle is ob-served, apart from those associated with daily tidal cycles (fig. 4.4).
Unpredictable salinity fluctuations make ac-curate temperature estimations with δ18Ootolith problematic. If δ18Owater values can be held con-stant (e.g., seawater), δ18Ootolith could accurately estimate temperatures. The δ18Ootolith sample of the terminal increment combined with the sam-
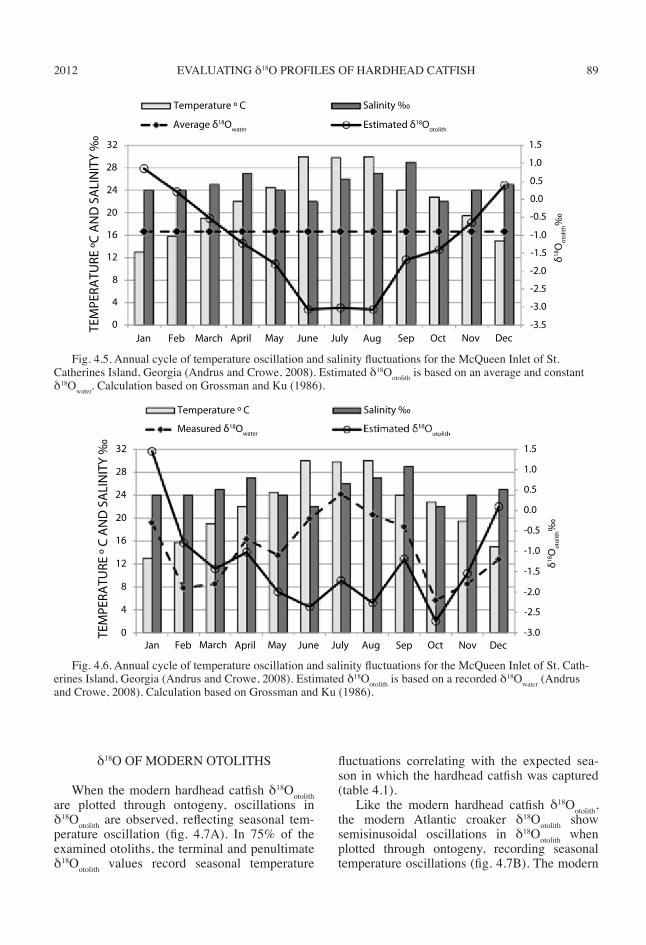
ple just prior to the terminal increment could es-tablish seasonal temperature fluctuations and the season in which people captured the fish. I dem-onstrate this using data from Andrus and Crowe (2008) and the Grossman and Ku (1986) arago-nite precipitation equation. With recorded tem-perature, salinity, and a constant δ18Owater value as the average water value of –0.9‰ from monthly collections, estimates of δ18Ootolith are calculated (Andrus and Crowe, 2008).
As seen in figure 4.5, when δ18Owater is held constant, δ18Ootolith accurately reflects seasonal temperature oscillations. That is, the most en-riched δ18Ootolith would precipitate during cool-est months, winter, while the most depleted δ18Ootolith would precipitate during warmest months, summer.
Figure 4.5 models the ideal circumstance for using δ18Ootolith to estimate season of capture, but this does not occur in estuarine waters of the Georgia coast. δ18Owater fluctuates due to both sea-sonal temperature oscillations and erratic salinity fluctuations. Thus, the δ18Ootolith profiles are more complex than figure 4.5 suggests.
Using actual monthly measured δ18Owater (range from –2.2‰ to 0.4‰) from Andrus and Crowe (2008), a model (fig. 4.6) is generated based on the Grossman and Ku (1986) arago-nite precipitation equation. From figure 4.6, a semisinusoidal pattern in estimated δ18Ootolith is
core
dark band
light band
drilling pathexample
Fig. 4.3. Cross section of Atlantic croaker otolith, FLMNH-EA 11319. Black lines represent drilling path exam-ples for δ18O sampling. Multiple drilling paths were taken from each otolith. Nine drilling paths were sampled from FLMNH-EA 11319 across the medial surface (surface with sulcus) to the center core, within incremental bands.
ANTHROPOLOGICAL PAPERS AMERICAN MUSEUM OF NATURAL HISTORY 88 NO. 97
seen. Estimated δ18Ootolith values are depleted dur-ing warmest months, while enriched values form during coldest months. Salinity complicates esti-mated δ18Ootolith values, however. For example, in October, the temperature is 22.8°C, but δ18Owater is depleted due to low salinity levels from fresh water, generating more depleted δ18Ootolith values.
To examine effects of fluctuating δ18Owater on
δ18Ootolith, I examined modern otoliths for season-al δ18Ootolith oscillations, converting δ18Ootolith to temperature in degrees Celsius, with a constant δ18Owater of –0.9‰ (the yearly average δ18Owater from waters surrounding St. Catherines Island [Andrus and Crowe, 2008]). These temperature values are approximations of the actual tempera-ture the fish experienced.
ESTI
MA
TED
TEM
PERA
TURE
º C
Max
Mean
Min
Max
Mean
Min
SALI
NIT
Y ‰
A
B
35
30
25
20
15
10
5
0
5
10
15
20
25
30
35
0
JAN FEB MAR APR MAY JUN JUL AUG SEP OCT NOV DEC
JAN FEB MAR APR MAY JUN JUL AUG SEP OCT NOV DEC
Fig. 4.4. A. Mean temperature per month for 2003 with recorded temperature maximum and minimums at Sapelo Island Marsh Landing. B. Mean salinity per month for 2003 with recorded salinity maximum and mini-mums. See http://cdmo.baruch.sc.edu/ for Marsh Landing, Sapelo Island, water data.
2012 89EVALUATING δ18O PROFILES OF HARDHEAD CATFISH
δ18O OF MODERN OTOLITHS
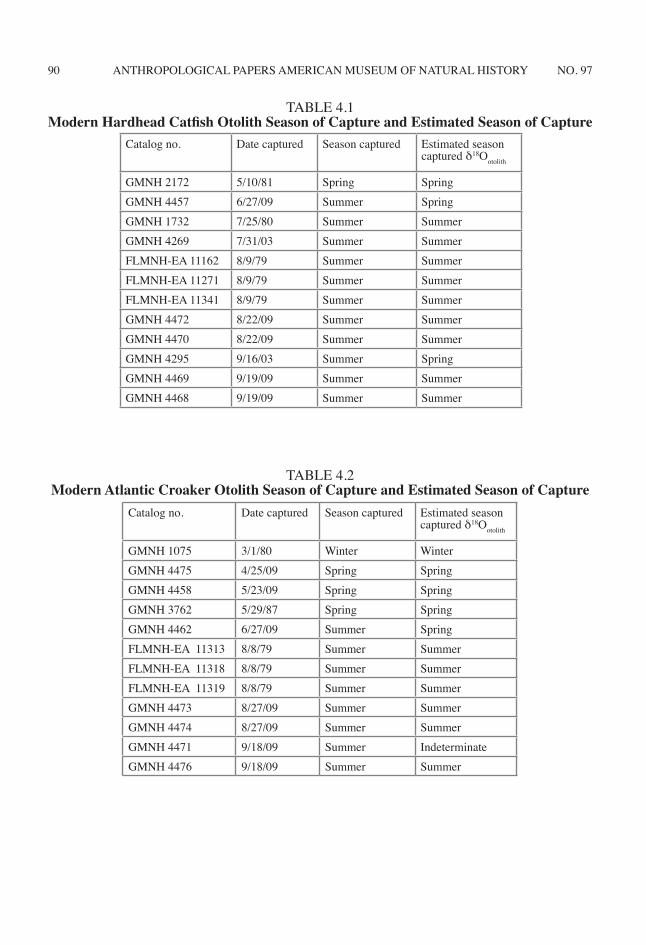
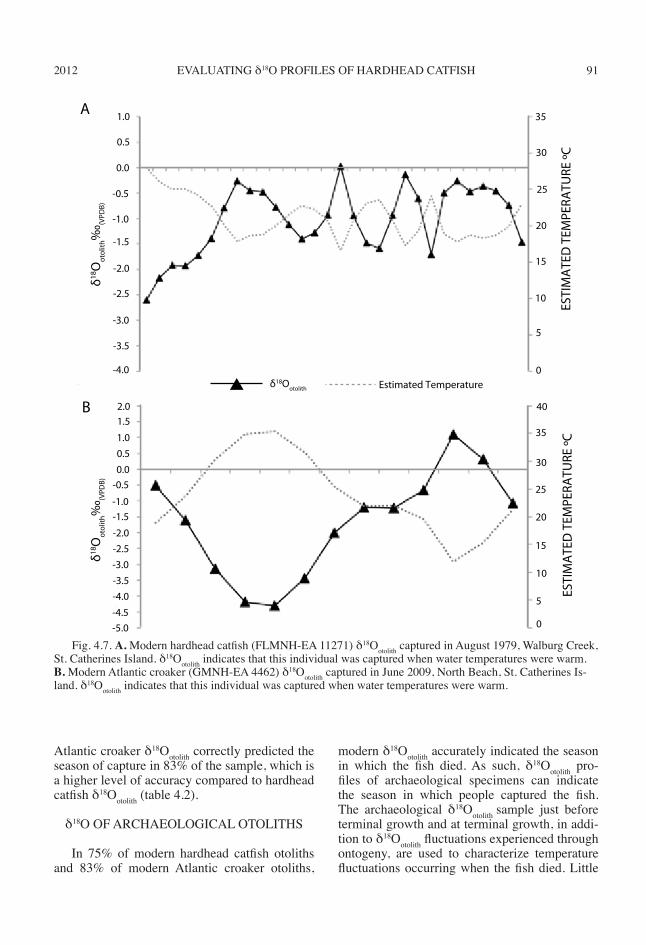
When the modern hardhead catfish δ18Ootolith are plotted through ontogeny, oscillations in δ18Ootolith are observed, reflecting seasonal tem-perature oscillation (fig. 4.7A). In 75% of the examined otoliths, the terminal and penultimate δ18Ootolith values record seasonal temperature
fluctuations correlating with the expected sea-son in which the hardhead catfish was captured (table 4.1).
Like the modern hardhead catfish δ18Ootolith, the modern Atlantic croaker δ18Ootolith show semisinusoidal oscillations in δ18Ootolith when plotted through ontogeny, recording seasonal temperature oscillations (fig. 4.7B). The modern
TEM
PERA
TURE
ºC A
ND
SA
LIN
ITY
‰
δ18O
otol
ith‰
Jan Feb March April May June July Aug Sep Oct Nov Dec
Temperature º C
Average δ18Owater
Salinity ‰
Estimated δ18Ootolith
32
28
24
20
16
12
8
4
0
1.5
1.0
0.5
0.0
-0.5
-1.0
-1.5
-2.0
-2.5
-3.0
-3.5
Temperature º C Salinity ‰
Measured δ18Owater
TEM
PERA
TURE
º C
AN
D S
ALI
NIT
Y ‰
δ18O
otol
ith‰
Jan Feb March April May June July Aug Sep Oct Nov Dec
1.5
1.0
0.5
0.0
-0.5
-1.0
-1.5
-2.0
-2.5
-3.0
32
28
24
20
16
12
8
4
0
Fig. 4.6. Annual cycle of temperature oscillation and salinity fluctuations for the McQueen Inlet of St. Cath-erines Island, Georgia (Andrus and Crowe, 2008). Estimated δ18Ootolith is based on a recorded δ18Owater (Andrus and Crowe, 2008). Calculation based on Grossman and Ku (1986).
Fig. 4.5. Annual cycle of temperature oscillation and salinity fluctuations for the McQueen Inlet of St. Catherines Island, Georgia (Andrus and Crowe, 2008). Estimated δ18Ootolith is based on an average and constant δ18Owater. Calculation based on Grossman and Ku (1986).
ANTHROPOLOGICAL PAPERS AMERICAN MUSEUM OF NATURAL HISTORY 90 NO. 97
Catalog no. Date captured Season captured Estimated season captured δ18Ootolith
GMNH 2172 5/10/81 Spring SpringGMNH 4457 6/27/09 Summer SpringGMNH 1732 7/25/80 Summer SummerGMNH 4269 7/31/03 Summer SummerFLMNH-EA 11162 8/9/79 Summer SummerFLMNH-EA 11271 8/9/79 Summer SummerFLMNH-EA 11341 8/9/79 Summer SummerGMNH 4472 8/22/09 Summer SummerGMNH 4470 8/22/09 Summer SummerGMNH 4295 9/16/03 Summer SpringGMNH 4469 9/19/09 Summer SummerGMNH 4468 9/19/09 Summer Summer
TABLE 4.1Modern Hardhead Catfish Otolith Season of Capture and Estimated Season of Capture
Catalog no. Date captured Season captured Estimated season captured δ18Ootolith
GMNH 1075 3/1/80 Winter WinterGMNH 4475 4/25/09 Spring SpringGMNH 4458 5/23/09 Spring SpringGMNH 3762 5/29/87 Spring SpringGMNH 4462 6/27/09 Summer SpringFLMNH-EA 11313 8/8/79 Summer SummerFLMNH-EA 11318 8/8/79 Summer SummerFLMNH-EA 11319 8/8/79 Summer SummerGMNH 4473 8/27/09 Summer SummerGMNH 4474 8/27/09 Summer SummerGMNH 4471 9/18/09 Summer IndeterminateGMNH 4476 9/18/09 Summer Summer
TABLE 4.2Modern Atlantic Croaker Otolith Season of Capture and Estimated Season of Capture
2012 91EVALUATING δ18O PROFILES OF HARDHEAD CATFISH
Atlantic croaker δ18Ootolith correctly predicted the season of capture in 83% of the sample, which is a higher level of accuracy compared to hardhead catfish δ18Ootolith (table 4.2).
δ18O OF ARCHAEOLOGICAL OTOLITHS
In 75% of modern hardhead catfish otoliths and 83% of modern Atlantic croaker otoliths,
modern δ18Ootolith accurately indicated the season in which the fish died. As such, δ18Ootolith pro-files of archaeological specimens can indicate the season in which people captured the fish. The archaeological δ18Ootolith sample just before terminal growth and at terminal growth, in addi-tion to δ18Ootolith fluctuations experienced through ontogeny, are used to characterize temperature fluctuations occurring when the fish died. Little
Fig. 4.7. A. Modern hardhead catfish (FLMNH-EA 11271) δ18Ootolith captured in August 1979, Walburg Creek, St. Catherines Island. δ18Ootolith indicates that this individual was captured when water temperatures were warm. B. Modern Atlantic croaker (GMNH-EA 4462) δ18Ootolith captured in June 2009, North Beach, St. Catherines Is-land. δ18Ootolith indicates that this individual was captured when water temperatures were warm.
δ18O
otol
ith‰
(VPD
B)
ESTI
MA
TED
TEM
PERA
TURE
ºC
B
20
15
10
5
0
2.0
-1.0
-2.0-2.5-3.0-3.5-4.0
-4.5-5.0
1.00.5
1.5
0.0-0.5
-1.5
40
35
30
25
δ18O
otol
ith‰
(VPD
B)
ESTI
MA
TED
TEM
PERA
TURE
ºC
A
0.0
-0.5
-1.0
-1.5
-2.0
-2.5
-3.0
-3.5
-4.0
35
30
25
20
15
10
5
0
1.0
0.5
Estimated Temperatureδ18Ootolith
ANTHROPOLOGICAL PAPERS AMERICAN MUSEUM OF NATURAL HISTORY 92 NO. 97
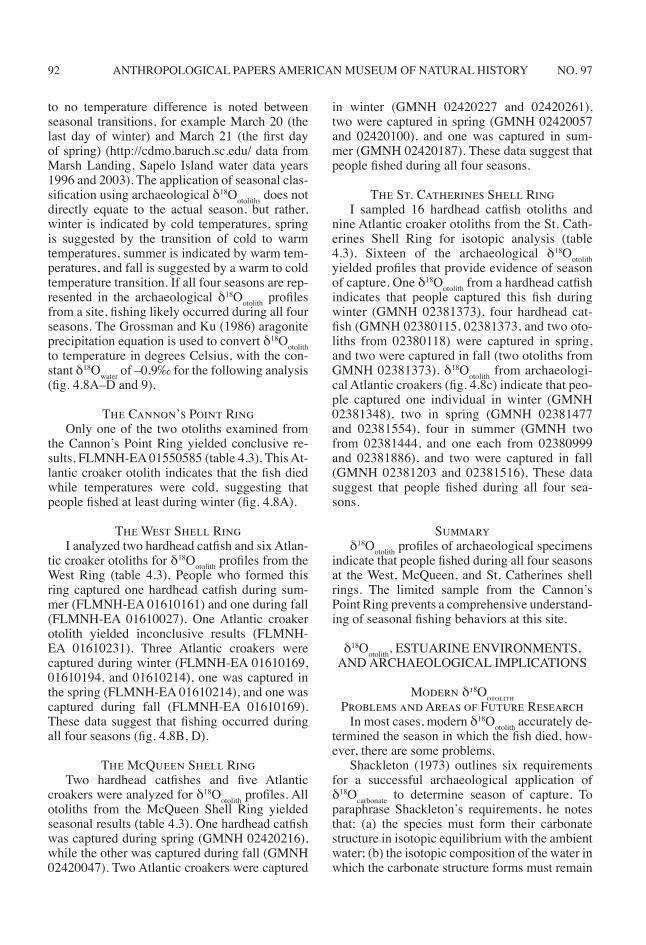
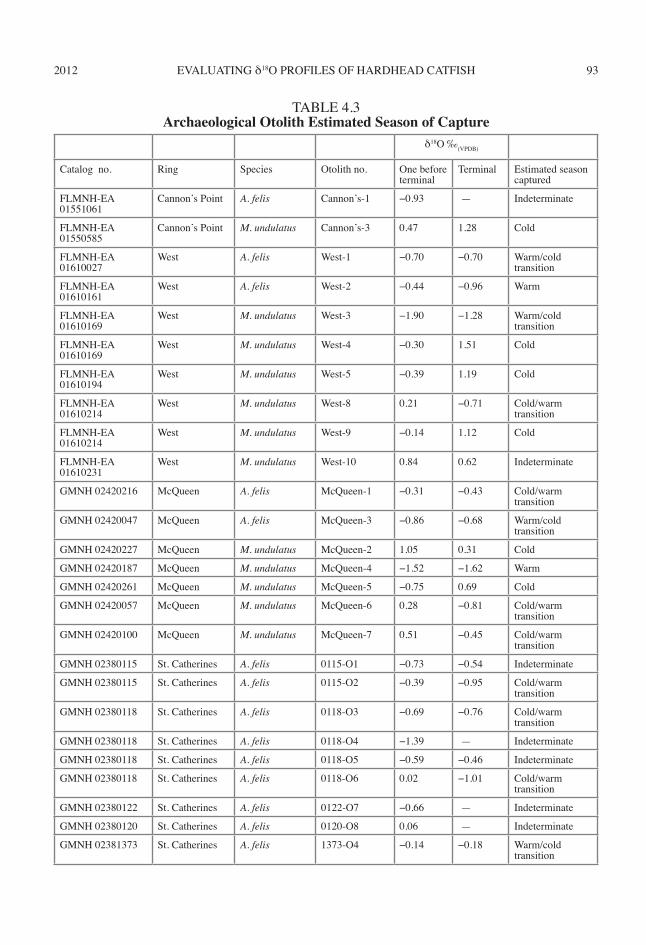
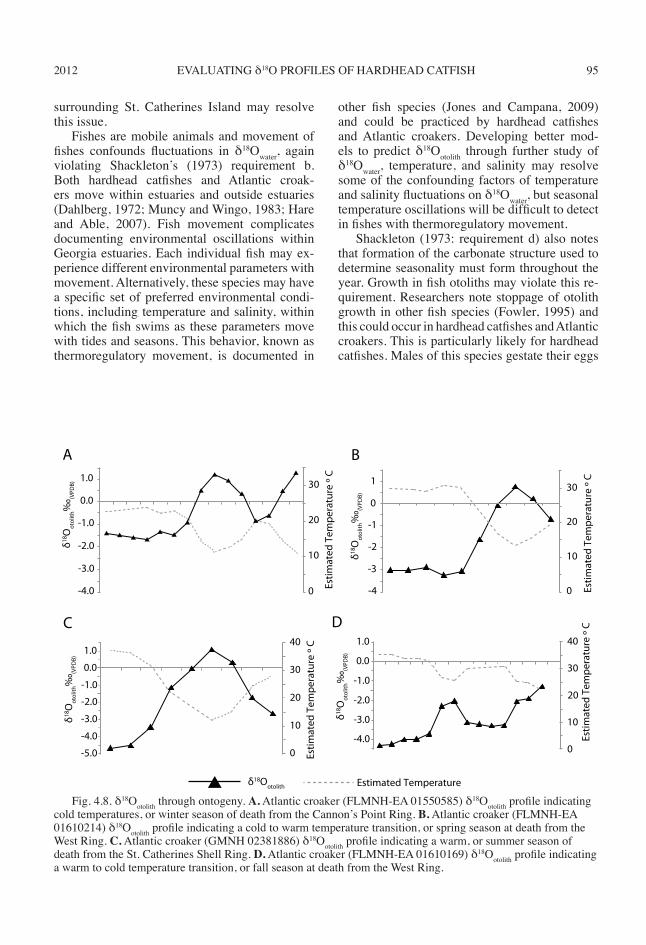
to no temperature difference is noted between seasonal transitions, for example March 20 (the last day of winter) and March 21 (the first day of spring) (http://cdmo.baruch.sc.edu/ data from Marsh Landing, Sapelo Island water data years 1996 and 2003). The application of seasonal clas-sification using archaeological δ18Ootoliths does not directly equate to the actual season, but rather, winter is indicated by cold temperatures, spring is suggested by the transition of cold to warm temperatures, summer is indicated by warm tem-peratures, and fall is suggested by a warm to cold temperature transition. If all four seasons are rep-resented in the archaeological δ18Ootolith profiles from a site, fishing likely occurred during all four seasons. The Grossman and Ku (1986) aragonite precipitation equation is used to convert δ18Ootolith to temperature in degrees Celsius, with the con-stant δ18Owater of –0.9‰ for the following analysis (fig. 4.8A–D and 9).
The Cannon’s Point RingOnly one of the two otoliths examined from
the Cannon’s Point Ring yielded conclusive re-sults, FLMNH-EA 01550585 (table 4.3). This At-lantic croaker otolith indicates that the fish died while temperatures were cold, suggesting that people fished at least during winter (fig. 4.8A).
The West Shell RingI analyzed two hardhead catfish and six Atlan-
tic croaker otoliths for δ18Ootolith profiles from the West Ring (table 4.3). People who formed this ring captured one hardhead catfish during sum-mer (FLMNH-EA 01610161) and one during fall (FLMNH-EA 01610027). One Atlantic croaker otolith yielded inconclusive results (FLMNH-EA 01610231). Three Atlantic croakers were captured during winter (FLMNH-EA 01610169, 01610194, and 01610214), one was captured in the spring (FLMNH-EA 01610214), and one was captured during fall (FLMNH-EA 01610169). These data suggest that fishing occurred during all four seasons (fig. 4.8B, D).
The McQueen Shell RingTwo hardhead catfishes and five Atlantic
croakers were analyzed for δ18Ootolith profiles. All otoliths from the McQueen Shell Ring yielded seasonal results (table 4.3). One hardhead catfish was captured during spring (GMNH 02420216), while the other was captured during fall (GMNH 02420047). Two Atlantic croakers were captured
in winter (GMNH 02420227 and 02420261), two were captured in spring (GMNH 02420057 and 02420100), and one was captured in sum-mer (GMNH 02420187). These data suggest that people fished during all four seasons.
The St. Catherines Shell RingI sampled 16 hardhead catfish otoliths and
nine Atlantic croaker otoliths from the St. Cath-erines Shell Ring for isotopic analysis (table 4.3). Sixteen of the archaeological δ18Ootolith yielded profiles that provide evidence of season of capture. One δ18Ootolith from a hardhead catfish indicates that people captured this fish during winter (GMNH 02381373), four hardhead cat-fish (GMNH 02380115, 02381373, and two oto-liths from 02380118) were captured in spring, and two were captured in fall (two otoliths from GMNH 02381373). δ18Ootolith from archaeologi-cal Atlantic croakers (fig. 4.8c) indicate that peo-ple captured one individual in winter (GMNH 02381348), two in spring (GMNH 02381477 and 02381554), four in summer (GMNH two from 02381444, and one each from 02380999 and 02381886), and two were captured in fall (GMNH 02381203 and 02381516). These data suggest that people fished during all four sea-sons.
Summaryδ18Ootolith profiles of archaeological specimens
indicate that people fished during all four seasons at the West, McQueen, and St. Catherines shell rings. The limited sample from the Cannon’s Point Ring prevents a comprehensive understand-ing of seasonal fishing behaviors at this site.
δ18Ootolith, ESTUARINE ENVIRONMENTS, AND ARCHAEOLOGICAL IMPLICATIONS
Modern δ18Ootolith
Problems and Areas of Future ResearchIn most cases, modern δ18Ootolith accurately de-
termined the season in which the fish died, how-ever, there are some problems.
Shackleton (1973) outlines six requirements for a successful archaeological application of δ18Ocarbonate to determine season of capture. To paraphrase Shackleton’s requirements, he notes that: (a) the species must form their carbonate structure in isotopic equilibrium with the ambient water; (b) the isotopic composition of the water in which the carbonate structure forms must remain
2012 93EVALUATING δ18O PROFILES OF HARDHEAD CATFISH
δ18O ‰(VPDB)
Catalog no. Ring Species Otolith no. One before terminal
Terminal Estimated season captured
FLMNH-EA 01551061
Cannon’s Point A. felis Cannon’s-1 −0.93 — Indeterminate
FLMNH-EA 01550585
Cannon’s Point M. undulatus Cannon’s-3 0.47 1.28 Cold
FLMNH-EA 01610027
West A. felis West-1 −0.70 −0.70 Warm/cold transition
FLMNH-EA 01610161
West A. felis West-2 −0.44 −0.96 Warm
FLMNH-EA 01610169
West M. undulatus West-3 −1.90 −1.28 Warm/cold transition
FLMNH-EA 01610169
West M. undulatus West-4 −0.30 1.51 Cold
FLMNH-EA 01610194
West M. undulatus West-5 −0.39 1.19 Cold
FLMNH-EA 01610214
West M. undulatus West-8 0.21 −0.71 Cold/warm transition
FLMNH-EA 01610214
West M. undulatus West-9 −0.14 1.12 Cold
FLMNH-EA 01610231
West M. undulatus West-10 0.84 0.62 Indeterminate
GMNH 02420216 McQueen A. felis McQueen-1 −0.31 −0.43 Cold/warm transition
GMNH 02420047 McQueen A. felis McQueen-3 −0.86 −0.68 Warm/cold transition
GMNH 02420227 McQueen M. undulatus McQueen-2 1.05 0.31 Cold
GMNH 02420187 McQueen M. undulatus McQueen-4 −1.52 −1.62 Warm
GMNH 02420261 McQueen M. undulatus McQueen-5 −0.75 0.69 Cold
GMNH 02420057 McQueen M. undulatus McQueen-6 0.28 −0.81 Cold/warm transition
GMNH 02420100 McQueen M. undulatus McQueen-7 0.51 −0.45 Cold/warm transition
GMNH 02380115 St. Catherines A. felis 0115-O1 −0.73 −0.54 Indeterminate
GMNH 02380115 St. Catherines A. felis 0115-O2 −0.39 −0.95 Cold/warm transition
GMNH 02380118 St. Catherines A. felis 0118-O3 −0.69 −0.76 Cold/warm transition
GMNH 02380118 St. Catherines A. felis 0118-O4 −1.39 — Indeterminate
GMNH 02380118 St. Catherines A. felis 0118-O5 −0.59 −0.46 Indeterminate
GMNH 02380118 St. Catherines A. felis 0118-O6 0.02 −1.01 Cold/warm transition
GMNH 02380122 St. Catherines A. felis 0122-O7 −0.66 — Indeterminate
GMNH 02380120 St. Catherines A. felis 0120-O8 0.06 — Indeterminate
GMNH 02381373 St. Catherines A. felis 1373-O4 −0.14 −0.18 Warm/cold transition
TABLE 4.3Archaeological Otolith Estimated Season of Capture
ANTHROPOLOGICAL PAPERS AMERICAN MUSEUM OF NATURAL HISTORY 94 NO. 97
constant through a season; (c) the water tempera-ture in which the carbonate structure forms must be sea temperature; (d) the organism must depos-it the carbonate structure throughout the year; (e) growth in the carbonate structure must be great enough to allow for discrete sampling of incre-ments covering no more than a few weeks; and (f) the habitat in which the organism lives must undergo large and regular seasonal temperature oscillations. Although hardhead catfish and At-lantic croaker otoliths meet requirements a, c, and f, otoliths from these two species do not meet requirements b, d, and e. This may explain why some of the modern δ18Ootolith did not indicate the correct season of capture.
Firstly, δ18Owater in which the fish lives does not remain constant through the season (Shack-
leton, 1973: requirement b). It is clear from the zooarchaeological record of the Georgia coast that estuarine fishes were an important subsis-tence resource (Reitz, Quitmyer, and Marrinan, 2009; Colaninno, 2010; Reitz et al., 2010a: 54–57). People fished estuarine fishes heavily, but they did not fish in offshore areas where δ18Owater values are more stable. To characterize seasonal fishing efforts in inshore settings, this require-ment must be met. It is possible that a more comprehensive environmental understanding of Georgia estuaries can generate accurate δ18Ootolith models that account for temperature, salinity, and δ18Owater (see Surge and Walker, 2005; An-drus and Crowe, 2008; Culleton, Kennett, and Jones, 2009). Monthly analysis of δ18Owater in conjunction with δ18Ootolith from several locations
δ18O ‰(VPDB)
Catalog no. Ring Species Otolith no. One before terminal
Terminal Estimated season captured
GMNH 02381373 St. Catherines A. felis 1373-O5 −0.28 −0.33 Cold/warm transition
GMNH 02381373 St. Catherines A. felis 1373-O6 −0.30 −0.28 Warm/cold transition
GMNH 02381373 St. Catherines A. felis 1373-O7 0.12 0.40 Cold
GMNH 02381437 St. Catherines A. felis 1437-O8 — −0.08 Indeterminate
GMNH 02380494 St. Catherines A. felis 0494-O14 −0.67 — Indeterminate
GMNH 02380989 St. Catherines A. felis 0989-O17 −0.23 — Indeterminate
GMNH 02381037 St. Catherines A. felis 1037-O19 — −1.11 Indeterminate
GMNH 02381348 St. Catherines M. undulatus 1348-O3 −0.17 0.32 Cold
GMNH 02381444 St. Catherines M. undulatus 1444-O9 −1.97 −1.90 Warm
GMNH 02381444 St. Catherines M. undulatus 1444-O10 −0.53 −1.07 Warm
GMNH 02381477 St. Catherines M. undulatus 1477-O11 −0.81 −0.74 Cold/warm transition
GMNH 02381516 St. Catherines M. undulatus 1516-O12 −1.34 −0.75 Warm/cold transition
GMNH 02381554 St. Catherines M. undulatus 1554-O13 0.63 −0.74 Cold/warm transition
GMNH 02380999 St. Catherines M. undulatus 0999-O21 −1.07 −1.28 Warm
GMNH 02381203 St. Catherines M. undulatus 1203-O25 −1.41 −0.08 Warm/cold transition
GMNH 02381886 St. Catherines M. undulatus 1886-O26 −1.74 −2.67 Warm
TABLE 4.3 — (Continued)
2012 95EVALUATING δ18O PROFILES OF HARDHEAD CATFISH
Fig. 4.8. δ18Ootolith through ontogeny. A. Atlantic croaker (FLMNH-EA 01550585) δ18Ootolith profile indicating cold temperatures, or winter season of death from the Cannon’s Point Ring. B. Atlantic croaker (FLMNH-EA 01610214) δ18Ootolith profile indicating a cold to warm temperature transition, or spring season at death from the West Ring. C. Atlantic croaker (GMNH 02381886) δ18Ootolith profile indicating a warm, or summer season of death from the St. Catherines Shell Ring. D. Atlantic croaker (FLMNH-EA 01610169) δ18Ootolith profile indicating a warm to cold temperature transition, or fall season at death from the West Ring.
surrounding St. Catherines Island may resolve this issue.
Fishes are mobile animals and movement of fishes confounds fluctuations in δ18Owater, again violating Shackleton’s (1973) requirement b. Both hardhead catfishes and Atlantic croak-ers move within estuaries and outside estuaries (Dahlberg, 1972; Muncy and Wingo, 1983; Hare and Able, 2007). Fish movement complicates documenting environmental oscillations within Georgia estuaries. Each individual fish may ex-perience different environmental parameters with movement. Alternatively, these species may have a specific set of preferred environmental condi-tions, including temperature and salinity, within which the fish swims as these parameters move with tides and seasons. This behavior, known as thermoregulatory movement, is documented in
other fish species (Jones and Campana, 2009) and could be practiced by hardhead catfishes and Atlantic croakers. Developing better mod-els to predict δ18Ootolith through further study of δ18Owater, temperature, and salinity may resolve some of the confounding factors of temperature and salinity fluctuations on δ18Owater, but seasonal temperature oscillations will be difficult to detect in fishes with thermoregulatory movement.
Shackleton (1973: requirement d) also notes that formation of the carbonate structure used to determine seasonality must form throughout the year. Growth in fish otoliths may violate this re-quirement. Researchers note stoppage of otolith growth in other fish species (Fowler, 1995) and this could occur in hardhead catfishes and Atlantic croakers. This is particularly likely for hardhead catfishes. Males of this species gestate their eggs
BA
C D
0
1
0
10
20
30
-4
-3
-2
Estim
ated
Tem
pera
ture
º C
Estim
ated
Tem
pera
ture
º C
-5.0
-2.0
-3.0
-4.0
40
30
20
10
0
1.0
0.0
-1.0
δ18O
otol
ith‰
(VPD
B)δ18
Oot
olith
‰(V
PDB)
Estim
ated
Tem
pera
ture
º C
-2.0
-3.0
-4.0
30
20
10
0
1.0
0.0
-1.0 -1
Estim
ated
Tem
pera
ture
º C
δ18O
otol
ith‰
(VPD
B)
-3.0
-4.0
40
30
20
10
0
1.0
0.0
-1.0
-2.0
δ18O
otol
ith‰
(VPD
B)
Estimated Temperatureδ18Ootolith
ANTHROPOLOGICAL PAPERS AMERICAN MUSEUM OF NATURAL HISTORY 96 NO. 97
and young in their mouth for approximately 60 to 80 days after spawning (Dahlberg, 1972). Oral gestation occurs during the late spring through early fall (Gunter, 1947; Ward, 1957). During this period, males do not eat and somatic growth may not occur. The fact that only one archaeological hardhead catfish otolith had a terminal increment that formed in summer further suggests that oto-lith growth is not continuous throughout the year. Hardhead catfish are most abundant in Georgia estuaries during summer (Dahlberg, 1972), mak-ing the limited evidence for summer-captured hardhead catfish surprising. Nonetheless, mod-ern hardhead catfish δ18Ootolith generally do form otolith increments in warmer months. Additional modern sampling of both males and females, in known states of reproduction, is required to un-derstand consequences of reproduction on so-matic growth and otolith formation.
Shackleton (1973: requirement e) also ob-serves that growth rates of the carbonate struc-ture must be large enough to sample isolated increments covering no more than a few weeks of growth. Some archaeological otoliths do not meet this requirement, particularly otoliths from older fishes. This problem is noted when peaks in δ18Ootolith profiles are examined in conjunction with the number of incremental bands in each otolith. Theoretically, fish form growth bands
through ontogeny in response to environmental and biological conditions such as temperature, food availability, and reproductive efforts (Pan-nella, 1971, 1980; Wootton, 1998:111–116; Van Neer, Löugas, and Rijnsdorp, 2004). Major fluc-tuations in environmental and biological condi-tions that the fish experiences generally occur annually, causing fish to grow quickly and then slowly within an annual cycle. This process pro-duces two visually distinct bands per year (dark and light growth bands). As such, the number of bands in an otolith should correlate to the number of isotopic peaks in δ18Ootolith profile when plotted through ontogeny (figs. 4.7, 8A–D, and 9). This is not always the case, however. In some otoliths, the number of increments is equal to the number of seasonal peaks in the δ18Ootolith profile. In other otoliths, there are more increments than peaks. This suggests that either too little growth oc-curred in these otoliths to discretely sample each season using the sampling method I employed, or increment formation does not correlate to sea-sonal temperature oscillations in every case.
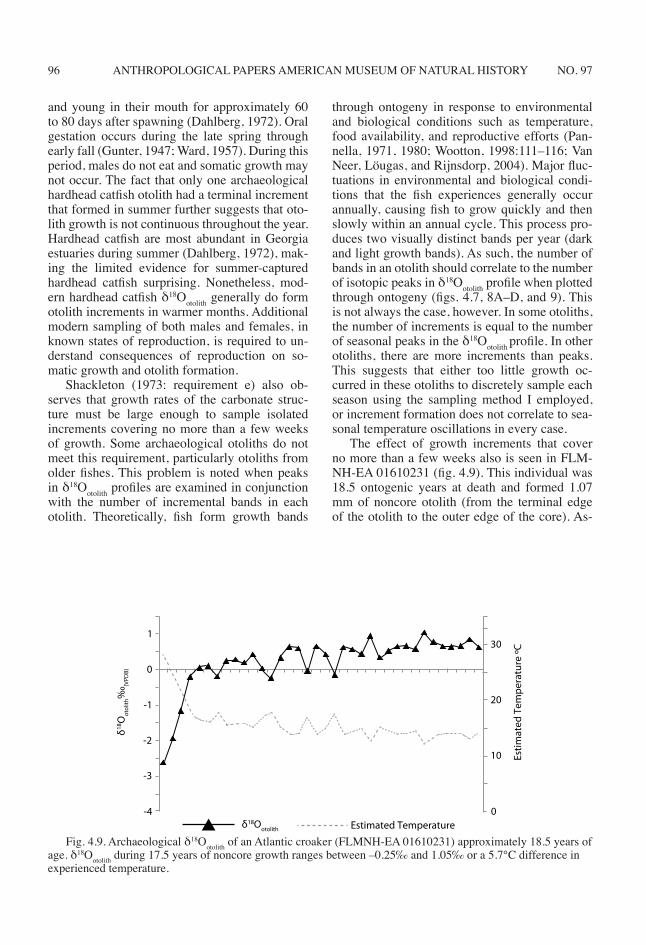
The effect of growth increments that cover no more than a few weeks also is seen in FLM-NH-EA 01610231 (fig. 4.9). This individual was 18.5 ontogenic years at death and formed 1.07 mm of noncore otolith (from the terminal edge of the otolith to the outer edge of the core). As-
Fig. 4.9. Archaeological δ18Ootolith of an Atlantic croaker (FLMNH-EA 01610231) approximately 18.5 years of age. δ18Ootolith during 17.5 years of noncore growth ranges between –0.25‰ and 1.05‰ or a 5.7°C difference in experienced temperature.
Estim
ated
Tem
pera
ture
ºC
δ18O
otol
ith‰
(VPD
B) 0
1
0
10
20
30
-4
-3
-2
-1
Estimated Temperatureδ18Ootolith
2012 97EVALUATING δ18O PROFILES OF HARDHEAD CATFISH
suming an average growth rate over the 17.5 years of noncore growth, only 0.06 mm of otolith formation occurred per year or 0.01 mm every three months (i.e., per season). I spaced isotopic drilling paths for both modern and archaeologi-cal otoliths between 0.1 and 0.2 mm apart. It is impossible to isolate season of capture for older individuals with such little growth each season. Because fish generally grow most rapidly during their first few years of life (Wootton, 1998: 116), otoliths from younger individuals should provide higher-resolution trends in temperature oscilla-tions experienced by the fish.
Researchers also use visual characterization of the terminal band type of otoliths to determine seasonality. If the type of banding, that is dark or light bands, is known to occur during specific sea-sons for a species, the terminal band can be used to infer the season in which the fish was captured (Smith, 1983; Hales and Reitz, 1992; Erlandson, 1994: 103; Higham and Horn, 2000). Currently, this method yielded inconclusive results for both hardhead catfishes and Atlantic croakers. For modern hardhead catfishes, individuals were cap-tured only during five months of the year (May, June, July, August, and September), representing two seasons: spring and summer. All hardhead catfishes in the sample had dark or fast, terminal growth bands when they were captured. Although this indicates that hardhead catfish likely form dark growth bands in the spring and summer, these data do not indicate whether dark growth occurs continuously throughout the spring and summer and when light growth bands form. Sea-son of death for Atlantic croakers in the modern sample includes croakers that died in spring and summer. Only one croaker captured in spring was in noncore growth and this individual was form-ing a dark growth band. Otoliths from Atlantic croakers captured in summer had both dark and light growth terminal bands. One otolith was in light growth formation and four were in dark growth formation. These data indicate that dark bands generally form during spring and summer; however, without direct evidence that light bands occur in winter and fall, it is impossible to draw this conclusion.
Characterizing the terminal band in otoliths may provide an additional method to determine season of capture, but more modern sampling is needed to understand seasonal timing of band formation in these two species. Overall results from the modern δ18Ootolith indicate that oscilla-
tions in δ18Ootolith can estimate temperature oscilla-tions fishes experienced just prior to and at death and thus, season of capture. Further research is needed to understand the full seasonal range of environmental oscillations, particularly correla-tions among temperature, salinity, and δ18Owater in Georgia estuaries, and biological and environ-mental factors that affect otolith growth and in-cremental banding in these two species.
Archaeological ImplicationsResearchers have conducted analyses of clam
and oyster incremental formation and δ18O pro-files at several Late Archaic shell rings, includ-ing the shell rings in this otolith study (Quitmyer, Hale, and Jones, 1985; O’Brien and Thomas, 2008; Thompson and Andrus, 2011). These mol-lusc studies concluded that people harvested shellfish during multiple seasons (Marrinan, 1975: 99; Thompson and Andrus, 2011), and in some instances, throughout the year (Quitmyer, Hale, and Jones, 1985; Thompson, 2006; Thomas, 2008: 927; Thompson and Andrus, 2011). These data suggest a model of year-round shellfish har-vesting at most, although not necessarily at all, shell rings (Thompson and Andrus, 2011).
This archaeological δ18Ootolith study also sug-gests a year-round model for fishing. At the West, McQueen, and St. Catherines shell rings, δ18Ootolith profiles just prior to and at death indicate that people captured these two fish species during all four seasons in conjunction with multiseason harvesting of shellfishes (table 4.3). Researchers in other coastal areas document a similar pattern of year-round resource use by coastal peoples in the past (Yesner, 1980; Russo, 1998; Keene, 2004; Orr, 2007).
Although δ18Ootolith profiles define a pattern of year-round fishing at the West, McQueen, and St. Catherines shell rings, this does not mean the entire population associated with each shell ring lived there continuously. Segments of the popu-lation could be absent occasionally on collecting and hunting trips, social visits, or ritual activities for longer or shorter lengths of time. Such sea-sonal patterns of movement by only segments of a population are documented among modern hunter-gatherer populations (Meehan, 1982: 31–41; Kelly, Poyer, and Tucker, 2005) and likely characterize the behavior of archaeological popu-lations.
Admittedly, evidence that people fished Geor-gia estuaries and deposited the fish remain at
ANTHROPOLOGICAL PAPERS AMERICAN MUSEUM OF NATURAL HISTORY 98 NO. 97
NOTES
1. Isotopic analysis of modern, Cannon’s Point, West, and McQueen otoliths is funded by the National Science Foundation Doctoral Dissertation Improvement Grant BCS-0912176. Isotopic analysis for the St. Catherines Shell Ring is funded by the American Museum of Natural History and Edward J. Noble Foundation. I would like to thank all those who have helped me with this research: David Hurst Thomas and his crew at the American Museum of Natural History for allowing me to work with the St. Catherines Is-land collections, Rochelle Marrinan for allowing me to work with the St. Simons material, Bruce Saul, Charles Lambert, and their students at Augusta State University for collect-ing fishes, Irvy Quitmyer for helping me collect fishes and aiding me at the Florida Museum of Natural History, Fred Andrus for allowing me to work at the University of Ala-bama, Joe Lambert for processing my isotopic samples, John A. Turck for the map, Julia K. Orr for processing the modern fishes, and Betsy Reitz for the insightful comments. This research could not have taken place without your support, so thank you. The author is responsible for all contents, includ-ing the errors and any misinterpretation of the data herein.
these shell rings during all four seasons does not directly equate to a year-round, sedentary popula-tion occupying shell rings. Temperature regimes at time of capture represent a discrete time inter-val during a period of three to four months. Ar-chaeological δ18Ootolith profiles are not sufficiently precise to identify patterned, but brief, absences or presences of fishing activities. It is possible that people only fished and deposited fish remains at these shell rings for a day, week, or month of the three to four month period defined using ar-chaeological δ18Ootolith. Given the large quantity of faunal remains (Colaninno, 2010), depth of deposits at these sites, and the multiseason har-vesting practices documented in mollusc samples (Quitmyer, Hale, and Jones, 1985; O’Brien and Thomas, 2008; Thompson and Andrus, 2011), an extended, year-round occupation is probable.
SUMMARY AND CONCLUSIONS
This study is one of the first to use archaeo-logical fish otoliths to determine the seasonality of fishing in the southeastern United States (for seasonal studies that used otoliths in other re-gions see, Erlandson, 1994: 103; Van Neer, Löu-gas, and Rijnsdorp, 1999; Van Neer et al., 2004; Hufthammer et al., 2010). Although initial results of this analysis are promising, further research is needed. Factors that control δ18Ootolith for Georgia estuaries, as well as biological and environmen-tal factors that control otolith formation must be better understood. Despite these shortcomings, modern δ18Ootolith profiles indicate that δ18Ootolith determines the season in which people captured the fish in most cases.
These data indicate that people fished hard-head catfishes and Atlantic croakers during mul-tiple seasons. At the West, McQueen, and St. Catherines shell rings, people fished during all four seasons. With these data, future archaeologi-cal research can focus on patterns in the horizon-tal and vertical distributions of seasonal deposits within each shell ring and across the region, as well as other spatial, temporal, and behavioral scales. Additionally, seasonal data from molluscs can be examined in conjunction with data from fish otoliths to view seasonal resource use involv-ing several taxa (Walker and Surge, 2006). Multi-proxy studies may provide a better prospective on Late Archaic seasonal resource use patterns and settlement patterns than single-proxy studies.
2012 99EVALUATING δ18O PROFILES OF HARDHEAD CATFISH
Catalog # Location Captured Collector Length, mm
Breadth, mm
Width, mm
Thickness, mm
Weight, g
GMNH 2172 Edisto Island, SC 5/10/81 Lisa Osteen 11.53 10.23 9.62 4.97 0.57
GMNH 4457 St. Catherines Island, Ga
6/27/09 Bruce Saul, Carol Colaninno
8.61 7.68 6.72 3.59 0.22
GMNH 1732 Sapelo Island, Caretta Beach, Ga
7/25/80 Besty Reitz 11.28 10.12 9.72 4.65 0.54
GMNH 4269 Camachee Island, St. Johns County, Fl
7/31/03 Kelly Orr 10.81 9.79 8.83 4.15 0.40
FLMNH 11162 St. Catherines Sound, SCI2, Ga
8/9/79 Richard Casteel 9.55 8.21 8.01 3.72 0.29
FLMNH 11271 St. Catherines Walburg Creek, Ga
8/9/79 Richard Casteel 10.73 9.58 9.13 3.82 0.39
FLMNH 11341 St. Catherines Island SCI1, Ga
8/9/79 Richard Casteel 10.20 8.85 8.33 3.85 0.33
GMNH 4472 St. Catherines Island, Ga
8/22/09 Bruce Saul, Carol Colaninno
8.82 7.81 7.15 3.75 0.25
GMNH 4470 St. Catherines Island, Ga
8/22/09 Bruce Saul, Carol Colaninno
12.29 10.90 10.55 5.34 0.73
GMNH 4295 Vilano Bridge, St. Johns County, Fl
9/16/03 Kelly Orr 12.10 10.62 9.98 5.70 0.75
GMNH 4469 St. Catherines Island, North Beach Seine, Ga
9/19/09 Bruce Saul, Carol Colaninno
11.10 9.79 9.13 4.51 0.48
GMNH 4468 St. Catherines Island, North Beach Seine, Ga
9/19/09 Bruce Saul, Carol Colaninno
12.80 11.31 10.78 5.25 0.73
GMNH 1075 Skidaway Island, Ga 3/1/80 D. Miller 8.91 6.63 3.60 0.17
GMNH 4475 Ossabaw Estuary Trawl, Ga
4/25/09 Carol Colaninno 7.72 5.65 3.40 0.11
GMNH 4458 St. Catherines Island Trawl, Ga
5/23/09 Carol Colaninno 11.39 8.56 4.84 0.39
GMNH 3762 Gloucester, Middlsex Co., Va
5/29/87 J. Gayner 11.04 8.14 5.19 0.39
GMNH 4462 St. Catherines Island, North Beach Seine, Ga
6/27/09 Carol Colaninno 8.98 6.64 3.63 0.19
FLMNH 11318 St. Catherines McQueen Inlet, Ga
8/8/79 Richard Casteel 7.36 5.39 3.42 0.10
FLMNH 11319 St. Catherines McQueen Inlet, Ga
8/8/79 Richard Casteel 7.28 5.17 2.80 0.08
FLMNH 11313 St. Catherines Island SCI2, Ga
8/9/79 Richard Casteel 7.46 5.55 3.29 0.10
GMNH 4473 St. Catherines Island, Ga
8/27/09 Bruce Saul, Carol Colaninno
8.57 6.37 3.61 0.17
GMNH 4474 St. Catherines Island, Ga
8/27/09 Bruce Saul, Carol Colaninno
9.99 7.23 4.32 0.25
GMNH 4471 St. Simons Estuary trawl, Ga
9/18/09 Bruce Saul, Carol Colaninno
7.98 5.60 3.42 0.13
GMNH 4476 St. Simons Estuary trawl, Ga
9/18/09 Bruce Saul, Carol Colaninno
7.91 5.56 3.22 0.12
APPENDIX 4.1Modern Otoliths Sampled for Isotopic Analysis
ANTHROPOLOGICAL PAPERS AMERICAN MUSEUM OF NATURAL HISTORY 100 NO. 97
Cat
alog
no.
Rin
gSp
ecie
sO
tolit
h no
.U
nit
Leve
lLe
ngth
, mm
Bre
adth
, mm
Wid
th, m
mTh
ickn
ess,
mm
Wei
ght,
g
FLM
NH
01
5510
61C
anno
n’s P
oint
A. fe
lisC
anno
n’s 1
18N
, 0E
259.
858.
808.
193.
610.
294
FLM
NH
01
5505
85C
anno
n’s P
oint
M. u
ndul
atus
Can
non’
s 318
N, 0
E12
9.39
7.30
4.48
0.25
3
FLM
NH
01
6100
27W
est
A. fe
lisW
est 1
5S, 3
0EZI
I L1
10.5
29.
348.
804.
520.
442
FLM
NH
01
6101
61W
est
A. fe
lisW
est 2
5S, 3
0E6
10.7
19.
498.
884.
050.
407
FLM
NH
01
6101
69W
est
M. u
ndul
atus
Wes
t 35S
, 30E
68.
606.
574.
060.
176
FLM
NH
01
6101
69W
est
M. u
ndul
atus
Wes
t 45S
, 30E
68.
166.
323.
340.
126
FLM
NH
01
6101
94W
est
M. u
ndul
atus
Wes
t 55S
, 30E
78.
626.
223.
390.
149
FLM
NH
01
6102
14W
est
M. u
ndul
atus
Wes
t 85S
, 30E
88.
966.
313.
980.
178
FLM
NH
01
6102
14W
est
M. u
ndul
atus
Wes
t 95S
, 30E
812
.14
10.0
05.
000.
500
FLM
NH
01
6102
31W
est
M. u
ndul
atus
Wes
t 10
5S, 3
0E9
19.9
415
.07
8.25
2.22
5
GM
NH
024
2021
6M
cQue
enA.
felis
McQ
ueen
1N
263
E179
5.6–
5.5
8.85
7.93
7.5
3.52
0.24
7
GM
NH
024
2022
7M
cQue
enM
. und
ulat
usM
cQue
en 2
N26
3 E1
795.
6–5.
58.
145.
983.
330.
142
GM
NH
024
2004
7M
cQue
enA.
felis
McQ
ueen
3N
213
E179
4.6–
4.5
8.08
7.25
6.78
3.72
0.21
5
GM
NH
024
2018
7M
cQue
enM
. und
ulat
usM
cQue
en 4
N26
3 E1
795.
7–5.
610
.85
9.22
4.84
0.35
6
GM
NH
024
2026
1M
cQue
enM
. und
ulat
usM
cQue
en 5
N26
3 E1
795.
5–5.
47.
615.
833.
000.
113
GM
NH
024
2005
7M
cQue
enM
. und
ulat
usM
cQue
en 6
N21
3 E1
984.
6–4.
511
.37
8.45
4.65
0.35
7
GM
NH
024
2010
0M
cQue
enM
. und
ulat
usM
cQue
en 7
N21
3 E1
984.
5–4.
410
.38
7.41
4.42
0.30
2
GM
NH
023
8011
5St
. Cat
herin
esA.
felis
0115
-O1
N78
9 E8
0110
–20
cm9.
368.
297.
823.
560.
270
GM
NH
023
8011
5St
. Cat
herin
esA.
felis
0115
-O2
N78
9 E8
0110
–20
cm9.
738.
878.
414.
330.
373
GM
NH
023
8011
8St
. Cat
herin
esA.
felis
0118
-O3
N78
9 E8
0120
–30
cm7.
996.
876.
493.
380.
179
APP
END
IX 4
.2A
rcha
eolo
gica
l Oto
liths
Sam
pled
for I
soto
pic A
naly
sis
2012 101EVALUATING δ18O PROFILES OF HARDHEAD CATFISHA
PPEN
DIX
4.2
— (C
ontin
ued)
Cat
alog
no.
Rin
gSp
ecie
sO
tolit
h no
.U
nit
Leve
lLe
ngth
, mm
Bre
adth
, mm
Wid
th, m
mTh
ickn
ess,
mm
Wei
ght,
g
GM
NH
023
8011
8St
. Cat
herin
esA.
felis
0118
-O4
N78
9 E8
0120
–30
cm9.
277.
797.
434.
390.
292
GM
NH
023
8011
8St
. Cat
herin
esA.
felis
0118
-O5
N78
9 E8
0120
–30
cm8.
537.
326.
853.
640.
218
GM
NH
023
8011
8St
. Cat
herin
esA.
felis
0118
-O6
N78
9 E8
0120
–30
cm8.
537.
326.
853.
640.
218
GM
NH
023
8012
2St
. Cat
herin
esA.
felis
0122
-O7
N78
9 E8
0130
–40
cm8.
878.
087.
784.
130.
265
GM
NH
023
8012
0St
. Cat
herin
esA.
felis
0120
-O8
N78
9 E8
0140
–50
cm8.
497.
396.
933.
690.
224
GM
NH
023
8134
8St
. Cat
herin
esM
. und
ulat
us13
48-O
3N
784
E797
10–2
0 cm
8.70
6.82
3.69
0.17
8
GM
NH
023
8137
3St
. Cat
herin
esA.
felis
1373
-O4
N78
4 E7
9720
–30
cm10
.29
8.95
8.52
4.09
0.37
4
GM
NH
023
8137
3St
. Cat
herin
esA.
felis
1373
-O5
N78
4 E7
9720
–30
cm9.
648.
568.
214.
110.
344
GM
NH
023
8137
3St
. Cat
herin
esA.
felis
1373
-O6
N78
4 E7
9720
–30
cm9.
708.
177.
923.
770.
290
GM
NH
023
8137
3St
. Cat
herin
esA.
felis
1373
-O7
N78
4 E7
9720
–30
cm10
.13
8.73
8.38
4.02
0.36
7
GM
NH
023
8143
7St
. Cat
herin
esA.
felis
1437
-O8
N78
4 E7
9740
–50
cm8.
768.
077.
553.
830.
274
GM
NH
023
8144
4St
. Cat
herin
esM
. und
ulat
us14
44-O
9N
784
E797
40–5
0 cm
9.17
7.03
3.96
0.19
8
GM
NH
023
8144
4St
. Cat
herin
esM
. und
ulat
us14
44-O
10N
784
E797
40–5
0 cm
8.66
6.33
3.41
0.16
2
GM
NH
023
8147
7St
. Cat
herin
esM
. und
ulat
us14
77-O
11N
784
E797
50–6
0 cm
9.64
7.62
4.05
0.23
2
GM
NH
023
8151
6St
. Cat
herin
esM
. und
ulat
us15
16-O
12N
784
E797
60–7
0 cm
7.67
5.16
3.17
0.10
9
GM
NH
023
8155
4St
. Cat
herin
esM
. und
ulat
us15
54-O
13N
784
E797
70–7
5.5
cm10
.32
7.62
4.35
0.28
4
GM
NH
023
8049
4St
. Cat
herin
esA.
felis
0494
-O14
N78
4 E8
0130
–40
cm8.
317.
236.
773.
840.
228
GM
NH
023
8098
9St
. Cat
herin
esA.
felis
0989
-O17
N78
4 E8
1120
–30
cm9.
368.
398.
063.
550.
282
GM
NH
023
8103
7St
. Cat
herin
esA.
felis
1037
-O19
N78
4 E8
1130
–40
cm10
.06
8.89
8.30
4.18
0.36
7
GM
NH
023
8099
9St
. Cat
herin
esM
. und
ulat
us09
99-O
21N
784
E811
20–3
0 cm
8.93
6.44
3.93
0.17
9
GM
NH
023
8120
3St
. Cat
herin
esM
. und
ulat
us12
03-O
25N
784
E811
60–7
0 cm
8.15
6.16
3.56
0.16
3
GM
NH
023
8188
6St
. Cat
herin
esM
. und
ulat
us18
86-O
26N
771
E819
2.5–
2.4
9.24
7.06
4.24
0.20
7

ANTHROPOLOGICAL PAPERS AMERICAN MUSEUM OF NATURAL HISTORY 102 NO. 97
Copyright © 2022 FDOKUMEN