Long-term bioaccumulation monitoring with transplanted bivalves in the San Francisco Estuary
Upload
independentCategory
view
0download
0
B(
LSVa
b
c
d
1
rppimoiplTBtt
0d
Aquatic Toxicology 88 (2008) 250–256
Contents lists available at ScienceDirect
Aquatic Toxicology
journa l homepage: www.e lsev ier .com/ locate /aquatox
iochemistry, cytogenetics and bioaccumulation in silver catfishRhamdia quelen) exposed to different thorium concentrations
izelia M. Correaa, Daiani Kochhanna, Alexssandro G. Beckera, Maria A. Pavanatoa,usana F. Llesuyb, Vania L. Loroc, Alice Raabec, Marcia F. Meskoc,d, Erico M.M. Floresc,alderi L. Dresslerc, Bernardo Baldisserottoa,∗
Departamento de Fisiologia e Farmacologia, Universidade Federal de Santa Maria, 97105-900 Santa Maria, RS, Brazil
Departamento de Quımica Analitica y Fisicoquımica, Universidad de Buenos Aires, Buenos Aires, ArgentinaDepartamento de Quımica, Universidade Federal de Santa Maria, 97105-900 Santa Maria, RS, BrazilRS, Bra
was telen)
adde gillthrou
diffe61.1 fe of win ancle wtic anowesassay
Polo em Cruz Alta, Universidade Estadual do Rio Grande do Sul, 98025-810 Cruz Alta,
a r t i c l e i n f o
Article history:Received 10 March 2008Received in revised form 29 April 2008Accepted 1 May 2008
Keywords:FishOxidative stressMicronucleiEcotoxicologyBioaccumulation
a b s t r a c t
The objective of this studysilver catfish (Rhamdia quprotein, and ammonia). InS-transferase (GST) in thparameters were studiedjuveniles were exposed to209.5 ± 17.6, and 608.7 ±gills and skin. The increaslevels in the gills, liver, skintermediates in the musGST activities in the hepacan be stimulated at the lresults of the cytogenetic
was found in juveniles exposed. Introduction
Thorium (Th) is a natural element present in the aquatic envi-onment. It is used in several anthropogenic activities, and it has theotential for use as a nuclear fuel (Poston, 1982). Thorium occursredominantly as a tetravalent cation, and it is a trace constituent
n phosphates, simple and multiples oxides, and silicates. It is theain element in thorianite (ThO2) and thorite (ThSiO4), among
ther minerals (Ivanovich and Harmon, 1982). Thorium is almostnsoluble in water, but it may be adsorbed in particulate and sus-ended material within water (Langmuir and Herman, 1980). The
evel of adsorption ranges from 0.003 to 1.72 �g L−1 for waterborneh and 183 to 3445 �g g−1 for Th in suspended solids (Tonetto andonotto, 2002). Thorium can also be found in abundance in lakeshat originated from the mining of other metals, which are some-imes converted for use in aquaculture. Yusof et al. (2001) found
∗ Corresponding author. Tel.: +55 55 3220 9382; fax: +55 55 3220 8241.E-mail address: [email protected] (B. Baldisserotto).
166-445X/$ – see front matter © 2008 Elsevier B.V. All rights reserved.oi:10.1016/j.aquatox.2008.05.003
zil
o evaluate the effect of thorium (Th) bioaccumulation on the metabolism ofthrough biochemical parameters of the muscle (glycogen, glucose, lactate,ition, lipidic peroxidation levels (TBARS), catalase (CAT) and glutathione-s and in hepatic and muscular tissues were also analyzed. Cytogeneticgh the evaluation of nuclear abnormalities in red blood cells. Silver catfishrent waterborne Th levels (in �g L−1): 0 (control), 25.3 ± 3.2, 69.2 ± 2.73,or 15 days. The organs that accumulated the highest Th levels were theaterborne Th concentration corresponded to a progressive increase of Th
d kidneys, with the highest accumulation in the gills and skin. Metabolicere altered by Th exposure, but no clear relationship was found. CAT andd muscular tissues of this species suggest that the enzymatic activities
t Th levels and inhibited at the higher levels (mainly in 608.7 �g L−1). Thecontribute to this hypothesis because the higher toxicity in blood samplesto 69.2 and 209.5 �g L−1 Th.
© 2008 Elsevier B.V. All rights reserved.
concentrations up to 297 �g L−1 of dissolved Th in lakes of tin min-ing.
Cellular biomarkers are important tools for evaluating fishexposure to toxic agents that can alter oxidative balance andthe structure and function of vital organs and that can evenresult in death (Radi and Matkovics, 1988; DiGiulio et al., 1989;Mather-Mihaich and Di Giulio, 1991; Au et al., 1999; Ahmad etal., 2000). Oxidative stress is defined as an imbalanced statebetween pro-oxidants and antioxidant agents with a potential forproducing deleterious effects that can damage macromoleculessuch as DNA, lipids, and proteins (Halliwell and Gutteridge, 1999).Enzymes and others compounds of non-enzymatic nature pro-vide an antioxidant defense system, which protects against thisoxidative stress. Catalase (CAT) and glutathione-S-transferase (GST)are two important antioxidant enzymes of this system (Storey,1996; Trenzado et al., 2006). Among the tests used to investi-gate genotoxicity, the micronuclei (MN) test has been shown tobe a sensitive indicator of chromosome damage and has beenused with success (Al-Sabti et al., 1994; Al-Sabit and Metcalfe,1995).

Toxic
L.M. Correa et al. / AquaticCurrently, there is only one study focused on Th exposure inaquatic animals (rainbow trout, Oncorhynchus mykiss) in litera-ture (Poston, 1982). Therefore, it is important to conduct additionalstudies regarding the influence of this element on aquatic organ-isms. The aim of this study is to evaluate the effect of 15 days ofwaterborne Th exposure on Th accumulation, metabolic and oxida-tive parameters in several organs, and cytogenetic parameters inthe erythrocytes of the silver catfish, Rhamdia quelen.
2. Materials and methods
2.1. Experimental protocol
Silver catfish juveniles (6.41 ± 0.17 g and 8.78 ± 0.10 cm) wereacquired from the fish culture sector at the Universidade Federal deSanta Maria (Brazil). Fish were kept in continuously aerated tanks(250 L) with dechlorinated well water and a natural photoperiod(12 h light and 12 h dark) for at least 2 weeks before experimentaluse. The temperature and pH of the water were kept at 22 ± 1.0 ◦Cand 7.6 ± 0.2, respectively.
After the acclimation period, fish were transferred into 40 Laquaria (7 fish per tank) and exposed to different waterborne Thconcentrations (�g L−1): 0 (below detection limit, 0.05 �g L−1, con-trol), 25.3 ± 3.2, 69.2 ± 2.73, 209.5 ± 17.6, and 608.7 ± 61.1 (threereplicates per treatment) for 15 days. Waterborne Th was adjustedto the appropriate levels using Th(NO3)4·5H2O (BDH ChemicalLtda, England Analar®, purity > 99%, compound of low radiotoxicityaccording to the dealer). Water was air saturated through con-stant aeration in a static system. Fish were fed to satiety once aday with commercial fish pellets (Supra 42% crude protein, AlisulAlimentos S.A., Carazinho, Brazil). Thorium levels in the food werebelow detection limits (0.08 ng g−1). Uneaten food and feces weresiphoned daily, and at least 20% of the water in the aquaria wasreplaced by water with previously adjusted pH and waterborne Thlevels.
2.2. Tissue collection
After the experimental period, the fish were placed in recipientswith water and ice for 5 min for anesthetizing. Blood was then col-lected from the caudal vein using heparinized syringes. Fish werethen killed by spinal section, and the tissues (bile, gills, liver, mus-
cle, brain, skin and kidney) were removed, weighed separately, andimmediately frozen in liquid argon. The tissues were then stocked ina −70 ◦C freezer for subsequent analysis of metabolites and enzy-matic activity or in a −20 ◦C freezer for posterior digestion withconcentrated nitric acid (HNO3, 65%, Merck). Th concentration indigested samples was determined by inductively coupled plasmamass spectrometry (ICP-MS, Elan DRCII PerkinElmer SCIEX (USA)),using conditions recommended by the manufacturer. Aqueous cal-ibration standards were prepared by sequential dilution of a stocksolution of Th (10 �g L−1, Spex CertiPrep, Metuchen, USA). Stan-dards were prepared daily using 0.10, 0.25, 0.50, 0.75, 1.00, 1.50,and 2.00 �g L−1 Th. Sample digests were diluted when necessary.Accuracy was evaluated by analysis of two biological certified ref-erence materials: IRMM BCR 668 (mussel tissue, 10.7 ± 1.2 �g g−1)and NIST SRM 1566b (oyster tissue, 0.0367 ± 0.0043 �g g−1). Recov-ery tests were also performed for sample digests and water samples.After every ten measurements, two standard Th solutions wereanalyzed to check the slope of the calibration curve. If slope dif-ference was higher than 5%, the calibration curve was preparedagain using all standards. The precision of ICP-MS measurementswas considered acceptable up to 2%.ology 88 (2008) 250–256 251
2.3. Biochemical parameters
Liver and muscle glycogen levels were determined according toBidinotto et al. (1998) after KOH and ethanol addition for hydrol-ysis and precipitation of glycogen. For protein analysis, tissueswere warmed at 100 ◦C with KOH and centrifuged at 1000 × g for10 min. The supernatant was used to determine the total proteinlevel according to Lowry et al. (1951). For lactate and glucose leveldetermination, tissue samples were homogenized by adding 20%trichloroacetic acid using a motor-driven Teflon® pestle and cen-trifuged at 1000 × g for 10 min for flocculation of the proteins. Thecompletely deproteinated supernatant was used for lactate deter-mination using the method described by Harrower and Brown(1972), and glucose was measured according to Duboie et al.(1956).
2.4. Parameters of oxidative stress
The gills, liver and muscle tissues were homogenized in 1.15%(w/v) KCl solution containing 1 mM PMSF. The homogenates werecentrifuged at 600 × g for 10 min to eliminate nuclei and cell debris,and the supernatant fraction obtained was frozen at −70 ◦C for fur-ther measurements. The supernatants were used for analysis ofCAT, GST and lipid peroxidation (LPO) levels. Catalase activity wasdetermined by using the method described by Boveris and Chance(1973), in which the disappearance of H2O2 is followed spectropho-tometrically at 240 nm. The results were reported as pmol mg−1
protein.Glutathione-S-transferase activity towards CDNB (1-chloro-
2,4-dinitrobenzene) was determined spectrophotometrically at340 nm using the method described in Habig et al. (1974). Activitywas calculated from the changes in absorbance at 340 nm using theextinction coefficient of 9.6 mmol−1 cm−1. One unit of GST activitywas defined as the amount of enzyme catalyzing the conjugationof 1 �mol of CDNB with GSH per minute at 25 ◦C.
Lipid peroxidation was measured by thiobarbituric acid reactivesubstances (TBARS) using the method described by Buege and Aust(1978). In this method, absorbance measurements at 535 nm wereused to measure the reaction between thiobarbituric acid and theLPO products, resulting in the formation of a chromogen (Schiff’sbase). The results were reported as nmol mg−1 protein. The pro-tein content of the homogenate was measured using the methoddescribed in Lowry et al. (1951) using bovine serum albumin as thestandard.
2.5. Cytogenetic parameters
The frequency of micronuclei in the erythrocytes was evalu-ated according to the criteria described by Countryman and Heddle(1976) and Fenech (1993). Immediately after sampling, a drop ofblood was smeared on clean slides (two per fish), which were driedat room temperature and after 24 h were fixed in 100% methanol for10 min. Afterwards, they were stained with 4% Giemsa solution for10 min, air-dried, and then prepared for permanent use. Cytologicalanalysis was done under an optical microscope (1000× objective).A total of 2000 erythrocyte cells were examined per fish in codedslides. The presence of other nuclear abnormalities in erythrocytes(NAE) was also analyzed.
2.6. Water parameters
Water alkalinity (33.9 ± 0.5 mg L−1 CaCO3) was determinedweekly by the sulfuric acid (H2SO4) method (Greenberg et al., 1976).Measurements of dissolved oxygen (6.24 ± 0.05 mg L−1) (YSI modelY5512 oxygen meter) and water pH (7.60 ± 0.01) (Quimix 400A pH
252 L.M. Correa et al. / Aquatic Toxic
meter) were performed daily. Water hardness (24.8 ± 0.5 mg L−1
CaCO3) was determined by the EDTA titrimetric method, and totalammonia nitrogen (0.20 ± 0.01 mg L−1) (NH3 + NH4
+) was deter-mined by the direct nesslerization method (Greenberg et al.,1976). Waterborne Th levels (as well as in the tissues) weremeasured weekly by inductively coupled plasma mass spectrome-try.
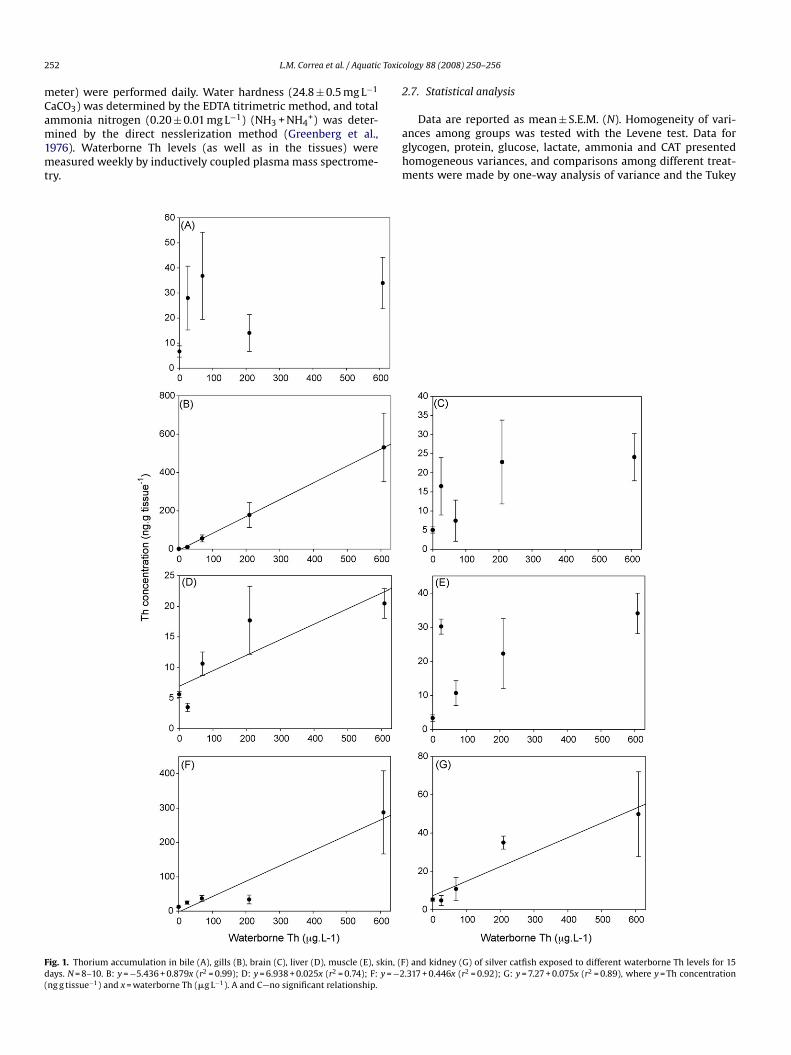
Fig. 1. Thorium accumulation in bile (A), gills (B), brain (C), liver (D), muscle (E), skin, (Fdays. N = 8–10. B: y = −5.436 + 0.879x (r2 = 0.99); D: y = 6.938 + 0.025x (r2 = 0.74); F: y = −2(ng g tissue−1) and x = waterborne Th (�g L−1). A and C—no significant relationship.
ology 88 (2008) 250–256
2.7. Statistical analysis
Data are reported as mean ± S.E.M. (N). Homogeneity of vari-ances among groups was tested with the Levene test. Data forglycogen, protein, glucose, lactate, ammonia and CAT presentedhomogeneous variances, and comparisons among different treat-ments were made by one-way analysis of variance and the Tukey
) and kidney (G) of silver catfish exposed to different waterborne Th levels for 15.317 + 0.446x (r2 = 0.92); G: y = 7.27 + 0.075x (r2 = 0.89), where y = Th concentration
L.M. Correa et al. / Aquatic Toxicology 88 (2008) 250–256 253
Table 2Oxidative stress determination in different organs of silver catfish exposed to dif-ferent waterborne Th levels for 15 days
Th (�g L−1) TBARS (nmol mg−1) GST (pmol mg−1)
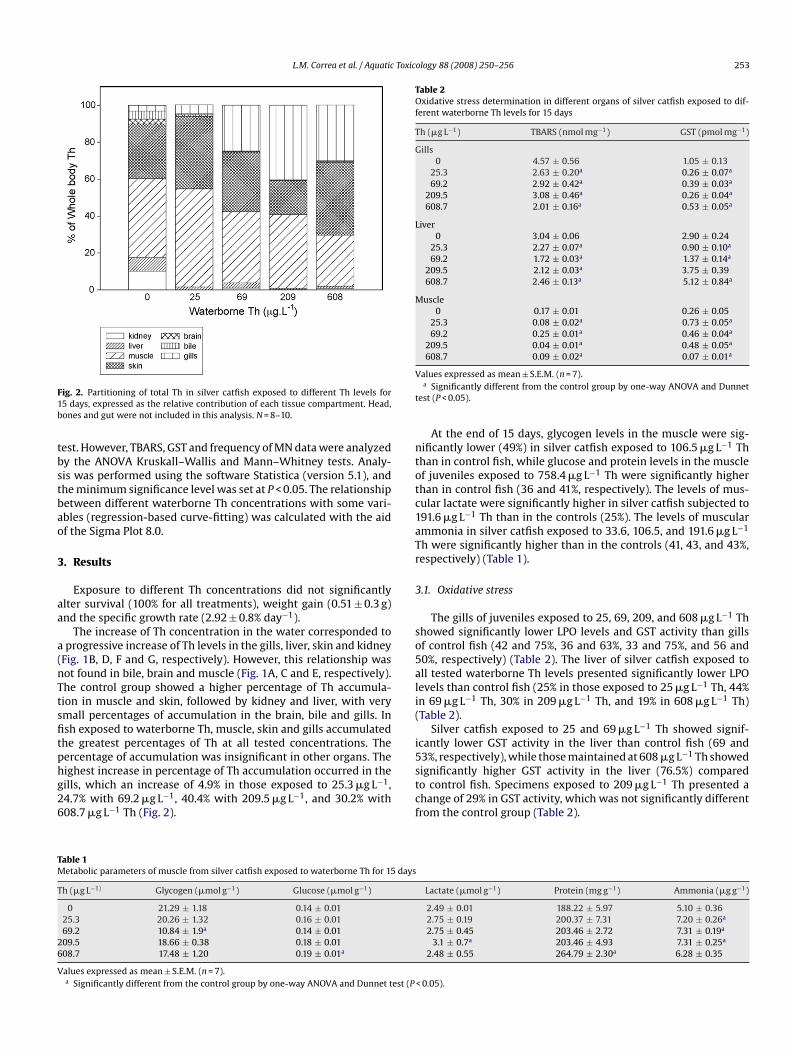
Fig. 2. Partitioning of total Th in silver catfish exposed to different Th levels for15 days, expressed as the relative contribution of each tissue compartment. Head,bones and gut were not included in this analysis. N = 8–10.
test. However, TBARS, GST and frequency of MN data were analyzedby the ANOVA Kruskall–Wallis and Mann–Whitney tests. Analy-sis was performed using the software Statistica (version 5.1), andthe minimum significance level was set at P < 0.05. The relationshipbetween different waterborne Th concentrations with some vari-ables (regression-based curve-fitting) was calculated with the aid
of the Sigma Plot 8.0.3. Results
Exposure to different Th concentrations did not significantlyalter survival (100% for all treatments), weight gain (0.51 ± 0.3 g)and the specific growth rate (2.92 ± 0.8% day−1).
The increase of Th concentration in the water corresponded toa progressive increase of Th levels in the gills, liver, skin and kidney(Fig. 1B, D, F and G, respectively). However, this relationship wasnot found in bile, brain and muscle (Fig. 1A, C and E, respectively).The control group showed a higher percentage of Th accumula-tion in muscle and skin, followed by kidney and liver, with verysmall percentages of accumulation in the brain, bile and gills. Infish exposed to waterborne Th, muscle, skin and gills accumulatedthe greatest percentages of Th at all tested concentrations. Thepercentage of accumulation was insignificant in other organs. Thehighest increase in percentage of Th accumulation occurred in thegills, which an increase of 4.9% in those exposed to 25.3 �g L−1,24.7% with 69.2 �g L−1, 40.4% with 209.5 �g L−1, and 30.2% with608.7 �g L−1 Th (Fig. 2).
Table 1Metabolic parameters of muscle from silver catfish exposed to waterborne Th for 15 days
Th (�g L−1) Glycogen (�mol g−1) Glucose (�mol g−1)
0 21.29 ± 1.18 0.14 ± 0.0125.3 20.26 ± 1.32 0.16 ± 0.0169.2 10.84 ± 1.9a 0.14 ± 0.01
209.5 18.66 ± 0.38 0.18 ± 0.01608.7 17.48 ± 1.20 0.19 ± 0.01a
Values expressed as mean ± S.E.M. (n = 7).a Significantly different from the control group by one-way ANOVA and Dunnet test (P
Gills0 4.57 ± 0.56 1.05 ± 0.13
25.3 2.63 ± 0.20a 0.26 ± 0.07a
69.2 2.92 ± 0.42a 0.39 ± 0.03a
209.5 3.08 ± 0.46a 0.26 ± 0.04a
608.7 2.01 ± 0.16a 0.53 ± 0.05a
Liver0 3.04 ± 0.06 2.90 ± 0.24
25.3 2.27 ± 0.07a 0.90 ± 0.10a
69.2 1.72 ± 0.03a 1.37 ± 0.14a
209.5 2.12 ± 0.03a 3.75 ± 0.39608.7 2.46 ± 0.13a 5.12 ± 0.84a
Muscle0 0.17 ± 0.01 0.26 ± 0.05
25.3 0.08 ± 0.02a 0.73 ± 0.05a
69.2 0.25 ± 0.01a 0.46 ± 0.04a
209.5 0.04 ± 0.01a 0.48 ± 0.05a
608.7 0.09 ± 0.02a 0.07 ± 0.01a
Values expressed as mean ± S.E.M. (n = 7).a Significantly different from the control group by one-way ANOVA and Dunnet
test (P < 0.05).
At the end of 15 days, glycogen levels in the muscle were sig-nificantly lower (49%) in silver catfish exposed to 106.5 �g L−1 Ththan in control fish, while glucose and protein levels in the muscleof juveniles exposed to 758.4 �g L−1 Th were significantly higherthan in control fish (36 and 41%, respectively). The levels of mus-cular lactate were significantly higher in silver catfish subjected to191.6 �g L−1 Th than in the controls (25%). The levels of muscular
−1
ammonia in silver catfish exposed to 33.6, 106.5, and 191.6 �g LTh were significantly higher than in the controls (41, 43, and 43%,respectively) (Table 1).3.1. Oxidative stress
The gills of juveniles exposed to 25, 69, 209, and 608 �g L−1 Thshowed significantly lower LPO levels and GST activity than gillsof control fish (42 and 75%, 36 and 63%, 33 and 75%, and 56 and50%, respectively) (Table 2). The liver of silver catfish exposed toall tested waterborne Th levels presented significantly lower LPOlevels than control fish (25% in those exposed to 25 �g L−1 Th, 44%in 69 �g L−1 Th, 30% in 209 �g L−1 Th, and 19% in 608 �g L−1 Th)(Table 2).
Silver catfish exposed to 25 and 69 �g L−1 Th showed signif-icantly lower GST activity in the liver than control fish (69 and53%, respectively), while those maintained at 608 �g L−1 Th showedsignificantly higher GST activity in the liver (76.5%) comparedto control fish. Specimens exposed to 209 �g L−1 Th presented achange of 29% in GST activity, which was not significantly differentfrom the control group (Table 2).
Lactate (�mol g−1) Protein (mg g−1) Ammonia (�g g−1)
2.49 ± 0.01 188.22 ± 5.97 5.10 ± 0.362.75 ± 0.19 200.37 ± 7.31 7.20 ± 0.26a
2.75 ± 0.45 203.46 ± 2.72 7.31 ± 0.19a
3.1 ± 0.7a 203.46 ± 4.93 7.31 ± 0.25a
2.48 ± 0.55 264.79 ± 2.30a 6.28 ± 0.35
< 0.05).

254 L.M. Correa et al. / Aquatic Toxicology 88 (2008) 250–256
Fig. 3. Catalase activity in liver (A) and muscle (B) of silver catfish exposed to differ-ent waterborne Th levels for 15 days. N = 8–10. aSignificantly different from controlby one-way ANOVA and Dunnet test (P < 0.05).
The CAT activity in the liver of fish exposed to 25 �g L−1 Th wassignificantly lower (63%), but those maintained at 608 �g L−1 Thshowed a significant increase (68%) compared to the control fish.Juveniles exposed to 69 and 209 �g L−1 Th showed a change of 33
and 25%, respectively, which was not significantly different whencompared to the control group (Fig. 3A).Silver catfish maintained in 25, 209, and 608 �g L−1 Th showedsignificantly lower LPO levels in the muscle (53, 76, and 47%,respectively), but those exposed to 69 �g L−1 Th presented a sig-nificant increase (47%) when compared to the control fish group(Table 2). The GST activity in the muscle of silver catfish exposedto 25, 69, and 209 �g L−1 Th was significantly higher (180, 77,and 84%, respectively), but those maintained at 608 �g L−1 Thshowed a significant decrease (73%) compared to control fish(Table 2). The CAT activity in the muscle of silver catfish exposedto 25 �g L−1 Th was significantly higher (83%) than control fish(Fig. 3B).
3.2. Cytogenetic parameters
Control fish did not show MN in the erythrocytes, but specimensexposed to 106.5 �g L−1 Th or higher levels presented significantlyhigher MN values than the control fish. Exposure to waterborne Thdid not significantly change the NAE values compared to controlvalues (Fig. 4).
Fig. 4. Occurrence of micronuclei (MN) and nuclear abnormalities in erythrocytes(NAE) of silver catfish exposed to different waterborne Th levels for 15 days. Therewas no MN at zero Th (control). N = 8–10. aSignificantly different from control byone-way ANOVA and Dunnet test (P < 0.05).
4. Discussion
Silver catfish juveniles exposed to the highest waterborne Thlevels showed the highest levels of Th accumulation in the skinand gills (287 and 530 �g g−1, respectively). Skin, gills, and muscleshowed the highest percentages of Th accumulation. Despite lowerlevels of Th in the muscle compared to skin and gills, its contributionto total Th accumulation in the fish is high due to the fact that itcorresponds to 30–40% of the fish’s weight. Since Th accumulationin the liver, bile, and kidney were low, hepatic and renal processeswere not involved in Th detoxification, which differs from Hg (Eliaet al., 2003) and Cd (Kumada et al., 1980). The high Th accumulationlevels detected in the skin indicate that a significant portion of thiselement could have remained adsorbed on the skin or have beenabsorbed into skin cells.
The exposure of rainbow trout to 0.61–0.82 �g L−1 Th (228Thand 232Th) for 9 or 27 days led to a whole body Th accumu-lation of 0.013–0.034 �g g−1 (Poston, 1982). The same authordetected a much higher Th accumulation in the gastrointestinaltract (0.41 �g g−1) than in the carcass (0.008 �g g−1), which is unex-
pected because fish were exposed to waterborne Th and not fedwith dietary Th.Silver catfish exposed to 106.5 �g L−1 Th showed a reduction of49% of muscle glycogen and an increase of 25% of muscular lactatein those exposed to 191.6 �g L−1 Th compared to control fish. Theseresults may indicate that glycogen is being degraded to lactate tocompensate for the stressful situation provoked by Th exposure.In addition, muscular glucose was 36% higher in fish exposed to608.7 �g L−1 Th. This elevation could be due to the increase of theglucose uptake rate in this tissue.
Higher muscular protein levels (41%) in fish exposed to608.7 �g L−1 Th and higher muscular ammonia levels (41, 43 and43%) in those exposed to 25.3, 106.5, and 191.6 �g L−1 Th, respec-tively, were observed compared to the control group. The proteincatabolism used to supply energy could be increasing protein syn-thesis (Sahib et al., 1984) as a compensatory response to a highenergy demand. Ammonia originates from protein catabolism, andit is the principal form of nitrogen excretion in most fishes (Sanchoet al., 1998; Baldisserotto, 2003). Consequently, the increase in pro-tein catabolism generates an increase of ammonia.
Toxic
L.M. Correa et al. / AquaticThe results obtained in the muscle did not allow a conclu-sive evaluation about the Th effects on silver catfish metabolism.Although the muscular metabolic profile of silver catfish exposedto waterborne Th may suggest the use of an anaerobic pathway, theevaluation of the metabolic rates in the other tissues also involvedin the metabolic process, such as liver and blood, are needed toconfirm this hypothesis.
The analysis of the parameters related to oxidative damage insilver catfish exposed to waterborne Th revealed that there wasa significant decrease in the activity of pro-oxidants (lipoperox-idation) and antioxidants (GST and CAT). Thorium accumulationincreased in the gills as waterborne levels increased. There was analteration to lipid peroxidation in the gills in fish exposed to allTh concentrations tested, suggesting oxidative damage. GST levelsshowed a similar pattern to lipoperoxidation, with a decrease ofits activity at all tested Th concentration. The gills seem to be verysensitive to oxidative damage.
The oxidative parameters of the liver did not show a clear pat-tern. Lipoperoxidation decreased in fish exposed to all tested Thconcentrations. The activity of CAT and GST decreased in the liverof fish exposed to 25 �g L−1 Th, but the activity of these enzymesin the fish exposed to the highest tested Th concentration was sig-nificantly higher than in control fish. Moreover, an increase of CATactivity was also observed in the liver of channel catfish, Ictalu-rus punctatus, exposed to paper mill effluents (Mather-Mihaichand Di Giulio, 1991). Two other antioxidant enzymes, superoxidedismutase and glutathione peroxidase, also presented higher activ-ities in the liver of Nile tilapia (Oreochromis niloticus) exposed to1500–3000 �g L−1 Cd (Almeida et al., 2002). Apparently, exposureto the highest waterborne Th levels would stimulate synthesis orenzymatic activity against oxidative damage.
Lipid peroxidation decreased significantly in the muscle of fishexposed to 25, 209, and 608 �g L−1 Th, but there was a significantincrease in oxidative damage in the muscle of those fish main-tained at 69 �g L−1 Th. The antioxidant enzymes of the musclepresented an opposite pattern from that of the liver because fishexposed to 25 �g L−1 Th showed a significant increase in both stud-ied enzymes, while fish maintained at the highest Th level hadsignificantly decreased GST levels. These results showed that lipidoxidation occurred only in the muscle of silver catfish exposed to69 �g L−1 Th. This could be due to a decrease in circulating ironsince it was demonstrated that Th could have the same properties asiron (Peter and Lehmann, 1981). The decrease of this metal, whichis fundamental for the development of the Fenton–Haber–Weiss
reaction, could lead to lower O2•, H2O2, OH•, and lipoperoxidationlevels (Winston, 1991). In the gills, the decrease in lipoperoxidationis accompanied by decreased protection, and, as a consequence,the oxidative damage persisted at all concentrations studied (Sies,1991). In the liver, a decrease in the lipid peroxidation and the activ-ity of the antioxidant enzymes in fish exposed to low waterborne Thlevels indicated that the oxidative damage persisted. However, inthose maintained at higher waterborne Th levels, there seems to bea stimulation of the antioxidant levels that would compensate forthe oxidative damage. The muscle showed lower lipoperoxidationin fish exposed to low Th levels, but a stimulation of the enzymaticantioxidants compensated for the damage. Meanwhile, at higherTh levels, this type of damage was more intense in muscle tissue.The reason for these inverted relationships is not clear, but it isclear that the presence of a transition metal such as Th alters theparameters of oxidative stress.
There is a quantitative difference in the antioxidant defensesobserved in the different studied fish species (Wilhelm Filho andMarcon, 1996), and, consequently, the relationship between theactivity of the antioxidant enzymes and the physiology of the fishesis not clear (Winston, 1991). The difference in resistance to stress-
ology 88 (2008) 250–256 255
ful situations between species, and, even among specimens of thesame species, it can occur due to individual variation in geneticexpression or individual exposure to other stressors (Cooper et al.,2002). Trace metals can increase the intracellular formation of reac-tive oxygen species through the Fenton/Haber–Weiss reaction andmetabolized substances, forming intermediate compounds in theredox cycle (Winston, 1991).
The exposure to metals also promoted alterations of the hema-tologic parameters of fishes (Heath, 1995). The higher occurrenceof MN in fish exposed to 191.6, 106.5, and 33.6 �g L−1 Th indicatedan increase in the formation of clastogenic accidents. However, inthe evaluation of NAE (segmented nucleous, lobate or in kidneyshape) according to Carrasco et al. (1990) and Matsumoto et al.(2006), there was no significant difference among the experimentalgroups, and cytoxicity was not evident. Lemos et al. (2001) showedgenotoxicity in Pimephales promelas exposed to Cr (VI) for 7, 14, and21 days and verified that the highest MN expression in erythro-cytes of fish exposed for 7 days. Moreover, zebrafish, Danio rerioshowed erythrocyte damage proportional to waterborne uraniumlevels (Barillet et al., 2005).
5. Conclusion
The results of this study demonstrated that most changes(metabolic, enzymatic and cytogenetic) occurred in silver catfishexposed to the lowest waterborne Th levels. Metabolic inter-mediates in muscle were altered by Th exposure, but no clearrelationship was found. CAT and GST activities in the hepatic andmuscular tissues of this species suggest that the enzymatic activ-ities can be stimulated at the lowest Th levels and inhibited atthe highest (mainly in 608.7 �g L−1). The results of the cytoge-netic assay contribute to this hypothesis because the higher toxicityin blood samples was found in juveniles exposed to 69.2 and209.5 �g L−1 Th.
Acknowledgement
B. Baldisserotto received a research fellowship from ConselhoNacional de Desenvolvimento Tecnologico (CNPq).
References
Ahmad, I., Hamid, T., Fatima, M., Chand, H.S., Jain, S.K., Athar, M., Raisuddin, S., 2000.
Induction of hepatic antioxidants in freshwater catfish (Channa punctatus Bloch)is a biomarker of paper mill effluent exposure. Biochim. Biophys. Acta 1523,37–48.Almeida, J.A., Diniz, Y.S., Marques, S.F., Faine, L.A., Ribas, B.O., Burneiko, R.C., Novelli,E.L., 2002. The use of the oxidative stress responses as biomarkers in Nile tilapia(Oreochromis niloticus) exposed to in vivo cadmium contamination. Environ. Int.27, 673–679.
Al-Sabti, K., Franko, M., Andrijanic, B., Knez, S., Stegnar, P., 1994. Chromium-inducedmicronuclei in fish. J. Appl. Toxicol. 13 (5), 333–336.
Al-Sabit, K., Metcalfe, C.D., 1995. Fish micronuclei for assessing genotoxicity in water.Mutat. Res. 343, 121–135.
Au, W.W., Torres, C.H.S., Salazar, N.C., Salama, A.S., 1999. Inheritance of polymorphicmetabolizing genes and environmental disease and quality of life. Mutat. Res.428, 131–140.
Baldisserotto, B., 2003. Osmoregulatory adaptations of freshwater teleosts. In:Val, A.L., Kapoor, B.G. (Eds.), Fish Adaptations. Science Publishers, Enfield, pp.179–201.
Barillet, S., Buet, A., Adam, C., Devaux, A., 2005. Does uranium exposure induce geno-toxicity in the teleostean Danio rerio? First experimental results. Radioprotection40 (1), 175–181.
Bidinotto, P.M., Moraes, G., Souza, R.H.S., 1998. Hepatic glycogen and glu-cose in eight tropical freshwater teleost fish: a procedure for fielddeterminations of micro samples. Boletim Tecnico CEPTA 10, 53–60.
Boveris, A., Chance, B., 1973. The mitochondrial generation of hydrogen peroxide.Biochem. J. 134, 707–716.
Buege, J.A.E., Aust, S.D., 1978. Microsomal lipid peroxidation. Methods Enzymol. 52,302–309.

Toxic
256 L.M. Correa et al. / AquaticCarrasco, K.R., Tilbury, K.L., Mayers, M.S., 1990. Assessment of the piscine micronucleitest as in situ biological indicator of chemical contaminants effects. Can. J. Fish.Aquat. Sci. 47, 2123–2136.
Cooper, R.U., Clough, L.M., Farwell, M.A., West, T.L., 2002. Hypoxia-induced metabolicand antioxidant enzymatic activities in the estuarine fish Leiostomus xanthurus.J. Exp. Mar. Biol. Ecol. 279, 1–20.
Countryman, P.I., Heddle, J.A., 1976. The production of micronuclei from chromo-some aberrations in irradiated cultures of human lymphocytes. Mutat. Res. 41,321–332.
DiGiulio, R.T., Washburn, P.C., Wenning, R.J., Winston, G.W., Jewell, C.S., 1989. Bio-chemical responses in aquatic animals: a review of determinats of oxidativestress. Environ. Toxicol. Chem. 8, 1103–1123.
Duboie, M., Gilles, K.A., Hamilton, J.K., 1956. Colorimetric method for determinationof sugars and related substances. Anal. Chem. 28, 350–358.
Elia, A.C., Galarini, R., Taticchi, M.I., Dorr, A.J.M., Mantilacci, L., 2003. Antioxidantresponses and bioaccumulation in Ictalurus melas under mercury exposure. Eco-toxicol. Environ. Saf. 55, 162–167.
Fenech, M., 1993. The cytokinesis-block micronucleus technique: a detailed descrip-tion of the method and its application to genotoxicity studies in humanpopulations. Mutat. Res. 285, 35–44.
Greenberg, A.E., Taras, M.J., Rand, M.C., 1976. Standard Methods for the Examinationof Water and Wastewater. Bru-El Graphic Inc., Springfield.
Habig, W.H., Pabst, M.J., Jakoby, W.B., 1974. Glutathione-S-transferases. The firstenzymatic step in mercapturic acid formation. J. Biol. Chem. 249, 7130–7139.
Halliwell, B., Gutteridge, J.M.C., 1999. Free Radicals in Biology and Medicine, 3rd ed.Oxford University Press, Oxford.
Harrower, J.R., Brown, C.H., 1972. Blood lactic acid. A micromethod adapted to fieldcollection of microliter sample. J. Appl. Physiol. 32 (5), 224–228.
Heath, A.G., 1995. Water Pollution and Fish Physiology, 2nd ed. CRC Press, Boca Raton.Ivanovich, M., Harmon, R.A., 1982. Uranium-Series Disequilibrium: Applications to
Earth, Marine and Environmental Sciences. Clarendon Press, Oxford.Kumada, H., Kimura, S., Yokote, M., 1980. Accumulation and biological effects of
cadmium in rainbow trout. Bull. Jpn. Soc. Sci. Fish. 46, 97–103.Langmuir, D., Herman, J.S., 1980. The mobility of thorium in natural waters at low
temperatures. Geochim. Cosmochim. Acta 44, 1753–1766.Lemos, C.T.L., Rodel, P.M., Terra, N.R., Erdtmann, B., 2001. Evaluation of basal micronu-
cleus frequency and hexavalent chromium effects in fish erythrocytes. Environ.Toxicol. Chem. 20 (6), 1320–1324.
Lowry, O.H., Rosebrough, N.J., Farr, A.L., Randall, R.J., 1951. Folin phenol reagent. J.Biol. Chem. 193, 265–275.
ology 88 (2008) 250–256
Mather-Mihaich, E., Di Giulio, R.T., 1991. Oxidant, mixed-function oxidase and per-oxisomal responses in channel catfish exposed to a beached kraft mill effluent.Ach. Environ. Contam. Toxicol. 20, 391–397.
Matsumoto, S.T., Mantovani, M.S., Malaguttii, M.I.A., Dias, A.L., 2006. Genotoxicityand mutagenicity of water contamined with tannery effluents as evaluated bythe micronucleous test and comet assay using the fish Oreochromis niloticus andchromosome aberrations in onion root-tips. Gen. Mol. Biol. Soc. Gen. 29 (1),148–158.
Peter, E., Lehmann, M., 1981. Interaction of thorium with blood serum proteins invivo. Int. J. Radiat. Biol. 4, 445–450.
Poston, T.M., 1982. Observations on the bioaccumulation potential of thorium anduranium in rainbow trout, Salmo gairdneri. Bull. Environ. Contam. Toxicol. 28,682–690.
Radi, A.A.R., Matkovics, B., 1988. Effects of metal ions on the antioxidant enzymesactivities, proteins contents and lipid peroxidation of carp tissues. Comp.Biochem. Physiol. 90, 69–72.
Sahib, I.K.A., Sambasiva Rao, K.R.S., Ramana Rao, K.V., 1984. Effect of malathion onprotein synthethic potentiality of the tissues of the teleost, Tilapia mossambica(Peters), as measured through incorporation of (14C) amino acids. Toxicol. Lett.20, 63–67.
Sancho, E., Ferrando, M.D., Fernandez, C., Andreu, E., 1998. Liver energy metabolismof Anguilla anguilla after exposure to fenitrothion. Ecotoxicol. Environ. Saf. 41,168–175.
Sies, H., 1991. Oxidative Stress: Oxidants and Antioxidants. Academic Press, London.Storey, K.B., 1996. Oxidative stress: animal adaptations in nature. Braz. J. Med. Biol.
Res. 29, 1715–1733.Tonetto, E.M., Bonotto, D.M., 2002. Mobilizacao de torio em aguas subterraneas de
Aguas da Prata, estado de Sao Paulo. Rev. Bras. Geociencias 32 (3), 343–350.Trenzado, C., Hidalgo, M.C., Garcia-Gallego, M., Morales, A.E., Furne, M., Domezain, J.,
Sanz, A., 2006. Antioxidant enzimes and lipid peroxidation in sturgeon Acipensernaccarii and trout Oncorhynchus mykiss. A comparative study. Aquaculture 254,758–767.
Wilhelm Filho, D., Marcon, J.L., 1996. Antioxidant defenses in fish of the Amazon. In:Val, A.L., Almeida-Val, V.M., Randall, D.J. (Eds.), Physiology and Biochemistry ofthe Fishes of the Amazon. INPA, Manaus, pp. 299–312.
Winston, G.W., 1991. Oxidants and antioxidants in aquatic animals. Comp. Biochem.Physiol. 100, 173–176.
Yusof, A.M., Mahat, M.N., Omar, N., Wood, A.K.H., 2001. Water quality studies in anaquatic environment of disused tin-mining pools and in drinking water. Ecol.Eng. 16, 405–414.
Copyright © 2022 FDOKUMEN