Fédération Royale Ouvrière de Tennis de ... - FROTTBF Hainaut
Upload
independentCategory
view
1download
0
The Science of the Total Environment 304(2003) 327–348
0048-9697/03/$ - see front matter� 2003 Elsevier Science B.V. All rights reserved.PII: S0048-9697Ž02.00579-X
Factors affecting enhanced mercury bioaccumulation in inlandlakes of Isle Royale National Park, USA
Patrick R. Gorski *, Lisa B. Cleckner , James P. Hurley , Michael E. Sierszen ,a, a a,b c
David E. Armstronga
University of Wisconsin–Madison, Environmental Chemistry and Technology Program, Madison, WI 53706, USAa
Wisconsin Department of Natural Resources, Bureau of Integrated Science Services, Monona, WI 53716, USAb
US Environmental Protection Agency, Mid-Continent Ecology Division, Duluth, MN 55804, USAc
Received 13 February 2002; accepted 15 October 2002
Abstract
We investigated factors causing mercury(Hg) concentrations in northern pike to exceed the consumption advisorylevel ()500 ngyg) in some inland lakes of Isle Royale National Park. Using Hg-clean techniques, we collectedwater, zooplankton, macro invertebrates, and fishes in 1998 and 1999 from one advisory lake, Sargent Lake, foranalysis of total mercury(Hg ) and methylmercury(MeHg). For comparison, samples were also collected from aT
non-advisory lake, Lake Richie. Concentrations of Hg in northern pike were significantly higher in Sargent LakeT
(P-0.01). Counter to expectations, mean concentrations of both Hg and MeHg in open water samples were slightlyT
higher in Lake Richie. However, zooplankton in Sargent Lake contained higher average concentrations of Hg andT
MeHg than in Lake Richie. Mercury concentrations in macro invertebrates were similar between lakes, but differentbetween taxa. The two lakes exhibited similar Hg concentrations in age-1 yellow perch and adult perch butT
concentrations in large adult perch()160 mm) in Sargent Lake were twice the concentrations in Lake Richie.Analysis of stable isotopes(d C andd N) in biota showed that pike from the two lakes are positioned at the same13 15
trophic level (4.2 and 4.3), but that the food web is more pelagic-based in Sargent and benthic-based in Richie.Factors causing concentrations in large pike to be higher in Sargent Lake may include higher bioavailability ofmethylmercury and a food web that enhances bioaccumulation.� 2003 Elsevier Science B.V. All rights reserved.
Keywords: Mercury; Methylmercury; Zooplankton; Yellow perch; Northern pike; Stable isotopes;d C; d N; Food web; Trophic13 15
level; Biomagnification; Bioavailability
1. Introduction
Elevated Hg levels were recently reported inaquatic biota in inland lakes of Isle Royale Nation-al Park (Kallemeyn, 2000). Preliminary results
*Corresponding author. Tel.:q1-608-265-5086; fax:q1-608-262-0454.
E-mail address: [email protected](P.R. Gorski).
from a 3-year Inland Lakes Fishery Inventoryshowed higher concentrations of Hg in northernpike from six Isle Royale lakes, including SargentLake. Also, results from the Michigan Fish Con-taminant Monitoring Report showed elevated Hglevels in lake trout in Siskiwit Lake(MI DNR,1997). For these lakes, Hg levels in fish exceedthe MI consumption advisory of 0.5 ppm(500

328 P.R. Gorski et al. / The Science of the Total Environment 304 (2003) 327–348
ngyg wet weight). Although Hg concentration canincrease six orders of magnitude from surfacewaters to fish(Watras et al., 1994; Hudson et al.,1994), the factors causing differences among lakesin bioaccumulation are not well understood.The main focus of this investigation, which was
done concurrently with other Hg research on theisland (for example see Vucetich et al., 2001),was a comparison of Hg concentrations in SargentLake, an advisory lake, to those in Lake Richie—a non-advisory lake used as a reference. Our goalwas to determine reasons for elevated Hg levelsin fish from Sargent Lake. We expected thatelevated concentrations of Hg in the lake water orthe lower food chain might account for elevatedconcentrations in fish. We compared concentra-tions of Hg and MeHg in samples of water,T
plankton, invertebrates, and fishes in the two lakesemploying ultra-sensitive analytical techniques andestablished protocols. We also used stable isotopedata to compare the food web structure.
2. Materials and methods
2.1. Field methods
Isle Royale, the largest island in Lake Superior,located in the NW portion of the lake, is also aUS National Park and designated as an Interna-tional Biosphere Reserve. Field sampling tookplace from June 1998–August 1999 and wasfocused on 2 of the 43 inland lakes: Sargent Lakeand Lake Richie. The two lakes were chosen dueto their morphometric similarities(Hyslop, unpub-lished data) and close proximity to each other.All sampling, sample processing and analysis
for Hg followed accepted clean techniques tominimize contamination of samples(US EPA,1996b; Olson et al., 1997; Cleckner et al., 1998;Hurley et al., 1998). Samples for Hg analysis werecollected into acid cleaned Teflon(or other appro-priate container), double-bagged and preserved(addition of 10 ml 50% trace metal grade HCl foraqueous total Hg, frozen for all solid phase sam-ples and aqueous MeHg). Appropriate taxonomickeys were used for identification of biota(Becker,1983; Balcer et al., 1984; Merritt and Cummins,1984; Thorp and Covich, 1991).
2.1.1. WaterPelagic water samples were collected from a
canoe using acid leached tubing and pumping into5-l Teflon bottles. Sampling depths(usually 1 mbelow the surface and 1 m above the sediment)were determined by temperature, dissolved oxy-gen, conductivity and pH profiles. After collection,samples were transported to shore and processedfor particle and filtered phases using a DC vacuumpump and acid-leached 0.45mm nitrocellulosefilters. Tributary grab samples were processedsimilar to pelagic samples. After Hg splits wereobtained, water samples were further processed forancillary measurements: dissolved organic carbon(DOC, 15 ml of 0.45mm nitrocellulose-filteredwater in ashed glass vial), pigments(100–300 mlon glass fiber filters), and suspended particulatematter(SPM,;100 ml on pre-weighed 0.45mmpolycarbonate filters). Ancillary samples werefrozen.
2.1.2. ZooplanktonZooplankton were collected from the pelagic
region of the lake by towing a non-metallic plank-ton net horizontally behind a canoe for approxi-mately 50 m through the epilimnion(0–4 m deep).The plankton was then cleanly back-washed intoa Teflon container filled with lake water andfrozen.
2.1.3. Littoral invertebratesBenthic invertebrates were collected in the lit-
toral zone of each lake and consisted of aquaticinsects and freshwater mussels(Unionidae).Insects (mostly immature forms of dragonflies,mayflies, caddisflies) were collected using cleantechniques and a non-metallic sieve, dip net, or bypicking individuals off of woody debris or rocks.Individuals were separated by Order into Teflonvials with site water and frozen.
2.1.4. FishesAge-1 yellow perch(Perca flavescens) were
sampled with non-metallic sieves in July 1999(Sargent: ns10, Richie: ns13). Adult yellowperch were caught with non-metallic minnow trapsthat were set overnight near the insect collectionsites(Sargent:ns33, Richie:ns15). Angling or

329P.R. Gorski et al. / The Science of the Total Environment 304 (2003) 327–348
netting was used to collect northern pike(Esoxlucius). Individual fish were placed into acid-cleaned sample containers(Teflon jars, polyethyl-ene jars) or new polyethylene bags. Fish werefrozen whole or as skin-on fillets until processing.We later included previously published Hg con-T
centrations for pike(Kallemeyn, 2000) to the dataset(Sargent:ns25, Richie:ns21).
2.2. Laboratory preparation
2.2.1. WaterWater samples for Hg analysis were first oxi-T
dized with BrCl and then placed in an oven at 608C overnight (US EPA, 1996a). Methylmercurywater samples were distilled using standard tech-niques and reagents, with modifications for specif-ic matrix effects(Horvat et al., 1993; Olson et al.,1997).
2.2.2. ZooplanktonFor 1998 samples, zooplankton samples were
picked individually using acid cleaned glasspipettes and a compound microscope under a HighEfficiency Particulate Air(HEPA)-filtered cleanarea. Major taxonomic groups were separated,enumerated and placed into separate Teflon vialswith at least 100 organisms per vial(Back et al.,1995). At least three vials(one for Hg , one forT
MeHg, one for dry weight) were picked for eachdate, lake and species.A syringe method of processing was developed
for processing 1999 zooplankton samples. Afterthawing and sieving(112mm Nitex), 10 ml sub-samples were collected on a 47 mm diameter pre-ashed quartz fiber filter (QFF). For eachzooplankton sample, six QFFs were taken(threereplicates each for Hg and MeHg). An additionalT
sub-sample was used for SPM and another waspreserved with 10% formalin for zooplanktoncounts and identification.Samples (on filters) for Hg analysis wereT
placed into 125 ml Teflon bottles with 75 ml ofdeionized water and 6 ml BrCl, heated(60 8C)overnight, and analyzed as water samples. Samplesfor MeHg analysis were distilled following waterprocedure, above.
2.2.3. Littoral invertebratesOrganisms were composited()3 individuals)
into pre-weighed Teflon vials according to taxo-nomic groups, predominately by Order. Due to themass of sample needed for analytical detection,invertebrates often were composited by taxonomicgroupings larger than species. Specific identifica-tion may have been lost, but samples were groupedtaxonomically in the same manner for both lakesand grouped to the most specific group that wasanalytically detectable. Also, species diversity waslow and consistent throughout the study. Wetweights were determined and then the invertebrateswere freeze-dried. Dry weights were obtained,homogenized and split into MeHg and HgT
samples.
2.2.4. FishesYellow perch were measured for length and
weight. All adult perch were individually groundwhole with a stainless steel blender and placedinto acid-cleaned vessels. From this container, asub-sample(measured to the nearest 0.1 mg ww)was placed into a vial for Hg processing. Individ-T
ual age-1 perch were not homogenized, but proc-essed whole.Northern pike skin-on fillets were ground twice
in a large meat grinder. Fully homogenized sam-ples were then placed into acid-leach polyethylenecontainers, sub-sampled and placed into a vial forHg processing.T
2.2.5. Processing biota for mercury analysesFor Hg samples, a known amount of sampleT
was placed into a clean Teflon container alongwith 7 ml of a nitric and sulfuric trace metal gradeacid mixture (5:2 HNO :H SO), micro waved,3 2 4
cooled and approximately 23 ml of Milli-Q waterwas added to each(to the nearest 0.1 ml). Finally,1 ml of BrCl was added and then they were placedin an oven at 608C overnight. Blanks and standardreference materials(SRMs) each constituted atleast 10% of each processing batch.For MeHg samples, a known amount of sample
was placed into a clean Teflon vial to which 10ml of a 25% KOHymethanol mixture was added.Each vial was sonicated for 6–8 h, and then placedin an oven at 608C overnight followed by 10 ml

330 P.R. Gorski et al. / The Science of the Total Environment 304 (2003) 327–348
of methanol (Bloom, 1992). Three blanks andthree SRMs were also processed and analyzedalong with each batch of samples.
2.2.6. Carbon and nitrogen stable isotopesA homogenized sub-sample of each biota type
was freeze-dried and ground with a mortar andpestle. These sub-samples consisted of the sametissue processed for Hg. A portion(1.0–1.5 mg)of each sub-sample was then placed into small tincups(5.0=3.5 mm) and sealed.2
2.3. Analyses
2.3.1. MercuryTotal Hg analysis used established protocols for
dual gold amalgamation and cold vapor atomicfluorescence spectroscopy(CVAFS) techniques(Gill and Fitzgerald, 1987; US EPA, 1996a; Olsonet al., 1997; Hurley et al., 1998). Methylmercuryanalysis followed ethylation, gas chromatographseparation, pyrolysis, and CVAFS detection tech-niques (Horvat et al., 1993; Liang et al., 1994;Olson et al., 1997; Hurley et al., 1998). Aqueoussamples were routinely spiked before distillationwith aqueous MeHg standard and spike recoverieswere between 75 and 125%. SRMs(NationalResearch Council of Canada), usually TORT-2(lobster hepatopancreas) or DOLT (dogfish liver),were also processed and analyzed along with thesamples to quantify both total and methyl Hgrecoveries during the processing. Analyzed valueswere consistently within the certified ranges forboth TORT-2 (Hg : 270"60 ngyg dw, MeHg:T
152"13 ngyg dw) and DOLT (Hg : 2140"280T
ngyg dw, MeHg: 693"53 ngyg dw).
2.3.2. Carbon and nitrogen stable isotopesSamples for carbon and nitrogen isotopes were
analyzed on a Micromass Isochrom-EA NC2500isotope ratio mass spectrometer. Isotope ratios areexpressed as d values, parts-per-thousand(ppt or‰) deviations from the ratios found in referencematerials (Peedee belemnite C and atmosphericN). Ultrapure urea(CAS �57-13-6) instrumentquality assurance(QA) samples had a standardd C value ofy48.139‰ that was measured with13
a mean standard deviation(S.D.) of 0.063. The
QA d N standard value wasy0.919‰, which15
was measured with a mean S.D. of 0.011. Thesample QA SRM used routinely was black bull-head(Ameiurus melas) muscle tissue since it hadsimilar isotopic and C:N ratios to both fish andinvertebrate samples. Sample isotopic ratios werecorrected for day-to-day instrument drift using thesample standards. Triplicate sub-samples of eachsample were analyzed, and the mean d value forsub-samples is reported as the sample value.Several types of biota were analyzed ford C13
and d N and included pike(Sargent: ns14,15
Richie:ns11), adult perch(Sargent:ns6, Richie:ns6), Hexagenia (Sargent:ns1, Richie: ns1),caddisflies(Sargent:ns2, Richie:ns2), mussels(Sargent:ns1, Richie:ns1) and bulk zooplank-ton (Sargent:ns3, Richie:ns3).The trophic level of different taxa was calculated
from nitrogen signatures:
15 15w xTrophic level of taxons d Nyd N y3.4 q2Ž .i i caddisfly
It was assumed that algae form the basis forthese food webs and are at trophic level 1; primaryconsumers such as caddisflies and zooplankton arethus assumed at level 2. Trophic levels are calcu-lated assuming 3.4‰ enrichment of N per trophic15
level (DeNiro and Epstein, 1981; Hobson andWelch, 1995).
2.3.3. Ancillary water samplesDOC was analyzed on a Shimadzu TOC-5000
analyzer with ASI-5000 auto sampler and Balston78–30 high purity TOC gas generator. Pigmentswere extracted from filters in 5 ml of 90% acetonein water and filtered into 4 ml amber HPLC vialswith a Gelman 0.2mm Teflon filter (Hurley andArmstrong, 1990). Instrumentation consisted of aWaters 600 Pumping System, Waters 712B Autosampler, Waters 996 Photodiode Array Detector(scan every 0.5 s 380–530 nm), Hitachi Model4000 absorbance detector(set at 440 nm), MiltonRoyyLDC Fluoromonitor(set atl s410 nmexcitation
andl s)650 nm) and a Waters Millenniumemission
Data Reduction System. A gradient system wasused for elution(Pinckney et al., 1996). Polycar-bonate filters for SPM were dried at 408C for 48

331P.R. Gorski et al. / The Science of the Total Environment 304 (2003) 327–348
Fig. 1. Average Hg concentrations in water during 1998–1999. Error bars represent"1 standard error(S.E.). ** Significantdifference atP-0.01.
h, and then weighed on a Perkin-Elmer AD-4microbalance to within 1mg.
3. Results
3.1. Water
The two lakes(Sargent and Richie) have manysimilarities. Both became stratified during the sum-mer and developed hypolimnetic anoxia. Duringstratification MeHg concentrations near the bottomof both lakes increased from below detection to0.3 ngyl. The average surface pH was 7.7 forSargent Lake and 7.4 for Lake Richie. The averageconductivity was 74.0mS for Sargent and 62.7mSfor Richie.Pelagic water from Sargent and Richie differed
between the two lakes in concentrations of Hg ,T
MeHg, SPM and DOC, although differences weresmall (Figs. 1 and 2). Average Hg (unfiltered)T
concentrations in Richie Lake were significantlyhigher(P-0.01, Wilcoxon Signed Rank test,Zs2.64, ns28), but differences in concentrations offilterable Hg were not significant(P)0.05, Wil-T
coxon, Zsy0.941, ns26). Average MeHg con-
centrations in both filtered and unfiltered sampleswere not significantly different between lakes(P)0.05, Wilcoxon). Concentrations of MeHg werelow in June for both lakes(at or below detectionlimits), but increased in August and were highest(;3 times higher) at 8 m. Average hypolimneticunfiltered MeHg concentrations were 0.08 ngyl"0.04 (S.E.) for Sargent and 0.16 ngyl"0.09(S.E.) for Richie, but this difference was notsignificant (P)0.05, Wilcoxon) due to seasonalvariability. Contrary to expectations, hypolimneticwater in Richie contained the highest percent ofHg present as MeHg(;20%), the form of HgT
that can bioaccumulate. Lake Richie also containedhigher average concentrations of SPM(Ps0.05,Wilcoxon, Zs1.93, ns28) and DOC (P-0.05,Wilcoxon, Zs2.20,ns18; see Fig. 2).Methylmercury concentrations in open water
particulate matter were similar between the twolakes (Fig. 3). Partitioning of MeHg to particleswas calculated by using the distribution coefficient(K ) as in Hurley et al.(1998):d
K sSyD (lykg)d

332 P.R. Gorski et al. / The Science of the Total Environment 304 (2003) 327–348
Fig. 2. Average concentrations of SPM)0.45mm, DOC, and chla. * Significant difference atP-0.05.
whereSsconcentration of Hg sorbed to particles(ngykg); calculated as(Unfiltered sampleyfil-tered sample) (ngyl)ywSPMx (kgyl); Dsconcen-tration of Hg dissolved in water(ngyl) in a 0.45mm filtered sample.Even though the concentration of MeHg in the
dissolved phase is similar between lakes, theKd
was 2 times higher in Sargent Lake(Fig. 3).However, this is probably not a significant differ-ence due to the error about the means used in theK calculation.d
To explore possible inputs of Hg to the lakeother than direct atmospheric deposition, tributariesto the lakes were sampled(6 streams in Sargent,3 in Richie). The streams varied in width(1–15m) and usually drained beaver ponds or wetlands.Due to low rainfall in summer of 1998, manytributaries were dry and flow was very low inothers, especially in August. Concentrations ofMeHg were similar among tributaries(Fig. 1), butMeHg and DOC levels in tributaries were signifi-cantly higher(P-0.05, Wilcoxon andt-test) thanin the respective lake water receiving the streamflow.
3.2. Pigments
During 1998–1999, the average chlorophylla(chl a) concentration in the surface meter of thewater column during the ice-free season(Fig. 2)was significantly higher in Richie(3.22 nmolyl)than in Sargent Lake(1.88 nmolyl, P-0.01, t-test, ts2.64, d.f.s8). Zeaxanthin pigment(indic-ative of blue-green algae) was significantly higherin Lake Richie(0.51 nmolyl) than Sargent Lake(0.17 nmolyl) during this same time(P-0.01, t-test, ts3.23, d.f.s8). A very predominate peakin bacteriochlorophyll d (60.27 nmolyl) wasobserved in Lake Richie at 8 m in August in 1998and 1999, suggesting an abundant population ofphototrophic green sulfur bacteria and an activesulfur cycle in the hypolimnion. Tributariesshowed little abundance or diversity of pigments.Comparing percentages of algal abundance cal-
culated from pigment concentrations, one can dis-tinguish differences between lakes(Fig. 4). Sinceour study did not take algal counts, we adoptedthe approach by Wilhelm et al.(1991), whocompared target carotenoid concentrations to over-

333P.R. Gorski et al. / The Science of the Total Environment 304 (2003) 327–348
Fig. 3. MeHg concentrations in open water particulate matter calculated by subtracting filtered from unfiltered MeHg concentrationsand dividing by SPM. TheK values express partitioning of MeHg between the particulate and dissolved phases.d
all chl a concentration(on amgyl basis) with theequation:
w x w x w xchl a s8.6 zeaxanthinq6.7 luteinw x w xq1.2 fucoxanthinq2.5 alloxanthin
Each carotenoid is unique to various organisms(zeaxanthinscyanobacteria, luteinsgreen algae,fucoxanthinschrysophytes and diatoms, alloxan-thinscryptophytes). During the ice-free seasonover the 2 years, the average epilimnetic algaecomposition for Sargent was 33% chrysophytesandyor diatoms, 2.5% cryptophytes, 30% greensand 35% blue-greens(cyanobacteria). The epilim-netic algae of Lake Richie were composed of 26%chrysophytes andyor diatoms, 3% cryptophytes,15% greens and 56% blue-greens.
3.3. Zooplankton
Individual zooplankton from Sargent Lake weregenerally higher in concentrations of both Hg andT
MeHg (Table 1). Zooplankton species in Sargentranged from 192 to 276 ngyg dw of Hg , asT
compared to 44–182 ngyg dw in Lake Richie.The proportion of Hg as MeHg ranged betweenT
31 and 72%. In June, MeHg concentrations in
Sargent zooplankton were at least 2 times higherthan in each respective species in Richie. Theexception wasCeriodaphnia in Lake Richie, whichcontained approximately 10 ngyg more MeHg thanSargent LakeCeriodaphnia. In August, MeHglevels in SargentBosmina were approximately 15ngyg higher than their Richie counterparts. SargentLake cyclopoids, the only group sampled twice,decreased in MeHg from 175 to 38 ngyg dw fromJune to February. Averaging all individuals by lakefor 1998, Sargent Lake zooplankton had more thandouble the Hg and MeHg concentrations ofT
Richie, while MeHg represented approximately40% of Hg in both lakes.T
Bulk zooplankton, in general, had Hg concen-trations similar to individual zooplankton, but thestandard error was generally lower for bulk sam-ples (Table 2). Percent Hg as MeHg(;30%)T
and species composition of zooplankton were sim-ilar between lakes(Table 3).June 1998 samples were analyzed both as bulk
zooplankton and individually(Tables 1 and 2).For Sargent, concentrations in bulk samples werelower than average individual measurements forHg (by;66 ngyg dw) and MeHg(by;61 ngyT
g dw). For Richie, the bulk samples were 72 ngy

334 P.R. Gorski et al. / The Science of the Total Environment 304 (2003) 327–348
Fig. 4. Percentages of algal groups that are present in the epilimnion of each lake. Calculated from pigment concentrations andcorrected for differences in varying levels of carotenoids among cells.
g higher than individuals for Hg and 13 ngyg dwT
higher for MeHg. The proportion of cyclopoidswas slightly higher in Sargent Lake, whereas LakeRichie had slightly more calanoids(Table 3).When individual and bulk data were combined
for both years and compared between lakes, Sar-gent zooplankton contained significantly higherHg concentrations(P-0.05,t-test,ts2.40, d.f.sT
13). The two lakes had statistically similar MeHgconcentrations(P)0.05, t-test,ts1.33, d.f.s15),although Sargent Lake zooplankton averaged 74ngyg dw MeHg while Richie zooplankton aver-aged 49 ngyg dw MeHg.
3.4. Littoral invertebrates
Samples were identified to order or genus(Table4). We note that grouping of aquatic insects at theorder level was sufficient to resolve differences inHg concentrations in invertebrates from hydroelec-tric reservoirs versus natural lakes(Tremblay etal., 1996; Tremblay and Lucotte 1997).Averaging all groups of aquatic invertebrates
(not including mussels and incidentals) for eachlake and over the 2 years, the Hg concentrationT
in all Sargent Lake insects combined was 85.1ngyg dw (S.E.s12.23,ns11) and all Lake Richieinsects were 62.1 ngyg dw (S.E.s6.37, ns14).The MeHg concentration in all Sargent insects was31.4 ngyg dw (S.E.s5.05, ns18) and in Richiewas 26.2 ngyg dw (S.E.s3.98,ns18). Althoughaverage values for Sargent were higher thanRichie, the data sets(Sargent both years vs. Richieboth years) were not significant between lakes foroverall Hg (Ps0.05, t-test, ts1.72, d.f.s22) orT
MeHg concentrations(P)0.05, t-test, ts0.79,d.f.s33).The average Hg concentration of each inverte-
brate taxon over the 2 years(Fig. 5) showedsignificant differences between taxa for Hg con-T
centration(P-0.05, ANOVA, Fs3.51, d.f.s21)and MeHg concentration(P-0.01, ANOVA, Fs8.21, d.f.s32). The two main differences werethat caddisflies, in general, had significantly lowerHg than other insects(P-0.01, t-test,tsy4.86,T
d.f.s18) and dragonflies, in general, had signifi-cantly higher MeHg than other insects(P-0.01,t-test, ts7.32, d.f.s31). While dragonflies hadthe highest MeHg concentration(Table 5), theyalso contained the highest percent Hg as MeHgT

335P.R. Gorski et al. / The Science of the Total Environment 304 (2003) 327–348
Table 1Average Hg concentrations for various individual zooplankton taxa
Date Lake Zooplankton HgT Standard MeHg Standard Hg as MeHgT
(ngyg dw) error (ngyg dw) error (%)
June-98 SAR Cyclopoid 192.3 87.9(ns3) 139.2 – 72.4June-98 SAR Daphnia g. m. 222.8 35.9(ns4) 108.9 10.8(ns3) 48.9June-98 SAR Ceriodaphnia 275.8 43.1(ns5) 30.0 – 10.9June-98 SAR Calanoid 263.5 47.2(ns5) 175.1 – 66.5June-98 RICH Cyclopoid 181.8 – 79.4 – 43.7June-98 RICH Daphnia g. m. 102.6 – 31.4 – 30.6June-98 RICH Ceriodaphnia 68.3 7.27(ns2) 41.0 – 60.0June-98 RICH Calanoid 44.6 17.8(ns4) 27.7 – 62.1June-98 RICH Bosmina 132.9 – ND – –
Aug-98 SAR Bosmina ND – 54.5 – –Aug-98 RICH Bosmina ND – 40.2 1.6(ns3) –
Feb-99 SAR Cyclopoid ND – 38.3 5.1(ns3) –Feb-99 RICH Cyclopoid ND – ND – –
SAR, Sargent Lake; RICH, Lake Richie;Daphnia g. m., Daphnia galeata mendotae; ND, Non-detectable(i.e. below detectionlimit).
Table 2Average Hg concentrations in bulk zooplankton obtained using a syringe processing method for samples
Date Lake HgT Standard MeHg Standard Hg as MeHgT
(ngyg dw) error (ngyg dw) error (%)
June-98 SAR 172.2 8.3(ns3) 52.7 1.0(ns3) 30.6June-98 RICH 178.0 – 32.2 0.4(ns3) 18.1
May-99 SAR 154.2 6.1(ns3) 47.8 5.8(ns3) 31.0May-99 RICH 150.7 9.8(ns3) 53.6 8.5(ns3) 35.6
July-99 SAR 307.0 35.7(ns3) 64.4 1.1(ns3) 21.0July-99 RICH 208.5 7.9(ns3) 59.6 2.9(ns3) 28.6
Aug-99 SAR 161.3 20.3(ns6) 34.6 2.3(ns2) 21.5Aug-99 RICH 256.9 7.1(ns2) 75.1 0.1(ns3) 29.2
Table 3Relative abundances(percent of total count) of different zooplankton in syringe-processed samples
Date Lake Cyclopoid Calanoid Ceriodaphnia Bosmina Daphnia g.m. Total
June-98 SAR 24 11 7 53 6 100June-98 RICH 19 22 3 52 4 100
May-99 SAR 82 6 2 9 0 100May-99 RICH 61 6 0 33 0 100
July-99 SAR 12 1 1 87 0 100July-99 RICH 4 0 1 95 0 100
Aug-99 SAR 34 10 9 47 0 100Aug-99 RICH 28 4 18 50 0 100

336 P.R. Gorski et al. / The Science of the Total Environment 304 (2003) 327–348
Table 4Average Hg concentrations in various immature aquatic insects and mussels
Date Lake Insect HgT Standard MeHg Standard Hg as MeHgT
(ngyg dw) error (ngyg dw) error (%)
June-98 SAR Caddisfly 78.1 – 40.0 – 51.2June-98 SAR Dragonfly 144.1 – 53.2 – 36.9June-98 SAR Heptageniid 143.9 – 24.1 – 16.8June-98 SAR Hexagenia 96.0 10.10(ns3) 14.4 – 15.0June-98 RICH Caddisfly 62.4 – 22.4 – 35.9June-98 RICH Dragonfly 69.4 – 48.7 – 70.2June-98 RICH Heptageniid 58.1 – 14.4 – 24.8June-98 RICH Hexagenia 90.5 – 16.4 – 18.1
Aug-98 SAR Caddisfly – – 42.8 – –Aug-98 SAR Dragonfly 100.6 – 44.8 2.53(ns3) 44.5Aug-98 SAR Heptageniid 79.9 – 24.6 – 30.7Aug-98 RICH Dragonfly 91.5 0.89(ns3) 41.6 6.95(ns3) 45.5Aug-98 RICH Heptageniid 88.6 – 8.5 – 9.6
May-99 SAR Caddisfly – – 1.3 – –May-99 SAR Dragonfly – – 41.5 – –May-99 SAR Hexagenia 118.6 – 10.7 0.14(ns3) 9.0May-99 RICH Caddisfly 43.5 – 20.4 – 46.9May-99 RICH Dragonfly 63.6 5.19(ns3) 46.4 – 72.9May-99 RICH Damselfly 44.5 – 20.5 – 46.1May-99 RICH Hexagenia 61.7 – 7.8 0.66(ns3) 12.6
July-99 SAR Caddisfly 32.5 – 11.9 – 36.6July-99 SAR Dragonfly 73.0 – 60.8 2.73(ns3) 83.3July-99 SAR Gyrinid 149.4 – 20.4 – 13.6July-99 SAR Hexagenia – – 20.0 – –July-99 SAR Mussel 34.2 – 7.9 – 23.1July-99 RICH Caddisfly 26.5 – 11.0 – 41.5July-99 RICH Dragonfly – – 53.1 0.37(ns3) –July-99 RICH Heptageniid – – 20.4 – –July-99 RICH Mussel 45.0 – 10.9 – 24.2
Aug-99 SAR Caddisfly 35.3 – 30.6 – 86.7Aug-99 SAR Dragonfly – – 85.9 – –Aug-99 SAR Heptageniid – – 33.3 – –Aug-99 SAR Hexagenia – – 16.9 6.97(ns2) –Aug-99 SAR Ranatra – – 381.9 – –Aug-99 RICH Caddisfly 19.4 1.71(ns3) 10.1 – 52.1Aug-99 RICH Dragonfly 87.3 – 52.6 – 60.2Aug-99 RICH Heptageniid – – 42.0 – –Aug-99 RICH Hexagenia – – 18.6 4.62(ns3) –
Heptageniid is a family andHexagenia is a genus of mayflies(Order: Ephemeroptera).
(54–62%). Caddisflies had the lowest Hg andT
low MeHg concentrations, but 42–52% of theirHg was MeHg. In the two types of mayflies,T
Hg concentrations were similar to dragonflies,T
but the percent Hg as MeHg was lower(-30%).T
In Mussels(Family Unionidae), Hg concentra-
tions were similar between the lakes. An incidentalpredacious adult water scorpion(Ranatra in Sar-gent) had the highest MeHg concentration(381.9ngyg dw). Another incidental, some adult whirly-gig beetles(Gyrinid in Sargent), had relativelyhigh Hg , but average MeHg.T

337P.R. Gorski et al. / The Science of the Total Environment 304 (2003) 327–348
Fig. 5. Average Hg concentration in insects for 1998–1999.Error barss"1 S.E.
3.5. Fishes
All age-1 year yellow perch collected werebetween 31 and 40 mm in length for both lakes.Although age-1 yellow perch had higher meanHg concentrations in Sargent compared to Richie,T
differences were not significant(P)0.05, t-test,ts1.52, d.f.s21, Fig. 6).Adult fishes covering a range of lengths and
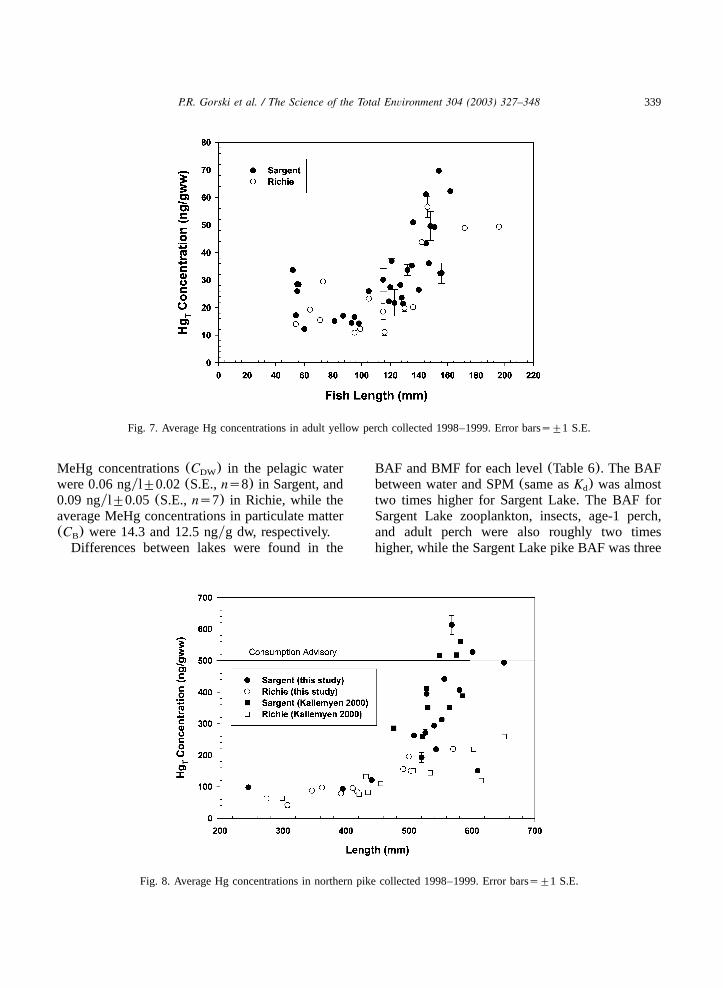
ages were collected. The adult yellow perch(Fig.7) had statistically similar lengths between the twolakes (P)0.05, Wilcoxon,Zs0.25, ns48), andfish that were aged were between 2 and 4 years(many perch were not aged). Mercury concentra-tions were obtained for northern pike representinga range of lengths(Sargent: 245–651 mm, Richie:274–651). The pike were between 1 and 7 yearsold. Five Sargent Lake pike(5 and 6 years old)were above the advisory limit for Hg()500 ngyT
g ww), but no Richie pike were above the limit(Fig. 8). Since Hg concentrations seemed toT
diverge at approximately 500 mm and both lakeshad several data points in this range, pike-500mm were statistically compared. Lengths(P)0.05, t-test, tsy0.11, d.f.s28) and ages(P)0.05, Wilcoxon,Zsy1.10) were similar, but pikein Sargent Lake had significantly higher HgTconcentrations(P-0.01, t-test,ts3.69).Polynomial regressions were obtained for com-
plete perch and pike data sets of transformed HgT
concentrations and total length(Figs. 9 and 10)following Tremblay et al.(1998). Standard lengthsof 120 and 160 mm were used for yellow perchto calculate concentrations for both Sargent(25.0and 57.5 ngyg ww, respectively) and Richie(22.3and 36.6 ngyg ww, respectively). The concentra-tion at 160 mm is approximately 21 ngyg wwhigher in the Sargent Lake perch compared toRichie Lake perch. Also, the increase in HgT
concentration in Sargent Lake perch from 120 to160 mm in length is more than double(130%).The increase in Hg concentration in Lake RichieT
perch is much less(64%) between the same sizes.A ‘standard pike’ of length 550-mm was calculatedto contain 343.8 ngyg ww in Sargent and 156.6
ngyg ww in Richie. At this size, pike in SargentLake have over twice the Hg concentration thanpike in Lake Richie.An ANCOVA analysis(SAS version 8.2, SAS
Institute Inc.) was used to compare adult perchbetween lakes for square root Hg concentrationT
and length and did not reveal significant differenc-es between the slopes of each lake’s concentra-tion–length relationship (P)0.05, ANCOVA,Fs1.13, d.f.s46). Length alone was a significantpredictor for Hg concentration(P-0.01, FsT
42.60), but perch in the two lakes had similarHg concentrations(Ps0.05,Fs4.09).T
The log Hg concentration versus length regres-T
sions for pike also gave statistically similar slopesbetween lakes(P)0.05, ANCOVA, Fs0.07,d.f.s26). Length was again a significant predictorfor Hg concentration(P-0.01, Fs45.22). But,T
unlike the perch, the pike had significantly higherHg concentrations in Sargent Lake(P-0.05,FsT
7.64).
3.6. Bioaccumulation and biomagnification factors
The bioaccumulation factor(BAF), or oftenreferred to as the bioconcentration factor(BCF),

338 P.R. Gorski et al. / The Science of the Total Environment 304 (2003) 327–348
Table 5Average Hg concentrations in immature aquatic insects for 1998–1999
Lake Insect HgT Standard MeHg Standard Hg as MeHgT
(ngyg dw) error (ngyg dw) error (%)
SAR Caddisfly 48.6 14.75(ns3) 25.3 8.08(ns5) 52.1SAR Dragonfly 105.9 20.69(ns3) 57.2 7.91(ns5) 54.1SAR Heptageniid 111.9 32.00(ns2) 27.3 2.99(ns3) 24.4SAR Hexagenia 107.3 11.30(ns2) 15.5 1.97(ns4) 14.4
RICH Caddisfly 37.9 9.59(ns4) 16.0 3.16(ns4) 42.1RICH Dragonfly 77.9 6.77(ns4) 48.5 2.12(ns5) 62.2RICH Heptageniid 73.3 15.25(ns2) 21.3 7.31(ns4) 29.1RICH Hexagenia 76.1 14.40(ns2) 14.3 3.29(ns3) 18.7
Fig. 6. Average Hg concentrations in age-1 perch collected during July 1999. Error barss"1 S.E.
was calculated as(Gobas and McCorquodale,1992):
BAFsC yC (lykg)B DW
where C sconcentration in biota or particle inB
(ngykg). C sconcentration dissolved in waterDW
(ngyl).The term BAF was used instead of BCF because
the samples were filtered at 0.45mm and therestill may be a significant portion of MeHg boundto colloids (Babiarz et al., 2001) within this‘filtered’ fraction and not truly dissolved.
Biomagnification factors(BMF) was calculatedas(Herrin et al., 1998):
BMFsC yC (unitless)Predator Prey
where C sconcentration in predator(ngygPredator
dry weight). C sconcentration in prey(ngygPrey
dry weight).Wet weight to dry weight conversions for fishes
were approximated according to Hanson et al.(1997). Pike(550 mm) and adult perch(160 mm)were assumed to be 75% water and age-1 perch88% water. For 1998–1999, average filterable
339P.R. Gorski et al. / The Science of the Total Environment 304 (2003) 327–348
Fig. 7. Average Hg concentrations in adult yellow perch collected 1998–1999. Error barss"1 S.E.
Fig. 8. Average Hg concentrations in northern pike collected 1998–1999. Error barss"1 S.E.
MeHg concentrations(C ) in the pelagic waterDW
were 0.06 ngyl"0.02(S.E.,ns8) in Sargent, and0.09 ngyl"0.05 (S.E.,ns7) in Richie, while theaverage MeHg concentrations in particulate matter(C ) were 14.3 and 12.5 ngyg dw, respectively.B
Differences between lakes were found in the
BAF and BMF for each level(Table 6). The BAFbetween water and SPM(same asK ) was almostd
two times higher for Sargent Lake. The BAF forSargent Lake zooplankton, insects, age-1 perch,and adult perch were also roughly two timeshigher, while the Sargent Lake pike BAF was three

340 P.R. Gorski et al. / The Science of the Total Environment 304 (2003) 327–348
Fig. 9. Regression of square root transformed Hg concentrations versus length in adult yellow perch.
Fig. 10. Regression of log transformed Hg concentrations versus length in northern pike.

341P.R. Gorski et al. / The Science of the Total Environment 304 (2003) 327–348
Table 6BAF and BMF calculated for this study
Particles Zooplankton Insects Age-1 perch Adult perch Pike
BAFs (lykg)SAR 2.4=105 1.2=106 5.2=105 3.1=106 3.8=106 2.3=107
RICH 1.4=105 5.4=105 2.9=105 1.9=106 1.6=106 7.4=106
BMFsSAR – 5.2 2.2 2.5 7.3 6.0RICH – 3.9 2.1 3.4 5.6 4.5
For BMFs, insects were compared to particles, age-1 perch to zooplankton, adult perch to insects, and pike to adult perch.
Fig. 11. Food web plot from nitrogen and carbon stable isotope analysis. Error barss"1 S.D.
times higher. The BMFs were also higher forSargent Lake at each successive trophic level,except the age-1 year perch. However, these dif-ferences are small considering the ranges in con-centrations about the mean values used to calculateBAFs and BMFs.
3.7. Food web
The food webs of Lake Richie and Sargent Lakewere similar, although some differences exist inthe isotopic signatures of some groups(Fig. 11).Perch d C was significantly different between13
lakes (P-0.01, t-test, ts4.17, d.f.s10), withLake Richie perch being more enriched in C13
than Sargent Lake perch. The relative large error
associated with the perchd C data(ns6 fish for13
each lake) was due to steadily decreasingd C13
with increasing size(52–196 mm). The pike inLake Richie were also significantly higher ind C13
compared to pike in Sargent Lake(P-0.01,t-test,ts5.19, d.f.s23).The d N for perch and pike was statistically15
similar between lakes within each trophic level(perch: P)0.05, t-test, ts0.71, d.f.s10, pike:P)0.05, t-test,ts1.50, d.f.s23).All other organisms had similard N between15
lakes, except for zooplankton. Sargent Lake zoo-plankton were higher ind N than Lake Richie15
zooplankton(P-0.01, t-test, d.f.s4).Trophic levels were calculated from the nitrogen
signatures for each different taxon analyzed and

342 P.R. Gorski et al. / The Science of the Total Environment 304 (2003) 327–348
Table 7Trophic levels for Sargent Lake and Lake Richie food webs calculated from nitrogen signatures
Sargent Richie
Averaged N15 Trophic level Averaged N15 Trophic level
Caddisfly 2.6 2.0 2.4 2.0Mussel 4.4 2.5 2.7 2.1Hexagenia 3.3 2.2 4.4 2.5Zooplankton 4.5 2.0 2.9 2.0Yellow Perch 8.5 3.7 8.3 3.7Northern Pike 10.3 4.3 10.0 4.2
show the similarity between lakes(Table 7). Pikeonly differed by 0.1 trophic level unit betweenlakes and perch were at 3.7 for both lakes. Thezooplankton trophic level was assumed to be level2, and not calculated using caddisfly as the base-line, since zooplankton were assumed to eat phy-toplankton rather than periphyton. Mussels mayalso feed on phytoplankton, since unionids arefilter feeders, but they may feed on particlesdifferent than zooplankton. Mussels and zooplank-ton probably do have different food sources basedupon the disparity between their carbon signatures(Fig. 11).
4. Discussion
4.1. Water
The Hg concentrations in surface waters ofT
Sargent and Richie(0.7–2.7 ngyl) are not unusual,only slightly higher than in Lake Superior water(0.3–0.7 ngyl, Rolfhus et al., unpublished data)and similar to other small inland lakes in northernMN (Monson and Brezonik, 1998) and WI(Babiarz and Andren, 1995). The levels of MeHgare also similar to MN and WI inland lakes. Theincrease in hypolimnetic MeHg in summer hasalso been demonstrated in Devils Lake, WI—alake with a consumption advisory on walleye—where the peak MeHg concentration reached 0.77ngyl in October(Herrin et al., 1998). Devils Lakehad a concentration of 0.26 ngyl by August(sim-ilar to Sargent, 0.26 ngyl; Richie was 0.34 ngyl).The hypolimnion is a possible source of MeHg foraccumulation in the food chain(Slotten et al.,1995; Herrin et al., 1998), but both lakes showed
hypolimnetic MeHg buildup and similar Hg con-centrations in the water column. These similaritiesindicate that differences in MeHg concentrationsin lake water are not the explanation for enhancedbioaccumulation in Sargent Lake. However, MeHgconcentrations vary both temporally and spatiallyand are not fully represented by mean concentra-tions. Furthermore, we do not have information onMeHg dynamics(methylation and demethylationrates) that could differ between lakes.Differences in ancillary water characteristics
(i.e. DOC, SPM, chla and zeaxanthin) may resultin differences in MeHg bioavailability for bioticuptake between the two lakes. Within the DOCfraction of each lake, we do not know the qualityof DOC or its percent colloidal DOC. Sincefilterable MeHg often preferentially binds to col-loidal DOC (Babiarz et al., 2001), the bioavaila-bility of filterable MeHg may be reduced in LakeRichie if there are more colloids. Quality of algaeis also important for edibility by zooplankton.Blue-green algae often have inhibitory and toxiceffects(Lampert, 1981). The algae in Lake Richiewere mostly blue-greens, which are less edible andtherefore less available for grazing by zooplanktonthan the greens and crysophytes that were domi-nant in Sargent Lake.The bioavailability of MeHg in the hypolimnion
of Lake Richie may also be reduced by microbialactivity. An interesting phenomenon observed inLake Richie, but not in Sargent Lake, was abun-dant phototropic sulfur bacteria evidenced by thepresence of bacteriochlorophylld. Phototrophicsulfur bacteria oxidize sulfide to elemental sulfuror sulfate(Parkin and Brock, 1981) and have beenshown to be associated with hypolimnetic layers

343P.R. Gorski et al. / The Science of the Total Environment 304 (2003) 327–348
that have high MeHg concentrations(Watras etal., 1994). This bacteria population could poten-tially block the transport of MeHg to the epilim-nion and further bioaccumulation.Although MeHg in tributaries could be a source
of MeHg for organisms within the lakes(Hurleyet al., 1995; Babiarz et al., 1998), both lakes hada similar number of tributaries with similar MeHgconcentrations. Furthermore, stream flow was low.From a mass-balance standpoint, tributaries areprobably unimportant for MeHg transport to theselakes.
4.2. Zooplankton
Mercury concentrations in zooplankton(30–300ngyg) were similar to those reported from otherstudies. For example, the ranges of MeHg incopepods from WI lakes ranged from 22–60 ngyg (Back and Watras, 1995) to 250 ngyg (Watrasand Bloom, 1992).Methylmercury concentrations in bulk zooplank-
ton samples were not consistently higher in SargentLake. However, the sieving process used for col-lecting bulk zooplankton samples also sometimesretained phytoplankton, which contain lower con-centrations of MeHg. This variable dilution mayexplain why, in the June 1998 bulk sample fromSargent Lake, the MeHg concentration was lowerthan in comparable individual zooplankton.Data from individual zooplankton samples sug-
gest bioaccumulation of MeHg in Sargent Lakemay be enhanced due to better food quality(higherconsumptive uptake) and higher bioavailability offilterable MeHg (higher bioconcentration fromwater). The higher abundance of blue-green algaein Lake Richie reduces food quality and mayreduce consumptive uptake of MeHg. Higher DOCconcentrations in Lake Richie may lead to morebound MeHg to DOC and reduced bioavailability.
4.3. Insects
Concentrations of Hg in insects are similar tothose found in other studies,(Tremblay and Lucot-te, 1997; Wong et al., 1997). Although Hg andT
MeHg concentrations were higher in Sargent Lakeinsects, the differences were not significant. The
main differences were between insect taxa asopposed to between lakes, possibly due to feedinghabits.It has been proposed that insects(at leastHex-
agenia) accumulate Hg mainly through ingestion(Saouter et al., 1991; Odin et al., 1994). Similarly,our data indicate that bioaccumulation of Hg ishigher in predacious organisms like dragonflies,which had the highest concentrations of Hg andT
MeHg and the highest percent Hg as MeHg. TheT
non-predacious caddisflies, and the two types ofmayflies had lower, but similar, MeHg concentra-tions. In mayflies, Hg concentrations are doubleT
their MeHg concentrations, possibly reflectingtheir feeding habits or habitat preference. Feedingdifferences are suggested by the lowerd C in13
Hexagenia than caddisflies(Fig. 11). Unfortunate-ly, stable isotopes were not measured indragonflies.
4.4. Fishes
Mercury concentrations in adult perch are simi-lar to those found in other small fish from otherlakes. Our average Hg concentrations in both age-T
1 perch and adult perch were lower than found byWiener et al.(1990) in age-1 yellow perch(114and 135 ngyg) in two different basins of LittleRock Lake, WI. Bodaly et al.(1993) found age-1yellow perch(70–81 mm fork length) to containapproximately 80 ngyg (range: 40–140 ngyg). InDevils Lake, WI, age-1 mimic shiners averaged118 ngyg in Hg and 38 mm in length(Gorski etT
al., 1999). Finescale dace of unreported age andsize collected in the Experimental Lake Area ofCanada contained approximately 117 ngyg ofHg (Hall et al., 1997). All of these ambientT
concentrations were lower than shiners(93–99mm) collected from a contaminated stream in OakRidge, TN, where the fish averaged 1400 ngygHg (Hill et al., 1996). These data indicate thatT
Isle Royale is not a ‘highly contaminated’ sitewith respect to small fish, but does possess enoughHg for bioaccumulation to levels necessitatingconsumption advisories for larger fishes.Differences between perch populations in the
two lakes were observed when larger sizes of adultperch were compared. Our comparison of 120 and

344 P.R. Gorski et al. / The Science of the Total Environment 304 (2003) 327–348
160 mm perch shows that at the middle of oursize range(120 mm) Hg concentrations appearT
similar, but after 40 mm of growth perch have arelative gain of 66% more mercury in SargentLake than in Lake Richie. This increase in Hgaccumulation in the larger perch is likely trans-ferred up the food chain to northern pike.The northern pike sampled from Sargent Lake
in this study have similar, but lower, Hg concen-trations than reported by Kallemeyn(2000). Fromregression estimates for 550 mm length pike thevalues are 344 ngyg ww (this study) compared to433 ngyg ww (Kallemeyn, 2000). Conversely,Lake Richie pike in this study had slightly higherHg concentrations(166 ngyg ww) than found byKallemeyn(2000), 153 ngyg ww). The differencesbetween the two studies may reflect the range offish lengths sampled. Our comparison of pike)500 mm highlights the importance of the largefish in both systems. Pike of the same age andlength contain higher Hg concentrations in Sar-T
gent Lake pike. This may be due to process-levelfactors that we did not measure or model.Concentrations of Hg in yellow perch are strong
correlates of fish growth patterns(Greenfield etal., 2001). Although growth rates for Isle Royalefishes were not modeled, Kallemeyn(2000) con-sidered pike growth rates in Isle Royale lakes tobe slow to moderate, slowing increasingly afterage 4. Back-calculated length at age values wassimilar in Sargent and Richie(Kallemeyn 2000).However, our data show that pike of similar agesin the two lakes have different levels of Hg. Thisobservation is consistent with a lower growthefficiency of large pike in Sargent Lake, but wedo not have any estimates of growth efficiency forpike in the two lakes.
4.5. Bioaccumulation and biomagnification factors
The field BAFs and BMFs calculated from ourdata are similar to others. The MeHg BAF fortransfer from water to particles(K ) falls withind
the range(10 –10) of those reported by Babiarz4 6
et al.(1998). The BAFs for zooplankton measuredby Monson and Brezonik(1998) (10 –10 )4.90 5.43
and the BCFs calculated by Back and Watras(1995) for zooplankton(10 –10 ) overlap with3.5 6.75
our BAFs for Sargent(10 ) and Richie zooplank-6
ton (10 ). Our concentrations of Hg(mostly5
MeHg) in fishes show a typical increase of 10 –6
10 (BAFs) above average concentrations of7
MeHg in the water.The BMF between zooplankton and particles
(11–19) and a BMF between shiners and zoo-plankton (2.6–2.9) reported by Herrin et al.(1998) are higher than our zooplankton to particlevalues of 3.9 (Richie) and 5.2 (Sargent), butsimilar to our age-1 perch to zooplankton values(Sargents2.5, Richies3.4). Our BMFs also fallwithin the range of those calculated for zooplank-ton (0.3–10) by Back and Watras(1995). BMFbetween piscivores and their prey were betweenapproximately 4 and 9 in other freshwater lakes(MacCrimmon et al., 1983; Cope et al., 1990; Kimand Burggraaf, 1999).The BAFs and BMFs suggest differences
between Sargent Lake and Lake Richie; the BAFsare consistently higher in Sargent Lake and theBMFs for zooplankton, adult perch, and pike arealso higher in Sargent Lake. Slightly higher bioac-cumulation in Sargent Lake and biomagnificationin zooplankton may translate to higher MeHglevels in large perch and pike. However, withoutinformation on temporal variability and dynamicsthe importance of these differences in mean valuesremains uncertain.
4.6. Food web
Stable isotope measurements, especiallyd C13
andd N, provide information on food web struc-15
ture (Peterson and Fry, 1987). Carbon ratios ofconsumers tend to resemble that of their food,with perhaps 1–2‰ enrichment in C from prey13
to consumer(DeNiro and Epstein, 1978; Fry andSherr, 1984). In contrast, there is approximately3.4‰ enrichment in N per trophic level because15
of preferential excretion of the lighter N isotope(DeNiro and Epstein, 1981; Minangawa and Wada,1984; Hobson and Welch, 1995; Cabana and Ras-mussen, 1994). As a result, when the nitrogenversus carbon ratios of food web biota are plotted,consumers and their food tend to lie along a linewith a slope of approximately 3.4:1. Dual-isotopeplots therefore demonstrate the pathways of carbon

345P.R. Gorski et al. / The Science of the Total Environment 304 (2003) 327–348
transfer through food webs to higher consumersand have been used extensively in food webanalyses(e.g. Peterson and Howarth, 1987; Sulli-van and Moncreiff, 1990; Fry, 1991; Keough etal., 1996). Furthermore, the trophic position ofmembers in an aquatic food web can be calculatedfrom nitrogen stable isotope ratios(Vander Zandenet al., 1997). Trophic structure can also influenceHg accumulation. For example, analysis ofd N15
from members of the food web has been shown tocorrelate to trophic level increases in Hg(Cabanaet al., 1994).Our analysis shows similarity between food
webs with respect to nitrogen isotope signature,indicative of similarity between lakes in food weblength: thed N is statistically the same between15
lakes for pike and perch and calculated trophiclevels are similar for pike(4.2–4.3) and perch(3.7). Nitrogen isotope signatures for pike that areabove advisory limits are similar to those belowadvisory limits, indicating that they are feeding atthe same trophic level. In both lakes, pike are thetop consumers and are one half trophic level aboveperch. This also illustrates that the pike are omniv-orous, feeding on more than perch. Otherwise pikewould be one full level, or approximately 3.4 ‰,above the perch. The pike may also feed on anytrophic level 3 organism that would be betweenperch and primary consumers(i.e. caddisflies orzooplankton), which would include shiners andother forage fishes not analyzed in this study.Adult perch could also feed on prey fishes.The values also suggest that the Sargent zoo-
plankton are slightly enriched ind N. Since cope-15
pods are often carnivorous(Dodson, 1984), thehigher proportion of copepods in the July Sargentsample (Table 3) may account for the slightlyhigherd N in Sargent Lake.15
Carbon isotope ratios can be used to determinebenthic or pelagic origins of food webs(France,1995). Even though lower trophic levels havesimilar d C in the two lakes, Lake Richie pike13
and perch are significantly higher ind C, sug-13
gesting that they have a more benthic signature—that their food sources have a benthic origin—ascompared with the more negative, more pelagic,value of d C in Sargent Lake pike and perch.13
Campbell et al.(2000) showed through the use of
d C analysis that organochlorines bioaccumulate13
to a higher degree in pelagic food webs than inbenthic food webs. This apparent difference infood webs may contribute to the enhanced bioac-cumulation of Hg in Sargent Lake.
5. Conclusion
The two Isle Royale lakes exhibited significantlydifferent Hg concentrations in northern pike.T
Although relatively small(the difference is notorders of magnitude), this difference is importantbecause some pike in Sargent Lake exceeded thefish consumption advisory level.Factors accounting for the higher concentrations
in large pike from Sargent Lake are uncertain butmay include a combination of the following: High-er bioavailability and bioaccumulation of filterableHg in Sargent Lake due to lower DOC levels;higher bioaccumulation and biomagnification byzooplankton in Sargent Lake, and higher biomag-nification and concentrations in adult perch. Thesedifferences, although relatively small, may trans-late to higher bioaccumulation and Hg concentra-T
tions in lager pike in Sargent Lake. However, thesefactors do not explain the similarity in smalleryellow perch and pike. Other factors such asdifferences in growth efficiency and food webstructure(which change with age) may be impor-tant. As evident by stable isotope data, the pikefood web may be more pelagic in Sargent Lake(more benthic in Lake Richie).In many ways, the two lakes are more similar
than different. In view of the difficulties in sam-pling these remote lakes(requiring backpacking)and the complexities of our sampling requirements,our data set is comprehensive. Yet, additional datamay be needed to confirm the causes of differencesin mercury concentration in large pike. The expla-nations may lie in subtle differences in mercurydynamics and food web structure, especially at thelarge perch and pike level.Isle Royale contains many lakes. At this stage,
we are unable to identify lakes where mercuryconcentrations will exceed consumption advisorieswithout direct measurement of mercury concentra-tions in fish. Predictive ability may eventuallyevolve from information on mercury methylation,

346 P.R. Gorski et al. / The Science of the Total Environment 304 (2003) 327–348
dynamics, bioavailability, food web structure, andbioenergetics. We note that the highest mercurylevel reported in fish from Isle Royale(Kallemeyn,2000) was not in pike, but in perch()1000 ngyg) from Lake Harvey—where there are no pike—showing that high mercury levels are not restrictedto large pike.
Acknowledgments
Funding was provided in part from the USNational Park Service(�ISRO-N-071.002) andCanon USA, Inc. J. Oelfke gave valuable logisticalsupport and suggestions. M. Romanski and A.Egan lent essential field assistance. S. Byler wasan integral field assistant and Hg lab analyst ininitial phases of this project. H. Sakamoto alsoanalyzed many of the Hg samples. R. Back, S.Hoffmann, M. Cleckner, R. Derrig-Green, D.DeMaster, J. Monahan, R. Wilkerson, A. Droppo,E. Volkman and V. Olinick volunteered in fieldsampling. L. Kallemeyn gave data, helpful advice,and collected a sub-set of perch and pike. M.Hyslop was our GIS contact for this project. P.Rasmussen lent statistical advice. This manuscriptwas greatly enhanced by the comments of a anon-ymous reviewer.
References
Babiarz CL, Andren AW. Total concentrations of mercury inWisconsin(USA) lakes and rivers. Water, Air, Soil Pollut1995;83:173–183.
Babiarz CL, Hurley JP, Benoit JM, Shafer MM, Andren AW,Webb DA. Seasonal influences on partitioning and transportof total and methylmercury in rivers from contrasting water-sheds. Biogeochemistry 1998;41:237–257.
Babiarz CL, Hurley JP, Hoffman SR, Andren AW, Shafer MM,Armstrong DE. Partitioning of total mercury and methyl-mercury to the colloidal phase in freshwater. Environ SciTechnol 2001;35:4773–4782.
Back RC, Watras CJ. Mercury in zooplankton of northernWisconsin lakes: taxonomic and site-specific trends. Water,Air, Soil Pollut 1995;80:931–938.
Back RC, Visman V, Watras CJ. Microhomogenization ofindividual zooplankton species improves mercury and meth-ylmercury determinations. Can J Fish Aquat Sci1995;52:2470–2475.
Balcer MD, Korda NL, Dodson SI. Zooplankton of the GreatLakes. Madison, WI, USA: The University of WisconsinPress, 1984. p. 174.
Becker GC. Fishes of Wisconsin. Madison, WI, USA: TheUniversity of Wisconsin Press, 1983. p. 1052.
Bloom NS. On the chemical form of mercury in edible fishand marine invertebrate tissue. Can J Fish Aquat Sci1992;49:1010–1017.
Bodaly RA, Rudd JWM, Fudge RJP, Kelly CA. Mercuryconcentrations in fish related to size of remote CanadianShield lakes. Can J Fish Aquat Sci 1993;50:980–987.
Cabana G, Rasmussen JB. Modeling food chain structure andcontaminant bioaccumulation using stable nitrogen isotopes.Nature 1994;372:255–257.
Cabana GA, Tremblay A, Kalff J, Rasmussen JB. Pelagic foodchain structure in Ontario lakes: a determinant of mercurylevels in lake trout(Salvelinus namaycush). Can J FishAquat Sci 1994;51:381–389.
Campbell LM, Schindler DW, Muir DCG, Donald DB, KiddKA. Organochlorine transfer in the food web of subalpineBow Lake, Banff National Park. Can J Fish Aquat Sci2000;57:1258–1269.
Cleckner LB, Garrison PJ, Hurley JP, Olson ML, KrabbenhoftDP. Trophic transfer of methyl mercury in the northernFlorida Everglades. Biogeochemistry 1998;40:347–361.
Cope WG, Wiener JG, Rada RG. Mercury accumulation inyellow perch in Wisconsin seepage lakes: relation to lakecharacteristics. Environ Toxicol Chem 1990;9:931–940.
DeNiro MJ, Epstein S. Influence of diet on the distribution ofcarbon isotopes in animals. Geochim Cosmochim Acta1978;42:495–506.
DeNiro MJ, Epstein S. Influence of diet on the distribution ofnitrogen isotopes in animals. Geochim Cosmochim Acta1981;45:341–351.
Dodson SI. Predation ofHetercope septentrionalis on twospecies ofDaphnia: morphological defenses and their cost.Ecology 1984;65:1249–1257.
France RL. Differentiation between littoral and pelagic foodwebs in lakes using stable carbon isotopes. Limnol Oceanogr1995;40:1310–1313.
Fry B. Stable isotope diagrams of freshwater food webs.Ecology 1991;72:2293–2297.
Fry B, Sherr EB.d C measurements as indicators of carbon13
flow in marine and freshwater ecosystems. Contrib Mar Sci1984;27:13–47.
Gill GA, Fitzgerald WF. Picomolar mercury measurements inseawater and other materials using stannous chloride reduc-tion and two-stage gold amalgamation with gas phasedetection. Mar Chem 1987;20:227–243.
Gobas F, McCorquodale J. Chemical dynamics in fresh waterecosystems. Boca Raton, FL, USA: Lewis Publishers, 1992.p. 129–151.
Gorski PR, Lathrop RC, Hill SD, Herrin RT. Temporal mercurydynamics and diet composition in the mimic shiner. TransAm Fish Soc 1999;128:701–712.
Greenfield BK, Hrabik TR, Harvey CJ, Carpenter SR. Predict-ing mercury levels in yellow perch: use of water chemistry,trophic ecology, and spatial traits. Can J Fish Aquat Sci2001;58:1419–1429.

347P.R. Gorski et al. / The Science of the Total Environment 304 (2003) 327–348
Hall BD, Bodaly RA, Fudge RJP, Rudd JWM, Rosenburg DM.Food as the dominant pathway of methylmercury uptake byfish. Water, Air, Soil Pollut 1997;100:13–24.
Hanson P, Johnson T, Schindler D, Kitchell J. Fish bioener-getics 3.0 for Windows. Madison, WI, USA: University ofWisconsin Sea Grant Institute, 1997.
Herrin RT, Lathrop RC, Gorski PR, Andren AW. Hypolimneticmethylmercury and its uptake by plankton during falldestratification: a key entry point of mercury into lake foodchains? Limnol Oceanogr 1998;43:1476–1486.
Hill WR, Stewart AJ, Napolitano GE. Mercury speciation andbioaccumulation in lotic primary producers and primaryconsumers. Can J Fish Aquat Sci 1996;53:812–819.
Hobson KA, Welch HE. Cannibalism and trophic structure ina high Arctic lake: insights from stable-isotope analysis.Can J Fish Aquat Sci 1995;52:1195–1201.
Horvat M, Liang L, Bloom NS. Comparison of distillationwith other current isolation methods for the determinationof methyl mercury compounds in low level environmentalsamples. Part II. Anal Chim Acta 1993;282:153–168.
Hudson RJM, Gherini SA, Watras CJ, Porcella DB. Modelingthe biogeochemical cycle of mercury in lakes: the mercurycycling model(MCM) and its application to the MTL studylakes. In: Watras CJ, Huckabee JW, editors. Mercury pol-lution integration and synthesis. Boca Raton, FL, USA:CRC Press, 1994. p. 153–180.
Hurley JP, Armstrong DE. Fluxes and transformations ofaquatic pigments in Lake Mendota, Wisconsin. LimnolOceanogr 1990;35:384–398.
Hurley JP, Benoit JM, Babiarz CL, Shafer MM, Andren AW,Sullivan JR, Hammond R, Webb DA. Influences of water-shed characteristics on mercury levels in Wisconsin rivers.Environ Sci Technol 1995;29:1867–1875.
Hurley JP, Cowell SE, Shafer MM, Hughes PE. Partitioningand transport of total and methyl mercury in the lower FoxRiver, Wisconsin. Eviron Sci Technol 1998;32:1424–1432.
Kallemeyn LW. A comparison of fish communities from 32inland lakes in Isle Royale National Park, 1929 and 1995–1997. Biological Science Report 0004. US Geological Sur-vey, Columbia Environmental Research Center, Columbia,Missouri; 2000, p.A65.
Keough JR, Sierszen ME, Hagley CA. Analysis of a LakeSuperior coastal food web with stable isotope techniques.Limnol Oceanogr 1996;41:136–143.
Kim JP, Burggraaf S. Mercury bioaccumulation in rainbowtrout (Oncorhynchus mykiss) and the trout food web inlakes Okareka, Okaro, Tarawera, Rotomahana and Rotorua,New Zealand. Water, Air, Soil Pollut 1999;115:535–546.
Lampert W. Inhibitory and toxic effects of blue-green algaeon Daphnia. Int Revue Ges Hydrobiol 1981;66:285–298.
Liang L, Bloom NS, Horvat M. Simultaneous determinationof mercury speciation in biological-materials by GCyCVAFSafter ethylation and room-temperature precollection. ClinChem 1994;40:602–607.
MacCrimmon HR, Wren CD, Gots BL. Mercury uptake bylake Trout,Salvelinus namaycush, relative to age, growth,and diet in Tadenac Lake with comparative data from other
Precambrian Shield lakes. Can J Fish Aquat Sci1983;40:114–120.
Merritt RW, Cummins KW. An introduction to the aquaticinsects. Dubuque, IA, USA: KendallyHunt Publishing Com-pany, 1984.
Michigan Department of Natural Resources(MI DNR). Fishcontaminant monitoring program: data for Siskiwit Lake,Isle Royale National Park. Isle Royale National Park files.1997.
Minangawa M, Wada E. Stepwise enrichment of N along15
food chains: further evidence and the relation betweend N15
and animal age. Geochim Cosmochim Acta 1984;48:1135–1140.
Monson BA, Brezonik PL. Seasonal patterns of mercuryspecies in water and plankton from softwater lakes inNortheastern Minnesota. Biogeochemistry 1998;40:147–162.
Odin M, Feurtet-Mazel A, Ribeyre F, Boudou A. Actions andinteractions of temperature, pH, and photoperiod on mercurybioaccumulation by nymphs of the burrowing mayflyHex-agenia rigida, from the sediment contamination source.Environ Toxicol Chem 1994;13:1291–1302.
Olson ML, Cleckner LB, Hurley JP, Krabbenhoft DP, HeelanTW. Resolution of matrix effects on analysis of total andmethyl mercury in aqueous samples from the Florida Ever-glades. Fresenius J Anal Chem 1997;358:392–396.
Parkin TB, Brock TD. The role of phototrophic bacteria in thesulfur cycle of a meromictic lake. Limnol Oceanogr1981;26:880–890.
Peterson BJ, Fry B. Stable isotopes in ecosystem studies. AnnRev Ecol Syst 1987;18:293–320.
Peterson BJ, Howarth RW. Sulfur, carbon, and nitrogen iso-topes used to trace organic matter flow in the salt-marshestuaries of Sapelo Island, Georgia. Limnol Oceanogr1987;32:1195–1213.
Pinckney JL, Millie DF, Howe KE, Paerl HW, Hurley JP. Flowscintillation counting of C-labeled microalgal photosyn-14
thetic pigments. J Plankton Res 1996;18:1867–1880.Saouter E, Ribeyre F, Boudou A, Maurybrachet R.Hexagenia
rigida (Ephemeroptera) as a biological model in ecotoxi-cology: experimental studies on mercury transfers fromsediment. Environ Pollut 1991;69:51–67.
Slotten DG, Reuter JE, Goldman CR. Mercury uptake patternsof biota in a seasonally anoxic northern California reservoir.Water, Air, Soil Pollut 1995;80:841–850.
Sullivan MJ, Moncreiff CA. Edaphic algae are an importantcomponent of salt marsh food-webs: evidence from multiplestable isotope analyses. Mar Ecol Prog Ser 1990;62:149–159.
Thorp JH, Covich AP. Ecology and classification of NorthAmerican freshwater invertebrates. New York, USA: Aca-demic Press, Inc, 1991. p. 911.
Tremblay A, Lucotte M, Rheault I. Methylmercury in a benthicfood web of two hydroelectric reservoirs and a natural lakeof northern Quebec, Canada. Water, Air, Soil Pollut1996;91:255–269.
348 P.R. Gorski et al. / The Science of the Total Environment 304 (2003) 327–348
Tremblay A, Lucotte M. Accumulation of total mercury andmethyl mercury in insect larvae of hydroelectric reservoirs.Can J Fish Aquat Sci 1997;54:832–841.
Tremblay G, Legendre P, Doyon JF, Verdon R, Schetagne R.The use of polynomial regression analysis with indicatorvariables for interpretation of mercury in fish data. Biogeo-chemistry 1998;40:189–201.
US EPA (United States Environmental Protection Agency).Method 1631: Mercury in water by oxidation, purge andtrap, and cold vapor atomic fluorescence spectrometry. EPA821-R-96-012. US EPA, Office of Water, Washington, DC;1996a.
US EPA. Method 1669: Method for sampling ambient waterfor determination of metals at EPA ambient criteria levels.EPA 821-R-96-011. US EPA, Office of Water, Washington,DC; 1996b.
Vander Zanden MJ, Cabana G, Rasmussen JB. Comparingtrophic position of freshwater fish calculated using stablenitrogen isotope ratios(d N) and literary dietary data. Can15
J Fish Aquatic Sci 1997;54:1142–1158.Vucetich LM, Vucetich JA, Cleckner LB, Gorski PR, PetersonRO. Mercury concentrations in deer mouse(Peromyscus
maniculatus) tissues from Isle Royale National Park. Envi-ron Pollut 2001;144:113–118.
Watras CJ, Bloom NS. Mercury and methylmercury in indi-vidual zooplankton: implications for bioaccumulation. Lim-nol Oceanogr 1992;37:1313–1318.
Watras CJ, et al. Sources and fates of mercury and methyl-mercury in Wisconsin lakes. In: Watras CJ, Huckabee JW,editors. Mercury pollution integration and synthesis. BocaRaton, FL, USA: CRC Press, 1994. p. 153–180.
Wiener JG, Fitzgerald WF, Watras CJ, Rada RG. Partitioningand bioavailability of mercury in an experimentally acidifiedWisconsin lake. Environ Toxicol Chem 1990;9:909–918.
Wilhelm C, Rudolph I, Renner W. A quantitative methodbased on HPLC-aided pigment analysis to monitor structureand dynamics of the phytoplankton assemblage—a studyfrom Lake Meerfelder Maar(Eifel, Germany). Archiv FurHydrobiologie 1991;123:21–35.
Wong AHK, McQueen DJ, Williams DD, Demers E. Transferof mercury from benthic invertebrates to fishes in lakeswith contrasting fish community structures. Can J FishAquat Sci 1997;54:1320–1330.
Copyright © 2022 FDOKUMEN