Determination of Hydrocarbons in Bivalves from the Egyptian Mediterranean Coast
Upload
independentCategory
view
1download
0
Reports
Long-term Bioaccumulation Monitoringwith Transplanted Bivalves in the SanFrancisco EstuaryANDREW J. GUNTHER *, JAY A. DAVISà, DANE D. HARDIN , JORDAN GOLD , DAVID BELL ,JONATHAN R. CRICK§, GENINE M. SCELFO§, JOSE SERICANO± and MARK STEPHENSON|| Applied Marine Sciences, Inc., 4749 Bennett Dr., Suite L, Livermore, CA 94550, USAàSan Francisco Estuary Institute, 1325 S. 46th Street, Richmond, CA 94804, USA§Department of Environmental Toxicology, University of California, Santa Cruz, CA 95064, USA±Geochemical and Environmental Research Group, Texas A&M University, 833 Graham Road, College Station,TX 77845, USAiMarine Pollution Studies Laboratory, 7711 Sandholt Road, Moss Landing, CA 95039, USA
The California State Mussel Watch and the RegionalMonitoring Program for Trace Substances have con-ducted biomonitoring for trace elements and organiccontaminants in the San Francisco Estuary using trans-planted bivalves (Mytilus californianus, Crassostrea gi-gas, and Corbicula ¯uminea). Signi®cant declines(p<0.01) in contaminant concentrations in M. califor-nianus for the period 1980±1996 were observed for PCBs,p,p0-DDE, cis-chlordane, dieldrin, and Ag, while a signi-®cant increase was observed for Cr (p<0.05). Certainlimitations of the ``mussel watch'' approach are illustratedby examining data on survival, body condition, and con-taminant uptake, including the inability of the techniqueto predict accumulation of mercury and selenium at highertrophic levels in the ecosystem. These results indicate thatbiomonitoring using transplanted bivalves, when part of aconsistently supported long-term program, can producevaluable data on the spatially and temporally averagedabundance and distribution of certain contaminants incoastal ecosystems. Ó 1999 Elsevier Science Ltd. Allrights reserved
Contamination of estuarine waters by toxic substances isa problem throughout the United States (OTA, 1987;Kennish, 1992). In the SanFrancisco Estuary, a variety ofmanagement programs have been implemented to reducethe discharge of toxic substances (RWQCB, 1995). Theseinclude monitoring the abundance and distribution of
contaminants in the Estuary to: determine the e�ective-ness of control e�orts, track natural processes that a�ectthe long-term abundance and distribution of contami-nants, and identify new contamination problems.
Frequent sampling is necessary to identify contami-nant trends given the temporal and spatial variability ofconcentrations in water and sediment, and this is oftentoo expensive for management agencies to undertake.One solution to this problem is to use bivalves as bio-monitors in what has been called the ``Mussel Watch''approach (Goldberg et al., 1978; Phillips, 1980; Burnsand Smith, 1981; Martin, 1985; Stephenson andLeonard, 1994; Stephenson et al., 1995). Transplantedor resident bivalves can provide an indication of tempo-rally and spatially averaged concentrations of bioavail-able contaminants in aquatic ecosystems, therebyproviding an integrated picture, for example, of thesuccess of source reduction e�orts in a watershed.
There are several advantages of the mussel watchapproach. These are the abilities of bivalves to: (1) ac-cumulate certain contaminants to much higher concen-trations than found in water, (2) be easily transplantedand maintained, (3) tolerate contaminated environ-ments, (4) not metabolize contaminants appreciably,and (5) provide an indication of contaminant bioavail-ability in an important estuarine and marine species(Martin and Richardson, 1991; Dame, 1996). However,there are disadvantages, including that (1) uptake ofcontaminants will vary with environmental conditionssuch as salinity, turbidity, and food availability, (2)uptake kinetics may be too slow to equilibrate with theenvironment (Sericano et al., 1996), (3) bioaccumulationcan be a�ected by physiological status, including growth
Marine Pollution Bulletin Vol. 38, No. 3, pp. 170±181, 1999
Ó 1999 Elsevier Science Ltd. All rights reserved
Printed in Great Britain
0025-326X/99 $ ± see front matterPII: S0025-326X(98)00185-4
*Corresponding author. Tel.: +1-510-451-7936; fax: +1-510-451-
3631; e-mail: [email protected]
170

rate and reproduction (Lobel et al., 1989) and (4) not allcontaminants in the environment are readily accumu-lated by bivalves (Luoma and Linville, 1995). Conse-quently, biomonitoring data must be interpretedappropriately with recognition of the potential impor-tance of these confounding factors.
We report on the results of biomonitoring for 15 yearsat two locations in the San Francisco Estuary via trans-plantation of the mussel Mytilus californianus under theCalifornia State Mussel Watch Program (SMW) andRegional Monitoring Program for Trace Substances inthe San Francisco Estuary (RMP). We also present dataon the survival and condition of oysters (Crassostreagigas) and clams (Corbicula ¯uminea) transplanted to theupper reaches of the Estuary, 1993±1996, to assess thee�cacy of biomonitoring using these species. Analysis oftemporal trends has allowed us to draw conclusionsabout changes in water quality over time, including thedetection of a major in¯ux of chromium to the Estuary.
Methods
The SMW has been biomonitoring with transplantedbivalves in the San Francisco Estuary since the early1980s (Phillips, 1988b; Rasmussen, 1994, 1996) and,since 1993, this work has been continued by the Re-gional Monitoring Program for Trace Substances in the
San Francisco Estuary (RMP). In addition, the Na-tional Mussel Watch Program collects annual samplesof resident mussels (identi®ed as Mytilus edulis but morelikely to be a hybrid of M. galloprovincialis andM. trossulus (Suchanek et al., 1997)) in San FranciscoBay (O'Connor, 1996).
The RMP was integrated with the SMW to developlong-term trends, and so RMP methods for bivalvecollection, maintenance, retrieval, and analysis aremodeled after those of SMW. Methods of the twoprograms have deviated slightly due to the participationof di�erent laboratories, limitations of funds, and lo-gistical considerations. These di�erences must be con-sidered when comparing the results from the RMP andSMW, and are identi®ed below as appropriate. Detaileddescriptions of the methods used by these programs(including the results of quality control testing) areavailable (Stephenson and Leonard, 1994; Stephensonet al., 1995; SFEI, 1996).
Collection of bivalves: Three species of bivalves arecollected from relatively clean sites and kept on ice untildeployment within 24±48 h of collection. Mytilus cali-fornianus (55±65 mm length) is collected from BodegaHead, CA (Fig. 1), Crassostrea gigas (70±150 mmlength) from Tomales Bay, CA (commercial suppliers),and Corbicula ¯uminea (20±35 mm width) from LakeIsabella and other locations as available.
Fig. 1 Location of study sites in the San Francisco Bay region ofCalifornia, USA.
171
Volume 38/Number 3/March 1999

Installation of moorings and deployment of bivalves:Divers using SCUBA establish a mooring by running aline from a pier, piling, or other permanent structure totwo large ground anchors (Fig. 2). A subsurface ¯oat isattached to one of the ground anchors and adjusted untilthe ¯oat is approximately 2 m o� the bottom. Use of per-manent structures aid mooring relocation and safe access.
Bivalves in nylon mesh bags (about 160 per site) areattached to the mooring line with nylon cable ties.During deployment, about 100 bivalves of each of thethree species are reserved to determine initial contami-nant concentrations and body condition. Divers returnto moorings 45 days after deployment to verify mooringintegrity and remove debris and fouling organisms. Thebivalves are retrieved 90±100 days after deployment.Bivalves for chemical analysis are handled to minimizecontamination and frozen in the ®eld on dry ice.
Tissue preparation: Bivalves are not depurated beforehomogenization for chemical analyses. Previous assess-ment found that, with the exception of lead and seleni-um, no signi®cant di�erences are found in trace metalconcentrations between mussels depurated for 48 h inclean seawater before homogenization and undepuratedmussels (Stephenson, 1992). While sediment in bivalveguts may contribute to the total tissue contaminantconcentration reported by SMW and RMP, signi®cantunexplained variability in trace element concentrationsexists even after considering the sediment gut contents(Lobel et al., 1989).
Bivalves for trace element analyses are scrubbed,thawed, and transferred to a clean room (Class 100,
uncerti®ed) at University of California at Santa Cruz.Samples are rinsed with deionized water to remove ex-traneous material and stainless steel scalpel blades areused to excise the animals and remove the gonads. Re-maining tissues are rinsed with ultrapure water andplaced in an acid-cleaned, shatter-proof glass jar. Thesample is homogenized using a Polytronä tissue grinder(Brinkmann) equipped with a titanium blade. Bivalvesused for trace organic analyses are shipped frozen viaovernight courier to Texas A&M University where theyare rinsed with reagent grade water to remove extrane-ous material, excised using a stainless steel scalpel blade,and homogenized in a combusted jar using a Tis-sumizerä or Polytronä.
Chemical analysis: The trace element methods used bySMW are described elsewhere (Stephenson and Leonard,1994). In the RMP su�cient homogenized tissue isdried overnight (70°C) to yield 1 g (dry weight), andcombined in an acid-cleaned te¯on vial with 10 mLtrace-metal grade aqua regia (3:1 HCl:HNO3). The aciddigest is re¯uxed 4 h (145°C) in closed vials and thenevaporated to dryness with lids removed. The cooledsample is redissolved in 10 ml trace-metal grade 1 NHNO3 (Fisher), allowed to equilibrate for about oneweek, and the resulting solution ®ltered (0.45 lm) ifnecessary to remove ¯oating particulate matter. Silver,Pb, and Cd were analyzed in 1993±1995 by graphitefurnace atomic adsorption spectrometry and Cu, Ni, Zn,and Cr by inductively coupled plasma mass spectrome-try; the latter method has been used for all elementssince 1996. Mercury is analyzed by cold vapor atomic¯ourescence (Bloom and Fitzgerald, 1988; Liang andBloom, 1993). Procedural blanks are analyzed toquantify elemental contamination, and extraction e�-ciency is quanti®ed using National Institute of Stan-dards and Technology Standard Reference Material1566 (oyster tissue).
Organic chemistry methods of SMW are given inStephenson et al. (1995), those of the RMP in Sericanoet al. (1990,1998). Brie¯y, extracts from homogenatesare dried with sodium sulfate, concentrated, and puri®edusing alumina and silica gel. Chlorinated hydrocarbonsare quanti®ed using high-resolution capillary gas chro-matography with electron capture detection. In 1996dual column chromatography with DB-5 and DB-17htcapillary columns was adopted by the RMP to reduceproblems with matrix interferences and coelution ofPCB congeners (SMW has always utilized dual col-umns). The results of quality control testing (includingsurrogates, lab duplicates, matrix spikes, and standardreference materials) are available (Stephenson et al.,1995; SFEI, 1996).
Measurement of condition: Specimens are scrubbedfree of encrusting organisms and sediments in the ®eld,dried, and sealed tightly shut with a nylon cable tie priorto freezing to prevent loss of shell contents upon thaw-ing. Measurement of sealed shell volume is accom-plished by weighing the water displaced by the
Fig. 2 Divers prepare to descend a piling (photo) to access a typicalmooring (diagram).
172
Marine Pollution Bulletin

specimens while still frozen. The volume of the openshell is determined by displacement, and the cavityvolume is derived as the di�erence between closed andopen shell volumes. Dry weight determinations aremade by carefully cutting the adductor muscles anddrying all shell contents to a constant weight (60°C for48 h). Body condition is de®ned as the ratio of dry ¯eshweight to cavity volume (Crosby and Gale, 1990).
Data analysis:P
PCB is calculated for RMP samplesby summing the concentrations of the following cong-eners: 8, 18, 28, 31, 33, 44, 49, 52, 56, 60, 66, 70, 74, 87,95, 97, 99, 101, 105, 110, 118, 128, 132, 138, 141, 149,151, 153, 156, 158, 170, 174, 177, 180, 183, 187, 194,195, 201, and 203. PCBs in the SMW were measured asAroclors;
PPCB data presented for SMW samples are
sums of Aroclors 1248, 1254, and 1260. Organicchemistry data are expressed on a lipid-weight basisbecause of correlations of contaminant concentrationswith lipid for SMW and RMP data in general, andbecause lipid normalization reduced the variance aboutthe long-term trend lines and between SMW and RMPdata. Long-term trends were tested for statistical sig-ni®cance using SpearmanÕs ranked correlation(O'Connor, 1996; Sheskin, 1997). The mean of multiplemeasurements in a given year (1993±1996) was used inthe correlation, although all samples appear in Figs. 5and 6.
Data for body condition are expressed as a ratio ofthe post-deployment condition index at each station tothe pre-deployment condition index (condition factor).A condition factor >1 indicates that the ratio of bodymass to shell volume increased, while a condition factorof <1 indicates that the ratio of body mass to shellvolume decreased during the deployment period.
Accumulation factors (AFs) are calculated as the ratioof the concentration of a contaminant in bivalves afterdeployment to the pre-deployment concentration. AFs6 1 indicate that concentrations in transplants did notincrease during deployment, the cause of which couldinclude relatively low levels of contamination in the Es-tuary (e.g., depuration of initial body burdens) or rela-tively high levels of contamination in the locations thatserved as sources for the transplanted bivalves. Withoutaccumulation, it is di�cult to ascertain whether con-taminant concentrations in tissue were the result ofexposure prior to deployment, or if there were no bio-available contaminants present at the site of deployment.It is thus essential that contaminant concentrations priorto deployment be as low as possible.
Results and Discussion
The utility of transplanted bivalves as biomonitors iscompromised if they are severely stressed or do notsurvive, and so the survival and condition of trans-planted organisms are considered below prior to dis-cussing bioaccumulation. Observation of low condition
factors in transplants suggests physiological stress,which could in¯uence the rate and magnitude of con-taminant uptake from the environment.
Viability of transplants: The California mussel(Mytilus californianus) is found in wave-exposed inter-tidal settings on the west coast of North America(McDonald and Koehn, 1988), and has a salinity tol-erance of approximately 50±150% natural seawater(Morris et al., 1980). Mytilus transplants demonstratedconsistently high survival (Fig. 3a) at the most salinestations (Alameda, Yerba Buena Island, and HorseshoeBay, Table 1, Fig. 1), while survival at the lower salinitystations was more variable. Survival was notably low inthe winter of 1995 when high freshwater ¯ows led to lowsalinities in most of the Estuary, and in winter deploy-ments at Pinole Point (except for the dry winter of 1994).Average salinity at Pinole Point (16 ppt, Table 1)approached the 50% of seawater tolerance limit forMytilus mentioned above. Survival of Mytilus in sum-mer transplants was consistently greater than 90% at allstations.
The oyster Crassostrea gigas has a salinity toleranceof 2±35& (Phillips, 1988a): survival was best at SanPablo Bay (Fig. 1), with only one deployment yielding asurvival of less than 90% (72% in winter 1996; Fig. 3b).Survival was moderately good at Coyote Creek andDavis Point, while at both Petaluma River and NapaRiver survival was poor in three of the eight deploy-ments. No clear seasonal pattern in oyster survival wasevident.
The Asiatic clam (Corbicula ¯uminea) has a salinitytolerance of zero to 3& (Foe and Knight, 1986). Clamsurvival was moderately good at all three sites (mean of84%; Fig. 3c), with lowest observed survival rates atGrizzly Bay in summer 1994 and Sacramento River insummer 1993. No clear seasonal pattern in clam survivalwas evident.
Body condition: Condition factors in mussels wereconsistently >1 at the most saline sites, Horseshoe Bayand Yerba Buena Island (Table 1), with only one in-stance of a ratio of <1 (Fig. 4a). Condition factors were>1 in winter deployments but <1 in summer deploy-ments at Alameda, Redwood Creek, and DumbartonBridge. At Red Rock and Pinole Point condition factorswere all <1.
In oysters, condition factors were all <1 at CoyoteCreek, San Pablo Bay, and Davis Point (Fig. 4b).Condition factors in summer at Coyote Creek werelower than in winter. Condition factors in clams weregenerally <1 (Fig. 4c), but were >1 at all three stationsin summer of 1994.
The survival and condition data indicate that bivalvesat many of the RMP stations did not survive deploy-ment with a positive condition factor. A condition fac-tor signi®cantly <1 suggests that the animals are notfeeding or under physiological stress (including the ef-fects of reproduction) during deployment. Suppressedfeeding might occur due to several causes, such as os-
173
Volume 38/Number 3/March 1999

motic stress or low food availability. Survival tended tobe better in the summer, while condition tended to beworse in the summer, but there were many exceptions tothis trend. This result is consistent with the hypothesisthat winter-time salinity stress lowers survival while
seasonally high productivity in late spring (Jassby et al.,1996) increases condition factor.
These results document the in¯uence of environmen-tal conditions on the physiology of bivalves, and high-light the importance of including such measures when
TABLE 1
Average salinities % measured in RMP sampling, 1993±1996.
Station Monthly average salinity Overall average
February April August
Alameda 20 23 27 23Coyote Creek 16 16 22 18Davis Point 10 10 19 13Dumbarton Bridge 19 20 26 21Grizzly Bay 2 2 7 4Horseshoe Bay 19 25 28 24Napa River 6 7 16 10Petaluma River 8 12 20 13Pinole Point 13 13 22 16Red Rock 14 21 25 20Redwood Creek 21 21 27 23Sacramento River 0 0 1 0San Joaquin River 0 0 0 0San Pablo Bay 10 14 23 16Yerba Buena Island 18 24 28 23
Average for each month is based on measurement in that month over four years, except for Alameda, Coyote Creek, Petaluma River, and Red Rock,which are based on three years.
Fig. 3 Survival of bivalves transplanted to San Francisco Bay in RMPbioaccumulation monitoring. Data represent percent of the de-ployed bivalves surviving at each location. Dates listed are col-lection dates at the end of a three month deployment period.
174
Marine Pollution Bulletin

designing biomonitoring programs. While conditionfactor is not an unambiguous measure of physiologicalstress, it does provide a method for considering thepotential confounding factors present in bioaccumula-tion data (see discussion of organic chemicals at PinolePoint below).
Contaminant bioaccumulation: Median AFs derivedfrom the RMP deployments (1993±1996) varied amongspecies and contaminant classes (Table 2). These varia-tions re¯ect both di�erences in accumulation potentialamong species and di�erences in spatial distribution ofcontamination in the Estuary. In some cases, low AFsresulted from relatively high contaminant concentra-tions at the sites where animals were collected (e.g., Cr inM. californianus at Bodega Head in 1995, Fig. 5).
Median AFs indicate that bioaccumulation of traceelements is less than for organic contaminants. The lowAF for mercury (maximum of 1.3), concentrations ofwhich are a main reason for public health advisories onconsumption of San Francisco Bay ®sh, indicates thatbivalve transplants are not an e�ective monitoring toolfor this element in the Estuary. Low bioaccumulation ofmercury by bivalves, which was also noted by Luomaand Linville (1995) for Potamocorbula amurensis andMacoma balthica in the San Francisco Estuary, does notsuggest the known contamination problem at highertrophic levels (Fairey et al., 1997). Similarly, low accu-
mulation of selenium in transplanted bivalves (maxi-mum AF� 1.4) does not suggest the seleniumconcentrations found in birds (Ohlendorf and Marois,1990). This might be due to the accumulation of sele-nium through the benthic food web, as documented forMacoma balthica in San Francisco Bay (Luoma et al.,1992).
The AFs for metals were lowest in M. californianus,with all values <2 (Table 2). C. gigas was the best ac-cumulator of metals, particularly Cr, Cu, Pb, and Zn.These results are consistent with laboratory studies(using C. virginica and M. edulis) documenting thatoysters accumulate Ag, Cd, and Zn much more e�-ciently than mussels (Reinfelder et al., 1997) C. ¯umineawas the best accumulator of Ag, and a relatively goodaccumulator of Ni and Pb (AFs >2).
AFs for organic contaminants were generally muchhigher than for trace elements. Mussels readily accu-mulated p,p0-DDD (an anaerobic breakdown product ofp,p0-DDT), RPCBs, and high molecular weight PAHssuch as ¯uoranthene and pyrene (AFs of 5±10). Oysterswere particularly strong accumulators of p,p0-DDD(AF� 15.7), chlordanes, RPCBs, and high molecularweight PAHs. Clams had lower AFs overall than mus-sels and oysters, but still experienced clear net accumu-lation of all organic analytes, particularly dieldrin(AF� 8.9) and pyrene (8.4). Low molecular weight
Fig. 4 Condition factors (see text for description) of bivalves trans-planted to the San Francisco Estuary in RMP bioaccumulationmonitoring. Dates listed are collection dates at the end of a threemonth deployment period.
175
Volume 38/Number 3/March 1999
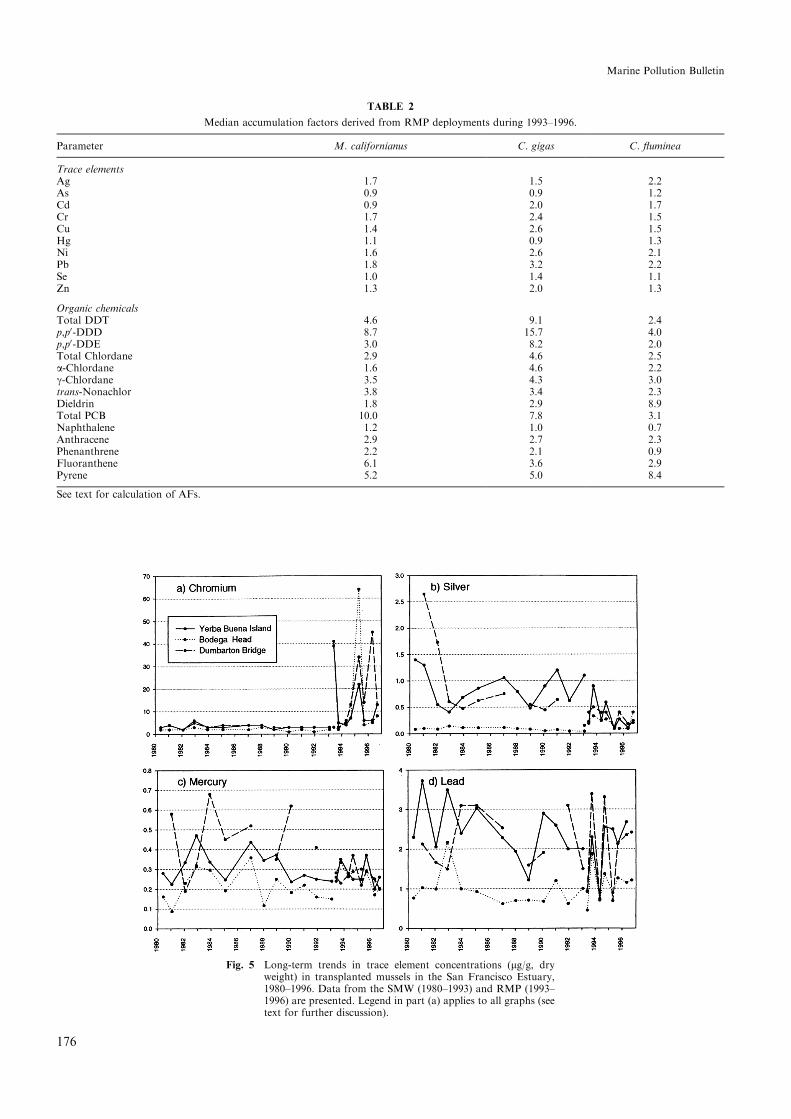
Fig. 5 Long-term trends in trace element concentrations (lg/g, dryweight) in transplanted mussels in the San Francisco Estuary,1980±1996. Data from the SMW (1980±1993) and RMP (1993±1996) are presented. Legend in part (a) applies to all graphs (seetext for further discussion).
TABLE 2
Median accumulation factors derived from RMP deployments during 1993±1996.
Parameter M. californianus C. gigas C. ¯uminea
Trace elementsAg 1.7 1.5 2.2As 0.9 0.9 1.2Cd 0.9 2.0 1.7Cr 1.7 2.4 1.5Cu 1.4 2.6 1.5Hg 1.1 0.9 1.3Ni 1.6 2.6 2.1Pb 1.8 3.2 2.2Se 1.0 1.4 1.1Zn 1.3 2.0 1.3
Organic chemicalsTotal DDT 4.6 9.1 2.4p,p0-DDD 8.7 15.7 4.0p,p0-DDE 3.0 8.2 2.0Total Chlordane 2.9 4.6 2.5a-Chlordane 1.6 4.6 2.2c-Chlordane 3.5 4.3 3.0trans-Nonachlor 3.8 3.4 2.3Dieldrin 1.8 2.9 8.9Total PCB 10.0 7.8 3.1Naphthalene 1.2 1.0 0.7Anthracene 2.9 2.7 2.3Phenanthrene 2.2 2.1 0.9Fluoranthene 6.1 3.6 2.9Pyrene 5.2 5.0 8.4
See text for calculation of AFs.
176
Marine Pollution Bulletin
PAHs, such as naphthalene, had relatively low AFs (6 1.2)in all species.
In summary, oysters showed the strongest overallaccumulation of trace elements and trace organicsduring deployment. Mussels and clams showed distinctaccumulation of organic contaminants during deploy-ment, but in general did not accumulate most traceelements as substantially. It should be noted that themedian AFs are an average indication of the strengthof bioaccumulation under the speci®c conditions inwhich the transplants were deployed; stronger orweaker accumulation might be observed in other eco-systems.
Long-term trends: Although the four years of data(1993±1996) available from the RMP (http://www.sfei.org) are not yet adequate to detect truly long-term trends, the RMP was designed to succeed the SMWat certain sites in the Estuary. Consequently, the com-bined data from these two programs create a muchlarger database at these shared locations, providing anextraordinary opportunity to examine the status ofcontamination in the Estuary over the last two decades.
The RMP and SMW data sets are not strictly com-parable, however, for several reasons. Some slight dif-ferences in analytical methods exist due to the fact thatdi�erent laboratories using alternative methodologieshave been responsible for chemical analyses (e.g.,packed column vs. capillary column gas chromatogra-phy for organic analytes), and conventions for estimat-ing RPCBs have also changed over time. In addition, thetime of deployment di�ered between SMW (fall) andRMP (winter and summer), which may bias bioaccu-mulation data (De Kock and Kramer, 1994; O'Connor,1996). In spite of these quali®cations, some of the trendsnoted below are strong enough that they are unlikely tobe the result of methodological di�erences, and somedetected changes do not correspond in time to changesin sampling or analytical methods.
The shared stations used for the assessment of long-term trends of trace elements are the RMP Yerba BuenaIsland station (which superseded the SMW TreasureIsland station), and the Dumbarton Bridge station(Fig. 1). A signi®cant decline (p<0.05) is indicated forAg at both sites (Table 3), with concentrations de-creasing over an order of magnitude during 1981±1995(Fig. 5b). A similar trend for Ag is noted by Luoma etal. (1996) from their monthly monitoring of resident
clams (Macoma balthica) in South San Francisco Bay.Stephenson and Leonard (1994) note long-term declinesfor Ag at 55% of the SMW sites along the Californiacoast, which appear to be due in large part to reductionsin the discharge of Ag by wastewater treatment plants.We expected the continued presence of bioavailable Agin the South Bay due to remobilization of Ag fromsediments (Rivera-Duarte and Flegal, 1997a). Long-term declines are also indicated for Hg and Pb (Fig. 5cand d), although these are less dramatic than for Ag.
In contrast, since 1993 the abundance of bioavailableCr in the Estuary has been higher than in the past, al-though ¯uctuating in both time and space (Fig. 5a);Table 3). In both 1993 and 1995, Cr concentrations werehigher, although in 1995 pre-deployment concentrationsof Cr from Bodega Head (Fig. 5a) made interpretationof the transplant data di�cult. Depending upon theactual rate of depuration in the environment, such highinitial concentrations could in¯uence concentrationsmeasured after deployment.
The di�erent concentrations at Yerba Buena Islandand Dumbarton Bridge suggest di�ering processes af-fecting Cr availability in these two locations. The di-agenic remobilization of Cr from sediments in the SouthBay might explain higher concentrations found at theDumbarton Bridge site during the winter/spring periodsof 1995 and 1996. Abu-Saba and Flegal (1997) suggestthat the principal source of dissolved Cr to the SouthBay is remobilization of Cr from sediments. This processis likely to exert a signi®cant in¯uence on measurementsof bioaccumulation by bivalves.
The bioaccumulation monitoring data for Cr stronglysuggest a large in¯ux of Cr to the Estuary in 1993 and1995; a source appears to be the ¯ushing of the YoloBypass (a portion of the Sacramento River ¯oodplain),as indicated by intensive sampling of the water columnfor chemical species of Cr. Mass balance calculationsindicate that ¯oodwaters sitting in the Yolo Bypassleach Cr from the sediments, which is carried into theEstuary during later storm events. The ¯ux of Cr to theEstuary via these high ¯ow events exceeds direct an-thropogenic inputs by almost 2 orders of magnitude(Abu-Saba and Flegal, 1997). While this mechanismshould also have been documented during the heavyrains of 1982 and 1983, the SMW samples were collectedin January, and so biomonitoring data do not re¯ect theperiod of high ¯ows in the winter. Another mechanism
TABLE 3
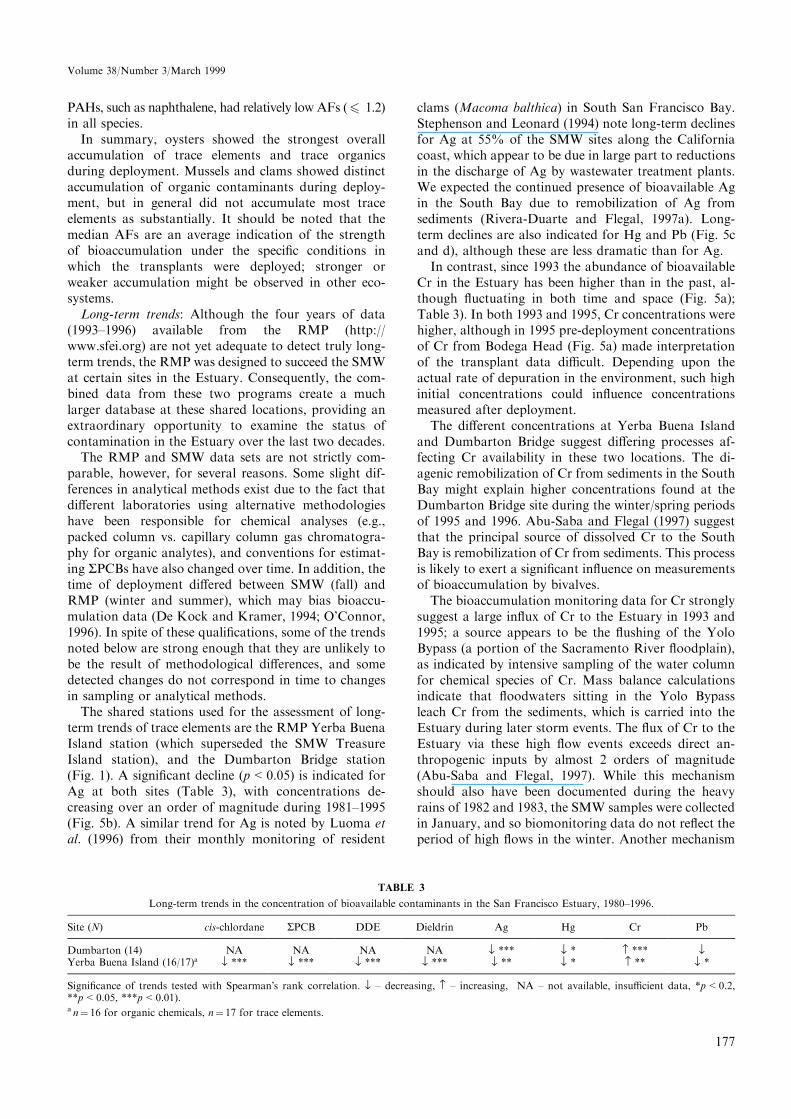
Long-term trends in the concentration of bioavailable contaminants in the San Francisco Estuary, 1980±1996.
Site (N) cis-chlordane RPCB DDE Dieldrin Ag Hg Cr Pb
Dumbarton (14) NA NA NA NA ¯ *** ¯ * *** ¯Yerba Buena Island (16/17)a ¯ *** ¯ *** ¯ *** ¯ *** ¯ ** ¯ * ** ¯ *
Signi®cance of trends tested with SpearmanÕs rank correlation. ¯ ± decreasing, ± increasing, NA ± not available, insu�cient data, *p<0.2,**p<0.05, ***p<0.01).a n� 16 for organic chemicals, n� 17 for trace elements.
177
Volume 38/Number 3/March 1999

to explain the increased bioaccumulation of Cr is intensestorm activity resuspending Cr-containing sedimentsthat were then ingested by the bivalves.
For Cu and Zn the long-term data indicate no trend(SFEI, 1998). This is in direct contrast to long-term datafor Cu in resident clams in South San Francisco Bay,which show a large decrease in bioavailable Cu (Luomaet al., 1996). Since the latter sampling is based onanalysis of clams close to the outfall of the Palo AltoSewage Treatment Plant, these declines may re¯ect theimportant in¯uence of that local source. Stephenson andLeonard (1994) document an increase in Cu at certainSMW sites along the California coast, which they sug-gest could be due to the increased use of Cu-containinganti-fouling paints.
As with Cr, Cu, and especially Zn, concentrations inthe water column of South Bay are likely in¯uenced bybenthic ¯uxes (Rivera-Duarte and Flegal, 1997b). Thelack of a trend at the Dumbarton Bridge site, despitee�orts to reduce anthropogenic inputs of these traceelements, may re¯ect the importance of sediment-waterinteractions in controlling the temporally and spatiallyaveraged bioavailable concentrations. In addition, thereis also some evidence of regulation of Zn body burdens(and to a lesser extent, Cu) by mussels, although thee�ect of this metabolic activity is not thought to inter-fere with larger changes of Zn bioavailability in theenvironment (Rainbow, 1995).
The most complete long-term data for organic con-taminants from the SMW were collected at YerbaBuena Island and Pinole Point (Fig. 1). Unfortunately,bivalves deployed at Pinole Point had relatively lowrates of survival, and condition factors<1 (Figs. 3 and 4).This raises a concern that these animals were near therange of their salinity tolerance and under physiologicalstress, compromising their performance as biomonitors.For this reason the data from Pinole Point are not usedto assess long-term trends, instead this discussion usesdata from Yerba Buena Island (Fig. 1). Overall, thesedata generally show statistically signi®cant declines(p<0.01, Table 3) in organic contaminant concentra-tions since 1980. The trajectory and magnitude of thedeclines, however, vary from contaminant to contami-nant.
RPCB concentrations were over 20,000 ng/g lipid in1980, but dropped almost an order of magnitude by1982, remaining essentially constant ever since (Fig. 6a).RPCB concentrations at certain other SMW stations inthe Estuary showed the same pattern in the early 1980s,with high concentrations in 1980 and 1981 and majorreductions by 1982 (Phillips, 1988b; Stephenson et al.,1995). As discussed above, the RMP derives RPCBs asthe sum of individual PCB congeners, while SMW usedthe older convention of the sum of Aroclors. In wildlifetissues, sums of Aroclors are approximately double thesums of congeners in the same sample (Turle et al.,
Fig. 6 Long-term trends in trace organic contaminant concentrations(ng/g lipid) in transplanted mussels in the San Francisco Estu-ary, 1980±1996. Data from the SMW (1980±1993) and RMP(1993±1996) are presented. Legend in part (a) applies to allgraphs (see text for further discussion).
178
Marine Pollution Bulletin
1991). Given this consideration, RMP RPCB data ap-pear to be in good agreement with SMW data from theearly 1990s.
p,p0-DDE is usually the most abundant DDT com-pound in samples from the Estuary. Concentrations ofp,p0-DDE were over 2000 ng/g (lipid) in 1980, droppedsharply in 1981, and appeared to slowly decline after1981 (Fig. 6c). Concentrations since 1988 have beenessentially constant, with close agreement betweenSMW and RMP data.
cis-chlordane was one of the most abundant chlor-dane compounds in chlordane mixtures (Dearth andHites, 1991) and is also relatively abundant in RMPsamples (Fig. 6c). Like RPCBs and p,p0-DDE, concen-trations of cis-chlordane were highest in 1980. UnlikeRPCBs and p,p0-DDE, however, cis-chlordane showed amore gradual, continuing decline from 1981 to 1991.Similar gradual declines occurred at most SMW stations(Stephenson et al., 1995). Concentrations since 1991have been relatively constant. Dieldrin concentrationshave been varying, but were also generally high in theearly 1980s, with the highest concentrations observed in1980 and 1984 (Fig. 6d). Concentrations have been rel-atively constant since 1989.Uses of all of the organic chemicals discussed have
been restricted for long periods of time. Restrictions onPCB production and use began in the early 1970s andcommercial PCB production ceased in 1977 (Brinkmanand de Kok, 1980). The use of DDT for almost allpurposes was banned in California in 1970 and in theUS in 1971 (Phillips, 1987). Restrictions on chlordaneuse began in 1975 and domestic sales and productionceased in 1988 (Shigenaka, 1990). Dieldrin use has beenrestricted since 1974 (Harte et al., 1991) and ceased in1987 (Fairey et al., 1997).
Given these restrictions, the declining concentrationsof these contaminants in the period covered by SMWand RMP would be expected. Distinct declines in con-centrations of RPCBs, p,p0-DDE, cis-chlordane occurredin 1980±1982. These declines were probably due to acombination of restrictions on the use of these chemicalsthat began in the 1970s and the institution of secondarytreatment at some of the major municipal treatmentplants in the late 1970s and early 1980s. Similar declinesfor organic contaminants have been noted in the Na-tional Musselwatch program (O'Connor, 1996).
It is important and somewhat surprising, however,that concentrations of these organic contaminants havenot continued to decline in the 1990s. Their concentra-tions remain high enough to invoke concern for humanhealth, as evidenced by current ®sh consumption advi-sories (Fairey et al., 1997), and for concern over e�ectson wildlife (Ohlendorf and Marois, 1990; Davis et al., inpreparation; Young et al., 1998). The most recent long-term trend data suggest that these concerns are notlikely to diminish in the near future.
Conclusions
Biomonitoring using transplanted bivalves in the SanFrancisco Estuary has produced valuable long-termdata on spatially and temporally averaged abundanceand distribution of certain trace elements and organiccontaminants. Signi®cant declines (p<0.01) in con-taminant concentrations in transplanted mussels for theperiod 1980±1996 were observed for RPCBs, p,p0-DDE,cis-chlordane, dieldrin, and Ag, while a signi®cant in-crease (p<0.05) was observed for Cr. These trends areonly available due to a commitment of public funds tobuild an internally consistent long-term data set.Maintenance of this commitment in the coming decadeswill provide an even ®rmer basis for evaluation of long-term trends in contamination in the Estuary.
Certain limitations of the mussel watch approachhave also been demonstrated. The data on survival andcondition of the transplants indicate that environmentalconditions at certain sites are generating physiologicalstress in the animals, which complicates the interpr-etation of contaminant accumulation data. In addition,certain contaminants are not accumulated signi®cantly.In some cases this lack of accumulation is likely an in-dication that the Estuary does not contain elevatedconcentrations relative to the source locations of thebivalves. In other cases, most notably for Hg and Se,which are present in relatively high concentrations inupper trophic levels, the transplanted bivalves used inRMP sampling appear to have a limited capacity foraccumulating these substances.
Given the need to conserve funds in monitoring pro-grams, it is tempting to eliminate analysis of contami-nants that show no temporal trend. The Cr dataindicate, however, that caution should be exercisedwhen considering elimination of potentially bioavailableanalytes from long-term monitoring programs. Agrowing body of evidence suggests that many sources ofcontamination are episodic in nature, and it is likely thatthese pulses of contaminant input can greatly in¯uencethe abundance and distribution of contaminants inaquatic environments. The data from long-term bio-monitoring can be an invaluable tool for prioritizinge�orts at pollution control in the face of future episodicinputs.
The authors are indebted to Mr. Gary Ichikawa and other SMWpersonnel for their advice on ®eld operations; Dr. Thomas OÕConnorof NOAA; Mr. Jung Yoon, Dr. Rainer Hoenicke, Dr. BruceThompson, Mr. Ted Daum, and Ms. Adrienne Yang of the SanFrancisco Estuary Institute; Mr. Brian Sak, Mr. Pat Conroy, Mr.Michael Kellog, Ms. Karen Salamy, Mr. Brad Cortwright, and Mr.Ron Walder for their assistance in the ®eld; and the US CoastGuard for their cooperation in the use of aids to navigation in SanFrancisco Bay. Sta� members of the laboratory of Dr. A. RussellFlegal at the University of California at Santa Cruz and the Geo-chemical and Environmental Research Group at Texas A&M Uni-versity contributed to this project, and Dr. Flegal provided avaluable review of the manuscript. This paper is RMP ContributionNumber 32 (www.sfei.org).
179
Volume 38/Number 3/March 1999

Abu-Saba, K. E. and Flegal, A. R. (1997) Temporally variablefreshwater sources of dissolved chromium to the San Francisco BayEstuary. Environmental Science and Technology 31, 3455±3460.
Bloom, N. S. and Fitzgerald, W. F. (1988) Determination of volatilemercury species at the picogram level by low-temperature gaschromatography with cold-vapour atomic ¯uorescence detection.Anal. Chim. Acta 208, 151±161.
Brinkman, U. A. T. and de Kok, A. (1980) Production, properties, andusage. In Halogenated Biphenyls, Terphenyls, Naphthalenes, Diben-zodioxins and Related Products, ed. R. D. Kimbrough. ElsevierBiomedical Press, Amsterdam.
Burns, K. A. and Smith, J. L. (1981) Biological monitoring of ambientwater quality: the case for using bivalves as sentinel organisms formonitoring petroleum pollution in coastal waters. Estuarine,Coastal and Shelf Science 13, 433±443.
Crosby, M. P. and Gale, L. D. (1990) A review and evaluation ofbivalve condition index methodologies with a suggested standardmethod. Journal of Shell®sh Research 9(1), 233±237.
Dame, R. F. (1996) Ecology of Marine Bivalves: An EcosystemApproach. CRC Press, Boca Raton, FL.
Davis, J. A., Fry, D. M., Higashi, R. M. and Preston, L. A. (inpreparation) Polychlorinated biphenyls (PCBs): concentrations,metabolism, and relation to biochemical and morphologicalparameters in double-crested cormorants (Phalacrocorax auritus)in California.
De Kock, W. C. and Kramer, K. J. M. (1994) Active biomonitoring(ABM) by translocation of bivalve molluscs. In Biomonitoring ofCoastal Waters and Estuaries, ed. K. J. M. Kramer, pp. 51±84. CRCPress, Boca Raton, FL.
Dearth, M. A. and Hites, R. A. (1991) Complete analysis of technicalchlordane using negative ionization mass spectrometry. Environ-mental Science and Technology 25, 245±254.
Fairey, R., Taberski, K., Lamerdin, S., Johnson, E., Clark, R. P.,Downing, J. W., Newman, J. and Petreas, M. (1997) Organochlo-rines and other environmental contaminants in muscle tissues ofsport®sh collected from San Francisco Bay. Marine PollutionBulletin 34(12), 1058±1071.
Foe, C. and Knight, A. (1986) A method for evaluating the sublethalimpact of stress employing Corbicula ¯uminea. American Malaco-logical Bulletin (Special Edition No. 2), 133±142.
Goldberg, E. D., Bowen, V. T., Farrington, J. W., Harvey, G., Martin,J. H., Parker, P. L., Risebrough, R. R., Robertson, W., Schneider,E. and Gamble, E. (1978) The mussel watch. EnvironmentalConservation 5, 101±125.
Harte, J., Holdren, C., Schneider, R. and Shirley, C. (1991) Toxics A toZ. University of California Press, Berkeley, CA.
Jassby, A. D., Kose�, J. R. and Monismith, S. G. (1996) Processesunderlying phytoplankton variability in San Francisco Bay. In SanFrancisco Bay: The Ecosystem, ed. J. T. Hollibaugh, pp. 325±350.Paci®c Division of the American Association for the Advancementof Science, San Francisco, CA.
Kennish, M. J. (1992) Ecology of Estuaries: Anthropogenic E�ects.CRC Press, Boca Raton, FL.
Liang, L. and Bloom, N. S. (1993) Determination of total Hg bysingle-stage gold amalgamation with cold vapor atomic spectro-metric detection. Journal of Analytical Atomic Spectrometry 8, 591±594.
Lobel, P. B., Belkhode, S. P., Jackson, S. E. and Longerich, H. P.(1989) A universal method for quantifying and comparing theresidual variability of element concentrations in biological tissuesusing 25 elements in the mussel Mytilus edulis as a model. MarineBiology 102, 513±518.
Luoma, S. N., Cain, D. J., Brown, C., Hornberger, M. and Bouse, R.(1996) Near Field Receiving Water monitoring of Trace Metals inClams (Macoma balthica) and Sediments Near the Palo Alto andSan Jose/Sunnyvale Water Quality Control Plants in South SanFrancisco Bay, December 1994±December 1995. US GeologicalSurvey, Menlo Park, CA.
Luoma, S. N., Johns, C., Fisher, N. S., Steinberg, N. A., Oremland, R.S. and Reinfelder, J. R. (1992) Determination of seleniumbioavailability to a benthic bivalve from particulate and solutepathways. Environmental Science and Technology 26, 485±491.
Luoma, S. N. and Linville, R. (1995) A comparison of selenium andmercury concentrations in transplanted and resident bivalves fromNorth San Francisco Bay. In 1995 Annual Report of the Regional
Monitoring Program for Trace Substances, pp. 160±170. SanFrancisco Estuary Institute, Richmond, CA.
Martin, M. (1985) California Mussel Watch: toxic surveillance inCalifornia. Marine Pollution Bulletin 16, 140±146.
Martin, M. and Richardson, B. (1991) Long term contaminantbiomonitoring: views from Southern and Northern hemisphereperspectives. Marine Pollution Bulletin 22(11), 533±537.
McDonald, J. H. and Koehn, R. K. (1988) The mussels Mytilusgalloprovincialis and M. trossulus on the Paci®c coast of NorthAmerica. Marine Biology 99, 111±118.
Morris, R. H., Abbot, D. P. and Haderlie, E. C. (1980) IntertidalInvertebrates of California. Stanford Univ. Press, Stanford, CA.
O'Connor, T. P. (1996) Trends in chemical concentrations in musselsand oysters collected along the US coast from 1986 to 1993. MarineEnvironmental Research 41(2), 183±200.
Ohlendorf, H. M. and Marois, K. C. (1990) Organochlorines andselenium in California night-heron and egret eggs. EnvironmentalMonitoring and Assessment 15, 91±104.
OTA (1987) Wastes in Marine Environments. O�ce of TechnologyAssessment, US Government Printing O�ce, Washington, DC.
Phillips, D. J. H. (1980) Quantitative Aquatic Biological Indicators.CRC Press, Boca Raton, FL.
Phillips, D. J. H. (1987) Toxic Contaminants in the San Francisco Bay-Delta and their Possible Biological E�ects: A Critical ReviewEmphasizing Spatial and Temporal Trend Monitoring. San Fran-cisco Estuary Institute, Richmond, CA.
Phillips, D. J. H. (1988a) Monitoring of Toxic Contaminants in theSan Francisco Bay-Delta: A Critical Review, Emphasizing Spatialand Temporal Trend Monitoring. San Francisco Estuary Institute,Richmond, CA.
Phillips, P. T. (1988b) California State Mussel Watch Ten Year DataSummary: 1977±1987. State Water Resources Control Board,Sacramento, CA.
Rainbow, P. S. (1995) Biomonitoring of heavy metal availability in themarine environment. Marine Pollution Bulletin 31, 183±192.
Rasmussen, D. (1994) State Mussel Watch Program: 1987±1993 DataReport. State Water Resources Control Board, Division of WaterQuality, Sacramento, CA.
Rasmussen, D. (1996) State Mussel Watch Program: 1993±1995 DataReport. State Water Resources Control Board, Division of WaterQuality, Sacramento, CA.
Reinfelder, J. R., Wang, W. -X., Luoma, S. N. and Fisher, N. S. (1997)Assimilation e�ciencies and turnover rates of trace elements inmarine bivalves: a comparison of oysters, clams and mussels.Marine Biology 129, 443±452.
Rivera-Duarte, I. and Flegal, A. R. (1997a) Pore-water silver concen-tration gradients and benthic ¯uxes from contaminated sedimentsof San Francisco Bay, California, USA. Marine Chemistry 56, 15±26.
Rivera-Duarte, I. and Flegal, A. R. (1997b) Porewater gradients anddi�usive ¯uxes of Co, Ni, Cu, Zn, and Cd in San Francisco Bay.Croatica Chemica Acta 70(1), 389±417.
RWQCB (1995) Water Quality Control Plan. California RegionalWater Quality Control Board, San Francisco Bay Region, Oakland,CA.
Sericano, J. L., Atlas, E. L., Wade, T. L. and Brooks, J. M. (1990)NOAA's Status and Trends Mussel Watch Program: chlorinatedpesticides and PCBs in oysters (Crassostrea virginica) and sedimentsfrom the Gulf of Mexico, 1986±1987. Marine EnvironmentalResearch 29, 161±203.
Sericano, J. L., Gardinali, P. and Wade, T. L. (1998) Quantitativedetermination of chlorinated hydrocarbons. In Sampling andAnalytical Methods of the National Status and Trends Program,Mussel Watch Project: 1993±1996 Update. NOAA TechnicalMemorandum NOS ORCA 130, pp. 160-167. NOAA, Washington,DC.
Sericano, J. L., Wade, T. L. and Brooks, J. M. (1996) Accumulationand depuration of organic contaminants by the American oyster(Crassostrea virginica). The Science of the Total Environment 179,149±160.
SFEI (1996) Quality Assurance Program Plan for the RegionalMonitoring Program for Toxic Substances in the San FranciscoEstuary. San Francisco Estuary Institute, Richmond, CA.
SFEI (1998) 1996 Annual Report for the Regional MonitoringProgram for Trace Substances in the San Francisco Estuary. SanFrancisco Estuary Institute, Richmond, CA.
180
Marine Pollution Bulletin

Sheskin, D. J. (1997) Handbook of Parametric and NonparametricStatistical Procedures. CRC Press, Boca Raton, FL.
Shigenaka, G. (1990) Chlordane in the Marine Environment of theUnited States: Review and Results from the National Status andTrends Program. National Oceanic and Atmospheric Administra-tion, Seattle, WA.
Stephenson, M. (1992) A report on bioaccumulation of trace metalsand organics in bivalves in San Francisco Bay. California Depart-ment of Fish and Game, Moss Landing Marine Laboratory, MossLanding, CA.
Stephenson, M. D. and Leonard, G. H. (1994) Evidence for the declineof silver and lead and the increase of copper from 1977 to 1990 inthe coastal marine waters of California. Marine Pollution Bulletin28(3), 148±153.
Stephenson, M. D., Martin, M. and Tjeerdema, R. S. (1995) Long-term trends in DDT, polychlorinated biphenyls, and chlordane inCalifornia mussels. Archives Environmental Contamination andToxicology 28(4), 443±450.
Suchanek, T. H., Geller, J. B., Kreiser, B. R. and Mitton, J. B. (1997)Zoogeographic distributions of the sibling species Mytilus gallop-rovincialis and M. trossulus (Bivalvia: Mytilidae) and their hybridsin the North Paci®c. Biological Bulletin 193, 187±194.
Turle, R., Norstrom, R. J. and Collins, B. (1991) Comparison of PCBquantitation methods: re-analysis of archived specimens of herringgull eggs from the Great Lakes. Chemosphere 22, 201±213.
Young, D., Becerra, M., Kopec, D. and Echols, S. (1998) GC/MSanalysis of PCB congeners in blood of the harbor seal (Phocavitulina) from San Francisco Bay. Chemosphere 37(4), 711±733.
181
Volume 38/Number 3/March 1999
Copyright © 2022 FDOKUMEN