Molecular identification of four cryptic species of (Rodentia, Murinae
Molecular identification of a cryptic species in the Amazonianpredatory catfish genus Pseudoplatystoma (Bleeker, 1962)from Peru
Carmen Garcıa-Davila • Fabrice Duponchelle • Diana Castro-Ruiz •
Jose Villacorta • Sophie Querouil • Werner Chota-Macuyama • Jesus Nunez •
Uwe Romer • Fernando Carvajal-Vallejos • Jean-Francois Renno
Received: 24 April 2013 / Accepted: 31 August 2013
� Springer Science+Business Media Dordrecht 2013
Abstract Pseudoplatystoma species are highly prized
South American Pimelodid migratory catfishes. Until
recently, their taxonomy was not clearly established, with
discrepancies between morphological and molecular anal-
yses. Here, Pseudoplatystoma species from the Peruvian
Amazon were characterized at the molecular level from a
sample representing the observed range of their color pat-
tern variations in the study area. Analyses were performed
using seven microsatellite loci for 103 specimens and, for
part of them (52), using sequences of two regions of their
mitochondrial genome [Cytochrome Oxidase subunit I
(COI) and Control Region (CR)]. Factorial correspondence
analysis and assignment tests based on microsatellite
polymorphism showed that the specimens originally iden-
tified as P. punctifer belonged to two different gene pools
highly differentiated from P. tigrinum. Morphological
examination identified two different morphotypes (with
and without black stripes), suggesting the existence of two
distinct taxa within P. punctifer. This result was corrobo-
rated by the ML tree based on CR sequences, where all
individuals but four clustered in a similar way as in the
FCA and Bayesian assignment tests. For these four indi-
viduals, mitochondrial introgression or retention of ances-
tral polymorphism was likely. In contrast, the ML tree
based on COI sequences showed that reciprocal monophyly
was not yet achieved for this marker for the two P. punc-
tifer taxa. The existence of three sympatric species of
Pseudoplatystoma in the Peruvian Amazon is discussed in
relation to their molecular characteristics, color patterns
and ecology. Evolutionary scenarios regarding their
divergence are hypothesized.
Keywords Microsatellites � Control Region �Barcoding � Migratory catfish
C. Garcıa-Davila � F. Duponchelle � D. Castro-Ruiz �S. Querouil � W. Chota-Macuyama � J. Nunez � U. Romer �F. Carvajal-Vallejos � J.-F. Renno
Laboratoire Mixte International-Evolution et Domestication de
l’Ichtyofaune Amazonienne (LMI-EDIA), Iquitos, Peru
e-mail: [email protected]
C. Garcıa-Davila � D. Castro-Ruiz � J. Villacorta �W. Chota-Macuyama
Laboratorio de Biologıa y Genetica Molecular (LBGM),
Programa para el Uso y Conservacion del Agua y sus Recursos
(AQUAREC), Instituto de Investigaciones de la Amazonıa
Peruana (IIAP), Carretera Iquitos-Nauta, Km. 4.5, Iquitos, Peru
F. Duponchelle � S. Querouil � J. Nunez � J.-F. Renno (&)
Institut de Recherche pour le Developpement (IRD), Institut des
Sciences de l’Evolution de Montpellier (UMR 226-ISEM),
Universite Montpellier 2, CC 065, 34095 Montpellier Cedex 5,
France
e-mail: [email protected]
U. Romer
Department of Geo-Sciences Institute for Biogeography,
University of Trier, Am Wissenschaftspark 25–27, 54296 Trier,
Germany
U. Romer
Linteler Straße 19, 33334 Gutersloh, Germany
F. Carvajal-Vallejos
Unidad de Limnologıa y Recursos Acuaticos, Universidad
Mayor San Simon, Cochabamba, Bolivia
F. Carvajal-Vallejos
Asociacion FAUNAGUA, Cochabamba, Bolivia
123
Genetica
DOI 10.1007/s10709-013-9734-5
Introduction
Amazonia covers approximately two-thirds (747,282 km2)
of the Peruvian territory. In the Peruvian Amazon, catches
are dominated by Characiformes and Siluriformes includ-
ing Pimelodidae family, among which species of the genus
Pseudoplatystoma Bleeker 1862, are the most abundant
(Canas 2000; Tello and Bayley 2001; Garcia et al. 2009).
These are large predatory species of high economic value
and are widely distributed in the main basins of South
America (Orinoco, Guyana, Magdalena, Parana-Paraguay
and Amazon basins), from the lowland to the Andean
piedmont, in the main channels, floodplains and small
creeks of the rainforest, but infrequent or absent in the
estuary (Barthem and Goulding 1997, 2007).
Until recently, the specific diversity of this genus was
underestimated and poorly documented, owing to the lack
of clear taxonomical studies to define morphological
boundaries among species. Only three Pseudoplatystoma
species were recognized: P. corruscans (Spix and Agassiz
1829) in the Parana-Paraguay basin; P. tigrinum (Valen-
ciennes 1840) in the Amazon basin; and P. fasciatum
(Linnaeus 1766) in the Amazon basin. In a recent sys-
tematic review based on morphological characters, Bui-
trago-Suarez and Burr (2007) defined eight species. Three
species were already described: P. fasciatum, which is now
restricted to the Guayana shield basins; P. corruscans, in
the Parana basin; and P. tigrinum, which is widely dis-
tributed in the Amazon basin. Two species were rehabili-
tated: P. punctifer (Castelnau 1855), which is widely
distributed in the Amazon basin, and P. reticulatum (Ei-
genmann and Eigenmann 1889) in the Parana-Paraguay
basin. Three species were newly described: P. orinocoense
(Buitrago-Suarez and Burr), P. metaense (Buitrago-Suarez
and Burr), both from the Orinoco basin, and P. magda-
leniatum (Buitrago-Suarez and Burr) from the Magdalena
basin. In a subsequent molecular phylogeny of the genus
Pseudoplatystoma using mtDNA analyses (CR), however,
Torrico et al. (2009) could not separate P. fasciatum from
P. punctifer, or P. orinocoense from P. metaense, and
suggested synonymy for these species. More recently, a
new phylogenetic revision of the genus based, on mito-
chondrial (cytochrome b) and nuclear (Rag1 intron 1, and
S7 intron 1) markers, recognized only four species within
the genus: P. magdaleniatum, P. corruscans, P. tigrinum
and P. fasciatum (Carvalho-Costa et al. 2011).
Morphological identification in Pseudoplatystoma is
essentially based on the number of vertebrae, body shape and
color patterns. In the Loreto (Peruvian Amazon) striped
catfish belonging to Pseudoplatystoma are called ‘‘doncella’’
(P. punctifer) and ‘‘tigre zungaro’’ (P. tigrinum). In this
Amazonian region, color patterns of P. punctifer are strongly
variable, creating confusion in their identification (Agudelo
et al. 2000). Indeed, this species presents a wide range of
pigmentation patterns, ranging from the typical patterns with
black and white vertical stripes laterally distributed over the
body, to the absence of vertical black lines. These variations
could represent the expression of an intraspecific polymor-
phism or indicate the presence of new species inside P.
punctifer. This study characterized the genetic variability of
the Pseudoplatystoma species in the Peruvian Amazon
around Iquitos, using both nDNA (microsatellite loci) and
mtDNA (CR and COI) from a sample representing the widest
possible range of their color pattern variations.
Materials and methods
Sampling
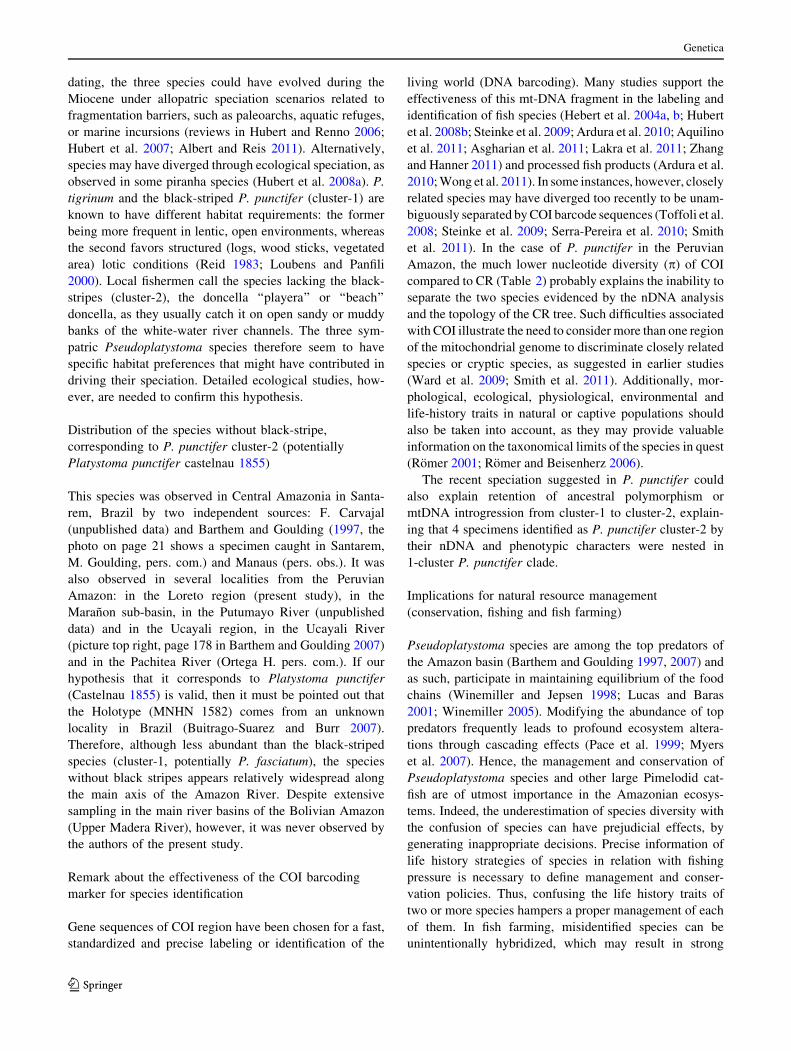
During the period from August 2009 to August 2011, 103
adults specimens of P. punctifer (83) and P. tigrinum (20)
presenting the widest possible range of variation in color
pattern were collected at the Belen market of Iquitos
(Loreto, Peru). We collected all the specimens found with
uncommon color pattern but only some specimens pre-
senting the common pattern (see Buitrago-Suarez and Burr
2007). In doing so, we gave a higher representation to
specimens with rare patterns in the sampling. This inten-
tional bias in term of natural relative abundance was nec-
essary to get enough rare specimens for proper compar-
isons with common specimens. Iquitos is the largest fishing
port in the Peruvian Amazon. According to the Regional
Office of Production (DIREPRO) catfishes sold in this
market come from the vicinity of Iquitos in an area
including the lower Ucayali River, the lower Maranon
River, and the middle Amazon River (Fig. 1).
Each specimen sampled was measured, photographed
and approximately 1 cm3 of muscle was collected and pre-
served in ethanol for later DNA extraction. To be conserved
as reference specimens, 24 P. punctifer and 5 P. tigrinum
individuals were chosen to cover the best range of color
pattern variation observed in the Belen market. These
vouchers are deposited at the ichthyological collection of the
‘‘Instituto de Investigaciones de la Amazonıa Peruana’’
(IIAP, Iquitos, Peru) and the fish collection of the Natur-
historisches Museum Dresden (MTD F, Dresden, Germany).
DNA extraction, amplification and genotyping
of microsatellite loci
DNA extraction was performed on 100 ng of muscle tissue
preserved in 96 % alcohol following the CTAB extraction
protocol modified from Doyle and Doyle (1987). DNA
amplification for 7 microsatellite loci was done using
primers designed for P. corruscuans (Revaldaves et al.
Genetica
123
2005) in a total volume of 10 ll with native DNA (0.5 ll),
Taq polymerase (5U/ul), Buffer (5X), MgCl2 (25 mM),
dNTPs (10 mM), primer (10 lM). PCR program was a first
denaturizing cycle at 92 �C for 2 min, then 30 cycles
(denaturizing at 95� C during 1 min, one annealing cycle at
optimal temperature for each primer during 1 min and
elongation at 72 �C during 1 min) and a final extension
cycle at 72 �C during 40 min.
The amplified segments were denatured and separated
by capillary electrophoresis on a sequencer (Applied Bio-
systems 3130XL). For each capillary a solution of 1 ll of
the PCR product, 8.6 ll of formamide and 0.4 ll of
GeneScan 500 ROX (fragment length marker) was used.
The molecular weight of each microsatellite allele was
obtained using Peak Scanner version 1.0 (https://products.
appliedbiosystems.com).
Amplification and sequencing of mtDNA fragments
Sequencing of Cytochrome Oxidase subunit I gene (COI)
and of Control Region (CR) was performed on 52
specimens (10 P tigrinum and 42 P. punctifer) presenting
the widest possible range of color pattern variation. The
COI and CR fragments were amplified using FishF1 50-TCA ACC AAC CAC AAA GAC ATT GGC AC-30 and
FishR1 50-TAG ACT TCT GGG TGG CCA AAG AAT
CA-30 primers (Hubert et al. 2008), and DL20F: 50-TTA
GCA AGG CGT CTT GGG CT-30 (Agnese et al. 2006) and
DL20R: 50-ACC CCT AGC TCC CAA AGC TA-30
primers (Agnese, courtesy), respectively. For the two
fragments, PCR amplifications were performed in 15 ll of
mix solution containing: ultra pure water (6.78 ll), PCR
buffer 59 (3 ll), MgCl2 25 mM (0.9 ll), each primer
10 lM (0.6 ll), mix dNTP 2 mM (1.5 ll), polymerase Taq
5 U/ll (0.12 ll), native DNA 100 ng/ll (1.5 ll). For CR,
PCR program was a first denaturizing cycle at 94 �C for
2 min, then 35 cycles (denaturizing at 94 �C during 30 s,
hybridizing at 54 �C for 40 s and elongation at 72 �C
during 1 min) and a final extension cycle at 72 �C during
10 min. For CO1, PCR program was a first denaturizing
cycle at 92 �C during 2 min, then 30 cycles (denaturizing
at 95 �C during 1 min, hybridizing at 50 �C during 1 min
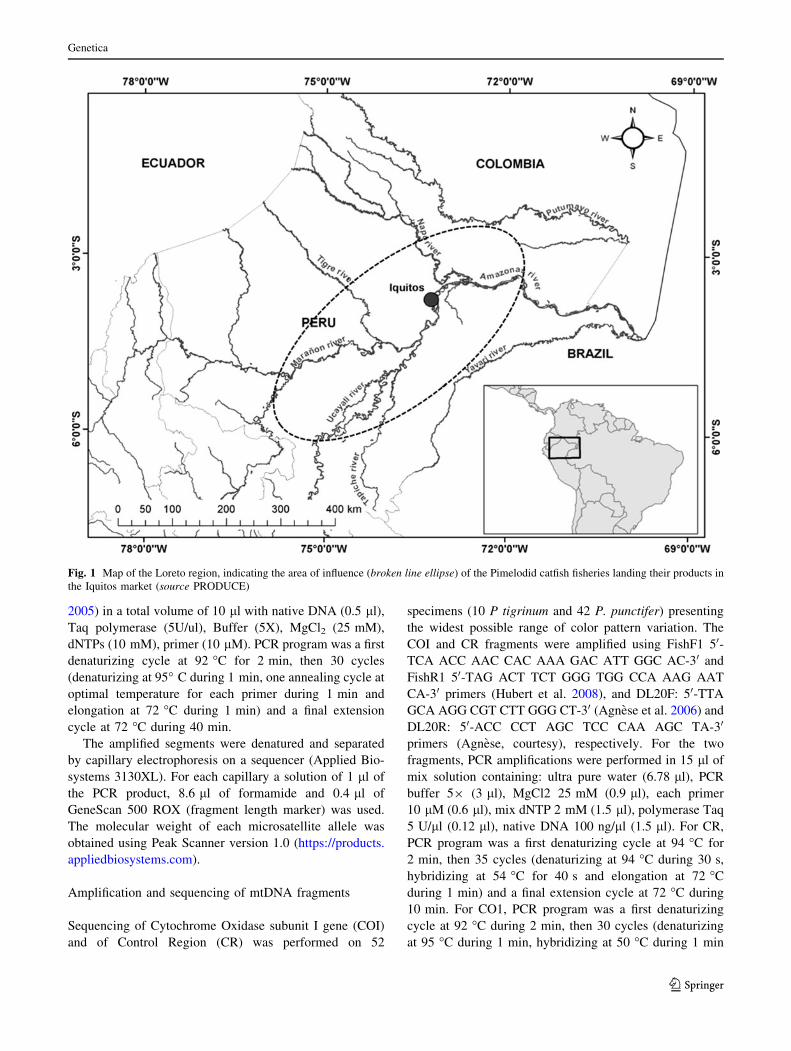
Fig. 1 Map of the Loreto region, indicating the area of influence (broken line ellipse) of the Pimelodid catfish fisheries landing their products in
the Iquitos market (source PRODUCE)
Genetica
123
and elongation at 72 �C during 1 min) and a final extension
cycle at 72 �C during 5 min. Sequencing reactions were
performed in both directions using the same primers used
for PCR amplification, and sequences were read on a
3130XL Applied Biosystems analyzer.
Data analysis
Nuclear DNA (microsatellites) polymorphism
Microsatellite data were used to characterize the extent of
interbreeding or introgression between P. punctifer and P.
tigrinum as well as to investigate population structure
within each taxa. Two types of analyses were performed
independently with the same data set, without a priori
consideration for morphological information (color pat-
tern): a Factorial Correspondence Analysis (FCA) and
assignment tests aiming at 1—determining the optimal
number of genetic units that minimizes deviation from
Hardy–Weinberg equilibrium within each units; 2—assign
individuals among these units.
The FCA is not a statistical test sensu stricto, as it does
not give probability, but it provides visual information,
identifying the responsible variables. It was carried out to
search for consistent genetic clusters, each of them being
constituted of genetically close individuals, as defined by
their allelic combinations or by alleles with relatively high
frequency. To run this analysis, for each locus and for each
individual, the alleles were coded 0 when absent, 1 when
heterozygous, and 2 when homozygous. As a corollary, a
homozygous allele has twice the weight of the heterozy-
gous one.
The Maximum Likelihood (ML) approach is similar to the
genetic mixture analysis example proposed by Smouse,
Waples and Tworek (1990) on predefined stocks and wild
populations of Pacific salmon. Without any a priori knowl-
edge about the source populations, the software Partition
ML (Belkhir and Bonhomme 2002) implements a ‘‘simu-
lated annealing’’ method (Kirkpatrick et al. 1983). This
method tests for a varying number of underlying source
populations contributing to a sample (while assigning indi-
viduals to each of them). The most probable partition is
structured in various reproductive units, each of which pro-
vides the minimum departure from panmixia. The number of
clusters and the distribution of individuals among clusters
were also evaluated by Bayesian analyses using the software
Structure 2.1 (Pritchard et al. 2000). We carried out MCMC
simulations using no prior information on the origin of
samples and the no admixture model given that samples were
expected to come from at least two distinct species. The
maximum number of populations (K) was assumed to vary
between 1 and 6. For each potential value of K, ten replica-
tions were performed, with a number of steps equal to 10,000
for the burning process and 100,000 for the simulations,
which was sufficient to achieve convergence according to the
criteria indicated by the authors. The probability that a given
value of K was the best one was calculated based on mean ln
Pr(X/K), following the recommendations of the authors.
Within each traditionally recognized species, the genetic
clusters and units revealed by the FCA and the assignment
tests were then compared and tested by h the estimator of Fst
and by the f estimator of Fis. Genetic variability was analyzed
using Genetix 4.05.2, (Belkhir et al. 2004). Null hypotheses
were rejected at P B 0.05 %.
Finally, in order to find a morphological marker to dif-
ferentiate the reproductive units revealed by the allelic
variation, the spot and stripe pattern variation of fishes was
reviewed considering the limits of the taxa as defined by
the FCA and assignment analyses.
Mitochondrial DNA, COI and CR sequencing
polymorphism
Partial sequences of COI and CR were obtained for a
subset of the individuals analyzed with the microsatellite
loci (42 P. punctifer and 10 P. tigrinum). Genbank
sequences from taxa phylogenetically close to P. punctifer
and P. tigrinum were used as taxonomic out-groups to root
the COI and CR trees: P. magdaleniatum (FJ889882), P.
corruscans (FJ889877 and FJ889876) and P. fasciatum
(FJ889869 from Guyana) for CR fragment, and P. mag-
daleniatum (GU570861 and GU570860), P. corruscans
(HQ689335), for COI fragment. Additionally, Genbank
sequences of P. tigrinum (FJ889689), P. punctifer
(FJ889866), for CR, and P. tigrinum (GU570938), P. fas-
ciatum (GU570852 y GU570851) for COI were added as
reference.
For each individual a consensus sequence was obtained
using BioEdit 7.0.9.0 software (Hall 1999). For the global
alignments no gap was needed in COI, while seven gaps
were required for the CR. Number of haplotypes, haplo-
typic distribution among clusters, and haplotype and
nucleotide diversity were estimated by DnaSP software
5.10.01 (Librado and Rozas 2009).
To infer phylogenetic relationships among Pseudopla-
tystoma, we performed a Maximum Likelihood (ML)
search, using the algorithm developed by Guindon and
Gascuel (2003). The best evolutionary model and its
parameters were selected using the Akaike Information
Criterion values (Akaike 1973) determined using the
Analysis of Phylogenetics and Evolution (APE) R program
(Paradis et al. 2004; Paradis 2006). Bootstrap proportions
(BP) for the maximum likelihood tree were determined
with 1000 pseudoreplicates to estimate each node’s
robustness. The evolutionary model for ML was also used
to calculate the genetic divergence among genetic clusters.
Genetica
123

The treatment was implemented using PhyML version 3.2
(http://atge.lirmm.fr/phyml) (Guindon and Gascuel 2003).
Results
Genetic variability in the nuclear genome
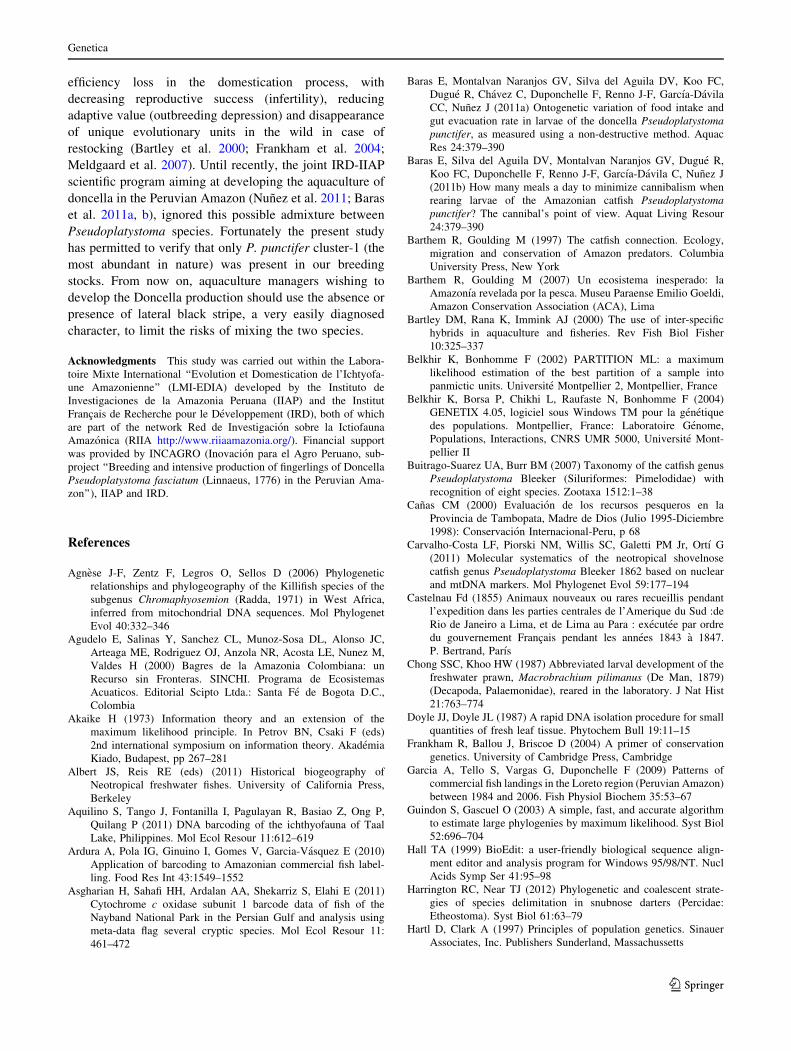
The factorial plan defined by the first two axes of the FCA
represented only 9.67 and 5.66 % of the total variance
respectively, but three genetic clusters were clearly sepa-
rated: two in P. punctifer and one in P. tigrinum (Fig. 2).
The number of individuals in each clade was 20 for P.
tigrinum, 41 for P. punctifer cluster-1 and 42 for P.
punctifer cluster-2. The variables separating the clusters are
private alleles or unique combinations of alleles. In the
plane defined by the axes 1 and 2, the alleles with highest
absolute contributions ([50), were: Pcor2-228, Pcor8-174,
Pcor10-138 characterizing P. punctifer cluster-1; Pcor2-
220, Pcor8-16, characterizing P. punctifer cluster-2 and
Pcor5-149, Pcor7-231, Pcor8-216, Pcor1-86, Pcor21-110
characterizing P. tigrinum.
The most likely assignment by ML Partition was the
distribution of the 103 individuals among 3 units (P \ 0.001,
df = 79, Log likelihood = -1,721) corresponding to the
same clusters illustrated by the FCA, except for 3 individuals
(2 individuals from P. punctifer cluster-1 were assigned to
unit-2 and 1 individual from P. punctifer cluster-2 was
assigned to unit-1). Structure analyses revealed that the
optimal number of reproductive units (K) was three, given
that lnP reached a plateau at K = 3 and P(K = 3) = 0.831.
Individuals were partitioned among the three units exactly in
the same way as among the three clusters identified by the
FCA. Assignment indexes were close to one for all indi-
viduals, ranging from 0.95 to 1 with an average value of 0.99.
Among the 3 clusters defined by the FCA, the expected non-
biased heterozygosity varied from zero (0), for Pcor10 loci
(P. tigrinum) and Pcor21 (P. tigrinum and P. punctifer
cluster2), to 0.91 for Pcor2 locus in P. tigrinum. The f esti-
mator of Fis, evaluating the departure from within-group
panmixia, showed significant negative values in two loci of
P. punctifer cluster-1 (Pcor10 and Pcor21), indicating an
excess of heterozygotes for these loci, whereas the multiloci f
estimator indicated a departure from panmixia in P. tigrinum
and P. punctifer cluster-2 (Table 1). The h (estimator of Fst)
values confirmed the strong genetic differentiation
(h = 0.46, P \ 0.0001) between the two clusters observed
in P. punctifer by the FCA and assignment analyses. Sub-
sequently the three clusters, identified as sympatric repro-
ductive units, will be considered as probable biological
species according to the Mayr concept (1942).
Preliminary approach of the relationship
between genetic variation and pigmentation
In order to find distinguishing phenotypic characters, the
103 individuals collected were separated according to the
three clusters defined by the FCA analysis and corroborated
by the assignment analyses. The three clusters totally
matched the following morphological delimitations. Spec-
imens in P. punctifer cluster-1 were characterized by a
relatively short and superficial fontanel ending about
midway between the eyes and the posterior edge of the
operculum, a head with almost straight lateral edges, and
close black and white vertical lateral stripes that terminate
before the dorsal region (Fig. 3a). The most noticeable
feature distinguishing specimens of P. punctifer clusters 1
and 2 was the absence of lateral vertical black stripes in
specimens belonging to cluster-2 (Fig. 3b). Every speci-
mens assigned to cluster-2 by the FCA had no black stripes
and, once this particular character was singled out, were
easily and unambiguously distinguished from the speci-
mens belonging to cluster-1 (common P. punctifer).
Although less evident than the stripe pattern, specimens of
P. punctifer cluster-2 also tended to have flatter dorso-
ventral body and head profile. P. tigrinum specimens dif-
fered very clearly from specimens of both P. punctifer
cluster 1 (black-and-white-striped species) and cluster 2
(white-striped species) by their typical characteristics
(Buitrago-Suarez and Burr 2007): a head with concave
lateral edges, a large fontanel reaching the operculum and
straight or loop–like black stripes continuing to the dorsal
part of the body without vertical white lines (Fig. 3c).
Genetic variability in the mitochondrial genome
Polymorphism
The Maximum Likelihood trees were built according to the
selected HKY ? G model (Log likelihood = -2113.26,
Gamma shape parameter = 0.642, transition/transversion
-1500
-1000
-500
0
500
1000
1500
-1000 -500 0 500 1000 1500 2000 2500
FC1 (inertia = 9.67%)
FC
2 (i
ner
tia
= 5.
66%
)
P. punctifer cluster 1 P. punctifer cluster 2 P. tigrinum
Fig. 2 Projection on the factorial plan defined by the first two axes of
the FCA of Pseudoplatystoma individuals from the Loreto region
(Peruvian Amazon) in function of their allelic frequencies
Genetica
123
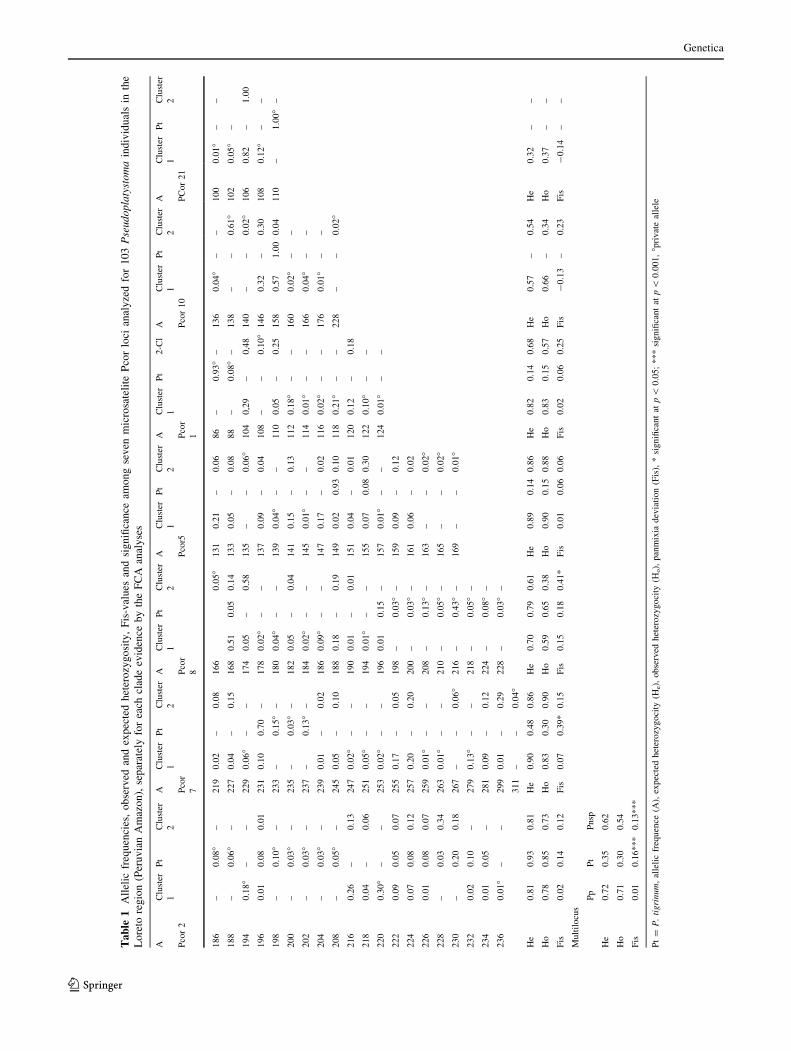
Ta
ble
1A
llel
icfr
equ
enci
es,
ob
serv
edan
dex
pec
ted
het
ero
zyg
osi
ty,
Fis
-val
ues
and
sig
nifi
can
ceam
on
gse
ven
mic
rosa
teli
teP
cor
loci
anal
yze
dfo
r1
03
Pse
ud
op
laty
sto
ma
ind
ivid
ual
sin
the
Lo
reto
reg
ion
(Per
uv
ian
Am
azo
n),
sep
arat
ely
for
each
clad
eev
iden
ceb
yth
eF
CA
anal
yse
s
AC
lust
er
1
Pt
Clu
ster
2
AC
lust
er
1
Pt
Clu
ster
2
AC
lust
er
1
Pt
Clu
ster
2
AC
lust
er
1
Pt
Clu
ster
2
AC
lust
er
1
Pt
2-C
lA
Clu
ster
1
Pt
Clu
ster
2
AC
lust
er
1
Pt
Clu
ster
2
Pco
r2
Pco
r
7
Pco
r
8
Pco
r5P
cor
1
Pco
r10
PC
or
21
186
–0.0
8�
–219
0.0
2–
0.0
8166
0.0
5�
131
0.2
1–
0.0
686
–0.9
3�
–136
0.0
4�
––
100
0.0
1�
––
188
–0.0
6�
–227
0.0
4–
0.1
5168
0.5
10.0
50.1
4133
0.0
5–
0.0
888
–0.0
8�
–138
––
0.6
1�
102
0.0
5�
–
194
0.1
8�
––
229
0.0
6�
––
174
0.0
5–
0.5
8135
––
0.0
6�
104
0,2
9–
0,4
8140
––
0.0
2�
106
0.8
2–
1.0
0
196
0.0
10.0
80.0
1231
0.1
00.7
0–
178
0.0
2�
––
137
0.0
9–
0.0
4108
––
0.1
0�
146
0.3
2–
0.3
0108
0.1
2�
––
198
–0.1
0�
–233
–0.1
5�
–180
0.0
4�
––
139
0.0
4�
––
110
0.0
5–
0.2
5158
0.5
71.0
00.0
4110
–1.0
0�
–
200
–0.0
3�
–235
–0.0
3�
–182
0.0
5–
0.0
4141
0.1
5–
0.1
3112
0.1
8�
––
160
0.0
2�
––
202
–0.0
3�
–237
–0.1
3�
–184
0.0
2�
––
145
0.0
1�
––
114
0.0
1�
––
166
0.0
4�
––
204
–0.0
3�
–239
0.0
1–
0.0
2186
0.0
9�
––
147
0.1
7–
0.0
2116
0.0
2�
––
176
0.0
1�
––
208
–0.0
5�
–245
0.0
5–
0.1
0188
0.1
8–
0.1
9149
0.0
20.9
30.1
0118
0.2
1�
––
228
––
0.0
2�
216
0.2
6–
0.1
3247
0.0
2�
––
190
0.0
1–
0.0
1151
0.0
4–
0.0
1120
0.1
2–
0.1
8
218
0.0
4–
0.0
6251
0.0
5�
––
194
0.0
1�
––
155
0.0
70.0
80.3
0122
0.1
0�
––
220
0.3
0�
––
253
0.0
2�
––
196
0.0
10.1
5–
157
0.0
1�
––
124
0.0
1�
––
222
0.0
90.0
50.0
7255
0.1
7–
0.0
5198
–0.0
3�
–159
0.0
9–
0.1
2
224
0.0
70.0
80.1
2257
0.2
0–
0.2
0200
–0.0
3�
–161
0.0
6–
0.0
2
226
0.0
10.0
80.0
7259
0.0
1�
––
208
–0.1
3�
–163
––
0.0
2�
228
–0.0
30.3
4263
0.0
1�
––
210
–0.0
5�
–165
––
0.0
2�
230
–0.2
00.1
8267
––
0.0
6�
216
–0.4
3�
–169
––
0.0
1�
232
0.0
20.1
0–
279
0.1
3�
––
218
–0.0
5�
–
234
0.0
10.0
5–
281
0.0
9–
0.1
2224
–0.0
8�
–
236
0.0
1�
––
299
0.0
1–
0.2
9228
–0.0
3�
–
311
––
0.0
4�
He
0.8
10.9
30.8
1H
e0.9
00.4
80.8
6H
e0.7
00.7
90.6
1H
e0.8
90.1
40.8
6H
e0.8
20.1
40.6
8H
e0.5
7–
0.5
4H
e0.3
2–
–
Ho
0.7
80.8
50.7
3H
o0.8
30.3
00.9
0H
o0.5
90.6
50.3
8H
o0.9
00.1
50.8
8H
o0.8
30.1
50.5
7H
o0.6
6–
0.3
4H
o0.3
7–
–
Fis
0.0
20.1
40.1
2F
is0.0
70.3
9*
0.1
5F
is0.1
50.1
80.4
1*
Fis
0.0
10.0
60.0
6F
is0.0
20.0
60.2
5F
is-
0.1
3–
0.2
3F
is-
0.1
4–
–
Mult
ilocu
s
Pp
Pt
Pnsp
He
0.7
20.3
50.6
2
Ho
0.7
10.3
00.5
4
Fis
0.0
10.1
6***
0.1
3***
Pt
=P
.ti
gri
num
,al
leli
cfr
equen
ce(A
),ex
pec
ted
het
erozy
goci
ty(H
e),
obse
rved
het
erozy
goci
ty(H
o),
pan
mix
iadev
iati
on
(Fis
),*
signifi
cant
atp\
0.0
5;
***
signifi
cant
atp\
0.0
01,
�pri
vat
eal
lele
Genetica
123
ratio = 12.283) and TN93 model (Log likelihood =
-1175.58, Gamma shape parameter = 0.008, transition/
transversion ratio = 50.168) for the CR and COI
fragments, respectively. The COI fragment is conserved
within Pseudoplatystoma with a weak polymorphism
(H = 0.57 and p = 0.008), only 17 polymorphic sites (out
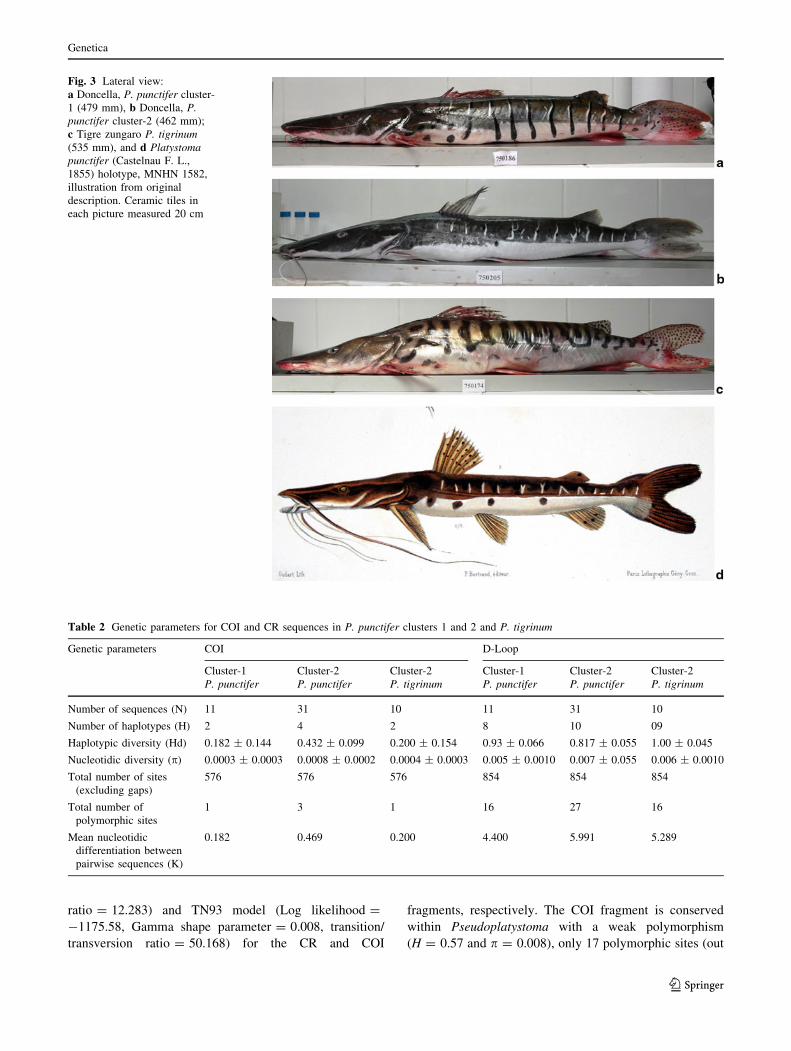
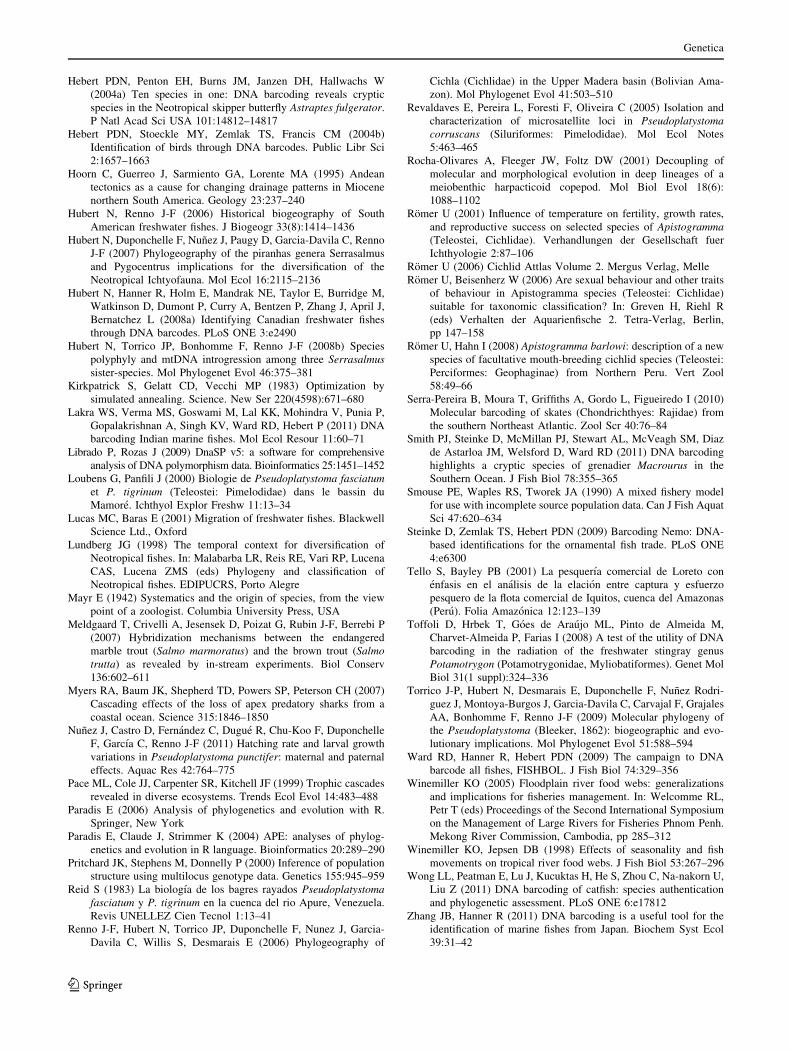
Fig. 3 Lateral view:
a Doncella, P. punctifer cluster-
1 (479 mm), b Doncella, P.
punctifer cluster-2 (462 mm);
c Tigre zungaro P. tigrinum
(535 mm), and d Platystoma
punctifer (Castelnau F. L.,
1855) holotype, MNHN 1582,
illustration from original
description. Ceramic tiles in
each picture measured 20 cm
Table 2 Genetic parameters for COI and CR sequences in P. punctifer clusters 1 and 2 and P. tigrinum
Genetic parameters COI D-Loop
Cluster-1 Cluster-2 Cluster-2 Cluster-1 Cluster-2 Cluster-2
P. punctifer P. punctifer P. tigrinum P. punctifer P. punctifer P. tigrinum
Number of sequences (N) 11 31 10 11 31 10
Number of haplotypes (H) 2 4 2 8 10 09
Haplotypic diversity (Hd) 0.182 ± 0.144 0.432 ± 0.099 0.200 ± 0.154 0.93 ± 0.066 0.817 ± 0.055 1.00 ± 0.045
Nucleotidic diversity (p) 0.0003 ± 0.0003 0.0008 ± 0.0002 0.0004 ± 0.0003 0.005 ± 0.0010 0.007 ± 0.055 0.006 ± 0.0010
Total number of sites
(excluding gaps)
576 576 576 854 854 854
Total number of
polymorphic sites
1 3 1 16 27 16
Mean nucleotidic
differentiation between
pairwise sequences (K)
0.182 0.469 0.200 4.400 5.991 5.289
Genetica
123
of 576 analyzed sites) and only 7 haplotypes among the 52
sequences studied (Table 2). It is worth noting that the 10
individuals of P. punctifer cluster-1 had a single haplotype,
shared with 23 of the 32 specimens of P. punctifer cluster-2
and also shared with the P. fasciatum specimen from
genbank (Fig. 4a). In contrast, the CR showed a high
polymorphism (H = 0.93 and p = 0.022), with 67 poly-
morphic sites out of 854. Of the 26 haplotypes, 9 were
found only in P. tigrinum (Hd = 1.00, p = 0,006), 7 in P.
punctifer cluster-1 (Hd = 0.93, p = 0,005), and 9 in P.
punctifer cluster-2 (Hd = 0.82, p = 0,007). One haplotype
was shared between 3 individuals of P. punctifer cluster-1
and one individual of P. punctifer cluster-2.
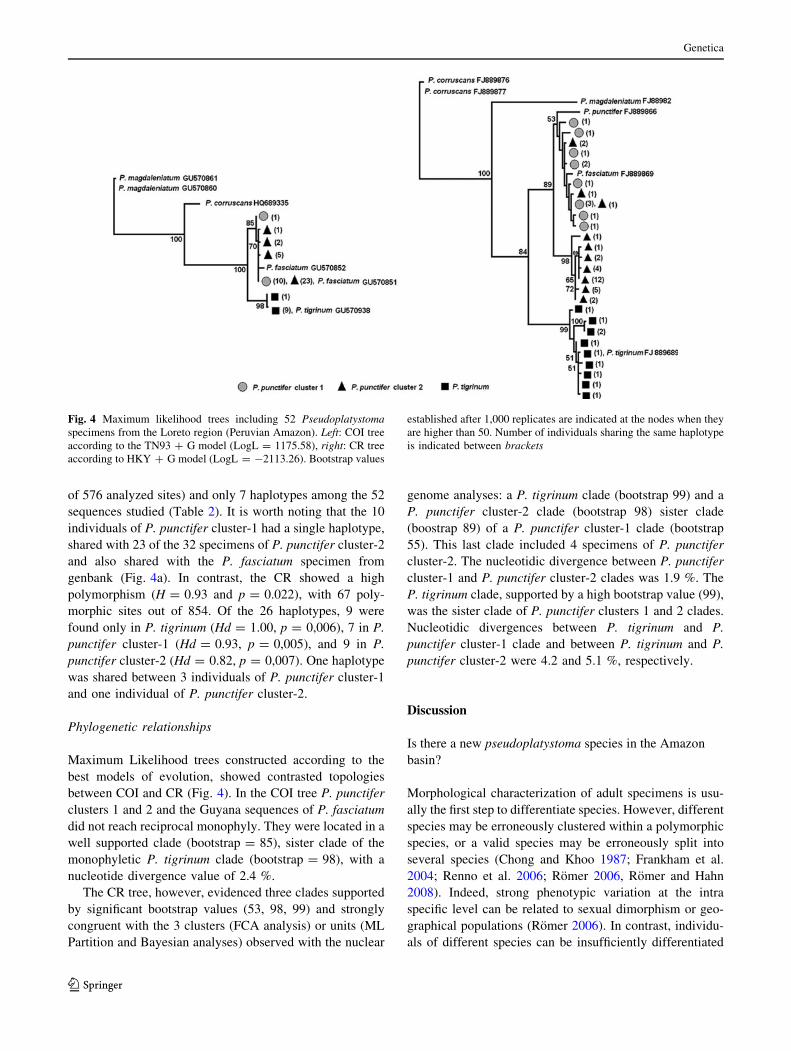
Phylogenetic relationships
Maximum Likelihood trees constructed according to the
best models of evolution, showed contrasted topologies
between COI and CR (Fig. 4). In the COI tree P. punctifer
clusters 1 and 2 and the Guyana sequences of P. fasciatum
did not reach reciprocal monophyly. They were located in a
well supported clade (bootstrap = 85), sister clade of the
monophyletic P. tigrinum clade (bootstrap = 98), with a
nucleotide divergence value of 2.4 %.
The CR tree, however, evidenced three clades supported
by significant bootstrap values (53, 98, 99) and strongly
congruent with the 3 clusters (FCA analysis) or units (ML
Partition and Bayesian analyses) observed with the nuclear
genome analyses: a P. tigrinum clade (bootstrap 99) and a
P. punctifer cluster-2 clade (bootstrap 98) sister clade
(boostrap 89) of a P. punctifer cluster-1 clade (bootstrap
55). This last clade included 4 specimens of P. punctifer
cluster-2. The nucleotidic divergence between P. punctifer
cluster-1 and P. punctifer cluster-2 clades was 1.9 %. The
P. tigrinum clade, supported by a high bootstrap value (99),
was the sister clade of P. punctifer clusters 1 and 2 clades.
Nucleotidic divergences between P. tigrinum and P.
punctifer cluster-1 clade and between P. tigrinum and P.
punctifer cluster-2 were 4.2 and 5.1 %, respectively.
Discussion
Is there a new pseudoplatystoma species in the Amazon
basin?
Morphological characterization of adult specimens is usu-
ally the first step to differentiate species. However, different
species may be erroneously clustered within a polymorphic
species, or a valid species may be erroneously split into
several species (Chong and Khoo 1987; Frankham et al.
2004; Renno et al. 2006; Romer 2006, Romer and Hahn
2008). Indeed, strong phenotypic variation at the intra
specific level can be related to sexual dimorphism or geo-
graphical populations (Romer 2006). In contrast, individu-
als of different species can be insufficiently differentiated
Fig. 4 Maximum likelihood trees including 52 Pseudoplatystoma
specimens from the Loreto region (Peruvian Amazon). Left: COI tree
according to the TN93 ? G model (LogL = 1175.58), right: CR tree
according to HKY ? G model (LogL = -2113.26). Bootstrap values
established after 1,000 replicates are indicated at the nodes when they
are higher than 50. Number of individuals sharing the same haplotype
is indicated between brackets
Genetica
123
morphologically to be easily separated. Then, in the case of
cryptic species, the confusion of species may prevent the
understanding of ecological and evolutionary processes and
lead to the underestimation of species richness (Rocha-
Olivares et al. 2001; Romer and Hahn 2008) or to inap-
propriate valorization of biodiversity and low yields in
artificial breeding projects (Bartley et al. 2000; Frankham
et al. 2004; Meldgaard et al. 2007).
For the genus Pseudoplatystoma, the wide distribution of
some species in major river basins of South America might
mask the existence of cryptic species. According to Bui-
trago-Suarez and Burr (2007), only two species of Pseudo-
platystoma are distributed in the Peruvian Amazon: P.
tigrinum and P. punctifer (formerly P. fasciatum, whose
geographical distribution would be restricted to the Guyana
shield). However, independent molecular analyses using
mtDNA (Torrico et al. 2009; Carvalho-Costa et al. 2011) and
nDNA (Carvalho-Costa et al. 2011) could not separate P.
fasciatum and P. punctifer. Consistently, here, the GenBank
Guyana sequence of P. fasciatum was nested inside the P.
punctifer clade (cluster-1), supporting the hypothesis of
conspecific status for these two taxa. The present study
revealed the genetic differentiation of two taxa within P.
punctifer, corroborated by both nDNA and mtDNA analyses.
An intra specific structure in P. punctifer may be explained
by the existence of geographic populations mixed up during
sampling at the Iquitos market, or populations isolated by
spawning migrations (homing behaviour) but naturally
mixed in fishing area. Such hypotheses, however, are unli-
kely because no scientific evidence ever suggested a homing
behaviour in Pseudoplatystoma species and because in all
previous studies, using both mitochondrial and nuclear
markers, their intra specific structure appeared very weak or
nonexistent at much larger geographic scales (Torrico et al.
2009, Carvalho-Costa et al. 2011) than in the present study. It
must be pointed out that the sampling area, a few hundred
kms around Iquitos, actually represents a unified hydro-
graphical network without physical barriers (sympatric area)
for migrating species such as Pseudoplatystoma spp. A more
plausible hypothesis explaining the presence of two P.
punctifer taxa would be the existence of two species or
incipient species within P. punctifer. This hypothesis is
supported by the differentiation in two clusters within P.
punctifer, evidenced for the nuclear DNA by 1- the AFC, 2-
the maximum likelihood analysis (Partition ML) and 3- by
the Bayesian analysis (Structure). It is also partially sup-
ported for the mitochondrial DNA (Control Region
sequencing) with the haplotypes of the two clusters distrib-
uted in two monophyletic clades (excepted for only 3 hap-
lotypes). This differentiation is quantified by high Fst values,
indicating low or nonexistent gene flow between the two
clusters, as expected between species, and by the existence of
clear distinctive phenotypic characters (stripe patterns) (see
Harrington and Near 2012). On the other hand, the significant
Fis values observed within P. punctifer cluster-2 and P.
tigrinum samples could result from a Wahlund effect (Hartl
and Clark 1997) caused by sampling, at the Iquitos market,
specimens originating from differentiated genetic popula-
tions within these taxa.
Interestingly, Castelnau (1855) described a Platystoma
punctifer from the Amazon basin with a morphology and
color pattern (absence of black stripes) extremely similar to
the P. punctifer cluster-2 identified in the present study
(Fig. 3d). It must be pointed out here that although cluster-2
is intentionally over-represented (because of the sampling
design) in our sampling, it is much less abundant than clus-
ter-1 (with black stripes) in nature (pers. obs.). In their
revision of the genus, Buitrago-Suarez and Burr (2007)
nonetheless had access to specimens of both P. punctifer
cluster-1 (they showed a picture of cluster-1, identified as P.
punctifer from the Iquitos area: Figure 15) and cluster-2
(they showed the original plate of Castelnau (1855) as
illustration of P. punctifer: Figure 21). Surprisingly, they
analyzed them as a single group designated as P. punctifer.
This accidental admixture of two species under P. punctifer
might have led Buitrago-Suarez and Burr (2007) to errone-
ously consider that P. fasciatum is not present in the Amazon
but only restricted to the Guyanas, and to consider that only
P. punctifer is present in the Amazon basin. This could
account for why three independent molecular studies (Tor-
rico et al. 2009; Carvalho-Costa et al. 2011; present study)
were not able to genetically differentiate between P. fasci-
atum and the P. punctifer with black and white stripes (our
cluster-1, and the most abundant in nature) described in
Buitrago-Suarez and Burr (2007). From the available data, it
appears that P. fasciatum might correspond to our cluster-1
and that the species described by Castelnau (1855) as
Platystoma punctifer might correspond to our cluster-2
(Fig. 3). Further morphological analyses by taxonomists are
obviously needed to confirm this hypothesis and to try and
find consistency between morphological and molecular data.
In any case, our results clearly demonstrate that three species
of Pseudoplatystoma inhabit the Amazon basin.
Evolutionary considerations
Considering a mean nucleotide substitution rate of 0.62 %
per site per million years for the CR (Torrico et al. 2009),
based on the separation of the Magdalena, Amazon and
Parana rivers 11.8 Myrs ago (Hoorn et al. 1995; Lundberg
1998), the divergence time among the three sympatric
species corresponding to P. tigrinum, P. punctifer cluster-1
and cluster-2 would be: 1.5 Myrs between P. punctifer
cluster 1 and cluster-2, 3.4 Myrs between P. tigrinum and P.
punctifer cluster-1, and 4.1 Myrs between P. tigrinum and
P. punctifer cluster-2. Taking into account this molecular
Genetica
123
dating, the three species could have evolved during the
Miocene under allopatric speciation scenarios related to
fragmentation barriers, such as paleoarchs, aquatic refuges,
or marine incursions (reviews in Hubert and Renno 2006;
Hubert et al. 2007; Albert and Reis 2011). Alternatively,
species may have diverged through ecological speciation, as
observed in some piranha species (Hubert et al. 2008a). P.
tigrinum and the black-striped P. punctifer (cluster-1) are
known to have different habitat requirements: the former
being more frequent in lentic, open environments, whereas
the second favors structured (logs, wood sticks, vegetated
area) lotic conditions (Reid 1983; Loubens and Panfili
2000). Local fishermen call the species lacking the black-
stripes (cluster-2), the doncella ‘‘playera’’ or ‘‘beach’’
doncella, as they usually catch it on open sandy or muddy
banks of the white-water river channels. The three sym-
patric Pseudoplatystoma species therefore seem to have
specific habitat preferences that might have contributed in
driving their speciation. Detailed ecological studies, how-
ever, are needed to confirm this hypothesis.
Distribution of the species without black-stripe,
corresponding to P. punctifer cluster-2 (potentially
Platystoma punctifer castelnau 1855)
This species was observed in Central Amazonia in Santa-
rem, Brazil by two independent sources: F. Carvajal
(unpublished data) and Barthem and Goulding (1997, the
photo on page 21 shows a specimen caught in Santarem,
M. Goulding, pers. com.) and Manaus (pers. obs.). It was
also observed in several localities from the Peruvian
Amazon: in the Loreto region (present study), in the
Maranon sub-basin, in the Putumayo River (unpublished
data) and in the Ucayali region, in the Ucayali River
(picture top right, page 178 in Barthem and Goulding 2007)
and in the Pachitea River (Ortega H. pers. com.). If our
hypothesis that it corresponds to Platystoma punctifer
(Castelnau 1855) is valid, then it must be pointed out that
the Holotype (MNHN 1582) comes from an unknown
locality in Brazil (Buitrago-Suarez and Burr 2007).
Therefore, although less abundant than the black-striped
species (cluster-1, potentially P. fasciatum), the species
without black stripes appears relatively widespread along
the main axis of the Amazon River. Despite extensive
sampling in the main river basins of the Bolivian Amazon
(Upper Madera River), however, it was never observed by
the authors of the present study.
Remark about the effectiveness of the COI barcoding
marker for species identification
Gene sequences of COI region have been chosen for a fast,
standardized and precise labeling or identification of the
living world (DNA barcoding). Many studies support the
effectiveness of this mt-DNA fragment in the labeling and
identification of fish species (Hebert et al. 2004a, b; Hubert
et al. 2008b; Steinke et al. 2009; Ardura et al. 2010; Aquilino
et al. 2011; Asgharian et al. 2011; Lakra et al. 2011; Zhang
and Hanner 2011) and processed fish products (Ardura et al.
2010; Wong et al. 2011). In some instances, however, closely
related species may have diverged too recently to be unam-
biguously separated by COI barcode sequences (Toffoli et al.
2008; Steinke et al. 2009; Serra-Pereira et al. 2010; Smith
et al. 2011). In the case of P. punctifer in the Peruvian
Amazon, the much lower nucleotide diversity (p) of COI
compared to CR (Table 2) probably explains the inability to
separate the two species evidenced by the nDNA analysis
and the topology of the CR tree. Such difficulties associated
with COI illustrate the need to consider more than one region
of the mitochondrial genome to discriminate closely related
species or cryptic species, as suggested in earlier studies
(Ward et al. 2009; Smith et al. 2011). Additionally, mor-
phological, ecological, physiological, environmental and
life-history traits in natural or captive populations should
also be taken into account, as they may provide valuable
information on the taxonomical limits of the species in quest
(Romer 2001; Romer and Beisenherz 2006).
The recent speciation suggested in P. punctifer could
also explain retention of ancestral polymorphism or
mtDNA introgression from cluster-1 to cluster-2, explain-
ing that 4 specimens identified as P. punctifer cluster-2 by
their nDNA and phenotypic characters were nested in
1-cluster P. punctifer clade.
Implications for natural resource management
(conservation, fishing and fish farming)
Pseudoplatystoma species are among the top predators of
the Amazon basin (Barthem and Goulding 1997, 2007) and
as such, participate in maintaining equilibrium of the food
chains (Winemiller and Jepsen 1998; Lucas and Baras
2001; Winemiller 2005). Modifying the abundance of top
predators frequently leads to profound ecosystem altera-
tions through cascading effects (Pace et al. 1999; Myers
et al. 2007). Hence, the management and conservation of
Pseudoplatystoma species and other large Pimelodid cat-
fish are of utmost importance in the Amazonian ecosys-
tems. Indeed, the underestimation of species diversity with
the confusion of species can have prejudicial effects, by
generating inappropriate decisions. Precise information of
life history strategies of species in relation with fishing
pressure is necessary to define management and conser-
vation policies. Thus, confusing the life history traits of
two or more species hampers a proper management of each
of them. In fish farming, misidentified species can be
unintentionally hybridized, which may result in strong
Genetica
123
efficiency loss in the domestication process, with
decreasing reproductive success (infertility), reducing
adaptive value (outbreeding depression) and disappearance
of unique evolutionary units in the wild in case of
restocking (Bartley et al. 2000; Frankham et al. 2004;
Meldgaard et al. 2007). Until recently, the joint IRD-IIAP
scientific program aiming at developing the aquaculture of
doncella in the Peruvian Amazon (Nunez et al. 2011; Baras
et al. 2011a, b), ignored this possible admixture between
Pseudoplatystoma species. Fortunately the present study
has permitted to verify that only P. punctifer cluster-1 (the
most abundant in nature) was present in our breeding
stocks. From now on, aquaculture managers wishing to
develop the Doncella production should use the absence or
presence of lateral black stripe, a very easily diagnosed
character, to limit the risks of mixing the two species.
Acknowledgments This study was carried out within the Labora-
toire Mixte International ‘‘Evolution et Domestication de l’Ichtyofa-
une Amazonienne’’ (LMI-EDIA) developed by the Instituto de
Investigaciones de la Amazonia Peruana (IIAP) and the Institut
Francais de Recherche pour le Developpement (IRD), both of which
are part of the network Red de Investigacion sobre la Ictiofauna
Amazonica (RIIA http://www.riiaamazonia.org/). Financial support
was provided by INCAGRO (Inovacion para el Agro Peruano, sub-
project ‘‘Breeding and intensive production of fingerlings of Doncella
Pseudoplatystoma fasciatum (Linnaeus, 1776) in the Peruvian Ama-
zon’’), IIAP and IRD.
References
Agnese J-F, Zentz F, Legros O, Sellos D (2006) Phylogenetic
relationships and phylogeography of the Killifish species of the
subgenus Chromaphyosemion (Radda, 1971) in West Africa,
inferred from mitochondrial DNA sequences. Mol Phylogenet
Evol 40:332–346
Agudelo E, Salinas Y, Sanchez CL, Munoz-Sosa DL, Alonso JC,
Arteaga ME, Rodriguez OJ, Anzola NR, Acosta LE, Nunez M,
Valdes H (2000) Bagres de la Amazonia Colombiana: un
Recurso sin Fronteras. SINCHI. Programa de Ecosistemas
Acuaticos. Editorial Scipto Ltda.: Santa Fe de Bogota D.C.,
Colombia
Akaike H (1973) Information theory and an extension of the
maximum likelihood principle. In Petrov BN, Csaki F (eds)
2nd international symposium on information theory. Akademia
Kiado, Budapest, pp 267–281
Albert JS, Reis RE (eds) (2011) Historical biogeography of
Neotropical freshwater fishes. University of California Press,
Berkeley
Aquilino S, Tango J, Fontanilla I, Pagulayan R, Basiao Z, Ong P,
Quilang P (2011) DNA barcoding of the ichthyofauna of Taal
Lake, Philippines. Mol Ecol Resour 11:612–619
Ardura A, Pola IG, Ginuino I, Gomes V, Garcia-Vasquez E (2010)
Application of barcoding to Amazonian commercial fish label-
ling. Food Res Int 43:1549–1552
Asgharian H, Sahafi HH, Ardalan AA, Shekarriz S, Elahi E (2011)
Cytochrome c oxidase subunit 1 barcode data of fish of the
Nayband National Park in the Persian Gulf and analysis using
meta-data flag several cryptic species. Mol Ecol Resour 11:
461–472
Baras E, Montalvan Naranjos GV, Silva del Aguila DV, Koo FC,
Dugue R, Chavez C, Duponchelle F, Renno J-F, Garcıa-Davila
CC, Nunez J (2011a) Ontogenetic variation of food intake and
gut evacuation rate in larvae of the doncella Pseudoplatystoma
punctifer, as measured using a non-destructive method. Aquac
Res 24:379–390
Baras E, Silva del Aguila DV, Montalvan Naranjos GV, Dugue R,
Koo FC, Duponchelle F, Renno J-F, Garcıa-Davila C, Nunez J
(2011b) How many meals a day to minimize cannibalism when
rearing larvae of the Amazonian catfish Pseudoplatystoma
punctifer? The cannibal’s point of view. Aquat Living Resour
24:379–390
Barthem R, Goulding M (1997) The catfish connection. Ecology,
migration and conservation of Amazon predators. Columbia
University Press, New York
Barthem R, Goulding M (2007) Un ecosistema inesperado: la
Amazonıa revelada por la pesca. Museu Paraense Emilio Goeldi,
Amazon Conservation Association (ACA), Lima
Bartley DM, Rana K, Immink AJ (2000) The use of inter-specific
hybrids in aquaculture and fisheries. Rev Fish Biol Fisher
10:325–337
Belkhir K, Bonhomme F (2002) PARTITION ML: a maximum
likelihood estimation of the best partition of a sample into
panmictic units. Universite Montpellier 2, Montpellier, France
Belkhir K, Borsa P, Chikhi L, Raufaste N, Bonhomme F (2004)
GENETIX 4.05, logiciel sous Windows TM pour la genetique
des populations. Montpellier, France: Laboratoire Genome,
Populations, Interactions, CNRS UMR 5000, Universite Mont-
pellier II
Buitrago-Suarez UA, Burr BM (2007) Taxonomy of the catfish genusPseudoplatystoma Bleeker (Siluriformes: Pimelodidae) with
recognition of eight species. Zootaxa 1512:1–38
Canas CM (2000) Evaluacion de los recursos pesqueros en la
Provincia de Tambopata, Madre de Dios (Julio 1995-Diciembre
1998): Conservacion Internacional-Peru, p 68
Carvalho-Costa LF, Piorski NM, Willis SC, Galetti PM Jr, Ortı G
(2011) Molecular systematics of the neotropical shovelnose
catfish genus Pseudoplatystoma Bleeker 1862 based on nuclear
and mtDNA markers. Mol Phylogenet Evol 59:177–194
Castelnau Fd (1855) Animaux nouveaux ou rares recueillis pendant
l’expedition dans les parties centrales de l’Amerique du Sud :de
Rio de Janeiro a Lima, et de Lima au Para : executee par ordre
du gouvernement Francais pendant les annees 1843 a 1847.
P. Bertrand, Parıs
Chong SSC, Khoo HW (1987) Abbreviated larval development of the
freshwater prawn, Macrobrachium pilimanus (De Man, 1879)
(Decapoda, Palaemonidae), reared in the laboratory. J Nat Hist
21:763–774
Doyle JJ, Doyle JL (1987) A rapid DNA isolation procedure for small
quantities of fresh leaf tissue. Phytochem Bull 19:11–15
Frankham R, Ballou J, Briscoe D (2004) A primer of conservation
genetics. University of Cambridge Press, Cambridge
Garcia A, Tello S, Vargas G, Duponchelle F (2009) Patterns of
commercial fish landings in the Loreto region (Peruvian Amazon)
between 1984 and 2006. Fish Physiol Biochem 35:53–67
Guindon S, Gascuel O (2003) A simple, fast, and accurate algorithm
to estimate large phylogenies by maximum likelihood. Syst Biol
52:696–704
Hall TA (1999) BioEdit: a user-friendly biological sequence align-
ment editor and analysis program for Windows 95/98/NT. Nucl
Acids Symp Ser 41:95–98
Harrington RC, Near TJ (2012) Phylogenetic and coalescent strate-
gies of species delimitation in snubnose darters (Percidae:
Etheostoma). Syst Biol 61:63–79
Hartl D, Clark A (1997) Principles of population genetics. Sinauer
Associates, Inc. Publishers Sunderland, Massachussetts
Genetica
123
Hebert PDN, Penton EH, Burns JM, Janzen DH, Hallwachs W
(2004a) Ten species in one: DNA barcoding reveals cryptic
species in the Neotropical skipper butterfly Astraptes fulgerator.
P Natl Acad Sci USA 101:14812–14817
Hebert PDN, Stoeckle MY, Zemlak TS, Francis CM (2004b)
Identification of birds through DNA barcodes. Public Libr Sci
2:1657–1663
Hoorn C, Guerreo J, Sarmiento GA, Lorente MA (1995) Andean
tectonics as a cause for changing drainage patterns in Miocene
northern South America. Geology 23:237–240
Hubert N, Renno J-F (2006) Historical biogeography of South
American freshwater fishes. J Biogeogr 33(8):1414–1436
Hubert N, Duponchelle F, Nunez J, Paugy D, Garcia-Davila C, Renno
J-F (2007) Phylogeography of the piranhas genera Serrasalmus
and Pygocentrus implications for the diversification of the
Neotropical Ichtyofauna. Mol Ecol 16:2115–2136
Hubert N, Hanner R, Holm E, Mandrak NE, Taylor E, Burridge M,
Watkinson D, Dumont P, Curry A, Bentzen P, Zhang J, April J,
Bernatchez L (2008a) Identifying Canadian freshwater fishes
through DNA barcodes. PLoS ONE 3:e2490
Hubert N, Torrico JP, Bonhomme F, Renno J-F (2008b) Species
polyphyly and mtDNA introgression among three Serrasalmus
sister-species. Mol Phylogenet Evol 46:375–381
Kirkpatrick S, Gelatt CD, Vecchi MP (1983) Optimization by
simulated annealing. Science. New Ser 220(4598):671–680
Lakra WS, Verma MS, Goswami M, Lal KK, Mohindra V, Punia P,
Gopalakrishnan A, Singh KV, Ward RD, Hebert P (2011) DNA
barcoding Indian marine fishes. Mol Ecol Resour 11:60–71
Librado P, Rozas J (2009) DnaSP v5: a software for comprehensive
analysis of DNA polymorphism data. Bioinformatics 25:1451–1452
Loubens G, Panfili J (2000) Biologie de Pseudoplatystoma fasciatum
et P. tigrinum (Teleostei: Pimelodidae) dans le bassin du
Mamore. Ichthyol Explor Freshw 11:13–34
Lucas MC, Baras E (2001) Migration of freshwater fishes. Blackwell
Science Ltd., Oxford
Lundberg JG (1998) The temporal context for diversification of
Neotropical fishes. In: Malabarba LR, Reis RE, Vari RP, Lucena
CAS, Lucena ZMS (eds) Phylogeny and classification of
Neotropical fishes. EDIPUCRS, Porto Alegre
Mayr E (1942) Systematics and the origin of species, from the view
point of a zoologist. Columbia University Press, USA
Meldgaard T, Crivelli A, Jesensek D, Poizat G, Rubin J-F, Berrebi P
(2007) Hybridization mechanisms between the endangered
marble trout (Salmo marmoratus) and the brown trout (Salmo
trutta) as revealed by in-stream experiments. Biol Conserv
136:602–611
Myers RA, Baum JK, Shepherd TD, Powers SP, Peterson CH (2007)
Cascading effects of the loss of apex predatory sharks from a
coastal ocean. Science 315:1846–1850
Nunez J, Castro D, Fernandez C, Dugue R, Chu-Koo F, Duponchelle
F, Garcıa C, Renno J-F (2011) Hatching rate and larval growth
variations in Pseudoplatystoma punctifer: maternal and paternal
effects. Aquac Res 42:764–775
Pace ML, Cole JJ, Carpenter SR, Kitchell JF (1999) Trophic cascades
revealed in diverse ecosystems. Trends Ecol Evol 14:483–488
Paradis E (2006) Analysis of phylogenetics and evolution with R.
Springer, New York
Paradis E, Claude J, Strimmer K (2004) APE: analyses of phylog-
enetics and evolution in R language. Bioinformatics 20:289–290
Pritchard JK, Stephens M, Donnelly P (2000) Inference of population
structure using multilocus genotype data. Genetics 155:945–959
Reid S (1983) La biologıa de los bagres rayados Pseudoplatystoma
fasciatum y P. tigrinum en la cuenca del rio Apure, Venezuela.
Revis UNELLEZ Cien Tecnol 1:13–41
Renno J-F, Hubert N, Torrico JP, Duponchelle F, Nunez J, Garcia-
Davila C, Willis S, Desmarais E (2006) Phylogeography of
Cichla (Cichlidae) in the Upper Madera basin (Bolivian Ama-
zon). Mol Phylogenet Evol 41:503–510
Revaldaves E, Pereira L, Foresti F, Oliveira C (2005) Isolation and
characterization of microsatellite loci in Pseudoplatystoma
corruscans (Siluriformes: Pimelodidae). Mol Ecol Notes
5:463–465
Rocha-Olivares A, Fleeger JW, Foltz DW (2001) Decoupling of
molecular and morphological evolution in deep lineages of a
meiobenthic harpacticoid copepod. Mol Biol Evol 18(6):
1088–1102
Romer U (2001) Influence of temperature on fertility, growth rates,
and reproductive success on selected species of Apistogramma
(Teleostei, Cichlidae). Verhandlungen der Gesellschaft fuer
Ichthyologie 2:87–106
Romer U (2006) Cichlid Attlas Volume 2. Mergus Verlag, Melle
Romer U, Beisenherz W (2006) Are sexual behaviour and other traits
of behaviour in Apistogramma species (Teleostei: Cichlidae)
suitable for taxonomic classification? In: Greven H, Riehl R
(eds) Verhalten der Aquarienfische 2. Tetra-Verlag, Berlin,
pp 147–158
Romer U, Hahn I (2008) Apistogramma barlowi: description of a new
species of facultative mouth-breeding cichlid species (Teleostei:
Perciformes: Geophaginae) from Northern Peru. Vert Zool
58:49–66
Serra-Pereira B, Moura T, Griffiths A, Gordo L, Figueiredo I (2010)
Molecular barcoding of skates (Chondrichthyes: Rajidae) from
the southern Northeast Atlantic. Zool Scr 40:76–84
Smith PJ, Steinke D, McMillan PJ, Stewart AL, McVeagh SM, Diaz
de Astarloa JM, Welsford D, Ward RD (2011) DNA barcoding
highlights a cryptic species of grenadier Macrourus in the
Southern Ocean. J Fish Biol 78:355–365
Smouse PE, Waples RS, Tworek JA (1990) A mixed fishery model
for use with incomplete source population data. Can J Fish Aquat
Sci 47:620–634
Steinke D, Zemlak TS, Hebert PDN (2009) Barcoding Nemo: DNA-
based identifications for the ornamental fish trade. PLoS ONE
4:e6300
Tello S, Bayley PB (2001) La pesquerıa comercial de Loreto con
enfasis en el analisis de la elacion entre captura y esfuerzo
pesquero de la flota comercial de Iquitos, cuenca del Amazonas
(Peru). Folia Amazonica 12:123–139
Toffoli D, Hrbek T, Goes de Araujo ML, Pinto de Almeida M,
Charvet-Almeida P, Farias I (2008) A test of the utility of DNA
barcoding in the radiation of the freshwater stingray genus
Potamotrygon (Potamotrygonidae, Myliobatiformes). Genet Mol
Biol 31(1 suppl):324–336
Torrico J-P, Hubert N, Desmarais E, Duponchelle F, Nunez Rodri-
guez J, Montoya-Burgos J, Garcia-Davila C, Carvajal F, Grajales
AA, Bonhomme F, Renno J-F (2009) Molecular phylogeny of
the Pseudoplatystoma (Bleeker, 1862): biogeographic and evo-
lutionary implications. Mol Phylogenet Evol 51:588–594
Ward RD, Hanner R, Hebert PDN (2009) The campaign to DNA
barcode all fishes, FISHBOL. J Fish Biol 74:329–356
Winemiller KO (2005) Floodplain river food webs: generalizations
and implications for fisheries management. In: Welcomme RL,
Petr T (eds) Proceedings of the Second International Symposium
on the Management of Large Rivers for Fisheries Phnom Penh.
Mekong River Commission, Cambodia, pp 285–312
Winemiller KO, Jepsen DB (1998) Effects of seasonality and fish
movements on tropical river food webs. J Fish Biol 53:267–296
Wong LL, Peatman E, Lu J, Kucuktas H, He S, Zhou C, Na-nakorn U,
Liu Z (2011) DNA barcoding of catfish: species authentication
and phylogenetic assessment. PLoS ONE 6:e17812
Zhang JB, Hanner R (2011) DNA barcoding is a useful tool for the
identification of marine fishes from Japan. Biochem Syst Ecol
39:31–42
Genetica
123
Copyright © 2022 FDOKUMEN