Molecular phylogeny of the armored catfish family Callichthyidae (Ostariophysi, Siluriformes
MOLECULARPHYLOGENETICSAND
Molecular Phylogenetics and Evolution 32 (2004) 152–163
EVOLUTION
www.elsevier.com/locate/ympev
Molecular phylogeny of the armored catfish familyCallichthyidae (Ostariophysi, Siluriformes)
Cristiane Kioko Shimabukuro-Dias,a Claudio Oliveira,a,* Roberto E. Reis,b
and Fausto Forestia
a Departamento de Morfologia, Instituto de Biociencias, Universidade Estadual Paulista, 18618-000 Botucatu, SP, Brazilb Laborat�orio de Ictiologia, Pontif�ıcia Universidade Cat�olica do Rio Grande do Sul, Av. Ipiranga, 6681, Caixa Postal 1429,
90619-900 Porto Alegre, RS, Brazil
Received 17 June 2003; revised 30 October 2003
Available online 17 January 2004
Abstract
The family Callichthyidae comprises eight genera of fishes widely distributed across the Neotropical region. In the present study,
sequences of the mitochondrial genes 12S rRNA, 16S rRNA, ND4, tRNAHis, and tRNASer were obtained from 28 callichthyid
specimens. The sample included 12 species of Corydoras, three species of Aspidoras, two species of Brochis, Dianema, Lepthoplo-
sternum, and Megalechis, and two local populations of Callichthys and Hoplosternum. Sequences of Nematogenys inermis (Nema-
togenyidae), Trichomycterus areolatus, and Henonemus punctatus (Trichomycteridae), Astroblepus sp. (Astroblepidae), and
Neoplecostomus paranensis, Delturus parahybae, and Hemipsilichthys nimius (Loricariidae) were included as the outgroup. Phylo-
genetic analyses were performed by using the methods of maximum parsimony and maximum likelihood. The results of almost all
analyses were very similar. The family Callichthyidae is monophyletic and comprises two natural groups: the subfamilies Co-
rydoradinae (Aspidoras, Brochis, and Corydoras) and Callichthyinae (Callichthys, Dianema, Hoplosternum, Lepthoplosternum, and
Megalechis), as previously demonstrated by morphological studies. The relationships observed within these subfamilies are in
several ways different from those previously proposed on the basis of morphological data. Molecular results were compared with the
morphologic and cytogenetic data available on the family.
� 2003 Elsevier Inc. All rights reserved.
Keywords: Molecular phylogeny; Callichthyidae; Systematic; Fish; Evolution
1. Introduction
The order Siluriformes is a very large fish group,widely
distributed across the tropical regions of the world (Bur-gess, 1989; Ferraris, 1998; Teugels, 1996). The number of
Siluriformes species known is about 2600, but it may ex-
ceed 3000 (Burgess, 1989; Ferraris, 1998; Nelson, 1994;
Teugels, 1996). Their impressive ecological and evolu-
tionary diversity is reflected in many studies of the group
(Fink and Fink, 1996; de Pinna, 1998).
Phylogenetic studies have shown that the families
Callichthyidae, Nematogenyidae, Trichomycteridae, Sco-loplacidae, Astroblepidae, and Loricariidae comprise the
* Corresponding author. Fax: +55-14-6821-3744.
E-mail address: [email protected] (C. Oliveira).
1055-7903/$ - see front matter � 2003 Elsevier Inc. All rights reserved.
doi:10.1016/j.ympev.2003.11.010
largest monophyletic group of catfishes in the neotrop-
ics, the superfamily Loricarioidea (de Pinna, 1998). The
family Callichthyidae includes 177 species currently
grouped in eight genera distributed throughout all majorriver basins of cis-Andean South America and trans-
Andean Colombia and Panama (Reis, 1998b, 2003).
They are easily recognized by the bony armor formed by
two longitudinal series of dermal plates that almost
completely protect their bodies. The phylogenetic rela-
tionships among the genera of the family have been re-
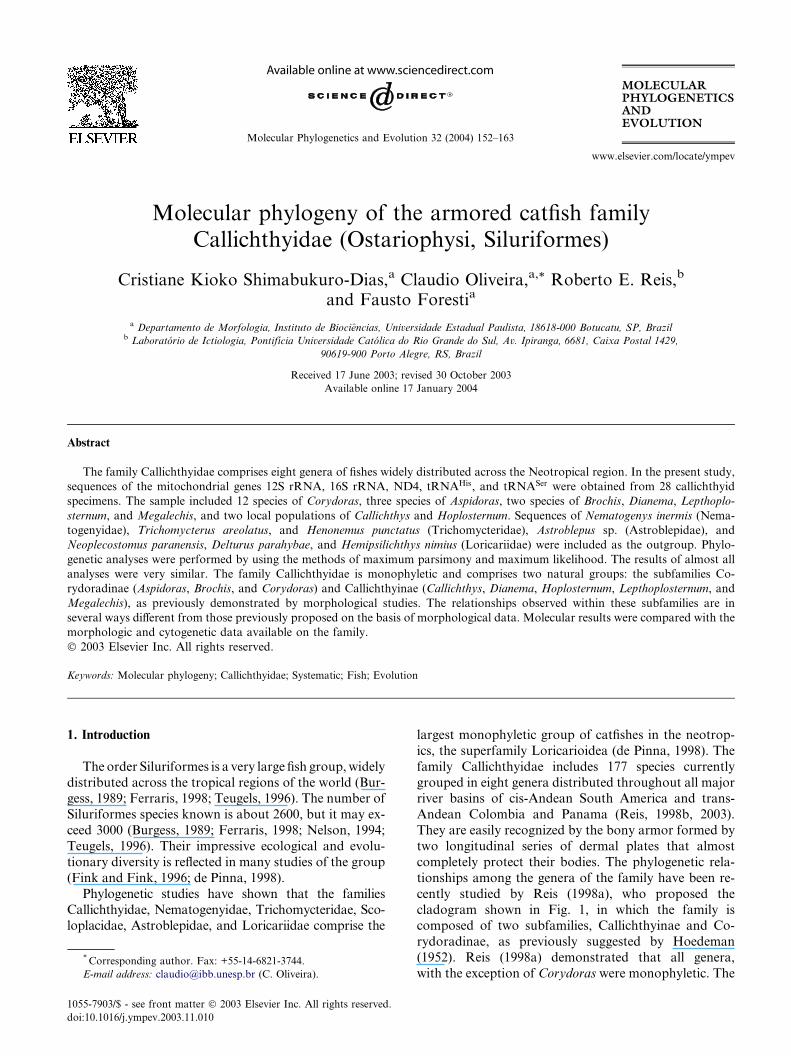
cently studied by Reis (1998a), who proposed the
cladogram shown in Fig. 1, in which the family iscomposed of two subfamilies, Callichthyinae and Co-
rydoradinae, as previously suggested by Hoedeman
(1952). Reis (1998a) demonstrated that all genera,
with the exception of Corydoras were monophyletic. The
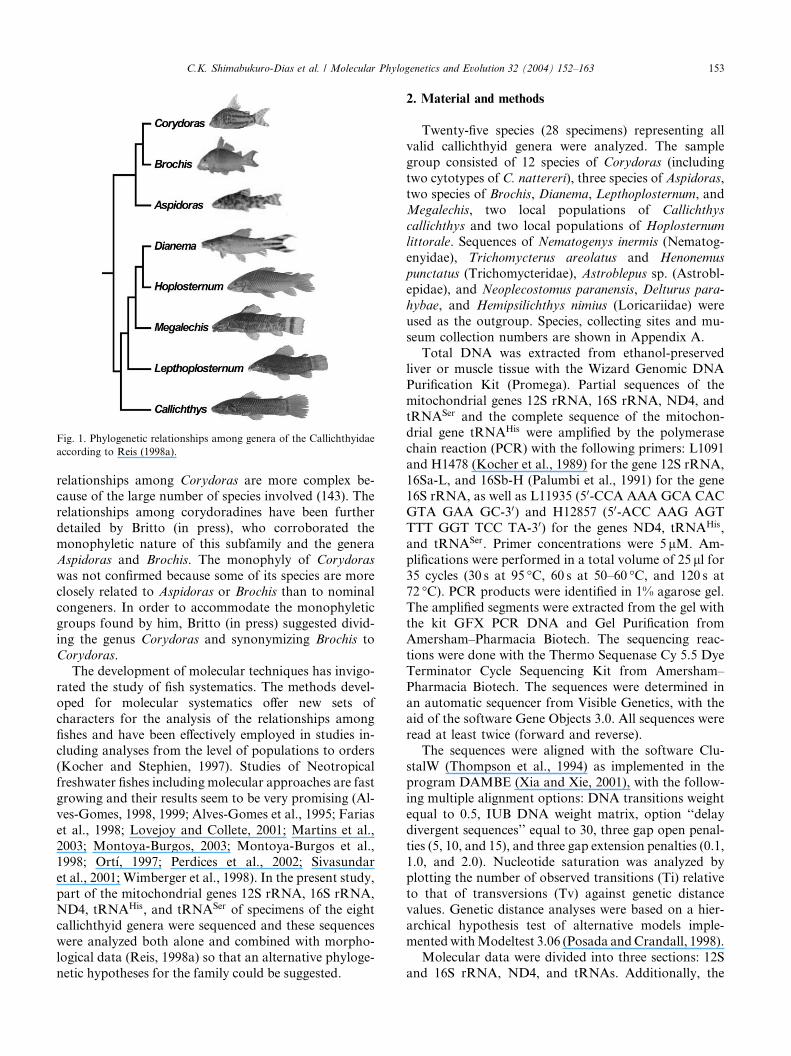
Fig. 1. Phylogenetic relationships among genera of the Callichthyidae
according to Reis (1998a).
C.K. Shimabukuro-Dias et al. / Molecular Phylogenetics and Evolution 32 (2004) 152–163 153
relationships among Corydoras are more complex be-cause of the large number of species involved (143). The
relationships among corydoradines have been further
detailed by Britto (in press), who corroborated the
monophyletic nature of this subfamily and the genera
Aspidoras and Brochis. The monophyly of Corydoras
was not confirmed because some of its species are more
closely related to Aspidoras or Brochis than to nominal
congeners. In order to accommodate the monophyleticgroups found by him, Britto (in press) suggested divid-
ing the genus Corydoras and synonymizing Brochis to
Corydoras.
The development of molecular techniques has invigo-
rated the study of fish systematics. The methods devel-
oped for molecular systematics offer new sets of
characters for the analysis of the relationships among
fishes and have been effectively employed in studies in-cluding analyses from the level of populations to orders
(Kocher and Stephien, 1997). Studies of Neotropical
freshwater fishes including molecular approaches are fast
growing and their results seem to be very promising (Al-
ves-Gomes, 1998, 1999; Alves-Gomes et al., 1995; Farias
et al., 1998; Lovejoy and Collete, 2001; Martins et al.,
2003; Montoya-Burgos, 2003; Montoya-Burgos et al.,
1998; Ort�ı, 1997; Perdices et al., 2002; Sivasundaret al., 2001; Wimberger et al., 1998). In the present study,
part of the mitochondrial genes 12S rRNA, 16S rRNA,
ND4, tRNAHis, and tRNASer of specimens of the eight
callichthyid genera were sequenced and these sequences
were analyzed both alone and combined with morpho-
logical data (Reis, 1998a) so that an alternative phyloge-
netic hypotheses for the family could be suggested.
2. Material and methods
Twenty-five species (28 specimens) representing all
valid callichthyid genera were analyzed. The sample
group consisted of 12 species of Corydoras (including
two cytotypes of C. nattereri), three species of Aspidoras,
two species of Brochis, Dianema, Lepthoplosternum, and
Megalechis, two local populations of Callichthys
callichthys and two local populations of Hoplosternum
littorale. Sequences of Nematogenys inermis (Nematog-
enyidae), Trichomycterus areolatus and Henonemus
punctatus (Trichomycteridae), Astroblepus sp. (Astrobl-
epidae), and Neoplecostomus paranensis, Delturus para-
hybae, and Hemipsilichthys nimius (Loricariidae) were
used as the outgroup. Species, collecting sites and mu-
seum collection numbers are shown in Appendix A.
Total DNA was extracted from ethanol-preservedliver or muscle tissue with the Wizard Genomic DNA
Purification Kit (Promega). Partial sequences of the
mitochondrial genes 12S rRNA, 16S rRNA, ND4, and
tRNASer and the complete sequence of the mitochon-
drial gene tRNAHis were amplified by the polymerase
chain reaction (PCR) with the following primers: L1091
and H1478 (Kocher et al., 1989) for the gene 12S rRNA,
16Sa-L, and 16Sb-H (Palumbi et al., 1991) for the gene16S rRNA, as well as L11935 (50-CCA AAA GCA CAC
GTA GAA GC-30) and H12857 (50-ACC AAG AGT
TTT GGT TCC TA-30) for the genes ND4, tRNAHis,
and tRNASer. Primer concentrations were 5 lM. Am-
plifications were performed in a total volume of 25 ll for35 cycles (30 s at 95 �C, 60 s at 50–60 �C, and 120 s at
72 �C). PCR products were identified in 1% agarose gel.
The amplified segments were extracted from the gel withthe kit GFX PCR DNA and Gel Purification from
Amersham–Pharmacia Biotech. The sequencing reac-
tions were done with the Thermo Sequenase Cy 5.5 Dye
Terminator Cycle Sequencing Kit from Amersham–
Pharmacia Biotech. The sequences were determined in
an automatic sequencer from Visible Genetics, with the
aid of the software Gene Objects 3.0. All sequences were
read at least twice (forward and reverse).The sequences were aligned with the software Clu-
stalW (Thompson et al., 1994) as implemented in the
program DAMBE (Xia and Xie, 2001), with the follow-
ing multiple alignment options: DNA transitions weight
equal to 0.5, IUB DNA weight matrix, option ‘‘delay
divergent sequences’’ equal to 30, three gap open penal-
ties (5, 10, and 15), and three gap extension penalties (0.1,
1.0, and 2.0). Nucleotide saturation was analyzed byplotting the number of observed transitions (Ti) relative
to that of transversions (Tv) against genetic distance
values. Genetic distance analyses were based on a hier-
archical hypothesis test of alternative models imple-
mentedwithModeltest 3.06 (Posada andCrandall, 1998).
Molecular data were divided into three sections: 12S
and 16S rRNA, ND4, and tRNAs. Additionally, the

154 C.K. Shimabukuro-Dias et al. / Molecular Phylogenetics and Evolution 32 (2004) 152–163
published morphological data generated by Reis (1998a)were used. Since the present study was based on a spe-
cies level and the study by Reis (1998a) was mostly
conducted at a genus level, the morphological data re-
garding the genera with multiple species were replicated
(i.e., terminal taxa from the same genera were coded
identically). A similar procedure was successfully em-
ployed in a broad study of Hymenoptera (Dowton and
Austin, 2001). The incongruence length difference (ILD)test (Farris et al., 1995) was used to estimate any dif-
ference in phylogenetic signal among the different
molecular sections and among molecular and morpho-
logical data. The ILD test was performed using PAUP*
beta version 4.0b10 (Swofford, 2002), with 1000 ran-
domized replicates. For each replicate, heuristic searches
with the closest addition sequence option and tree
bisection–reconnection (TBR) branch swamping wereused. All uninformative characters were removed before
the analysis.
Maximum-parsimony (MP) based phylogenetic
analyses were performed using the software PAUP* beta
version 4.0b10 (Swofford, 2002) with heuristic searches
using random addition of sequences and the TBR al-
gorithm. In all analyses the character-state optimization
method employed was the accelerated transformation(ACCTRAN). Parsimony trees were generated using
1:1, 1:2, 1:3, and 2:3 Ti/Tv ratios, considering gaps as
either missing data or a fifth base. Bootstrap resampling
(Felsenstein, 1985) was applied to assess support for
individual nodes using 1000 replicates with 20 random
additions and TBR branch swapping. Decay indexes
(Bremer, 1988) were calculated with SEPAL (Salisbury,
2001).Maximum-likelihood (ML) based phylogenetic rela-
tionships were estimated using the software PAUP* beta
version 4.0b10 (Swofford, 2002). The GTR model
(Yang, 1994) incorporating rate variation (C) and
PINVAR with four C-distributed rate classes (Swofford
et al., 1996) were utilized for all likelihood analyses
based on a hierarchical hypothesis test of alternative
models implemented with Modeltest 3.06 (Posada andCrandall, 1998). The Ti/Tv ratio, gamma shape pa-
rameter, and proportion of non-variant sites were esti-
mated by maximum likelihood from a maximum
parsimony tree. Gaps were considered as missing data.
Bootstrap resampling was applied to assess support for
individual nodes using 100 replicates with 10 random
additions and TBR branch swapping. Additional ML
analyses were conducted with the software MetaPIGAversion 1.0.2b (Lemmon and Milinkovitch, 2002a). This
software implements a heuristic approach, the meta-
population genetic algorithm, involving several popu-
lations of trees that are forced to cooperate in the search
for the optimal tree (Lemmon and Milinkovitch, 2002b).
Analyses were conducted with the default options (one
population of four individuals) using the Hasegawa–
Kishino–Yano (HKY85) nucleotide substitution model(Hasegawa et al., 1985) and 1000 replicates. Consensus
trees were produced with the software TreeExplorer
implemented in MEGA 2.1 (Kumar et al., 2001).
3. Results
The sequences obtained in this study have been de-posited in GenBank under Accession Nos. AY307216–
AY307320 (Appendix A). All sequences were obtained
for all species, with the exception of Lepthoplosternum
tordilho in which the 30 end of the ND4 and the genes
tRNASer and tRNAHis were not sequenced, resulting in
a DNA fragment of 1230 bp.
The nine alignments obtained combining three gap
open penalties (5, 10, and 15) and three gap extensionpenalties (0.1, 1.0, and 2.0) were very similar. Six of the
alignments resulted in an identical matrix with 1614
positions and three alignments resulted in an identical
matrix with 1630 positions. The alignments with 1614
positions were chosen because they were more frequent
and exhibited fewer gap positions. Almost all positions
were very well aligned. However, two sections in the 16S
rRNA gene (with 27 and 8 bp) were difficult to align inall cases, and were excluded from the phylogenetic
analyses. Additionally, in the six alignments with 1614
positions, one section with 5 bp in 12S, and one section
with 4 bp in 16S were also hard to align and therefore
discarded in the phylogenetic analyses. The final matrix
had 1570 bp, from which 811 were conserved, 182 were
phylogenetically uninformative, and 577 were phyloge-
netically informative. The final alignment is availablefrom C. Oliveira upon request.
The percent base composition for sequenced regions
of the L-strand was determined as follows: adenine (A)
31.4; cytosine (C) 25.5; guanine (G) 18.7; and thymine
(T) 24.4. The analysis of these data clearly shows that
the base composition of the L-strand is somewhat A-
rich, similar to that described for several mitochondrial
genes of fishes (Alves-Gomes et al., 1995), lizards(Reeder, 1995), and snakes (Parkinson, 1999). On the
other hand, the base pair composition shows anti-G
bias, characteristic of mitochondrial genes but not of
nuclear genes (Zhang and Hewitt, 1996), as observed in
other fish species (Hrbek et al., 2002; Murphy and
Collier, 1999).
Molecular data were divided in three sections: 12S
and 16S rRNA, ND4, and tRNAs. The transitions/transversions (Ti/Tv) ratio observed was 1.4 for 12S and
16S rRNA, 0.7 for ND4, 3.5 for tRNAs, and 1.0 for the
total data. Fig. 2 shows the results obtained by plotting
transitions and transversions versus genetic distance
(Tamura and Nei, 1993). Linear relationships (coeffi-
cient of determination> 0.85) were found in almost all
analyses, indicating that these data were not saturated.

Fig. 2. Graphics showing the frequency of observed transitions and transversions versus genetic distance (Tamura and Nei, 1993). (A) 12S and 16S
rRNA genes; (B) ND4 gene; (C) tRNAs genes; (D) total molecular data. Transitions are black squares, transversions are open circles.
C.K. Shimabukuro-Dias et al. / Molecular Phylogenetics and Evolution 32 (2004) 152–163 155
The only two regressions which did not showed linear
relationships (coefficient of determination <0.75) were
those related to Ti in the ND4 gene (Fig. 2B) and Tv in
tRNA genes (Fig. 2C), suggesting that these data could
be possibly saturated.
The genetic distance among sequences was estimated
by the GTR model (Yang, 1994) incorporating rate
variation (C) and PINVAR with four C-distributed rateclasses (Swofford et al., 1996) based on a hierarchical
hypothesis test of alternative models implemented with
Modeltest 3.06 (Posada and Crandall, 1998). The mean
values of genetic distance were 0.149� 0.056 (0.000–
0.251) for callichthyids, 0.170� 0.047 (0.000–0.217) for
callichthyines, and 0.091� 0.024 (0.012–0.141) for
corydoradines. The oldest callichthyid fossil known is
Corydoras revelatus from late Paleocene, about 58.5million years ago (Lundberg et al., 1998; Reis, 1998b).
Considering such time as the minimum age of the origin
of Corydoras, the genetic distance among callichthyid
species may be considered low.
The ILD test detected a significant congruence (at the
P < 0:05 level) between molecular and morphological
data (Table 1). On the other hand, a significant incon-
Table 1
Results of incongruence length difference tests (Farris et al., 1994)
ND4 TRNAs Morphological
12S/16S 0.001 0.004 0.532
ND4 — 0.757 0.108
tRNAs — — 0.001
Molecular — — 0.168
Note. Numbers shown are P values. Numbers in bold indicate ILD
test is significant at the P < 0:05 threshold.
gruence (at the P < 0:05 level) was detected in three
pairwise comparisons of the datasets (Table 1). The 12S/
16S dataset was incongruent with both ND4 and tRNA
datasets, and the tRNA dataset was incongruent with
the morphological dataset. Bull et al. (1993) suggested
that incongruent data should not be combined for
phylogenetic analyses. However, Gatesy et al. (1999),
who advocate a ‘‘total evidence’’ methodology, showedthat the combination of incongruent data can increase
the resolution and the support within phylogenetic trees,
revealing if a ‘‘hidden signal’’ is present in the different
datasets. The approach combining putative incongruent
datasets has been recently used (Dowton and Austin,
2001; Lavou�e et al., 2003) with very good results. In the
phylogenetic analyses conducted in the present study,
the same approach was employed.Molecular data were analyzed under a range of
models, from the simplest (all characters changes
weighted equally) to the most parameter-rich (with
separate three-parameter step-matrices applied to each
molecular partition). Initially, a total of eight MP heu-
ristic searches were conducted, including or excluding
gaps, and considering the 1:1, 1:2, 1:3, and 2:3 Ti/Tv
ratios. Considering the differences in Ti/Tv ratios ob-served in the different molecular regions (12 and 16S
rRNA, ND4, and tRNAs), two additional MP heuristic
searches were conducted, including or excluding gaps,
and considering the Ti/Tv ratios of 2:3 for 12 and 16S
rRNA, 3:2 for ND4, and 2:7 for tRNA. The resultant
phylogenies had all the same topology, with a few dif-
ferences in the bootstrap values observed for some in-
ternal nodes. Fig. 3 exhibits the consensus tree obtainedfrom the analysis of 1000 bootstrap replicates (which

Fig. 3. Consensus MP tree produced when gaps were considered as
missing data and Ti/Tv ratio was 1:1 (TL¼ 2984, CI¼ 0.3934,
HI¼ 0.6066, RI¼ 0.5653). Numbers above branches are bootstrap
values based on 1000 replicates. Values below 50% are not shown.
Numbers below branches represent Bremer support index values. Dip-
loid numbers ð2nÞwere taken from several papers cited in the main text.
156 C.K. Shimabukuro-Dias et al. / Molecular Phylogenetics and Evolution 32 (2004) 152–163
generated 2296 trees), where gaps were considered as
missing data and Ti/Tv ratio was 1:1. The values ob-
tained for this tree were: tree length (TL)¼ 2984, con-
sistency index (CI)¼ 0.3934, homoplasy index
(HI)¼ 0.6066, and retention index (RI)¼ 0.5653.
Fig. 4. (A) Consensus ML tree produced with the software PAUP* ()Ln like
based on 100 replicates. (B) Consensus ML tree produced with the softwar
represent the branch support values found on 1000 replicates. Values below
ML analysis conducted with PAUP* resulted in aconsensus phylogeny similar to those obtained in the
MP analyses ()Ln likelihood¼ 14809.67752). Fig. 4A
shows the values P50% found in the 100 bootstrap
replicates. In this ML analysis, an interesting species
group consisting of the three Aspidoras species (boot-
strap value¼ 71) was found. The ML analyses with
MetaPIGA performed with 1000 independent metaGA
searches (strict consensus pruning among four popula-tions) generated 2000 trees. The majority-rule consensus
tree obtained from them was very similar, but
not identical to that obtained in the MP analyses
(Fig. 4B).
A MP analysis, combining molecular and morpho-
logical data equally weighed, resulted in a consensus
phylogeny very similar to those obtained in the MP
analyses of the molecular data. The consensus tree ob-tained from the analysis of 1000 bootstrap replicates
(which generated 2227 trees), where gaps were consid-
ered as missing data, Ti/Tv ratio was 1:1, and the
morphological data were considered ordered is shown in
Fig. 5A. The values obtained for this tree were:
TL¼ 3308, CI¼ 0.4205, HI¼ 0.5795, and RI¼ 0.6126.
The only significant difference observed in the topology
of the phylogeny shown in Fig. 5A when compared withthat shown in Fig. 3 was the presence of both Leptho-
plosternum species forming a monophyletic group with a
bootstrap value of 59.
Weighing morphological data five times the molecu-
lar data, the consensus phylogeny obtained is different
from those obtained in the analyses of the molecular
lihood¼ 14809.67752). Numbers above branches are bootstrap values
e MetaPIGA using the default parameters. Numbers above branches
50% are not shown.

Fig. 5. (A) Consensus MP tree produced combining molecular and morphological data equally weighed (TL¼ 3308, CI¼ 0.4205, HI¼ 0.5795,
RI¼ 0.6126). (B) Consensus MP tree produced weighing the morphological data five times the molecular data (TL¼ 3714, CI¼ 0.4585, HI¼ 0.5415,
RI¼ 0.7277). (C) Consensus MP tree produced weighing the morphological data ten times the molecular data (TL¼ 4199, CI¼ 0.4985, HI¼ 0.5015,
RI¼ 0.7981). Numbers above branches are bootstrap values based on 1000 replicates. Values below 50% are not shown.
C.K. Shimabukuro-Dias et al. / Molecular Phylogenetics and Evolution 32 (2004) 152–163 157
data. The consensus tree obtained from the analysis of1000 bootstrap replicates (which generated 2171 trees),
where gaps were considered as missing data, Ti/Tv ratio
was 1:1, and the morphological data were considered
ordered is shown in Fig. 5B. The values obtained for this
tree were: TL¼ 3714, CI¼ 0.4585, HI¼ 0.5415, and
RI¼ 0.7277. The difference observed in the topology of
the phylogeny shown in Fig. 5B when compared withthat shown in Fig. 3 was the presence of Aspidoras as
monophyletic (as observed in the ML analysis con-
ducted with PAUP*) and the division of the subfamily
Callichthyinae into two genera groups, one consisting of
Dianema and Hoplosternum and the other formed by
Callichthys, Megalechis, and Lepthoplosternum.

158 C.K. Shimabukuro-Dias et al. / Molecular Phylogenetics and Evolution 32 (2004) 152–163
Weighing morphological data 10 times the moleculardata, the consensus phylogeny obtained was very dif-
ferent from those obtained in the analyses of the mo-
lecular data. The consensus tree obtained from the
analysis of 1000 bootstrap replicates (which generated
2025 trees), where gaps were considered as missing data,
and Ti/Tv ratio was 1:1, as well as the ordered mor-
phological data were considered ordered is shown in
Fig. 5C. The values obtained for this tree were:TL¼ 4199, CI¼ 0.4985, HI¼ 0.5015, and RI¼ 0.7981.
The difference observed in the topology of the phylo-
geny shown in Fig. 5C when compared with that shown
in Fig. 3 was the presence of Aspidoras as monophyletic,
the species Corydoras macropterus isolated as the most
basal species of Corydoras, the subfamily Callichthyinae
composed of two lineages: one formed by the genus
Callichthys and the second by the genera Dianema,Hoplosternum, Megalechis, and Lepthoplosternum.
4. Discussion
The molecular phylogenies obtained by the MP and
ML methods were largely congruent and exhibited high
bootstrap and decay indexes supporting the main nodes,as shown in Figs. 3 and 4. Thus, the molecular data
corroborate the hypothesis that the family Callichthyi-
dae, the subfamily Callichthyinae and the subfamily
Corydoradinae are monophyletic groups. The same was
observed when molecular and morphological datasets
were combined (Fig. 5). These results are in accordance
with the initial hypothesis proposed by Hoedeman
(1952) and corroborated by the morphological phylo-genetic analyses conducted by Reis (1998a).
Regarding callichthyines, the topology obtained with
molecular data is, in some ways, distinct from that
proposed by Reis (1998a). Molecular data suggest that
Dianema is the primitive sister group of all other call-
ichthyines, Hoplosternum is the sister group of Callich-
thys, Lepthoplosternum, and Megalechis, and Callichthys
is the sister group of Lepthoplosternum and Megalechis
(Figs. 3 and 4). In all molecular analyses the two species
of Lepthoplosternum studied did not appear as a
monophyletic group, but this may be related to the fact
that complete sequence for L. tordilho was not obtained.
Disregarding this species level problem with the genus
Lepthoplosternum, the relative positions of the genera
Callichthys, Lepthoplosternum, and Megalechis in mo-
lecular phylogenies (Figs. 3 and 4) is in accordance withthe hypothesis of Reis (1998a). However, Dianema and
Hoplosternum as the primitive sister groups of all other
callichthyines is a curious result because the genus
Callichthys has been considered as the most primitive
callichthyid by several authors (Gosline, 1940; Hoed-
eman, 1952; Ribeiro, 1959) and was found to be the
most primitive clade of the callichthyines in the phylo-
genetic study conducted by Reis (1998a). Dianema spe-cies are, both morphologically and behaviorally, the
most differentiated among callichthyines (Reis, 1998a).
Furthermore, from the biogeographic standpoint, Dia-
nema does not seem to be basal, as it is distributed only
across the central Amazon, a region that is extremely
new considering the estimated age of the callichthyines.
By combining both molecular and morphological
data on callichthyines, some different results were ob-served (Fig. 5). Considering that only 72 morphological
characters of the family Callichthyidae were available
(Reis, 1998a) and that 577 nucleotides were phyloge-
netically informative, experiments with different weights
were conducted in order to avoid attributing too much
importance to molecular data. In the first experiment, all
characters were equally weighed, and the phylogeny
obtained was very similar to those obtained with mo-lecular data alone, but for the fact that the genus Lep-
thoplosternum was demonstrated to be monophyletic
(Fig. 5A). By weighing the morphological data five times
the molecular data, the subfamily Callichthyinae was
shown to consist of two units: one formed by Dianema
and Hoplosternum and the other formed by Callichthys,
Lepthoplosternum, and Megalechis with Callichthys as
the sister group of Lepthoplosternum and Megalechis
(Fig. 5B). When the morphological data were weighted
10 times the molecular data, the subfamily Callichthyi-
nae was demonstrated to include two units: one formed
by the genus Callichthys, and the other formed by Dia-
nema, Hoplosternum, Lepthoplosternum, and Megale-
chis, with Callichthys as the sister group of all other
callichthyines (Fig. 5C).
In contrast to the monophyly of the family andsubfamilies, the sister-group relationships among call-
ichthyines genera, as proposed on morphological
grounds, are not very strongly corroborated (Reis,
1998a). However, the topology suggested by the mo-
lecular analyses is not acceptable unless some morpho-
logical characters are considered to have evolved in a
less parsimonious way, increasing from 9 to 15 steps in
three internal nodes within callichthyines (see tree inFig. 36 of Reis, 1998a). Character 69.1 (color pattern of
young with transverse dark bands) would have to have
evolved in the ancestor of the whole subfamily and re-
versed in Callichthys. Similarly, character 56.2 (corac-
oids large and exposed ventrally) would have to have
evolved at the base of the subfamily, decreased in size in
Lepthoplosternum (state 56.1) and become covered by
skin in Callichthys (state 56.0). Character 60.1 (leadingray of pelvic fin with a skin fold dorsally) would have
increased from one to three steps: either evolving at the
base of the subfamily and disappearing in Callichthys
and Lepthoplosternum, or evolving independently in
Dianema, Hoplosternum, and Megalechis. Similarly,
characters 8.1 (first lateral-line ossicle with lateral ex-
pansions), 9.1 (second lateral-line ossicle with lateral

C.K. Shimabukuro-Dias et al. / Molecular Phylogenetics and Evolution 32 (2004) 152–163 159
expansions), and 54.1 (caudal fin bilobed), would haveto have evolved independently in Dianema and Hoplo-
sternum, or evolved in the ancestor of the subfamily and
subsequently disappeared in the ancestor of Callichthys,
Lepthoplosternum, and Megalechis. On the other hand,
character 5.1 (trigemino-facial foramen separated from
the optic foramen) presents a shorter optimization on
the molecular tree, having evolved in the ancestor of
Callichthys, Lepthoplosternum, and Megalechis. Fur-thermore, by increasing the tree length in six steps, the
molecular topology has no morphological support for
the clade Lepthoplosternum and Megalechis as well as
for the clade including all genera except Dianema, pro-
ducing a quite unresolved tree, if morphology is used to
support the molecular topology.
Some studies have shown that Dianema urostriata has
the lowest value of nuclear DNA content of the sub-family (1.18� 0.07 pg of DNA/nuclei) followed by Ho-
plosternum sp. (1.36� 0.11) and two populations of
Callichthys callichthys, 1.89� 0.24 and 1.94� 0.15
(Oliveira et al., 1993b). These data support the hy-
pothesis of Reis (1998a) and all hypotheses presented in
the present study that suggest that Dianema and Ho-
plosternum are more closely related to each other than to
other callichthyines. Considering that in the subfamilyCorydoradinae the nuclear DNA content tends to in-
crease among genera and species (Oliveira et al., 1993b),
the molecular phylogenies obtained in the present study
also suggest the occurrence of an increase in DNA
content in the evolutionary history of callichthyines. On
the other hand, if Callichthys is the most primitive genus
of Callichthyinae, a reduction in nuclear DNA content
must have occurred in the evolutionary history of thissubfamily.
Cytogenetic studies of callichthyines species have
shown that diploid numbers in this group display a
relatively low variation with values ranging from
2n ¼ 52 to 2n ¼ 66 (Oliveira et al., 1993b; Porto et al.,
1992) and that the karyotypes of Dianema, Hoploster-
num, and Megalechis are very similar with almost all
chromosomes being uniarmed. On the other hand, al-most all Callichthys chromosomes are biarmed (Oliveira
et al., 1993b). These cytogenetic data corroborate the
possible relationship among Dianema, Hoplosternum,
and Megalechis but do not help to identify the most
primitive genera in the subfamily. Considering that the
data available do not satisfactorily resolve the relation-
ships among Callichthyinae genera, further tests, with
additional data, are necessary.The analyses conducted on corydoradines showed
that they consist of at least three groups of species. The
first group is formed by the species of the genus Aspi-
doras and C. macropterus. The second group is formed
by Corydoras prionotos and C. barbatus, and the third
group is formed by the other species of Corydoras and
Brochis (Figs. 3, 4, 5A and B). These results are similar
to those obtained by Reis (1998a), who showed thatAspidoras and Brochis were monophyletic groups and
Corydoras was not. More recently, based on morpho-
logical data, Britto (in press) demonstrated in a phylo-
genetic study of corydoradines that Aspidoras and some
Corydoras species (including C. prionotos, C. barbatus,
and C. macropterus) belong to a natural group (tribe
Aspidoradini), and suggested that these Corydoras spe-
cies should be included in a separate genus. Our data donot entirely support this hypothesis.
All MP analyses with molecular data (under different
weight models) (Fig. 3), the ML analysis with MetaP-
IGA (Fig. 4B), and the analysis in which molecular and
morphological data were combined (weighting mor-
phological data equally to molecular data) (Fig. 5A),
showed that the species C. macropterus was the sister
group of Aspidoras poecilus. On the other hand, the MLanalyses conducted with PAUP* (Fig. 5A), and the MP
analysis combining molecular and morphological data
(weighing morphological data five times molecular data)
(Fig. 5B) showed that the three species of Aspidoras
studied comprise a monophyletic group that is the sister
group of C. macropterus. When the morphological data
were weighed 10 times the molecular data, the species
C. macropterus was found to be the sister group of allother species of Corydoras and Brochis (Fig. 5C). In all
analyses, C. prionotos and C. barbatus, were seen as a
monophyletic group that is the sister group of all other
species of Corydoras (excluding C. macropterus) and
Brochis (Figs. 3–5).
These results were unexpected because the morpho-
logical analyses conducted by Britto (in press) showed
that C. prionotos, C. barbatus, and C. macropterus be-long to a monophyletic group that is the sister group of
Aspidoras. Cytogenetic data showed that C. macropte-
rus, C. prionotos, and C. barbatus exhibit almost the
same karyotypic structure, suggesting that these species
should belong to a natural group (Oliveira et al., 1993a).
Additionally, although the nuclear DNA content found
among the species of Aspidoras is very similar to those
found in the species C. macropterus, C. prionotos, andC. barbatus, the diploid number exhibited by Aspidoras,
2n ¼ 44–46, is quite different from those found among
these Corydoras species, 2n ¼ 64–86 (Oliveira et al.,
1993a,b).
The two Brochis species analyzed were found to
represent a natural group in all analyses conducted
(Figs. 3–5). However, they were never found to be the
sister group of all other Corydoras species. Reis (1998a)suggested that Corydoras is not monophyletic if Brochis
is considered as a recognized genus. Phylogenetic studies
conducted by Britto (in press) also showed that the ge-
nus Corydoras is not monophyletic if Brochis is accepted
as a valid genus, and therefore suggested that Brochis
should be considered a synonym of Corydoras. Our
molecular study supports this view.

160 C.K. Shimabukuro-Dias et al. / Molecular Phylogenetics and Evolution 32 (2004) 152–163
The study conducted by Britto (in press) suggestedthat Corydoras difluviatilis is the primitive sister group
of all other Corydoradini species. In the present phylo-
genetic analyses this hypothesis was not corroborated
since C. difluviatilis was grouped with Corydoras sodalis
(Figs. 3 and 5) or as sister group of Brochis (Fig. 4).
Cytogenetic studies showed that C. difluviatilis has
2n ¼ 78 chromosomes (Shimabukuro-Dias et al., in
press) and C. sodalis has 2n ¼ 74 (our unpublished data)and the karyotypes of both species are very similar with
a high number of uniarmed chromosomes. Unfortu-
nately, C. sodalis was not included in the phylogenetic
study of Britto (in press). The presence of a high diploid
number and a high number of uniarmed chromosomes is
also a characteristic of Brochis species (Oliveira et al.,
1993b), reinforcing the hypothesis that these four species
may belong to a natural group (Fig. 3).Although only a small portion of the large genus
Corydoras has been analyzed, our molecular study
supports the monophyly of some species groups in the
tribe Corydoradini. Thus, the species Corydoras metae
and Corydoras araguaiensis were found to be sister
species in all analyses. These species are characterized by
the presence of a high diploid number, 2n ¼ 92 and
2n ¼ 94, respectively, and very similar karyotypicstructure (Oliveira et al., 1992; Shimabukuro-Dias et al.,
submitted). Additionally, in all analyses the species
Corydoras aeneus was found to be the sister group of
C. metae and C. araguaiensis.
All analyses performed provided a significant statis-
tical support for a second group, which included Cory-
doras flaveolus, Corydoras paleatus, two cytotypes of
C. nattereri and C. ehrhardti (Figs. 3–5). Although thephylogenetic study conducted by Britto (in press) pro-
vided no evidence that the species C. paleatus, C. nat-
tereri, and C. ehrhardti comprise a monophyletic group,
Oliveira et al. (1992, 1993a), based on the fact that these
species have almost the same karyotypic structure and
nuclear DNA content, suggested that they belong to a
natural group. The finding that one cytotype of
C. nattereri ð2n ¼ 42Þ is more closely related to C. ehr-
hardti than to a second cytotype of C. nattereri ð2n ¼ 44Þwas not expected (Figs. 3–5). Cytogenetic studies con-
ducted in three isolated samples identified as C. nattereri,
showed that each had their own diploid number (2n ¼ 40,
42 or 44) and karyotype (Oliveira et al., 1990). This
finding allowed the authors to suggest that these cytotypes
represent different unidentified species. The molecular
data herein presented support this hypothesis. However,additional samples should be analyzed before any final
conclusion is drawn.
The results obtained in the present study show that
the mitochondrial genes employed were able to recover
the high-level relationship patterns among the calli-
chthyid genera. However, considering that the rela-
tionship pattern among genera was not congruent with
that found in morphological studies, and that the rela-tionships among some Corydoras species were not well
resolved, two main points should be focused in future
studies: the use of additional sequences and a larger
number of species. The analysis combining molecular
and morphological data was very useful in demon-
strating the monophyletic nature of the genus Leptho-
plosternum, but as the amount of morphological data
was much reduced when compared to that of moleculardata, significant changes in molecular phylogenies were
observed only when special weight models were em-
ployed. Considering that the use of species weight
models may not be justifiable, further analyses of addi-
tional morphological data may be very helpful in the
understanding of the phylogeny of Callichthyidae.
Acknowledgments
The authors are grateful to Renato Devid�e for his
technical assistance, to Hern�an Ortega, Margarida
Carvalho, C�esar Cuevas, and Miguel Velasquez for their
help during the collection of several specimens, Marcelo
Britto for his help in the identification of some Cory-
doras and Aspidoras , M�ario de Pinna for his help in theidentification of Trichomycteridae species, and two
anonymous reviewers for their valuable comments.
Funds supporting this study were provided by FAPESP,
CAPES, and CNPq.
Appendix A
Museum numbers and collection sites of fish from
which DNA was extracted for this study (LBP¼Labo-
rat�orio de Biologia de Peixes, Instituto de Biociencias ofUniversidade Estadual Paulista, Botucatu, S~ao Paulo,
Brazil; MCP¼Museu de Ciencias e Tecnologia, Pon-
tif�ıcia Universidade Cat�olica do Rio Grande do Sul,
Porto Alegre, Brazil) and GenBank Accession Nos. (12S
rRNA/16S rRNA/ND4+ tRNAHis + tRNASer, in pa-
renthesis and in order).
A.1. Ingroup taxa
Aspidoras poecilus, c�orrego �Aguas Quentes, Araguaia
Riber basin, Barra do Garc�as, MT, Brazil, LBP1272
(AY307224/AY307259/AY307294); Aspidoras fuscogutta-
tus, c�orrego Araponga, Tiete River basin, Pen�apolis, SP,Brazil, LBP1295 (AY307223/AY307258/AY307293); As-
pidoras cf. fuscoguttatus, aquarium, LBP453 (AY307222/
AY307257/AY307292); Brochis britskii, a tributary of therio Pirai, Paraguay River basin (16�25.6800S,56�25.1430W), Pocon�e, MT, Brazil, LBP688 (AY307228/
AY307263/AY307298); Brochis splendens, aquarium,
LBP432 (Y307229/AY307264/AY307299); Callichthys

C.K. Shimabukuro-Dias et al. / Molecular Phylogenetics and Evolution 32 (2004) 152–163 161
callichthys, cytotype 1 ð2n ¼ 58Þ, ribeir~ao Santa Rita,Tiete River basin (23�55.5940S, 46�53.3360W), Embu
Guac�u, SP, Brazil, LBP485 (AY307240/AY307275/
AY307310);Callichthys callichthys, cytotype 2 ð2n ¼ 56Þ,c�orrego do Pombo, Tiete River basin,Mar�ılia, SP, Brazil,LBP485 (AY307241/AY307276/AY307311); Corydoras
aeneus, rio Araqu�a, Tiete River basin (22�47.1350S,48�28.8920W), Botucatu, SP, Brazil, LBP410 (AY307234/
AY307269/AY307304); Corydoras araguaiensis, aquar-ium, LBP435 (AY307232/AY307267/AY307302); Cory-
doras barbatus, rio S~ao Jo~ao (25�58,6490S, 48�52,9930W),
Garuva, PR, Brazil, LBP743 (AY307227/AY307262/
AY307297); Corydoras difluviatilis, c�orrego �Agua Boa,
Mogi-Guac�u River basin (22�23.0040S, 47�25.8190), Ar-
aras, SP, Brazil, LBP382 (AY307230/AY307265/
AY307300); Corydoras ehrhardti, c�orrego Ribeir~ao Ca-
valo, Itapucu River basin (26�28.2500S, 49�10.9580W),Jaragu�a do Sul, SC, Brazil, LBP741 (AY307235/
AY307270/AY307305); Corydoras flaveolus, rio Alam-
bari, Tiete River basin (22�5600800S, 48�1901500W), Bot-
ucatu, SP, Brazil, LBP397 (AY307239/AY307274/
AY307309);Corydoras macropterus, a tributary of the rio
Preto, Itanha�em River basin (24�10.8900S, 46�50.5630W),
Itanha�em, SP, Brazil, LBP1238 (AY307225/AY307260/
AY307295); Corydoras metae, aquarium, LBP428(AY307233/AY307268/AY307303); Corydoras nattereri,
cytotype 1 ð2n ¼ 44Þ, rio Marumbi (25�29.1970S,48�49.9780W), Morretes, PR, Brazil, LBP778
(AY307237/AY307272/AY307307); Corydoras nattereri,
cytotype 2 ð2n ¼ 42Þ, rio Fau, Ribeira de Iguape River
basin (24�12.4410S, 47�28.6160W), Miracatu, SP, Brazil,
LBP1266 (AY307236/AY307271/AY307306); Corydoras
paleatus, rio Gua�iba River basin (30�02.8200S,51�22.3470W), Eldorado do Sul, RS, Brazil, LBP568
(AY307238/AY307273/AY307308);Corydoras prionotos,
rio Fau, Ribeira de Iguape River basin (24�12.4410S,47�28.6160W),Miracatu, SP,Brazil, LBP1267 (AY307226/
AY307261/AY307296); Corydoras sodalis, aquarium,
LBP434 (AY307231/AY307266/AY307301); Dianema
longibarbis, aquarium, Purus River basin, AM, Brazil,
LBP557 (AY307242/AY307277/AY307312); Dianema
urostriata, aquarium, Purus River basin, AM, Brazil,
LBP558 (AY307243/AY307278/AY307313); Hoploster-
num littorale, Represa de Jurumirim, Paranapanema
River basin (19�34.6300S, 57�01.1230W), Angatuba, SP,
Brazil, LBP466 (AY307244/AY307279/AY307314); Ho-
plosternum littorale, rio Gua�ıba (30�02.8200S,51�22.3470W), Eldorado do Sul, RS, Brazil, LBP569
(AY307245/AY307280/AY307315); Lepthoplosternum
altamazonicum, swamp at the Pacaya River, Ucayali
River basin, Peru, MCP uncat. (AY307247/AY307282/
AY307317); Lepthoplosternum tordilho, a tributary of
the rio Gua�ıba (30�0203900S, 51�2600700W), Eldorado do
Sul, RS, Brazil, MCP 29383 (AY307249/AY307284/
AY307319); Megalechis personata, igarap�e do Almoc�o,Acre River basin, Rio Branco, AC, Brazil, LBP239
(AY307246/AY307281/AY307316); Megalechis thora-
cata, aquarium, upper rio Negro, AM, Brazil, LBP526
(AY307248/AY307283/AY307318).
A.2. Outgroup taxa
Nematogenyidae: Nematogenys inermis, estero Aguasde laGloria, Pacific drainage (S36�50.3040,W72�55.6420),Aguas de la Gloria, VIII Region, Chile, LBP1002
(AY307250/AY307285/AY307320). Trichomycteridae:
Trichomycterus areolatus, R�ıo Rehue, R�ıo Biobio
(S38�09.2030, W72�37.0050), Quechereguas, IX Region,
Chile, LBP994 (AY307217/AY307252/AY307287); He-
nonemus punctatus, lago Amap�a, Acre River basin
(S10�03.0380, W67� 50.8740), Rio Branco, AC, Brazil,LBP1125 (AY307216/AY307251/AY307286). Astrobl-
epidae: Astroblepus sp., Rio Santa, Pacific drainage
(S08�57054.60, W77�50007.400), Sucre, Ancash, Peru,
LBP1357 (AY307219/AY307254/AY307289). Loricarii-
dae: Neoplecostomus paranensis, c�orrego Hortel~a,Paranapanema River basin (S22�550, W48�300), Botuc-atu, SP, Brazil, LBP709 (AY307218/AY307253/
AY307288);Delturus parahybae, rio Pombas, Para�ıba doSul River basin (S21�2602800,W42�2601900), Laranjal,MG,
Brazil, MCP31467 (AY307220/AY307255/AY307290);
Hemipsilichthys nimius, rio Pereque-ac�u, Paraty, RJ,
Brazil, MCP31990 (AY307221/AY307256/AY307291).
References
Alves-Gomes, J., 1998. The phylogenetic position of the South
American electric fish genera Sternopygus and Archolaemus
(Ostariophysi, Gymanotiformes) according to 12S and 16S mito-
chondrial DNA sequences. In: Malabarba, L.R., Reis, R.E., Vari,
R.P., Lucena, Z.M.S., Lucena, C.A.S. (Eds.), Phylogeny and
Classification of Neotropical Fishes. Edipucrs, Porto Alegre, pp.
447–460.
Alves-Gomes, J., 1999. Systematic biology of gymnotiform and
mormyriform electric fishes: phylogenetic relationships, molecular
clocks and rates of evolution in the mitochondrial rRNA genes. J.
Exp. Biol. 202, 1167–1183.
Alves-Gomes, J., Ort�ı, G., Haygood, M., Heiligenberg, W., Meyer, A.,
1995. Phylogenetic analysis of the South American electric fishes
(Order Gymnotiformes) and the evolution of their electrogenic
system: a synthesis based on morphology, electrophysiology, and
mitochrondrial sequence data. Mol. Biol. Evol. 12, 298–318.
Bremer, K., 1988. The limits of amino acid sequence data in
angiosperm phylogenetic reconstruction. Evolution 42, 795–803.
Britto, M.R., in press. Phylogeny of the subfamily Corydoradinae
Hoedeman, 1952 (Siluriformes: Callichthyidae), with a definition of
its genera. Proc. Acad. Natl. Sci. Philadelphia.
Bull, J.J., Huelsenbeck, J.P., Cunningham, C.W., Swofford, D.L.,
Waddell, P.J., 1993. Partitioning and combining data in phyloge-
netic analysis. Syst. Biol. 42, 384–397.
Burgess, W.E., 1989. An Atlas of Freshwater and Marine Catfishes. A
Preliminary Survey of Siluriformes. T.F.H. Publications, Neptune.
Dowton, M., Austin, A.D., 2001. Simultaneous analysis of 16S, 28S,
COI and morphology in the Hymenoptera: Apocrita—evolutionary
transitions among parasitic wasps. Biol. J. Linnean Soc. 74, 87–111.

162 C.K. Shimabukuro-Dias et al. / Molecular Phylogenetics and Evolution 32 (2004) 152–163
Farias, I.P., Schneider, H., Sampaio, I., 1998. Molecular phylogeny of
Neotropical cichlids: the relationships of Cichlasomines and
Heroines. In: Malabarba, L.R., Reis, R.E., Vari, R.P., Lucena,
Z.M.S., Lucena, C.A.S. (Eds.), Phylogeny and Classification of
Neotropical Fishes. Edipucrs, Porto Alegre, pp. 499–508.
Farris, J.S., Kallersjo, M., Kluge, A.G., Bult, C., 1995. Testing
significance of incongruence. Cladistics 10, 315–319.
Felsenstein, J., 1985. Confidence limits on phylogenies: an approach
using the bootstrap. Evolution 39, 783–791.
Ferraris, C.J., 1998. Catfishes and knifefishes. In: Paxton, J.R.,
Eschmeyer, W.N. (Eds.), Encyclopedia of Fishes. Academic Press,
San Diego, pp. 106–112.
Fink, S.V., Fink, W.L., 1996. Interrelationships of Ostariophysan
fishes. In: Stiassny, M.L.J., Parenti, L.R., Johnson, G.D. (Eds.),
Interrelationships of Fishes. Academic press, San Diego, pp. 209–
249.
Gatesy, J., O�Grady, P., Baker, R.H., 1999. Stability of cladistic
relationships between Cet�acea and higher-level Artiodactyl taxa.
Syst. Biol. 48, 6–20.
Gosline, W.A., 1940. A revision of the Neotropical catfishes of the
family Callichthyidae. Stanf. Ichthyol. Bull. 2, 1–29.
Hasegawa, M., Kishino, H., Yano, T., 1985. Dating of the human–ape
splitting by a molecular clock of mitochondrial DNA. J. Mol. Evol.
22, 160–174.
Hoedeman, J.J., 1952. Notes on the ichthyology of Surinam (Dutch
Guiana).The catfish generaHoplosternum and Callichthys, with key
to the genera and groups of the family Callichthyidae. Beaufortia
12, 1–12.
Hrbek, T., K€uc�€uk, F., Frickey, T., St€olting, K.N., Wildekamp, R.H.,
Meyer, A., 2002. Molecular phylogeny and historical biogeography
of the Aphanius (Pisces, Cyprinodontiformes) species complex of
central Anatolia, Turkey. Mol. Phylogenet. Evol. 25, 125–137.
Kocher, T.D., Stephien, C.A., 1997. Molecular Systematics of Fishes,
second ed. Academic Press, London.
Kocher, T.D., Thomas, W.K., Meyer, A., Edwards, S.V., P€a€abo, S.,Villablanca, F.X., Wilson, A.C., 1989. Dynamics of mitochondrial
DNA evolution in animals: amplification and sequencing with
conserved primers. Proc. Natl. Acad. Sci. USA 86, 6196–6200.
Kumar, S., Tamura, K., Jakobsen, I., Nei,M., 2001.MEGA:Molecular
evolutionary genetic analysis, ver. 2.1. Pennsylvania State Univer-
sity, University Park, and Arizona State University, Tempe.
Lavou�e, S., Sullivan, J.P., Hopkins, C.D., 2003. Phylogenetic utility of
the first two �ıntrons of the S7 ribosomal protein gene in African
electric fishes (Mormyroidea: Teleostei) and congruence with other
molecular markers. Biol. J. Linn. Soc. 78, 273–292.
Lemmon, A.R., Milinkovitch, M.C., 2002a. MetaPIGA (Phylogenetic
Inference using the MetaGA) version 1.0.2b. Distributed by the
authors. www.ulb.ac.be/sciences/ueg.
Lemmon, A.R., Milinkovitch, M.C., 2002b. The metapopulation
genetic algorithm: an efficient solution for the problem of large
phylogeny estimation. Proc. Natl. Acad. Sci. USA 99, 10516–
10521.
Lovejoy, N.R., Collete, B.B., 2001. Phylogenetic relationships of new
world needlefishes (Teleostei: Belonidae) and the biogeography of
transitions between marine and freshwater habitats. Copeia 2001,
324–338.
Lundberg, J.G., Marshall, L.G., Guerrero, J., Horton, B., Malabarba,
M.C.S.L., Wesselingh, F., 1998. The stage for neotropical fish
diversification: a history of tropical South American rivers. In:
Malabarba, L.R., Reis, R.E., Vari, R.P., Lucena, Z.M.S., Lucena,
C.A.S. (Eds.), Phylogeny and Classification of Neotropical Fishes.
Edipucrs, Porto Alegre, pp. 13–48.
Martins, C., Wasko, A.P., Oliveira, C., Foresti, F., 2003. Mitochon-
drial DNA variation in wild populations of Leporinus elongatus
from the Paran�a river basin. Genet. Mol. Biol. 26, 33–38.
Montoya-Burgos, J.I., 2003. Historical biogeography of the catfish
genus Hypostomus (Siluriformes: Loricariidae), with implications
on the diversification of Neotropical ichthyofauna. Mol. Ecol. 12,
1855–1867.
Montoya-Burgos, J.I., Muller, S., Weber, C., Pawlowski, J., 1998.
Phylogenetic relationships of the Loricariidae (Siluriformes) based
on mitochondrial rRNA gene sequences. In: Malabarba, L.R.,
Reis, R.E., Vari, R.P., Lucena, Z.M.S., Lucena, C.A.S. (Eds.),
Phylogeny and Classification of Neotropical Fishes. Edipucrs,
Porto Alegre, pp. 363–374.
Murphy, W.J., Collier, G.E., 1999. Phylogenetic relationships of
African killifishes in the genera Aphyosemion and Fundulopanchax
inferred from mitochondrial DNA sequences. Mol. Phylogenet.
Evol. 11, 351–360.
Nelson, J.S., 1994. Fishes of the World, third ed. Wiley, New York.
Oliveira, C., Almeida-Toledo, L.F., Toledo Filho, S.A., 1990. Compar-
ative cytogenetic analysis in three cytotypes of Corydoras nattereri
(Pisces, Siluriformes, Callichthyidae). Cytologia 55, 21–26.
Oliveira, C., Almeida-Toledo, L.F., Mori, L., Toledo-Filho, S.A.,
1992. Extensive chromosomal rearrangements and nuclear DNA
content changes in the evolution of the armoured catfishes genus
Corydoras (Pisces, Siluriformes, Callichthyidae). J. Fish Biol. 40,
419–431.
Oliveira, C., Almeida-Toledo, L.F., Mori, L., Toledo-Filho, S.A.,
1993a. Cytogenetic and DNA content studies on armoured catfishes
of the genus Corydoras (Pisces, Siluriformes, Callichthyidae) from
the southeast coast of Brazil. Rev. Brasil Genet. 16, 617–629.
Oliveira, C., Almeida-Toledo, L.F., Mori, L., Toledo-Filho, S.A.,
1993b. Cytogenetic and DNA content in six genera of the family
Callichthyidae (Pisces, Siluriformes). Caryologia 46, 171–188.
Ort�ı, G., 1997. Radiation of characiform fishes: evidence from
mitochondrial and nuclear DNA sequences. In: Kocher, T.D.,
Stepien, C.A. (Eds.), Molecular Systematics of Fishes. Academic
Press, San Diego, pp. 219–243.
Palumbi, S., Martin, A., Romano, W.O., Stice, L., Grabowski, G.,
1991. The simple fool�s guide do PCR, version 2.0. University of
Hawaii, Honolulu.
Parkinson, C.L., 1999. Molecular systematics and biogeographical
history of pitvipers as determined by mitochondrial ribosomal
DNA sequences. Copeia 1999, 576–586.
Perdices, A., Bermingham, E., Montilla, A., Doadrio, I., 2002.
Evolutionary history of the genus Rhamdia (Teleostei, Pimelodi-
dae) in Central America. Mol. Phylogenet. Evol. 25, 172–189.
de Pinna, M.C.C., 1998. Phylogenetic relationships of Neotropical
Siluriformes (Teleostei: Ostariophysi): historical overview and
synthesis of hypotheses. In: Malabarba, L.R., Reis, R.E., Vari,
R.P., Lucena, Z.M.S., Lucena, C.A.S. (Eds.), Phylogeny and
Classification of Neotropical Fishes. Edipucrs, Porto Alegre, pp.
279–330.
Porto, J.I.R., Feldberg, E., Nakayama, C., Falc~ao, J.N., 1992. A
checklist of chromosome number and karyotypes of Amazonian
freshwater fishes. Rev. Hydrobiol. Trop. 25, 287–299.
Posada, D., Crandall, K.A., 1998. Modeltest: testing the model of
DNA substitution. Bioinformatics 14, 817–818.
Reeder, T.W., 1995. Phylogenetic relationships among phrynosomatid
lizards as inferred from mitochondrial ribosomal DNA sequences:
substitutional bias and information content of transitions relative
to transversions. Mol. Phylogenet. Evol. 4, 203–222.
Reis, R.E., 1998a. Anatomy and phylogenetic analysis of the
neotropical callichthyid catfishes (Ostariophysi, Siluriformes).
Zool. J. Linn. Soc. 124, 105–168.
Reis, R.E., 1998b. Systematics, biogeography, and fossil record of the
Callichthyidae: a review of the available data. In: Malabarba, L.R.,
Reis, R.E., Vari, R.P., Lucena, Z.M.S., Lucena, C.A.S. (Eds.),
Phylogeny and Classification of Neotropical Fishes. Edipucrs,
Porto Alegre, pp. 351–362.
Reis, R.E., 2003. Family Callichthyidae. In: Reis, R.E., Kullander,
S.O., Ferraris Jr., C.J. (Eds.), Checklist of the Freshwater Fishes of
South and Central America. Edipucrs, Porto Alegre, pp. 291–309.

C.K. Shimabukuro-Dias et al. / Molecular Phylogenetics and Evolution 32 (2004) 152–163 163
Ribeiro, P.M., 1959. Considerac�~o es sobre Callichthyidae Gill, 1872
(Nematognathi). Boletim Mus. Nacional 206, 1–9.
Salisbury, B.A., 2001. SEPAL—Strongest Evidence and Parsimony
AnaLyzer, Version 1.4. Department of Ecology and Evolutionary
Biology, Yale University, New Haven. Distributed by the author.
Shimabukuro-Dias, C.K., Oliveira, O., Foresti, F., in press. Karyotype
variability in eleven species of the genus Corydoras (Siluriformes,
Callichthyidae). Ichthyol. Explor. Freshwaters.
Sivasundar, A., Bermingham, E., Ort�ı, G., 2001. Population structure
and biogeography of migratory freshwater fishes (Prochilodus:
characiformes) in major south American rivers. Mol. Ecol. 10, 407–
417.
Swofford, D.L., 2002. PAUP*—Phylogenetic analysis using parsimony
(*and other methods), Version 4b10. Sinauer, Sunderland, MA.
Swofford, D.L., Olsen, G.J., Waddell, P.J., Hillis, D.M., 1996. Phylo-
genetic inference. In: Hillis, D.M., Mable, B.K., Moritz, C. (Eds.),
Molecular Systematics. Sinauer, Sunderland, MA, pp. 407–514.
Tamura, K., Nei, M., 1993. Estimation of the number of nucleotide
substitution in the control region of mitochondrial DNA in
humans and chimpanzees. Mol. Biol. Evol. 10, 512–526.
Teugels, G.G., 1996. Taxonomy, phylogeny and biogeography of
catfishes (Ostariophysi, Siluroidei): an overview. Aquat. Living
Resour. 9, 9–34.
Thompson, J.D., Higgins, D.G., Gibson, T.J., 1994. CLUSTAL W:
improving the sensitivity of progressive multiple sequence
alignment through sequence weighting, positions-specific gap
penalties and weight matrix choice. Nucleic Acids Res. 22, 4673–
4680.
Wimberger, P.H., Reis, R.E., Thornton, K., 1998. Mitochondrial
phylogenetics, biogeography, and evolution of parental care and
mating systems in Gymnogeophagus (Perciformes, Cichlidae). In:
Malabarba, L.R., Reis, R.E., Vari, R.P., Lucena, Z.M.S., Lucena,
C.A.S. (Eds.), Phylogeny and Classification of Neotropical Fishes.
Edipucrs, Porto Alegre, pp. 509–518.
Xia, X., Xie, Z., 2001. DAMBE: Data analysis in molecular biology
and evolution. J. Heredity 92, 371–373.
Yang, Z., 1994. Estimating the pattern of nucleotide substitution. J.
Mol. Evol. 39, 105–111.
Zhang, D.-X., Hewitt, G.M., 1996. Nuclear integrations: challenges
for mitochondrial DNA markers. Trends Ecol. Evol. 11, 247–251.
Copyright © 2022 FDOKUMEN