Quantitative Assessment of the Sensitivity of Various Commercial Reverse Transcriptases Based on...
10
Quantitative Assessment of the Sensitivity of Various Commercial Reverse Transcriptases Based on Armored HIV RNA John B. A. Okello 1 *, Linda Rodriguez 1 , Debi Poinar 1 , Kirsten Bos 1 , Andrew L. Okwi 2 , Gabriel S. Bimenya 2 , Nelson K. Sewankambo 3 , Kenneth R. Henry 4 , Melanie Kuch 1 , Hendrik N. Poinar 1,5,6 * 1 Department of Anthropology, McMaster Ancient DNA Centre, McMaster University, Hamilton, Ontario, Canada, 2 Department of Pathology, School of Biomedical Sciences, College of Health Sciences, Makerere University, Kampala, Uganda, 3 Office of the Principal, College of Health Sciences, Makerere University, Kampala, Uganda, 4 Division of Infectious Diseases, Case Western Reserve University, Cleveland, Ohio, United States of America, 5 Michael DeGroote Institute for Infectious Disease Research, McMaster University, Hamilton, Ontario, Canada, 6 Department of Pathology and Molecular Medicine, McMaster University, Hamilton, Ontario, Canada Abstract Background: The in-vitro reverse transcription of RNA to its complementary DNA, catalyzed by the enzyme reverse transcriptase, is the most fundamental step in the quantitative RNA detection in genomic studies. As such, this step should be as analytically sensitive, efficient and reproducible as possible, especially when dealing with degraded or low copy RNA samples. While there are many reverse transcriptases in the market, all claiming to be highly sensitive, there is need for a systematic independent comparison of their applicability in quantification of rare RNA transcripts or low copy RNA, such as those obtained from archival tissues. Methodology/Principal Findings: We performed RT-qPCR to assess the sensitivity and reproducibility of 11 commercially available reverse transcriptases in cDNA synthesis from low copy number RNA levels. As target RNA, we used a serially known number of Armored HIV RNA molecules, and observed that 9 enzymes we tested were consistently sensitive to ,1,000 copies, seven of which were sensitive to ,100 copies, while only 5 were sensitive to ,10 RNA template copies across all replicates tested. Despite their demonstrated sensitivity, these five best performing enzymes (Accuscript, HIV-RT, M-MLV, Superscript III and Thermoscript) showed considerable variation in their reproducibility as well as their overall amplification efficiency. Accuscript and Superscript III were the most sensitive and consistent within runs, with Accuscript and Superscript II ranking as the most reproducible enzymes between assays. Conclusions/Significance: We therefore recommend the use of Accuscript or Superscript III when dealing with low copy number RNA levels, and suggest purification of the RT reactions prior to downstream applications (eg qPCR) to augment detection. Although the results presented in this study were based on a viral RNA surrogate, and applied to nucleic acid lysates derived from archival formalin-fixed paraffin embedded tissue, their relative performance on RNA obtained from other tissue types may vary, and needs future evaluation. Citation: Okello JBA, Rodriguez L, Poinar D, Bos K, Okwi AL, et al. (2010) Quantitative Assessment of the Sensitivity of Various Commercial Reverse Transcriptases Based on Armored HIV RNA. PLoS ONE 5(11): e13931. doi:10.1371/journal.pone.0013931 Editor: Sue Cotterill, St George’s University of London, United Kingdom Received July 7, 2010; Accepted October 18, 2010; Published November 10, 2010 Copyright: ß 2010 Okello et al. This is an open-access article distributed under the terms of the Creative Commons Attribution License, which permits unrestricted use, distribution, and reproduction in any medium, provided the original author and source are credited. Funding: This study was funded by the Canadian Institutes of Health Research (CIHR, to HNP). The funders, however, had no role in study design, data collection and analysis, decision to publish, or preparation of the manuscript. Competing Interests: The authors have declared that no competing interests exist. * E-mail: [email protected] (JBAO); [email protected] (HNP) Introduction Quantitative polymerase chain reaction (qPCR) is today one of the most accurate methods used for the quantification of nucleic acids in genomic studies [1], biotechnology and forensics [2], and was recently utilized to detect archival retroviruses [3]. For RNA detection [4], the most fundamental step is the in-vitro reverse transcription (RT) of RNA to its complementary DNA (cDNA), catalyzed by the enzyme reverse transcriptase [5,6,7]. Many factors such as the quality of the RNA, the presence of inhibitors co-extracted with the RNA, as well as the RT efficiency are known to affect the total yield of cDNA [8,9]. While the success of obtaining cDNA from samples with low copy number RNA levels will depend mainly on the reverse transcription step [8,10,11], it is known that certain reaction components have inhibitory effects on downstream applications, especially qPCR [5,12,13,14,15,16]. In fact, some studies have shown the main inhibitory substance is the reverse transcriptase enzyme itself [12,13]. As such, the enzyme needs to be removed or denatured directly after the RT reaction is complete to reduce its inhibitory and/or nuclease activities. This can be achieved via a heat or an alternative inactivation step which has been incorporated in almost all commercially available reverse transcriptase kits/systems. However, with the increasing number of heat-resistant RT enzymes [9], and the fact that many RT enzymes retain their inhibitory properties even post denaturation [15], there is need for alternative strategies to overcome this limitation. Dilutions of RT products are often used to minimize post-RT inhibitory effects [5,10,12,13,17,18], although this has the negative consequence of reducing quantification precision, PLoS ONE | www.plosone.org 1 November 2010 | Volume 5 | Issue 11 | e13931
Transcript of Quantitative Assessment of the Sensitivity of Various Commercial Reverse Transcriptases Based on...

Quantitative Assessment of the Sensitivity of VariousCommercial Reverse Transcriptases Based on ArmoredHIV RNAJohn B. A. Okello1*, Linda Rodriguez1, Debi Poinar1, Kirsten Bos1, Andrew L. Okwi2, Gabriel S. Bimenya2,
Nelson K. Sewankambo3, Kenneth R. Henry4, Melanie Kuch1, Hendrik N. Poinar1,5,6*
1 Department of Anthropology, McMaster Ancient DNA Centre, McMaster University, Hamilton, Ontario, Canada, 2 Department of Pathology, School of Biomedical
Sciences, College of Health Sciences, Makerere University, Kampala, Uganda, 3 Office of the Principal, College of Health Sciences, Makerere University, Kampala, Uganda,
4 Division of Infectious Diseases, Case Western Reserve University, Cleveland, Ohio, United States of America, 5 Michael DeGroote Institute for Infectious Disease Research,
McMaster University, Hamilton, Ontario, Canada, 6 Department of Pathology and Molecular Medicine, McMaster University, Hamilton, Ontario, Canada
Abstract
Background: The in-vitro reverse transcription of RNA to its complementary DNA, catalyzed by the enzyme reverse transcriptase, isthe most fundamental step in the quantitative RNA detection in genomic studies. As such, this step should be as analyticallysensitive, efficient and reproducible as possible, especially when dealing with degraded or low copy RNA samples. While there aremany reverse transcriptases in the market, all claiming to be highly sensitive, there is need for a systematic independent comparisonof their applicability in quantification of rare RNA transcripts or low copy RNA, such as those obtained from archival tissues.
Methodology/Principal Findings: We performed RT-qPCR to assess the sensitivity and reproducibility of 11 commerciallyavailable reverse transcriptases in cDNA synthesis from low copy number RNA levels. As target RNA, we used a seriallyknown number of Armored HIV RNA molecules, and observed that 9 enzymes we tested were consistently sensitive to,1,000 copies, seven of which were sensitive to ,100 copies, while only 5 were sensitive to ,10 RNA template copiesacross all replicates tested. Despite their demonstrated sensitivity, these five best performing enzymes (Accuscript, HIV-RT,M-MLV, Superscript III and Thermoscript) showed considerable variation in their reproducibility as well as their overallamplification efficiency. Accuscript and Superscript III were the most sensitive and consistent within runs, with Accuscriptand Superscript II ranking as the most reproducible enzymes between assays.
Conclusions/Significance: We therefore recommend the use of Accuscript or Superscript III when dealing with low copynumber RNA levels, and suggest purification of the RT reactions prior to downstream applications (eg qPCR) to augmentdetection. Although the results presented in this study were based on a viral RNA surrogate, and applied to nucleic acidlysates derived from archival formalin-fixed paraffin embedded tissue, their relative performance on RNA obtained fromother tissue types may vary, and needs future evaluation.
Citation: Okello JBA, Rodriguez L, Poinar D, Bos K, Okwi AL, et al. (2010) Quantitative Assessment of the Sensitivity of Various Commercial Reverse TranscriptasesBased on Armored HIV RNA. PLoS ONE 5(11): e13931. doi:10.1371/journal.pone.0013931
Editor: Sue Cotterill, St George’s University of London, United Kingdom
Received July 7, 2010; Accepted October 18, 2010; Published November 10, 2010
Copyright: � 2010 Okello et al. This is an open-access article distributed under the terms of the Creative Commons Attribution License, which permitsunrestricted use, distribution, and reproduction in any medium, provided the original author and source are credited.
Funding: This study was funded by the Canadian Institutes of Health Research (CIHR, to HNP). The funders, however, had no role in study design, data collectionand analysis, decision to publish, or preparation of the manuscript.
Competing Interests: The authors have declared that no competing interests exist.
* E-mail: [email protected] (JBAO); [email protected] (HNP)
Introduction
Quantitative polymerase chain reaction (qPCR) is today one of
the most accurate methods used for the quantification of nucleic
acids in genomic studies [1], biotechnology and forensics [2], and
was recently utilized to detect archival retroviruses [3]. For RNA
detection [4], the most fundamental step is the in-vitro reverse
transcription (RT) of RNA to its complementary DNA (cDNA),
catalyzed by the enzyme reverse transcriptase [5,6,7]. Many
factors such as the quality of the RNA, the presence of inhibitors
co-extracted with the RNA, as well as the RT efficiency are known
to affect the total yield of cDNA [8,9].
While the success of obtaining cDNA from samples with low
copy number RNA levels will depend mainly on the reverse
transcription step [8,10,11], it is known that certain reaction
components have inhibitory effects on downstream applications,
especially qPCR [5,12,13,14,15,16]. In fact, some studies have
shown the main inhibitory substance is the reverse transcriptase
enzyme itself [12,13]. As such, the enzyme needs to be removed or
denatured directly after the RT reaction is complete to reduce its
inhibitory and/or nuclease activities. This can be achieved via a
heat or an alternative inactivation step which has been
incorporated in almost all commercially available reverse
transcriptase kits/systems. However, with the increasing number
of heat-resistant RT enzymes [9], and the fact that many RT
enzymes retain their inhibitory properties even post denaturation
[15], there is need for alternative strategies to overcome this
limitation. Dilutions of RT products are often used to minimize
post-RT inhibitory effects [5,10,12,13,17,18], although this has
the negative consequence of reducing quantification precision,
PLoS ONE | www.plosone.org 1 November 2010 | Volume 5 | Issue 11 | e13931

which is especially problematic when dealing with very low copy
templates, such as those obtained from archival tissues.
Most biological applications utilizing RNA, such as gene
expression assays, generally rely on relative amounts of RNA as
opposed to discrete copy numbers, hence the absolute amount of
total RNA in a sample is of little importance [19]. In addition,
sensitivities with low templates are not generally of concern for
such assays, as expression levels are expected to be high. These
factors, however, are of paramount importance when dealing with
samples containing very low amounts of nucleic acid [16] or highly
fragmented RNA such as viral RNA recovered from archival
Formalin-Fixed Paraffin Embedded (FFPE) tissues [3]. For the
latter application, it is advantageous to use the most sensitive RT
enzyme available [20]. Given the increasing attempts by many
researchers to quantitatively determine RNA levels from very low
or highly degraded sources using commercially available reverse
transcriptases, it is surprising that their analytical sensitivity,
efficiency, and reproducibility are not extensively explored.
Most of the commercially available reverse transcriptases are
derived from Avian Myelomatosis Virus (AMV), Murine Moloney
Leukemia Virus (MMLV) and/or the Human Immunodeficiency
Virus (HIV). While it is claimed that these enzymes produce high
yields of cDNA during reverse transcription [21], some notable
studies have compared their relative performances [10,21,22,23,24],
and to our knowledge, only two have attempted to evaluate the
suitability of a few of these common RT enzymes in the reverse
transcription of low copy number RNA [10,12]. Using AMV-RT,
Chandler et al. [12] assessed inhibition of qPCR at low template
concentrations (2 fg – 2 pg), while Levesque-Sergerie et al. [10] tested
detection limits of five commercial reverse transcriptases on a
template range of 10–2,000 ng. Both of the above mentioned studies
were largely qualitative. Similar to the previous studies, Sieber et al.
[24] experimented on the sensitivity of 9 RT enzymes, however
detection limits were not tested and their results were based on RNA
obtained from different tissues, potentially prone to variations. Two
other studies have documented high sensitivity of RT-qPCR assays
aimed at detecting HIV-1, with a limit of 5 copies per ‘reaction’ and
1 copy/ml respectively [25,26]. While these are interesting results,
their study were each based on only one RT enzyme, among the
many commercial ones available which we tested herein.
The purpose and scope of this study therefore was to compare the
suitability of 11 commercially available reverse transcriptases with
an RT-qPCR assay for the sensitive detection of very low template
amounts. Using cDNA produced from increasing quantities of
Armored HIV RNA surrogate, we compared the analytical
sensitivity (detection limits), linearity of product amplification, intra-
and inter-assay variability, and qPCR amplification efficiency of all
of these RT-systems. We also tested the applicability of our
preferred RT enzyme in quantifying viral RNA from nucleic acid
extracts derived from a formalin fixed paraffin embedded tissue.
Since sample variations or differences in sample preparations may
influence any observed difference in enzyme efficiency [27], we used
a well tested primer pair and viral RNA standard, the Armored
HIV RNA [28,29], thereby eliminating potential variation due to
template sources. Overall, this evaluation should be fundamental in
guiding researchers striving to quantitatively detect low copy
number RNA or rare transcripts in genomic studies.
Materials and Methods
Ethics StatementThis study uses nucleic acid lysates from an archival human
visceral FFPE tissue in some of its assays. The approval for the use of
this tissue was obtained from the Institutional Review Boards (IRB) of
both the College of Health Sciences at Makerere University and the
Faculty of Health Sciences at McMaster University. Since the tissue
in question was anonymous and post-mortal, no informed consent
was necessary, save for the above IRB approval of its use in this study.
General overview of the studyThe archival FFPE tissue was extracted as previously reported
[30], and used to examine the suitability of the different RT
enzymes in successful amplification of nucleic acid from a typical
archival tissue lysate, but with known quantity. Prior to all
experimental setup, all glass, tubes, plastic wares and working
surfaces were bleached and treated with RNAse inhibitor, RNase
Zap (Ambion Inc, Austin, TX, USA), and all solutions were
prepared with diethylpyrocarbonate-treated water.
In quantitative assessment of the sensitivity of various commer-
cially available reverse transcriptases, the absolute copy numbers
of the target RNA molecules were calculated using appropriate
standard curves [31,32], from duplicate dilution series of the
Armored RNA Quant HIV standard (Asuragen, Inc. Austin, TX,
USA) during the reverse transcription stage [19,33]. Standard
curves provide a simple, rapid and reproducible indication of
efficiency, analytical sensitivity, and the variability of each assay
[32]. The number of amplification cycles needed to reach the
crossing point (Cq) was used to determine the starting template
amount in reactions where we assumed unknown template
amount. The Armored RNA Quant HIV (hereafter referred to
as Armored HIV RNA), is a viral RNA surrogate normally used in
extraction control, transcription or PCR-detection. It consists of a
456 bp GAG region sequence derived from HIV-1 B (HXB),
encapsulated within an MS2 bacteriophage particle that renders it
resistant to RNase digestion [29,34,35].
RT setup and reactionFirst-strand cDNA was synthesized from each serially diluted
Armored HIV RNA using all the 11 reverse transcriptase enzymes
evaluated in this study (Table 1). To avoid potential template
variation between assays, we used the same vial of Armored HIV
RNA, heated to 70uC for 3 min to release the RNA from its
bacteriophage-like complexes before cDNA synthesis. Fresh RNA
dilutions, ranging from 5–500 copies/ml were used for each assay
to avoid potential variation due to freeze-thaw cycles, which could
influence the quality of RNA. All RT reactions were prepared
using a single mastermix, strictly following the manufacturer’s
protocol (see supplementary Table S1 for detailed summary of
each protocol). In summary, each reaction was carried out in 20 ml
reaction volume using the HIV gene specific primer (GSP) SK431
[34]. Each duplicate reaction included the manufacturer recom-
mended amounts of GSP primer, dNTP mix, RT buffer, DTT,
RNase Inhibitor (except SML), Armored HIV RNA template and
reverse transcriptase enzyme, respectively.
Quantitative PCR assayThe RT products were amplified using primers SK462 and
SK431 to generate a 142 base pair amplicon [34]. The qPCR
reactions were performed using the MxP - Mx3000P Real Time
PCR System (Stratagene -Agilent Technologies, La Jolla, CA
USA). Each 20 ml reaction contained 16PCR Buffer II, 2.5 mM
MgCl2, 1.0 mg/ml bovine serum albumin (BSA), 250 mM of each
deoxynucleoside triphosphate (dNTP), 250 nM of each primer,
0.1676 SYBRGreen I, 0.05 U/ml AmpliTaq Gold DNA poly-
merase, and 2 ml of cDNA (or water for nontemplate controls).
The amplification profile consisted of 95uC for 7 min, 45 cycles of
95uC denaturation for 30 s, annealing at 65uC for 30 s, extension
at 72uC for 30 s, and a final extension at 72uC for 10 min. SYBR
Sensitivity of RT Enzymes
PLoS ONE | www.plosone.org 2 November 2010 | Volume 5 | Issue 11 | e13931
Green I based fluorescence data were acquired during each
annealing phase of the reaction, while a melting curve was
generated after the 45th amplification cycle to check amplification
specificity of RT-qPCR. All our analyses involved the manual
removal of background fluorescence using the MxPro - MX3000P
v4.10 (Stratagene) after each run.
In determining the level of RT-qPCR amplified products, the
quantification cycle was assumed to be proportional to the starting
Armored HIV RNA molecules in each dilution assayed. The
analytical sensitivity and efficiency of each reverse transcriptase
system was determined by amplifying cDNA derived from serial
dilutions of the above armoured HIV surrogate, using the same
mastermix in each qPCR assay. Another set of assays was done
independently on a different day to test for reproducibility across runs.
Assessing repeatability and reproducibilityThe repeatability of the tested RT enzymes in reverse
transcription was estimated as the standard deviation (sd) of
intra-assay quantification cycle (Cq) variance, while the reproduc-
ibility (inter-assay variability) was measured as the coefficient of
variation (cv) of an estimated copy number between different runs.
The latter were assayed based on ACC (details in Table 1),
preliminarily the most sensitive RT enzyme (its standard curve was
then used to estimate quantities in other enzymes). This test was
conducted using only the highest standard copy (1,000 copies per
reaction), and the variances were calculated both within and
between runs. Overall, the mean Cq and corresponding sd
between replicates within the same run, and percentage cv of
amplified copies between runs were calculated to assess reproduc-
ibility of each RT enzyme tested in accordance with the Minimum
Information for Publication of Quantitative Real-Time PCR
Experiments (MIQE) guidelines [32].
Establishing the standard curves and correlationcoefficients
The standard curve was generated by performing serial
dilutions of the armored HIV RNA and assaying each dilution
twice per RT enzyme, while using a non-template control in each
assay to check for contamination. Since all reverse transcription
reactions were carried out in 20 ml reaction volumes, the template
RNA amount ranged from 10, 100 and 1,000 copies per reaction
(<1–100 fg/ml). To determine linearity in cDNA synthesis of the
different assays, we amplified the three aforementioned dilutions,
plotted the Cq values against the amplified copies, and calculated
the linear regression of the curve as well as the correlation
coefficient (Rsq). The quality of the standard curve generated from
each RT reaction was judged via the slope and its Rsq, as well as
the amplification efficiency using the software Mx3000P. In
theory, the slope should be 23.3, representing a theoretical
doubling stemming from a 1:10 dilution series. So, an RT-qPCR
yielding a slope lower than 23.3 would wrongly indicate its
efficiency is greater than 100% and hence each quantification
cycle would be generating more than twice the amount of cDNA
copies. If this is observed, it would be attributable to the RT
enzyme system itself, since the primers and qPCR reagents were
consistent across all RT enzymes tested.
Assessing performance of RT enzymes with FFPE tissueFor a comparison of how the different RT enzyme systems
would synthesize cDNA from a typical archival FFPE tissue
extract, we spiked all nucleic acid extracts from a typical FFPE
tissue of 1995 [30] with a known amount of RNA standard and
compared their cDNA yields to those obtained from the same
amount of RNA standard assayed under identical conditions,
though in the absence of extract. The Cq measured from the
spiked reaction was compared with that of the control reaction,
with the assumption that an RT enzyme performing well in the
presence of a typical FFPE tissue extract should show similar or
increased Cq relative to that in the un-spiked reference standard.
This assay enabled testing/comparing the relative performance of
the RT enzymes in reverse transcribing RNA from a typical FFPE
tissue extract with similar RNA quantity, but also indirectly shows
how potential co-purified inhibitors in the FFPE tissue would affect
RT-qPCR accuracy.
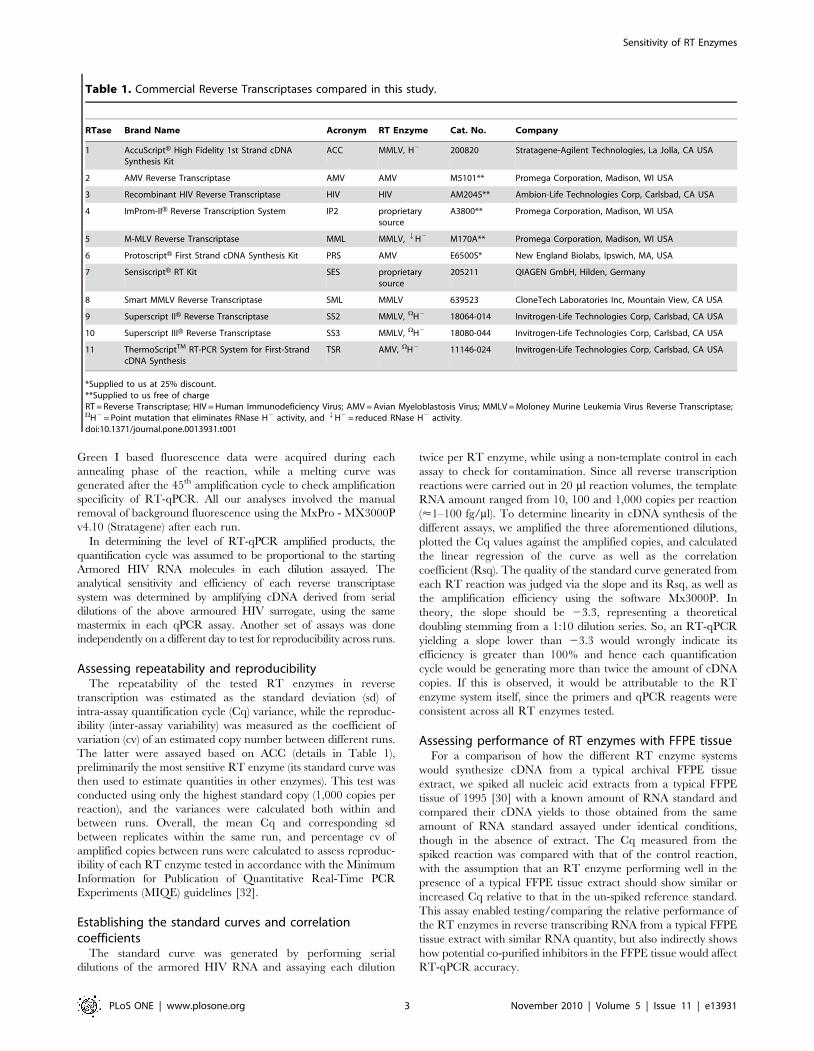
Table 1. Commercial Reverse Transcriptases compared in this study.
RTase Brand Name Acronym RT Enzyme Cat. No. Company
1 AccuScriptH High Fidelity 1st Strand cDNASynthesis Kit
ACC MMLV, H2 200820 Stratagene-Agilent Technologies, La Jolla, CA USA
2 AMV Reverse Transcriptase AMV AMV M5101** Promega Corporation, Madison, WI USA
3 Recombinant HIV Reverse Transcriptase HIV HIV AM2045** Ambion-Life Technologies Corp, Carlsbad, CA USA
4 ImProm-IIH Reverse Transcription System IP2 proprietarysource
A3800** Promega Corporation, Madison, WI USA
5 M-MLV Reverse Transcriptase MML MMLV, QH2 M170A** Promega Corporation, Madison, WI USA
6 ProtoscriptH First Strand cDNA Synthesis Kit PRS AMV E6500S* New England Biolabs, Ipswich, MA, USA
7 SensiscriptH RT Kit SES proprietarysource
205211 QIAGEN GmbH, Hilden, Germany
8 Smart MMLV Reverse Transcriptase SML MMLV 639523 CloneTech Laboratories Inc, Mountain View, CA USA
9 Superscript IIH Reverse Transcriptase SS2 MMLV, VH2 18064-014 Invitrogen-Life Technologies Corp, Carlsbad, CA USA
10 Superscript IIIH Reverse Transcriptase SS3 MMLV, VH2 18080-044 Invitrogen-Life Technologies Corp, Carlsbad, CA USA
11 ThermoScriptTM RT-PCR System for First-StrandcDNA Synthesis
TSR AMV, VH2 11146-024 Invitrogen-Life Technologies Corp, Carlsbad, CA USA
*Supplied to us at 25% discount.**Supplied to us free of chargeRT = Reverse Transcriptase; HIV = Human Immunodeficiency Virus; AMV = Avian Myeloblastosis Virus; MMLV = Moloney Murine Leukemia Virus Reverse Transcriptase;VH2 = Point mutation that eliminates RNase H2 activity, and QH2 = reduced RNase H2 activity.doi:10.1371/journal.pone.0013931.t001
Sensitivity of RT Enzymes
PLoS ONE | www.plosone.org 3 November 2010 | Volume 5 | Issue 11 | e13931

Inhibition and post-RT cleanup methodTo assess the potential benefits of post RT purification on
qPCR inhibition, we chose a single enzyme (ACC) and performed
a reaction in which we spiked the reactant cDNA product into a
qPCR amplification with a known standard, 16103 copies/ml of a
purified cloned-PCR product (cytochrome b) of mammoth [36].
We then compared the Cq obtained from the spiked amplification
with that of a control reaction, with the expectation that any
observed delay (shift) in the Cq relative to that of the amplified
control would be an indication of inhibition [37]. We then tested
two different purification methods to choose the most suitable one
for post-RT cleanups; i) PCI-Microcon, the phenol-chloroform-
isoamyl alcohol purification with subsequent Microcon YM-30
Centrifugal Filter Unit concentration (Millipore, Temecula CA,
USA), and ii) MiniElute, the MinElute PCR Purification Kit
(QIAGEN, Hilden, Germany), and compared them with both
straight and diluted RT products. Briefly, the PCI–Microcon
involved bringing the RT aliquots up to 100 ml with 0.1xTE buffer
(pH 7.5), and 50 ml of 25:24:1 phenol/chloroform/isoamyl
alcohol was added to each subsample, mixed gently by vortexing
before spinning at 13,200 rpm in a microcentriguge for 2 min.
The aqueous phase from above was re-extracted with 50 ml of
chloroform before concentration using the Microcon YM-30
according to the manufacturer’s instructions. The MiniElute
protocol on the other hand was followed as described by the
manufacturer (QIAGEN). In all cases, the final eluates were made
to the same volume as the initial starting RT product volume so
that no later adjustments in volumes would be necessary.
Data analysisWe determined the correlation coefficient (Rsq), the slope and
hence efficiency of each assay using the Mxp-Mx3000P software,
employing the same threshold setting within each run. Other data
analyses, including assay precision (measured from the coefficient
of variation), standard deviation and statistical significance of
observed differences in results were calculated using the Data
Analysis Tools in the Microsoft Office Excel (Microsoft Corp,
USA), and R version 2.11 [38].
Results
The serially diluted HIV RNA used in this study ranged from
500 copies/ml (56.40 fg/ml) to 5 copies/ml (0.564 fg/ml). Further
dilutions were not attempted as it would be below a reliable PCR
detection limit. Typically, the theoretical analytical sensitivity of a
given PCR with certainty is approximately 3 copies [39], assuming
a Poisson distribution, and a 95% chance that at least 1 copy is
detected in the PCR.
Repeatability, reproducibility and sensitivityGenerally, melt curve analysis confirmed the majority yielded
products of expected size, but some of them had multiple peaks that
suggested multiple products (Figure S1) or lacked any amplified
product (failed reactions), many of the latter stemmed from the
lower RNA template dilutions. The RT enzymes that produced
erroneous efficiencies due to non-specificity (eg SML) or failed
altogether at the low copy end were excluded from further analysis
that required all dilution points. In brief, six RT enzymes amplified
the low RNA copy number standards (five of them consistently
across all replicates tested), while most enzymes amplified the high
copy number standards both within and between assays.
Only a few did not work consistently across runs (Figure 1),
leaving 7 of the 11 amplifying all replicates at the high end (Figure
S2). Ultimately, we were left with only 5 RT enzyme systems
(ACC, HIV, SS3, MML and TSR), where we could estimate and
compare amplification Rsq as well as efficiency (Figure S3), with
their standard curves varying in linearity and efficiency (Figure 2),
emphasizing their variation in analytical sensitivity, especially at
low copy number RNA levels.
The Cqs of each standard dilution point across replicates were
generally similar although SS3 and ACC RT enzymes were the
most consistent in their amplification of low copy number templates
(Figure 1). The overall technical variability, calculated as average
percentage coefficient of variation showed SES (cv = 4.27) and HIV
(cv = 3.41) as the two most variable RT enzymes, while SS3
(cv = 0.89) and ACC (cv = 1.00) as the least variable and thus the
most reproducible RT enzymes. In terms of technical reproducibly
at the lowest copy numbers, the best two RT enzymes were SS3
(sd = 0.39%) and ACC (sd = 1.04%), while overall, ACC remained
the most reproducible (sd = 1.44%), with the least reproducible
enzyme being MML (sd = 137.63%); detailed results (see Table 2).
Standard curves, correlation coefficients (Rsq) andefficiency
The standard curve method, commonly used to estimate target
DNA amounts from unknown samples based on a serially diluted
standard, requires the amplification efficiency in the samples to be
the same as those in the standards used [19]. The 5 enzymes
exhibited clear linear relationships among the dilution points and
Cq values obtained from amplification of Armored HIV RNA, with
each yielding an Rsq of $0.95, except for the HIV RT enzyme
(0.85). The standard curves for the five best enzymes as judged by
consistency and efficiency are shown in Figure 2, with their 95%
confidence intervals. Also included are the correlation coefficients
(the linearity of each RT enzyme tested) as well as their efficiencies.
The qPCR efficiencies calculated from the standard curves were
generally high, ranging from 119.3 to 77.2%, suggesting reverse
transcription was similarly efficient for these enzymes.
Performance of commercial RTs in the presence of FFPEextract
The RT enzymes varied considerably in their ability to reverse
transcribe Armored HIV RNA spiked with a typical FFPE tissue
extract, showing seven of the enzymes to consistently amplify
1,000 copies of Armored RNA tested (Figure S2). Overall, ACC,
TSR and SS3 exhibited the most superior capability to synthesize
cDNA from FFPE tissue lysates as suggested by their very small Cq
(sd) and consistent amplification across all replicates tested. The
other RT systems (not indicated), completely failed, were
irreproducible or displayed high intra-assay variability in relation
to the un-spiked standard (Figure S4).
Post-RT cleanup minimizes RT inhibitory effectWhile the impact of inhibitory components of RT reactions on
known standards have been previously evaluated [9], no study to
our knowledge has systematically evaluated such a large number of
enzymes as tested here. The results of our inhibition tests showed a
clear inhibitory effect of the RT reagents on qPCR as demonstrated
by a Cq shift in the quantification cycle relative to the PCI-
Microcon cleaned cDNA (Figure 3), but not statistically significant
(Wilcoxon–Mann–Whitney test, P = 0.1). However, of the two
purification methods tested, the PCI–Microcon yielded significantly
more number of template molecules than the MiniElute purified
ones (Wilcoxon–Mann–Whitney test, P,0.005). The two methods,
however, did not significantly differ when #20% of the RT-
reactions were used in the qPCR setup. Therefore, using more
than 20% RT products in a qPCR reaction certainly reduces
Sensitivity of RT Enzymes
PLoS ONE | www.plosone.org 4 November 2010 | Volume 5 | Issue 11 | e13931

amplification success, as demonstrated by a delayed Cq shift, and
thus if cDNA syntheses are to be used for downstream PCRs
detection of low copy templates, it would be wise to purify RT
reaction products before further assay.
Discussion
In order to find the most suitable RT enzyme for amplifying low
copy RNA, a total of 11 commercial reverse transriptases derived
from either Moloney Murine Leukemia Virus (ACC, MML, SML,
SS2 & SS3), Avian Myeloblastosis Virus (AMV, PRS & TSR),
Human Immunodeficiency Virus (HIV), or other proprietary
sources (IP2 and SES) were compared (Table 1). Four of these
enzymes were engineered with RNAse H minus point mutations to
render them non-degrading to RNA, while one had RNase H
activity substantially reduced, in addition to other characteristics
and optimizations (see Tables 1 & S1 for more information). The
suitability of the RT enzymes in reverse transcribing RNA from
FFPE tissue extracts was also assessed. All results were based upon
the quantitative amplification of a known number of armored HIV
RNA copies using a widely accepted standard curve method [19].
To the best of our knowledge, our study represents the first to
analyse the lowest quantitatively known copy number RNA
templates, a level more likely to be found in RNA extracts from
archival formalin fixed tissues. The results presented in this study
were based on a viral RNA surrogate, and applied to nucleic acid
lysates derived from archival FFPE tissue based on gene-specific
primers. As such, their relative performance may vary if RNA
obtained from other tissue types or random primers are used,
however evaluation of this is beyond the scope of the present study.
Reproducibility and efficiency of RT reactionsWhile the results presented here largely agree with the Invitrogen
(Life Technologies) assertion that their SuperScriptH family of
reverse transcriptases delivers reliable and consistent results, we
hereby show that other enzymes perform equally well and
consistently, especially at low template amounts. From the 11 RT
enzymes studied, five enzymes (ACC, HIV, SS3, MML and TSR)
produced reproducible results across all dilution points tested. The
other RT enzymes all exhibited nonspecific products in the melt
curves (Supplemental Figure S1), with efficiencies sometimes greater
than 100%, and hence were excluded, leaving only five best
performing enzymes (Figure 2) for further analysis. Overall, these
five reverse transcriptases either had no or comparatively reduced
RNase H activity, suggesting that mutant RNase-H- RT enzymes
might out perform their generic counterparts. Using the ACC based
calibration curve, we observed the most reproducible yield from
SS2 and SS3 enzymes. The amplified 1,000 RNA copies were
slightly overestimated for the IP2 enzyme (Figure S2), and the lowest
inter-assay variation was observed in ACC, followed by SS3, while
HIV RT had the highest variation (Figure 2 and Table 2).
Analytical sensitivity and efficiency of reversetranscriptases
While the majority of the total eleven enzymes failed to
consistently amplify across the range tested (Table 2), the five
which performed well at the lowest template end tested (Figure 1),
are more suitable for studies aiming at detecting low amounts of
RNA templates. In particular, ACC and SS3 demonstrated the
most analytical sensitivity and reproducible enzymes across all
dilution points (Table 2, Figure 2), with overall superiority at low
amounts of viral RNA tested. There are many reasons for failed
amplifications at low copies, as has been previously noted
elsewhere [8,40,41]. Inter-assay reproducibility of the different
enzymes based strictly on the highest template amounts was
greatest in ACC and SS2 (Figure S2), with their percentage
coefficients of variation at 1.44 and 4.99 respectively (see Table 2
for more details). Overall, our results corroborate a previous study
that assessed the efficiency and sensitivity of different commercial
reverse transriptases, where reverse transcription at high template
Figure 1. Average quantification cycles (and their standard deviations, represented as error bars) from 10, 100, 1000 copies ofArmored HIV RNA assayed using all 11 reverse transcriptases compared in this study. The coloring corresponds to the copies of ArmoredRNA in each reaction. Only Cq points above 25 cycles are shown to emasize the differences among the enzymes assessed.doi:10.1371/journal.pone.0013931.g001
Sensitivity of RT Enzymes
PLoS ONE | www.plosone.org 5 November 2010 | Volume 5 | Issue 11 | e13931

numbers was efficient for all RTs tested, but low template amounts
could not be detected with certain RT systems [10].
Two previous studies have reported high sensitivity of RT-qPCR
assays for the detection HIV-1, with their limits at 5 copies per
reaction and 1 copy/ml respectively [25,26]. These two studies did
not compare different RT systems but rather focused on Multi-
Scribe and SuperScript II RT enzymes respectively. While there are
a few other commercially available reverse transcriptases on the
market, and potentially in individual laboratories, our study
represents one of the most comprehensive evaluations of the major
commercial RT enzymes available on the market today. Contrary
to a study by Levesque-Sergerie et al. [10], which found most RT
enzymes tested were not able to reverse transcribe below 2,500
RNA copies (except for Superscript II), we observed that 9 of the 11
RT enzymes tested in this study could detect 1,000 Armored HIV
RNA copies, across all replicates assayed, while seven of them were
sensitive to 100 copies, and only five of them consistently amplified
over the entire range tested (10–1,000 RNA copies, see Table 2 and,
Figures 1 & 2). Interestingly, SS2 or SES were not among these,
though they were the two best enzymes reported by Levesque-
Sergerie et al. [10]. The lack of sensitivity of some RT systems at low
template RNA amounts could be due to either PCR inhibitors or
Figure 2. Standard curves for the five most reproducible reverse transcriptases that amplified all Armored HIV RNA replicatestested in this study. The standard curves (solid lines) and their associated 95% confidence intervals (dashed lines) were generated by the Mxp-MX3000Psoftware by plotting quantification cycles (Cq) against RNA molecules (10–1,000 copies) amplified in duplicates. Only Cq points above 25 are shown in thegraphs to emphasize phthe differences among the enzymes assessed. Correlation coefficients (Rsq) and amplification efficiencies (Eff.) as well as the linearequation of each curve are shown. The tightness of the 95% confidence limit shows quantification accuracy given an input RNA template amount.doi:10.1371/journal.pone.0013931.g002
Sensitivity of RT Enzymes
PLoS ONE | www.plosone.org 6 November 2010 | Volume 5 | Issue 11 | e13931

preferential primer-dimer formation [10,13]. Primer-dimer forma-
tion can be exacerbated by limited template or extended
amplification cycles beyond the linear phase of PCR [42]. These
factors likely also lead to the occurrence of artificially inflated PCR
amplification efficiencies over 100% [15]. Due to lack of sensitivity
[43], there is clearly a need for post-RT purification in order to
remove the reverse transcriptase and the RT components prior to
performing PCR [15], or the use of mutant Taq DNA polymerases
that are resistant to these inhibitors [44]. Since cleaning up the
reactions seems beneficial, we investigated post-RT cleaning
methods for low template RT-products as discussed below.
Post-RT cleaning methods appropriate for low templateRT-qPCR
The cDNA synthesis and the successful use of its product in
PCR amplification may be influenced by numerous factors, and
this may depend on the type of reverse transcriptase enzyme used.
Previous studies have suggested that reverse transcriptase enzymes
inhibit PCR at low template concentrations [5,12,13,14]. Two
studies have documented simply using up to half of or all of the
RT reaction (after heat-killing the RT) in the subsequent PCR
reaction without any apparent problem with the sensitivity of the
subsequent PCR step [25,26]. This is in contrast to our paper,
which suggests a strong inhibitory effect. This may be due to the
less inhibitory effect of the reagents in the respective RT systems or
PCR enzymes used after RT are inhibition resistant. While simply
increasing template concentrations might be useful when dealing
with modern and invasively obtained DNA sources, such a
strategy would not work for low copy viral RNA from highly
degraded archival FFPE tissues, especially if the same extracts are
needed for multiple tests/targets.
The inhibition test we performed [36,45] confirmed inhibitory
effect of RT on qPCR, depicted by the straight (unpurified) RT
products being substantially delayed in their qPCR Cq relative to
the standard (Figure 3A). While RT dilution seems the easiest way to
overcome this inhibition, as has been widely recommended to
augment qPCR amplification success [5,12,13,14], this strategy has
the negative consequence of reducing the number of available
template copies, and is thus not a suitable alternative when template
molecules are expected to be minimal. Diluting the RT products
before downstream application [5] likely yields inconsistent and
non-reproducible detection [8,11], owing to competition between
RT molecules and DNA polymerase I in the PCR, thereby
decreasing the reaction efficiency [15]. For this reason, we tested the
efficacy of removing post-RT inhibition using two alternative cDNA
methods; the PCI-Microcon and the MiniElute purifications.
Based on our results, it is clear there is a comparative advantage
in cleaning the RT products as opposed to using them straight or
diluted. Specifically, we observed that post-RT cleaning with the
PCI-Microcon method enhances the qPCR success, yielding
relatively more amplified products even at increased template
amounts (Figure 3B). In addition to being a better method at
limiting the RT inhibition, we hypothesize that this purification
method might be better at releasing the RNA:DNA complexes
and hence increasing cDNA availability for qPCR amplification.
We also found that up to 40% of the PCI-Microcon purified RT
product could be used in a qPCR without substantially inhibiting
the reaction (Figure 3), whereas increasing template volume
beyond 20% for MiniElute cleaned RT product met with
increased Cq, suggesting interference with amplification. This
could be due to competition of the RT molecules with DNA
polymerase I in qPCR thereby decreasing the reaction efficiency
[15]. Increasing template amount beyond 10% substantially delays
Cq relative to the standard, suggesting increased inhibitory effect
on qPCR at this stage. Although the reasons for the differences
between the two methods are not clear, relatively more inhibitory
properties still remains after MiniElute purifications as reported
previously [28,46].
ConclusionsOur results suggest that, of the 11 reverse transcriptase enzymes
subjected to our investigation, the Accuscript (ACC) and
Superscript III (SS3) were the best performing enzymes in terms
of reproducibility and sensitivity for low copy RNA levels. For
those wishing to quantify low RNA template molecules, it is
advisable to augment the detection via use of a PCI-Microcon
purification step, and where necessary use up to 40% of the
purified RT product in downstream applications, such as qPCR.
This option is favored over simple dilution to minimize inhibition
when template amounts are presumed to be minimal.
Table 2. Sensitivity as well as intra-assay and inter-assay reproducibility of the 11 reverse transcriptase enzymes assessed in thisstudy.
RT ACC AMV HIV IP2 MML PRS SES SML SS2 SS3 TSR
A: Sensitivity and reproducibility
10 33.6960.35 NA 34.4362.34 NA 34.9760.71 34.68 NA NA NA 35.6960.14 35.7561.01
100 30.9460.37 42.78 31.9760.56 31.3160.68 32.8060.49 NA 34.42 NA 31.5460.28 31.0460.18 31.8760.60
1000 27.5960.21 NA 28.5360.48 27.1160.08 28.5260.33 30.1760.30 34.2061.46 NA 27.7660.32 27.6360.47 28.6960.38
B: Intra-assay variability
10 1.04 NA 6.80 NA 2.03 NA NA NA NA 0.39 2.83
100 1.20 NA 1.75 2.17 1.49 NA NA NA 0.89 0.58 1.88
1000 0.76 0.31 1.68 0.30 1.16 0.99 4.27 NA 1.15 1.70 1.32
Average 1.00 0.31 3.41 1.23 1.56 0.99 4.27 NA 1.02 0.89 2.01
C: Inter-assay variability
1000 1.44 NA 64.75 7.43 137.63 NA NA NA 4.99 21.31 63.68
sd = standard deviation, cv = coefficient of variation. A) Sensitivity and reproducibility (mean Cq6sd, n = 2) within a run; B) Intra-assay variability [% cv = (sd/meanCq)x100] based on replicate runs; C) Inter-run variability of cDNA quantification derived from 1,000 copies of Armored HIV RNA with ACC reverse transcriptase providingthe calibration curve. NA denotes failed amplifications or values excluded due to non-specific products, while Cq values with no sd amplified only once.doi:10.1371/journal.pone.0013931.t002
Sensitivity of RT Enzymes
PLoS ONE | www.plosone.org 7 November 2010 | Volume 5 | Issue 11 | e13931

Supporting Information
Table S1 Detailed reverse transcription steps, reaction condi-
tions and ingredients for all the 11 commercial reverse
transcriptases studied. The same colour coding at each stage
show groups enzymes that were incubated together for the
respective stage, the rest of the stages were all done in unison.
Found at: doi:10.1371/journal.pone.0013931.s001 (0.04 MB XLS)
Figure S1 The qPCR profile of all the amplifications conducted
in this study, showing clearly differentiated melt curves. Melt curve
of the expected products peaked at ,84uC, while those from the
unspecific amplicons (erroneous amplifications) peaked at ,82uC,
the latter comprised largely of primer dimmers. Because of many
number of amplifications combined in this figure, it was impossible
to provide the legend to each curve.
Found at: doi:10.1371/journal.pone.0013931.s002 (0.60 MB EPS)
Figure S2 Intra-run and inter-run variability of the 11
commercial reverse transcriptases (mean6sd, n = 2) based on
amplification of cDNA produced from 1,000 copies of Armored
HIV RNA. A) shows the results presented across runs in ascending
Figure 3. Comparison of amplification success measured by quantification cycle (Cq) of the straight cDNA with post-RT processedcDNA. Post-RT processing was by means of dilutions, phenol-chloroform-isoamylalcohol-microcon and MiniElute purification of ACC generatedRT products, the latter two in tripcates. A) Typical amplifications profile of a DNA standard (green), compared to ones spiked with RT unpurified(straight; in red) and PCI-Microcon YM-30 cleaned products (blue). The shift in Cq when the amplification reaction included straight RT productsdemonstrates the inhibitory effects of RTs. B), comparison of the strategies used to reduce inhibitory effects of RT, with blue bars showing dilutions(as percentage reduction of straight template) and increasing amounts of post-RT cleaned products (depicted as purple stripes, superimposed onyellow bars). Only Cq points above 25 were shown in the graphs to emphasize the differences revealed. Straight/Dilution = Straight Armored RNAtemplates range from 0.25–40%, and PCI-Microcon = phenol-chloroform microcon cleaned Armored RNA products.doi:10.1371/journal.pone.0013931.g003
Sensitivity of RT Enzymes
PLoS ONE | www.plosone.org 8 November 2010 | Volume 5 | Issue 11 | e13931
order, while B are the means across runs of estimated cDNA
copies produced between different assays. The comparisons were
based on quantities estimated with ACC reverse transcriptase
providing the calibration curve, for all other RT enzymes. AMV
(Promega) failed in the second experiment and hence couldn’t be
compared, while we excluded SML (CloneTech) due to the non-
specific products consistently obtained across the different runs.
Found at: doi:10.1371/journal.pone.0013931.s003 (0.29 MB EPS)
Figure S3 The HIV-1 qPCR assay showing collective plots from
replicate amplifications across the best 5 reverse transcriptases.
The panels A, B and D show amplification tests with 10, 100 and
1000 Armored HIV RNA copies (panels A, B & C respectively)
and their combined melting curves (panel D). Only Cq points
above 25 were shown in the graphs to emphasize the differences
among the enzymes assessed.
Found at: doi:10.1371/journal.pone.0013931.s004 (0.65 MB EPS)
Figure S4 The average quantification cycle (Cq) obtained from
seven RT enzymes that consistently amplified the 1,000 copies of
input Armored HIV RNA standard. The straight (arRNA) were
compared to spiked ones (FFPE+arRNA) to assess their reverse
transcription success with known RNA from a typical FFPE tissue.
Found at: doi:10.1371/journal.pone.0013931.s005 (0.21 MB EPS)
Acknowledgments
We thank Alison Devault, Jacob Enk and Christine King for their helpful
discussions and suggestions on the paper. We are grateful to Promega
(Corporation, Madison, WI USA), Ambion-Life Technologies Corp
(Carlsbad, CA USA), and New England Biolabs (Ipswich, MA, USA) for
providing us with free samples of their respective reverse transcriptase
enzyme system/kit assessed in this study.
Author Contributions
Conceived and designed the experiments: JBAO LR DP KB ALO GSB
NKS KRH MK HP. Performed the experiments: JBAO LR MK.
Analyzed the data: JBAO LR KB KRH MK HP. Contributed reagents/
materials/analysis tools: JBAO DP ALO GSB NKS KRH MK HP. Wrote
the paper: JBAO LR DP KB ALO GSB NKS MK HP.
References
1. Taniguchi K, Kajiyama T, Kambara H (2009) Quantitative analysis of gene
expression in a single cell by qPCR. Nat Meth 6: 503–506.
2. Karlen Y, McNair A, Perseguers S, Mazza C, Mermod N (2007) Statistical
significance of quantitative PCR. BMC Bioinform 8: 131.
3. McKinney MD, Moon SJ, Kulesh DA, Larsen T, Schoepp RJ (2009) Detection
of viral RNA from paraffin-embedded tissues after prolonged formalin fixation.
J Clin Virol 44: 39–42.
4. Kawasaki E (1990) Amplification of RNA. In: Innis MA, Gelfand DH,
Sninsky JJ, While TJ, eds. PCR protocols: A guide to methods and applications.
San Diego, CA: Academic Press.
5. Sellner LN, Coelen RJ, Mackenzie JS (1992) Reverse transcriptase inhibits Taq
polymerase activity. Nucl Acids Res 20: 1487–1490.
6. Arezi B, Salehi M (2006) High quality external RNA control detects inhibitors in
RNA samples. Strategies 19: 52.
7. Verma IM (1977) The reverse transcriptase. BBA-Rev Cancer 473: 1–38.
8. Bustin S, Nolan T (2004) Pitfalls of Quantitative Real-Time Reverse-
Transcription Polymerase Chain Reaction. J Biomol Tech 153: 155–166.
9. Arezi B, McCarthy M, Hogrefe H (2010) Mutant of Moloney murine leukemia
virus reverse transcriptase exhibits higher resistance to common reverse
transcriptase-quantitative polymerase chain reaction inhibitors. Anal Biochem
400: 301–303.
10. Levesque-Sergerie J-P, Duquette M, Thibault C, Delbecchi L, Bissonnette N
(2007) Detection limits of several commercial reverse transcriptase enzymes:
impact on the low- and high-abundance transcript levels assessed by quantitative
RT-PCR. BMC Mol Biol 8: 93.
11. Stahlberg A, Kubista M, Pfaffl M (2004) Comparison of Reverse Transcriptases
in Gene Expression Analysis. Clin Chem 50: 1678–1680.
12. Chandler DP, Wagnon CA, Bolton H, Jr. (1998) Reverse Transcriptase (RT)
Inhibition of PCR at Low Concentrations of Template and Its Implications for
Quantitative RT-PCR. Appl Environ Microbiol 64: 669–677.
13. Chumakov KM (1994) Reverse transcriptase can inhibit PCR and stimulate
primer-dimer formation. Genome Res 4: 62–64.
14. Fehlmann C, Krapf R, Solioz M (1993) Reverse transcriptase can block
polymerase chain reaction. Clin Chem 39: 368–369.
15. Suslov O, Steindler DA (2005) PCR inhibition by reverse transcriptase leads to
an overestimation of amplification efficiency. Nucl Acids Res 33: e181-.
16. Lekanne Deprez RH, Fijnvandraat AC, Ruijter JM, Moorman AFM (2002)
Sensitivity and accuracy of quantitative real-time polymerase chain reaction
using SYBR green I depends on cDNA synthesis conditions. Anal Biochem 307:
63–69.
17. Cottam EM, King DP, Wilson A, Paton DJ, Haydon DT (2009) Analysis of
Foot-and-mouth disease virus nucleotide sequence variation within naturally
infected epithelium. Virus Res 140: 199–204.
18. Wilson IG (1997) Inhibition and Facilitation of Nucleic Acid Amplification. Appl
Environ Microbiol 63: 3741–3751.
19. Cikos S, Bukovska A, Koppel J (2007) Relative quantification of mRNA:
comparison of methods currently used for real-time PCR data analysis. BMC
Mol Biol 8: 113.
20. Wong L, Pearson H, Fletcher A, Marquis CP, Mahler S (1998) Comparison of
the Efficiency of Moloney Murine Leukaemia Virus (M-MuLV) Reverse
Transcriptase, RNase H—M-MuLV Reverse Transcriptase and Avian Myelo-
blastoma Leukaemia Virus (AMV) Reverse Transcriptase for the Amplification
of Human Immunoglobulin Genes. Biotechnol Tech 12: 485–489.
21. Jefferies D, Farquharson C (2002) Effects of choice of reverse-transcriptase
enzyme and use of T4 gene 32 protein on banding patterns in agarose gel
differential display. Anal Biochem 308: 192–194.
22. Barragan-Gonzalez E, Lopez-Guerrero JA, Bolufer-Gilabert P, Sanz-Alonso M,
De la Rubia-Comos J, et al. (1997) The type of reverse transcriptase affects the
sensitivity of some reverse transcription PCR methods. Clinica Chimica Acta
260: 73–83.
23. Stangegaard M, Dufva I, Dufva M (2006) Reverse transcription using random
pentadecamer primers increases yield and quality of resulting cDNA.
BioTechniques 40: 649–657.
24. Sieber MW, Recknagel P, Glaser F, Witte OW, Bauer M, et al. (2010)
Substantial performance discrepancies between commercially available kits for
rt-qPCR - A systematic comparative investigator-driven approach. Anal
Biochem 401: 303–311.
25. Henning TR, Nedra L, Angela Martin A (2009) Efficient methodologies for
sensitive HIV-1 RNA quantitation from plasma and vaginal secretions. J Clin
Virol 46: 309–313.
26. Palmer S, Wiegand AP, Maldarelli F, Bazmi H, Mican JM, et al. (2003) New
Real-Time Reverse Transcriptase-Initiated PCR Assay with Single-Copy
Sensitivity for Human Immunodeficiency Virus Type 1 RNA in Plasma. J Clin
Microbiol 41: 4531–4536.
27. Stahlberg A, Aman P, Ridell B, Mostad P, Kubista M (2003) Quantitative Real-
Time PCR Method for Detection of B-Lymphocyte Monoclonality by
Comparison of {kappa} and {lambda} Immunoglobulin Light Chain Expres-
sion. Clin Chem 49: 51–59.
28. Hietala SK, Crossley BM (2006) Armored RNA as Virus Surrogate in a Real-
Time Reverse Transcriptase PCR Assay Proficiency Panel. J Clin Microbiol 44:
67–70.
29. Pasloske BL, Walkerpeach CR, Obermoeller RD, Winkler M, DuBois DB
(1998) Armored RNA Technology for Production of Ribonuclease-Resistant
Viral RNA Controls and Standards. J Clin Microbiol 36: 3590–3594.
30. Okello JBA, Zurek J, Devault AM, Kuch M, Okwi AL, et al. (2010) Comparison
of methods in the recovery of nucleic acids from archival formalin-fixed paraffin-
embedded autopsy tissues. Anal Biochem 400: 110–117.
31. Bustin SA (2000) Absolute quantification of mRNA using real-time reverse
transcription polymerase chain reaction assays. J Mol Endocrinol 25: 169–193.
32. Bustin SA, Benes V, Garson JA, Hellemans J, Huggett J, et al. (2009) The MIQE
Guidelines: Minimum Information for Publication of Quantitative Real-Time
PCR Experiments. Clin Chem 55: 611–622.
33. Ramakers C, Ruijter JM, Deprez RHL, Moorman AFM (2003) Assumption-free
analysis of quantitative real-time polymerase chain reaction (PCR) data.
Neurosci Lett 339: 62–66.
34. Mulder J, McKinney N, Christopherson C, Sninsky J, Greenfield L, et al. (1994)
Rapid and simple PCR assay for quantitation of human immunodeficiency virus
type 1 RNA in plasma: application to acute retroviral infection. J Clin Microbiol
32: 292–300.
35. WalkerPeach CR, Winkler M, DuBois DB, Pasloske BL (1999) Ribonuclease-
resistant RNA Controls (Armored RNA) for Reverse Transcription-PCR,
Branched DNA, and Genotyping Assays for Hepatitis C Virus. Clin Chem 45:
2079–2085.
36. Schwarz C, Debruyne R, Kuch M, McNally E, Schwarcz H, et al. (2009) New
insights from old bones: DNA preservation and degradation in permafrost
preserved mammoth remains. Nucl Acids Res 37: 3215–3229.
Sensitivity of RT Enzymes
PLoS ONE | www.plosone.org 9 November 2010 | Volume 5 | Issue 11 | e13931

37. King CE, Debruyne R, Kuch M, Schwarz C, Poinar HN (2009) A quantitative
approach to detect and overcome PCR inhibition in ancient DNA extracts.BioTechniques 47: 941–949.
38. R-Development-Core-Team (2010) R (Version 2.11.1): A language and
environment for statistical computing. Vienna: The R Foundation for StatisticalComputing.
39. Wittwer C, Kusukawa N (2004) Real-time PCR. In: Persing D, Tenover F,Versalovic J, Tang YW, Unger ER, Relman DA, White TJ, eds. Molecular
Microbiology: Diagnostic Principles and Practice. Washington, DC: American
Society for Microbiology. pp 71–84.40. Bustin SA, Benes V, Nolan T, Pfaffl MW (2005) Quantitative real-time RT-PCR
- a perspective. J Mol Endocrinol 34: 597–601.41. Karrer EE, Lincoln JE, Hogenhout S, Bennett AB, Bostock RM, et al. (1995) In
situ isolation of mRNA from individual plant cells: creation of cell-specific cDNAlibraries. Proc Natl Acad Sci U S A 92: 3814–3818.
42. Gal AB, Carnwath JW, Dinnyes A, Herrmann D, Niemann H, et al. (2006)
Comparison of real-time polymerase chain reaction and end-point polymerasechain reaction for the analysis of gene expression in preimplantation embryos.
Reprod Fertil Dev 18: 365–371.
43. Pfaffl MW (2004) Quantification strategies in real-time PCR In: Bustin SA, ed.A-Z of quantitative PCR. La Jolla, CA, USA: International University Line
(IUL).44. Kermekchiev MB, Kirilova LI, Vail EE, Barnes WM (2009) Mutants of Taq
DNA polymerase resistant to PCR inhibitors allow DNA amplification from
whole blood and crude soil samples. Nucl Acids Res 37(5): e40.45. Cottam EM, King DP, Wilson A, Paton DJ, Haydon DT (2009) Analysis of
Foot-and-mouth disease virus nucleotide sequence variation within naturallyinfected epithelium. Virus Research 140: 199–204.
46. Bustin SA (2002) Quantification of mRNA using real-time reverse transcriptionPCR (RT-PCR): trends and problems. J Mol Endocrinol 29: 23–39.
Sensitivity of RT Enzymes
PLoS ONE | www.plosone.org 10 November 2010 | Volume 5 | Issue 11 | e13931