Kepler Cheuvreux Reverse Roadshow Infrastructure Europe
57
Kepler Cheuvreux Reverse Roadshow Infrastructure Europe 19 May 2014
-
Upload
khangminh22 -
Category
Documents
-
view
1 -
download
0
Transcript of Kepler Cheuvreux Reverse Roadshow Infrastructure Europe

Kepler Cheuvreux Reverse Roadshow Infrastructure Europe
19 May 2014

1st Quarter 2014 highlights May 2014

Disclaimer
This presentation may contain forward-looking objectives and statements about VINCI’s financial situation, operating results, business activities and expansion strategy.
These objectives and statements are based on assumptions that are dependent upon significant risk and uncertainty factors that may prove to be inexact. The information is valid only at the time of writing and VINCI dœs not assume any obligation to update or revise the objectives on the basis of new information or future or other events, subject to applicable regulations.
Additional information on the factors that could have an impact on VINCI’s financial results is contained in the documents filed by the Group with the French securities regulator (AMF) and available on the Group’s website at www.vinci.com or on request from its head office.
4

5
1st quarter 2014 highlights
A good beginning to the year
Revenue growth +4.1% like-for-like
Toll road traffic +2.1%
Airport passenger traffic +6.4%
Order book at 31 March 2014 € 31 bn

1st quarter 2014 consolidated revenue
Δ∆ 13/12
Euros in millions Q1 2014 Q1 2013 Actual Like-for-like
Concessions 1,311 1,177 +11.3% +2.8%
VINCI Autoroutes 981 944 +4.0% +4.0%
VINCI Concessions 329 233 +41.1% -0.7%
Contracting 7,309 7,231 +1.1% +4.5%
VINCI Energies 2,126 2,113 +0.6% +0.0%
Eurovia 1,501 1,342 +11.8% +13.2%
VINCI Construction 3,681 3,775 -2.5% +3.8%
VINCI Immobilier 117 185 -36.8% -36.8% Eliminations (113) (171)
Total revenue* 8,623 8,423 +2.4% +4.1%
6 * Revenue excluding concession subsidiaries’ revenue derived from works

1st quarter 2014 consolidated revenue
7
+4.5% +325
8,423 8,623
Q1 2013
Change 14/13 Organic growth Scope FX Revenue change Concessions +2.8% +8.7% (0.2%) +11.3% Contracting +4.5% (2.6%) (0.8%) +1.1%
Group total +4.1% (1.0%) (0.7%) +2.4%
(2.6%) -247 -12
Contracting +1.1% +11.3 %
Concessions Immobilier
& eliminations
Q1 2014
Revenue growth: +2.4% +200 m€
Scope & FX
Organic growth
Euros in millions
+2.8% +33
+8.5% +101
Scope & FX
Organic growth
75
80
85
90
95
100
105
110
115
120
Q1 08
Q2 08
Q3 08
Q4 08
Q1 09
Q2 09
Q3 09
Q4 09
Q1 10
Q2 10
Q3 10
Q4 10
Q1 11
Q2 11
Q3 11
Q4 11
Q1 12
Q2 12
Q3 12
Q4 12
Q1 13
Q2 13
Q3 13
Q4 13
Q1 14
LV HV Total
Change in total traffic over 12 trailing months (number of km travelled)
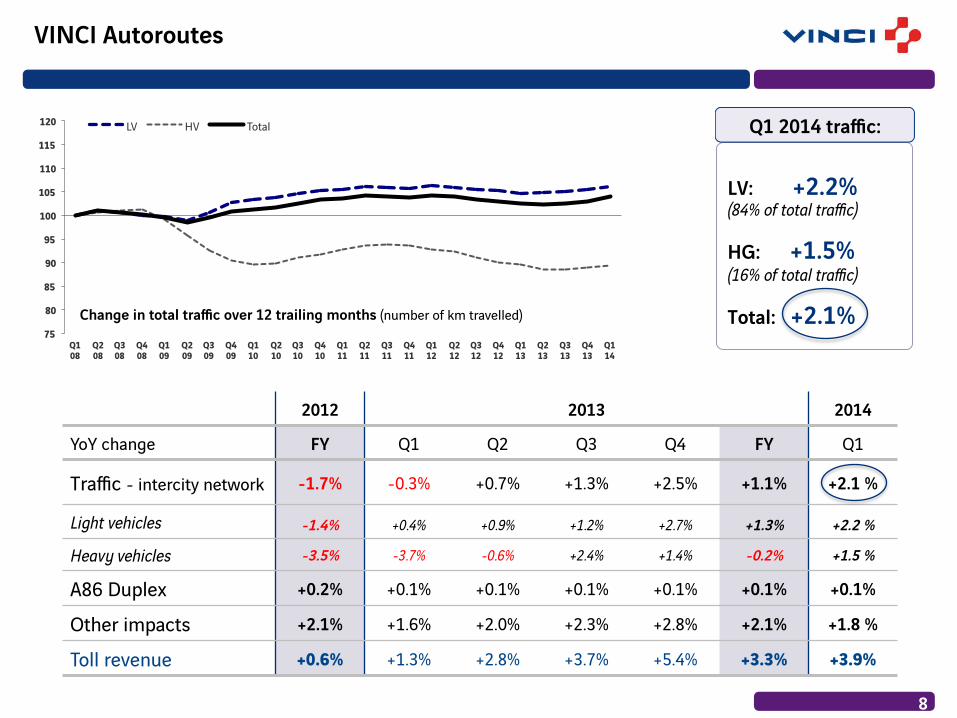
VINCI Autoroutes
8
LV: +2.2% (84% of total traffic)
HG: +1.5% (16% of total traffic)
Total: +2.1%
Q1 2014 traffic:
2012 2013 2014
YoY change FY Q1 Q2 Q3 Q4 FY Q1
Traffic - intercity network -1.7% -0.3% +0.7% +1.3% +2.5% +1.1% +2.1 %
Light vehicles -1.4% +0.4% +0.9% +1.2% +2.7% +1.3% +2.2 %
Heavy vehicles -3.5% -3.7% -0.6% +2.4% +1.4% -0.2% +1.5 %
A86 Duplex +0.2% +0.1% +0.1% +0.1% +0.1% +0.1% +0.1%
Other impacts +2.1% +1.6% +2.0% +2.3% +2.8% +2.1% +1.8 %
Toll revenue +0.6% +1.3% +2.8% +3.7% +5.4% +3.3% +3.9%

9
2012 2013 2014 FY Q1 Q2 Q3 Q4 FY Q1
Cambodia +17.6% +21.0% +17.7% +16.9% +14.9% +17.7% +10.3%
France +7.6% +6.2% +8.7% +6.8% +5.6% +6.9% +0.9%
Portugal (ANA) +1.4% +2.2% +4.9% +4.8% +7.7% +5.0% +6.7% Lisbon +3.5% +3.6% +5.0% +3.2 % +7.0% +4.6% +8.8%
Total +3.7% +5.8% +6.5% +5.9% +8.4% +6.6% +6.4%
Change in passenger traffic
A major actor in the airport sector
VINCI Airports
! 42.9 million passengers in 2013 (32.0 million at ANA)
! 23 airports: ! 3 in Cambodia ! 10 in France ! 10 in Portugal
! 8% stake in ADP
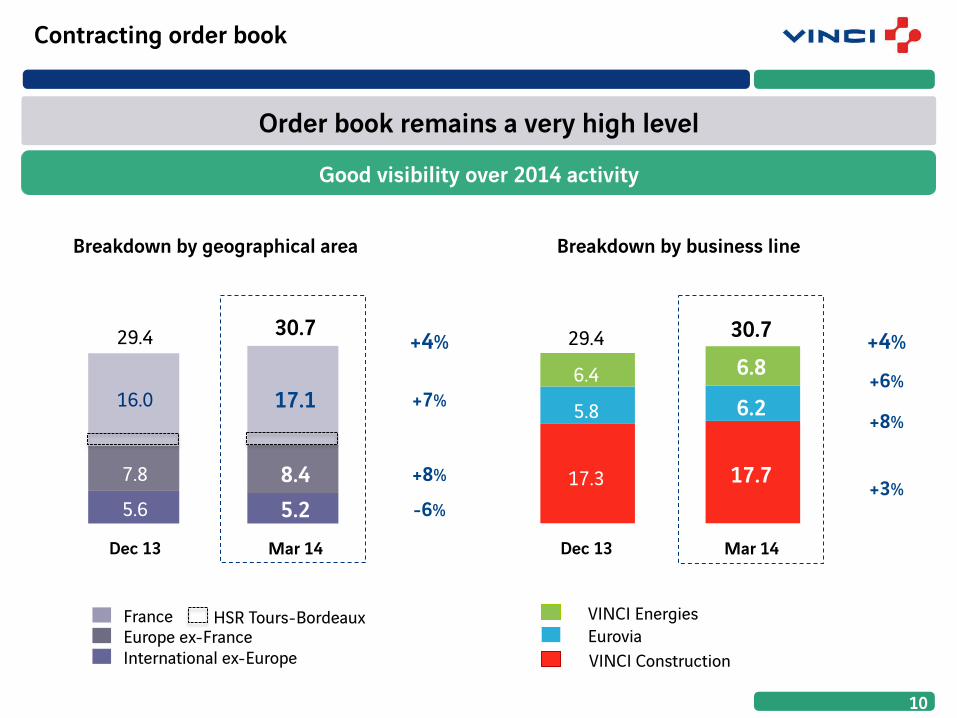
Contracting order book
10
Order book remains a very high level
Good visibility over 2014 activity
Mar 14
29.4
7.8
16.0
5.6
Dec 13
8.4
17.1
30.7
5.2
29.4
17.3
5.8
6.4
30.7
17.7
6.2
6.8
Mar 14
France
International ex-Europe Europe ex-France
VINCI Energies Eurovia VINCI Construction
HSR Tours-Bordeaux
+4%
+7%
+8%
-6%
Dec 13
+4%
+6%
+8%
+3%
Breakdown by geographical area Breakdown by business line

! Gross debt by lender category:
Financial policy
11
Optimise average gross debt maturity
5.7 years: average gross financial debt maturity at 31 March 2014
2020 2014 2015 2016 2017
2014-2020 maturity schedule (in € bn):
0.9 1.4
1.9
Q2 H2
Optimise financing cost
! Reduction in gross debt cost:
! A- VINCI’s credit rating raised by S&P on
31 March 2014
3.37% at 31 Mar. 2014
3.39% at 31 Dec. 2013
2018 2019
2.1 2.6
1.6 1.6
>€720 mn: new bond issues/placements by ASF in Q1 2014
63% 7%
19%
11%
Diversify financing sources
Bonds
Banks
CNA
EIB

2014 outlook
12
Revenue: stable on a constant structure basis
Earnings: positive evolution
! Concessions: continuation of positive 2013 traffic trends at VINCI Autoroutes and VINCI Airports
! Contracting:
! good visibility thanks to high level of order book ! SEA: significant revenue contribution, similar to that of 2013 ! business environment remains weak, especially in France ! impact of CFE deconsolidation
! VINCI Autoroutes: EBITDA maintained at good level
! Contracting: slight improvement in margins expected
! Earnings: positive impact if sale of majority stake in VINCI Park

Strategic priorities
13
VINCI’s priorities for sustainable, profitable growth
Extract more value from our current positions
Complete sale of stake in VINCI Park
Expand VINCI Airports
Expand the Group worldwide
P Restructure sub-par country-sector combinations
Create long-term value while maintaining financial equilibrium
P Complete motorway stimulus plan
P Reinforce synergies
P Cristallise value of VINCI Park P Build resources for Group expansion P Allow VINCI Park to continue to grow
P Take advantage of worldwide air traffic growth
P Increase growth outside of Europe
P Build on local knowlege & presence
P Acquire companies with high-growth & high-value potential
Appendixes Structure and shareholder base
Business line profiles Financial data
Structure and shareholder base

Simplified group structure
16 Headcount: 7,641 68,881 10,626 40,178 62,619 2013 revenue: €4.6bn €16.8bn €1.0bn €8.6bn €9.2bn
Revenue: €40.3bn 190,700 employees
Operations in more than 100 countries
Net income: €2.0bn Of which 38% outside France
2013
Concessions Contracting

17
Shareholder base at 31 December 2013
! Over 500 institutional investors ! Approximately 205,000 individual shareholders ! 115,000 Group employees and former employees are shareholders, including ~14,000 outside France ! Slight increase in number of treasury shares (5.7 million shares purchased in 2013)
Individual investors
Employees
Qatari Diar
Treasury shares
Institutional investors
Rest of World
Rest of Europe
United States
United Kingdom
France
68.7%
4.8% 23.4%
15.4%
8.1% 17.0%
9.2%
9.5%
5.2%
7.4%

Business line profiles

Concessions

* Intercity network (excl. A86 Duplex) 21
ASF ESCOTA
Cofiroute A19 -Arcour
4,386 km under concession (4,368 km in service)
ASF Escota Cofiroute* Arcour A86 Duplex
Network under concession (km) 2,715 459 1,100 101 11
Km in service 2,697 459 1,100 101 11
End of concession 2033 2027 2031 2070 2086
% held by VINCI 100% 99% 100% 100% 100%
Key figures (€ in millions) 2013 2012 Δ∆ 13/12
Revenue 4,596 4,439 +3.5%
EBITDA 3,533 3,087 +4.8%
as % of revenue 70.3% 69.5%
Net income 798 825 -3.4%
Operating cash flow 1,849 1,744 +6.0%
Investments in concessions (689) (1,046) 357
Net financial debt at year-end (15,387) (16,617) 1,230
Headcount at 31 December 2013: 7,641
Europe’s leading motorway concession operator
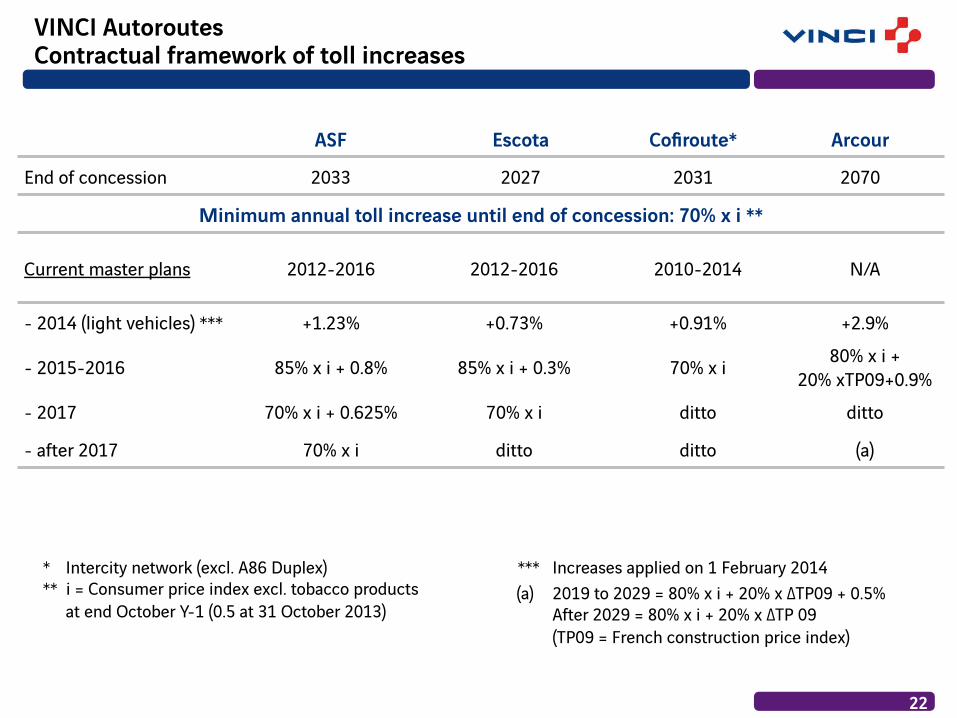
VINCI Autoroutes Contractual framework of toll increases
ASF Escota Cofiroute* Arcour
End of concession 2033 2027 2031 2070
Minimum annual toll increase until end of concession: 70% x i **
Current master plans 2012-2016 2012-2016 2010-2014 N/A
- 2014 (light vehicles) *** +1.23% +0.73% +0.91% +2.9%
- 2015-2016 85% x i + 0.8% 85% x i + 0.3% 70% x i 80% x i + 20% xTP09+0.9%
- 2017 70% x i + 0.625% 70% x i ditto ditto
- after 2017 70% x i ditto ditto (a)
* Intercity network (excl. A86 Duplex) ** i = Consumer price index excl. tobacco products
at end October Y-1 (0.5 at 31 October 2013)
(a) 2019 to 2029 = 80% x i + 20% x Δ∆TP09 + 0.5% After 2029 = 80% x i + 20% x Δ∆TP 09 (TP09 = French construction price index)
22
*** Increases applied on 1 February 2014

VINCI Autoroutes Current capex forecast
23
VINCI Autoroutes planned capex 2014 - 2018 Including the ASF and Escota 5-year plans (2012-2016)
€ in
billi
ons
1.2
0.8
0.4
0.0 2013 2014 2015 2016 2017 2018


25 = % of the division’s 2013 revenue XX%
2013 revenue by geographical area
Road, rail and bridge infra- Structure, stadiums • Toll roads in Germany & Slovakia • Tunnels/bridges in France, UK, Canada,
Portugal & Greece • Rail: SEA HSR, Synerail, Rhônexpress, • Stadiums under concessions: Stade de
France, Allianz Riviera, MMArena • Several PPP under construction
Regional and national airport operator • 10 regional airports in France • 10 national airports in Portugal • 3 national airports in Cambodia • 43 million passengers • 60 client airline companies
• 8% stake in ADP
World leader in parking management • 2,600 parking structures • 1.8 million parking spaces • 2,500 concession and management
contracts • Main countries of operation:
• France • USA • Canada • UK
Transport Infra & Stadiums
59% 31% 10%
France 60% United Kingdom 5%
Rest of Europe 21%
Asia 9%
N. America 5%
Key figures (€ in millions) 2013 2012 Δ∆ 13/12
Revenue 1,020 915 +11.6% France 610 618 -1.4%
International 411 296 +38.6%
EBITDA 310 285 +5.8%
as % of revenue 29.5% 31.1%
Net income 137 59 +133.0%
Net financial debt at period end (4,622) (1,441) (3,181)
€1.0 bn
Headcount at 31 December 2013: 10,626

€0.6 bn
2013 revenue by geographical area
26
! 1,762,000 spaces managed in 14 countries (of which 1,311,000 outside France)
! 436,000 spaces under concession or freehold, representing 84% of 2013 revenue
France 70%
United Kingdom 9%
Canada 8%
Spain 6%
RoW 5%
Number of spaces (000) by contract type
Freehold Concession Service contract
Belgium 3%
Key figures (€ in millions) 2013 2012 Δ∆ 13/12
Revenue 607 615 -1.1%
France 423 429 -1.2%
International 183 186 -0.8%
EBITDA 209 210 -0.6%
as % of revenue 34.4% 34.2%
Net income 69 51 +35.3 %
Net financial debt at period end (673) (730) +57
2013
1,513
353
1,144
16
2011 2012
1,461
349
1,096
16
1,762
421
1,325
16

27
! 42.9 million passengers in 2013 (32.0 million at ANA)
! 23 airports: ! 3 in Cambodia ! 10 in France ! 10 in Portugal
! 8% stake in ADP
Platforms: • Azores (4) • Beja • Faro • Lisbon • Madeira (2) • Porto 2013 traffic: 32.0 million pax 120 shops 67 restaurants/bars 39 parking lots/garages Est. total capacity: 44.4 million pax
Portugal
Platforms:
• Phnom Penh
• Siem Reap
• Sihanoukville
2013 traffic: 5.1 million pax
20 shops
17 restaurants/bars
6 parking lots/garages
Est. total capacity: 5.7 million pax
Cambodia
Main Platforms: • Chambery • Clermont-Ferrand • Grenoble • Nantes • Poiters • Quimper • Rennes 2013 traffic: 5.8 million pax 11 shops 19 restaurants/bars 31 parking lots/garages Est. total capacity: 9.4 million
France
Key figures (€ in millions) 2013 2012 Δ∆ 13/12
Revenue 315 167 +89.0%
France 99 89 +10.7%
International 217 78 nm
EBITDA 102 59 +73.6%
as % of revenue 32.5% 35.3%
Net income 151 27 nm
Net financial debt at period end (2,927) (39) (2,888)
28
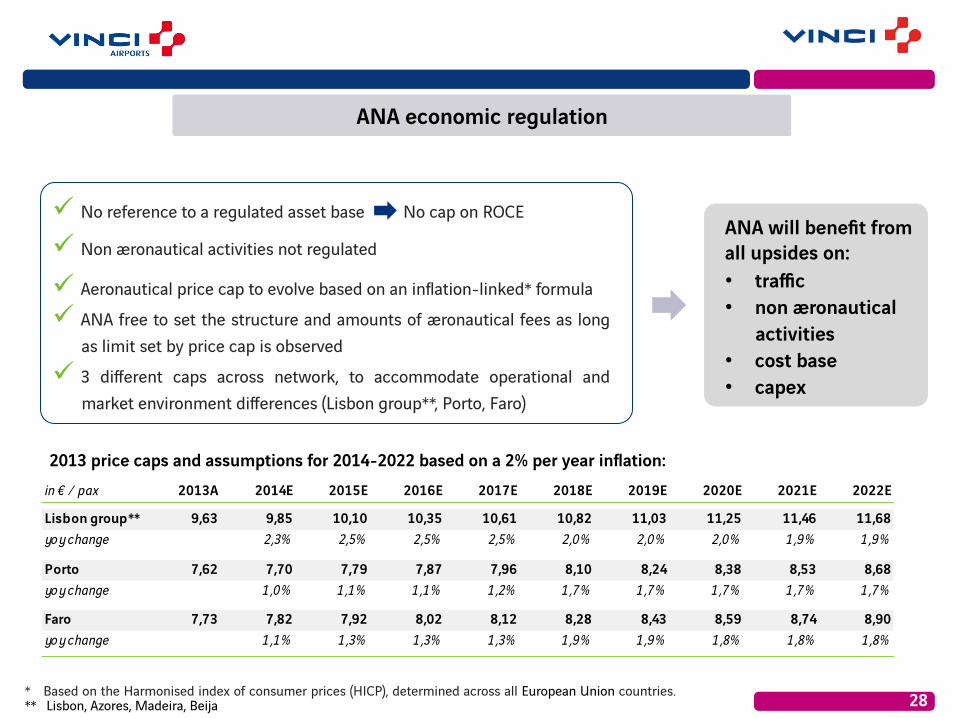
" No reference to a regulated asset base No cap on ROCE
" Non æronautical activities not regulated
" Aeronautical price cap to evolve based on an inflation-linked* formula
" ANA free to set the structure and amounts of æronautical fees as long as limit set by price cap is observed
" 3 different caps across network, to accommodate operational and market environment differences (Lisbon group**, Porto, Faro)
* Based on the Harmonised index of consumer prices (HICP), determined across all European Union countries. ** Lisbon, Azores, Madeira, Beija
ANA will benefit from all upsides on: • traffic • non æronautical
activities • cost base • capex
2013 price caps and assumptions for 2014-2022 based on a 2% per year inflation: in € / pax 2013A 2014E 2015E 2016E 2017E 2018E 2019E 2020E 2021E 2022E
Lisbon group** 9,63 9,85 10,10 10,35 10,61 10,82 11,03 11,25 11,46 11,68yoy change 2,3% 2,5% 2,5% 2,5% 2,0% 2,0% 2,0% 1,9% 1,9%
Porto 7,62 7,70 7,79 7,87 7,96 8,10 8,24 8,38 8,53 8,68yoy change 1,0% 1,1% 1,1% 1,2% 1,7% 1,7% 1,7% 1,7% 1,7%
Faro 7,73 7,82 7,92 8,02 8,12 8,28 8,43 8,59 8,74 8,90yoy change 1,1% 1,3% 1,3% 1,3% 1,9% 1,9% 1,8% 1,8% 1,8%
ANA economic regulation

29
Once Lisbon Portela airport traffic reaches full capacity, the development of a new Lisbon airport (NLA) will trigger an evolution of the regulation
2013
Agreement on NLA?
Compensation: guaranteed
minimum IRR
New regulation/price cap
increase to compensate for
capex Yes
No
Trigger for discussions on NLA
with grantor: Traffic = 22m pax
4-year period to agree on
NLA
estimated 12 years
" No excessive tar iff increase expected
" Guaranteed minimum IRR on capital invested by VINCI
" Computed as from 2013
ANA economic regulation – Lisbon airport

Country Type Name Description End of concession
VINCI share
Traffic risk
Consoli-dation*
VINCI Airports Cambodia Airport Phnom Penh Concession
Airport Siem Reap Concession 2040 70 % Yes FC
Airport Sihanoukville Concession
France Airport Clermont-Ferrand Auvergne DSP (2013: 426 KPAX) 2014 99 % Yes FC Airport Quimper Cornouaille DSP (2013: 113 KPAX) 2015 99 % Yes FC Airport Poitiers-Biard DSP (2013: 108 KPAX) 2019 100% Yes FC Airport Grenoble-Isère DSP (2013: 337 KPAX) 2023 99 % Yes FC Airport Bretagne Rennes & Dinard DSP (2013: 611 KPAX) 2024 49 % Yes EM Airport Chambéry-Savoie DSP (2013: 222 KPAX) 2029 100 % Yes FC Airport Aéroports du Grand Ouest
(Nantes Atlantique, Saint Nazaire)
Concession (2013: 3,956 KPAX) 2065 85 % Yes FC
Portugal Airport ANA (10 airports in Lisbon, Porto, Faro, Madeira, Azores)
Concession (2013: 32,039 KPAX)
2063 100% Yes FC
30 DSP = outsourced public service
2013: 5,077 KPAX
* FC: full consolidation; EM: equity method

Other infrastructures conceded or operated in PPPs
Country Type Name Description End of concession
VINCI share
Traffic risk
Consoli-dation*
Road and rail infrastructures Germany Motorway A4 Horselberg 45 km 2037 50% yes EM
UK Road Hounslow PFI 432 km roads; 763 km sidewalks 2037 50% no EM
UK Road Isle of Wight PFI 821 km roads; 767 km sidewalks 2038 50% no EM
UK Road Newport Southern Distributor Road 10 km 2042 50% yes EM
Greece Motorway Athens-Tsakona 365 km 2038 29,9% yes EM
Greece Motorway Maliakos–Kleidi 240 km 2038 13,8% yes EM
Slovakia Road Voie express R1 52 km 2041 50% no EM
Bridges and tunnels
France Tunnel Prado Carénage Road tunnel, Marseille 2025 33% yes EM
France Tunnel Prado Sud Urban road tunnel, Marseille 2055 58,5% yes EM
Greece Bridge Rion–Antirion 2.9 km mainland–Peloponnese link 2039 57,4% yes EM
Portugal Bridge Lusoponte Vasco da Gama & 25 de Abril bridges, Lisbon 2030 37,3% yes EM
Netherlands Tunnel Cœntunnel 2 tunnels (4-lane dual carriageway), Amsterdam 2037 21% no EM
Canada Bridge Pont de la Confédération Link to Prince Edward Island 2032 20% yes EM
31 * FC: full consolidation; EM: equity method

Other infrastructures conceded or operated in PPPs
Country Type Name Description End of concession
VINCI share
Traffic risk
Consoli-dation*
Rail infrastructures France Rail RhônExpress 23 km light rail system, Lyon 2038 35% yes EM
Belgium Tunnel Liefkenshœk, Antwerp Rail tunnel under the Escaut 2050 28% no EM
Stadiums and public equipment
France Stadium Stade de France 80,000 seats, Paris 2025 67% yes FC
France Stadium MMArena 25,000 seats, Le Mans 2043 100% yes FC
France Stadium Allianz Riviera 35,000 seats, Nice 2040 50% yes EM
France Energy Lucitea Public lighting, Rouen 2027 100% no FC
France Hydraulic VNF Aisne & Meuse Operation & maintenance of 31 dams 2043 50% no EM
France Building Park Azur Car rental firm complex, Nice 2040 100% no FC
32 * FC: full consolidation; EM: equity method
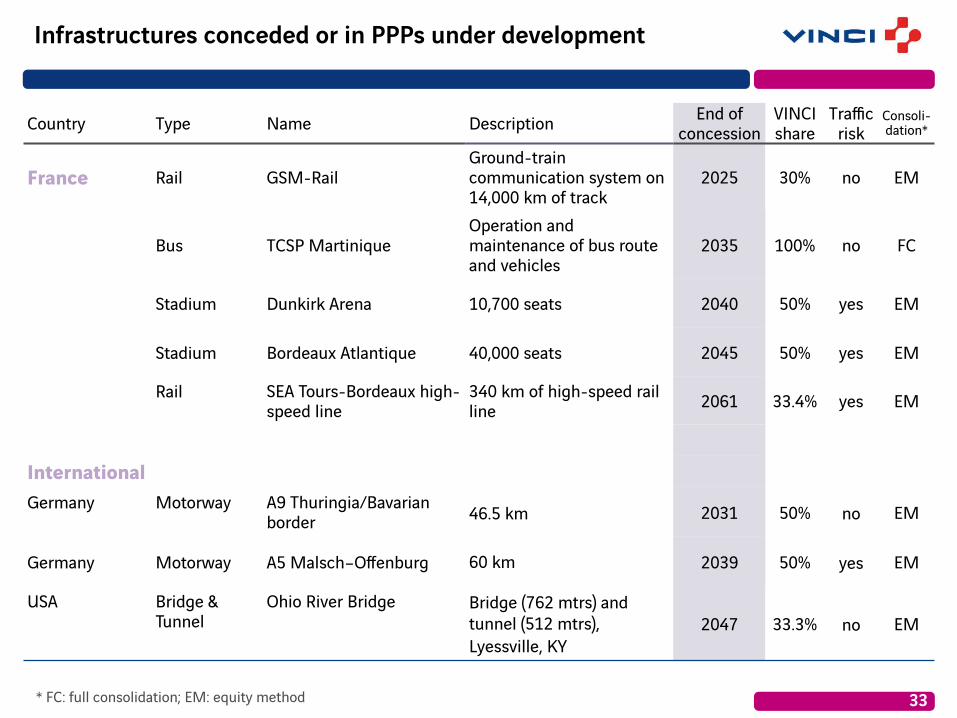
Infrastructures conceded or in PPPs under development
Country Type Name Description End of concession
VINCI share
Traffic risk
Consoli-dation*
France Rail GSM-Rail Ground-train communication system on 14,000 km of track
2025 30% no EM
Bus TCSP Martinique Operation and maintenance of bus route and vehicles
2035 100% no FC
Stadium Dunkirk Arena 10,700 seats 2040 50% yes EM
Stadium Bordeaux Atlantique 40,000 seats 2045 50% yes EM
Rail SEA Tours-Bordeaux high-speed line
340 km of high-speed rail line 2061 33.4% yes EM
International Germany Motorway A9 Thuringia/Bavarian
border 46.5 km 2031 50% no EM
Germany Motorway A5 Malsch–Offenburg 60 km 2039 50% yes EM
USA Bridge & Tunnel
Ohio River Bridge Bridge (762 mtrs) and tunnel (512 mtrs), Lyessville, KY
2047 33.3% no EM
33 * FC: full consolidation; EM: equity method

Contracting

UK 7%
CEE 5%
RoE 9%
Americas 5%
France 57%
RoW 5%
Africa 5%
Germany 7%
35
2013 revenue by geographical area
= % of 2013 Contracting revenue XX%
Key figures (€ in millions) 2013 2012 Δ∆ 13/12
Revenue 34,636 33,090 +4.7%
France 19,806 19,054 +3.9%
International 14,830 14,036 +5.7%
EBIT 1,427 1,412 +1.1%
as % of revenue 4.1% 4.3%
Net income 963 914 +5.3%
Net financial surplus 2,129 2,095 +34
Order book at period end (€ billions)* 29.4 30.1 -2%
Contracting Profile
France’s leading construction company and a major global player • Building • Civil engineering • Hydraulic engineering • Specialised civil engineering: deep
foundations, ground technologies, cable-stayed bridges, underground works, prestressing, nuclear
• Design and construction of complex projects
A world leader in transport and urban development infrastructure • Transport infrastructure (road, rail) • Urban development infrastructure • Quarries • Industrial production (asphalt) • Maintenance and servicing
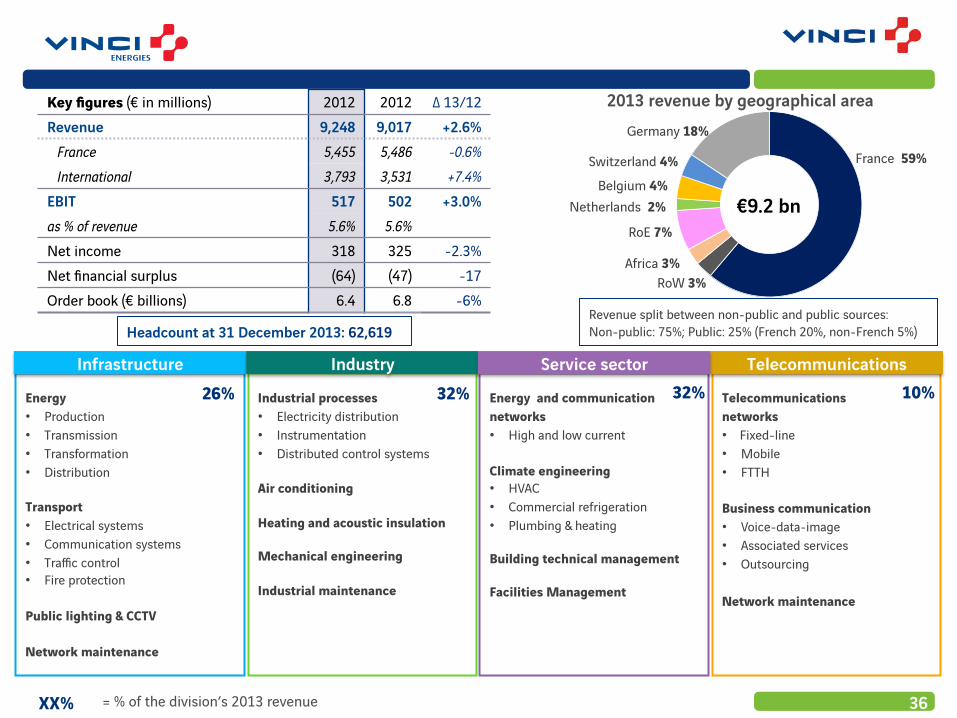
A market leader in France and a major player in Europe in energy and information technology services • Infrastructure • Industry • Service sector • Telecommunications
27% 25% 48%
Revenue split between non-public and public sources: Non-public: 50%; Public: 50% (French 30%, non-French 20%)
€34.6 bn
* Excluding CFE order book in 2012 and 2013, deconsolidated 24 December 2013
2013 revenue by geographical area
Revenue split between non-public and public sources: Non-public: 75%; Public: 25% (French 20%, non-French 5%)
36
Energy and communication networks • High and low current Climate engineering • HVAC • Commercial refrigeration • Plumbing & heating Building technical management Facilities Management
Industrial processes • Electricity distribution • Instrumentation • Distributed control systems Air conditioning Heating and acoustic insulation Mechanical engineering Industrial maintenance
Energy • Production • Transmission • Transformation • Distribution Transport • Electrical systems • Communication systems • Traffic control • Fire protection Public lighting & CCTV Network maintenance
Telecommunications networks • Fixed-line • Mobile • FTTH Business communication • Voice-data-image • Associated services • Outsourcing Network maintenance
Telecommunications Infrastructure Industry Service sector 26% 32% 32% 10%
= % of the division’s 2013 revenue XX%
Key figures (€ in millions) 2012 2012 Δ∆ 13/12 Revenue 9,248 9,017 +2.6% France 5,455 5,486 -0.6% International 3,793 3,531 +7.4% EBIT 517 502 +3.0% as % of revenue 5.6% 5.6% Net income 318 325 -2.3% Net financial surplus (64) (47) -17 Order book (€ billions) 6.4 6.8 -6%
Germany 18%
Belgium 4%
Africa 3% RoW 3%
France 59%
Netherlands 2%
RoE 7%
Switzerland 4%
€9.2 bn
Headcount at 31 December 2013: 62,619

CEE 11%
UK 6%
RoE 1% Canada 6%
France 61%
Germany 10%
37
Asphalt production • Production of
23 million tonnes • 43 binder plants • 370 mixing plants 10 plants producing: • Road signage equipment • Paving equipment for industrial
and retail facilities • Prefabricated concretes and
products
Extraction, transformation, commercialisation, trading and logistics for natural and recycled aggregates Network of over 400 quarries • Annual production: 86 million
tonnes, o/w Eurovia share: 68 million tonnes
Reliable supply of materials for its projects • Almost 50 years of reserves
(> 3.3 billion tonnes)
Construction and renovation of transport infrastructure • Roads, motorways • Airports • Rail lines, tramways • Industrial and retail facilities
Extensive know-how in related areas • Demolition and deconstruction • Drainage, earthworks • Urban development • Civil engineering structures • Noise barriers
Design, maintenance and comprehensive management of road, motorway and rail networks, as well as urban transport infrastructure • Engineering • Client-side programme
management • Design and coordination • Road equipment services
(signage, safety) • Maintenance of public lighting,
traffic lights, structures, parks and gardens
Services Transport/urban development infrastructure Quarries Industrial production
70% 9% 14% 7%
2013 revenue by geographical area
XX% = % of the division’s 2013 revenue
Key figures (€ in millions) 2013 2012 Δ∆ 13/12 Revenue 8,613 8,747 -1.5% France 5,229 5,159 +1.4% International 3,384 3,588 -5.7% EBIT 230 278 -17.6% as % of revenue 2.7% 3.2% Net income 121 168 -27.9% Net financial surplus 26 (136) +162 Order book (€ billions) 5.8 6.4 -10%
Revenue split between non-public and public sources: Non-public: 40%; Public: 60% (French 35%, non-French 25%)
Rest of Americas 5% RoW 1%
€8.6 bn
Headcount at 31 December 2013: 40,178

UK 11%
Belgium 4%
RoE 9%
Americas 5%
France 54%
RoW 8%
Africa 9%
Hydraulic engineering Civil engineering Building
38
2013 revenue by geographical area
Major civil engineering structures and buildings • Tunnels, dams, bridges • Road and rail
infrastructure • Skyscrapers • Major industrial
facilities • Nuclear sites
• Deep
foundations • Ground technologies • Civilian nuclear
engineering (construction and decommissioning)
• Oil & gas infrastructure • Maritime and river
works • Cable-stayed bridges
Specialised civil engineering Complex projects
• Pipes • Waste
management, water and wastewater treatment plants
• Systems re-routing
3%
• Civil engineering structures (bridges, viaducts, dams)
• Environment-related civil engineering
• Underground works • Special foundations • Earthworks
25%
Non residential • Public buildings
(healthcare, education, legal)
• Offices Residential • New builds and
refurbishments • Apartment buildings
and social housing
40%
Network of 470 profit centres in France Strong presence in rest of Europe and Africa
Specialised subsidiaries serving global markets Operations worldwide
= % of the division’s 2013 revenue
32%
XX%
Key figures (€ in millions) 2013 2012 Δ∆ 13/12 Revenue 16,775 15,327 +9.4% France 9,122 8,410 +8.5% International 7,653 6,917 +10.6% EBIT 680 631 +7.9% as % of revenue 4.1% 4.1% Net income 524 421 +24.5% Net financial surplus 2,167 2,278 -111 Order book (€ billions)* 17.3 17.0 +2%
Revenue split between non-public and public sources: Non-public: 55%; Public: 45% (French 25%, non-French 20%
€16.8 bn
Headcount at 31 December 2013: 68,881
* Excluding CFE order book in 2012 and 2013 (deconsolidated on 24 Dec. 2013)

Detailed consolidated financial statements

(in € millions) 2013 2012 Δ∆ 13/12
Operating income from ordinary activities 3,670 3,679 (0.3%) % of revenue 9.1% 9.5% - share-based payment expense (IFRS 2) (86) (94)
- recurring operating income of equity-accounted cos. 95 82
- other recurring operating items (2) 5
Recurring operating income 3,677 3,672 +0.1% Non-recurring operating items 90 (5)
Operating income 3,767 3,667 +2.7% Financial income/(expense) (650) (669) Taxes (1,070) (972) Effective tax rate 34.2% 33.3% Non-controlling interests (84) (109) Net income attributable to owners of the parent 1,962 1,917 +2.3% Diluted earnings per share (in €) 3.54 3.54 -
40
Income statement
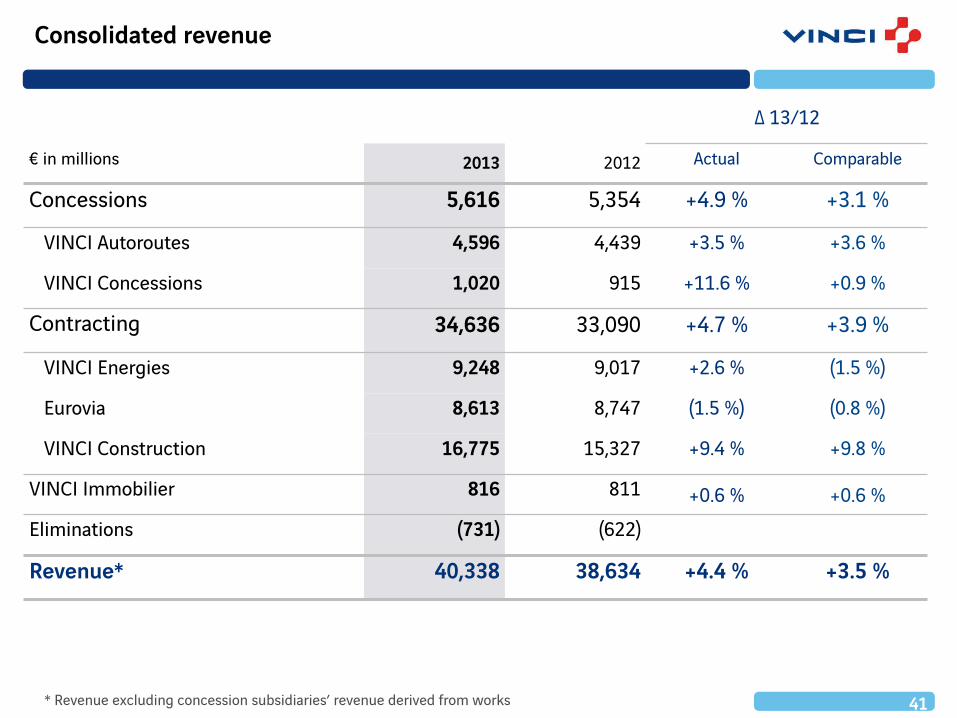
Consolidated revenue
Δ∆ 13/12
€ in millions 2013 2012 Actual Comparable
Concessions 5,616 5,354 +4.9 % +3.1 %
VINCI Autoroutes 4,596 4,439 +3.5 % +3.6 %
VINCI Concessions 1,020 915 +11.6 % +0.9 %
Contracting 34,636 33,090 +4.7 % +3.9 %
VINCI Energies 9,248 9,017 +2.6 % (1.5 %)
Eurovia 8,613 8,747 (1.5 %) (0.8 %)
VINCI Construction 16,775 15,327 +9.4 % +9.8 %
VINCI Immobilier 816 811 +0.6 % +0.6 % Eliminations (731) (622)
Revenue* 40,338 38,634 +4.4 % +3.5 %
41 * Revenue excluding concession subsidiaries’ revenue derived from works
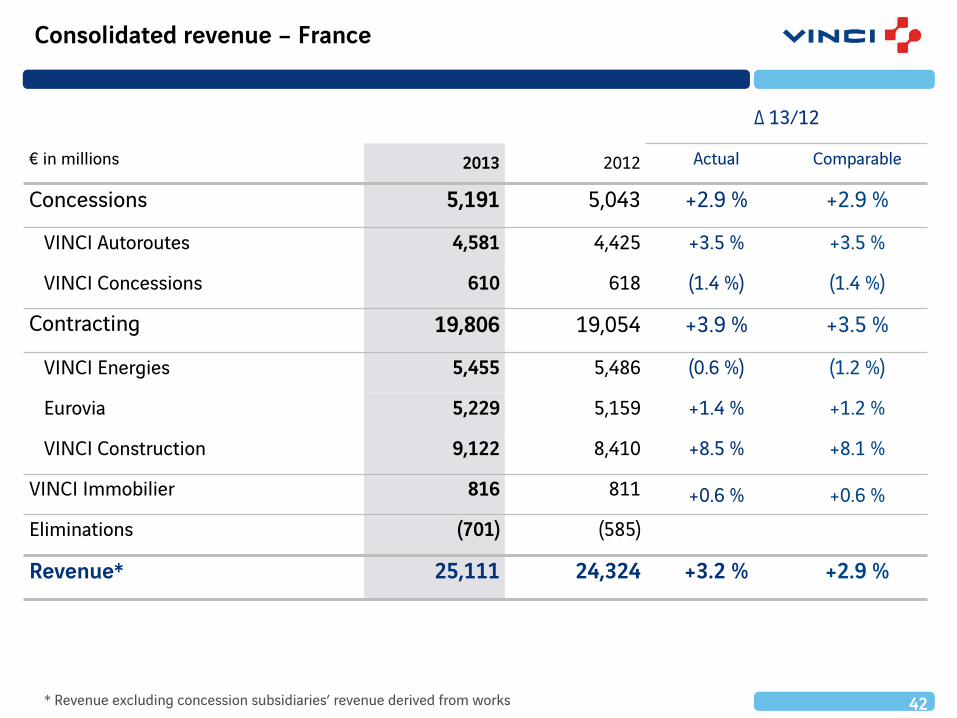
Consolidated revenue – France
Δ∆ 13/12
€ in millions 2013 2012 Actual Comparable
Concessions 5,191 5,043 +2.9 % +2.9 %
VINCI Autoroutes 4,581 4,425 +3.5 % +3.5 %
VINCI Concessions 610 618 (1.4 %) (1.4 %)
Contracting 19,806 19,054 +3.9 % +3.5 %
VINCI Energies 5,455 5,486 (0.6 %) (1.2 %)
Eurovia 5,229 5,159 +1.4 % +1.2 %
VINCI Construction 9,122 8,410 +8.5 % +8.1 %
VINCI Immobilier 816 811 +0.6 % +0.6 % Eliminations (701) (585)
Revenue* 25,111 24,324 +3.2 % +2.9 %
42 * Revenue excluding concession subsidiaries’ revenue derived from works
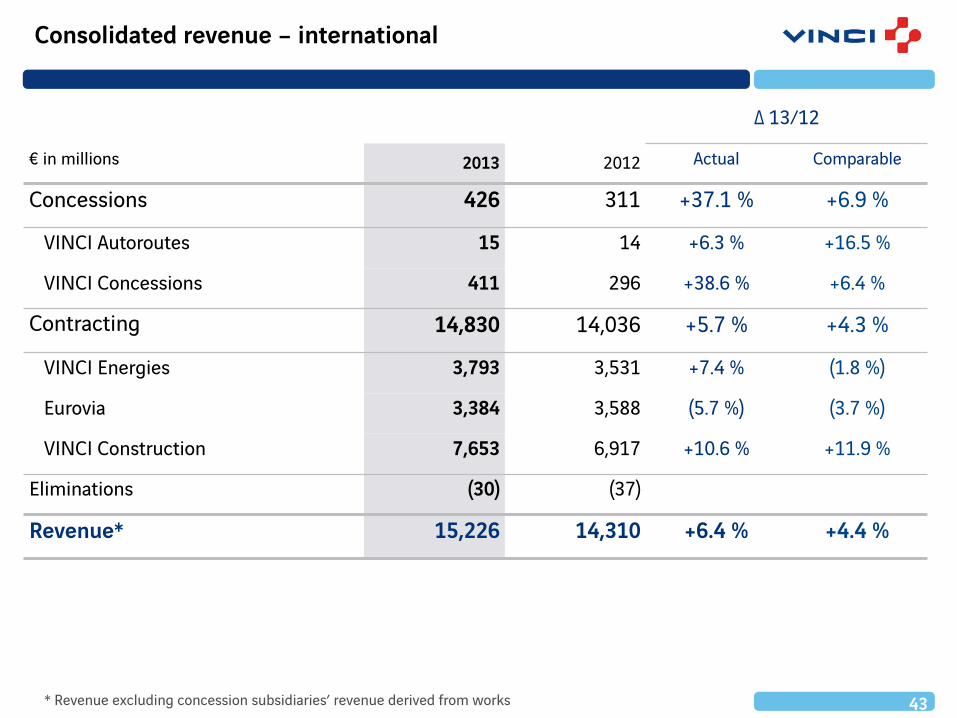
Consolidated revenue – international
Δ∆ 13/12
€ in millions 2013 2012 Actual Comparable
Concessions 426 311 +37.1 % +6.9 %
VINCI Autoroutes 15 14 +6.3 % +16.5 %
VINCI Concessions 411 296 +38.6 % +6.4 %
Contracting 14,830 14,036 +5.7 % +4.3 %
VINCI Energies 3,793 3,531 +7.4 % (1.8 %)
Eurovia 3,384 3,588 (5.7 %) (3.7 %)
VINCI Construction 7,653 6,917 +10.6 % +11.9 %
Eliminations (30) (37)
Revenue* 15,226 14,310 +6.4 % +4.4 %
43 * Revenue excluding concession subsidiaries’ revenue derived from works

44
2012 2013 2012 2013 2012 2013 2012 2013 2012 2013
VINCI Autoroutes
VINCI Concessions
CONCESSIONS CONTRACTING
€2,155 mn Margin: 38.4%
VINCI Energies Eurovia
VINCI Construction
€1,427 mn Margin: 4.1%
2012: €2,155 mn, margin 40.2 % 2012: €1,412 mn, margin 4.3 %
Operating income from ordinary activities
(in € millions and as % of revenue)
45.4% 44.2%
2,015 2,031
15.2% 12.2%
139 124 5.6% 5.6% 3.2% 2.7%
4.1% 4.1%
502 517
278 230
631 680

€ in millions 2013 % of revenue* 2012 % of
revenue* Δ∆ 13/12
Concessions 2,155 38.4 % 2,155 40.2 % 0.0 %
VINCI Autoroutes 2,031 44.2 % 2,015 45.4 % +0.8 %
VINCI Concessions 124 12.2 % 139 15.2 % (10.7 %)
Contracting 1,427 4.1 % 1,412 4.3 % +1.1 %
VINCI Energies 517 5.6 % 502 5.6 % +3.0 %
Eurovia 230 2.7 % 278 3.2 % (17.6 %)
VINCI Construction 680 4.1 % 631 4.1 % +7.9 %
VINCI Immobilier 59 7.2 % 62 7.6 % (4.7 %) Holding companies 29 52
EBIT 3,670 9.1 % 3,679 9.5 % (0.3 %)
45 * Revenue excluding concession subsidiaries’ revenue derived from works
EBIT - operating income from ordinary activities by business line

Financial income/(expense)
€ in millions 2013 2012 Δ∆ 13/12
Cost of net financial debt (598) (638) 39
Concessions (628) (668) 40
Contracting (2) 14 (16) Holding companies and misc. 32 17 15 Other financial income and expenses (52) (32) (20)
Capitalised borrowing costs for investments in progress 21 71 (51)
Discounting retirement obligations and provisions (63) (97) 34
Translation differences (10) (6) (3) Financial income/(expense) (650) (669) 19
46

€ in millions 2013 % of revenue* 2012 % of
revenue* Δ∆ 13/12
Concessions 934 16.6 % 884 16.5 % +5.7 %
VINCI Autoroutes 798 17.4 % 825 18.6 % (3.4 %)
VINCI Concessions 137 13.4 % 59 6.4 % +133.0 %
Contracting 963 2.8 % 914 2.8 % +5.3 %
VINCI Energies 318 3.4 % 325 3.6 % (2.3 %)
Eurovia 121 1.4 % 168 1.9 % (27.9 %)
VINCI Construction 524 3.1 % 421 2.7 % +24.5 %
VINCI Immobilier 37 4.6 % 37 4.6 % +0.8 % Holding companies 27 82 Net income attributable to owners of the parent 1,962 4.9 % 1,917 5.0 % +2.3 %
47
Net income attributable to owners of the parent by business line
* Revenue excluding concession subsidiaries’ revenue derived from works

€ in millions 2013 % of revenue** 2012 % of
revenue** Δ∆ 13/12
Concessions 3,533 62.9 % 3,372 63.0 % +4.8 % VINCI Autoroutes 3,231 70.3 % 3,087 69.5 % +4.7 %
ASF/Escota 2,316 70.0% 2,207 69.1% +5.0 %
Cofiroute 886 71.4% 856 70.8% +3.5 %
VINCI Concessions 301 29.5 % 285 31.1 % +5.8 %
Contracting 1,898 5.5 % 1,875 5.7 % +1.2 % VINCI Energies 536 5.8 % 532 5.9 % +0.8 %
Eurovia 431 5.0 % 467 5.3 % (7.7 %)
VINCI Construction 931 5.6 % 876 5.7 % +6.2 %
VINCI Immobilier 58 7.1 % 60 7.4 % (3.2 %) Holdings 108 112 EBITDA 5,596 13.9 % 5,418 14.0 % +3.3 %
48 ** Revenue excluding concession subsidiaries’ revenue derived from works
EBITDA*
* Cash flow from operations before tax and financing costs by business line

Cash flow statement (1/2)
€ in millions 2013 Concessions Contracting 2012
EBITDA* 5,596 3,533 1,898 5,418
Change in WCR and current provisions 6 74 (49) (37)
Income taxes paid (1,408) (825) (522) (979)
Net interest paid (605) (657) (44) (595)
Dividends received from companies accounted for under the equity method 57 10 47 57
Net operating investments (665) (58) (606) (742)
Operating cash flow 2,983 2,077 725 3,123
Growth investments in concessions & PPPs (803) (764) (39) (1,140)
Free cash flow (after investments) 2,180 1,313 686 1,983
49 * Cash flow from operations before tax and financing costs by business line

Operating investments, net
€ in millions 2013 2012 Δ∆ 13/12
Concessions 64 58 +6 VINCI Autoroutes 25 30 (5) VINCI Concessions 39 27 +11 Contracting 712 809 (98) VINCI Energies 108 95 +13 Eurovia 218 258 (40) VINCI Construction 385 457 (71) VINCI Immobilier and holdings 1 4 (3) Purchases of PP&E and intangible assets 777 871 (94) Proceeds from sales of PP&E and intangible assets (112) (129) 17 Operating investments (net of disposals) 665 742 (77)
50

Growth investments in concessions and PPPs
€ in millions 2013 2012 Δ∆ 13/12
Concessions 764 1 125 (361) VINCI Autoroutes 689 1 046 (357)
O/w : ASF / Escota 553 861 (308)
Cofiroute 132 182 (50)
VINCI Concessions 75 79 (4)
Contracting 39 14 24 Growth investments in concessions and PPPs (net) 803 1 140 (337)
51

Cash flow statement (2/2)
€ in millions 2013 2012
Free cash flow (after investments) 2 180 1 983
Net financial investments (3 220) (700)*
Other financial cash flows (95) (50)
Cash flow before movements in share capital (1 135) 1 233
Share capital increases and other operations 783 340
Dividends (1 072) (1 057)
Share buy-backs (222) (647)
Net cash flow for the period (1 647) (130)
Other and consolidation impacts 70 193
Change in net financial debt (1 577) 63
52 * including the buy out of Entrepose Contracting minorities for €102m

Consolidated balance sheet
(in € millions) 31 Dec. 2013 31 Dec. 2012
Non-current assets – Concessions 29,554 26,459
Non-current assets – Contracting and other 8,434 8,848
WCR, current provisions and other current assets & liabilities (6,619) (6,699)
Capital employed 31,369 28,608
Equity (14,260) (13,768)
Non-current provisions and misc. long-term liabilities (3,005) (2,313)
Long-term financing (17,265) (16,081)
Gross financial debt (18,212) (17,510)
Net cash managed 4,108 4,983
Net financial debt (14,104) (12,527)
53
15.0%
ROE (return on equity)
9.0%
ROCE (return on capital
employed)
1.0x
net financial debt/ equity

Net financial debt by entity
(in € millions) 2013 Net financial debt/EBITDA 2012
Net financial debt/EBITDA Δ∆ 13/12
Concessions (20,010) 5.7x (18,058) 5.4x (1,952)
VINCI Autoroutes (15,387) 4.8x (16,617) 5.4x 1,229
VINCI Concessions (4,622) 15.3x (1,441) 5.1x (3,181)
Contracting 2,129 - 2,095 - 34
Holding cos & VINCI Immobilier 3,777 - 3,436 - 341
Net financial debt (14,104) 2.5x (12,527) 2.3x (1,577) of which gross debt (18,212) (17,510) (702)
of which net cash managed 4,108 4,983 (875)
54 EBITDA : cash flow from operations before tax and financing costs
Baa1 Moody’s
- Stable outlook -
A- S&P
€6.3 bn Unused bank credit lines

55
Capital increases &
misc. 0.8*
Dividends (1.1)*
Δ∆ WCR (0.0)
(12.5) EBITDA
5.6 (14.1) Investments
(1.5)
Acquisitions (3.3)
Free cash flow: €2.2 bn 2012: €2.0 bn
Share buy-backs (0.2)
1.9
3.5
0.2 (1.4) (0.6)
Contracting
Concessions
Other
(0.8) (0.7)
Net financial debt at 31 Dec. 2012
(in € billions)
Change in net financial debt in 2013
Interest & taxes paid
(2.0)
Net financial debt at 31 Dec. 2013
* including payment of final 2012 dividend in shares: €0.4 bn

0
500
1 000
1 500
2 000
2 500
3 000
2Q 14 2H 14 2015 2016 2017 2018 2019 2020 2021 2022 2023 2024 2025 2026 2027 2028 > 2028
Repayment schedule at end March 2014
56
Other concessions Holdings and misc. Cofiroute ASF
Arcour
Maturity of gross financial debt
! Average maturity of gross financial debt at end March 2014: 5.7 years (Concessions: 6.1 years)

G. Christopher Welton [email protected] Tel: +33 1 47 16 45 07
Thomas Guillois [email protected] Tel: +33 1 47 16 33 46
57
IR Contacts
CONTACTS