Getachew Kepler
11
MNRAS 430, 3472–3482 (2013) doi:10.1093/mnras/stt148 Kepler observations of the open cluster NGC 6819 L. A. Balona, 1 ‹ T. Medupe, 2 O. P. Abedigamba, 2 G. Ayane, 2 L. Keeley, 2 M. Matsididi, 2 G. Mekonnen, 2 M. D. Nhlapo 2 and N. Sithole 2 1 South African Astronomical Observatory, PO Box 9, Observatory, 7935 Cape Town, South Africa 2 Department of Physics, University of the North-West, Private Bag X2046, Mmabatho 2735, South Africa Accepted 2013 January 23. Received 2013 January 22; in original form 2012 October 3 ABSTRACT Using photometry from the Kepler Input Catalogue, we determine the distance and age of NGC 6819 using several different methods. From isochrone fitting we find the age of the cluster to be about 2.5Gyr. There are many different types of variables in the field, including eight δ Scuti stars, at least three γ Dor variables and several eclipsing binaries of various types. We derive masses, radii and luminosities from 63 red giants with solar-like oscillations, including 28 stars with no previous measurements, from which we obtain an unreddened distance modulus of 12.20 ± 0.06 mag. We measured rotation periods of 129 stars which showed variations attributable to starspots. There is a correlation between the rotation period and the colour which extends to stars with temperatures equivalent to late A-type. This implies that starspots are present in stars which are much hotter than previously supposed. We also discuss several eclipsing binaries and the variability of stars which are blue straggler candidates and discuss X-ray sources found in the cluster. Key words: stars: oscillations – stars: rotation – starspots – stars: variables: general. 1 INTRODUCTION The Kepler mission has been extremely important in the study of stellar pulsation. This mission has observed, and is still observing, the light variations of over 150 000 stars in a large field of 105 square degrees in the direction of Cygnus and Lyra. Most of the observations are obtained using an exposure time of about 30 min [long-cadence (LC) mode], but a few thousand stars have also been observed with an exposure time of about 1 min [short-cadence (SC) mode]. There are four open clusters in the Kepler field of view: NGC 6811, NGC 6819, NGC 6791 and NGC 6866. Kepler studies of pulsating red giants in these clusters allow independent estimates of mass, radius and surface gravity of each star. In these stars the large separation (i.e. the frequency separation between modes of the same spherical harmonic degree but of successive overtones) allows the mean density to be obtained, while the frequency of maximum amplitude gives a separate relationship between mass and radius, allowing both the mass and the radius to be determined. Stello et al. (2010), using Kepler data, were the first to apply the method to red giants in NGC 6819. From the masses derived in this way, Miglio etal. (2012) have recently studied mass-loss in red giants in NGC 6791 and NGC 6819. From the radius and ef- fective temperature, the luminosity of the red giants can be derived E-mail: [email protected] which allows the distance to the cluster to be found in a model- independent manner. Such studies have been applied to NGC 6791 and NGC 6819 (Basu et al. 2011; Miglio et al. 2012), to NGC 6791, NGC 6819 and NGC 6811 (Hekker et al. 2011; Corsaro et al. 2012) and to NGC 6866 (Balona et al. 2013). Apart from studies of stellar pulsation, stars in clusters may also provide useful information regarding stellar rotation. For example, some cool stars have starspots which lead to rotational modulation of the light curve. In a series of papers (Barnes 2001, 2003, 2007; Barnes & Kim 2010), Barnes showed that the rotation periods of cool dwarfs depend on their mass and age in accordance with a law first discovered by Skumanich (1972). The colour index can be used as a proxy for the stellar mass and, as a result, there exists a period–colour–age relationship. Reliable ages can be derived for field dwarf stars in this way. NGC 6819 is a moderately old cluster (≈2.5 Gyr; Rosvick & Vandenberg 1998; Kalirai et al. 2001; Basu et al. 2011) with near- solar or slightly super-solar metallicity ([Fe/H]=+0.09 ± 0.03; Bragaglia et al. 2001). From BV photometry and main-sequence fit- ting, Rosvick & Vandenberg (1998) obtained a distance modulus of μ 0 = V 0 − M V = 12.36 and a reddening of E(B − V) = 0.16. From additional BV photometry, Kalirai et al. (2001) derived a distance modulus μ 0 = 12.30 ± 0.12 and a reddening of E(B − V) = 0.10. Hole et al. (2009) obtained further photometry and also radial velocities for 1207 stars in the field of the cluster from which they deduce 480 cluster members. The cluster members define a clear colour–magnitude diagram in which giant, subgiant and blue C 2013 The Authors Published by Oxford University Press on behalf of the Royal Astronomical Society at Potchefstroom University on March 26, 2014 http://mnras.oxfordjournals.org/ Downloaded from
Transcript of Getachew Kepler

MNRAS 430, 3472–3482 (2013) doi:10.1093/mnras/stt148
Kepler observations of the open cluster NGC 6819
L. A. Balona,1‹ T. Medupe,2 O. P. Abedigamba,2 G. Ayane,2 L. Keeley,2
M. Matsididi,2 G. Mekonnen,2 M. D. Nhlapo2 and N. Sithole2
1South African Astronomical Observatory, PO Box 9, Observatory, 7935 Cape Town, South Africa2Department of Physics, University of the North-West, Private Bag X2046, Mmabatho 2735, South Africa
Accepted 2013 January 23. Received 2013 January 22; in original form 2012 October 3
ABSTRACTUsing photometry from the Kepler Input Catalogue, we determine the distance and age ofNGC 6819 using several different methods. From isochrone fitting we find the age of thecluster to be about 2.5 Gyr. There are many different types of variables in the field, includingeight δ Scuti stars, at least three γ Dor variables and several eclipsing binaries of varioustypes. We derive masses, radii and luminosities from 63 red giants with solar-like oscillations,including 28 stars with no previous measurements, from which we obtain an unreddeneddistance modulus of 12.20 ± 0.06 mag. We measured rotation periods of 129 stars whichshowed variations attributable to starspots. There is a correlation between the rotation periodand the colour which extends to stars with temperatures equivalent to late A-type. This impliesthat starspots are present in stars which are much hotter than previously supposed. We alsodiscuss several eclipsing binaries and the variability of stars which are blue straggler candidatesand discuss X-ray sources found in the cluster.
Key words: stars: oscillations – stars: rotation – starspots – stars: variables: general.
1 IN T RO D U C T I O N
The Kepler mission has been extremely important in the study ofstellar pulsation. This mission has observed, and is still observing,the light variations of over 150 000 stars in a large field of 105square degrees in the direction of Cygnus and Lyra. Most of theobservations are obtained using an exposure time of about 30 min[long-cadence (LC) mode], but a few thousand stars have also beenobserved with an exposure time of about 1 min [short-cadence (SC)mode].
There are four open clusters in the Kepler field of view:NGC 6811, NGC 6819, NGC 6791 and NGC 6866. Kepler studiesof pulsating red giants in these clusters allow independent estimatesof mass, radius and surface gravity of each star. In these stars thelarge separation (i.e. the frequency separation between modes ofthe same spherical harmonic degree but of successive overtones)allows the mean density to be obtained, while the frequency ofmaximum amplitude gives a separate relationship between massand radius, allowing both the mass and the radius to be determined.Stello et al. (2010), using Kepler data, were the first to apply themethod to red giants in NGC 6819. From the masses derived inthis way, Miglio et al. (2012) have recently studied mass-loss inred giants in NGC 6791 and NGC 6819. From the radius and ef-fective temperature, the luminosity of the red giants can be derived
� E-mail: [email protected]
which allows the distance to the cluster to be found in a model-independent manner. Such studies have been applied to NGC 6791and NGC 6819 (Basu et al. 2011; Miglio et al. 2012), to NGC 6791,NGC 6819 and NGC 6811 (Hekker et al. 2011; Corsaro et al. 2012)and to NGC 6866 (Balona et al. 2013).
Apart from studies of stellar pulsation, stars in clusters may alsoprovide useful information regarding stellar rotation. For example,some cool stars have starspots which lead to rotational modulationof the light curve. In a series of papers (Barnes 2001, 2003, 2007;Barnes & Kim 2010), Barnes showed that the rotation periods ofcool dwarfs depend on their mass and age in accordance with alaw first discovered by Skumanich (1972). The colour index canbe used as a proxy for the stellar mass and, as a result, there existsa period–colour–age relationship. Reliable ages can be derived forfield dwarf stars in this way.
NGC 6819 is a moderately old cluster (≈2.5 Gyr; Rosvick &Vandenberg 1998; Kalirai et al. 2001; Basu et al. 2011) with near-solar or slightly super-solar metallicity ([Fe/H]= +0.09 ± 0.03;Bragaglia et al. 2001). From BV photometry and main-sequence fit-ting, Rosvick & Vandenberg (1998) obtained a distance modulus ofμ0 = V0 − MV = 12.36 and a reddening of E(B − V) = 0.16.From additional BV photometry, Kalirai et al. (2001) derived adistance modulus μ0 = 12.30 ± 0.12 and a reddening of E(B −V) = 0.10. Hole et al. (2009) obtained further photometry and alsoradial velocities for 1207 stars in the field of the cluster from whichthey deduce 480 cluster members. The cluster members define aclear colour–magnitude diagram in which giant, subgiant and blue
C© 2013 The AuthorsPublished by Oxford University Press on behalf of the Royal Astronomical Society
at Potchefstroom U
niversity on March 26, 2014
http://mnras.oxfordjournals.org/
Dow
nloaded from
Kepler observations of the open cluster NGC 6819 3473
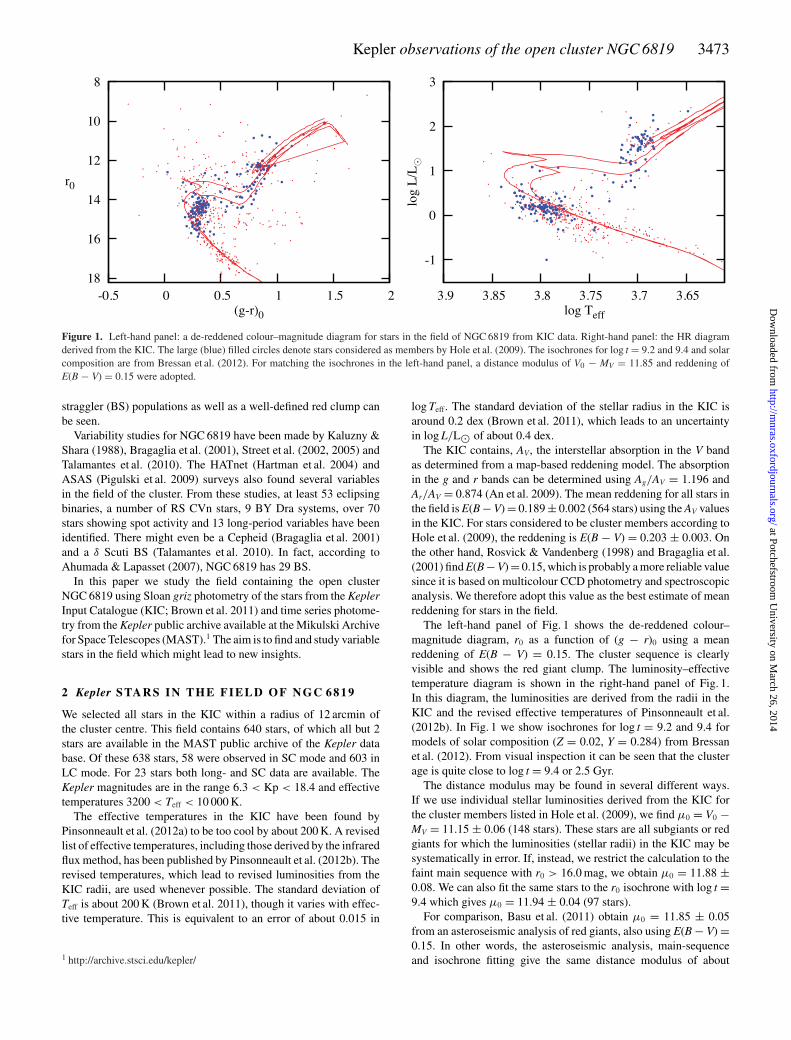
Figure 1. Left-hand panel: a de-reddened colour–magnitude diagram for stars in the field of NGC 6819 from KIC data. Right-hand panel: the HR diagramderived from the KIC. The large (blue) filled circles denote stars considered as members by Hole et al. (2009). The isochrones for log t = 9.2 and 9.4 and solarcomposition are from Bressan et al. (2012). For matching the isochrones in the left-hand panel, a distance modulus of V0 − MV = 11.85 and reddening ofE(B − V) = 0.15 were adopted.
straggler (BS) populations as well as a well-defined red clump canbe seen.
Variability studies for NGC 6819 have been made by Kaluzny &Shara (1988), Bragaglia et al. (2001), Street et al. (2002, 2005) andTalamantes et al. (2010). The HATnet (Hartman et al. 2004) andASAS (Pigulski et al. 2009) surveys also found several variablesin the field of the cluster. From these studies, at least 53 eclipsingbinaries, a number of RS CVn stars, 9 BY Dra systems, over 70stars showing spot activity and 13 long-period variables have beenidentified. There might even be a Cepheid (Bragaglia et al. 2001)and a δ Scuti BS (Talamantes et al. 2010). In fact, according toAhumada & Lapasset (2007), NGC 6819 has 29 BS.
In this paper we study the field containing the open clusterNGC 6819 using Sloan griz photometry of the stars from the KeplerInput Catalogue (KIC; Brown et al. 2011) and time series photome-try from the Kepler public archive available at the Mikulski Archivefor Space Telescopes (MAST).1 The aim is to find and study variablestars in the field which might lead to new insights.
2 Kepler S TA R S I N T H E FI E L D O F N G C 6 8 1 9
We selected all stars in the KIC within a radius of 12 arcmin ofthe cluster centre. This field contains 640 stars, of which all but 2stars are available in the MAST public archive of the Kepler database. Of these 638 stars, 58 were observed in SC mode and 603 inLC mode. For 23 stars both long- and SC data are available. TheKepler magnitudes are in the range 6.3 < Kp < 18.4 and effectivetemperatures 3200 < Teff < 10 000 K.
The effective temperatures in the KIC have been found byPinsonneault et al. (2012a) to be too cool by about 200 K. A revisedlist of effective temperatures, including those derived by the infraredflux method, has been published by Pinsonneault et al. (2012b). Therevised temperatures, which lead to revised luminosities from theKIC radii, are used whenever possible. The standard deviation ofTeff is about 200 K (Brown et al. 2011), though it varies with effec-tive temperature. This is equivalent to an error of about 0.015 in
1 http://archive.stsci.edu/kepler/
log Teff. The standard deviation of the stellar radius in the KIC isaround 0.2 dex (Brown et al. 2011), which leads to an uncertaintyin log L/L� of about 0.4 dex.
The KIC contains, AV, the interstellar absorption in the V bandas determined from a map-based reddening model. The absorptionin the g and r bands can be determined using Ag/AV = 1.196 andAr/AV = 0.874 (An et al. 2009). The mean reddening for all stars inthe field is E(B − V) = 0.189 ± 0.002 (564 stars) using the AV valuesin the KIC. For stars considered to be cluster members according toHole et al. (2009), the reddening is E(B − V) = 0.203 ± 0.003. Onthe other hand, Rosvick & Vandenberg (1998) and Bragaglia et al.(2001) find E(B − V) = 0.15, which is probably a more reliable valuesince it is based on multicolour CCD photometry and spectroscopicanalysis. We therefore adopt this value as the best estimate of meanreddening for stars in the field.
The left-hand panel of Fig. 1 shows the de-reddened colour–magnitude diagram, r0 as a function of (g − r)0 using a meanreddening of E(B − V) = 0.15. The cluster sequence is clearlyvisible and shows the red giant clump. The luminosity–effectivetemperature diagram is shown in the right-hand panel of Fig. 1.In this diagram, the luminosities are derived from the radii in theKIC and the revised effective temperatures of Pinsonneault et al.(2012b). In Fig. 1 we show isochrones for log t = 9.2 and 9.4 formodels of solar composition (Z = 0.02, Y = 0.284) from Bressanet al. (2012). From visual inspection it can be seen that the clusterage is quite close to log t = 9.4 or 2.5 Gyr.
The distance modulus may be found in several different ways.If we use individual stellar luminosities derived from the KIC forthe cluster members listed in Hole et al. (2009), we find μ0 = V0 −MV = 11.15 ± 0.06 (148 stars). These stars are all subgiants or redgiants for which the luminosities (stellar radii) in the KIC may besystematically in error. If, instead, we restrict the calculation to thefaint main sequence with r0 > 16.0 mag, we obtain μ0 = 11.88 ±0.08. We can also fit the same stars to the r0 isochrone with log t =9.4 which gives μ0 = 11.94 ± 0.04 (97 stars).
For comparison, Basu et al. (2011) obtain μ0 = 11.85 ± 0.05from an asteroseismic analysis of red giants, also using E(B − V) =0.15. In other words, the asteroseismic analysis, main-sequenceand isochrone fitting give the same distance modulus of about
at Potchefstroom U
niversity on March 26, 2014
http://mnras.oxfordjournals.org/
Dow
nloaded from

3474 L. A. Balona et al.
μ = 11.9 mag. On the other hand, the distance modulus using KICradii and revised effective temperatures for giants and subgiants isconsiderably smaller at μ0 = 11.15. This suggests that the KIC radiifor giants and subgiants are systematically too small. The same dis-crepancy was found for stars in the cluster NGC 6866 (Balona et al.2013).
3 TH E Kepler DATA
For the vast majority of stars, Kepler photometry is available onlyin LC mode which consist of practically uninterrupted 30 min expo-sures. For a few thousand stars, SC 1 min exposures are available, butthese usually cover only one or two months of observations. Char-acteristics of SC data are described in Gilliland et al. (2010), whileJenkins et al. (2010b) describe the characteristics of LC data. Thescience processing pipeline is described by Jenkins et al. (2010a).In this study we use all available LC and SC data (Q0–Q12) fromJD 245 4953 to JD 245 6015 (1061 d). The majority of stars wereobserved over a time span of about 500 d, though for about 30 percent of the stars the time span is only 180 d. SC data are availablefor 58 stars, nearly all of them with a time span of about 30 d.
The light-curve files contain simple aperture photometry (SAP)flux and a more processed version of SAP with artefact mitigationincluded called presearch data conditioning (PDC) flux. Significantsystematic and stochastic errors occur in the SAP which includediscontinuities, outliers, systematic trends and other instrumentalsignatures. The PDC tries to remove these errors while preservingastrophysically interesting signals. This makes use of a subset ofhighly correlated and quiet stars to generate a cotrending basis vec-tor set which is in turn used to establish a range of reasonable robustfit parameters. The PDC flux uses the best fit that simultaneouslyremoves systematic effects while reducing the signal distortion andnoise injection. Details of how this is accomplished are describedin Stumpe et al. (2012) and Smith et al. (2012).
Although for many stars, the PDC flux clearly removes instru-mental trends, this is not true for around 10 per cent of the stars. Wetherefore used our own software which uses a moving average of theSAP flux to define a smooth light curve for each quarter. Outlierswere removed if the deviation from the smooth light curve exceededa certain value. Long-term trends to each quarter were removed us-ing low-order polynomials typically of order 3 or 5. Finally, jumpsbetween quarters were calculated and removed. The resulting cor-rected data were used to calculate periodograms. Because a degreeof smoothing is involved, the power at low frequencies is reduced.From simulations, we find that frequencies higher than about 0.1 d−1
are not affected by this procedure.For each star in the field of NGC 6819, we visually examined
the SAP light curve and the periodogram and attached a variabilityclass. This is, of course, a subjective process guided also by thelocation of the star in the HR diagram. δ Sct stars are probably theeasiest to recognize as they contain peaks at high frequencies (i.e.greater than about 5 d−1). Pulsating red giants sometimes have highfrequencies, but they are much cooler. γ Dor stars are very difficultto distinguish from spotted stars except if they have several low-frequency peaks which cannot be explained by rotation. Solar-likeoscillators are easy to classify as they have a characteristic Gaussian-like envelope. However, at very low frequencies these peaks mergeinto the noise and are difficult to distinguish. Stars with a singlelow frequency or a group of peaks tightly clustered around a singlefrequency were taken to be rotational variables (spotted stars). Inmany of these, the harmonic is visible as expected for a spotted star.
4 δ S C U T I STA R S
Stars considered to be δ Scuti variables are listed in Table 1.KIC 4936524 and KIC 5200544 are both cluster members accord-ing to Hole et al. (2009). The location of the δ Sct stars in the HRdiagram is shown in Fig. 2. We note two stars that are much coolerthan the others: KIC 5025217 and KIC 5200544. The periodogramsof the δ Sct stars are shown in Fig. 3 (LC mode) and in Fig. 4 (SCmode).
While searching for δ Sct variables we found some stars thathave the same frequencies as a brighter nearby star. This is clearlya false signal due to light from the brighter star leaking into theaperture of the fainter star (i.e. blending). Stars with this feature areKIC 4937438 (blended with KIC 4937435), KIC 5024450 and KIC5024456 (blended with KIC 5024482).
KIC 4936524 is the only previously known δ Sct star in Table 1and is listed in Uytterhoeven et al. (2011). It is also classified as a BSby Hole et al. (2009). Its periodogram shows several nearly equallyspaced peaks with a separation of about δf ≈ 1.2 d−1. It is a clustermember with a 95 per cent probability and a rapid rotator (Holeet al. 2009). KIC 4937379 also shows nearly equally spaced peakswith δf = 1.0 d−1. It is probably a spotted star since it has a strongpeak at f = 0.30 d−1 and harmonics at 2f, 4f and 6f. KIC 5024482 isanother interesting star with just four low-amplitude peaks (12.70,11.38, 11.94, 10.91 d−1).
Table 1. δ Scuti stars in the field of NGC 6819. The columns are: the KICnumber, the WOCS number and the percentage membership (both fromHole et al. 2009), the cadence (L – long, S – short), the Kp magnitude,corrected effective temperature and luminosity as derived from the KIC.
KIC WOCS Mem Cad Kp Teff log L/L�4936524 3022 95 S 13.104 7466 1.27194937379 L 11.454 7092 1.38774937435 L 12.760 7803 1.73775023338 L 13.413 7436 1.37355024482 9001 L 12.2035025217 3014 L 11.800 6322 0.30745113557 L 6.2665200544 13019 95 S, L 14.381 6087 0.4851
Figure 2. Location of δ Scuti stars (large filled circles) in the HR diagram.The trapezoidal region shows the general location of Kepler δ Sct stars fromBalona & Dziembowski (2011). Stars with solar-like oscillations are shownas (green) open circles and the two crosses show γ Dor candidates.
at Potchefstroom U
niversity on March 26, 2014
http://mnras.oxfordjournals.org/
Dow
nloaded from

Kepler observations of the open cluster NGC 6819 3475
Figure 3. Periodograms of LC δ Scuti stars.
Figure 4. Periodograms of SC δ Scuti stars.
KIC 5025217 (WOCS 3014) has been observed by Hole et al.(2009) who classified it as a binary with unknown membership ofthe cluster. The pulsation amplitude does not exceed 0.2 mmagwhich is probably too small to cause measurable radial velocityvariations. It is possible that the star is a solar-like oscillator. Indeed,the periodogram shows equally spaced peaks which is consistentwith a large separation �ν = 13.5 µHz and νmax = 157.75 µHz andfalls on the �ν–νmax relation for solar-like oscillations (Stello et al.2009). The resultant luminosity is log L/L� = 1.61 as opposed tolog L/L� = 0.30 in Fig. 2, which places it among the red giantsexcept that it is far too hot. If the star is a red giant, perhaps the higheffective temperature may be a result of a hot, luminous, companion.
KIC 5113557 is HR 7499 (A6V, v sin i = 102 km s−1; Royer,Zorec & Gomez 2007) which is an X-ray source (Gosnell et al.2012). The star is far too bright to be a cluster member and is
heavily saturated in Kepler photometry. The very dense and complexperiodogram is probably affected by saturation. KIC 5200544 hasseveral peaks of extremely low amplitude (mostly less than 0.05mmag) with frequencies as high as 43 d−1.
Perhaps the most interesting stars are KIC 5025217 andKIC 5200544 both of which are much cooler than the red edgeof the instability region, as shown in Fig. 2. KIC 5025217 has beendiscussed above and may not be a δ Sct star. KIC 5200544 is a clus-ter member with 95 per cent probability (Hole et al. 2009). UsingE(B − V) = 0.15 and the (B − V) values in Hole et al. (2009) we ob-tain (B − V)0 = 0.39 and 0.49 for KIC 5025217 and KIC 5200544,respectively. Transforming the KIC unreddened (g − r)0 valuesusing (B − V)0 = 0.98(g − r)0 + 0.22 (Jester et al. 2005) gives(B − V)0 = 0.38 and 0.51, respectively, which means that the cooltemperatures are not due to photometric errors. Both stars certainlydeserve closer attention.
5 γ D O R STA R S
The γ Dor variables are multiperiodic pulsating stars with fre-quencies in the range 0.5–5 d−1. They are extremely difficult todistinguish from spotted stars unless they have very asymmetriclight curves or too many frequencies to be adequately explainedby rotation (Balona et al. 2011). Three candidates were found andlisted in Table 2 and shown in Fig. 2. Their periodograms are shownin Fig. 5. Of the three stars, KIC 5024455 is listed by Uytterhoevenet al. (2011) as γ Dor, but none of the others have previously beenknown to be variable. KIC 5024455 (WOCS 14012) is listed as aBS by Hole et al. (2009).
Table 2. Suspected γ Dor stars.
KIC WOCS Mem Cad Kp Teff log L/L�5111801 L 9.8075024455 14012 S 14.790 7130 0.43215113809 6022 L 13.755 6617 0.4432
Figure 5. Periodograms of γ Dor candidates.
at Potchefstroom U
niversity on March 26, 2014
http://mnras.oxfordjournals.org/
Dow
nloaded from

3476 L. A. Balona et al.
The periodogram of KIC 5111801 shows a tight group of peaksaround 1 d−1. In fact, the central peak at f = 1.017 d−1 has harmon-ics as high as 4f, suggesting that at least this frequency might bedue to a starspot. The same is true of KIC 5113809 in which thehighest amplitude is at f = 0.646 d−1, but peaks at 2f and 3f areclearly present. However, peaks at 2.489 and 2.585 d−1 do not fitthis pattern.
It is possible that none of these stars are actually pulsating. Theperiodograms of many cool stars show peaks which do not always fitinto a harmonic pattern, but are likely to be due to drifting starspotsor starspots which change size and position. The three stars inTable 2 are, however, the most likely γ Dor candidates. These γ
Dor candidates have distance moduli considerably smaller than thatof the cluster and are probably foreground stars.
6 STA R S W I T H S O L A R - L I K E O S C I L L AT I O N S
All cool stars have convective envelopes. The convective motionsresonate with the global acoustic frequencies characteristic of thestar, thereby driving low-amplitude oscillations at these frequencies.This mechanism of pulsational driving by stochastic convective mo-tion was first detected in the Sun (Leighton, Noyes & Simon 1962).Data from the WIRE, MOST, CoRoT and Kepler space missionshave been particularly important for the study of these oscillationsin stars owing to their small amplitudes. In the periodogram, theseoscillations are easily identified because of the localized comb-likestructure with amplitudes which decrease sharply from a centralmaximum. In fact, the location of frequency of maximum ampli-tude, νmax, is an important parameter as it seems to be related tothe acoustic cutoff frequency of the star and hence to its physicalparameters (Brown et al. 1991; Kjeldsen & Bedding 1995):
νmax ≈ νmax�M/M�
(R/R�)2√
Teff/Teff�,
where the solar value for the frequency of maximum amplitudeis νmax� = 3120 µHz (Kallinger et al. 2010), M/M�, R/R� andTeff/Teff� are the stellar mass, radius and effective temperaturerelative to the Sun.
The separation between peaks of the comb is the other importantparameter. Acoustic modes tend to form equally spaced frequencystructures consisting of modes of the same spherical harmonic de-gree, l, but of successive overtones, n. The frequency separationbetween successive overtones is called the large separation, �ν,and depends on the mean density of the star (Ulrich 1986; Kjeldsen& Bedding 1995):
�ν ≈ �ν�√
M/M�(R/R�)3
,
where �ν� = 134.88 µHz (Kallinger et al. 2010). If νmax and �ν
are expressed in µHz, it is easy to show that
log M/M� = −7.6056 + 3
2log Teff + 3 log νmax − 4 log �ν,
log R/R� = −1.1151 + 1
2log Teff + log νmax − 2 log �ν,
log L/L� = −17.274 + 5 log Teff + 2 log νmax − 4 log �ν.
Since the effective temperature, luminosity and large separation arerelated to each other, one can use stellar evolution and pulsationmodels to constrain the solution. The stellar parameters are usuallydetermined by searching among a grid of stellar models to get abest fit for observed values of �ν, νmax, Teff and metallicity. This isusually referred to as ‘grid’ asteroseismology (Gai et al. 2011).
Using Kepler data, Stello et al. (2010) were able to obtain seismicparameters of 47 red giants in NGC 6819. Stello et al. (2011b) found61 red giants in the cluster in which solar-like oscillations could bedetected. Basu et al. (2011) and Hekker et al. (2011) studied theasteroseismic parameters of confirmed red giant members of thecluster.
By independent visual inspection of the periodograms and lightcurves, we recovered 45 stars mentioned in the literature as redgiants with solar-like oscillations. We did not recover 15 stars be-cause these have very low values of νmax. At these low frequenciesthe Gaussian envelope is very narrow and blends with the low-frequency noise, so that it is difficult to recognize them as solar-likeoscillations. In addition, we found 39 new solar-like candidates notpreviously mentioned in the literature. None of them except for KIC5112558 are listed by Hole et al. (2009) as radial velocity members.The new candidates are listed in Table 3.
Table 3. A list of new stars with solar-like oscillations discovered by visualinspection. The values of νmax and �ν are in µHz. When these values aremissing it is because they could not be calculated. The last column shows theunreddened distance moduli, μ0, obtained from the oscillation parametersusing fixed E(B − V) = 0.15.
KIC WOCS Mem Kp log (Teff) νmax �ν μ0
4936438 10.563 3.71 114.8 9.71 8.974936463 5019 0 12.941 3.71 44.8 4.69 12.464936825 6015 0 13.168 3.69 29.5 3.60 12.604937204 10.658 3.70 38.7 4.42 10.044937236 12.521 3.67 21.2 2.62 12.444937340 5022 0 13.672 3.73 1.44937784 2021 0 12.453 3.68 55.8 5.94 11.045023379 4019 0 12.817 3.69 31.3 4.05 12.035023865 12.833 29.9 3.985024252 13.322 1.55024263 24011 0 15.255 3.76 1.35024322 6011 0 13.108 3.71 59.9 5.86 12.285024584 11.020 35.5 3.765025021 4010 0 12.884 3.68 47.2 5.02 11.855025101 6010 0 13.635 21.9 2.915025172 3013 0 12.155 3.70 20.05025234 9013 0 13.335 3.82 2.15025472 3017 0 12.744 3.70 37.5 4.41 11.995025632 6019 0 13.138 3.69 33.4 3.92 12.645025895 11.542 3.71 127.3 10.20 10.045111655 3020 0 12.272 3.71 32.1 3.77 11.995111767 7016 0 13.677 3.68 29.7 3.69 12.915111987 29013 0 15.011 3.65 90.8 8.24 12.735112118 5009 0 12.633 3.69 31.5 3.73 12.025112127 6015 17.506 3.73 1.35112281 3008 5 12.236 3.72 71.7 6.42 11.575112558 11003 95 14.165 3.70 34.6 3.96 13.755112687 34002 15.119 3.79 1.35112840 6006 13.577 3.70 105.2 8.85 12.105113552 8016 0 13.466 34.1 4.015113644 4020 0 12.902 3.69 35.1 4.27 12.165199437 14019 0 14.095 3.68 32.4 3.94 13.085199554 13020 0 13.822 3.69 53.5 5.64 12.735199605 3016 0 11.337 62.0 6.055199906 12.090 3.71 62.6 5.79 11.405199930 2015 0 11.943 3.68 27.2 3.49 11.225199978 9019 0 13.355 3.71 175.4 14.56 10.915200629 8020 0 13.152 3.70 48.8 4.45 12.995200695 2020 0 12.132 3.68 29.8 3.60 11.54
at Potchefstroom U
niversity on March 26, 2014
http://mnras.oxfordjournals.org/
Dow
nloaded from

Kepler observations of the open cluster NGC 6819 3477
Figure 6. Periodograms of some stars with solar-like oscillations. The fittedGaussian and location of νmax (arrow) are shown.
We derived νmax by fitting a Gaussian to the highest peaks inthe periodogram in the appropriate frequency range after remov-ing a linear fit to the background noise level. The periodograms ofsome stars, together with the fitted Gaussian envelope, are shownin Fig. 6. More rigorous methods are available and we do not claimthe resulting νmax to be particularly accurate. Visual inspection ofthe fit was made in each case and, as far as we could judge, thefits all appear to describe the overall shape of the envelope quitewell. We used autocorrelation of the periodogram over the range ofthe oscillations to determine �ν (Huber et al. 2009). Peaks in theautocorrelation function are also expected to occur at 1
2 �ν which isthe frequency spacing between consecutive l = 0 and 1 modes. Weremoved the ambiguity by choosing the peak closest to the valuegiven by �ν = aνb
max with a = 0.266, b = 0.761. This empiricalrelationship is based on Kepler data of three open clusters and 662field stars (Hekker et al. 2011). In some cases, �ν could not bemeasured because the autocorrelation shows no clear maximum,which is why some stars in Table 3 have no measurements. Com-parison with Basu et al. (2011) for 12 stars in common shows thatour estimates of νmax are typically 3 per cent smaller. There is nosignificant systematic difference in �ν. It is difficult to estimatethe uncertainties in these two quantities. Hekker et al. (2012) haveinvestigated this question by means of simulations using differentmethods and found that for a time series duration of about 500 d asused here the uncertainty in νmax is about 2 per cent and in �ν it isabout 1 per cent.
Fig. 7 shows the relationship between νmax and �ν for stars inTable 3. Also shown is the function �ν = aνb
max. For 63 stars forwhich we could measure νmax and �ν and for which revised ef-fective temperatures are available, we were able to determine themass, radius and luminosity using the equations described above.This is called the ‘direct method’. Omitting two discrepant stars,KIC 5024272 and 5112950, we obtain a mean mass of M/M� =1.61 ± 0.05. Basu et al. (2011) obtained a seismic mean mass of
Figure 7. The relationship between νmax and �ν for stars in Table 3 andthe function �ν = 0.266ν0.761
max (solid line).
Figure 8. Location of red giants (filled circles) in the HR diagram usingluminosities derived from the oscillation frequencies. The BS discussed inthe text are shown by crosses.
M/M� = 1.68 ± 0.03 for red giants, while Miglio et al. (2012)obtained M/M� = 1.61–1.62 for red giants outside the clump andM/M� = 1.52–1.70 for red giants in the clump.
The HR diagram using these luminosities is shown in Fig. 8. Twostars, KIC 5111987 and 5199437, which are on the main sequenceaccording to KIC luminosities are actually giants according to theoscillation parameters. We were not able to detect solar-like oscil-lations in dwarf stars due to the fact that these would occur beyondthe Nyquist frequency of 24 d−1 for LC data. There appear to be nosolar-like oscillations in any of the 23 stars for which SC data areavailable.
Using the unreddened r photometry and bolometric correction,we are able to determine the unreddened distance modulus, μ0,for every star. Table 3 gives the distance moduli assuming a fixedreddening of E(B − V) = 0.15. A histogram of the distribution ofdistance moduli is shown in Fig. 9. The sharp peak shows that mostof the red giants are at about the same distance. If we remove fouroutliers, we obtain μ0 = 12.20 ± 0.06 from 60 stars assuming aconstant E(B − V) = 0.15. The uncertainty is purely an internalerror. The various distance moduli discussed in Section 2 cluster
at Potchefstroom U
niversity on March 26, 2014
http://mnras.oxfordjournals.org/
Dow
nloaded from
3478 L. A. Balona et al.
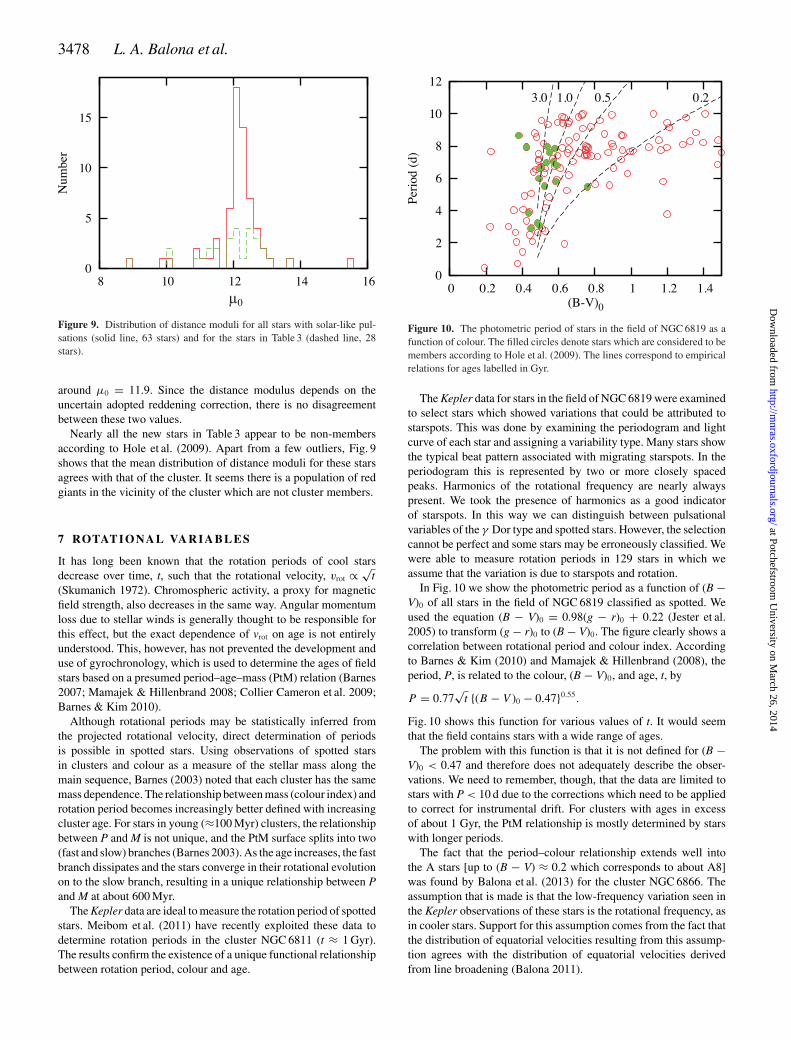
Figure 9. Distribution of distance moduli for all stars with solar-like pul-sations (solid line, 63 stars) and for the stars in Table 3 (dashed line, 28stars).
around μ0 = 11.9. Since the distance modulus depends on theuncertain adopted reddening correction, there is no disagreementbetween these two values.
Nearly all the new stars in Table 3 appear to be non-membersaccording to Hole et al. (2009). Apart from a few outliers, Fig. 9shows that the mean distribution of distance moduli for these starsagrees with that of the cluster. It seems there is a population of redgiants in the vicinity of the cluster which are not cluster members.
7 ROTAT I O NA L VA R I A B L E S
It has long been known that the rotation periods of cool starsdecrease over time, t, such that the rotational velocity, vrot ∝ √
t
(Skumanich 1972). Chromospheric activity, a proxy for magneticfield strength, also decreases in the same way. Angular momentumloss due to stellar winds is generally thought to be responsible forthis effect, but the exact dependence of vrot on age is not entirelyunderstood. This, however, has not prevented the development anduse of gyrochronology, which is used to determine the ages of fieldstars based on a presumed period–age–mass (PtM) relation (Barnes2007; Mamajek & Hillenbrand 2008; Collier Cameron et al. 2009;Barnes & Kim 2010).
Although rotational periods may be statistically inferred fromthe projected rotational velocity, direct determination of periodsis possible in spotted stars. Using observations of spotted starsin clusters and colour as a measure of the stellar mass along themain sequence, Barnes (2003) noted that each cluster has the samemass dependence. The relationship between mass (colour index) androtation period becomes increasingly better defined with increasingcluster age. For stars in young (≈100 Myr) clusters, the relationshipbetween P and M is not unique, and the PtM surface splits into two(fast and slow) branches (Barnes 2003). As the age increases, the fastbranch dissipates and the stars converge in their rotational evolutionon to the slow branch, resulting in a unique relationship between Pand M at about 600 Myr.
The Kepler data are ideal to measure the rotation period of spottedstars. Meibom et al. (2011) have recently exploited these data todetermine rotation periods in the cluster NGC 6811 (t ≈ 1 Gyr).The results confirm the existence of a unique functional relationshipbetween rotation period, colour and age.
Figure 10. The photometric period of stars in the field of NGC 6819 as afunction of colour. The filled circles denote stars which are considered to bemembers according to Hole et al. (2009). The lines correspond to empiricalrelations for ages labelled in Gyr.
The Kepler data for stars in the field of NGC 6819 were examinedto select stars which showed variations that could be attributed tostarspots. This was done by examining the periodogram and lightcurve of each star and assigning a variability type. Many stars showthe typical beat pattern associated with migrating starspots. In theperiodogram this is represented by two or more closely spacedpeaks. Harmonics of the rotational frequency are nearly alwayspresent. We took the presence of harmonics as a good indicatorof starspots. In this way we can distinguish between pulsationalvariables of the γ Dor type and spotted stars. However, the selectioncannot be perfect and some stars may be erroneously classified. Wewere able to measure rotation periods in 129 stars in which weassume that the variation is due to starspots and rotation.
In Fig. 10 we show the photometric period as a function of (B −V)0 of all stars in the field of NGC 6819 classified as spotted. Weused the equation (B − V)0 = 0.98(g − r)0 + 0.22 (Jester et al.2005) to transform (g − r)0 to (B − V)0. The figure clearly shows acorrelation between rotational period and colour index. Accordingto Barnes & Kim (2010) and Mamajek & Hillenbrand (2008), theperiod, P, is related to the colour, (B − V)0, and age, t, by
P = 0.77√
t {(B − V )0 − 0.47}0.55.
Fig. 10 shows this function for various values of t. It would seemthat the field contains stars with a wide range of ages.
The problem with this function is that it is not defined for (B −V)0 < 0.47 and therefore does not adequately describe the obser-vations. We need to remember, though, that the data are limited tostars with P < 10 d due to the corrections which need to be appliedto correct for instrumental drift. For clusters with ages in excessof about 1 Gyr, the PtM relationship is mostly determined by starswith longer periods.
The fact that the period–colour relationship extends well intothe A stars [up to (B − V) ≈ 0.2 which corresponds to about A8]was found by Balona et al. (2013) for the cluster NGC 6866. Theassumption that is made is that the low-frequency variation seen inthe Kepler observations of these stars is the rotational frequency, asin cooler stars. Support for this assumption comes from the fact thatthe distribution of equatorial velocities resulting from this assump-tion agrees with the distribution of equatorial velocities derivedfrom line broadening (Balona 2011).
at Potchefstroom U
niversity on March 26, 2014
http://mnras.oxfordjournals.org/
Dow
nloaded from

Kepler observations of the open cluster NGC 6819 3479
The results presented here confirm those in NGC 6866, but leavemany unanswered questions. The first is the general belief thatrotational braking is negligible in stars hotter than mid-F [hence,the limit of applicability of the PtM relation to (B − V)0 > 0.47].This does not seem to be the case and is only evident because of thesuperb precision of Kepler photometry. The rotational light curvesin most stars in the cluster cannot be detected from ground-basedobservations. If rotational braking due to mass-loss arising fromconvection is indeed the cause of the PtM relationship, one is ledto the conclusion that convection and mass-loss are as importantin late-A and F-type stars as they are in G, K and M stars. This issurprising as the convective zones in these hot stars are very thin,but is consistent with recent deductions from Kepler observationsof hot stars (Balona 2011). Apart from the fact, already alluded to,that starspots appear to be present in stars as hot as A0, we also havethe fact that flares have been seen in these hot stars (Balona 2012).
8 OT H E R VA R I A B L E S
Several stars could not be placed in any clear variability class(Table 4). Among these are a few stars with a single significantpeak in the high-frequency region. KIC 5112705 and KIC 5112687both have a single peak at 9.44 d−1 but the stars are separated byonly 6 arcsec which means that the common frequency is due toblending. Other stars with a single peak are KIC 5024263 (5.91 d−1)and KIC 5024652 (6.60 d−1). KIC 4937512 has two small but sig-nificant peaks at 7.75 and 6.76 d−1. Whether any of these peaks areintrinsic to the star is difficult to say without further investigation. Ifthey are intrinsic, it would suggest a pulsation since the frequenciesare rather high for rotation or orbital motion.
Three multiperiodic stars of unknown type are shown in Fig. 11.KIC 5024268 looks very much like a δ Sct star with rather lowfrequencies, but the star is far too cool. The red colour is supportedby photometry by Hole et al. (2009) for which (B − V) = 1.14. Stelloet al. (2011b) classify this star as a solar-like oscillator blended witha nearby δ Sct star, but do not identify the offending δ Sct star. Themost probable candidate would be KIC 5024272 (WOCS 3003)which is of comparable brightness and at 30 arcsec distance, butthere are no δ Sct pulsations in this star. It therefore seems thatthe variability is intrinsic to the star and not due to stay light fromanother star unless the δ Sct variable is within the same aperture oris a binary companion to the red giant.
The harmonics seen in the periodogram of KIC 5112836 suggestsa spotted star or perhaps grazing eclipsing binary. The periodogramresembles that of a δ Sct star except that harmonics of such low am-plitude are very unusual. Harmonics tend to occur only in stars withhigh pulsation amplitudes where non-linear effects start to appear.The periodogram does not lend itself to any simple explanation.
The periodogram of KIC 5200521 [(B − V) = 0.78] also resem-bles that of a δ Sct star, but the star is also too cool to be a δ Sct
Table 4. Stars with unknown classification. The columns are the same asin Table 1.
KIC WOCS Mem Cad Kp Teff log L/L�5024652 24003 L 15.193 6072 0.06165024263 24011 0 L 15.255 5720 0.00905024268 2003 93 L 11.359 5092 2.18715112687 34002 L 15.119 6153 −0.05265112836 45004 L 15.449 6278 −0.04315200521 2017 0 L 11.223 5378 0.8180
Figure 11. Periodograms of three interesting stars of doubtful classification.
Table 5. Eclipsing binaries in the field of NGC 6819. The third columndescribes the light curve as follows: EA: detached eclipsing binary; EB:semi-detached or contact binaries; EW: W Ursae Majoris type; EP: veryshort shallow eclipse (perhaps a compact or planetary companion). Theorbital period is in days.
KIC WOCS Mem Type Period Kp Teff log L/L�4936180 35025 95 EP 4.639 15.270 6546 0.19034936990 33016 0 EP 10.314 15.295 6099 0.12384937143 EA 9.850 16.350 6705 0.49374937217 EW 0.429 15.402 6281 −0.04884937350 22024 EW 0.394 14.273 6150 0.20685023948 24009 EA 3.649 15.048 6174 0.22595023956 13009 0 EP 1.828 14.605 6326 0.14875024447 23009 EA - 14.980 6293 0.18245025261 1012 EB 2.172 12.343 6506 0.72635025294 40013 EP 5.463 13.266 5977 0.02345112410 44008 EW 0.366 15.112 5669 −0.06405112741 3002 EB 17.758 12.449 4920 1.59485113053 40007 EA 3.185 15.519 6288 0.38285199426 10022 0 EA 78.625 14.080 5945 0.09195199489 EW 0.464 15.888 5972 −0.0930
variable. There are no δ Sct nearby stars with the same frequen-cies. This places the star in the same category as KIC 5024268. Theperiodograms of these stars are certainly very interesting and de-serve further study. Perhaps these are hot δ Sct stars with red giantcompanions or perhaps we do not fully understand high-frequencypulsations in cool stars.
A number of eclipsing binaries of various types were detected(Table 5). Some of the eclipses are very short and shallow whichcould indicate a compact companion or planet. In contrast toKaluzny & Shara (1988), who were not able to find any contactbinaries in the cluster, we find several of the EB and EW type.KIC 5023948 and KIC 5113053 are listed as type EA in Talamanteset al. (2010).
at Potchefstroom U
niversity on March 26, 2014
http://mnras.oxfordjournals.org/
Dow
nloaded from
3480 L. A. Balona et al.
Table 6. Stars within 5 arcsec of X-ray sources listed in Gosnell et al.(2012).
KIC Gosnell WOCS Mem Kp Teff log L/L�5112741 X6 3002 12.449 4920 1.59485024329 X7 15005 95 14.362 5037 1.00245023754 194049.0+400615 66016 16.274 6687 0.68355112553 194115.8+401724 12.314 5818 0.6313
KIC 5112741 is a red giant and a rapid rotator which is discussedby Hole et al. (2009). We obtain the same period of 17.7 d. Holeet al. (2009) remark that such a short period is not expected for abinary with a primary star that has evolved through the tip of thegiant branch and back to the red clump and that the current orbitalseparation would not permit a binary containing a star at the tip ofthe red giant branch without significant mass transfer and possiblya common-envelope phase. They conclude that KIC 5112741 is anevolved cluster member. Gosnell et al. (2012) find this star (whichis called X6 in this paper) to be an X-ray source. This is clearly aninteracting binary.
Other X-ray sources which can be identified with Kepler stars arelisted in Table 6. Both KIC 5112741 and KIC 5024329 are clustermembers according to Hole et al. (2009). Nothing very interestingcan be seen in the light curves and periodograms of KIC 5024329and 5023754, but KIC 5112553 clearly has starspots which migrate.The light curve has a period of about 5.3 d which is very likely therotation period of the star. There are many similar stars in the field,so why KIC 5112553 should be an X-ray source but not others isnot clear.
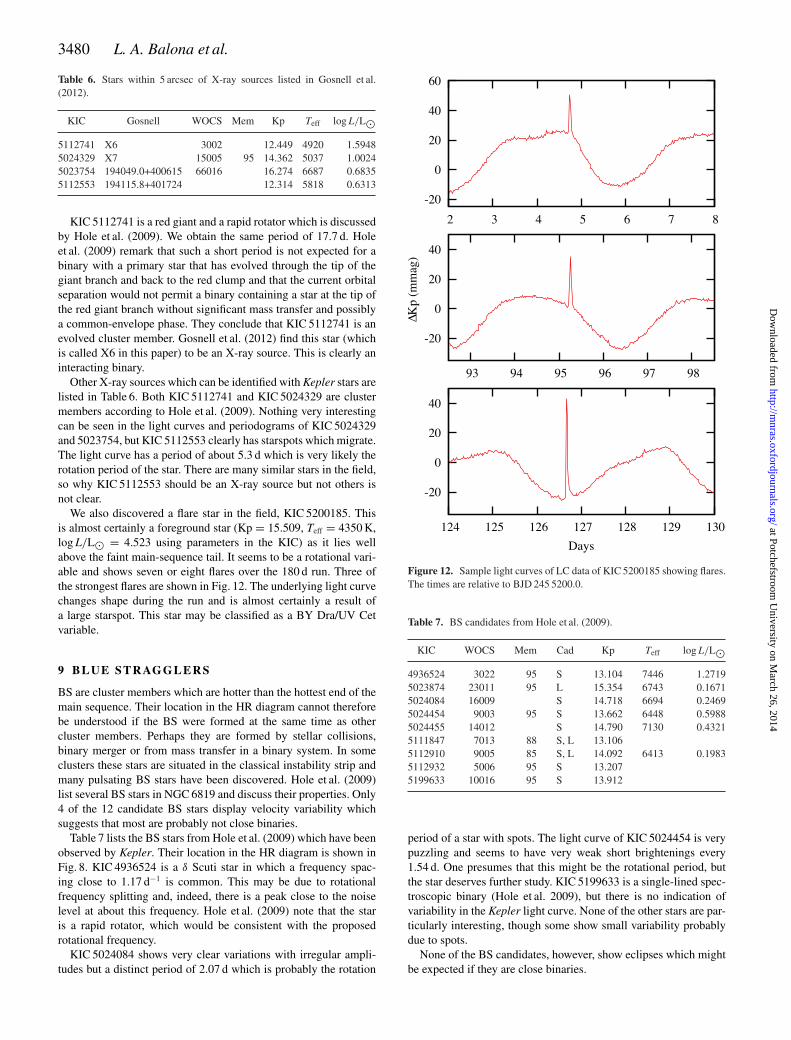
We also discovered a flare star in the field, KIC 5200185. Thisis almost certainly a foreground star (Kp = 15.509, Teff = 4350 K,log L/L� = 4.523 using parameters in the KIC) as it lies wellabove the faint main-sequence tail. It seems to be a rotational vari-able and shows seven or eight flares over the 180 d run. Three ofthe strongest flares are shown in Fig. 12. The underlying light curvechanges shape during the run and is almost certainly a result ofa large starspot. This star may be classified as a BY Dra/UV Cetvariable.
9 B L U E ST R AG G L E R S
BS are cluster members which are hotter than the hottest end of themain sequence. Their location in the HR diagram cannot thereforebe understood if the BS were formed at the same time as othercluster members. Perhaps they are formed by stellar collisions,binary merger or from mass transfer in a binary system. In someclusters these stars are situated in the classical instability strip andmany pulsating BS stars have been discovered. Hole et al. (2009)list several BS stars in NGC 6819 and discuss their properties. Only4 of the 12 candidate BS stars display velocity variability whichsuggests that most are probably not close binaries.
Table 7 lists the BS stars from Hole et al. (2009) which have beenobserved by Kepler. Their location in the HR diagram is shown inFig. 8. KIC 4936524 is a δ Scuti star in which a frequency spac-ing close to 1.17 d−1 is common. This may be due to rotationalfrequency splitting and, indeed, there is a peak close to the noiselevel at about this frequency. Hole et al. (2009) note that the staris a rapid rotator, which would be consistent with the proposedrotational frequency.
KIC 5024084 shows very clear variations with irregular ampli-tudes but a distinct period of 2.07 d which is probably the rotation
Figure 12. Sample light curves of LC data of KIC 5200185 showing flares.The times are relative to BJD 245 5200.0.
Table 7. BS candidates from Hole et al. (2009).
KIC WOCS Mem Cad Kp Teff log L/L�4936524 3022 95 S 13.104 7446 1.27195023874 23011 95 L 15.354 6743 0.16715024084 16009 S 14.718 6694 0.24695024454 9003 95 S 13.662 6448 0.59885024455 14012 S 14.790 7130 0.43215111847 7013 88 S, L 13.1065112910 9005 85 S, L 14.092 6413 0.19835112932 5006 95 S 13.2075199633 10016 95 S 13.912
period of a star with spots. The light curve of KIC 5024454 is verypuzzling and seems to have very weak short brightenings every1.54 d. One presumes that this might be the rotational period, butthe star deserves further study. KIC 5199633 is a single-lined spec-troscopic binary (Hole et al. 2009), but there is no indication ofvariability in the Kepler light curve. None of the other stars are par-ticularly interesting, though some show small variability probablydue to spots.
None of the BS candidates, however, show eclipses which mightbe expected if they are close binaries.
at Potchefstroom U
niversity on March 26, 2014
http://mnras.oxfordjournals.org/
Dow
nloaded from

Kepler observations of the open cluster NGC 6819 3481
1 0 C O N C L U S I O N S
A region of 12 arcmin radius centred on NGC 6819 is studied. Pho-tometry from the KIC (Brown et al. 2011) together with a revisedeffective temperature scale (Pinsonneault et al. 2012a) was usedto determine the age and distance modulus of the cluster. Thecluster sequence is reasonably well described by an isochrone ofabout 2.5 Gyr. The well-defined lower main sequence of the clustergives an unreddened distance modulus of μ0 = 11.94 ± 0.04 usingisochrone fitting. Using luminosities derived from effective temper-atures and radii we find μ0 = 11.88 ± 0.08 for the same stars. Wewere also able to derive the distance modulus in a completely inde-pendent way using solar-like oscillations in red giants, giving μ0 =12.20 ± 0.06. These methods depend on the adopted reddening ofthe cluster for which we used E(B − V) = 0.15, but are in goodagreement with each other and with most recent determinations.However, if we use the KIC parameters of giants and subgiants, weobtain a distance modulus which is too small by about 0.8 mag. Thissuggests that the radii of giants and subgiants in the KIC are too low.The same conclusion was already evident from Kepler observationsof NGC 6866 (Balona et al. 2013). There is considerable uncertaintyin the distance modulus using different data sets and reddening as-sumptions. The errors quoted are merely internal errors and do notreflect the (unknown) real error.
The main aim of this paper is to investigate stellar variability inthe cluster field using Kepler photometry. The cluster turnoff occursat about 6700 K which is at the cool end of the δ Sct instability strip.We did therefore not expect to find many δ Sct stars in the cluster.Of the eight δ Scuti stars in the field, at least one is a confirmedmember and some others may well be members judging by theirphotometric distances. If so, they are hotter than the turnoff andtherefore BS. In addition, we found two stars which appear to beδ Sct variables but are much cooler than the known red edge. It ispossible that the location of the red edge of the δ Sct instability stripshould be extended to temperatures as low as 6000 K. If so, we mayhave to revise our ideas regarding pulsational driving in these stars.
The γ Dor variables are very difficult to distinguish from rota-tional variability due to starspots. We could, however, identify threestars which have periodograms that cannot be easily explained byrotation and these are probably γ Dor variables, though they areprobably not cluster members judging from their photometric dis-tances.
There has been much recent work on solar-like oscillations inred giants, including studies of Kepler stars in NGC 6819 (Stelloet al. 2010, 2011a,b; Basu et al. 2011). We independently identified45 of these stars as well as an additional 39 new candidates oscil-lating red giants. Masses, radii and luminosities for 63 red giantswere determined using the direct method from their pulsational pa-rameters, from which the distance modulus already mentioned wasderived.
The rotation periods of 129 stars were measured. These stars arelikely to be rotational variables owing to the presence of harmonicsor periods too long to be attributed to γ Dor pulsations. We foundthe expected correlation between rotational period and colour whichis nowadays frequently used to determine the ages of stars, a processwhich has been termed ‘gyrochronology’ (Barnes 2001, 2003, 2007;Barnes & Kim 2010). We were surprised, however, to find that therelationship extends to stars hotter than F5 which is generally takenas the boundary between convective and radiative envelopes. Infact, the relationship still holds for late A-type stars, confirming aresult recently obtained by Balona et al. (2013) for NGC 6866. Thecorrelation suggests that even A-type stars have spots, which seems
a plausible explanation for the low frequencies seen in Kepler datafor A–F stars (Balona 2011, 2012).
Several stars which defy classification into any well-known vari-able star scheme were discussed. Among these are further examplesof very cool δ Sct-like variables. Some eclipsing binaries of vari-ous types were found. Finally, we examined the light curves of BScandidates but found that they do not differ in any way from thoseof other stars.
AC K N OW L E D G E M E N T S
This paper includes data collected by the Kepler mission. Fundingfor the Kepler mission is provided by the NASA Science MissionDirectorate. The authors wish to thank the Kepler team for their gen-erosity in allowing the data to be released and for their outstandingefforts which have made these results possible.
Much of the data presented in this paper were obtained from theMikulski Archive for Space Telescopes (MAST). STScI is operatedby the Association of Universities for Research in Astronomy, Inc.,under NASA contract NAS5-26555. Support for MAST for non-HST data is provided by the NASA Office of Space Science viagrant NNX09AF08G and by other grants and contracts.
LAB wishes to thank the South African Astronomical Observa-tory and the National Research Foundation for financial support.
R E F E R E N C E S
Ahumada J. A., Lapasset E., 2007, A&A, 463, 789An D. et al., 2009, ApJ, 700, 523Balona L. A., 2011, MNRAS, 415, 1691Balona L. A., 2012, MNRAS, 423, 3420Balona L. A., Dziembowski W. A., 2011, MNRAS, 417, 591Balona L. A., Guzik J. A., Uytterhoeven K., Smith J. C., Tenenbaum P.,
Twicken J. D., 2011, MNRAS, 415, 3531Balona L. A., Joshi S., Joshi Y. C., Sagar R., 2013, MNRAS, 429, 1466Barnes S. A., 2001, ApJ, 561, 1095Barnes S. A., 2003, ApJ, 586, 464Barnes S. A., 2007, ApJ, 669, 1167Barnes S. A., Kim Y.-C., 2010, ApJ, 721, 675Basu S. et al., 2011, ApJ, 729, L10Bragaglia A. et al., 2001, AJ, 121, 327Bressan A., Marigo P., Girardi L., Salasnich B., Dal Cero C., Rubele S.,
Nanni A., 2012, MNRAS, 427, 127Brown T. M., Gilliland R. L., Noyes R. W., Ramsey L. W., 1991, ApJ, 368,
599Brown T. M., Latham D. W., Everett M. E., Esquerdo G. A., 2011, AJ, 142,
112Collier Cameron A. et al., 2009, MNRAS, 400, 451Corsaro E. et al., 2012, ApJ, 757, 190Gai N., Basu S., Chaplin W. J., Elsworth Y., 2011, ApJ, 730, 63Gilliland R. L. et al., 2010, ApJ, 713, L160Gosnell N. M., Pooley D., Geller A. M., Kalirai J., Mathieu R. D., Frinchaboy
P., Ramirez-Ruiz E., 2012, ApJ, 745, 57Hartman J. D., Bakos G., Stanek K. Z., Noyes R. W., 2004, AJ, 128, 1761Hekker S. et al., 2011, A&A, 530, A100Hekker S. et al., 2012, A&A, 544, A90Hole K. T., Geller A. M., Mathieu R. D., Platais I., Meibom S., Latham D.
W., 2009, AJ, 138, 159Huber D., Stello D., Bedding T. R., Chaplin W. J., Arentoft T., Quirion P.-O.,
Kjeldsen H., 2009, Commun. Asteroseismol., 160, 74Jenkins J. M. et al., 2010a, ApJ, 713, L87Jenkins J. M. et al., 2010b, ApJ, 713, L120Jester S. et al., 2005, AJ, 130, 873Kalirai J. S. et al., 2001, AJ, 122, 266Kallinger T. et al., 2010, A&A, 522, A1
at Potchefstroom U
niversity on March 26, 2014
http://mnras.oxfordjournals.org/
Dow
nloaded from

3482 L. A. Balona et al.
Kaluzny J., Shara M. M., 1988, AJ, 95, 785Kjeldsen H., Bedding T. R., 1995, A&A, 293, 87Leighton R. B., Noyes R. W., Simon G. W., 1962, ApJ, 135, 474Mamajek E. E., Hillenbrand L. A., 2008, ApJ, 687, 1264Meibom S. et al., 2011, ApJ, 733, L9Miglio A. et al., 2012, MNRAS, 419, 2077Pigulski A., Pojmanski G., Pilecki B., Szczygieł D. M., 2009, Acta Astron.,
59, 33Pinsonneault M. H., An D., Molenda-Zakowicz J., Chaplin W. J., Metcalfe
T. S., Bruntt H., 2012a, ApJS, 199, 30Pinsonneault M. H., An D., Molenda-Zakowicz J., Chaplin W. J., Metcalfe
T. S., Bruntt H., 2012b, VizieR Online Data Catalog, 219, 90030Rosvick J. M., Vandenberg D. A., 1998, AJ, 115, 1516Royer F., Zorec J., Gomez A. E., 2007, A&A, 463, 671Skumanich A., 1972, ApJ, 171, 565Smith J. C. et al., 2012, PASP, 124, 1000
Stello D., Chaplin W. J., Basu S., Elsworth Y., Bedding T. R., 2009, MNRAS,400, L80
Stello D. et al., 2010, ApJ, 713, L182Stello D. et al., 2011a, ApJ, 737, L10Stello D. et al., 2011b, ApJ, 739, 13Street R. A. et al., 2002, MNRAS, 330, 737Street R. A. et al., 2005, MNRAS, 358, 795Stumpe M. C. et al., 2012, PASP, 124, 985Talamantes A., Sandquist E. L., Clem J. L., Robb R. M., Balam D. D.,
Shetrone M., 2010, AJ, 140, 1268Ulrich R. K., 1986, ApJ, 306, L37Uytterhoeven K. et al., 2011, A&A, 534, A125
This paper has been typeset from a TEX/LATEX file prepared by the author.
at Potchefstroom U
niversity on March 26, 2014
http://mnras.oxfordjournals.org/
Dow
nloaded from