ASTEROSEISMIC FUNDAMENTAL PROPERTIES OF SOLAR-TYPE STARS OBSERVED BY THE NASA KEPLER MISSION
Upload
independentCategory
view
1download
0
arX
iv:1
001.
0026
v1 [
astr
o-ph
.SR
] 30
Dec
200
9
Detection of solar-like oscillations fromKepler photometry of the opencluster NGC 6819
Dennis Stello,1 Sarbani Basu,2 Hans Bruntt,3 Benoıt Mosser,3 Ian R. Stevens,4
Timothy M. Brown,5 Jørgen Christensen-Dalsgaard,6 Ronald L. Gilliland,7 Hans Kjeldsen,6
Torben Arentoft,6 Jerome Ballot,8 Caroline Barban,3 Timothy R. Bedding,1 William J. Chaplin,4
Yvonne P. Elsworth,4 Rafael A. Garcıa,9 Marie-Jo Goupil,3 Saskia Hekker,4 Daniel Huber,1
Savita Mathur,10 Søren Meibom,11 Reza Samadi,3 Vinothini Sangaralingam,4
Charles S. Baldner,2 Kevin Belkacem,12 Katia Biazzo,13 Karsten Brogaard,6
Juan Carlos Suarez,14 Francesca D’Antona,15 Pierre Demarque,2 Lisa Esch,2 Ning Gai,2,16
Frank Grundahl,6 Yveline Lebreton,17 Biwei Jiang,16 Nada Jevtic,18 Christoffer Karoff,4
Andrea Miglio,12 Joanna Molenda-Zakowicz,19 Josefina Montalban,12 Arlette Noels,12
Teodoro Roca Cortes,20,21 Ian W. Roxburgh,22 Aldo M. Serenelli,23 Victor Silva Aguirre,23
Christiaan Sterken,24 Peter Stine,18 Robert Szabo,25 Achim Weiss,23 William J. Borucki,26
David Koch,26 Jon M. Jenkins27
– 2 –
1Sydney Institute for Astronomy (SIfA), School of Physics, University of Sydney, NSW 2006, Australia
2Department of Astronomy, Yale University, P.O. Box 208101,New Haven, CT 06520-8101
3LESIA, CNRS, Universite Pierre et Marie Curie, Universit´e Denis Diderot, Observatoire de Paris, 92195 Meudon,France
4School of Physics and Astronomy, University of Birmingham,Edgbaston, Birmingham B15 2TT, UK
5Las Cumbres Observatory Global Telescope, Goleta, CA 93117, USA
6Department of Physics and Astronomy, Aarhus University, 8000 Aarhus C, Denmark
7Space Telescope Science Institute, 3700 San Martin Drive, Baltimore, Maryland 21218, USA
8Laboratoire d’Astrophysique de Toulouse-Tarbes, Universite de Toulouse, CNRS,14 av E. Belin, 31400 Toulouse,France
9Laboratoire AIM, CEA/DSM-CNRS, Universite Paris 7 Diderot, IRFU/SAp, Centre de Saclay, 91191, Gif-sur-Yvette, France
10Indian Institute of Astrophysics, Koramangala, Bangalore560034, India
11Harvard-Smithsonian Center for Astrophysics, 60 Garden Street, Cambridge, MA, 02138, USA
12Institut d’Astrophysique et de Geophysique de l’Universite de Liege, 17 Allee du 6 Aout, B-4000 Liege, Belgium
13Arcetri Astrophysical Observatory, Largo E. Fermi 5, 50125, Firenze, Italy
14Instituto de Astrofısica de Andalucıa (CSIC),Dept. Stellar Physics, C.P. 3004, Granada, Spain
15INAF - Osservatorio di Roma, via di Frascati 33, I-00040, Monteporzio, Italy
16Department of Astronomy, Beijing Normal University, Beijing 100875, China
17GEPI, Observatoire de Paris, CNRS, Universite Paris Diderot, 5 Place Jules Janssen, 92195 Meudon, France
18Department of Physics & Engineering Technology, Bloomsburg University, 400 East Second St, Bloomsburg PA17815, USA
19Astronomical Institute, University of Wrocław, ul. Kopernika 11, 51-622 Wrocław, Poland
20Departmento de Astrofıca, Universidad de La Laguna, 38207La Laguna, Tenerife, Spain
21Instituto de Astrofıca de Canarias, 38205 La Laguna, Tenerife, Spain
22Queen Mary University of London, Mile End Road, London E1 4NS, UK
23Max Planck Institute for Astrophysics, Karl SchwarzschildStr. 1, Garching bei Munchen, D-85741, Germany
24Vrije Universiteit Brussel, Pleinlaan 2, B-1050 Brussels,Belgium
25Konkoly Observatory, H-1525 Budapest, P.O. Box 67, Hungary
26NASA Ames Research Center, MS 244-30, Moffat Field, CA 94035, USA
27SETI Institute/NASA Ames Research Center, MS 244-30, Moffat Field, CA 94035, USA
– 3 –
ABSTRACT
Asteroseismology of stars in clusters has been a long-sought goal because the as-sumption of a common age, distance and initial chemical composition allows strongtests of the theory of stellar evolution. We report results from the first 34 days of sci-ence data from theKepler Mission for the open cluster NGC 6819 — one of four clus-ters in the field of view. We obtain the first clear detections of solar-like oscillationsin the cluster red giants and are able to measure the large frequency separation,∆ν,and the frequency of maximum oscillation power,νmax. We find that the asteroseismicparameters allow us to test cluster-membership of the stars, and even with the limitedseismic data in hand, we can already identify four possible non-members despite theirhaving a better than 80% membership probability from radialvelocity measurements.We are also able to determine the oscillation amplitudes forstars that span about twoorders of magnitude in luminosity and find good agreement with the prediction thatoscillation amplitudes scale as the luminosity to the powerof 0.7. These early resultsdemonstrate the unique potential of asteroseismology of the stellar clusters observedby Kepler.
Subject headings: stars: fundamental parameters — stars: oscillations — stars: interi-ors — techniques: photometric — open clusters and associations: individual (NGC 6819)
1. Introduction
Open clusters provide unique opportunities in astrophysics. Stars in open clusters are believedto be formed from the same cloud of gas at roughly the same time. The fewer free parametersavailable to model cluster stars make them interesting targets to analyze as a uniform ensemble,especially for asteroseismic studies.
Asteroseismology is an elegant tool based on the simple principle that the frequency of astanding acoustic wave inside a star depends on the sound speed, which in turn depends onthe physical properties of the interior. This technique applied to the Sun (helioseismology) hasprovided extremely detailed knowledge about the physics that governs the solar interior, (e.g.,Christensen-Dalsgaard 2002). All cool stars are expected to exhibit solar-like oscillations of stand-ing acoustic waves – called p modes – that are stochasticallydriven by surface convection. Usingasteroseismology to probe the interiors of cool stars in clusters, therefore, holds promise of re-warding scientific return (Gough & Novotny 1993; Brown & Gilliland 1994). This potential hasresulted in several attempts to detect solar-like oscillations in clusters using time-series photome-try. These attempts were often aimed at red giants, since their oscillation amplitudes are expected

– 4 –
to be larger than those of main-sequence or subgiant stars due to more vigorous surface convection.Despite these attempts, only marginal detections have beenattained so far, limited either by thelength of the time series usually achievable through observations with theHubble Space Telescope(Edmonds & Gilliland 1996; Stello & Gilliland 2009) or by thedifficulty in attaining high preci-sion from ground-based campaigns (e.g., Gilliland et al. 1993; Stello et al. 2007; Frandsen et al.2007).
In this Letter we report clear detections of solar-like oscillations in red-giant stars in the opencluster NGC 6819 using photometry from NASA’sKepler Mission (Borucki et al. 2009). Thiscluster, one of four in theKepler field, is about 2.5 Gyr old. It is at a distance of 2.3 kpc, and has ametallicity of [Fe/H]∼ −0.05 (see Hole et al. 2009, and references herein).
2. Observations and data reduction
The data were obtained between 2009 May 12 and June 14, i.e., the first 34 days of con-tinuous science observations byKepler (Q1 phase). The spacecraft’s long-cadence mode (∆t ≃
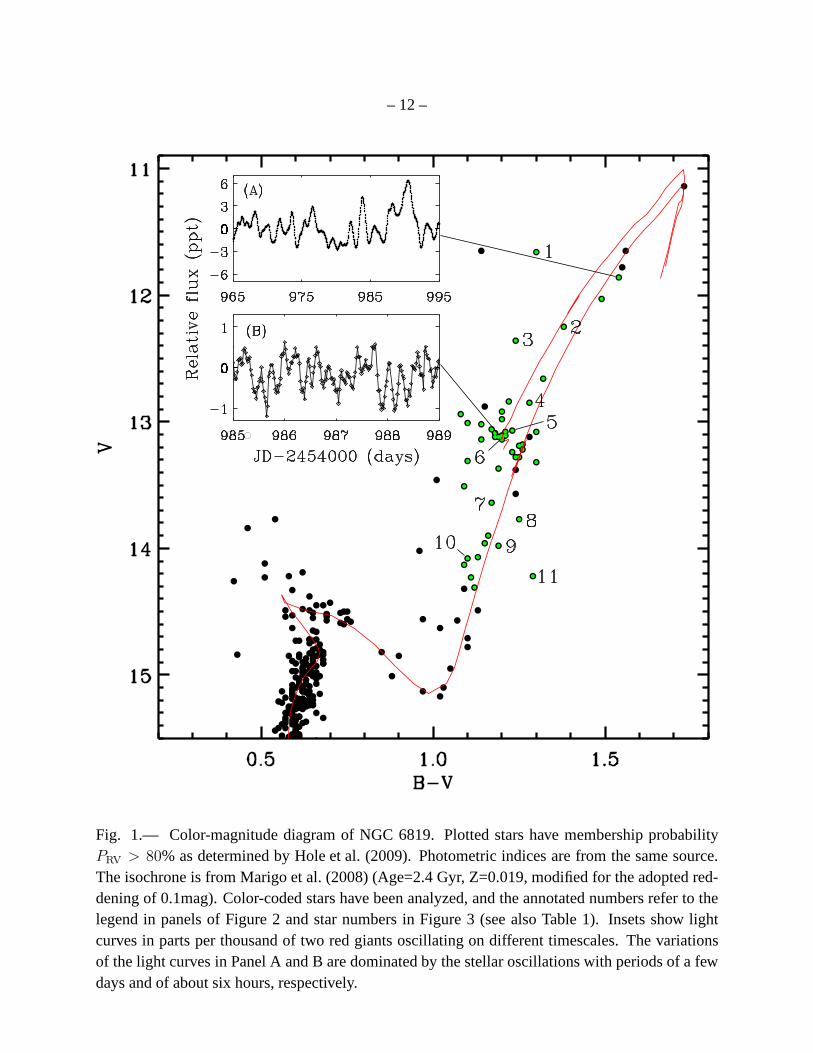
30 minutes) used in this investigation provided a total of 1639data points in the time series ofeach observed star. For this Letter we selected 47 stars in the field of the open cluster NGC 6819with membership probabilityPRV > 80% from radial velocity measurements (Hole et al. 2009).Figure 1 shows the color-magnitude diagram (CMD) of the cluster with the selected stars indicatedby green symbols. The eleven annotated stars form a representative subset, which we will use toillustrate our analyses in Sections 3 and 4. We selected the stars in this subset to cover the samebrightness range as our full sample, while giving high weight to stars that appear to be photometricnon-members (i.e., stars located far from the isochrone in the CMD). Data for each target werechecked carefully to ensure that the time-series photometry was not contaminated significantlyby other stars in the field, which could otherwise complicatethe interpretation of the oscillationsignal.
Fourteen data points affected by the momentum dumping of thespacecraft were removedfrom the time series of each star. In addition, we removed points that showed a point-to-pointdeviation greater than4σ, whereσ is the local rms of the point-to-point scatter within a 24 hourwindow. This process removed on average one data-point per time series. Finally, we removed alinear trend from each time series and then calculated the discrete Fourier transform. The Fourierspectra at high frequency have mean levels below 5 parts per million (ppm) in amplitude, allowingus to search for low-amplitude solar-like oscillations.

– 5 –
3. Extraction of asteroseismic parameters
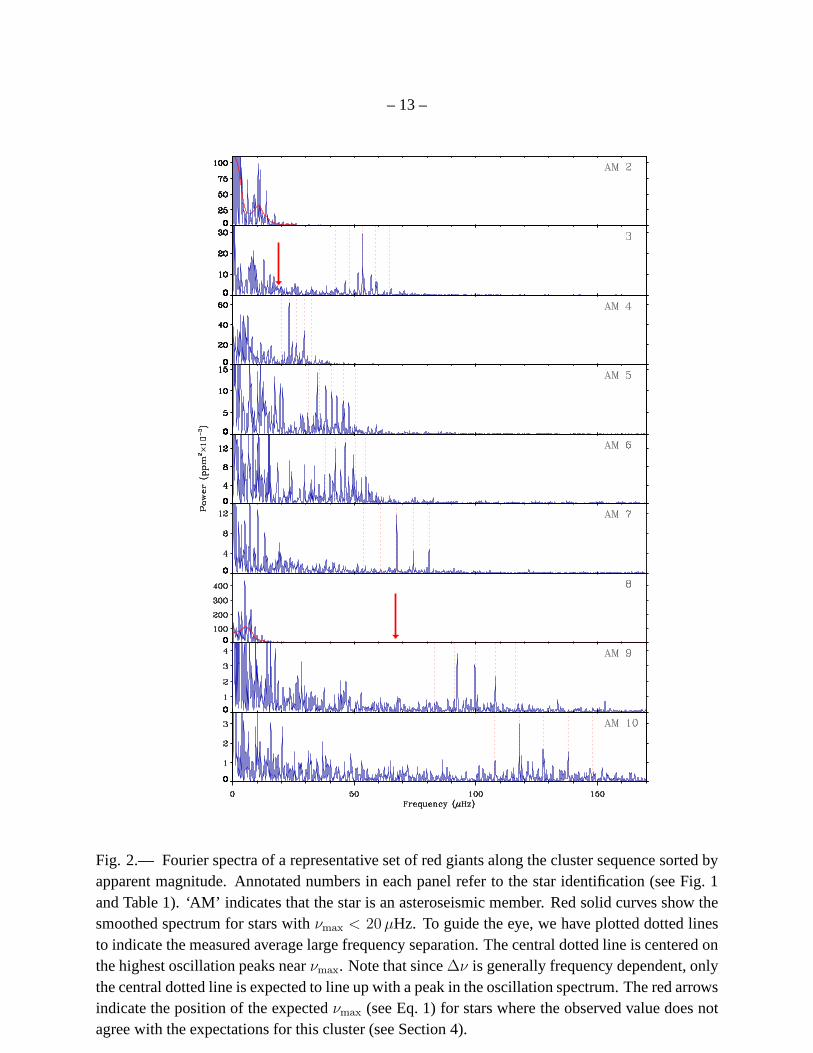
Figure 2 shows the Fourier spectra (in power) of 9 stars from our subset. These range fromthe lower red-giant branch to the tip of the branch (see Figure 1). The stars are sorted by apparentmagnitude, which for a cluster is indicative of luminosity,with brightest at the top. Note that thered giants in NGC 6819 are significantly fainter (12 . V . 14) than the sample ofKepler field redgiants (8 . V . 12) studied by Bedding et al. (2010). Nevertheless, it is clearfrom Figure 2 thatwe can detect oscillations for stars that span about two orders of magnitude in luminosity alongthe cluster sequence.
We used four different pipelines (Hekker et al. 2009a; Huberet al. 2009a; Mathur et al. 2009;Mosser & Appourchaux 2009) to extract the average frequencyseparation between modes of thesame degree (the so-called large frequency separation,∆ν). We have also obtained the frequencyof maximum oscillation power,νmax, and the oscillation amplitude. The measured values of∆ν
are indicated by vertical dotted lines in Figure 2 centered on the highest oscillation peaks nearνmax. While the stars in Figure 2, particularly in the lower panels, show the regular series ofpeaks expected for solar-like oscillations, the limited length of the time-series data does not allowsuch structure to be clearly resolved for the most luminous stars in our sample — those withνmax
. 20 µHz. We do, however, see humps of excess power in the Fourier spectra (see Figure 2 starno. 2 and 8) withνmax and amplitude in mutual agreement with oscillations. With longer timeseries we expect more firm results for these high-luminositygiants.
4. Cluster membership from asteroseismology
It is immediately clear from Figure 2 that not all stars follow the expected trend of increasingνmax with decreasing apparent magnitude, suggesting that some of the stars might be intrinsicallybrighter or fainter than expected. Since oscillations in a star only depend on the physical propertiesof the star, we can use asteroseismology to judge whether or not a star is likely to be a clustermember independently of its distance and of interstellar absorption and reddening. For cool stars,νmax scales with the acoustic cut-off frequency, and it is well established that we can estimateνmax
by scaling from the solar value (Brown et al. 1991; Kjeldsen &Bedding 1995):
νmax
νmax,⊙
=M/M⊙(Teff/Teff,⊙)3.5
L/L⊙
, (1)
whereνmax,⊙ = 3100 µHz. The accuracy of such estimates is good to within 5% (Stello et al.2009) assuming we have good estimates of the stellar parametersM , L, andTeff .
In the following we assume the idealistic scenario where allcluster members follow standardstellar evolution described by the isochrone. Stellar massalong the red giant branch of the cluster
– 6 –
isochrone varies by less than 1%. The variation is less than 5% even if we also consider theasymptotic giant branch. For simplicity, we therefore adopt a mass of1.55M⊙ for all stars, whichis representative for the isochrone from Marigo et al. (2008) (Figure 1) and a similar isochrone byVandenBerg et al. (2006). Neglecting binarity (see Table 1), we derive the luminosity of each starin our subset from itsV -band apparent magnitude, adopting reddening and distancemodulus ofE(B − V ) = 0.1 and(M −m)V = 12.3, respectively (obtained from simple isochrone fitting, seeHole et al. 2009). We used the calibration of Flower (1996) toconvert the stellar(B−V )0 color toTeff . Bolometric corrections were also taken from Flower (1996). The derived quantities were thenused to estimateνmax for each star (Eq. 1), and compared with the observed value (see Figure 3).
Figure 3 shows four obvious outliers (no. 1, 3, 8 and 11), three of which are also outliers inthe CMD (no. 1, 3, and 11). For the rest of the stars we see good agreement between the expectedand observed value, indicating that the uncertainty on theνmax estimates are relatively small. Sincethe variations in mass and effective temperature among the cluster giant stars are small, deviationsfrom the dotted line must be caused by an incorrect estimate of the luminosity. This implies that theluminosities of stars falling significantly above or below the line have been over- or underestimated,respectively. The simplest interpretation is that these outliers are fore- or background stars, andhence not members of the cluster. To explain the differencesbetween the observed and expectedvalue ofνmax would require the deviant stars to haveV errors of more than 1 magnitude, and insome casesB − V errors of about 0.2 magnitude if they were cluster members. Binarity mayexplain deviations above the dotted line, but only by up to a factor of two inL (and hence, in theratio of the observed to expectedνmax). The deviation of only one star (no.1) could potentiallybe explained this way. However, that would be in disagreement with its single-star classificationfrom multi-epoch radial velocity measurements, assuming it is not a binary viewed pole-on (seeTable 1). Hence, under the assumption of a standard stellar evolution, the most likely explanationfor all four outliers in Figure 3 is therefore that these stars are not cluster members. This conclusionis, however, in disagreement with their high membership probability from measurements of radialvelocity (Hole et al. 2009) and proper motion (Sanders 1972)(see Table 1). Another interestingpossibility is that the anomalous pulsation properties might be explained by more exotic stellarevolution scenarios than is generally anticipated for open-cluster stars.
5. Asteroseismic “color-magnitude diagrams”
It is clear from Figure 2 that the amplitudes of the oscillations increase with luminosity for theseismically determined cluster members. Based on calculations by Christensen-Dalsgaard & Frandsen(1983), Kjeldsen & Bedding (1995) have suggested that the photometric oscillation amplitude ofp modes scale as(L/M)s Teff
−2, with s = 1 (the velocity amplitudes, meanwhile, would scale as

– 7 –
(L/M)s). This was revised by Samadi et al. (2007) tos = 0.7 based on models of main sequencestars. Taking advantage of the fewer free parameters withinthis ensemble of stars, our observationsallow us to make some progress towards extrapolating this scaling to red giants and determiningthe value ofs.
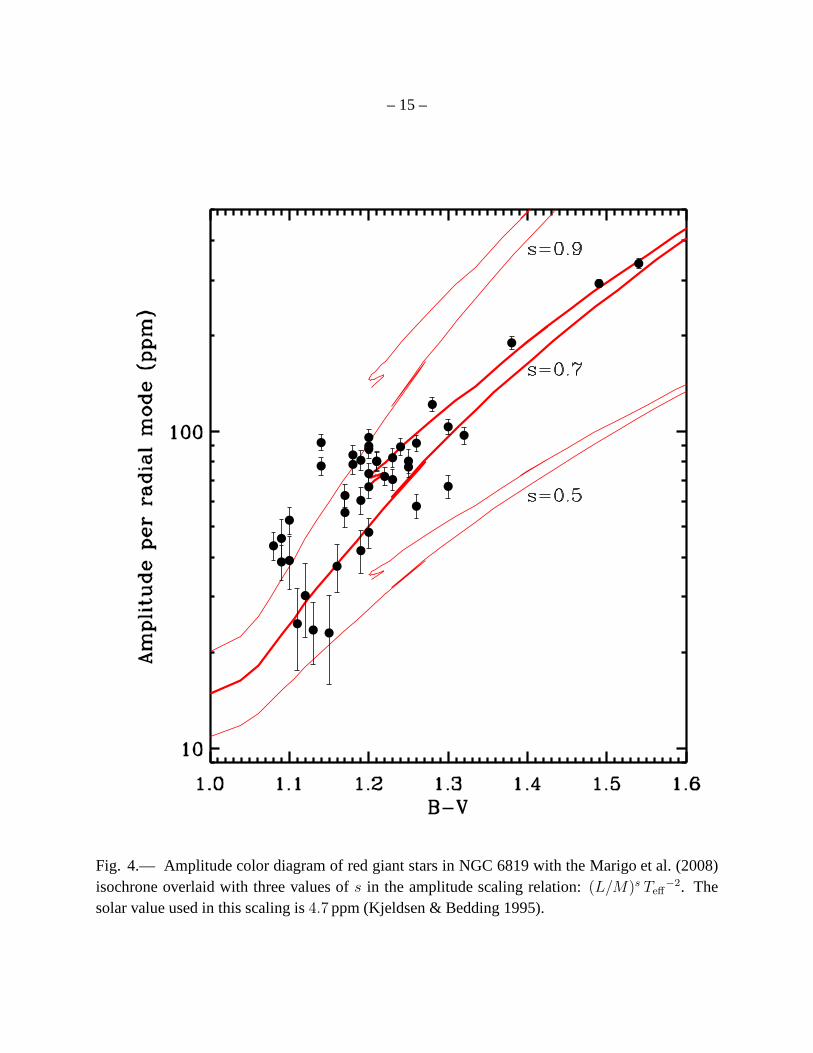
In Figure 4 we introduce a new type of diagram that is similar to a CMD, but with magnitudereplaced by an asteroseismic parameter – in this case, the measured oscillation amplitude. Ampli-tudes were estimated for all stars in our sample (except for the four outliers) using methods similarto that of Kjeldsen et al. (2008) (see also Michel et al. 2008), which assume that the relative powerbetween radial and non-radial modes is the same as in the Sun.This diagram confirms the relation-ship between amplitude and luminosity. Despite a large scatter, which is not surprising from thisrelatively short time series, we see thats = 0.7 provides a much better match thans = 1.0. Onceverified with more data, this relation will allow the use of the measured amplitude as an additionalasteroseismic diagnostic for testing cluster membership and for isochrone fitting in general. Wenote that the other clusters observed byKepler have different metallicities than NGC 6819, whichwill allow future investigation on the metallicity dependence of the oscillation amplitudes.
We expect to obtain less scatter in the asteroseismic measurements when longer time seriesbecome available. That will enable us to expand classical isochrone fitting techniques to includediagrams like this, where amplitude could also be replaced by νmax or ∆ν. In particular, we shouldbe able to determine the absolute radii aided by∆ν of the red giant branch stars, which would be animportant calibrator for theoretical isochrones. Additionally, the distributions of the asteroseismicparameters – such asνmax – can potentially be used to test stellar population synthesis models(Hekker et al. 2009b; Miglio et al. 2009b). Applying this approach to clusters could lead to furtherprogress in understanding of physical processes such as mass loss during the red-giant phase (seee.g., Miglio et al. 2009a). Note that a few clear outliers areindicative of non-membership or exoticstellar evolution, as a result of factors such as stellar collisions or heavy mass loss, while a generaldeviation from the theoretical predictions by a large groupof stars would suggest that the standardtheory may need revision.
Finally, we note that NGC 6819 and anotherKepler cluster, NGC 6791, contain detachedeclipsing binaries (Talamantes & Sandquist 2009; Street etal. 2005; de Marchi et al. 2007; Mochejska et al.2005). For these stars masses and radii can be determined independently (Grundahl et al. 2008),which will further strengthen results of asteroseismic analyses.

– 8 –
6. Discussion & Conclusions
Photometric data of red giants in NGC 6819 obtained by NASA’sKepler Mission have enabledus to make the first clear detection of solar-like oscillations in cluster stars. The general propertiesof the oscillations (∆ν, νmax, and amplitudes) agree well with results of field red giants made byKepler (Bedding et al. 2010) and CoRoT (de Ridder et al. 2009; Hekkeret al. 2009b). We find thatthe oscillation amplitudes of the observed stars scale as(L/M)0.7 Teff
−2, suggesting that previousattempts to detect oscillations in clusters from ground were at the limit of detection.
We find that the oscillation properties provide additional tests for cluster membership, al-lowing us to identify four stars that are either non-membersor exotic stars. All four stars havemembership probability higher than 80% from radial-velocity measurements, but three of themappear to be photometric non-members. We further point out that deviations from the theoreticalpredictions of the asteroseismic parameters among a large sample of cluster stars have the potentialof being used as additional constraints in the isochrone fitting process, which can lead to improvedstellar models.
Our results, based on limited data of about one month, highlight the unique potential of as-teroseismology on the brightest stars in the stellar clusters observed byKepler. With longer seriessampled at the spacecraft’s short cadence (≃ 1 minute), we expect to detect oscillations in thesubgiants and turn-off stars, as well as in the blue stragglers in this cluster.
Funding for this Discovery mission is provided by NASA’s Science Mission Directorate. Theauthors would like to thank the entireKepler team without whom this investigation would not havebeen possible. The authors also thank all funding councils and agencies that have supported theactivities of Working Group 2 of theKepler Asteroseismic Science Consortium (KASC).
Facilities:Kepler.
REFERENCES
Bedding, T. R., et al. 2010, ApJL, in press
Borucki, W., et al. 2009, in IAU Symposium, Vol. 253, IAU Symposium, 289
Brown, T. M., & Gilliland, R. L. 1994, ARA&A, 32, 37
Brown, T. M., Gilliland, R. L., Noyes, R. W., & Ramsey, L. W. 1991, ApJ, 368, 599
Christensen-Dalsgaard, J. 2002, Reviews of Modern Physics, 74, 1073
– 9 –
Christensen-Dalsgaard, J., & Frandsen, S. 1983, Sol. Phys., 82, 469
de Marchi, F., et al. 2007, A&A, 471, 515
de Ridder, J., et al. 2009, Nature, 459, 398
Edmonds, P. D., & Gilliland, R. L. 1996, ApJ, 464, L157
Flower, P. J. 1996, ApJ, 469, 355
Frandsen, S., et al. 2007, A&A, 475, 991
Gilliland, R. L., et al. 1993, AJ, 106, 2441
Gough, D. O., & Novotny, E. 1993, in ASP Conf. Ser. 42: GONG 1992. Seismic Investigation ofthe Sun and Stars, ed. T. M. Brown, 355
Grundahl, F., Clausen, J. V., Hardis, S., & Frandsen, S. 2008, A&A, 492, 171
Hekker, S., et al. 2009a, MNRAS, in press (astro-ph/0911.2612)
—. 2009b, A&A, 506, 465
Hole, K. T., Geller, A. M., Mathieu, R. D., Platais, I., Meibom, S., & Latham, D. W. 2009, AJ,138, 159
Huber, D., Stello, D., Bedding, T. R., Chaplin, W. J., Arentoft, T., Quirion, P., & Kjeldsen, H.2009a, Commun. Asteroseismol., 160, 74
Kjeldsen, H., & Bedding, T. R. 1995, A&A, 293, 87
Kjeldsen, H., et al. 2008, ApJ, 682, 1370
Latham, D. W., Brown, T. M., Monet, D. G., Everett, M., Esquerdo, G. A., & Hergenrother, C. W.2005, in Bulletin of the American Astronomical Society, Vol. 37, 1340
Marigo, P., Girardi, L., Bressan, A., Groenewegen, M. A. T.,Silva, L., & Granato, G. L. 2008,A&A, 482, 883
Mathur, S., et al. 2009, A&A, in press (arXiv:0912.3367)
Michel, E., et al. 2008, Science, 322, 558
Miglio, A., Montalban, J., Eggenberger, P., Hekker, S., & Noels, A. 2009a, in American Instituteof Physics Conference Series, Vol. 1170, American Institute of Physics Conference Series,ed. J. A. Guzik & P. A. Bradley, 132
– 10 –
Miglio, A., et al. 2009b, A&A, 503, L21
Mochejska, B. J., et al. 2005, AJ, 129, 2856
Mosser, B., & Appourchaux, T. 2009, A&A, 508, 877
Samadi, R., Georgobiani, D., Trampedach, R., Goupil, M. J.,Stein, R. F., & Nordlund,A. 2007,A&A, 463, 297
Sanders, W. L. 1972, A&A, 19, 155
Stello, D., Chaplin, W. J., Basu, S., Elsworth, Y., & Bedding, T. R. 2009, MNRAS, 400, 80
Stello, D., & Gilliland, R. L. 2009, ApJ, 700, 949
Stello, D., et al. 2007, MNRAS, 377, 584
Street, R. A., et al. 2005, MNRAS, 358, 795
Talamantes, A., & Sandquist, E. L. 2009, in Bulletin of the American Astronomical Society,Vol. 41,320
VandenBerg, D. A., Bergbusch, P. A., & Dowler, P. D. 2006, ApJS, 162, 375
This preprint was prepared with the AAS LATEX macros v5.2.
– 11 –
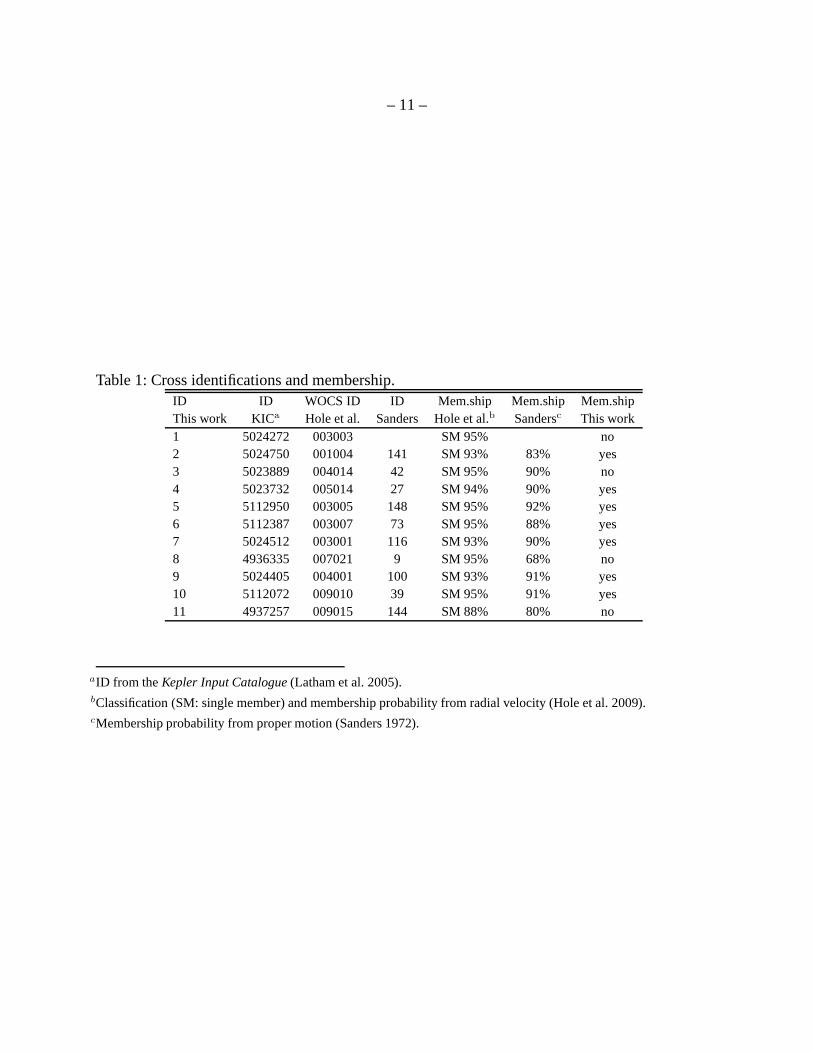
Table 1: Cross identifications and membership.ID ID WOCS ID ID Mem.ship Mem.ship Mem.shipThis work KICa Hole et al. Sanders Hole et al.b Sandersc This work1 5024272 003003 SM 95% no2 5024750 001004 141 SM 93% 83% yes3 5023889 004014 42 SM 95% 90% no4 5023732 005014 27 SM 94% 90% yes5 5112950 003005 148 SM 95% 92% yes6 5112387 003007 73 SM 95% 88% yes7 5024512 003001 116 SM 93% 90% yes8 4936335 007021 9 SM 95% 68% no9 5024405 004001 100 SM 93% 91% yes10 5112072 009010 39 SM 95% 91% yes11 4937257 009015 144 SM 88% 80% no
aID from theKepler Input Catalogue (Latham et al. 2005).bClassification (SM: single member) and membership probability from radial velocity (Hole et al. 2009).cMembership probability from proper motion (Sanders 1972).
– 12 –
Fig. 1.— Color-magnitude diagram of NGC 6819. Plotted starshave membership probabilityPRV > 80% as determined by Hole et al. (2009). Photometric indices are from the same source.The isochrone is from Marigo et al. (2008) (Age=2.4 Gyr, Z=0.019, modified for the adopted red-dening of 0.1mag). Color-coded stars have been analyzed, and the annotated numbers refer to thelegend in panels of Figure 2 and star numbers in Figure 3 (see also Table 1). Insets show lightcurves in parts per thousand of two red giants oscillating ondifferent timescales. The variationsof the light curves in Panel A and B are dominated by the stellar oscillations with periods of a fewdays and of about six hours, respectively.
– 13 –
Fig. 2.— Fourier spectra of a representative set of red giants along the cluster sequence sorted byapparent magnitude. Annotated numbers in each panel refer to the star identification (see Fig. 1and Table 1). ‘AM’ indicates that the star is an asteroseismic member. Red solid curves show thesmoothed spectrum for stars withνmax < 20 µHz. To guide the eye, we have plotted dotted linesto indicate the measured average large frequency separation. The central dotted line is centered onthe highest oscillation peaks nearνmax. Note that since∆ν is generally frequency dependent, onlythe central dotted line is expected to line up with a peak in the oscillation spectrum. The red arrowsindicate the position of the expectedνmax (see Eq. 1) for stars where the observed value does notagree with the expectations for this cluster (see Section 4).

– 14 –
Fig. 3.— Ratio of observed and expectedνmax. 1-σ errorbars indicate the uncertainty onνmax(obs).Stars clearly above or below the dotted line are either not cluster members or members whoseevolution have not followed the standard scenario.
– 15 –
Fig. 4.— Amplitude color diagram of red giant stars in NGC 6819 with the Marigo et al. (2008)isochrone overlaid with three values ofs in the amplitude scaling relation:(L/M)s Teff
−2. Thesolar value used in this scaling is4.7 ppm (Kjeldsen & Bedding 1995).
Copyright © 2022 FDOKUMEN