![Optical and Infrared Photometry of the Nearby Type I[CLC]a[/CLC] Supernova 2001[CLC]el[/CLC](https://static.fdokumen.com/doc/165x107/631f65313fc948596809c568/optical-and-infrared-photometry-of-the-nearby-type-iclcaclc-supernova-2001clcelclc.jpg)
Optical and Infrared Photometry of the Nearby Type I[CLC]a[/CLC] Supernova 2001[CLC]el[/CLC
arX
iv:0
807.
2970
v1 [
astr
o-ph
] 1
8 Ju
l 200
8Astronomy & Astrophysics manuscript no. sirait c© ESO 2013November 27, 2013
First time-series optical photometry from Antarctica
sIRAIT monitoring of the RS CVn binary V841 Centauri and the δ-Scuti starV1034 Centauri
K. G. Strassmeier1, R. Briguglio2,3, T. Granzer1, G. Tosti2, I. DiVarano1, I. Savanov1, M. Bagaglia2 ,S. Castellini2, A. Mancini2, G. Nucciarelli2, O. Straniero4, E. Distefano5, S. Messina5 and G. Cutispoto5
1 Astrophysical Institute Potsdam (AIP), An der Sternwarte 16, D-14482 Potsdam, Germany;e-mail: [email protected], e-mail: [email protected], e-mail: [email protected], e-mail: [email protected]
2 Dipartimento di Fisica, Universita di Perugia, Via A. Pascoli, I-06100 Perugia, Italy;e-mail: [email protected], e-mail: [email protected]
3 Concordia, Dome C, Antarctica; http://www.concordiabase.eu4 INAF Osservatorio Teramo, Via Mentore Maggini, I-64100 Teramo, Italy5 INAF - Catania Astrophysical Observatory, via S. Sofia 78, I-95123 Catania, Italy;
e-mail: [email protected], e-mail: [email protected], e-mail: [email protected]
Received ... ; accepted ...
ABSTRACT
Context. Beating the Earth’s day-night cycle is mandatory for long and continuous time-series photometry and had beenachieved with either large ground-based networks of observatories at different geographic longitudes or when conductedfrom space. A third possibility is offered by a polar location with astronomically-qualified site characteristics.Aims. In this paper, we present the first scientific stellar time-series optical photometry from Dome C in Antarcticaand analyze approximately 13,000 CCD frames taken in July 2007.Methods. The optical pilot telescope of the “International Robotic Antarctic Infrared Telescope”, named “small IRAIT”(sIRAIT), and its UBV RI CCD photometer were used in BV R for a continuous 243 hours (10.15 days) with a dutycycle of 98% and a cadence of 155 sec. The prime targets were the chromospherically active, spotted binary starV841 Cen and the non-radially pulsating δ-Scuti star V1034 Cen.Results. We confirm the known 0.2-day fundamental period of V1034 Cen and found a total of 23 further periodsbetween 2.2 hours and 3.5 days. V841 Cen’s V amplitude due to spots appeared to be at a record high of 0.
m4 in V inJuly 2007. We present a spot-model analysis with a light-curve inversion technique and found the star with a spot fillingfactor of 44% of the visible hemisphere, among the highest ever measured values for active stars, and a temperaturedifference photosphere minus spot of 750±100 K. Its odd-numbered (for a single site) rotation period was determinedwith a higher precision than before (5.8854±0.0026 days) despite the comparably short data set. The rms scatter froma 2.4-hour data subset was 3 mmag in V and 4.2 mmag in R. The differential data quality is 3–4 times better thanwith the 25cm Fairborn Automatic Photoelectric Telescope in southern Arizona and is likely due to the exceptionallylow scintillation noise at Dome C.Conclusions. We conclude that high-precision CCD photometry with exceptional time coverage and cadence can beobtained at Dome C in Antarctica and be successfully used for time-series astrophysics.
Key words. stars: spots – stars: variables: general – stars: activity – stars: oscillations – stars: individual: V841 Cen –stars: individual: V1034 Cen
1. Introduction
Time-series photometry is a powerful tool to understandcosmic variabilities and their many underlying physicalmechanisms, from Gamma Ray Bursts to the non-radialoscillations of our Sun. World-wide networks around theglobe were organized to bypass the Earth’s day-night cycle,e.g. by the “Global Oscillation Network Group” (Harveyet al. 1996), the “Whole Earth Telescope” (Nather et al.1990) or the “Multi Site Continuous Spectroscopy” cam-paigns (Catala et al. 1993), just to name a few. Despitetheir tremendous success such networks must cope with themany different site characteristics, the individual weatherpatterns and, most importantly, with the different instru-
Send offprint requests to: K. G. Strassmeier
ment/detector combinations and the respective calibrationissues. An alternative to such networks is a single polar site.
The French-Italian Antarctic station Concordia atDome C at a height of 3200m on the east Antarctic plateauis currently, besides the U.S. South Pole station, the onlyplateau station populated over winter (=night). In princi-ple, it thus enables astronomical observations comparableto regular observatories at temperate sites. Dome C hadreceived world-wide attention from the night-time astro-nomical community when it became known that the seeingconditions on the east Antarctic plateau are likely the beston the entire planet with a median seeing of 0.3′′ and occa-sionally even below 0.1′′ at a height of approximately 30mabove ground (Lawrence et al. 2004, Agabi et al. 2006).
2 K. G. Strassmeier et al.: Time-series optical photometry from Antarctica
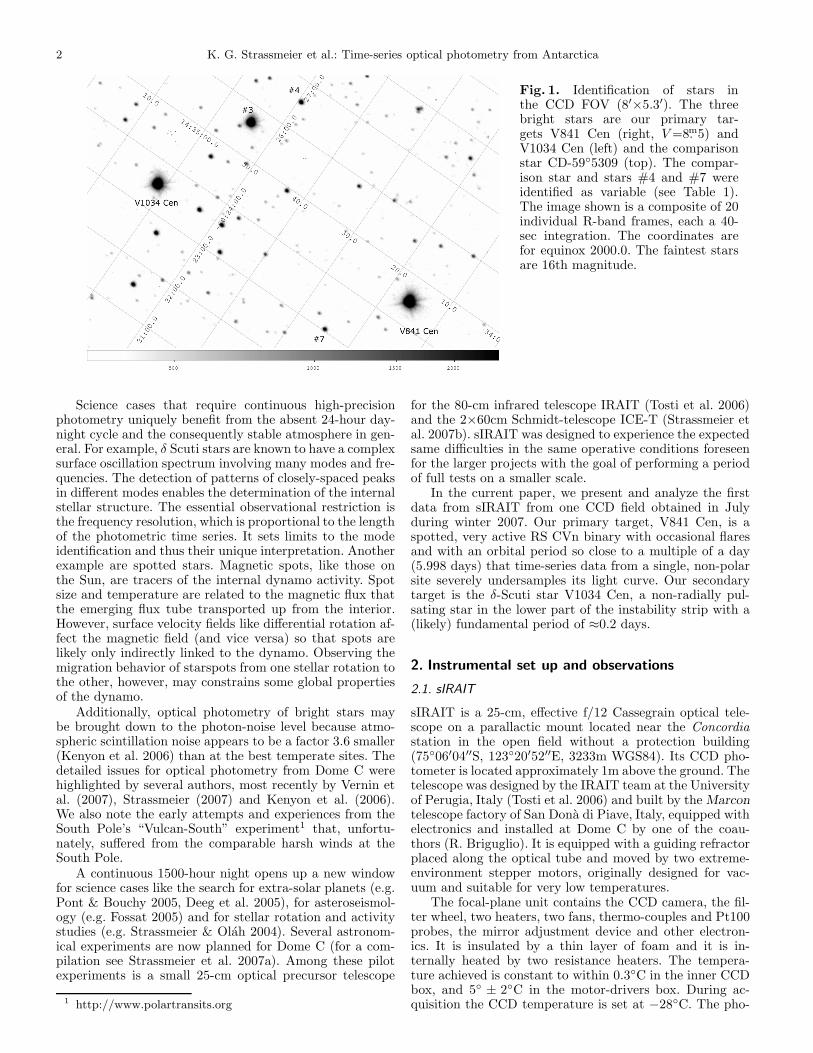
Fig. 1. Identification of stars inthe CCD FOV (8′×5.3′). The threebright stars are our primary tar-gets V841 Cen (right, V =8.m5) andV1034 Cen (left) and the comparisonstar CD-59◦5309 (top). The compar-ison star and stars #4 and #7 wereidentified as variable (see Table 1).The image shown is a composite of 20individual R-band frames, each a 40-sec integration. The coordinates arefor equinox 2000.0. The faintest starsare 16th magnitude.
Science cases that require continuous high-precisionphotometry uniquely benefit from the absent 24-hour day-night cycle and the consequently stable atmosphere in gen-eral. For example, δ Scuti stars are known to have a complexsurface oscillation spectrum involving many modes and fre-quencies. The detection of patterns of closely-spaced peaksin different modes enables the determination of the internalstellar structure. The essential observational restriction isthe frequency resolution, which is proportional to the lengthof the photometric time series. It sets limits to the modeidentification and thus their unique interpretation. Anotherexample are spotted stars. Magnetic spots, like those onthe Sun, are tracers of the internal dynamo activity. Spotsize and temperature are related to the magnetic flux thatthe emerging flux tube transported up from the interior.However, surface velocity fields like differential rotation af-fect the magnetic field (and vice versa) so that spots arelikely only indirectly linked to the dynamo. Observing themigration behavior of starspots from one stellar rotation tothe other, however, may constrains some global propertiesof the dynamo.
Additionally, optical photometry of bright stars maybe brought down to the photon-noise level because atmo-spheric scintillation noise appears to be a factor 3.6 smaller(Kenyon et al. 2006) than at the best temperate sites. Thedetailed issues for optical photometry from Dome C werehighlighted by several authors, most recently by Vernin etal. (2007), Strassmeier (2007) and Kenyon et al. (2006).We also note the early attempts and experiences from theSouth Pole’s “Vulcan-South” experiment1 that, unfortu-nately, suffered from the comparable harsh winds at theSouth Pole.
A continuous 1500-hour night opens up a new windowfor science cases like the search for extra-solar planets (e.g.Pont & Bouchy 2005, Deeg et al. 2005), for asteroseismol-ogy (e.g. Fossat 2005) and for stellar rotation and activitystudies (e.g. Strassmeier & Olah 2004). Several astronom-ical experiments are now planned for Dome C (for a com-pilation see Strassmeier et al. 2007a). Among these pilotexperiments is a small 25-cm optical precursor telescope
1 http://www.polartransits.org
for the 80-cm infrared telescope IRAIT (Tosti et al. 2006)and the 2×60cm Schmidt-telescope ICE-T (Strassmeier etal. 2007b). sIRAIT was designed to experience the expectedsame difficulties in the same operative conditions foreseenfor the larger projects with the goal of performing a periodof full tests on a smaller scale.
In the current paper, we present and analyze the firstdata from sIRAIT from one CCD field obtained in Julyduring winter 2007. Our primary target, V841 Cen, is aspotted, very active RS CVn binary with occasional flaresand with an orbital period so close to a multiple of a day(5.998 days) that time-series data from a single, non-polarsite severely undersamples its light curve. Our secondarytarget is the δ-Scuti star V1034 Cen, a non-radially pul-sating star in the lower part of the instability strip with a(likely) fundamental period of ≈0.2 days.
2. Instrumental set up and observations
2.1. sIRAIT
sIRAIT is a 25-cm, effective f/12 Cassegrain optical tele-scope on a parallactic mount located near the Concordiastation in the open field without a protection building(75◦06′04′′S, 123◦20′52′′E, 3233m WGS84). Its CCD pho-tometer is located approximately 1m above the ground. Thetelescope was designed by the IRAIT team at the Universityof Perugia, Italy (Tosti et al. 2006) and built by the Marcontelescope factory of San Dona di Piave, Italy, equipped withelectronics and installed at Dome C by one of the coau-thors (R. Briguglio). It is equipped with a guiding refractorplaced along the optical tube and moved by two extreme-environment stepper motors, originally designed for vac-uum and suitable for very low temperatures.
The focal-plane unit contains the CCD camera, the fil-ter wheel, two heaters, two fans, thermo-couples and Pt100probes, the mirror adjustment device and other electron-ics. It is insulated by a thin layer of foam and it is in-ternally heated by two resistance heaters. The tempera-ture achieved is constant to within 0.3◦C in the inner CCDbox, and 5◦ ± 2◦C in the motor-drivers box. During ac-quisition the CCD temperature is set at −28◦C. The pho-
K. G. Strassmeier et al.: Time-series optical photometry from Antarctica 3
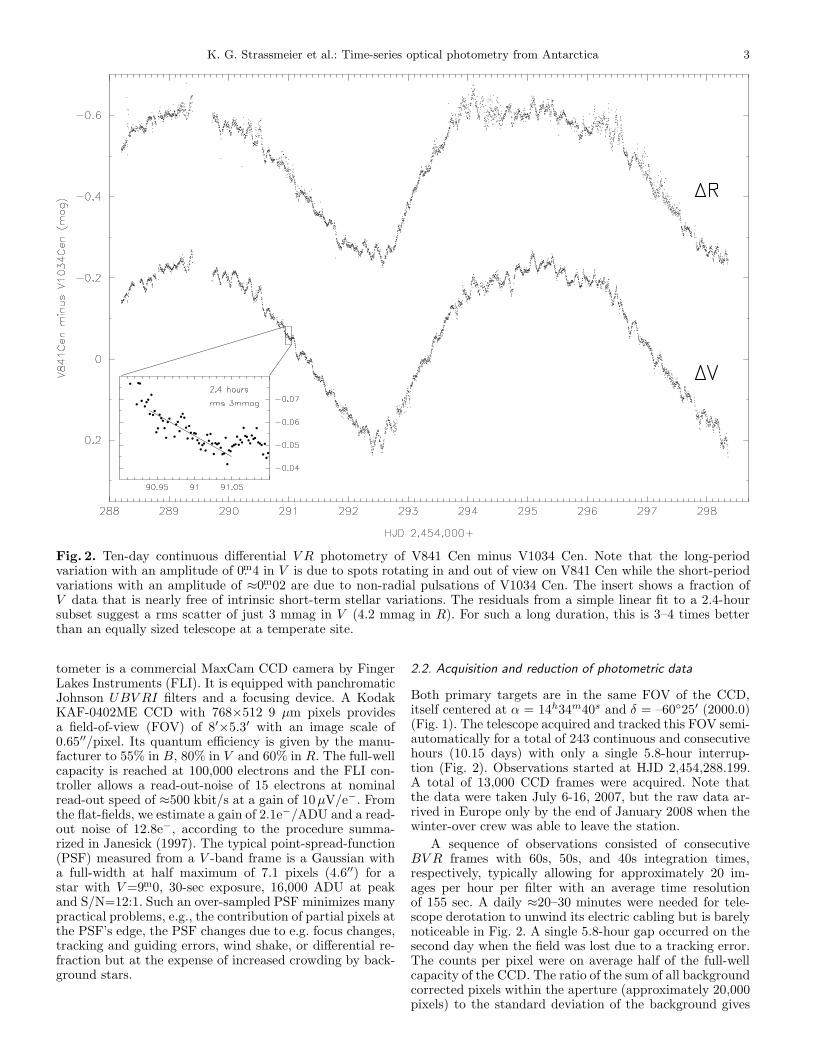
Fig. 2. Ten-day continuous differential V R photometry of V841 Cen minus V1034 Cen. Note that the long-periodvariation with an amplitude of 0.m4 in V is due to spots rotating in and out of view on V841 Cen while the short-periodvariations with an amplitude of ≈0.m02 are due to non-radial pulsations of V1034 Cen. The insert shows a fraction ofV data that is nearly free of intrinsic short-term stellar variations. The residuals from a simple linear fit to a 2.4-hoursubset suggest a rms scatter of just 3 mmag in V (4.2 mmag in R). For such a long duration, this is 3–4 times betterthan an equally sized telescope at a temperate site.
tometer is a commercial MaxCam CCD camera by FingerLakes Instruments (FLI). It is equipped with panchromaticJohnson UBV RI filters and a focusing device. A KodakKAF-0402ME CCD with 768×512 9 µm pixels providesa field-of-view (FOV) of 8′×5.3′ with an image scale of0.65′′/pixel. Its quantum efficiency is given by the manu-facturer to 55% in B, 80% in V and 60% in R. The full-wellcapacity is reached at 100,000 electrons and the FLI con-troller allows a read-out-noise of 15 electrons at nominalread-out speed of ≈500 kbit/s at a gain of 10µV/e−. Fromthe flat-fields, we estimate a gain of 2.1e−/ADU and a read-out noise of 12.8e−, according to the procedure summa-rized in Janesick (1997). The typical point-spread-function(PSF) measured from a V -band frame is a Gaussian witha full-width at half maximum of 7.1 pixels (4.6′′) for astar with V =9.m0, 30-sec exposure, 16,000 ADU at peakand S/N=12:1. Such an over-sampled PSF minimizes manypractical problems, e.g., the contribution of partial pixels atthe PSF’s edge, the PSF changes due to e.g. focus changes,tracking and guiding errors, wind shake, or differential re-fraction but at the expense of increased crowding by back-ground stars.
2.2. Acquisition and reduction of photometric data
Both primary targets are in the same FOV of the CCD,itself centered at α = 14h34m40s and δ = –60◦25′ (2000.0)(Fig. 1). The telescope acquired and tracked this FOV semi-automatically for a total of 243 continuous and consecutivehours (10.15 days) with only a single 5.8-hour interrup-tion (Fig. 2). Observations started at HJD 2,454,288.199.A total of 13,000 CCD frames were acquired. Note thatthe data were taken July 6-16, 2007, but the raw data ar-rived in Europe only by the end of January 2008 when thewinter-over crew was able to leave the station.
A sequence of observations consisted of consecutiveBV R frames with 60s, 50s, and 40s integration times,respectively, typically allowing for approximately 20 im-ages per hour per filter with an average time resolutionof 155 sec. A daily ≈20–30 minutes were needed for tele-scope derotation to unwind its electric cabling but is barelynoticeable in Fig. 2. A single 5.8-hour gap occurred on thesecond day when the field was lost due to a tracking error.The counts per pixel were on average half of the full-wellcapacity of the CCD. The ratio of the sum of all backgroundcorrected pixels within the aperture (approximately 20,000pixels) to the standard deviation of the background gives
4 K. G. Strassmeier et al.: Time-series optical photometry from Antarctica
Table 1. Log of three other variable stars in the CCD FOV.
ID NOMAD α (in deg) V R Notesδ (in deg) σV σR
3 0295-0641140 218.72680 9.57 9.13 P=3.0d,1.5d-60.4277 0.028 0.028
4 0295-0640999 218.70627 12.82 12.89 no clear P-60.4432 0.051 0.16
7 0296-0615795 218.60366 13.14 13.17 no clear P-60.3841 0.24 0.25
Note: ID is the internal identification according to Fig. 1. ID=3is the original comparison star CD-59◦5309. NOMAD is theNOMAD catalog number (Zacharias et al. 2005). α and δ arefor equinox 2000.0. V and R are their average magnitudes in theJohnson system, and σV and σR the standard deviations fromthe mean in the V and R bandpasses in magnitudes.
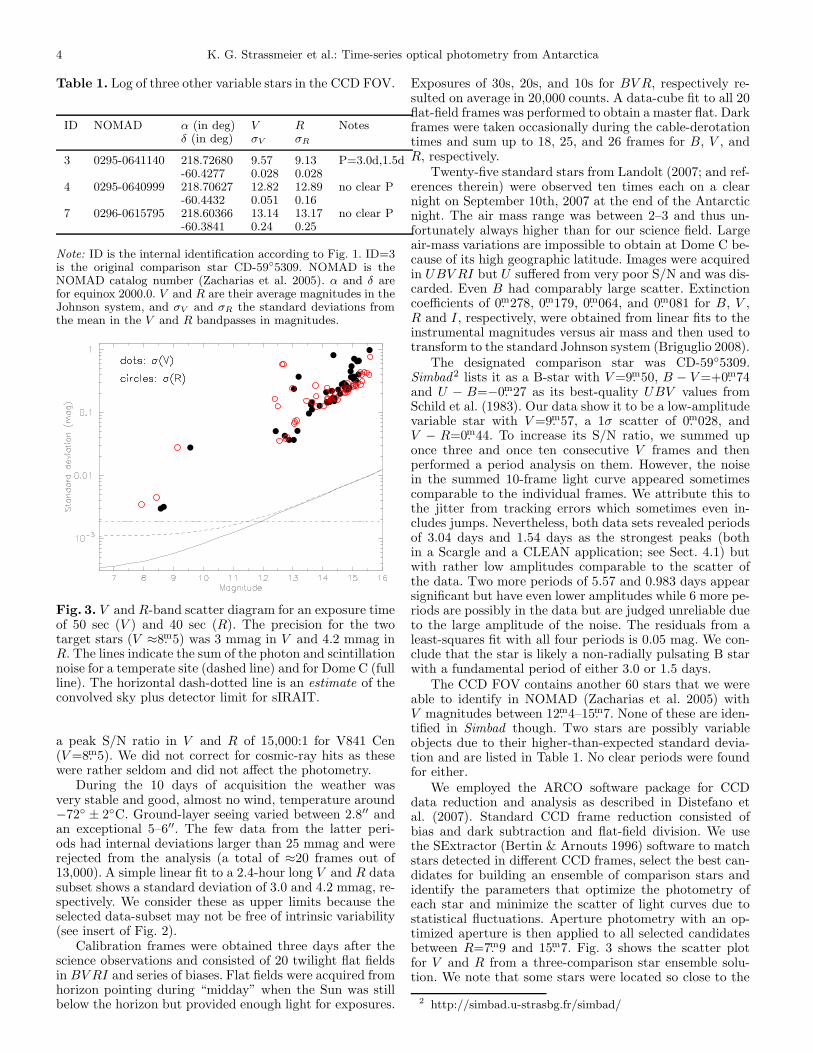
Fig. 3. V and R-band scatter diagram for an exposure timeof 50 sec (V ) and 40 sec (R). The precision for the twotarget stars (V ≈8.m5) was 3 mmag in V and 4.2 mmag inR. The lines indicate the sum of the photon and scintillationnoise for a temperate site (dashed line) and for Dome C (fullline). The horizontal dash-dotted line is an estimate of theconvolved sky plus detector limit for sIRAIT.
a peak S/N ratio in V and R of 15,000:1 for V841 Cen(V =8.m5). We did not correct for cosmic-ray hits as thesewere rather seldom and did not affect the photometry.
During the 10 days of acquisition the weather wasvery stable and good, almost no wind, temperature around−72◦ ± 2◦C. Ground-layer seeing varied between 2.8′′ andan exceptional 5–6′′. The few data from the latter peri-ods had internal deviations larger than 25 mmag and wererejected from the analysis (a total of ≈20 frames out of13,000). A simple linear fit to a 2.4-hour long V and R datasubset shows a standard deviation of 3.0 and 4.2 mmag, re-spectively. We consider these as upper limits because theselected data-subset may not be free of intrinsic variability(see insert of Fig. 2).
Calibration frames were obtained three days after thescience observations and consisted of 20 twilight flat fieldsin BV RI and series of biases. Flat fields were acquired fromhorizon pointing during “midday” when the Sun was stillbelow the horizon but provided enough light for exposures.
Exposures of 30s, 20s, and 10s for BV R, respectively re-sulted on average in 20,000 counts. A data-cube fit to all 20flat-field frames was performed to obtain a master flat. Darkframes were taken occasionally during the cable-derotationtimes and sum up to 18, 25, and 26 frames for B, V , andR, respectively.
Twenty-five standard stars from Landolt (2007; and ref-erences therein) were observed ten times each on a clearnight on September 10th, 2007 at the end of the Antarcticnight. The air mass range was between 2–3 and thus un-fortunately always higher than for our science field. Largeair-mass variations are impossible to obtain at Dome C be-cause of its high geographic latitude. Images were acquiredin UBV RI but U suffered from very poor S/N and was dis-carded. Even B had comparably large scatter. Extinctioncoefficients of 0.m278, 0.m179, 0.m064, and 0.m081 for B, V ,R and I, respectively, were obtained from linear fits to theinstrumental magnitudes versus air mass and then used totransform to the standard Johnson system (Briguglio 2008).
The designated comparison star was CD-59◦5309.Simbad2 lists it as a B-star with V =9.m50, B − V =+0.m74and U − B=−0.m27 as its best-quality UBV values fromSchild et al. (1983). Our data show it to be a low-amplitudevariable star with V =9.m57, a 1σ scatter of 0.m028, andV − R=0.m44. To increase its S/N ratio, we summed uponce three and once ten consecutive V frames and thenperformed a period analysis on them. However, the noisein the summed 10-frame light curve appeared sometimescomparable to the individual frames. We attribute this tothe jitter from tracking errors which sometimes even in-cludes jumps. Nevertheless, both data sets revealed periodsof 3.04 days and 1.54 days as the strongest peaks (bothin a Scargle and a CLEAN application; see Sect. 4.1) butwith rather low amplitudes comparable to the scatter ofthe data. Two more periods of 5.57 and 0.983 days appearsignificant but have even lower amplitudes while 6 more pe-riods are possibly in the data but are judged unreliable dueto the large amplitude of the noise. The residuals from aleast-squares fit with all four periods is 0.05 mag. We con-clude that the star is likely a non-radially pulsating B starwith a fundamental period of either 3.0 or 1.5 days.
The CCD FOV contains another 60 stars that we wereable to identify in NOMAD (Zacharias et al. 2005) withV magnitudes between 12.m4–15.m7. None of these are iden-tified in Simbad though. Two stars are possibly variableobjects due to their higher-than-expected standard devia-tion and are listed in Table 1. No clear periods were foundfor either.
We employed the ARCO software package for CCDdata reduction and analysis as described in Distefano etal. (2007). Standard CCD frame reduction consisted ofbias and dark subtraction and flat-field division. We usethe SExtractor (Bertin & Arnouts 1996) software to matchstars detected in different CCD frames, select the best can-didates for building an ensemble of comparison stars andidentify the parameters that optimize the photometry ofeach star and minimize the scatter of light curves due tostatistical fluctuations. Aperture photometry with an op-timized aperture is then applied to all selected candidatesbetween R=7.m9 and 15.m7. Fig. 3 shows the scatter plotfor V and R from a three-comparison star ensemble solu-tion. We note that some stars were located so close to the
2 http://simbad.u-strasbg.fr/simbad/
K. G. Strassmeier et al.: Time-series optical photometry from Antarctica 5
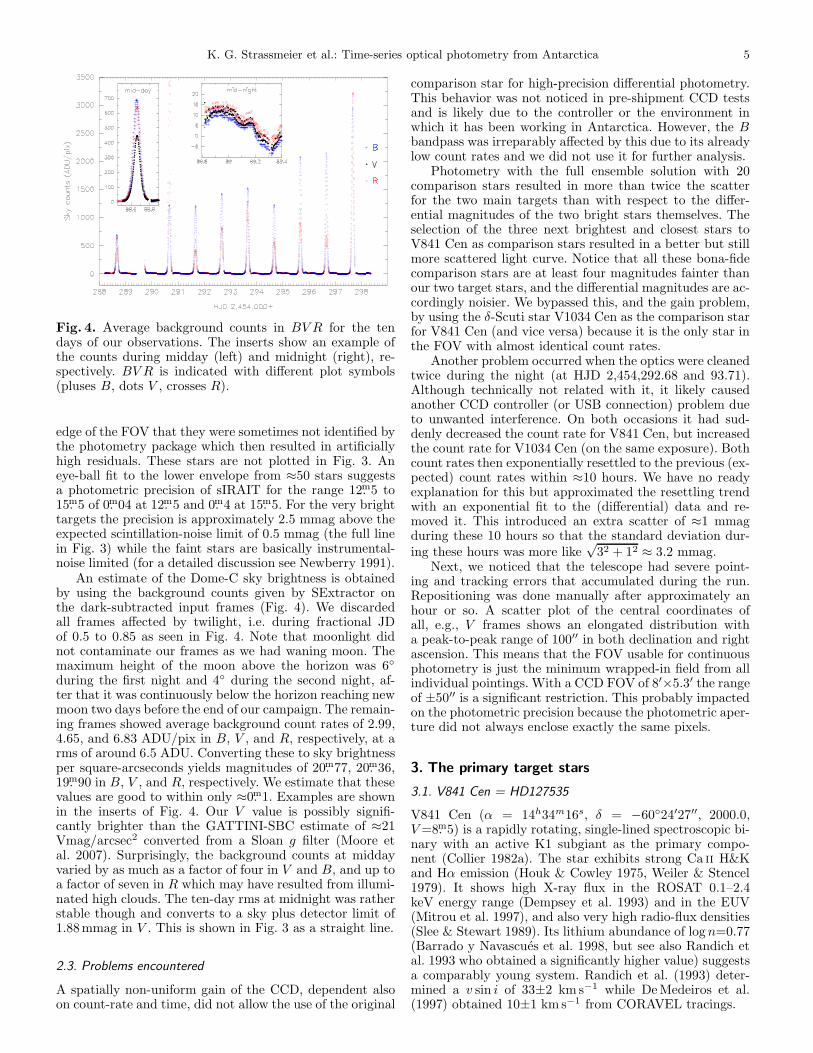
Fig. 4. Average background counts in BV R for the tendays of our observations. The inserts show an example ofthe counts during midday (left) and midnight (right), re-spectively. BV R is indicated with different plot symbols(pluses B, dots V , crosses R).
edge of the FOV that they were sometimes not identified bythe photometry package which then resulted in artificiallyhigh residuals. These stars are not plotted in Fig. 3. Aneye-ball fit to the lower envelope from ≈50 stars suggestsa photometric precision of sIRAIT for the range 12.m5 to15.m5 of 0.m04 at 12.m5 and 0.m4 at 15.m5. For the very brighttargets the precision is approximately 2.5 mmag above theexpected scintillation-noise limit of 0.5 mmag (the full linein Fig. 3) while the faint stars are basically instrumental-noise limited (for a detailed discussion see Newberry 1991).
An estimate of the Dome-C sky brightness is obtainedby using the background counts given by SExtractor onthe dark-subtracted input frames (Fig. 4). We discardedall frames affected by twilight, i.e. during fractional JDof 0.5 to 0.85 as seen in Fig. 4. Note that moonlight didnot contaminate our frames as we had waning moon. Themaximum height of the moon above the horizon was 6◦
during the first night and 4◦ during the second night, af-ter that it was continuously below the horizon reaching newmoon two days before the end of our campaign. The remain-ing frames showed average background count rates of 2.99,4.65, and 6.83 ADU/pix in B, V , and R, respectively, at arms of around 6.5 ADU. Converting these to sky brightnessper square-arcseconds yields magnitudes of 20.m77, 20.m36,19.m90 in B, V , and R, respectively. We estimate that thesevalues are good to within only ≈0.m1. Examples are shownin the inserts of Fig. 4. Our V value is possibly signifi-cantly brighter than the GATTINI-SBC estimate of ≈21Vmag/arcsec2 converted from a Sloan g filter (Moore etal. 2007). Surprisingly, the background counts at middayvaried by as much as a factor of four in V and B, and up toa factor of seven in R which may have resulted from illumi-nated high clouds. The ten-day rms at midnight was ratherstable though and converts to a sky plus detector limit of1.88mmag in V . This is shown in Fig. 3 as a straight line.
2.3. Problems encountered
A spatially non-uniform gain of the CCD, dependent alsoon count-rate and time, did not allow the use of the original
comparison star for high-precision differential photometry.This behavior was not noticed in pre-shipment CCD testsand is likely due to the controller or the environment inwhich it has been working in Antarctica. However, the Bbandpass was irreparably affected by this due to its alreadylow count rates and we did not use it for further analysis.
Photometry with the full ensemble solution with 20comparison stars resulted in more than twice the scatterfor the two main targets than with respect to the differ-ential magnitudes of the two bright stars themselves. Theselection of the three next brightest and closest stars toV841 Cen as comparison stars resulted in a better but stillmore scattered light curve. Notice that all these bona-fidecomparison stars are at least four magnitudes fainter thanour two target stars, and the differential magnitudes are ac-cordingly noisier. We bypassed this, and the gain problem,by using the δ-Scuti star V1034 Cen as the comparison starfor V841 Cen (and vice versa) because it is the only star inthe FOV with almost identical count rates.
Another problem occurred when the optics were cleanedtwice during the night (at HJD 2,454,292.68 and 93.71).Although technically not related with it, it likely causedanother CCD controller (or USB connection) problem dueto unwanted interference. On both occasions it had sud-denly decreased the count rate for V841 Cen, but increasedthe count rate for V1034 Cen (on the same exposure). Bothcount rates then exponentially resettled to the previous (ex-pected) count rates within ≈10 hours. We have no readyexplanation for this but approximated the resettling trendwith an exponential fit to the (differential) data and re-moved it. This introduced an extra scatter of ≈1 mmagduring these 10 hours so that the standard deviation dur-ing these hours was more like
√32 + 12 ≈ 3.2 mmag.
Next, we noticed that the telescope had severe point-ing and tracking errors that accumulated during the run.Repositioning was done manually after approximately anhour or so. A scatter plot of the central coordinates ofall, e.g., V frames shows an elongated distribution witha peak-to-peak range of 100′′ in both declination and rightascension. This means that the FOV usable for continuousphotometry is just the minimum wrapped-in field from allindividual pointings. With a CCD FOV of 8′×5.3′ the rangeof ±50′′ is a significant restriction. This probably impactedon the photometric precision because the photometric aper-ture did not always enclose exactly the same pixels.
3. The primary target stars
3.1. V841 Cen = HD127535
V841 Cen (α = 14h34m16s, δ = −60◦24′27′′, 2000.0,V =8.m5) is a rapidly rotating, single-lined spectroscopic bi-nary with an active K1 subgiant as the primary compo-nent (Collier 1982a). The star exhibits strong Ca ii H&Kand Hα emission (Houk & Cowley 1975, Weiler & Stencel1979). It shows high X-ray flux in the ROSAT 0.1–2.4keV energy range (Dempsey et al. 1993) and in the EUV(Mitrou et al. 1997), and also very high radio-flux densities(Slee & Stewart 1989). Its lithium abundance of log n=0.77(Barrado y Navascues et al. 1998, but see also Randich etal. 1993 who obtained a significantly higher value) suggestsa comparably young system. Randich et al. (1993) deter-mined a v sin i of 33±2 km s−1 while De Medeiros et al.(1997) obtained 10±1 km s−1 from CORAVEL tracings.
6 K. G. Strassmeier et al.: Time-series optical photometry from Antarctica
a) V1034 Cen V -light curve
b) V1034 Cen periodogram
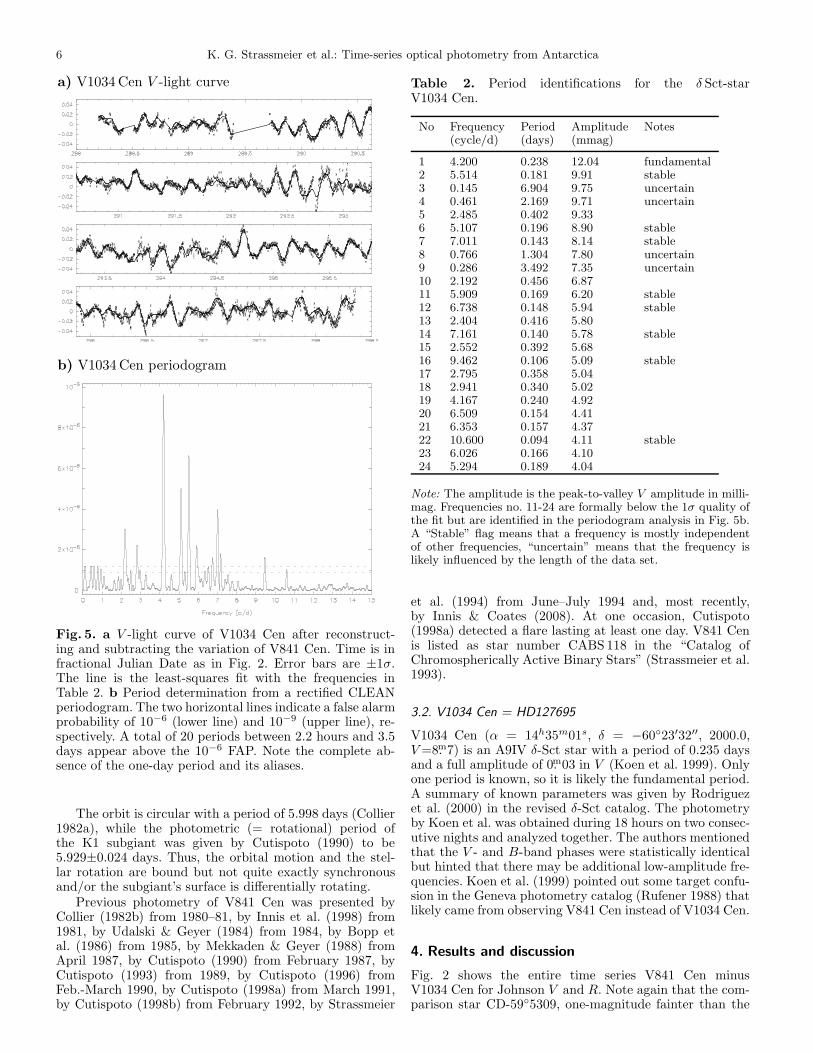
Fig. 5. a V -light curve of V1034 Cen after reconstruct-ing and subtracting the variation of V841 Cen. Time is infractional Julian Date as in Fig. 2. Error bars are ±1σ.The line is the least-squares fit with the frequencies inTable 2. b Period determination from a rectified CLEANperiodogram. The two horizontal lines indicate a false alarmprobability of 10−6 (lower line) and 10−9 (upper line), re-spectively. A total of 20 periods between 2.2 hours and 3.5days appear above the 10−6 FAP. Note the complete ab-sence of the one-day period and its aliases.
The orbit is circular with a period of 5.998 days (Collier1982a), while the photometric (= rotational) period ofthe K1 subgiant was given by Cutispoto (1990) to be5.929±0.024 days. Thus, the orbital motion and the stel-lar rotation are bound but not quite exactly synchronousand/or the subgiant’s surface is differentially rotating.
Previous photometry of V841 Cen was presented byCollier (1982b) from 1980–81, by Innis et al. (1998) from1981, by Udalski & Geyer (1984) from 1984, by Bopp etal. (1986) from 1985, by Mekkaden & Geyer (1988) fromApril 1987, by Cutispoto (1990) from February 1987, byCutispoto (1993) from 1989, by Cutispoto (1996) fromFeb.-March 1990, by Cutispoto (1998a) from March 1991,by Cutispoto (1998b) from February 1992, by Strassmeier
Table 2. Period identifications for the δ Sct-starV1034 Cen.
No Frequency Period Amplitude Notes(cycle/d) (days) (mmag)
1 4.200 0.238 12.04 fundamental2 5.514 0.181 9.91 stable3 0.145 6.904 9.75 uncertain4 0.461 2.169 9.71 uncertain5 2.485 0.402 9.336 5.107 0.196 8.90 stable7 7.011 0.143 8.14 stable8 0.766 1.304 7.80 uncertain9 0.286 3.492 7.35 uncertain10 2.192 0.456 6.8711 5.909 0.169 6.20 stable12 6.738 0.148 5.94 stable13 2.404 0.416 5.8014 7.161 0.140 5.78 stable15 2.552 0.392 5.6816 9.462 0.106 5.09 stable17 2.795 0.358 5.0418 2.941 0.340 5.0219 4.167 0.240 4.9220 6.509 0.154 4.4121 6.353 0.157 4.3722 10.600 0.094 4.11 stable23 6.026 0.166 4.1024 5.294 0.189 4.04
Note: The amplitude is the peak-to-valley V amplitude in milli-mag. Frequencies no. 11-24 are formally below the 1σ quality ofthe fit but are identified in the periodogram analysis in Fig. 5b.A “Stable” flag means that a frequency is mostly independentof other frequencies, “uncertain” means that the frequency islikely influenced by the length of the data set.
et al. (1994) from June–July 1994 and, most recently,by Innis & Coates (2008). At one occasion, Cutispoto(1998a) detected a flare lasting at least one day. V841 Cenis listed as star number CABS 118 in the “Catalog ofChromospherically Active Binary Stars” (Strassmeier et al.1993).
3.2. V1034 Cen = HD127695
V1034 Cen (α = 14h35m01s, δ = −60◦23′32′′, 2000.0,V =8.m7) is an A9IV δ-Sct star with a period of 0.235 daysand a full amplitude of 0.m03 in V (Koen et al. 1999). Onlyone period is known, so it is likely the fundamental period.A summary of known parameters was given by Rodriguezet al. (2000) in the revised δ-Sct catalog. The photometryby Koen et al. was obtained during 18 hours on two consec-utive nights and analyzed together. The authors mentionedthat the V - and B-band phases were statistically identicalbut hinted that there may be additional low-amplitude fre-quencies. Koen et al. (1999) pointed out some target confu-sion in the Geneva photometry catalog (Rufener 1988) thatlikely came from observing V841 Cen instead of V1034 Cen.
4. Results and discussion
Fig. 2 shows the entire time series V841 Cen minusV1034 Cen for Johnson V and R. Note again that the com-parison star CD-59◦5309, one-magnitude fainter than the
K. G. Strassmeier et al.: Time-series optical photometry from Antarctica 7
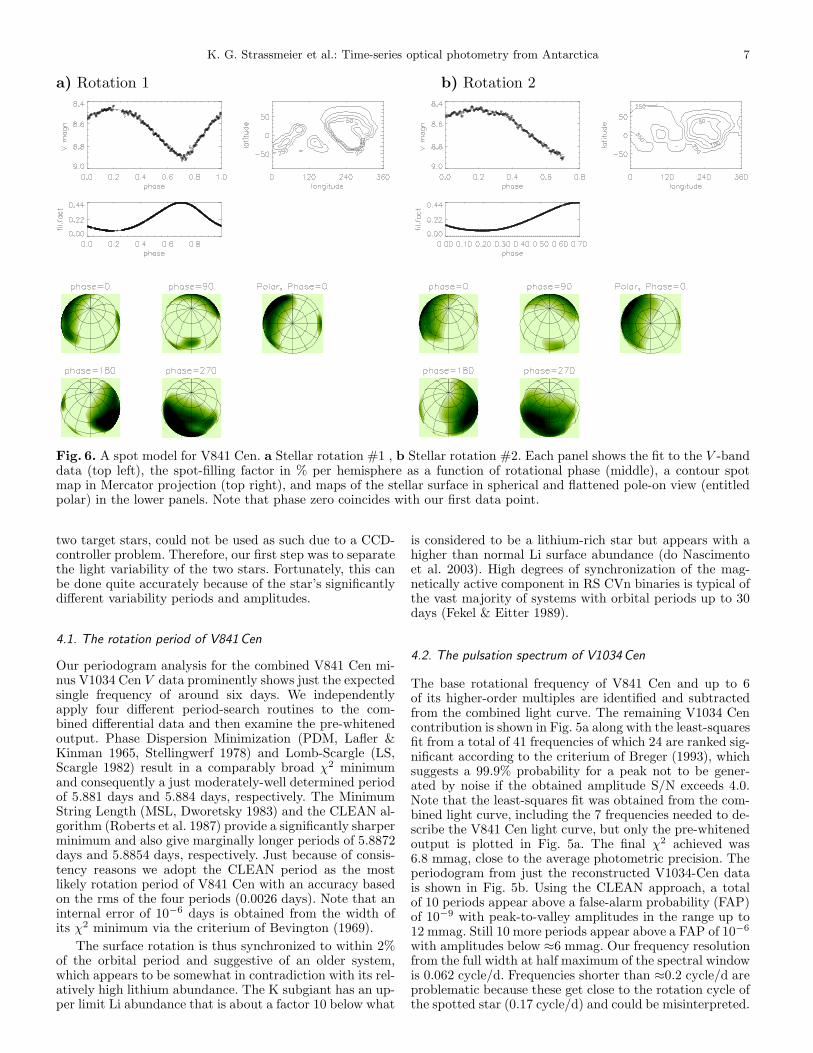
a) Rotation 1 b) Rotation 2
Fig. 6. A spot model for V841 Cen. a Stellar rotation #1 , b Stellar rotation #2. Each panel shows the fit to the V -banddata (top left), the spot-filling factor in % per hemisphere as a function of rotational phase (middle), a contour spotmap in Mercator projection (top right), and maps of the stellar surface in spherical and flattened pole-on view (entitledpolar) in the lower panels. Note that phase zero coincides with our first data point.
two target stars, could not be used as such due to a CCD-controller problem. Therefore, our first step was to separatethe light variability of the two stars. Fortunately, this canbe done quite accurately because of the star’s significantlydifferent variability periods and amplitudes.
4.1. The rotation period of V841Cen
Our periodogram analysis for the combined V841 Cen mi-nus V1034 Cen V data prominently shows just the expectedsingle frequency of around six days. We independentlyapply four different period-search routines to the com-bined differential data and then examine the pre-whitenedoutput. Phase Dispersion Minimization (PDM, Lafler &Kinman 1965, Stellingwerf 1978) and Lomb-Scargle (LS,Scargle 1982) result in a comparably broad χ2 minimumand consequently a just moderately-well determined periodof 5.881 days and 5.884 days, respectively. The MinimumString Length (MSL, Dworetsky 1983) and the CLEAN al-gorithm (Roberts et al. 1987) provide a significantly sharperminimum and also give marginally longer periods of 5.8872days and 5.8854 days, respectively. Just because of consis-tency reasons we adopt the CLEAN period as the mostlikely rotation period of V841 Cen with an accuracy basedon the rms of the four periods (0.0026 days). Note that aninternal error of 10−6 days is obtained from the width ofits χ2 minimum via the criterium of Bevington (1969).
The surface rotation is thus synchronized to within 2%of the orbital period and suggestive of an older system,which appears to be somewhat in contradiction with its rel-atively high lithium abundance. The K subgiant has an up-per limit Li abundance that is about a factor 10 below what
is considered to be a lithium-rich star but appears with ahigher than normal Li surface abundance (do Nascimentoet al. 2003). High degrees of synchronization of the mag-netically active component in RS CVn binaries is typical ofthe vast majority of systems with orbital periods up to 30days (Fekel & Eitter 1989).
4.2. The pulsation spectrum of V1034Cen
The base rotational frequency of V841 Cen and up to 6of its higher-order multiples are identified and subtractedfrom the combined light curve. The remaining V1034 Cencontribution is shown in Fig. 5a along with the least-squaresfit from a total of 41 frequencies of which 24 are ranked sig-nificant according to the criterium of Breger (1993), whichsuggests a 99.9% probability for a peak not to be gener-ated by noise if the obtained amplitude S/N exceeds 4.0.Note that the least-squares fit was obtained from the com-bined light curve, including the 7 frequencies needed to de-scribe the V841 Cen light curve, but only the pre-whitenedoutput is plotted in Fig. 5a. The final χ2 achieved was6.8 mmag, close to the average photometric precision. Theperiodogram from just the reconstructed V1034-Cen datais shown in Fig. 5b. Using the CLEAN approach, a totalof 10 periods appear above a false-alarm probability (FAP)of 10−9 with peak-to-valley amplitudes in the range up to12 mmag. Still 10 more periods appear above a FAP of 10−6
with amplitudes below ≈6 mmag. Our frequency resolutionfrom the full width at half maximum of the spectral windowis 0.062 cycle/d. Frequencies shorter than ≈0.2 cycle/d areproblematic because these get close to the rotation cycle ofthe spotted star (0.17 cycle/d) and could be misinterpreted.
8 K. G. Strassmeier et al.: Time-series optical photometry from Antarctica
E.g., a frequency of 0.145 cycle/d (Table 2) has formally anamplitude of 9.75 mmag and would be highly significant butis judged particularly uncertain because its cycle length of6.9 days is close to the length of the entire data set andclose to the rotation period of V841 Cen. In Table 2 we listall frequencies that we consider significant with respect tothe data quality and the periodogram analysis. Note thatthe original frequency of ≈4.2 cycle/day (a period of ≈0.2days) found by Koen et al. (1999) is reconstructed as thestrongest peak in our data set in Fig. 5b at 4.20018 cycle/d,which nicely confirms Koen et al.’s initial discovery.
4.3. A spot model for V841 Cen
We employ the new light-curve inversion code of Savanov &Strassmeier (2008). It reconstructs the stellar surface spotconfiguration from multi-color light curves by using a trun-cated least-squares estimation of the inverse problem’s ob-jects principal components. Our unknown object, the pho-tospheric spot-filling factor, is a composite of a two tem-perature contribution; the intensity from the photosphere,IP, and from cool spots, IS, weighted by the fraction f ofthe surface covered with spots, i.e. the spot filling factor.The intensity per pixel reads then
I = f × IP + (1 − f) × IS (1)
with 0 < f < 1. The inversion results in the distributionof the spot filling factor over the visible stellar surface thatbest fits the data. No assumptions for the shape or for theconfiguration or total number of spots are made. The stel-lar astrophysical input includes band-pass fluxes calculatedfrom atmospheric models from Kurucz (2000).
An effective temperature for V841 Cen of 4390 K waslisted in Barrado y Navascues et al. (1998) who based it onV − I and R− I indices. Note that just B −V alone wouldsuggest a 300-K higher temperature of ≈4,700K based on,e.g. Flower (1996). Karatas et al. (2004) gave a spectro-scopic parallax that places V841 Cen at a distance of 63+26
−13
pc and thus with an accordingly uncertain luminosity of≈2.3 L⊙ (no Hipparcos parallax is available) . Our best ro-tation period of 5.8854 days and the projected rotationalvelocity of 10±1 kms−1 from De Medeiros et al. (1997) de-termine together the lower limit of the stellar radius toR sin i=1.16±0.12 R⊙. Assuming the luminosity based onthe spectroscopic parallax and the Stefan-Boltzmann lawwe obtain a matching radius only with inclinations of aslow as 30◦ and 26◦ for effective temperatures of 4700 K and4400 K, respectively. Cutispoto (1998b) favored a K3(V-IV)spectral type from the observed long-term UBV RI colorswhich leads to a slightly higher inclination of ≈40◦ (±10◦)and Teff=4500 K. These are the values we adopt for the spotmodelling. A generally low inclination is also in agreementwith the low mass function of f(m)=0.025 from the orbitby Collier (1982a) and the fact that we do not see eclipsesnor a secondary star in any of the published spectra (e.g.Randich et al. 1993). In any case, the numerical light-curvesimulations by Savanov & Strassmeier (2008) showed that achange of the inclination angle of even ±15◦ just marginallyaltered the light-curve solution.
Due to the continuous time coverage we do not need toconvert the data into phase space but separate into firstand second rotation based on a period of 5.8854 days. Fiveconsecutive data points were always averaged. Fig. 6 shows
the results for the consecutive 1.7 stellar rotations, dubbed“rotation 1” and “rotation 2”. A huge spot covering up to44% of the visible hemisphere is required to fit the deep 0.m4photometric minimum. A second, smaller spot with ≈10%filling factor at a longitude of ≈100◦(phase 0.p28) located inthe adjacent hemisphere is needed to fit the broad shape ofthe light curve near maximum light. Note that our inver-sion algorithm converges with a χ2 of the fit that is alwaysthe (average) χ2 of the data. Despite the low inclination ofthe rotational axis, and the therefore pronounced pole-onview, the inversion reconstructs both spots at low latitudesrather than at the poles. This is due to the deep and rel-atively sharp photometric minimum that excludes a polar,permanently-in-view location.
A spot coverage of 44% of the visible hemisphere isamong the largest measured values for active stars, andis by chance the same value as determined for the largestspot ever recorded with the Doppler-Imaging technique (forXX Tri, a K-giant in a 24-day RS CVn binary; Strassmeier1999). However, spot sizes obtained from photometry de-pend on the spot temperature. The full ∆(V −R) amplitudein our data is 0.m090±0.004, becoming redder during min-imum brightness and bluer during maximum brightness.Our inversion code resolves this with a most likely spot tem-perature of 3750 K. Its error is obtained from the numericalsimulations in Savanov & Strassmeier (2008) that suggestedthat f increases up to 30% if ∆T = TP − TS is lowered by250 K. We conclude that f=44±3% and ∆T=750±100 Kare the most likely spot parameters for V841 Cen at thetime of our observations.
Because the orbit determination is almost 30 years oldand had a just modestly precise period, it is impossible toidentify the exact orbital phase for the time of our datain 2007. Therefore, no statement can be made regardingthe location of the largest spot with respect to the or-bital frame. However, this would be needed to interpret themagnetic-flux emergence in such a binary because the prox-imity of the companion star breaks the rotational symme-try and cause a non-uniform surface flux distribution (e.g.Holzwarth 2004).
5. Conclusions and outlook
We presented 243 continuous hours of optical photometryfrom Antarctica with a duty cycle of 98% and a cadenceof 155 seconds. A 3 mmag rms precision in V over 2.4hours with the 25-cm sIRAIT telescope was achieved forthe two bright 8.m5 target stars. This is a factor 3–4 betterthan what we had obtained with the 25-cm T1 automaticphotoelectric telescope (APT) at Fairborn Observatory insouthern Arizona (Strassmeier et al. 1997, Henry 1995).Most likely this is attributed to scintillation noise smallerby a factor 3–4 compared to temperate observing sites,as reported by Kenyon et al. (2006). We conclude thathigh-precision continuous photometry within the turbulentground layer just one meter above ground is feasible atDome C, even with low-cost, partly commercial compo-nents. The main problems we had encountered with sIR-AIT in its first winterover were all due to the quality ofthe equipment rather than with the harsh Antarctic en-vironment. This makes us strongly believe that our pro-posed 2×60-cm, more optimized and robust, photometricfacility ICE-T (Strassmeier et al. 2007b) as well as theintermediate-step 40cm a-step experiment (Fressin et al.
K. G. Strassmeier et al.: Time-series optical photometry from Antarctica 9
2007) are well suited for a site like Dome C and could,for some favorable cases, even challenge photometry fromspace.
Acknowledgements. The field activities and the results at Dome Cbenefit from the support of the French and Italian polar agenciesIPEV and PNRA in the framework of the Concordia station pro-gramme. We tank the AstroConcordia astronomers D. Mekarnia andF. Jeanneaux for their support during the winterover. Heidi Korhonenkindly provided the scintillation noise values for temperate sites. Wethank an anonymous referee for several helpful suggestions that im-proved the paper. German participation in sIRAIT was financed byAIP through the State of Brandenburg and the federal Ministry ofEducation and Research and supported by the German polar agencyAWI. Discussions with Michel Breger on the significance of pulsationfrequencies is also appreciated. Finally, we acknowledge support fromthe European Community’s Sixth Framework Programme under con-tract number RICA-026150 (ARENA).
References
Agabi, A., Aristidi, E., Azouit, M., Fossat, E., Martin, F., Sadibekova,T., Vernin, J., Ziad, A. 2006, PASP 118, 344
Bertin, E., Arnouts, S. 1996, A&AS 117, 393Bevington, P. R. 1969, Data Reduction and Error Analysis for the
Physical Sciences, McGraw-Hill, New YorkBriguglio, R. 2008, PhD thesis, Univ. of PerugiaBarrado y Navascues, D., De Castro, E., Fernandez-Figueroa, M.,
Cornide, M., Garcia Lopez, R. J. 1998, A&A 337, 739Bopp, B. W., Africano, J., Quigley, R. 1986, AJ 92, 1409Breger, M., Stich, J., Garrido, R., et al. 1993, A&A 271, 482Catala, C., Foing, B. H., Baudrand, J. et al. 1993, A&A 275, 245Collier, A. C. 1982a, Ph.D. Thesis, University of Canterbury, New
ZealandCollier, A. C. 1982b, Southern Stars 30, 177Cutispoto, G. 1990, A&AS 84, 397Cutispoto, G. 1993, A&AS 102, 655Cutispoto, G. 1996, A&AS 119, 281Cutispoto, G. 1998a, A&AS 127, 207Cutispoto, G. 1998b, A&AS 131, 321Dempsey, R. C., Linsky, J. E., Fleming, T., Schmitt, J. H. M. M. 1993,
ApJS 86, 599Deeg, H. J., Belmonte, J. A., Alonso, R., Horne, K., Alsubai, K.,
Doyle, L. R. 2005, in Giard, M. et al. (eds.), Dome C, Astronomy,and Astrophysics Meeting, EDP Publ. Ser. 14, p.303
De Medeiros, J. R., Do Nascimento, J. D., Mayor, M. 1997, A&A 317,701
Distefano, E., Messina, S., Cutispoto, G., Parihar, P. S., Comparato,M., Busa, I., Lanza, A. F., Lanzafame, A. C., Pagano, I.,Strassmeier, K. G. 2007, in Epchtein, N. et al. (eds.), LargeAstronomical Infrastructures at Concordia, Roscoff, EDP sci-ences, EAS Publ. Ser. Vol. 25, p.165
Do Nascimento, J. R., Canto Martins, B. L., Melo, C. H. F., PortoMello, G., De Medeiros, J. R. 2003, A&A 405, 723
Dworetsky, M. M. 1983, MNRAS 203, 917ESA 1997, The Hipparcos and Tycho Catalogues, ESA SP-1200Fekel, F. C., Eitter, J. J. 1989, AJ 97, 1139Flower, P. J. 1996, ApJ 469, 355Fossat, E. 2005, in Giard, M. et al. (eds.), Dome C, Astronomy, and
Astrophysics Meeting, EDP Publ. Ser. 14, p.121Fressin, F., Guillot, T., Schmider, F.-X. et al. 2007, in Epchtein, N.,
et al. (eds.), Large Astronomical Infrastructures at Concordia,Roscoff, EDP sciences, EAS Publ. Ser. Vol. 25, p.225
Harvey, J. W., Hill, F., Hubbard, R. et al. 1996, Science 272, 1284Henry, G. W. 1995, in Henry, G.W. & J. A. Eaton (eds.), Robotic
Telescopes: Current Capabilities, Present Developments, andFuture Prospects for Automated Astronomy, ASP Conf. Ser. Vol.79, p.37
Holzwarth, V. 2004, AN 325, 408Houk, N., Cowley, A. 1975, Michigan Catalog, Vol. 1, Ann Arbor:
Astron. Dept.Innis, J. L., Coates, D. W. 2008, IBVS 5838Innis, J. L., Thompson, K., Coates, D. W. 1998, IBVS 4570Janesick, J. 1997, SPIE 3019, 70Karatas, Y., Bilir, S., Eker, Z., Demircan, O. 2004, MNRAS 349, 1069Kenyon, S. L., Lawrence, J., Ashley, M. C. B., Storey, J. W. V.,
Tokovinin, A., Fossat, E. 2006, PASP 118, 924
Koen, C., Van Rooyen, R., Van Wyk, F., Marang, F. 1999, MNRAS309, 1051
Kurucz, R. L. 2000, http://www.cfaku5.harvard.eduLafler, J., Kinman, T. D. 1965, ApJS 11, 216Landolt, A. U. 2007, AJ 133, 2502Lawrence, J. S., Ashley, M. C. B., Tokovinin, A., Travouillon, T. 2004,
Nature 431, 278Mekkaden, M. V., Geyer, E. H. 1988, A&A 195, 214Mitrou, C. K., Mathioudakis, M., Doyle, J. G., Antonopoulov, E.
1997, A&A 317, 776Moore, A., Aristidi, E., Ashley, M., et al. 2007, in Epchtein, N., et al.
(eds.), Large Astronomical Infrastructures at Concordia, Roscoff,EDP sciences, EAS Publ. Ser. Vol. 25, p.35
Nather, R. E., Winget, D. E., Clemens, J. C., Hansen, C. J., Hine, B.P. 1990, ApJ 361, 309
Newberry, M. V. 1991, PASP 103, 122Pont, F., Bouchy, F. 2005, in Giard, M. et al. (eds.), Dome C,
Astronomy, and Astrophysics Meeting, EDP Publ. Ser. 14, p.155Randich, S., Gratton, R., Pallavicini, R. 1993, A&A 273, 194Roberts, D. H., Lehar, J., Dreher, J. W. 1987, AJ 93, 968Rodriguez, E., Lopez-Gonzalez, M. J., Lopez de Coca, P. 2000, A&AS
144, 469Rufener, F. 1988, Catalogue of Stars measured in the Geneva
Observatory Photometric System, 4th ed., Geneva Obs., SauvernySavanov, I. S., Strassmeier, K. G. 2008, AN 329, 364Scargle, J. D. 1982, ApJ 263, 835Schild, R. E., Garrison, R. F., Hiltner, W. A. 1983, ApJS 51, 321Slee, O. B., Stewart, R. T. 1989, MNRAS 236, 129Stellingwerf, R. F. 1978, ApJ 224, 953Strassmeier, K. G. 1999, A&A 347, 225Strassmeier, K. G. 2007, in Epchtein, N. et al. (eds.), Large
Astronomical Infrastructures at Concordia, Roscoff, EDP sci-ences, EAS Publ. Ser. Vol. 25, p.233
Strassmeier, K. G., Agabi, K., Agnoletto, L., et al. 2007a, AN 328,451
Strassmeier, K. G., Andersen, M., Granzer, T., Korhonen, H., Herber,A., Cutispoto, G., Rafanelli, P., Horne, K. 2007b, in C. Afonsoet al. (eds.), Transiting Extrasolar Planets Workshop, ASP 366,p.332
Strassmeier, K. G., Bartus, J., Cutispoto, G., Rodono, M. 1997, A&AS125, 11
Strassmeier, K. G., Hall, D. S., Fekel, F. C., Scheck, M. 1993, A&AS100, 173
Strassmeier, K. G., Olah, K. 2004, ESA SP-583, 149Strassmeier, K. G., Paunzen, E., North, P. 1994, IBVS 4066Tosti, G., Busso, M., Nucciarelli, G., et al. 2006, SPIE 6267, 47Udalski, A., Geyer, E. H. 1984, IBVS 2594Vernin, J., Agabi, K., Aristidi, E., et al. 2007, in Epchtein, N., et al.
(eds.), Large Astronomical Infrastructures at Concordia, Roscoff,EDP sciences, EAS Publ. Ser. Vol. 25, p.23
Walker, G. A. H., Croll, B., Kuschnig, R., et al. 2007, ApJ 659, 1611Weiler, E. J., Stencel, R. E. 1979, AJ 84, 1372Zacharias, N., Monet, D. G., Levine, S. E., Urban, S. E., Gaume,
R., Wycoff, G. L. 2005, Bulletin of the American AstronomicalSociety, Vol. 36, p.1418
Copyright © 2022 FDOKUMEN