Optical and Infrared Photometry of the Nearby Type Ia Supernova 2001el
45
arXiv:astro-ph/0210327v3 4 Nov 2002 Optical and Infrared Photometry of the Nearby Type Ia Supernova 2001el Kevin Krisciunas, 1 Nicholas B. Suntzeff, 1 Pablo Candia, 1 Jos´ e Arenas, 1 Juan Espinoza, 1 David Gonzalez, 1 Sergio Gonzalez, 2 Peter A. H¨oflich 3 , Arlo U. Landolt, 4,6 Mark M. Phillips, 2 and Sergio Pizarro 1 1 Cerro Tololo Inter-American Observatory, National Optical Astronomy Observatories, 5 Casilla 603, La Serena, Chile 2 Las Campanas Observatory, Carnegie Observatories, Casilla 601, La Serena, Chile 3 University of Texas, Dept. of Astronomy, Austin, TX 78712 4 Louisiana State University, Dept. of Physics and Astronomy, Baton Rouge, LA 70803-4001 kkrisciunas, [email protected] pcandia, juan, spizarro, [email protected] [email protected] [email protected] [email protected] [email protected] [email protected] ABSTRACT We present well sampled optical (UBV RI ) and infrared (JHK ) light curves of the nearby (≈18.0 Mpc) Type Ia supernova SN 2001el, from 11 days before to 142 days after the time of B-band maximum. The data represent one of the best sets of optical and infrared photometry ever obtained for a Type Ia super- nova. Based on synthetic photometry using optical spectra of SN 2001el and optical and infrared spectra of SN 1999ee, we were able to devise filter correc- tions for the BVJHK photometry of SN 2001el which to some extent resolve systematic differences between SN 2001el datasets obtained with different tele- scope/filter/instrument combinations. We also calculated V minus infrared color 5 The National Optical Astronomy Observatories are operated by the Association of Universities for Re- search in Astronomy, Inc., under cooperative agreement with the National Science Foundation. 6 Visiting Astronomer, Cerro Tololo Inter-American Observatory, National Optical Astronomy Observa- tories.
-
Upload
independent -
Category
Documents
-
view
0 -
download
0
Transcript of Optical and Infrared Photometry of the Nearby Type Ia Supernova 2001el
arX
iv:a
stro
-ph/
0210
327v
3 4
Nov
200
2
Optical and Infrared Photometry of the Nearby Type Ia
Supernova 2001el
Kevin Krisciunas,1 Nicholas B. Suntzeff,1 Pablo Candia,1 Jose Arenas,1 Juan Espinoza,1
David Gonzalez,1 Sergio Gonzalez,2 Peter A. Hoflich3, Arlo U. Landolt,4,6 Mark M.
Phillips,2 and Sergio Pizarro1
1Cerro Tololo Inter-American Observatory, National Optical Astronomy
Observatories,5 Casilla 603, La Serena, Chile2Las Campanas Observatory, Carnegie Observatories, Casilla 601, La Serena, Chile
3University of Texas, Dept. of Astronomy, Austin, TX 787124Louisiana State University, Dept. of Physics and Astronomy, Baton Rouge, LA
70803-4001
kkrisciunas, [email protected]
pcandia, juan, spizarro, [email protected]
ABSTRACT
We present well sampled optical (UBV RI) and infrared (JHK) light curves
of the nearby (≈18.0 Mpc) Type Ia supernova SN 2001el, from 11 days before
to 142 days after the time of B-band maximum. The data represent one of the
best sets of optical and infrared photometry ever obtained for a Type Ia super-
nova. Based on synthetic photometry using optical spectra of SN 2001el and
optical and infrared spectra of SN 1999ee, we were able to devise filter correc-
tions for the BV JHK photometry of SN 2001el which to some extent resolve
systematic differences between SN 2001el datasets obtained with different tele-
scope/filter/instrument combinations. We also calculated V minus infrared color
5The National Optical Astronomy Observatories are operated by the Association of Universities for Re-
search in Astronomy, Inc., under cooperative agreement with the National Science Foundation.
6Visiting Astronomer, Cerro Tololo Inter-American Observatory, National Optical Astronomy Observa-
tories.
– 2 –
curves on the basis of a delayed detonation model and showed that the theoretical
color curves match the unreddened loci for Type Ia SNe with mid-range decline
rates to within 0.m2. Given the completeness of the light curves and the elimina-
tion of filter-oriented systematic errors to some degree, the data presented here
will be useful for the construction of photometric templates, especially in the
infrared. On the whole the photometric behavior of SN 2001el was quite normal.
The second H-band maximum being brighter than the first H-band maximum
is in accord with the prediction of Krisciunas et al. (2000) for Type Ia SNe with
mid-range decline rates. The photometry exhibits non-zero host extinction, with
total AV = 0.57 ± 0.05 mag along the line of sight. NGC 1448, the host of SN
2001el, would be an excellent target for a distance determination using Cepheids.
Subject headings: supernovae, photometry; supernovae
1. Introduction
Type Ia supernovae (SNe) continue to be some of the most important objects of study in
extragalactic astronomy. Since the discovery of the luminosity-decline rate relation (Phillips
1993; Phillips et al. 1999) and the corresponding relationships between light curve shapes
and luminosities-at-maximum (Riess, Press, & Kirshner 1996; Riess et al. 1998; Perlmutter
et al. 1997), Type Ia SNe have been regarded as standardizable candles to be used for
calibrating the distances to the host galaxies.
Until recently, the amount of published infrared data of Type Ia SNe was quite small
(Elias et al. 1981, 1985; Meikle 2000, and references therein; Krisciunas et al. 2000, 2001).
Beginning in 1999 two of us (MMP and NBS) began a coordinated effort, using telescopes
at Las Campanas and Cerro Tololo, to obtain well-sampled optical and infrared light curves
of Type Ia supernovae. The first of these, SN 2000bk, was published by Krisciunas et al.
(2001), including data from Apache Point Observatory.
Recently, we have published well-sampled light curves of SNe 1999aw (Strolger et al.
2002) and 1999ac (Phillips et al. 2002). In the H- and K-bands, in particular, we note
that the light curves of Type Ia SNe are quite flat about 10 days after the time of B-band
maximum, T(Bmax), allowing us get an accurate brightness measure of Type Ia SNe in the
near-infrared, independent of the peculiarities of the light curves around the time of the
primary maximum (t ≈ −3 d) or the time of the secondary maximum (t ≈ +25 d).7
7As is conventional, we shall measure the “age” of a supernova in time before or after T(Bmax). For this
– 3 –
In addition to the data of SN 2001el presented here, we are finishing up the reduction
of the light curves of another dozen objects. This will allow us to characterize better than
ever before the infrared light curves of Type Ia SNe and correlate the variations observed at
infrared wavelengths with those seen at optical wavelengths. Because interstellar extinction
at infrared wavelengths is an order of magnitude less than extinction at optical wavelengths,
we expect that we will be able to exploit this fact to obtain intrinsic photometry of Type
Ia SNe only minimally affected by interstellar extinction. This will lead to an infrared
Hubble diagram for Type Ia SNe free of significant systematic errors incurred from imprecise
reddening estimates, and characterized by small random errors. Only with such a foundation
for nearby Type Ia SNe can we have confidence in the conclusions drawn from observations
of distant SNe, such as evidence for a non-zero cosmological constant (Riess et al. 1998,
Perlmutter et al. 1999).
2. Observations
SN 2001el was discovered by Monard (2001) on 17.064 September 2001 UT (= Ju-
lian Date 2,452,169.564) some 22′′ west and 19′′ north of the nucleus of the SAcd galaxy
NGC 1448, which incidentally was also the host of the Type II SN 1983S. According to
the NASA/IPAC Extragalactic Database (NED) the heliocentric velocity of this galaxy is
1164 km s−1. Based on a spectrum taken with the VLT on 21 September 2001 UT (JD =
2,452,173.5), Sollerman, Leibundgut, & Lundqvist (2001) showed SN 2001el to be a Type
Ia SN well before maximum. On this basis we requested that frequent optical and infrared
imagery be made with the Yalo-AURA-Lisbon-Ohio (YALO) 1-m telescope at Cerro Tololo.
We also obtained optical imagery on five nights with the CTIO 0.9-m telescope. Optical
data of Landolt presented here is single-channel photoelectric photometry carried out with
the CTIO 1.5-m telescope. Finally, we obtained other infrared imagery with the 1-m Swope
telescope at Las Campanas, which was used, along with observations of infrared standards
of Persson et al. (1998) to calibrate the JHK magnitudes of the field stars near SN 2001el.
Fig. 1 is a V -band optical image in which we identify the location of SN 2001el and
various local field standards. In Tables 1 and 2 we give optical and infrared photometry of
some of these local standards. These were used as secondary standards tied to the optical and
infrared standards of Landolt (1992) and Persson et al. (1998), respectively. This allowed
us to calibrate the photometry of the SN on photometric as well as non-photometric nights.
Photometry reduction of the YALO data was carried out using daophot (Stetson 1987,
we use the variable t, measured in days.

– 4 –
1990) and a set of programs written by one of us (NBS). The photometric techniques were
described by Suntzeff et al. (1999) and involve using aperture magnitudes and aperture
corrections for the brighter stars, while relying on point spread function (PSF) magnitudes
for fainter stars. We used transformation equations of the following form:
b = B + ZPb − 0.079(B − V ) + kbX ; (1)
v = V + ZPv + 0.018(B − V ) + kvX ; (2)
r = R + ZPr − 0.030(V − R) + krX ; (3)
i = I + ZPi + 0.045(V − I) + kiX ; (4)
j = J + ZPj − 0.034(J − H) + kjX ; (5)
h = H + ZPh + 0.022(J − H) + khX ; (6)
k = K + ZPk − 0.003(J − K) + kkX . (7)
The parameters on the left hand sides are the instrumental magnitudes. On the right hand
side of each equation we have the standardized magnitude, a photometric zeropoint, a color
term times a standardized color, and an extinction term times the air mass. Given that the
color terms are reasonably close to zero, the YALO filters provide a good, but not perfect,
match to the filters used by Landolt (1992) and Persson et al. (1998) for the derivation of
their standard star networks.
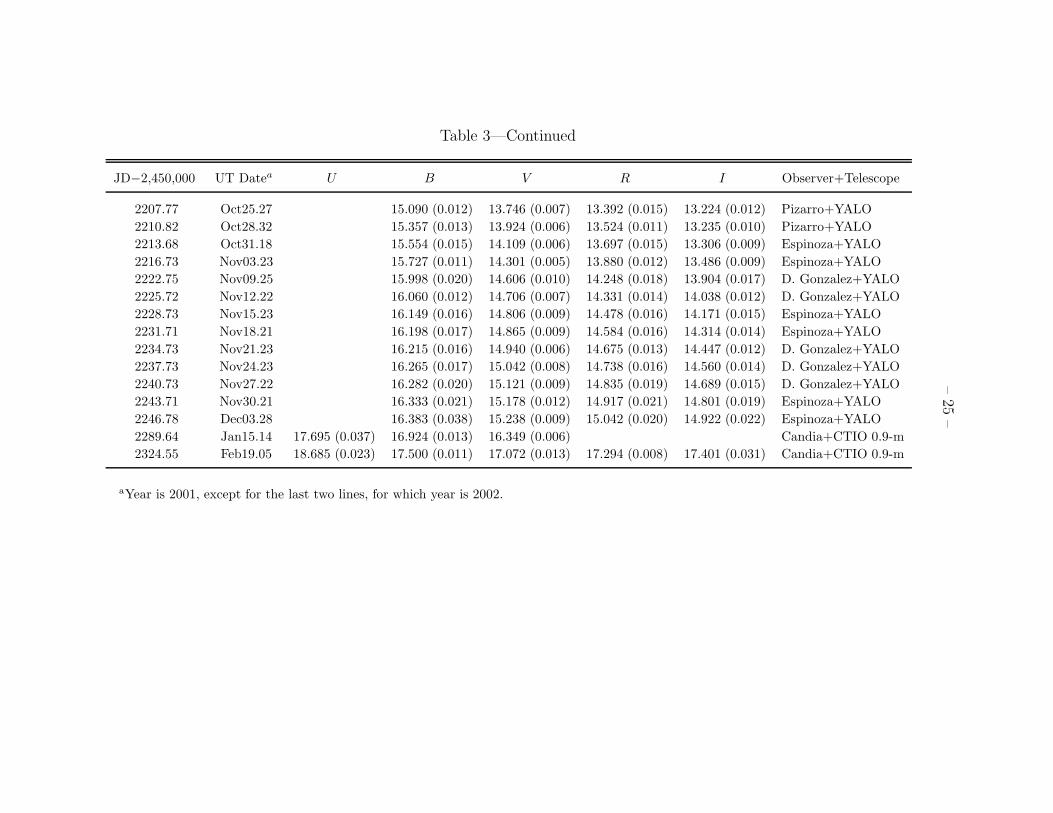
In Table 3 we present UBV RI photometry of SN 2001el. A majority of the data is
from YALO, calibrated using the secondary standards from Table 1. Landolt’s data are tied
directly to the Landolt (1992) standards, i.e. without using the secondary standards. The
internal errors of the Landolt data are as small as several millimags. His data were taken
when the SN was getting monotonically fainter, and the data bear this out on those four
nights when he measured the SN on more than one occasion. For our field star number 1
Landolt obtained mean values of V, B−V, V −R, and V −I which are +0.003, +0.002, −0.005,
– 5 –
and −0.009 mag different, respectively, than the values obtained from CCD photometry with
YALO. Thus, photometry of stars carried out with the CTIO 1.5-m and YALO telescopes
is in excellent agreement.
We note that Landolt’s measurements of SN 2001el are aperture photometry using a 14
arcsec diameter aperture. His sky readings were taken 15 arcsec to the north of supernova.
To determine the amount of diffuse light of NGC 1448 which was in his diaphragm while
measuring SN 2001el, we used CCD frames of the field taken 16 October 2001 and 15 January
2002. We determined that U -band corrections to Landolt’s photoelectric photometry are
negligible, 0.m002 or less. In B, V , R, and I, however, the data required correction by 0.m019
to 0.m043, 0.m024 to 0.m035, 0.m034 to 0.m048, and 0.m058 to 0.m078, respectively. (Another way
of describing this is that galaxy light is red.) The Landolt data in Table 3 include these
corrections.
There were four nights when Landolt observed SN 2001el when it was also observed
with YALO. In the sense “YALO minus Landolt” the B-band data show a difference of
+0.m037. For other bands ∆V = −0.m025, ∆R = −0.m009, and ∆I = −0.m064. V -band data
obtained with the CTIO 0.9-m telescope by Arenas is up to 0.067 mag fainter at the time
of maximum light than corresponding YALO data.
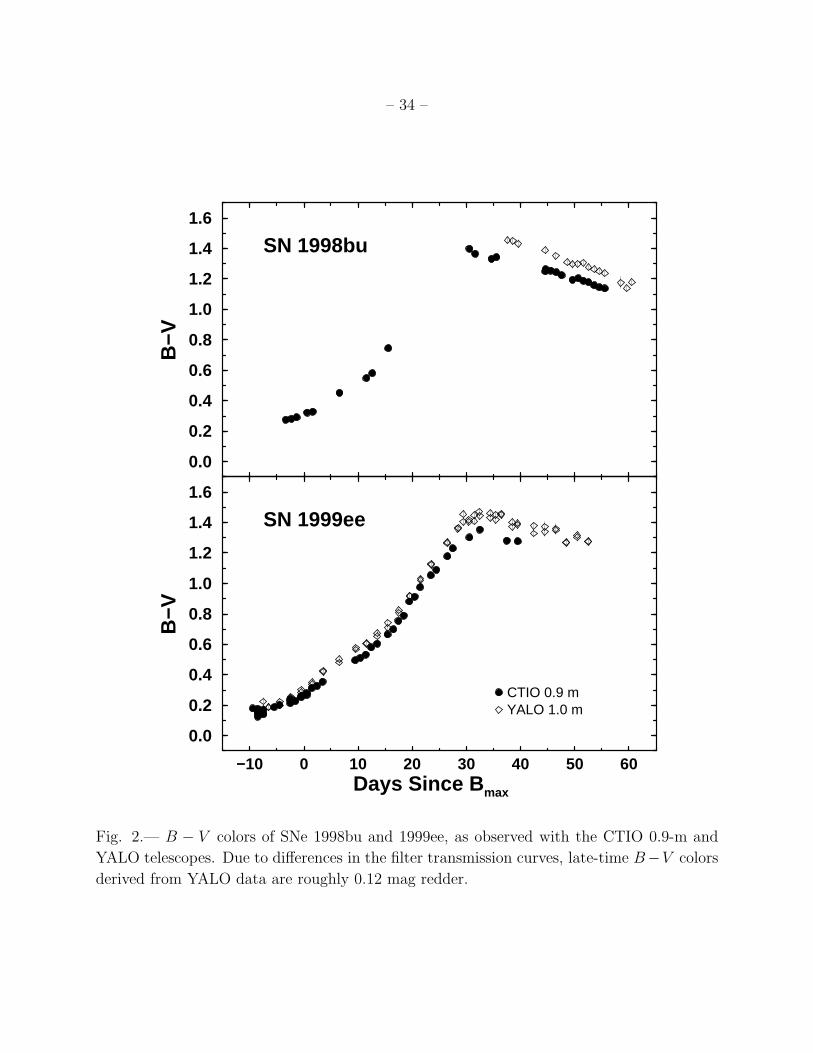
Suntzeff (2000) notes that one observes sizable and repeatable systematic differences
for the B − V colors of Type Ia SNe measured with different telescopes. In the cases of
SNe 1998bu and 1999ee observed with the YALO and CTIO 0.9-m telescopes, one finds that
YALO colors are 0.m03 redder at maximum and 0.m12 in the tail of the color curve, as shown
in Fig. 2. Obviously, if we try to derive a B − V color excess from late-time photometry,
we must identify and correct systematic differences in the photometry that are as large as
shown in Fig. 2.
To account for possible systematic errors in our photometry of SN 2001el we investigated
the method of computing filter corrections described by Stritzinger et al. (2002). In the end
these authors chose not to apply their derived filter corrections, describing the whole exercise
as “somewhat disappointing.”8 By contrast, we were quite encouraged by similar efforts for
SN 2001el. In particular, our corrections to the B and V magnitudes not only tighten up
the light curves in those filters, but they solve the problem of the B − V colors being too
red in the tail of the color curve. Also, our JHK light curves are improved. Still, should
the reader disagree with our application of the filter corrections, we present the data in this
8Some of their disappointment stemmed from trying to correct YALO observations taken with a very
wide, non-standard R filter. Our YALO observations were made with a much narrower, more standard R
filter.

– 6 –
paper in multiple tables: two for uncorrected photometry, and two for corrections.
The determination of filter corrections involves at minimum the dot product (i.e. mul-
tiplying together) of filter transmission functions, quantum efficiency as a function of wave-
length, and an atmospheric transmission profile. The zeropoints are first fixed with Vega
(see Appendix A), then one determines synthetic broad-band magnitudes using spectra of
spectrophotometric standards (Hamuy et al. 1992, 1994). This allows one to derive color
terms based on the synthetic photometry. In order for the synthetic color terms to match
the color terms derived from actual broad band photometry within 0.m01 mag−1, we found,
as did Stritzinger et al. (2002), that we had to shift the optical filter profiles by as much as
100 A to match the synthetic color terms with the actual observed ones.9 In Appendix B
we give the filter shifts used for the optical photometry.
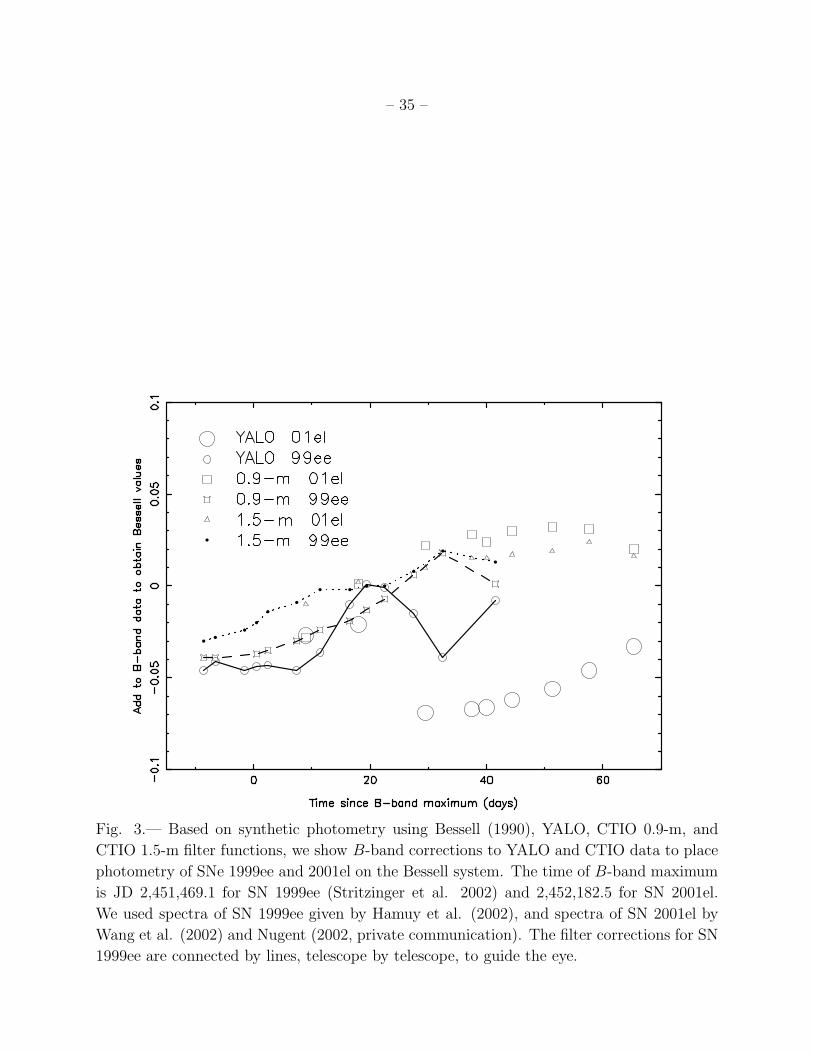
We took as our filter references the BV RI profiles of Bessell (1990), corrected for
wavelength (i.e. divided by λ). In Fig. 3 we show the derived magnitude corrections for
B-band photometry of SNe 1999ee and 2001el. In Fig. 4 we show the analogous filter
corrections for the V -band. These corrections were obtained using spectra of SN 1999ee
from Hamuy et al. (2002), while some spectra of SN 2001el are discussed by Wang et al.
(2002).10 Six HST spectra were also kindly made available to us by P. Nugent. These range
from 2947 to 10238 A, thus covering the UBV RI passbands, and were taken from 29.5 ≤ t ≤
65.3 d.
We find that for the CTIO 1.5-m telescope with the filters used by Landolt the B-band
filter corrections are essentially the same for SN 1999ee and 2001el. The situation is not too
bad for the CTIO 0.9-m telescope, but for YALO the B-band corrections are not as well
behaved, indicating that the filter corrections can be telescope and object dependent. For
example, features at the blue end of the B-band are included more or less with different B
filters, and these features are different in the spectra SN 1999ee and 2001el. As a check on
our method, filter corrections based on spectra by Wang et al. (2002) and HST (Nugent,
private communication) give very consistent corrections at t ≈ 40 d for the YALO B-band
9Shifting the filter profiles in this manner will strike some readers as unsatisfactory. However, the manu-
facturer of our R-band filter gives a particular filter curve, but states that when the filter is used in a liquid
nitrogen filled dewar, the filter curve should be shifted 300 A to the blue. We find that a shift of 270 A gives
the correct color term, or 30 A to the red of the expected filter curve. Thus, the use of these wavelength
shifts is justified at some level.
10The first two of these spectra range from 4179 to 8634 A, while the last three range from 3327 to 8634
A. Because the B-band starts at roughly 3600 A, we obtain three synthetic B-band magnitudes and five
synthetic V -band magnitudes of SN 2001el. Both are needed to derive filter corrections for B and V data
because of color terms that need to be applied.

– 7 –
filter. In the case of the V -band (see Fig. 4), the corrections are better behaved and seem
to be telescope dependent, i.e. more independent of the object under study.
In Table 4 we give the B-band and V -band corrections to the photometry tabulated
in Table 3. These corrections would place the measurements obtained with three different
telescopes and filter sets on the Bessell (1990) system. The consistency of the photometry
obtained on different telescope is improved. With the corrections, ∆B = +0.m020 and ∆V =
−0.m002, with “∆” in the sense “YALO minus Landolt”. As we show below, the late time
YALO B − V colors give an estimate of the reddening which is in agreement with other
estimates of the reddening, but only if we take into account the systematic differences of the
filters.
The R-band photometry given in Table 3 (i.e. YALO vs. Landolt) is consistent at
the 0.m01 mag level, on average. Under the assumption that the spectra of SNe 1999ee and
2001el are the same at t = 16 d, the application of R-band filter corrections would make the
Landolt and YALO R-band photometry differ by as much as 0.m04. We do not have spectra
of SN 2001el covering the R and I-bands at this epoch, and the photometry is not crying
out for corrections to be made.
There is a systematic difference of I-band photometry in Table 3 at the 0.m06 level.
The application of filter corrections based on spectra of SN 1999ee would pull the data
further apart by an additional 0.m10 mag or more. Thus, while the SN 2001el data in Table
3 motivates us to apply I-band filter corrections, corrections based on spectra of a different
object make the systematic differences worse, not better.
In the case of the R- and I-bands, we also suspect some unquantified effect of the YALO
dichroic on the photometry. While we are satisfied with the B- and V -band corrections, we
feel it unwise to apply corrections to the R- and I-band data.
Fig. 5 shows the UBV RI light curves of SN 2001el, with the corrections of Table 4
applied to the B and V data given in Table 3.
The most interesting result of the application of the filter corrections is that by t = 40
d we have reproduced a correction (with respect to Bessell filter functions) of ≈0.m1 to the
YALO B−V colors (see Fig. 10 below), almost exactly what was found for SNe 1998bu and
1999ee using YALO and CTIO 0.9-m photometry.
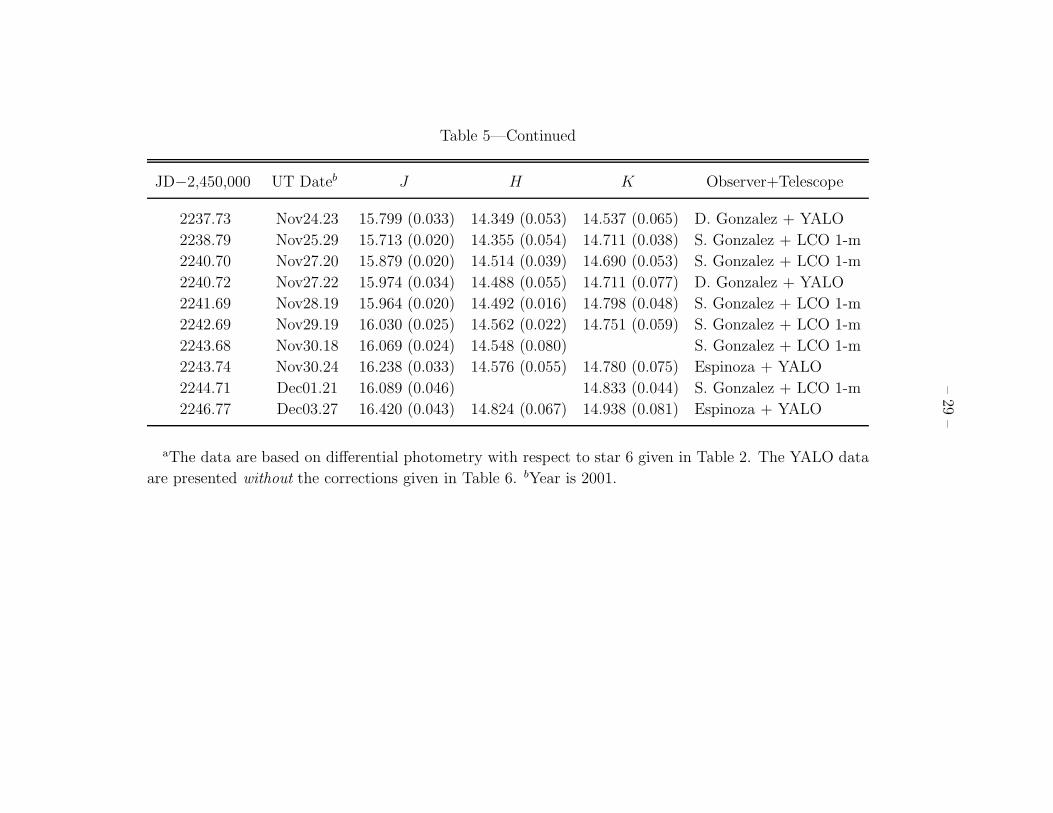
In Table 5 we give near-infrared photometry of SN 2001el obtained with the YALO and
LCO 1-m telescopes. The near-infrared data were calibrated using our “best” IR secondary
standard, star 6, which was tied to the system of Persson et al. (1998) from observations

– 8 –
on five photometric nights.11 We note that the LCO observations and Persson’s system of
standards rely on different J- and K-band filters than the broader-band filters used at YALO.
At LCO one uses a “Jshort” and “Kshort” filter. These are the very filters and telescope used
to establish the system of Persson et al. (1998), and by definition the color terms are zero.
The YALO data are systematically fainter than the LCO 1-m data by roughly 0.1 mag
at t = 20 d in the J- and H-bands, and also by 0.1 mag or more in J beyond t = 55
d, while there appear to be no significant differences in the K-band data. Can synthetic
photometry confirm that the YALO data are expected to be different at certain epochs for
J and H , while the K-band data need little correction beyond t = 20 d? To test this,
we constructed effective transmission profiles using the raw filter profiles, an atmospheric
transmission profile, quantum efficiency, and multiple applications of reflection and window
transmission in the optical paths. Then, using spectra of Vega, Sirius, and the Sun (see
Appendix A), we found that the synthetic infrared color terms for the YALO telescope
match observed ones to better than 0.m01 mag−1. This required no arbitrary shifting of the
filter transmission profiles.
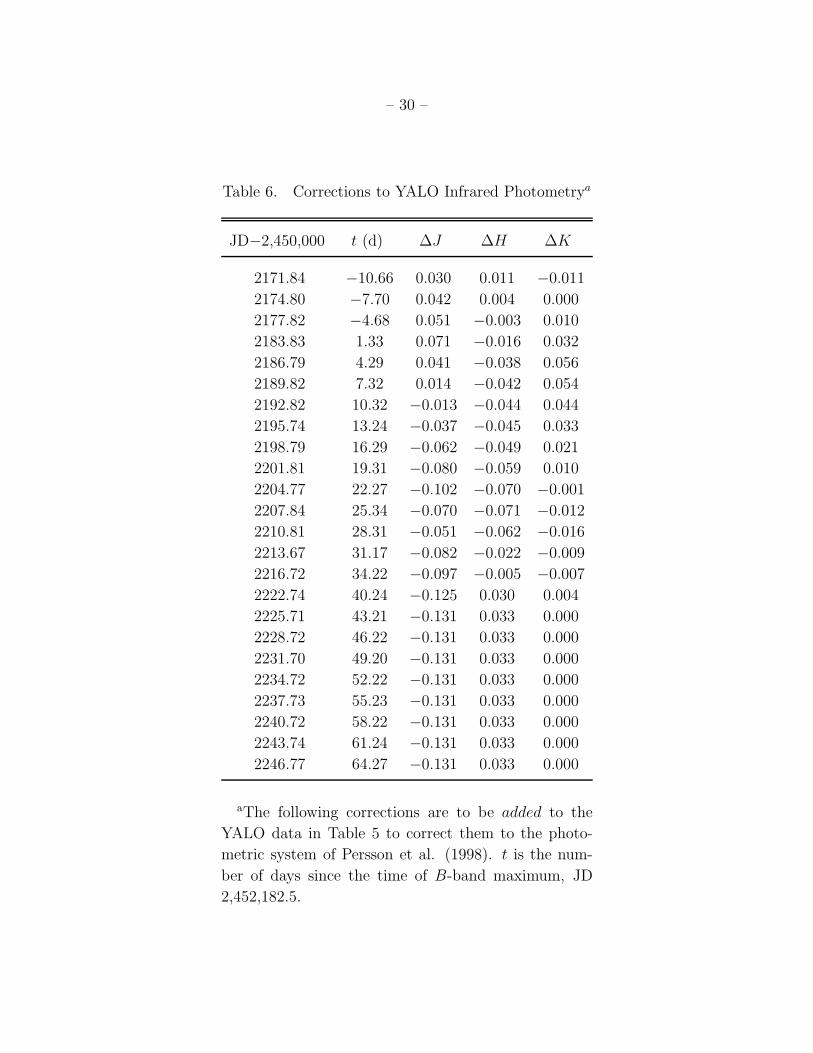
In Fig. 6 we show the derived photometric corrections to YALO data, based on spectra
of SN 1999ee, which would have to be added to YALO data to make them agree with
photometry obtained with the LCO 1-m. Under the assumption that these corrections are
applicable to SN 2001el, we give in Table 6 a set of corrections to YALO IR photometry.
We assume that the J- and H-band corrections at t = 43 d are appropriate until t = 64
d. Obviously, the two assumptions just made may be somewhat dubious. But consider the
IR light curves of SN 2001el shown in Fig. 7. By application of the corrections in Table 6,
we find that the J- and H-band data are in agreement within the internal errors now that
corrections up to 0.13 mag have been made. Since the corrections based on spectra of an
actual Type Ia SN are about the right size and are to be made in the right direction, we feel
confident that an application of these corrections is fully warranted for the IR data. Thus,
for the rest of this paper we include these corrections, and all analysis based on IR data uses
the corrected YALO data.
One curious thing about the H-band light curve is that SN 2001el was brighter at the
time of the second maximum (H = 12.97 at t = +22.2 d) than at the time of the first
maximum (H = 13.08 at t = −4.7 d). This is in agreement with the prediction of Krisciunas
et al. (2000, Fig. 13; Table 11) for Type Ia SNe with mid-range decline rates.
11The K-band magnitude of star 6 is based on data from only two photometric nights. We note that the
optical and infrared colors of this star are entirely consistent with it being a normal K2 III star (Cox 2000).
We do not suspect that it is variable.
– 9 –
Table 7 gives the maximum apparent UBV RIJHK magnitudes and the respective
times of maximum for SN 2001el. Note that within the uncertainties the time of maximum
light in the I, J, H , and K bands was the same, about 4.0 days before T(Bmax). This is
apparent visually by an inspection of Fig. 8, which also shows how the secondary hump or
shoulder in the light curve varies as a function of filter from V through K.
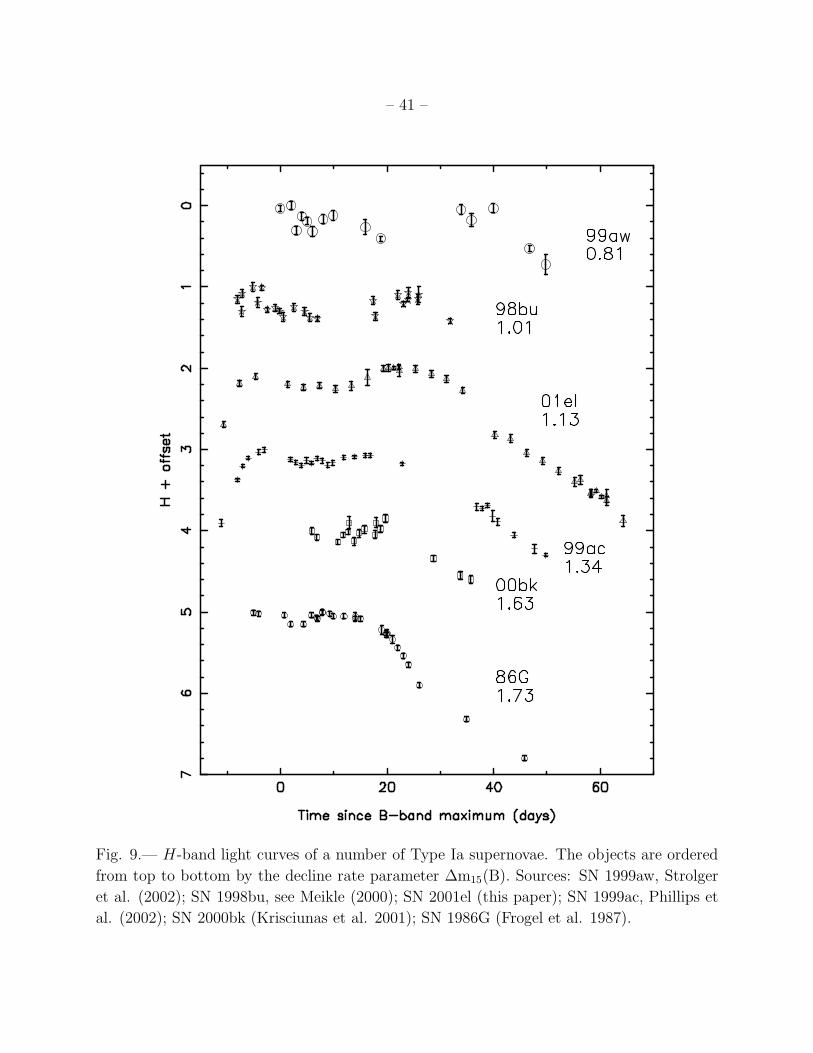
To compare SN 2001el with other supernovae, we show in Fig. 9 a stack of H-band light
curves ordered by the decline rate parameter ∆m15(B). Given the number of nights of SN
2001el photometry and the minimal gaps in the dataset, it is clear that the data presented
here are of high quality. Just as in the I-band, most Type Ia SNe exhibit a secondary hump
in H . However, the objects with the lowest values of ∆m15(B) seem to exhibit rather flat
light curves in the H-band for the first 40 days after T(Bmax). Unlike I-band light curves,
however, Type Ia SNe with large B-band decline rates (e.g. SN 2000bk) do not monotonically
decline after the time of maximum light.
3. Discussion
3.1. Optical Light Curves
The uncertainties given in Table 3 should be considered minimum values of the internal
errors (i.e. essentially based on photon statistics and the uncertainties of the zero points and
color corrections). A more honest measure of the internal errors can be obtained from higher
order polynomical fits to the light curves, filter by filter, under the assumption that the
supernova’s light varied smoothly with time. On this basis we believe that the uncertainties
of the U -band magnitudes in Table 3 are sensible as given. For B, V , R, and I, respectively,
we estimate that the internal errors are ± 0.016, 0.025, 0.029, and 0.047 mag, where the B
and V data include the filter corrections of Table 4.
According to Phillips et al. (1999) a typical Type Ia SN has a B-band decline rate
∆m15(B) = 1.1 mag. This parameter varies roughly from 0.75 (SN 1999aa; Krisciunas et al.
2000) to 1.94 mag (SN 1999da; Krisciunas et al. 2001). SN 2001el has ∆m15(B) = 1.13 ±
0.04 mag and is thus a mid-range decliner.
One of the characteristic features of the light curves of Type Ia SNe is the secondary
hump observed in the IJHK bands. To a lesser extent this can be seen as a “shoulder” in
the R-band, and sometimes even in the V -band light curves. Krisciunas et al. (2001, Fig.
17) took various well sampled I-band light curves, fitted polynomials to the data between 20
and 40 days after T(Bmax), using the flux at I-band maximum as the reference, and showed
that an integration of the I-band flux over this range correlated quite well with the B-band
– 10 –
decline rate. If we let X = 〈 I 〉20−40, we find that
∆m15(B) = 0.0035 + 17.475X − 47.838X2 + 35.618X3 , (8)
with a typical rms residual of ±0.093 mag in ∆m15(B).
Since the B-band decline rate is correlated with the intrinsic luminosity at maximum of
Type Ia SNe, therefore, this relationship implies that the strength of the I-band secondary
hump is also correlated with the intrinsic luminosity. We note two exceptions to Eqn. 8
above. SN 1992bc had a much weaker I-band secondary hump than expected on the basis
of its B-band decline rate, and SN 1994M had a much stronger I-band secondary hump.
SN 2001el had a mean flux over the time span 20 < t < 40 d of 0.594 ± 0.04 with
respect to the I-band maximum. On the basis of its B-band decline rate, we would have
predicted 〈 I 〉20−40 = 0.530. Thus, it has a slightly stronger than “normal” I-band secondary
hump, but well within the uncertainty of the relationship given above.
3.2. Spectra
Regarding the spectrum of SN 2001el, Sollerman et al. (2001) note that the 612 nm
Si II absorption line appeared flat-bottomed. Interstellar absorption lines of Ca H and K,
and the D lines of Na I were observed at the redshift of NGC 1448. Wang et al. (2001)
describe spectropolarimetry of SN 2001el on 26 Sept 2001 UT (JD = 2,452,178.5; t = −4.0
d), finding that SN 2001el had a normal spectrum similar to that of SN 1994D except for
a strong double-troughed absorption feature around 800.0 nm. The absorption dips of Si II
(635.5, 564.0 nm) and Fe II (492.4, 516.9 nm) all showed velocities of about 10,000 km s−1.
Ca II lines (the “infrared triplet”) were present in the spectrum at a velocity comparable
to that of the Si II 635.5-nm feature but were much weaker than an absorption feature at
800.0 nm. It is possible that the 800-nm feature was a second component of high-velocity
Ca II, as suggested by Hatano et al. (1999) to explain a similar (but much weaker) feature
in SN 1994D; if this identification is correct, then this Ca II feature was due to a detached
shell/clump with a relative velocity of roughly 23,000 km s−1.
Wang et al. (2002) also obtained spectropolarimtery of SN 2001el on 1, 10, 18 October
and 9 November 2001 UT. Their data indicate, among other things, that the value of RV ≡
AV / E(B − V ) = 2.88 ± 0.15, somewhat less than the standard Galactic value of 3.10
(Sneden et al. 1978; Rieke & Lebofsky 1985). From their spectra the interstellar Na I line
has an equivalent width of 0.47 A. From Fig. 4 of Barbon et al. (1990) this corresponds to
– 11 –
a color excess E(B − V ) ≈ 0.m12. However, the uncertainty of this number is greater than
or equal to 0.m10. We believe that the most accurate estimate of E(B − V ) is obtained from
a combination of optical and infrared photometry (see below).
The HST spectra provided by Nugent for purposes of determining filter corrections and
comparing synthetic photometry to our data were obtained on 29 October, 6, 13, 20, 26
November, and 4 December 2001 UT. These spectra will be discussed in a subsequent paper.
3.3. Reddening and Implied Extinction
From an analysis of SNe 1992A, 1992bc, 1992bo, and 1994D Lira (1995) found a uniform
color evolution for unreddened B−V colors of Type Ia SNe from 30 to 90 days after V -band
maximum. Phillips et al. (1999) used Lira’s relation to get an estimate of the color excess
for the tail of the B−V colors of the SNe they analyzed. A majority of SNe analyzed by Jha
(2002, §4.2.3) show that the Lira relation works very well to describe the late time B − V
color evolution of unreddened Type Ia SNe. In Fig. 10 we show the B − V colors of SN
2001el, with and without the filter corrections given in Table 4. Given that the Lira relation
was based on observations with the CTIO 0.9-m telescope, we clearly want to correct the
YALO data to the CTIO 0.9-m system so as to derive E(B − V )tail (see below) using the
same zeropoint for the Lira relation.
In Table 8 we give the color excesses for SN 2001el based on a variety of indices.
Following the analysis of Phillips et al. (1999), we give the B − V color excess as implied
from the photometry at maximum light, the V − I color excess at maximum, and the B −V
color excess from the photometry for t > 32 d. The three estimates of AV that result
are in reasonable agreement, but only if we correct the B − V colors for filter differences.
A weighted B − V color excess is E(B − V )avg = 0.206 ± 0.046 mag for the host galaxy
reddening. The small contribution of Galactic dust reddening is E(B − V ) = 0.014 mag
(Schlegel et al. 1998), indicating a small Galactic contribution to AV amounting to 0.043
mag. Adopting RV = 2.88 ± 0.15 from Wang et al. (2002) for the host galaxy, the estimated
total extinction based on optical photometry alone is AV = 0.64 ± 0.14 mag.
As is well known, interstellar extinction in the near-infrared is an order of magnitude
lower than in the V -band. If there exists a color index such as V −K which is “well behaved”
for some range of decline rates of Type Ia SNe, then a V − K color excess, for example, is
almost a direct measure of the V -band extinction. We shall adopt Rieke & Lebofsky’s (1985)
values of Aλ / AV = 0.282, 0.175, and 0.112 for the J-, H-, and K-bands, respectively, and
assign an uncertainty of 20 percent to each ratio. It follows that AV = (1.393 ± 0.110)
– 12 –
E(V − J) = (1.212 ± 0.052) E(V − H) = (1.126 ± 0.028) E(V − K). In other words, if we
can estimate a color excess in V − K, AV numerically is only 10 to 15 percent greater than
that color excess.
Krisciunas et al. (2000, 2001) showed that over a range of decline rates (0.87 < ∆m15(B)
< 1.28) Type Ia SNe exhibit uniform V minus near-IR color curves from −9 ≤ t ≤ +27
d. V − K colors were particularly well behaved, and over the widest range of decline rates.
However, on the basis of a small number of data points per object they could not justify
fitting the V − H or V − K colors by anything more sophisticated than two straight lines.
The V − J colors were fitted with a second order curve for −9 ≤ t ≤ +9.5 d, while a linear
fit was used for +9.5 ≤ t ≤ +27 d.
From the well sampled V minus near-IR color curves of SNe 1999ac and 2001el we now
know that there is no abrupt change of the color evolution one week after T(Bmax). Thus we
feel justified in fitting a higher order curve to the data of eight mid-range decliners studied
by Krisciunas et al. (2000) to give more realistic unreddened color loci.
In Fig. 11 we show the V minus near-IR colors of SN 2001el, along with loci derived
from SNe 1972E, 1980N, 1983R, 1999cp, 1981B, 1981D, 1998bu, and 1999cl, adjusted in the
ordinate direction so as to minimize the reduced χ2 of the fits. The shape of the V − K
locus matches the data of SN 2001el very well (with χ2ν = 0.76). The V −H and V − J loci
match the data of SN 2001el well only from +10 . t . +20 d.
In Table 8 we also give the color excesses and values of AV derived from V JHK pho-
tometry. Within the errors these estimates of AV are in agreement with the value derived
from optical photometry alone. The weighted mean from the V minus near-IR colors and
E(B − V )avg is AV = 0.57 ± 0.05 mag.12 The use of optical and infrared data results in a
smaller statistical uncertainty for the extinction. Though the filter corrections adopted for
the BV JHK photometry are only approximate (±0.02 mag), we feel that the consistency of
the various estimates of AV is facilitated by the adoption of the filter corrections. While the
calculation of such corrections is time consuming because of its iterative nature, this extra
work will likely become a standard part of the production of high quality SN light curves.
12The various estimates of AV are only semi-independent, as all rely on the V -band photometry. However,
we believe that our V -band photometry suffers from no serious systematic errors.
– 13 –
3.4. Theoretical V minus IR Color Curves
Model calculations for the explosion, light curves and spectra of typical Type Ia SNe
indicate that there exists a physical basis for well behaved optical versus infrared color
relationships (Hoflich 1995, Wheeler et al. 1998). What we see as a supernova event is
the light emitted from a rapidly expanding envelope. Due to the increasing geometrical
dilution, deeper layers of the envelope become exposed with time. Until about maximum
light, the spectra are formed in the regions which have undergone incomplete Si-burning.
During this period both the fluxes in the V - and K-bands are mainly determined by the
free-free/bound-free opacities and Thomson scattering and the source functions, i.e. the
temperature evolution at the photosphere which is rather insensitive to the total luminosity
because of the steep dependence of the opacity on the temperature (Hoflich et al. 1993).
Starting a few days before maximum light, the V -band flux reflects the evolution of the
luminosity. Around the same time, the Fe/Ni core becomes exposed, and broad emission
features due to iron group elements occur in the H− and K-bands (Wheeler et al. 1998)
which determine the flux. They are in emission because the IR source functions are close
to thermal and the optical depth is large, i.e. they are formed well above the photosphere
close to the outer edge of the Fe/Ni core. With time, the optical photosphere receeds in
mass. Thus, the emission features in the K-band increase in strength while the V -band flux
decreases, leading to V − K colors that get redder for some time. Once the SNe enter the
nebular stage there should be a spread in V −K color curves for different objects, even if they
have the same decline rate. The V −K color curve should be reasonably model-independent
(i.e. whether the explosion is due to deflagration or a delayed detonation should not matter
significantly) because, virtually, the entire K-band is dominated by the iron feature.
The V − J and V − H color curves would not be as well behaved because the J- and
H-bands cover spectral regions which are affected both by the IR-emission features and the
continua. The fractional contribution depends on the Doppler shift of the chemical layers
and, thus, it depends on the details of the nuclear burning. Note that for very subluminous
Type Ia SNe (e.g. SN1999by), the V −K evolution after maximum light is delayed because
the Fe/Ni core is explosed only two weeks after maximum (Hoflich et al. 2002).
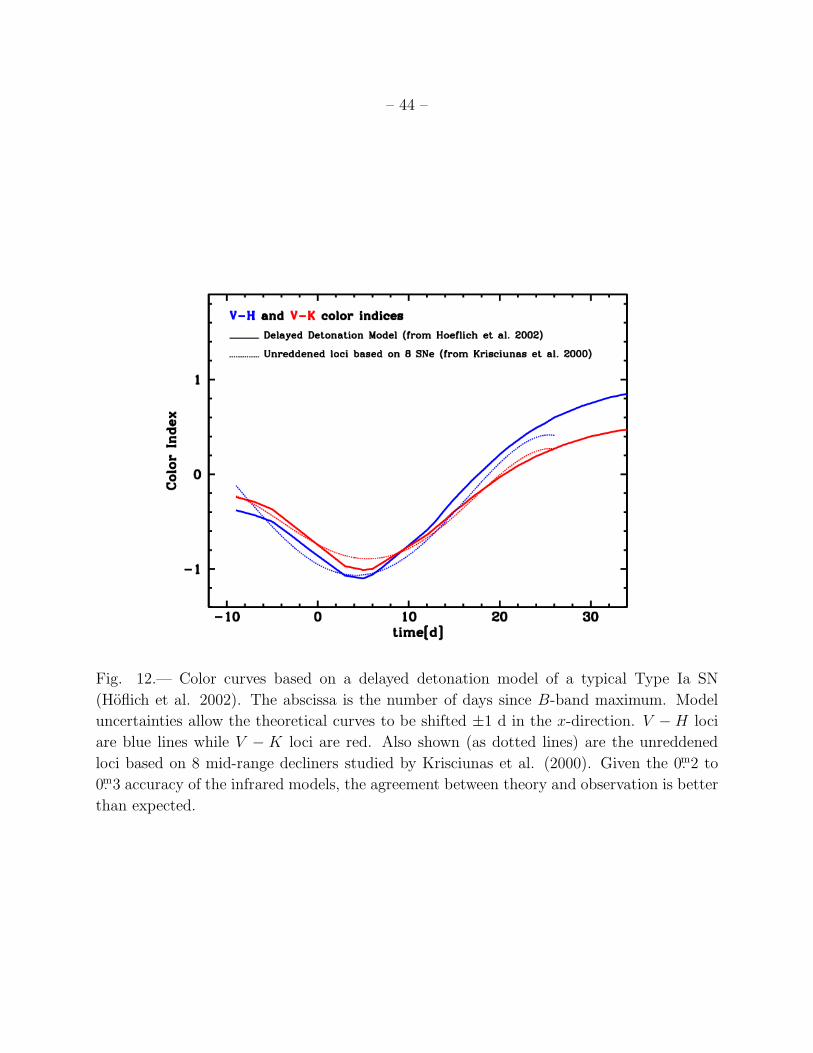
In Fig. 12 we show the V −H and V −K color curves for a delayed detonation model
of a “Branch-normal” Type Ia SN (model 5p028z22.23 of Hoflich et al. 2002). To derive
synthetic magnitudes we used the V -band filter profile of Bessell (1990) and the H and
Kshort filter profiles of Persson et al. (1998), along with appropriate quantum efficiency and
atmospheric transmission functions. The fluxes were normalized to the spectra of Vega given
by Castelli & Kurucz (1994) and assumed V − H and V − K = 0.00. For comparison we
show the unreddened loci based on the 8 SNe studied by Krisciunas et al. (2000). The color

– 14 –
indices are well reproduced within the model uncertainties of ≈ 0.m2 to 0.m3. We note that
our delayed detonation model gives t(Vmax) −t(Bmax) = 1.1 d, which is smaller than the
nominal value of 1.7 to 2.0 d. A shift of the theoretical V minus infrared color curves by
±1 d is within the uncertainties. Likewise, from data on any given SN, the time of B-band
maximum is rarely known to better than ±0.5 d, so the observed colors can be shifted in
the time direction as well.
The colors have been calculated by our spherical NLTE light curve code which uses
about 500 depths, 3000 frequency points and 50 NLTE-superlevels. A comparison with
detailed NLTE-spectral calculations shows that the reduction of atomic levels and frequencies
produces uncertainties of ≈ 0.m2 to 0.m3 in H and K. However, the small number of frequencies
is responsible for the failure to properly reproduce V −J , especially after the time of B-band
maximum when the flux varies strongly within the J band (a factor of ≈ 10; Wheeler et al.
1998). As a result, we do not show our theoretical V − J curve.
3.5. Distance
NGC 1448, the host of SN 2001el, has not been the target of study for determining its
distance via surface brightness fluctuations (SBF) or Cepheids. Since it is a spiral galaxy
inclined to the line of sight, one can derive a Tully-Fisher (TF) distance to it. Mathewson
& Ford (1996) give the following parameters: velocity width V20 = 208 km s−1, inclination
angle i = 88o, integrated extinction-corrected I-band magnitude 9.44. Using the I-band
Tully-Fisher calibration of Sakai et al. (2000), W20 = 2 V20, and a slight correction for the
inclination angle of the galaxy and its redshift, we find WC20 = 414.6 km s−1. It follows that
the absolute I-band magnitude of NGC 1448 MI = −22.21 and the distance modulus is 31.65
mag. Giovanelli et al. (1997) indicate that the uncertainty of a single TF distance is roughly
± 0.35 mag. The TF distance of NGC 1448 is therefore 21.4+3.7−4.2 Mpc.
We note that H-band and K-band light curves of many Type Ia SNe are reasonably
flat at t ≈ +10 d. We assume, then, that this is a “well behaved” part of the light curves.
The J-band light curves, by contrast, exhibit rapidly changing flux at this epoch.
In Fig. 13 we show the absolute magnitudes at BV I maximum light and absolute
H-band magnitudes at t = +10 d versus the decline rate parameter ∆m15(B). Some of
the data shown are derived using Cepheid distances to host galaxies, surface brightness
fluctuations, the planetary nebula luminosity function method, or the “tip of the red giant
branch” method, assuming the Cepheid distance scale adopted by Freedman et al. (2001).
Other data for galaxies in the Hubble flow (i.e. with redshifts greater than 3000 km s−1)

– 15 –
are derived assuming H0 = 74 km s−1 Mpc−1. In all four bands the absolute magnitude is
reasonably constant for 0.87 < ∆m15(B) < 1.30. For 9 SNe which satisfy this criterion we
find a weighted mean H-band absolute magnitude at t = +10 d of MH(t=10) = −17.91 ±
0.05.
From an interpolation of the corrected YALO data for SN 2001el we estimate that at t
= +10 d H = 13.228 ± 0.04. Adopting an extinction of AH = 0.10 mag and the absolute
magnitude just given, we obtain a distance modulus of 31.04 mag with an uncertainty of ±
0.14. The corresponding distance is 16.1 ± 1.1 Mpc.
Using the method of Phillips et al. (1999), the BV I optical photometry gives a distance
modulus of m−M = 31.29 ± 0.08 mag. This is on the Cepheid distance scale adopted by
Freedman et al. (2001). The corresponding distance is 17.9 ± 0.8 Mpc.
With a distance somewhere in the range 16.1 to 21.4 Mpc, NGC 1448 is clearly near
enough for a determination of its distance via Cepheids.
4. Conclusions
Perhaps the most significant finding of this paper is that we were able to calculate
corrections to BV and infrared photometry, based on synthetic photometry, but using spectra
of actual supernovae, that to some extent eliminated systematic differences in the data
obtained on different telescopes with different physical detectors and filters. Under the
assumption that the infrared spectrum of SN 2001el was like that of SN 1999ee, and that
it evolved similarly with time, we derived corrections to YALO IR photometry which had
the right size and were to be applied in the right direction to bring the YALO data fully
onto the system of Persson et al. (1998), and in agreement with the data taken with the
LCO 1-m telescope. Though it is known that the spectrum of a SN is not like that of
a star, especially once the SN enters the nebular phase (t & 30 d), such corrections have
been ignored in the past because we simply did not have enough spectra and photometry to
confirm to what degree synthetic photometry gives the right results. Clearly, not all optical
response functions are well-known. Further information (e.g. the effect of the YALO dichroic
on the optical transmission) is needed to make analogous corrections to the RI data.
Another significant result of this paper is the excellent agreement between theoretical
V −H and V −K color curves with the unreddened loci based on 8 SNe studied by Krisciunas
et al. (2000). This gives us further confidence that there exist “uniform” color curves for
Type Ia SNe with mid-range decline rates, which can be used to derive accurate values of
the total extinction suffered by the light of such objects. A comparison of theoretical color
– 16 –
curves with observational data, covering the full range of decline rates of Type Ia SNe, is
beyond the scope of the present paper.
Given the importance of SNe in modern cosmological studies, it is worth our while to
investigate the uniformity of behavior of as many nearby SNe as we can. Though the light
curves of SN 2001el are quite normal, we note that the observed B − V color 3 to 4 days
before T(Bmax) was slightly negative. Given the extinction along the line of sight, the color
excess E(B − V ) must be about 0.m20. Thus, the dereddened color shortly before T(Bmax)
was B − V ≈ −0.22, which is extremely blue. The second H-band maximum at t = +22.2
d was 0.1 mag brighter than the first H-band maximum at t = −4.7 d. This is consistent
with a prediction of Krisciunas et al. (2000) based on an analysis of other Type Ia SNe with
mid-range decline rates, but not all H-band light curves of mid-range decliners show this.
On the basis of the optical and IR photometry we derive AV = 0.57 ± 0.05 mag.
Given the small formal uncertainty in AV , we can state that the uncertainty in the distance
estimate to SN 2001el and its host is not due to the extinction along the line of sight. Given
the attention we have paid to possible sources of systematic error in the UBV RIJHK
photometry and the good coverage of the light curve, we hope that photometry of SN 2001el
can serve as a template for studies of other Type Ia SNe.
With a distance in the range 16.1 to 21.4 Mpc, the host galaxy of SN 2001el is close
enough for its distance to be determined by means of Cepheids. Given the small number of
nearby galaxies which have hosted SNe and also had their distances determined via Cepheids,
we suggest that NGC 1448 be a future target for such observations with HST.
It is worth (re-)stating that (for the forseeable future) high redshift SNe will only be
observed in rest frame optical bands, because we do not yet have infrared detectors sensitive
enough, even with an 8-m class telescope, to detect these objects in the rest frame IR bands.
This is unfortunate, as it is becoming increasingly clear that a combination of optical and
infrared photometry of Type Ia SNe allows us to get a better handle on the host extinction
suffered by these objects. Since the advocacy of a non-zero cosmological constant based
on supernova studies hinges on the systematic faintness of objects in the redshift range
0.2 < z < 0.8, we want to minimize as well as possible the effect of systematic errors in
distances to these most important cosmological beacons.
We thank STScI for the following support: HST GO-07505.02-A, HST-GO-08641.07-A,
HST-GO-8177.06 (the High-Z Supernova Team survey) and HST-GO-08648.10-A (the SInS
collaboration). We thank Peter Nugent for providing HST spectra in advance of publication;

– 17 –
support for HST proposal #8611 was provided by NASA through a grant from the Space
Telescope Science Institute, which is operated by the Association of Universities for Research
in Astronomy, Inc., under NASA contract NAS5-26555.
Eric Persson provided much necessary information for the calculation of the infrared
filter corrections. We also thank Mario Hamuy for useful discussions; Lifan Wang for sharing
data ahead of publication; and Michael Merrill for his telluric atlas. AUL acknowledges sup-
port from NSF grant AST0097895. Useful information was obtained from the NASA/IPAC
Extragalactic Database.
A. Spectra for Synthetic Photomery
The near-infrared photometry required an estimate of the theoretical color terms for
the various natural systems. There is no grid of spectrophotometric standards in the near-
infrared comparable to what is available in the optical. As a simple guide to color terms,
we have chosen to use synthetic photometry based on the Sun, Vega, and Sirius. This color
range generally encompasses the photometric standards (Persson et al. 1998) used in our
study. All spectrophotometric data were convolved 2 A and sampled it at 1 A per pixel. The
spectrophotometric models did not include atmospheric absorption. Rather, we added the
telluric absorption to the tranmissions functions used to calculate the synthetic photometry.
The adopted photometry was taken from the discussion in Bessell et al. (1998).
A.1. The Sun
The solar spectrophotometry is a combination of observed solar fluxes and models. We
chose the solar model from the Kurucz website (see also Fontenla et al. 1999) as (Teff , log g,
vmicro, mixing length/scale height) = (5777 K, 4.438, 1.5 km s−1, 1.25). The Kurucz model
reproduces the Kitt Peak Solar Flux Atlas (Kurucz et al. 1984). In the near-infrared, we
have inserted the Livingston & Wallace (1991) observed spectra, which were scaled to the
continuum of the Kurucz model.
A.2. Vega
The Vega spectrophotometry is a combination of empirical data and model data. The
fundamental flux calibration in the optical comes from Hayes (1970, 1985), Oke & Schild
(1970), and Tug (1980). We have adopted the model “veg090250000p.asc5” from the website

– 18 –
of Kurucz. This model corresponds to the physical parameters (Teff , log g, [M/H], vmicro,
vmacro) = (9550 K, 3.950, −0.5, 2 km s−1, 0 km s−1) which is the model adopted by Bessell
et al. (1998). This model was then scaled from the calculated Eddington fluxes corrected to
an angular size 3.24 ± 0.07 mas (Code et al. 1976).
We then compared this scaled model to the Hayes (1985) fluxes of Vega in the wave-
length region 4000-8000 A and found that the model needed to be scaled to 3.26 mas, in
agreement with the conclusions of Bessell et al. (1998). At the extremes of the measured
data the models did not fit well. We needed to scale the model by 0.972 at 3300 A and 1.009
at 10500 A to fit the Hayes points.
The final semi-empirical spectrophotometric model of Vega was created by using the
Hayes (1985) points from 3300-10500 A, the Kurucz model scaled by 0.972 below 3300 A,
and the Kurucz model scaled by 1.009 above 10500 A. A more complete discussion of the
range in models of Vega can be found in Cohen et al. (1999) and Bessell et al. (1998).
A.3. Sirius
For Sirius we have adopted the model“sir.ascsq5” from the Kurucz website which was
run with the physical parameters (Teff , log g, [M/H], vmicro) = (9850 K, 4.30, +0.4, 0 km
s−1). This is very similar to the model used by Cohen et al. (1999). We scaled the model
from the Eddington fluxes to observed fluxes assuming an angular diameter of 5.89 mas
(Code et al. 1976). It was found, however, that this did not reproduce the observed V mag
of Sirius from Ian Glass as quoted in Bessell et al. (1998). The final fluxes were scaled by
1.049 to force V = −1.43.
B. Filter Shifts for Synthetic Photometry
Synthetic photometry uses spectra of spectrophotometric standards, filter and atmo-
spheric transmission curves to derive broad band magnitudes of the standards. These should
give photometric color terms that match the color terms derived from actual photometry of
stars. However, we find that the filter profiles must be shifted in order to match the synthetic
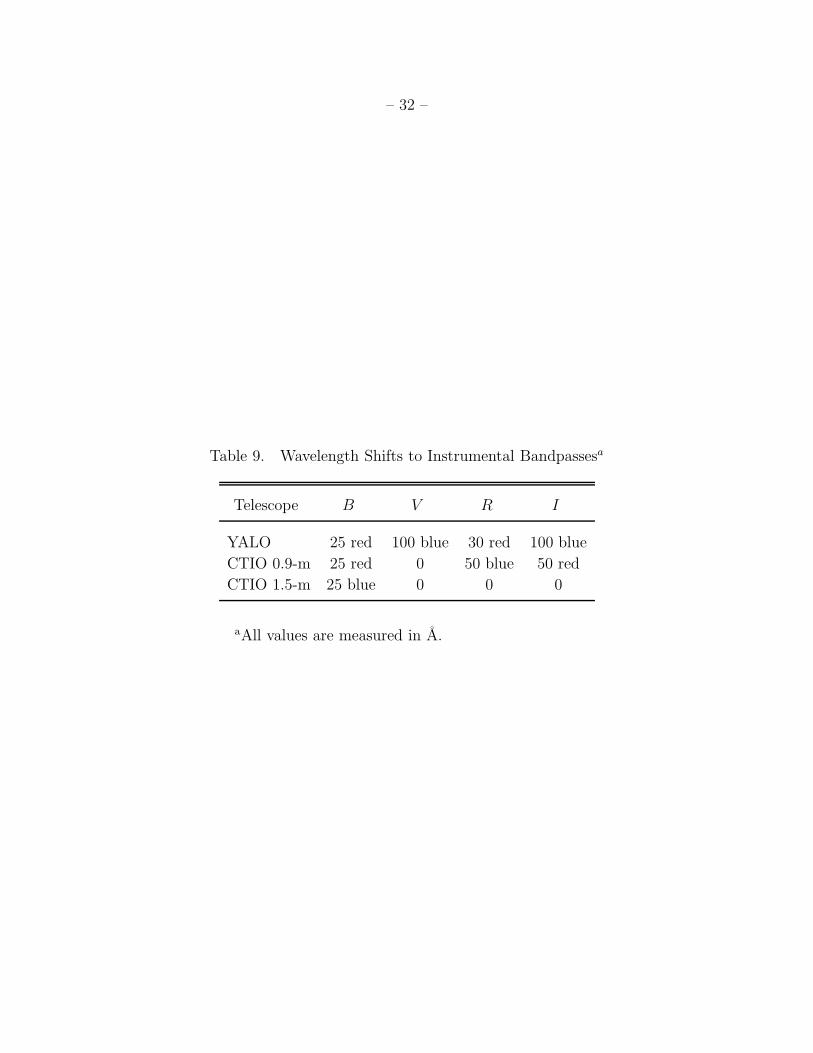
color terms with the observed values. In Table 9 we give the filter shifts adopted to place
optical photometry on the Bessell (1990) system.
We found that no shifts needed to be applied for the infrared photometry (YALO versus
LCO 1-m).
– 19 –
We note that the R-band filter used by Stritzinger et al. (2002) for their YALO ob-
servations was a very wide non-standard filter. Our observations were made with a much
narrower, more standard filter.
We also note that Stritzinger et al. (2002) found a filter shift of only 10 A for the YALO
I-band filter, compared to our value of 100 A. Their color terms for YALO photometry were
based on the photometric sequence of SN 1999ee, rather than Landolt standards, as were
ours, and their I-band color term has a size half as large as ours. Our filter shift would be
comparable to theirs for identical color terms.
As stated above, since the YALO and Landolt R-band data agree, on average, at the
0.m01 level, there is no great motivation to apply R-band filter corrections. If we did so, it
would produce systematic differences at the 0.m04 level. We do have a motivation to resolve
systematic differences in I-band photometry, but we do not have spectra of SN 2001el at the
appropriate epochs to make these corrections directly. Assuming that the spectra of SNe
1999ee and 2001el are the same in the I-band would give us filter corrections that would
make the photometry nearly 0.m20 different (YALO vs. Landolt) at t = 16 d. We suspect
that a significant unknown is the effect of the YALO dichroic on the actual R- and I-band
filter functions.
REFERENCES
Barbon, R., Benetti, S., Rosino, L., Cappellaro, E., & Turatto, M. 1990, A&A, 237, 79
Bessell, M. S. 1990, PASP, 102 118
Bessell, M. S., Castelli, F., & Plez, B. 1998, A&A, 333, 231
Bessell, M. S., Castelli, F., & Plez, B. 1998, A&A, 337, 321 (erratum)
Castelli, F., & Kurucz, R. L. 1994, A&A, 281, 817
Code, A. D., Bless, R. C., Davis, J., & Brown, R. H. 1976, ApJ, 203, 417
Cohen, M., Walker, R. G., Carter, B., Hammersley, P., Kidger, M., & Noguchi, K. 1999, AJ,
117, 1864
Cox, A. N., ed. 2000, Allen’s Astrophysical Quantities, 4th ed., pp. 152,388
Elias, J. H., Frogel, J. A., Hackwell, J. A., & Persson, S. E. 1981, ApJ, 251, L13
Elias, J. H., Matthews, G., Neugebauer, G., & Persson, S. E. 1985, ApJ, 296, 379
– 20 –
Fontenla, J., White, O. R., Fox, P. A., Avrett, E. H., & Kurucz, R. L. 1999, ApJ, 518, 480
Freedman, W., et al. 2001, ApJ, 553, 47
Frogel, J. A., Gregory, B., Kawara, K., Laney, D., Phillips, M. M., Terndrup, D., Vrba, F.,
& Whitford, A. E. 1987, ApJ, 315, L129
Giovanelli, R., Haynes, M. P., Herter, T., Vogt, N. P., da Costa, L. N., Freudling, W., Salzer,
J. J., & Wegner, G. 1997, AJ, 113, 53
Hamuy, M., Walker, A. R., Suntzeff, N. B., Gigoux, P., Heathcote, S. R., & Phillips, M. M.
1992, PASP, 104, 533
Hamuy, M., Suntzeff, N. B., Heathcote, S. R., Walker, A. R., Gigoux, P., & Phillips, M. M.
1994, PASP, 106, 566
Hamuy, M. et al. 2002, AJ, in press (astro-ph/0203491)
Hatano, K., Branch, D., Fisher, A., Baron, E., & Filippenko, A. V. 1999, ApJ, 525, 881
Hayes, D. S. 1970, ApJ, 159, 165
Hayes, D. S. 1985, IAU Symp. 111: Calibration of Fundamental Stellar Quantities, 111, 225
Hoflich, P. 1995, ApJ, 443, 89
Hoflich, P., Muller, E., & Khokhlov, A. 1993, A&A, 268, 570
Hoflich, P., Gerardy, C., Fesen, R., & Sakai, S. 2002, ApJ, 568, 791
Jha, S. 2002, Dissertation, Harvard University
Krisciunas, K., Hastings, N. C., Loomis, K., McMillan, R., Rest, A., Riess, A. G., & Stubbs,
C. 2000, ApJ, 539, 658
Krisciunas, K., Phillips, M. M., Stubbs, C., et al. 2001, AJ, 122, 1616
Kurucz, R. L., Furenlid, I., Brault, J., & Testerman, L., eds. 1984, Solar Flux Atlas from
296 to 1300 nm, National Solar Observatory Atlas No. 1, 2nd ed.
Landolt, A. U. 1992, AJ, 104, 340
Lira, P. 1995, Master’s thesis, Univ. of Chile
Livingston, W. & Wallace, L. 1991, NSO Technical Report, Tucson: National Solar Obser-
vatory, National Optical Astronomy Observatory

– 21 –
Mathewson, D. S., & Ford, V. L., 1996, ApJS, 107, 97
Meikle, W. P. S. 2000, MNRAS, 314, 782
Monard, L. A. G. 2001, IAUC No. 7720
Oke, J. B. & Schild, R. E. 1970, ApJ, 161, 1015
Perlmutter, S., et al. 1997, ApJ, 483, 565
Perlmutter, S., et al. 1999, ApJ, 517, 565
Persson, S. E., Murphy, D. C., Krzeminski, W., Roth, M., & Rieke, M. J. 1998, AJ, 116,
2475
Phillips, M. M. 1993, ApJ, 413, L105
Phillips, M. M., Lira, P., Suntzeff, N. B., Schommer, R. A., Hamuy, M., & Maza, J. 1999,
AJ, 118, 1766
Phillips, M. M., et al. 2002, AJ, in prepration
Rieke, G. H., & Lebofsky, M. J. 1985, ApJ, 288, 618
Riess, A. G., Press, W. H., & Kirshner, R. P. 1996, ApJ, 473, 88
Riess, A. G., Filippenko, A. V., Challis, P., et al. 1998, AJ, 116, 1009
Sakai, S., et al. 2000, ApJ, 529, 698
Schlegel, D. J., Finkbeiner, D. P., & Davis, M. 1998, ApJ, 500, 525
Sneden, C., Gehrz, R. D., Hackwell, J. A., York, D. G., & Snow, T. P. 1978, ApJ, 223, 168
Sollerman, J., Leibundgut, B., & Lundqvist, P. 2001, IAUC No. 7723
Stetson, P. 1987, PASP, 99, 191
Stetson, P. 1990, PASP, 102, 932
Stritzinger, M., et al. 2002, AJ, in press (astro-ph/0206438)
Strolger, L.-G., Smith, R. C., Suntzeff, N. B., et al. 2002, AJ, in press (astro-ph/0207409)
Suntzeff, N. B., Phillips, M. M., Covarrubias, R., et al. 1999, AJ, 117 1175

– 22 –
Suntzeff, N. B. 2000, in Cosmic Explosions, ed. S. S. Holt & W. W. Zhang (Melville, New
York: American Institute of Physics), AIP Conf. Proc. 522, 65
Tug, H. 1980, A&A, 82, 195
Wang, L., Kasen, D. N., Baade, D., et al. 2001, IAUC No. 7724
Wang, L., et al. 2002, in press
Wheeler, J. C., Hoflich, P., Harkness, R. P., & Spyromilio, J. 1998, ApJ, 496, 908
This preprint was prepared with the AAS LATEX macros v5.0.

– 23 –
Table 1. Optical Photometric Sequence near SN 2001el
Star ID α (2000) δ (2000) V B − V V − R V − I
SN 3:44:30.6 −44:38:24 ... ... ... ...
1a 3:44:37.7 −44:39:34 12.736 (0.002) 0.621 (0.003) 0.372 (0.002) 0.747 (0.004)
1b ... ... 12.739 (0.003) 0.623 (0.006) 0.367 (0.002) 0.738 (0.002)
2a 3:44:30.4 −44:40:36 15.377 (0.002) 1.086 (0.009) 0.666 (0.003) 1.221 (0.005)
5a 3:44:21.8 −44:38:38 15.913 (0.002) 0.965 (0.010) 0.532 (0.004) 0.986 (0.005)
6a 3:44:26.3 −44:38:40 15.756 (0.002) 1.132 (0.013) 0.675 (0.006) 1.236 (0.004)
7a 3:44:29.5 −44:37:29 14.524 (0.002) 0.836 (0.005) 0.487 (0.002) 0.932 (0.005)
aBased on 5 nights of CCD photometry with YALO. bThe second set of values is based on 7
nights of single-channel photoelectric photometry by Landolt, who also obtained U −B = +0.049
± 0.012 for this star.
Table 2. Infrared Photometric Sequence near SN 2001ela
Star IDb J H K
5 14.260 (0.042) 13.739 (0.029) 13.727 (0.021)
6 13.745 (0.009) 13.163 (0.004) 13.017 (0.026)
7 13.302 (0.043) 13.170 (0.146) 13.194 (0.041)
aBased on 5 nights of J-band calibration with the LCO 1-m
telescope, 4 nights in H , and 2 nights in K. bThe identifica-
tions are the same as those in Table 1 and Fig. 1.

–24
–
Table 3. UBVRI Photometry of SN 2001el
JD−2,450,000 UT DateaU B V R I Observer+Telescope
2171.85 Sep19.35 14.075 (0.013) 13.808 (0.009) 13.711 (0.016) 13.742 (0.015) Espinoza+YALO
2174.81 Sep22.31 13.407 (0.012) 13.258 (0.008) 13.111 (0.015) 13.120 (0.014) Espinoza+YALO
2177.84 Sep25.34 13.032 (0.015) 12.927 (0.010) 12.768 (0.024) 12.838 (0.016) Espinoza+YALO
2178.82 Sep26.32 12.753 (0.045) 12.932 (0.023) 12.899 (0.014) Arenas+CTIO 0.9-m
2179.81 Sep27.31 12.708 (0.043) 12.887 (0.026) 12.868 (0.015) Arenas+CTIO 0.9-m
2183.84 Oct01.34 12.871 (0.019) 12.686 (0.010) 12.622 (0.045) 12.885 (0.016) D. Gonzalez+YALO
2183.86 Oct01.36 12.765 (0.027) 12.850 (0.013) 12.753 (0.008) Arenas+CTIO 0.9-m
2184.88 Oct02.38 12.824 (0.029) 12.867 (0.013) 12.755 (0.007) Arenas+CTIO 0.9-m
2186.80 Oct04.30 12.966 (0.009) 12.724 (0.004) 12.624 (0.009) 12.954 (0.008) Espinoza+YALO
2189.74 Oct07.24 13.418 (0.019) 13.157 (0.014) 12.810 (0.013) 12.729 (0.015) 13.115 (0.015) Landolt+CTIO 1.5-m
2189.76 Oct07.26 13.392 (0.019) 13.160 (0.014) 12.812 (0.013) 12.730 (0.015) 13.119 (0.015) Landolt+CTIO 1.5-m
2189.83 Oct07.33 13.193 (0.007) 12.784 (0.004) 12.738 (0.010) 13.073 (0.008) Espinoza+YALO
2189.85 Oct07.35 13.428 (0.019) 13.171 (0.014) 12.831 (0.013) 12.736 (0.015) 13.113 (0.015) Landolt+CTIO 1.5-m
2190.72 Oct08.22 13.507 (0.019) 13.230 (0.014) 12.834 (0.013) 12.772 (0.015) 13.211 (0.015) Landolt+CTIO 1.5-m
2190.85 Oct08.35 13.545 (0.019) 13.266 (0.014) 12.859 (0.013) 12.798 (0.015) 13.207 (0.015) Landolt+CTIO 1.5-m
2191.72 Oct09.22 13.643 (0.019) 13.331 (0.014) 12.879 (0.013) 12.835 (0.015) 13.240 (0.015) Landolt+CTIO 1.5-m
2191.85 Oct09.35 13.669 (0.019) 13.353 (0.014) 12.901 (0.013) 12.864 (0.015) 13.278 (0.015) Landolt+CTIO 1.5-m
2192.83 Oct10.33 13.453 (0.016) 12.906 (0.011) 12.909 (0.018) 13.259 (0.016) D. Gonzalez+YALO
2192.85 Oct10.35 13.765 (0.019) 13.425 (0.014) 12.924 (0.013) 12.902 (0.015) 13.331 (0.015) Landolt+CTIO 1.5-m
2193.72 Oct11.22 13.881 (0.019) 13.542 (0.014) 12.981 (0.013) 12.969 (0.015) 13.368 (0.015) Landolt+CTIO 1.5-m
2193.85 Oct11.35 13.913 (0.019) 13.565 (0.014) 13.007 (0.013) 12.988 (0.015) 13.374 (0.015) Landolt+CTIO 1.5-m
2194.78 Oct12.28 14.009 (0.019) 13.651 (0.014) 13.056 (0.013) 13.032 (0.015) 13.375 (0.015) Landolt+CTIO 1.5-m
2195.75 Oct13.25 13.793 (0.027) 13.068 (0.018) 13.040 (0.035) 13.358 (0.027) D. Gonzalez+YALO
2195.83 Oct13.33 14.188 (0.019) 13.779 (0.014) 13.130 (0.013) 13.103 (0.015) 13.440 (0.015) Landolt+CTIO 1.5-m
2197.71 Oct15.21 14.450 (0.019) 13.989 (0.014) 13.230 (0.013) 13.175 (0.015) 13.462 (0.015) Landolt+CTIO 1.5-m
2198.71 Oct16.21 14.544 (0.019) 14.086 (0.014) 13.265 (0.013) 13.156 (0.015) 13.359 (0.015) Landolt+CTIO 1.5-m
2198.80 Oct16.30 14.155 (0.008) 13.278 (0.005) 13.169 (0.014) 13.322 (0.008) D. Gonzalez+YALO
2201.81 Oct19.31 14.506 (0.012) 13.453 (0.008) 13.232 (0.014) 13.253 (0.012) Pizarro+YALO
2204.78 Oct22.28 14.804 (0.016) 13.590 (0.009) 13.303 (0.019) 13.226 (0.024) Espinoza+YALO
–25
–
Table 3—Continued
JD−2,450,000 UT DateaU B V R I Observer+Telescope
2207.77 Oct25.27 15.090 (0.012) 13.746 (0.007) 13.392 (0.015) 13.224 (0.012) Pizarro+YALO
2210.82 Oct28.32 15.357 (0.013) 13.924 (0.006) 13.524 (0.011) 13.235 (0.010) Pizarro+YALO
2213.68 Oct31.18 15.554 (0.015) 14.109 (0.006) 13.697 (0.015) 13.306 (0.009) Espinoza+YALO
2216.73 Nov03.23 15.727 (0.011) 14.301 (0.005) 13.880 (0.012) 13.486 (0.009) Espinoza+YALO
2222.75 Nov09.25 15.998 (0.020) 14.606 (0.010) 14.248 (0.018) 13.904 (0.017) D. Gonzalez+YALO
2225.72 Nov12.22 16.060 (0.012) 14.706 (0.007) 14.331 (0.014) 14.038 (0.012) D. Gonzalez+YALO
2228.73 Nov15.23 16.149 (0.016) 14.806 (0.009) 14.478 (0.016) 14.171 (0.015) Espinoza+YALO
2231.71 Nov18.21 16.198 (0.017) 14.865 (0.009) 14.584 (0.016) 14.314 (0.014) Espinoza+YALO
2234.73 Nov21.23 16.215 (0.016) 14.940 (0.006) 14.675 (0.013) 14.447 (0.012) D. Gonzalez+YALO
2237.73 Nov24.23 16.265 (0.017) 15.042 (0.008) 14.738 (0.016) 14.560 (0.014) D. Gonzalez+YALO
2240.73 Nov27.22 16.282 (0.020) 15.121 (0.009) 14.835 (0.019) 14.689 (0.015) D. Gonzalez+YALO
2243.71 Nov30.21 16.333 (0.021) 15.178 (0.012) 14.917 (0.021) 14.801 (0.019) Espinoza+YALO
2246.78 Dec03.28 16.383 (0.038) 15.238 (0.009) 15.042 (0.020) 14.922 (0.022) Espinoza+YALO
2289.64 Jan15.14 17.695 (0.037) 16.924 (0.013) 16.349 (0.006) Candia+CTIO 0.9-m
2324.55 Feb19.05 18.685 (0.023) 17.500 (0.011) 17.072 (0.013) 17.294 (0.008) 17.401 (0.031) Candia+CTIO 0.9-m
aYear is 2001, except for the last two lines, for which year is 2002.

– 26 –
Table 4. Corrections to B-band and V-band Photometrya
JD−2,450,000 t (d) ∆B ∆V Telescopeb
2171.85 −10.65 [−0.027] −0.007 1
2174.81 −7.69 [−0.027] −0.001 1
2177.84 −4.66 [−0.027] +0.005 1
2178.82 −3.68 −0.038 +0.004 2
2179.81 −2.69 −0.038 +0.005 2
2183.84 1.34 [−0.027] +0.018 1
2183.86 1.36 −0.036 +0.005 2
2184.88 2.38 −0.035 +0.004 2
2186.80 4.30 [−0.027] +0.020 1
2189.78 7.28 −0.012 +0.001 3
2189.83 7.33 [−0.027] +0.023 1
2190.79 8.29 −0.011 0.000 3
2191.79 9.29 −0.010 −0.001 3
2192.72 10.22 −0.008 0.000 3
2192.83 10.33 −0.026 +0.026 1
2193.78 11.28 −0.007 +0.001 3
2194.78 12.28 −0.006 +0.002 3
2195.75 13.25 −0.024 +0.028 1
2195.84 13.34 −0.004 +0.004 3
2197.71 15.21 −0.002 +0.005 3
2198.71 16.21 0.000 +0.007 3
2198.80 16.30 −0.022 +0.030 1
2201.81 19.31 −0.023 +0.033 1
2204.78 22.28 −0.039 +0.034 1
2207.77 25.27 −0.051 +0.035 1
2210.82 28.32 −0.065 +0.037 1
2213.68 31.18 −0.069 +0.038 1
2216.73 34.23 −0.068 +0.040 1
2222.75 40.25 −0.066 +0.040 1
2225.72 43.22 −0.063 +0.038 1
2228.73 46.23 −0.060 +0.034 1

– 27 –
Table 4—Continued
JD−2,450,000 t (d) ∆B ∆V Telescopeb
2231.71 49.21 −0.058 +0.030 1
2234.73 52.23 −0.054 +0.027 1
2237.73 55.23 −0.050 +0.026 1
2240.73 58.23 −0.044 +0.026 1
2243.71 61.21 −0.040 +0.026 1
2246.78 64.28 −0.034 +0.027 1
aThe following corrections are to be added to the data
in Table 3 to correct them to the filter system of Bessell
(1990). Values in square brackets are less certain; we
have assumed that the YALO B-band filter corrections
are represented by a flat function at the start. t is the
number of days since the time of B-band maximum, JD
2,452,182.5. bYALO = 1; CTIO 0.9-m = 2, CTIO 1.5-m
= 3.

–28
–
Table 5. Near-Infrared Photometry of SN 2001ela
JD−2,450,000 UT Dateb J H K Observer+Telescope
2171.84 Sep19.34 13.607 (0.021) 13.661 (0.036) 13.543 (0.044) D. Gonzalez + YALO
2174.80 Sep22.30 13.129 (0.020) 13.161 (0.037) 13.021 (0.045) Espinoza + YALO
2177.82 Sep25.33 12.878 (0.022) 13.085 (0.037) 12.831 (0.046) Espinoza + YALO
2183.83 Oct01.33 12.986 (0.020) 13.193 (0.036) 12.919 (0.043) D. Gonzalez + YALO
2186.79 Oct04.29 13.177 (0.020) 13.253 (0.036) 13.061 (0.043) Espinoza + YALO
2189.82 Oct07.33 13.538 (0.020) 13.239 (0.036) 13.116 (0.043) Espinoza + YALO
2192.82 Oct10.32 14.139 (0.022) 13.276 (0.042) 13.142 (0.051) D. Gonzalez + YALO
2195.74 Oct13.24 14.265 (0.032) 13.245 (0.051) 13.085 (0.063) D. Gonzalez/Pizarro + YALO
2198.79 Oct16.29 14.290 (0.068) 13.140 (0.099) 13.036 (0.103) D. Gonzalez + YALO
2201.81 Oct19.31 14.380 (0.020) 13.045 (0.036) 12.987 (0.043) Pizarro/Espinoza + YALO
2202.75 Oct20.25 14.191 (0.023) 12.978 (0.040) 13.035 (0.036) S. Gonzalez/Krisciunas + LCO 1-m
2203.74 Oct21.24 14.167 (0.022) 12.982 (0.019) 12.957 (0.039) S. Gonzalez + LCO 1-m
2204.70 Oct22.20 14.174 (0.025) 12.966 (0.026) 12.988 (0.036) S. Gonzalez + LCO 1-m
2204.77 Oct22.27 14.263 (0.043) 13.084 (0.071) 12.873 (0.086) Espinoza + YALO
2207.84 Oct25.34 14.217 (0.021) 13.061 (0.038) 12.941 (0.045) Pizarro + YALO
2210.81 Oct28.31 14.199 (0.025) 13.108 (0.042) 13.045 (0.053) Pizarro + YALO
2213.67 Oct31.17 13.997 (0.023) 13.132 (0.041) 13.082 (0.049) Espinoza + YALO
2216.72 Nov03.22 14.112 (0.021) 13.259 (0.039) 13.317 (0.043) Espinoza + YALO
2222.74 Nov09.24 14.774 (0.025) 13.769 (0.043) 13.867 (0.058) D. Gonzalez + YALO
2225.71 Nov12.21 14.917 (0.028) 13.812 (0.048) 13.893 (0.058) D. Gonzalez + YALO
2228.72 Nov15.22 15.204 (0.026) 13.991 (0.044) 14.112 (0.053) Espinoza + YALO
2231.70 Nov18.20 15.354 (0.027) 14.090 (0.045) 14.305 (0.056) Espinoza + YALO
2234.72 Nov21.22 15.544 (0.026) 14.213 (0.044) 14.404 (0.059) D. Gonzalez + YALO
–29
–
Table 5—Continued
JD−2,450,000 UT Dateb J H K Observer+Telescope
2237.73 Nov24.23 15.799 (0.033) 14.349 (0.053) 14.537 (0.065) D. Gonzalez + YALO
2238.79 Nov25.29 15.713 (0.020) 14.355 (0.054) 14.711 (0.038) S. Gonzalez + LCO 1-m
2240.70 Nov27.20 15.879 (0.020) 14.514 (0.039) 14.690 (0.053) S. Gonzalez + LCO 1-m
2240.72 Nov27.22 15.974 (0.034) 14.488 (0.055) 14.711 (0.077) D. Gonzalez + YALO
2241.69 Nov28.19 15.964 (0.020) 14.492 (0.016) 14.798 (0.048) S. Gonzalez + LCO 1-m
2242.69 Nov29.19 16.030 (0.025) 14.562 (0.022) 14.751 (0.059) S. Gonzalez + LCO 1-m
2243.68 Nov30.18 16.069 (0.024) 14.548 (0.080) S. Gonzalez + LCO 1-m
2243.74 Nov30.24 16.238 (0.033) 14.576 (0.055) 14.780 (0.075) Espinoza + YALO
2244.71 Dec01.21 16.089 (0.046) 14.833 (0.044) S. Gonzalez + LCO 1-m
2246.77 Dec03.27 16.420 (0.043) 14.824 (0.067) 14.938 (0.081) Espinoza + YALO
aThe data are based on differential photometry with respect to star 6 given in Table 2. The YALO data
are presented without the corrections given in Table 6. bYear is 2001.
– 30 –
Table 6. Corrections to YALO Infrared Photometrya
JD−2,450,000 t (d) ∆J ∆H ∆K
2171.84 −10.66 0.030 0.011 −0.011
2174.80 −7.70 0.042 0.004 0.000
2177.82 −4.68 0.051 −0.003 0.010
2183.83 1.33 0.071 −0.016 0.032
2186.79 4.29 0.041 −0.038 0.056
2189.82 7.32 0.014 −0.042 0.054
2192.82 10.32 −0.013 −0.044 0.044
2195.74 13.24 −0.037 −0.045 0.033
2198.79 16.29 −0.062 −0.049 0.021
2201.81 19.31 −0.080 −0.059 0.010
2204.77 22.27 −0.102 −0.070 −0.001
2207.84 25.34 −0.070 −0.071 −0.012
2210.81 28.31 −0.051 −0.062 −0.016
2213.67 31.17 −0.082 −0.022 −0.009
2216.72 34.22 −0.097 −0.005 −0.007
2222.74 40.24 −0.125 0.030 0.004
2225.71 43.21 −0.131 0.033 0.000
2228.72 46.22 −0.131 0.033 0.000
2231.70 49.20 −0.131 0.033 0.000
2234.72 52.22 −0.131 0.033 0.000
2237.73 55.23 −0.131 0.033 0.000
2240.72 58.22 −0.131 0.033 0.000
2243.74 61.24 −0.131 0.033 0.000
2246.77 64.27 −0.131 0.033 0.000
aThe following corrections are to be added to the
YALO data in Table 5 to correct them to the photo-
metric system of Persson et al. (1998). t is the num-
ber of days since the time of B-band maximum, JD
2,452,182.5.

– 31 –
Table 7. Maximum Magnitudes of SN 2001el
Filter JD−2,450,000 mmax
U 2181.4 (1.0) 12.67 (0.04)
B 2182.5 (0.5) 12.81 (0.02)
V 2184.5 (0.5) 12.73 (0.02)
R 2185.3 (0.5) 12.62 (0.04)
I 2179.1 (1.0) 12.82 (0.04)
J 2178.4 (1.0) 12.90 (0.04)
Ha 2177.8 (1.0) 13.08 (0.04)
K 2178.8 (1.0) 12.83 (0.04)
aThe second maximum (H = 12.97 at
JD 2,452,204.7) is actually brighter than
the first H-band maximum.
Table 8. Color Excesses and Implied Extinctiona
Color Index Color Excess AV (host galaxy) AV (total)
(B − V )max 0.185 (0.104) 0.53 (0.30) 0.57 (0.30)
(B − V )tail 0.253 (0.063) 0.73 (0.19) 0.77 (0.19)
(V − I)max 0.133 (0.087) 0.31 (0.20) 0.35 (0.20)
(B − V )avg 0.206 (0.046) 0.593 (0.136) 0.636 (0.136)
V − J 0.350 (0.077) 0.445 (0.114) 0.488 (0.114)
V − H 0.450 (0.071) 0.502 (0.089) 0.545 (0.089)
V − K 0.530 (0.054) 0.554 (0.063) 0.597 (0.063)
aAll values are measured in magnitudes. Values in parentheses
are 1-σ uncertainties. We adopt RV ≡ AV / E(B−V ) = 2.88 ± 0.15
(Wang et al. 2002) for the host galaxy. We also adopt E(B − V )
= 0.8 E(V − I).
– 32 –
Table 9. Wavelength Shifts to Instrumental Bandpassesa
Telescope B V R I
YALO 25 red 100 blue 30 red 100 blue
CTIO 0.9-m 25 red 0 50 blue 50 red
CTIO 1.5-m 25 blue 0 0 0
aAll values are measured in A.

– 33 –
Fig. 1.— A V -band image of SN 2001el in NGC 1448 obtained with the CTIO 0.9-m telescope
on 26.4 Sept 2001. The exposure time was 25 seconds. The local photometric standards are
shown. The bar corresponds to 1 arcminute. North is up and East is to the left. The
supernova is marked as “SN”.
– 34 –
−10 0 10 20 30 40 50 60Days Since B max
0.0
0.2
0.4
0.6
0.8
1.0
1.2
1.4
1.6
B−V
SN 1999ee
0.0
0.2
0.4
0.6
0.8
1.0
1.2
1.4
1.6
B−V
CTIO 0.9 mYALO 1.0 m
SN 1998bu
Fig. 2.— B − V colors of SNe 1998bu and 1999ee, as observed with the CTIO 0.9-m and
YALO telescopes. Due to differences in the filter transmission curves, late-time B−V colors
derived from YALO data are roughly 0.12 mag redder.
– 35 –
Fig. 3.— Based on synthetic photometry using Bessell (1990), YALO, CTIO 0.9-m, and
CTIO 1.5-m filter functions, we show B-band corrections to YALO and CTIO data to place
photometry of SNe 1999ee and 2001el on the Bessell system. The time of B-band maximum
is JD 2,451,469.1 for SN 1999ee (Stritzinger et al. 2002) and 2,452,182.5 for SN 2001el.
We used spectra of SN 1999ee given by Hamuy et al. (2002), and spectra of SN 2001el by
Wang et al. (2002) and Nugent (2002, private communication). The filter corrections for SN
1999ee are connected by lines, telescope by telescope, to guide the eye.

– 36 –
Fig. 4.— Same as Fig. 3, but for the V -band. Note that, unlike the B-band, these corrections
are mostly telescope-dependent, not telescope- and object-dependent after t = 20 d.

– 37 –
Fig. 5.— Optical photometry of SN 2001el. For B, V , R, and I the YALO data are plotted
as smaller open symbols, while data from the CTIO 0.9-m and 1.5-m telescopes are plotted
as ×’s. We have corrected the B-band and V -band data to the filter system of Bessell (1990)
using the values in Table 4. On the whole the internal errors are smaller than the size of
the points. The U , B, R, and I data have been offset vertically by +2, +1, −1, and −2,
magnitudes, respectively. The Landolt data are plotted as nightly means. Data from two
nights are off the right edge of the plot.

– 38 –
Fig. 6.— Corrections to YALO infrared photometry, based on spectra of SN 1999ee (Hamuy
et al. 2002), to place the YALO data on the system of Persson et al. (1998). Solid line = J ;
dashed line = H ; dotted line = K.

– 39 –
Fig. 7.— JHK photometry of SN 2001el. The J and K data have been offset vertically by
+1 and −1 magnitudes, respectively. Open symbols = YALO data. ×’s = LCO 1-m data.
The YALO data include the corrections given in Table 6.

– 40 –
2170 2190 2210 2230 2250Julian Date [2450000 + ...]
6
7
8
9
10
11
12
13
14
15
16
17
18
mag
nitu
deSN 2001el
CTIO & LCO Photometry
K
H
J
I
R
V
B
U
Fig. 8.— UBV RIJHK light curve of SN 2001el. The different bands are offset for plotting
purposes but show that the red and infrared maxima occurred earlier than for the UBV
bands.
– 41 –
Fig. 9.— H-band light curves of a number of Type Ia supernovae. The objects are ordered
from top to bottom by the decline rate parameter ∆m15(B). Sources: SN 1999aw, Strolger
et al. (2002); SN 1998bu, see Meikle (2000); SN 2001el (this paper); SN 1999ac, Phillips et
al. (2002); SN 2000bk (Krisciunas et al. 2001); SN 1986G (Frogel et al. 1987).

– 42 –
Fig. 10.— B − V colors of SN 2001el versus Julian Date. The smaller open circles represent
the uncorrected data, while the solid dots include the corrections of Table 4. The solid line
is the zero reddening line of Lira (1995) adjusted to the time of V -band maximum given in
Table 7.

– 43 –
Fig. 11.— V minus near-IR color curves for SN 2001el, using the V -band data of Table 3,
corrected by the values in Table 4, and the JHK data in Table 5, with the YALO data
corrected according the values in Table 6. The V−K data have been offset by +1 mag, while
the V − J data have been offset by −1 mag. The solid lines are based on the fourth order
polynomial fits to data of eight Type Ia SNe studied by Krisciunas et al. (2000) which have
mid-range B-band decline rates. The loci are adjusted in the ordinate direction to minimize
the reduced χ2 of the fits.
– 44 –
Fig. 12.— Color curves based on a delayed detonation model of a typical Type Ia SN
(Hoflich et al. 2002). The abscissa is the number of days since B-band maximum. Model
uncertainties allow the theoretical curves to be shifted ±1 d in the x-direction. V − H loci
are blue lines while V − K loci are red. Also shown (as dotted lines) are the unreddened
loci based on 8 mid-range decliners studied by Krisciunas et al. (2000). Given the 0.m2 to
0.m3 accuracy of the infrared models, the agreement between theory and observation is better
than expected.

– 45 –
0.8 1.0 1.2 1.4 1.6 1.8 2.0∆m15(B)
−20
−19
−18
−17
M+1
0
−20
−19
−18
−17
Mm
ax
−20
−19
−18
−17
Mm
ax
−20
−19
−18
−17
Mm
ax
0.01 < z < 0.1 (Ho = 74) Cepheid, SBF, PNLF, TRGB
B
V
IKC
H
Fig. 13.— Absolute magnitudes of Type Ia SNe versus decline rate parameter ∆m15(B). For
the H-band the absolute magnitudes correspond to 10 days after the time of Bmax. The solid
points were derived using distances from Cepheids or other direct measures of the distance
to the host galaxy such as surface brightness fluctuations, the planetary nebula luminosity
function, or using the “tip of the red giant branch method”. Open triangles correspond to
points derived using a Hubble constant of 74 km s−1 Mpc−1; these objects are sufficiently
distant to be in the Hubble flow. The right-most point in the bottom panel corresponds to
SN 1986G, which was highly reddened and whose distance is subject to some uncertainty.


![Optical Photometry of the Type I[CLC]a[/CLC] Supernova 1999[CLC]ee[/CLC] and the Type I[CLC]b[/CLC]/[CLC]c[/CLC] Supernova 1999[CLC]ex[/CLC] in IC 5179](https://static.fdokumen.com/doc/165x107/631b4c6e28a72b00c00f66b8/optical-photometry-of-the-type-iclcaclc-supernova-1999clceeclc-and-the.jpg)


![Optical and Infrared Photometry of the Nearby Type I[CLC]a[/CLC] Supernova 2001[CLC]el[/CLC](https://static.fdokumen.com/doc/165x107/631f65313fc948596809c568/optical-and-infrared-photometry-of-the-nearby-type-iclcaclc-supernova-2001clcelclc.jpg)

