Broad‐band and Hα surface photometry of the central regions of nearby active galaxiesI....
31
q 2000 RAS Broad-band and Ha surface photometry of the central regions of nearby active galaxies – I. Observations Miguel Sa ´nchez-Portal, 1, 2w A ´ ngeles I. Dı ´az, 1 Roberto Terlevich, 3 ² Elena Terlevich, 4w ‡ Mar A ´ lvarez A ´ lvarez 1 and Itziar Aretxaga 4 1 Dpto. de Fı ´sica Teo ´rica, C-XI, Universidad Auto ´noma de Madrid, Cantoblanco, 28049 Madrid, Spain 2 LAEFF/INTA, PO Box 50727, 28080 Madrid, Spain 3 Institute of Astronomy, Madingley Road, Cambridge CB3 0HA 4 Instituto Nacional de Astrofı ´sica, O ´ ptica y Electro ´nica, Tonantzintla, Puebla, Mexico Accepted 1999 September 2. Received 1999 July 12; in original form 1999 April 15 ABSTRACT Broad-band V , R and I and narrow-band Ha CCD surface photometry of a sample of 24 active and three normal nearby galaxies is presented, in order to study their morphological and structural properties. This first paper presents the observations, data reduction and processing techniques used; the main characteristics of the central regions of the sample galaxies are derived from broad-band and Ha images; broad-band surface brightness and colour profiles are presented; based on the inspection of individual images and the examination of the radial variation of ellipticity and polar angle, the morphological class of the sample objects is revised: several objects previously classified as non-barred or unclassified are found to be barred galaxies. A high fraction (,71 per cent) of the objects that present any kind of nuclear activity are barred. This proportion is even higher (,87 per cent) if only Seyfert galaxies are considered. This result can reinforce the clues about the connection between bars and nuclear activity as a fuelling mechanism that can trigger and sustain nuclear activity. Key words: galaxies: active – galaxies: fundamental parameters – galaxies: photometry. 1 INTRODUCTION Many galactic nuclei show signs of more or less violent activity, understood as energy production at a level that cannot be sustained over a large fraction of the expected galaxy life. A substantial fraction of nearby galaxies (<40 per cent; Ho, Filippenko & Sargent 1995) fall into this category, mainly Seyfert, LINER and starburst galaxies. Whether this activity represents a transitory phase in the life of a galaxy or is a fact related to its own structural characteristics still remains an open question. A number of papers have been written trying to explain the observational aspects of nuclear activity in the light of various theoretical models proposed by different authors (e.g. Rees 1984; Norman & Scoville 1988; Perry 1992; Terlevich 1992). No matter which model is assumed for the nuclear luminosity, an unavoid- able fact is the requirement of substantial amounts of gas in the galaxy centre. This gas has to be transported from reservoirs located in the outer parts of the discs, or provided by interactions with companion galaxies, and in this process it has to get rid of most of its angular momentum. At galactic scales, this can be accomplished by gravitational torques produced in non-axisym- metric potentials in the central regions of these galaxies. One difficulty in learning about the main processes responsible for the feeding of the nuclear region is that not many papers have been devoted to studying the intrinsic properties of the host galaxies as compared to normal galaxies of similar morphological type. Yee (1983) found the colours of Seyfert galaxies to be comparable to those of normal galaxies of similar type, but their absolute luminosity to be higher. These results have further been confirmed by Kotilainen & Ward (1994) and Hunt et al. (1997). Heckmann (1980a,b) reported an important result that estab- lishes a basic difference in the Hubble type distribution of galaxies hosting emission-line nuclei, in the sense that galaxies with AGN- like nuclei tend to have Hubble types earlier than Sbc, while those with starburst nuclei tend to have Hubble types later than Sbc. This fact raises the following questions. (1) Why should this dichotomy in the Hubble type distribution exist at all? (2) How is it possible that while nuclear star formation is so common in late-type spirals it seems to be almost completely Mon. Not. R. Astron. Soc. 312, 2–32 (2000) w E-mail: [email protected] (MSP); [email protected] (ET) ²Visiting Professor, INAOE, Puebla, Mexico. ‡Visiting Fellow, IoA, Cambridge.
-
Upload
independent -
Category
Documents
-
view
3 -
download
0
Transcript of Broad‐band and Hα surface photometry of the central regions of nearby active galaxiesI....

q 2000 RAS
Broad-band and Ha surface photometry of the central regions of nearbyactive galaxies ± I. Observations
Miguel SaÂnchez-Portal,1, 2w AÂ ngeles I. DõÂaz,1 Roberto Terlevich,3² Elena Terlevich,4w³
Mar AÂ lvarez AÂ lvarez1 and Itziar Aretxaga4
1Dpto. de FõÂsica TeoÂrica, C-XI, Universidad AutoÂnoma de Madrid, Cantoblanco, 28049 Madrid, Spain2LAEFF/INTA, PO Box 50727, 28080 Madrid, Spain3Institute of Astronomy, Madingley Road, Cambridge CB3 0HA4Instituto Nacional de AstrofõÂsica, OÂ ptica y ElectroÂnica, Tonantzintla, Puebla, Mexico
Accepted 1999 September 2. Received 1999 July 12; in original form 1999 April 15
A B S T R A C T
Broad-band V, R and I and narrow-band Ha CCD surface photometry of a sample of 24
active and three normal nearby galaxies is presented, in order to study their morphological
and structural properties. This first paper presents the observations, data reduction and
processing techniques used; the main characteristics of the central regions of the sample
galaxies are derived from broad-band and Ha images; broad-band surface brightness and
colour profiles are presented; based on the inspection of individual images and the
examination of the radial variation of ellipticity and polar angle, the morphological class of
the sample objects is revised: several objects previously classified as non-barred or
unclassified are found to be barred galaxies. A high fraction (,71 per cent) of the objects
that present any kind of nuclear activity are barred. This proportion is even higher (,87 per
cent) if only Seyfert galaxies are considered. This result can reinforce the clues about the
connection between bars and nuclear activity as a fuelling mechanism that can trigger and
sustain nuclear activity.
Key words: galaxies: active ± galaxies: fundamental parameters ± galaxies: photometry.
1 I N T R O D U C T I O N
Many galactic nuclei show signs of more or less violent activity,
understood as energy production at a level that cannot be sustained
over a large fraction of the expected galaxy life. A substantial
fraction of nearby galaxies (<40 per cent; Ho, Filippenko &
Sargent 1995) fall into this category, mainly Seyfert, LINER and
starburst galaxies. Whether this activity represents a transitory
phase in the life of a galaxy or is a fact related to its own structural
characteristics still remains an open question.
A number of papers have been written trying to explain the
observational aspects of nuclear activity in the light of various
theoretical models proposed by different authors (e.g. Rees 1984;
Norman & Scoville 1988; Perry 1992; Terlevich 1992). No matter
which model is assumed for the nuclear luminosity, an unavoid-
able fact is the requirement of substantial amounts of gas in the
galaxy centre. This gas has to be transported from reservoirs
located in the outer parts of the discs, or provided by interactions
with companion galaxies, and in this process it has to get rid of
most of its angular momentum. At galactic scales, this can be
accomplished by gravitational torques produced in non-axisym-
metric potentials in the central regions of these galaxies.
One difficulty in learning about the main processes responsible
for the feeding of the nuclear region is that not many papers have
been devoted to studying the intrinsic properties of the host
galaxies as compared to normal galaxies of similar morphological
type. Yee (1983) found the colours of Seyfert galaxies to be
comparable to those of normal galaxies of similar type, but their
absolute luminosity to be higher. These results have further been
confirmed by Kotilainen & Ward (1994) and Hunt et al. (1997).
Heckmann (1980a,b) reported an important result that estab-
lishes a basic difference in the Hubble type distribution of galaxies
hosting emission-line nuclei, in the sense that galaxies with AGN-
like nuclei tend to have Hubble types earlier than Sbc, while those
with starburst nuclei tend to have Hubble types later than Sbc.
This fact raises the following questions.
(1) Why should this dichotomy in the Hubble type distribution
exist at all?
(2) How is it possible that while nuclear star formation is so
common in late-type spirals it seems to be almost completely
Mon. Not. R. Astron. Soc. 312, 2±32 (2000)
w E-mail: [email protected] (MSP); [email protected] (ET)
² Visiting Professor, INAOE, Puebla, Mexico.
³ Visiting Fellow, IoA, Cambridge.
Surface photometry of nearby active galaxies 3
switched off at Sb only two Hubble types away from the peak of
their distribution?
(3) As AGN are so common among early-type galaxies, why
does their formation seem to be almost completely inhibited at Sc,
again only two Hubble types away from the maximum of their
distribution?
Arsenault (1989) found that on top of this Hubble type
dichotomy there is also a tendency for galaxies with either AGN
or starburst nuclei to be associated with bars or rings, with perhaps
a slightly higher fraction of bars in starburst nuclei than in AGN.
MacKenty (1990), from a study of the morphologies of a
volume- and magnitude-limited sample of Seyfert galaxies, found
that <70 per cent of Seyfert galaxies show evidence of the
presence of some mechanism for transporting material into their
nuclei. The fraction of barred galaxies in his sample is the same as
found in normal galaxies, but it is worth noting that some objects
classified by MacKenty as spirals (S) may actually possess a bar
(e.g., NGC 7469). Regarding the role played by the environment,
De Robertis, Hayhoe & Yee (1998) have found that there is no
strong evidence that galaxies with AGN are more likely to be
associated either with mergers or interactions than normal galaxies
of the same type and luminosity.
It seems, therefore, that a detailed high-resolution study of the
morphological parameters of galaxies with nuclear activity can
contribute significantly towards the understanding of the reasons
for certain galaxies to show activity and of the origin of the
empirical link between the galaxian morphology and the type of
nuclear activity.
With this in mind, we have observed a sample of 24 galaxies
which show different degrees of nuclear activity and are
sufficiently nearby to provide adequate spatial resolution of their
central regions, plus three normal galaxies of comparable
morphological type to be used as a reference sample.
This first paper presents the data for the study, while the
corresponding analysis will be presented in a forthcoming paper.
2 O B S E RVAT I O N S A N D DATA R E D U C T I O N
The observations presented here were obtained in two
observing runs in 1988 and 1990 using a blue-sensitive GEC
CCD at the f /15 Cassegrain focus of the 1.0-m Jacobus
Kapteyn Telescope (JKT) of the Isaac Newton Group in La
Palma. The CCD size is 578 � 385 pixels, and the pixel size is
22mm. The scale obtained with this instrumental configuration
is 0.3 arcsec pixel21, and the CCD field is 2:89 � 1:92 arcmin2.
Broad-band Kitt Peak V, R and I and narrow-band Hainterference filters at the corresponding galaxy rest frame
wavelengths were used. Their characteristics are summarized in
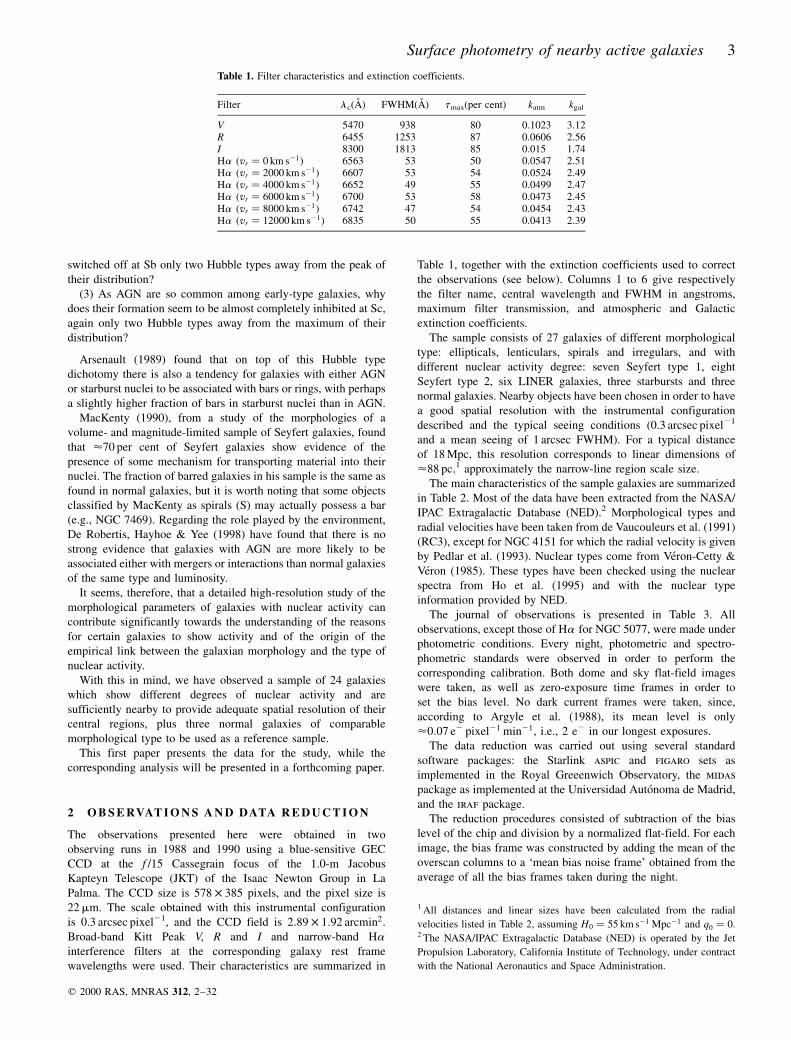
Table 1, together with the extinction coefficients used to correct
the observations (see below). Columns 1 to 6 give respectively
the filter name, central wavelength and FWHM in angstroms,
maximum filter transmission, and atmospheric and Galactic
extinction coefficients.
The sample consists of 27 galaxies of different morphological
type: ellipticals, lenticulars, spirals and irregulars, and with
different nuclear activity degree: seven Seyfert type 1, eight
Seyfert type 2, six LINER galaxies, three starbursts and three
normal galaxies. Nearby objects have been chosen in order to have
a good spatial resolution with the instrumental configuration
described and the typical seeing conditions (0.3 arcsec pixel21
and a mean seeing of 1 arcsec FWHM). For a typical distance
of 18 Mpc, this resolution corresponds to linear dimensions of
<88 pc;1 approximately the narrow-line region scale size.
The main characteristics of the sample galaxies are summarized
in Table 2. Most of the data have been extracted from the NASA/
IPAC Extragalactic Database (NED).2 Morphological types and
radial velocities have been taken from de Vaucouleurs et al. (1991)
(RC3), except for NGC 4151 for which the radial velocity is given
by Pedlar et al. (1993). Nuclear types come from VeÂron-Cetty &
VeÂron (1985). These types have been checked using the nuclear
spectra from Ho et al. (1995) and with the nuclear type
information provided by NED.
The journal of observations is presented in Table 3. All
observations, except those of Ha for NGC 5077, were made under
photometric conditions. Every night, photometric and spectro-
phometric standards were observed in order to perform the
corresponding calibration. Both dome and sky flat-field images
were taken, as well as zero-exposure time frames in order to
set the bias level. No dark current frames were taken, since,
according to Argyle et al. (1988), its mean level is only
<0:07 e2 pixel21 min21, i.e., 2 e2 in our longest exposures.
The data reduction was carried out using several standard
software packages: the Starlink aspic and figaro sets as
implemented in the Royal Greeenwich Observatory, the midas
package as implemented at the Universidad AutoÂnoma de Madrid,
and the iraf package.
The reduction procedures consisted of subtraction of the bias
level of the chip and division by a normalized flat-field. For each
image, the bias frame was constructed by adding the mean of the
overscan columns to a `mean bias noise frame' obtained from the
average of all the bias frames taken during the night.
q 2000 RAS, MNRAS 312, 2±32
Table 1. Filter characteristics and extinction coefficients.
Filter lc(AÊ ) FWHM(AÊ ) tmax(per cent) katm kgal
V 5470 938 80 0.1023 3.12R 6455 1253 87 0.0606 2.56I 8300 1813 85 0.015 1.74Ha �vr � 0 km s21� 6563 53 50 0.0547 2.51Ha �vr � 2000 km s21� 6607 53 54 0.0524 2.49Ha �vr � 4000 km s21� 6652 49 55 0.0499 2.47Ha �vr � 6000 km s21� 6700 53 58 0.0473 2.45Ha �vr � 8000 km s21� 6742 47 54 0.0454 2.43Ha �vr � 12000 km s21� 6835 50 55 0.0413 2.39
1 All distances and linear sizes have been calculated from the radial
velocities listed in Table 2, assuming H0 � 55 km s21 Mpc21 and q0 � 0.2 The NASA/IPAC Extragalactic Database (NED) is operated by the Jet
Propulsion Laboratory, California Institute of Technology, under contract
with the National Aeronautics and Space Administration.

4 M. SaÂnchez-Portal et al.
Sky subtraction was performed by averaging the mean count
values in several boxes in the periphery of the frame, after
rejection of those whose standard deviation was greater than
10 per cent. Some objects, like M51, fill the chip entirely, and
therefore it was not possible to select sky areas in the galaxy
frame. In these cases, the sky level was measured on sky frames
taken immediately before and after the object at nearly the same
zenith distance.
The final reduction steps involved cosmic rays removal, seeing
estimation by a Gaussian fit to the field stars, extinction
correction, and calibration with standard stars. Both atmospheric
and Galactic extinction correction were applied. The former was
calculated using the first-order extinction coefficients provided by
La Palma observatory (see Table 1); these values have been
checked, and found to be in very good agreement with those
derived from our observations of standard stars through a wide
range of air masses. Galactic extinction coefficients were computed
through the expression Al � klE�B 2 V�, using the values of
E�B 2 V� from Burstein & Heiles (1984) and the absorption
constants kl interpolated for our filter wavelengths in the Galactic
extinction curve from Seaton (1975) (see Table 1). No internal
absorption correction was performed [with the exception of NGC
4151, where a value of E�B 2 V� � 0:05 derived from UV
observations from Penston et al. (1981) has been adopted].
The broad-band VRI calibration was performed using the
photometric standard stars from Landolt (1983). The absolute
errors in the photometry are ^0:01 mag for V, ^0:04 mag for R,
and ^0:02 mag for I. The narrow-band Ha images were calibrated
using spectrophotometric standards from Stone (1977) and
Massey et al. (1988). Formal errors in the calibration are between
0.03 and 0.04 mag for the different velocity filters.
The seeing for each observation was measured using star images
present in each frame, except in the case of NGC 3227 for which no
stars were present and the seeing was estimated from previous frames.
3 R E S U LT S
3.1 Broad-band images
Broad-band images of AGN are difficult to interpret due to the
contribution of emission lines to the different filters, mainly Hbl4861 AÊ and [O iii] ll4959, 5007 AÊ to V, and [O i] ll6300,
6364 AÊ , Ha l6563 AÊ , [N ii] ll6548, 6584 AÊ and [S ii] ll6716,
6731 AÊ to R. The I filter is virtually free from emission-line
contamination. Only [S iii] l9069 AÊ enters the filter at 1/5 of the
peak transmision.3 Therefore we can consider the I band to reflect
the true stellar continuum flux. On the other hand, the spatial
characteristics of the emitting gas can be seen in the Ha images.
Figs 1±4 show the I images of the inner 15 � 15 arcsec2 (unless
specified) for all the objects in our sample. The x- and y-axes are
given in pixels. North is to the top, and east is to the left.
3.2 Ha images
To produce the Ha emission image, the continuum adjacent to the
line has to be removed. When suitable Ha continuum images
existed, they were subtracted from the Ha line� continuum frames
after careful alignment. This alignment was performed by translation
and rotation, using the centroids of field stars and/or galactic nuclei.
When possible, at least three objects in each frame have been used
for the alignment. The typical accuracy is better than 0.05 pixel.
When the two images to be aligned had different seeing, the image
with the better seeing was convolved with the appropriate Gaussian
function in order to match the one with the poorer seeing.
When no Ha continuum images are available, two different
methods for continuum removal have been used, depending on the
relative intensity of the lines close to Ha . The first one uses the
q 2000 RAS, MNRAS 312, 2±32
Table 2. Main characteristics of the sample galaxies.
Galaxy a (1950) d (1950) Morphological Nuclear BT vr
h m s 8 0 00 type type km s21
NGC 3227 10 20 46.78 120 07 06.14 SAB(s) pec Sy1.5 11.1 1157 ^ 3NGC 3516 11 03 22.84 172 50 20 .22 (R)SB(s)00 Sy1.5 12.5 2602 ^ 7NGC 3998 11 55 20.93 155 43 54.58 SA(r)00? Sy1.5 11.61 1040 ^ 13NGC 7469 12 00 44.43 108 36 16.12 (R')SAB(rs)a Sy1 13.0 4898 ^ 5NGC 4151 12 08 1.055 139 41 01.82 (R')SAB(rs)ab Sy1.5 11.5 997 ^ 4NGC 5077 13 16 53.00 212 23 43.0 E3-4 Sy1 12.38 2832 ^ 45NGC 6814 19 39 55.79 210 26 33.35 SAB(rs)bc Sy1 12.06 1563 ^ 4NGC 513 01 21 37.32 133 32 21.00 S? Sy2 13.9 5859 ^ 10NGC 1068 02 40 07.08 200 13 31.48 (R)SA(rs)b Sy2 9.61 1136 ^ 4Mrk 620 (NGC 2273) 06 45 37.69 160 54 12.9 SB(r)a Sy2 12.55 1840 ^ 4Mrk 622 08 04 21.04 139 08 58.80 S? Sy2 14.60 6964 ^ 11NGC 3982 11 53 52.32 155 24 12.34 SAB(r)b Sy2 11.78 1109 ^ 6NGC 5347 13 51 04.95 133 44 11.32 (R')SB(rs)ab Sy2 13.4 1335 ^ 20NGC 6217 16 35 5.10 178 18 5.0 (R)SB(rs)bc Sy2 11.79 1362 ^ 4NGC 7479 23 02 26.37 112 03 10.6 SB(s)c Sy2 11.60 2382 ^ 2NGC 1052 02 38 37.35 208 28 09.02 E4 LINER 11.41 1470 ^ 11NGC 2841 09 18 35.85 151 11 24.1 SA(r)b LINER 10.09 638 ^ 3M106 (NGC 4258) 12 16 29.39 147 34 53.2 SAB(s)bc LINER 9.10 448 ^ 3M51 (NGC 5194) 13 27 45.98 147 27 21.5 SA(s)bc pec LINER 8.96 463 ^ 3NGC 7177 21 58 18.50 117 29 50.0 SAB(r)b LINER 12.01 1150 ^ 5NGC 7217 22 05 37.60 131 06 53.0 (R)SA(r)ab LINER 11.02 946 ^ 4NGC 2146 06 10 40.10 178 22 23.0 SB(s)ab pec starburst 11.38 893 ^ 4NGC 3310 10 35 39.08 53 45 42.6 SAB(r)bc pec starburst 11.15 980 ^ 6NGC 3353 10 42 15.84 156 13 26.0 BCD/Irr starburst 13.25 944 ^ 5NGC 1023 02 37 15.83 138 50 55.00 SB(rs)02 normal 10.35 637 ^ 4NGC 6340 17 11 16.90 172 21 55 SA(s)0/a normal 11.87 1198 ^ 6NGC 6384 17 29 59.00 17 05 43.0 SAB(r)bc normal 11.14 1663 ^ 9
3 O i l8480 AÊ can also be present, but only in luminous Seyfert 1 galaxies.

Surface photometry of nearby active galaxies 5
q 2000 RAS, MNRAS 312, 2±32
Table 3. Journal of observations.
Object Obs. date Filter Exposure time Seeing FWHM Scale(UT) (sec.) ( 00) (pc pixel21) (pc/ 00)
NGC 3227 7-May-1988 V 300 1.3a 30.6 102R 300I 300
Ha (0 km s21) 1000NGC 3516 10-May-1988 V 600 2.1 68.8 229
R 600 2.4I 600 2.2
Ha (2000 km s21) 1200 2.2NGC 3998 11-May-1988 V 400 1.8 27.5 92
R 400 1.7I 300 1.5
Ha (2000 km s21) 600 1.6NGC 7469 23-Oct-1990 V 500 1.3 128.3 432
R 300 1.3I 300 1.3
Ha (4000 km s21) 800 1.5Ha (cont.) (0 km s21) 1000 1.5
NGC 4151 6-May-1988 V 300 0.8 26.4 88R 50 0.7I 150 0.7
Ha (0 km s21) 500 0.8NGC 5077b 11-May-1988 V 500 1.8 74.9 250
R 500 1.6I 500 1.7
Ha (2000 km s21) 1000 2.0NGC 6814 12-May-1988 V 900 2.0 41.3 138
R 900 2.0I 800 2.0
Ha (2000 km s21) 900 2.0NGC 513 29-Oct-1990 V 300 1.1 154.9 516
R 600 1.1I 600 1.1
NGC 1068 24-Oct-1990 V 100 2.1 30.0 100R 100 2.1I 100 2.1
23-Oct-1990 Ha (0 km s21) 800 1.223-Oct-1990 Ha (cont.) (4000 km s21) 800 1.2
Mrk 620 27-Oct-1990 V 300 1.9 48.7 162R 300 1.1I 300 1.1
Ha (2000 km s21) 1500 2.3Ha (cont.) (6000 km s21) 800 2.9
Mrk 622 7-May-1988 V 900 1.3 184.2 614R 900 1.3I 900 1.5
Ha (6000 km s21) 1800 1.9NGC 3982 8-May-1988 V 600 1.6 29.3 98
R 600 1.510-May-1988 I 600 1.3
Ha (0 km s21) 1200 1.2NGC 5347 12-May-1988 V 900 3.0 61.7 118
11-May-1988 R 600 1.4I 600 1.4
Ha (2000 km s21) 1000 1.7NGC 6217 6-May-1988 V 300 1.0 36.0 120
R 300 1.1I 300 1.1
Ha (2000 km s21) 1000 1.1NGC 7479 26-Oct-1990 V 500 1.1 63.0 210
R 400 1.1I 300 1.1
27-Oct-1990 Ha (2000 km s21) 1000 1.326-Oct-1990 Ha (cont.) (12000 km s21) 1000 1.3
NGC 1052 24-Oct-1990 V 500 1.4 38.9 130R 500 1.4I 500 1.4
27-Oct-1990 Ha (2000 km s21) 1000 1.425-Oct-1990 Ha (cont.) (12000 km s21) 1200 1.4
NGC 2841 6-May-1988 V 300 0.7 16.9 56R 300 0.8

6 M. SaÂnchez-Portal et al.
broad-band R image as continuum, and derives the line intensity
according to the relation (Terlevich et al. 1991)
Il � I�Ha�kR 2 I�R�kHa
t�Ha�kR 2 t�R�kHa;�1�
where I(Ha ) and I(R) are the observed intensities (in count s21) in
the Ha and R filters respectively, t(Ha ) and t (R) are the
corresponding filter transmissions at the redshifted Ha wave-
length (Argyle et al. 1988), and kHa and kR are defined by
kHa ��DHa
tHa�l� dl; �2�
kR ��DR
tR�l� dl: �3�
DHa and DR are the filter bandwidths.
This method assumes that the lines included in the R filter and
not in the Ha one are not important. In some cases, notably in the
case of LINERS where [S ii] lines are known to be rather
prominent, this is not true. We have then developed an alternative
method that assumes the existence of a proportionality factor
between the R and I continua. In order to obtain the
proportionality factor, we computed the mean value of the R-
and I-band intensities in several areas of the galactic bulge,
supposedly not affected by emission-line contamination. The ratio
I(R)mean/I(I)mean agrees well with the R 2 I colour of an old stellar
population.
On the other hand, the relationship between the instrumental
intensities of the Ha and R continua can be computed as
Ic�Ha�Ic�R� .
kHa
kR
: �4�
This assumes that the continuum in R is effectively constant. (This
value can also be obtained measuring the mean intensity values
through the Ha and R filters in a region free of emission lines.)
q 2000 RAS, MNRAS 312, 2±32
Table 3 ± continued
Object Obs. date Filter Exposure time Seeing FWHM Scale(UT) (sec.) ( 00) (pc pixel21) (pc/ 00)
I 200 0.8Ha (0 km s21) 600 0.7
M106 10-May-1988 V 300 1.8 11.9 39(NGC 4258) R 300 1.6
I 400 1.7Ha (0 km s21) 800 1.8
M51 7-May-1988 V 700 0.9 12.2 41(NGC 5194) R 300 1.1
I 300 1.1Ha (0 km s21) 1000 0.9
NGC 7177 24-Oct-1990 V 600 1.2 30.4 101R 600 1.2I 600 1.0
Ha (2000 km s21) 2000 1.326-Oct-1990 Ha (cont.) (12000 km s21) 2000 1.4
NGC 7217 22-Oct-1990 V 500 1.6 25.0 83R 500 1.6I 500 1.6
Ha (2000 km s21) 1000 1.8Ha (cont.) (12000 km s21) 2000 1.7
NGC 2146 26-Oct-1990 V 300 1.7 23.6 79R 300 1.7I 300 1.7
Ha (0 km s21) 2000 1.8Ha (cont.) (4000 km s21) 600 1.8
NGC 3310 7-May-1988 V 300 0.8 25.9 86R 300 0.9I 300 0.9
6-May-1988 Ha (0 km s21) 700 0.8NGC 3353 9-May-1988 V 600 1.6 25.0 83
R 600 1.4I 1000 1.7
Ha (0 km s21) 1500 1.5NGC 1023 24-Oct-1990 V 150 1.8 16.8 56
R 150 1.8I 150 1.8
Ha (0 km s21) 800 1.5Ha (cont.) (8000 km s21) 1000 1.5
NGC 6340 10-May-1988 V 300 1.6 31.7 106R 300 1.5I 360 1.4
Ha (2000 km s21) 300 1.6NGC 6384 10-May-1988 V 400 1.4 44.0 147
R 400 1.412-May-1988 I 900 1.9
a EstimatedbNon-photometric

Surface photometry of nearby active galaxies 7
q 2000 RAS, MNRAS 312, 2±32
Figure 1. I-band isophotal maps of the central regions of the sample galaxies.

8 M. SaÂnchez-Portal et al.
q 2000 RAS, MNRAS 312, 2±32
Figure 2. I-band isophotal maps of the central regions of the sample galaxies (continued).

Surface photometry of nearby active galaxies 9
q 2000 RAS, MNRAS 312, 2±32
Figure 3. I-band isophotal maps of the central regions of the sample galaxies (continued).

10 M. SaÂnchez-Portal et al.
Once these two values [I(R)mean/I(I)mean and Ic(Ha )/Ic(R)] are
found, the Ha continuum image is obtained as
Ic � Rmean
Imean
Ic�Ha�Ic�R� I�I�: �5�
This continuum can be subtracted from the original image, thereby
giving the Ha -line image.
Figs 5±7 show the Ha -line images obtained by means of the
methods described above. An error in the initial estimate of the
radial velocity of NGC 513 prevented us from obtaining the Ha -
line image of this galaxy. NGC 1023 does not present any nuclear
Ha emission. We did not obtain Ha frames from NGC 6384.
3.3 Notes to individual objects
NGC 3227: in Figs 1 and 5 the peak isophotes correspond to
mI � 13:9 mag arcsec22 and mHa � 30:37 mag arcsec22. In both
contour plots the isophotal increment is 0.25 mag arcsec22.
The I-band isophotes are very smooth, with a monotonous
increase in ellipticity for radii r * 5 arcsec. The position angles of
the isophotes also decrease gradually from PA < 658 at the centre
to PA < 08 at r < 2 arcsec, changing abruptly to values PA < 1608at larger radii. This is probably the position of the bar, although we
cannot see it clearly in our images. Outside the represented region
in Fig. 1, the galaxy shows a very distorted geometry, probably due
to the interaction with its companion galaxy NGC 3226.
The line-emitting region is oriented at PA < 348. The nuclear
region is very compact, with FWHM < 1:76 arcsec, but probably
resolved since the estimated seeing for this observations is
FWHM < 1:3 arcsec. VLA data from Ulvestad, Wilson & Sramek
(1981) and Ulvestad & Wilson (1984) show a partially resolved
nuclear radiosource of similar size (about 300 pc).
NGC 3516: in Figs 1 and 5 the peak isophotes correspond to
mI � 14:91 mag arcsec22 and mHa � 31:82 mag arcsec22. In the
I-band plot the isophotal increment is 0.25 mag arcsec22, while
in the Ha one the increment is 0.2 mag arcsec22.
The stellar continuum contours are quite circular in the centre,
but gain ellipticity as they progress outwards until r < 9 arcsec
due to the presence of a bar at PA < 1738.Two components are observed in the emission-line maps: an
unresolved nuclear component and an extended component. The
latter is oriented at PA < 458, with a total extension of about
12 arcsec, i.e., 2.7 kpc. The observed Ha emission morphology is
very similar to that shown by Pogge (1989a). VLA observations
from Wrobel & Heeschen (1988) reveal extended radio emission
at PA , 458, i.e., aligned with the stellar continuum.
NGC 3998: in Figs 1 and 5 the peak isophotes correspond to
mI � 14:0 mag arcsec22 and mHa � 31:5 mag arcsec22. In both
contour plots the isophotal increment is 0.5 mag arcsec22.
The I isophotes are quite regular, with ellipticities e & 0:2; the
Ha contours are rounded, and the emitting region is barely
resolved, with FWHM < 1:95 arcsec.
NGC 7469: in Figs 1 and 5 the peak isophotes correspond to
mI � 14:4 mag arcsec22 and mHa � 30:35 mag arcsec22. In both
contour plots the isophotal increment is 0.5 mag arcsec22.
The represented I-band contours are slightly smoothed in order
to filter out an error in the tracking of the telescope. However, the
q 2000 RAS, MNRAS 312, 2±32
Figure 4. I-band isophotal maps of the central regions of the sample galaxies (continued).

Surface photometry of nearby active galaxies 11
q 2000 RAS, MNRAS 312, 2±32
Figure 5. Ha isophotal maps of the central regions of the sample galaxies.

12 M. SaÂnchez-Portal et al.
q 2000 RAS, MNRAS 312, 2±32
Figure 6. Ha isophotal maps of the central regions of the sample galaxies (continued).

Surface photometry of nearby active galaxies 13
q 2000 RAS, MNRAS 312, 2±32
Figure 7. Ha isophotal maps of the central regions of the sample galaxies (continued).

14 M. SaÂnchez-Portal et al.
observed displacement between the nucleus and the galaxy at
PA < 1158 is real. This has also been reported by MaÂrquez &
Moles (1994), but while they measure a displacement of about
15 arcsec, our data show a maximum displacement of only
4 arcsec.
The Ha contours are roundish, and the region is partially
resolved, with FWHM < 1:86 arcsec.
NGC 4151: in Figs 1 and 5 the peak isophotes correspond to
mI � 13:1 mag arcsec22 and mHa � 27:27 mag arcsec22. In both
contour plots the isophotal increment is 0.25 mag arcsec22.
While I-band isophotes are almost circular (only a very little
elongation with e < 0:04 and PA < 508 can be observed for
radius greater than 6 arcsec), the emission-line contours are
extended and notably elongated at PA < 508. An outstanding
difference is observed between the V- and R-band isophote shapes,
which follow closely the emission-line distribution, and the I-band
map, virtually free from emission-line contamination. All these
maps are described in detail in Terlevich et al. (1991).
NGC 5077: in Fig. 1 the peak isophote in the I-band map
corresponds to mI � 15:72 mag arcsec22, with isophotal incre-
ments of 0.25 mag arcsec22. The Ha map shown in Fig. 5 is
represented in logarithmic instrumental units.
This is an elliptical galaxy oriented at PA < 108 and all the I-
band isophotes, except the innermost ones, have the same
orientation.
The line-emitting region is roughly circular and resolved, with
FWHM < 3:13 arcsec.
NGC 6814: in Figs 1 and 5 the peak isophotes correspond to
mI � 15:84 mag arcsec22 and mHa � 33:58 mag arcsec22. In both
contour plots the isophotal increment is 0.25mag arcsec22.
The ellipticity of the isophotes in the I-band map changes from
e � 0 in the nucleus to 0.2 at r < 6 arcsec. At this point the
position angle is PA < 208, which corresponds to the orientation
of the bar in NGC 6814.
During the 1988 run, when the images were obtained, the
nucleus was experiencing a period of minimum activity (E. PeÂrez,
private communication) and we were able to produce the Ha -line
map by subtracting a pseudo-continuum estimated from the I
band. The Ha shows a compact region whose size FWHM <2:13 arcsec is nearly equal to the seeing disc.
NGC 513: in Fig. 1 the peak isophotes correspond to
mI � 15:7 mag arcsec22. The isophotal increment is 0.25 mag arc-
sec22. This galaxy does not have a morphological classification in
the catalogues. The inner I-band isophotes are roundish, but their
ellipticity increases up to e < 0:4 at r < 5 arcsec. Their elongated
shape indicate the presence of a bar at PA < 1158. The abrupt
change in the position angle at this point from PA < 1158 to 698,which is the position angle of the galaxy as a whole, is also strong
evidence for the existence of a bar (see next sections), as is the
small bump seen in the surface brightness profile. In the outer
regions, faint spiral arms tightly bound to the bulge might be
present. We propose that this galaxy be classified as SAB(r)a.
NGC 1068: in Figs 2 and 5 the peak isophotes correspond to
mI � 13:48 mag arcsec22 and mHa � 28:35 mag arcsec22. In the I-
band plot the isophotal increment is 0.2 mag arcsec22, while in the
Ha one the increment is 0.25 mag arcsec22.
The inner isophotes of the stellar continuum map gain ellipticity
from the centre to r < 12 arcsec, where they reach e < 0:4 at
PA < 608. From this point on, the ellipticity decreases again. This
maximum in the radial variation of the ellipticity and the oval
shape that the isophotes adopt lead us to reclassify this galaxy as
SAB. The full image of the galaxy (not shown here) shows that the
spiral arms departure from the bar at PA < 608. This feature has
not been observed in photographic plates (e.g. Kodaira, Okamura
& Ichikawa 1990), since the bulge of the galaxy is usually over-
exposed due to the steep inner surface brightness profile.
Along with NGC 4151, this is one of the few galaxies in
our sample whose V and R contour maps differ substantially
from the I-band one. While in I the inner isophotes are quite
circular, in V and R they present elongations. This behaviour of the
V and R maps can be also explained by strong emission-line
contamination.
The emission-line map shows a very extended region. The
central zone is compact but resolved, and oriented at PA , 08 to
188.Mrk 620: in Figs 2 and 6 the peak isophotes correspond to
mI � 15:44 mag arcsec22 and mHa � 31:51 mag arcsec22. In both
contour plots the isophotal increment is 0.25 mag arcsec22. In the
I-band map, the position angle of the isophotes change from PA <108 at the centre to PA < 1108 at r < 9 arcsec. This is the position
of the bar.
The Ha region is resolved and elongated at PA < 108.Mrk 622: in Figs 2 and 6 the peak isophotes correspond to
mI � 15:96 mag arcsec22 and mHa � 34 mag arcsec22. In the I-
band plot the isophotal increment is 0.25 mag arcsec22, while in
the Ha one the increment is 0.2 mag arcsec22.
MacKenty (1990) classifies this galaxy as SO/a, considering it
an amorphous galaxy, possibly with spiral structure. Although the
galaxy has a disc, we have not been able to detect any spiral
pattern, even after masking the nucleus. This is why we consider
this object a lenticular galaxy. The variation of the ellipticity from
e < 0:28 at r < 4 arcsec to e < 0:34 at r < 12 arcsec (as well as
the twisting of the position angle at the same distances), and its
subsequent monotonical fall until e < 0:1 at the outermost radii
could be the signature of a bar. This leads us to suggest a
reclassification of this galaxy as SB0.
Extended line emission at PA , 458 is observed, but the small
angular size of the object, the relatively poor seeing �FWHM <1:95 arcsec� and the uncertainties involved in the continuum
subtraction process make the estimation of the linear size of the
region difficult. A Gaussian fit to the emitting region gives a value
of FWHM < 2:1 arcsec, slightly larger than the seeing disc.
NGC 3982: in Figs 2 and 6 the peak isophotes correspond to
mI � 16:2 mag arcsec22 and mHa � 34:5 mag arcsec22. In the I-
band plot the isophotal increment is 0.25 mag arcsec22, while in
the Ha one the increment is 0.5 mag arcsec22.
The stellar continuum map shows that the isophotes are oriented
at PA < 208, and their ellipticity changes monotonically from e <0:1 to 0.35 at r < 6 arcsec with PA < 08. This can be considered
the position of the bar.
The line-emitting region is unresolved. A ring composed by H ii
regions is observed at the edge of the area shown in the Ha map.
NGC 5347: in Figs 2 and 6 the peak isophotes correspond to
mI � 19:09 mag arcsec22 and mHa � 35 mag arcsec22. In both
contour plots the isophotal increment is 0.25 mag arcsec22.
The I-band isophotes are oriented at PA < 978, which
corresponds to the orientation of the bar. The ellipticity changes
monotonically from e < 0:1 at the centre to 0.5 at r < 17 arcsec
due to the presence of the bar.
The Ha nuclear emission region is extended and asymme-
trically oriented at PA < 408. Its total angular size is about
6 arcsec, very similar to that measured by Pogge (1989a).
NGC 6217: in Figs 2 and 6 the peak isophotes correspond
to mI � 14:61 mag arcsec22 and mHa � 31:6 mag arcsec22. In the
q 2000 RAS, MNRAS 312, 2±32

Surface photometry of nearby active galaxies 15
I-band plot the isophotal increment is 0.3 mag arcsec22, while in
the Ha one the increment is 0.25 mag arcsec22.
The stellar continuum map shows isophotes oriented at
PA < 1508, which is the orientation of its prominent bar.
The emission-line map shows a resolved nuclear region of
FWHM , 2:1 arcsec.
NGC 7479: in Figs 2 and 6 the peak isophotes correspond to
mI � 16:31 mag arcsec22 and mHa � 34:5 mag arcsec22. In both
contour plots the isophotal increment is 0.2 mag arcsec22.
The stellar continuum images reveal a small bulge whose
isophotes are oriented at PA < 408. This angle varies subsequently
until PA < 138, which is the position of the bar. The isophotes are
deformed to the NS due to the presence of dust in the bar.
The nuclear line-emitting region is small but resolved, with a
total size of about 3 arcsec (630 pc) and elongated at PA < 1208.NGC 1052: in Figs 2 and 6 the peak isophotes correspond to
mI � 14:61 mag arcsec22 and mHa � 31:02 mag arcsec22. In both
contour plots the isophotal increment is 0.25 mag arcsec22.
The isophotes in I-band are oriented at the same position angle
as the whole galaxy, PA < 1138.The Ha line-emitting region is resolved �FWHM <
1:93 arcsec� and elongated at PA < 698. The total angular size
is about 12 arcsec, smaller than the size derived by Fosbury et al.
(1978) of about 20 arcsec.
NGC 2841: in Figs 3 and 6 the peak isophotes correspond to
mI � 13:9 mag arcsec22 and mHa � 34:0 mag arcsec22. In the I-
band plot the isophotal increment is 0.25 mag arcsec22, while in
the Ha one the increment is 0.2 mag arcsec22.
The stellar continuum isophotes are very regular and oriented at
PA < 1508, which is the general orientation of the galaxy. The
precession of about 108 from r < 10 arcsec to r < 32 arcsec in the
position angle of the isophotes attributed by Varela (1992) to a
triaxial bulge is not observed in our I-band images, although it is
indeed present in the V and R bands.
The small line-emitting region is elongated at PA < 1468. The
region is resolved in the direction of elongation, but not in the
orthogonal one.
M106 (NGC 4258): in Figs 3 and 7 the peak isophotes correspond
to mI � 14:25 mag arcsec22 and mHa � 35:0 mag arcsec22: In the I-
band plot the isophotal increment is 0.25 mag arcsec22, while in the
Ha one the increment is 0.2 mag arcsec22.
The I-band map shows a dust band crossing the frame near the
nucleus in the direction NW to SE. Apart from this obvious
distortion, the isophotes are quite regular and oriented at
PA < 1508. The ellipticity increases monotonically from values
e � 0:1 in the centre to e � 0:6 at r < 12 arcsec, where it reaches
a maximum; at r < 20 arcsec, the ellipticity decreases abruptly to
values around e � 0:4 (see Fig. 16). The variation of the ellipticity
reflects the behaviour of the bar, whose maximum radius is about
r < 20 arcsec.
In the Ha map we observe extended emission oriented at PA <1358 and an unresolved compact nuclear region. The overall size
of the emitting region is about 4.5 to 6 arcsec.
M51 (NGC 5194): in Figs 3 and 7 the peak isophotes correspond
to mI � 14:5 mag arcsec22 and mHa � 32:4 mag arcsec22. In the I-
band plot the isophotal increment is 0.25 mag arcsec22, while in the
Ha one the increment is 0.2 mag arcsec22.
The inner isophotes of the I-band map are elongated at
PA < 08. These are the signature of a small bulge. From r <3 arcsec onwards the isophotes become irregular due to the
presence of dusty spiral arms.
The following features are observed in the Ha map: (a) a
nuclear region elongated at PA < 1678 and partially resolved; (b)
a round region with a diameter of about 3 arcsec (37 pc) located to
the SE of the nuclear region; and (c) a fainter ring-shaped
structure located to the NW of diameter 8.5 arcsec (104 pc). These
Ha structures are aligned in the direction of the nuclear
elongation, and match those observed by Ford et al. (1985).
NGC 7177: in Figs 3 and 7 the peak isophotes correspond to
mI � 15:72 mag arcsec22 and mHa � 35:5 mag arcsec22. In the I-
band plot the isophotal increment is 0.25 mag arcsec22, while in
the Ha one the increment is 0.2 mag arcsec22. The I-band map
shows a progressive elongation of the isophotes until they are
aligned at PA < 208, which corresponds to the bar position angle.
The line-emitting region is resolved in several nodes (H ii
regions) that compose a pseudo-ring (Alvarez Alvarez 1997), but
there is not a neat nuclear region. The Ha image from Pogge
(1989b) shows a stellar nucleus that is not present in our images,
as well as the individual H ii regions without a specific distribution
pattern.
NGC 7217: in Figs 3 and 7 the peak isophotes correspond to
mI � 14:88 mag arcsec22 and mHa � 32:31 mag arcsec22. In both
contour plots the isophotal increment is 0.2 mag arcsec22.
The I-band isophotes are very circular and regular �e & 0:1�,aligned at PA < 758.
The Ha line-emitting region is extended with a total size of
about 9 arcsec (112 pc).
NGC 2146: in Figs 3 and 7 the peak isophotes correspond to
mI � 16:2 mag arcsec22 and mHa � 33:4 mag arcsec22. In both
contour plots the isophotal increment is 0.2 mag arcsec22.
The I-band isophotes are very irregular, revealing a dust lane
which crosses the galaxy from NW to SE at PA < 1308.The Ha nuclear line emission is extended. A big H ii region is
observed SE of the nucleus.
NGC 3310: in Figs 3 and 7 the peak isophotes correspond to
mI � 14:5 mag arcsec22 and mHa � 31:5 mag arcsec22. The iso-
photal increment is 0.25 mag arcsec22 in the I-band plot and
0.5 mag arcsec22 in the Ha one; the size of the plots has been
enlarged to 33 � 33 arcsec2 in order to show the outstanding
circumnuclear ring.
The I-band map shows a compact centre, which corresponds to
the small bulge of the galaxy. Ouside this region of about 5 arcsec,
the isophotes reveal the positions of the stars in the circumnuclear
ring. We can see that the stellar nucleus is the centre of symmetry
of the stellar distibution. On the other hand, the Ha map shows an
unresolved nuclear region and a circumnuclear ring elongated at
PA < 1408, whose centre is displaced about 2.7 arcsec to the SE
of the stellar nucleus. To the SW and NE, two spiral arms arise
tangent to the ring. At the beginning of the SW arm, a giant H ii
region is observed. This region is resolved into two components. It
has been suggested that this region is the result of a merger
(Schweizer 1983).
NGC 3353: in Figs 3 and 7 the peak isophotes correspond to
mI � 17:4 mag arcsec22 and mHa � 31:7 mag arcsec22. In both
contour plots the isophotal increment is 0.5 mag arcsec22. The size
of the plots has been enlarged to 33 � 33 arcsec2 in order to show
all the extranuclear sources.
The galaxy shows merger structures. In the I-band image the
centre comprises a strong source to the NW, and two more sources
to the S and NE. The latter two sources are stronger in the R-band
map, where more regions are observed further away to the SW.
These two regions are located in the isophotal tail of the I-band
map. Except for these prominent features the overall pattern of the
isophotes is rather regular, and they are oriented at PA < 458.
q 2000 RAS, MNRAS 312, 2±32

16 M. SaÂnchez-Portal et al.
Several resolved regions are observed in the Ha map: an intense
source located to the NW of the centre, a fainter source located to
the NE, and two more sources at the bottom right corner of the map.
An additional source, that may correspond to the symmetry centre
of the underlying stellar distribution and is clearly observed in our
broad-band images (SaÂnchez-Portal 1996), and in particular in the I-
band one, is not detected in the Ha frame.
NGC 1023: in Fig. 4 the peak isophotes correspond to mI �13:85 mag arcsec22: The isophotal increment is 0.25 mag arcsec22.
The stellar continnum presents regular isophotes which increase
monotonically their ellipticity towards the outer regions due to the
presence of a bar.
NGC 6340: in Figs 4 and 7 the peak isophotes correspond to
mI � 15:22 mag arcsec22 and mHa � 35:9 mag arcsec22. The iso-
photal increment is 0.25 mag arcsec22 in the I-band plot and
0.2 mag arcsec22 in the Ha one.
The I-band isophotes are nearly circular with an overall
inclination of PA < 238.A very weak extranuclear emission is observed in Ha . The
spectrum from Ho et al. (1995) in this position shows a weak [N ii]
feature.
NGC 6384: in Fig. 4 the peak isophotes correspond to
mI � 16:12 mag arcsec22. The isophotal increment is 0.2 mag arc-
sec22.
The stellar continuum image presents very regular elongated
isophotes at PA < 338, corresponding to the orientation of the bar.
3.4 Broad-band surface brightness and colour profiles
The analysis of the radial surface brightness variation of regular
galaxies is based on the assumption that the isophotes can be
represented by a series of nested ellipses. Therefore each point of
the profile can be determined by the ellipse semi-axis and the
surface brightness value along the ellipse.
We have obtained the azimuthally averaged surface brightness
profiles from the broad-band VRI images using the program prof
described by Davies et al. (1985). This program makes use of an
initial guess of ellipse centre, ellipticity and position angle, and
assuming that the azimuthal variation of the surface brightness is a
periodic function, this can therefore be expressed as a Fourier
series I�f� � I0 �P4
n�1�An sin nf� Bn cos nf�. The program
calculates the coefficients of the series using a least-squares
minimization technique.
The profile errors have been computed taking into account the
source photon noise, the sky value error and the CCD readout
noise, according to the equation (Granato et al. 1993)
s2kIl
kIl2� �ne � s2
ron
Nring� �ne � �ne�2� �nbk � s2
ron
Nbk� �ne � �ne�2� s2
bk
� �ne � �ne�2; �6�
where Nring and Nbk are, respectively, the number of pixels
contained in the ring used for profile calculation and in the region
used for sky computation, nÅe is the mean electron count in the ring
pixels, nÅbk is the mean electron count from the background, sbk is
the background error, and s ron is the CCD readout noise.
Figs 8±20 show the surface brightness profiles4 (not corrected
for inclination), the radial variation of ellipticity and position
angle, and the R 2 I and V 2 I colour profiles for the sample
objects. The colour profiles have been computed subtracting the
surface brigthness profiles. In a few cases, generally related to the
presence of bars, some irregularities are observed in the colour
profiles. These are most likely due to artefacts in the surface
brightness profile interpolation. All the data can be obtained by
anonymous ftp at astro1.ft.uam.esThe position angles and inclinations of the sample galaxies have
been derived by averaging these parameters among the outermost
valid ellipses fitted to each frame through the prof program. The
final values adopted, presented in Table 4, have been obtained as
the mean of the results for each of the three broad-band filters. The
inclination value of NGC 4151 has been taken from Simkin (1975),
as the position of our outermost isophotes �PA . 1308� does not
correspond to the position angle of the disc but of a bar. The surface
brightness profile of NGC 7479 is dominated also by the strong bar,
therefore preventing us from obtaining accurate values of position
angle and inclination. We did not attempt to obtain azimuthally
averaged profiles of the irregular galaxy NGC 3353.
The derived values of inclination can be used to correct the
surface brightness profile, as well as all derived morphological
parameters:
mreal � mobs 2 2:5 log�1 2 e�; �7�
where 1 2 e � b=a � cos i, and b and a are, respectively, the
semimajor and semiminor axes of the galaxy.
The broad-band images and profiles can be used to determine
the existence of bars. We have applied the following criteria. (a)
The bar is seen in the broad-band images. (b) The ellipticity
presents a maximum (or two maxima, in the case of double-barred
galaxies) and then decreases to reveal the inclination of the disc;
the position angle keeps roughly constant while the ellipticity is
rising (Mulchaey, Regan & Kundu 1997). (c) There is either a
q 2000 RAS, MNRAS 312, 2±32
Table 4. Mean position angle and inclination of thesample galaxies.
Galaxy PA (8) i (8)
NGC 3227 150:2 ^ 1:8 63:6 ^ 0:7NGC 3516 46:9 ^ 3:2 37:7 ^ 0:3NGC 3998 136:5 ^ 1:3 37:4 ^ 0:7NGC 7469 139:0 ^ 15:0 32:5 ^ 3:6NGC 4151 26:0 ^ 3:5 21:0 ^ 5:0NGC 5077 10:1 ^ 0:2 45:0 ^ 0:1NGC 6814 113:0 ^ 10:0 22:5 ^ 1:2NGC 513 69:3 ^ 1:2 54:8 ^ 2:9NGC 1068 19:5 ^ 1:0 38:3 ^ 1:3Mrk 620 (NGC 2273) 84:4 ^ 1:6 43:0 ^ 0:1Mrk 622 41:3 ^ 10:0 26:0 ^ 1:7NGC 3982 16:9 ^ 1:1 27:2 ^ 1:1NGC 5347 117:5 ^ 0:9 38:2 ^ 1:4NGC 6217 159:7 ^ 1:9 44:8 ^ 0:9NGC 7479 ± ±NGC 1052 113:4 ^ 1:2 48:8 ^ 0:3NGC 2841 149:7 ^ 1:9 59:0 ^ 0:9M106 (NGC 4258) 161:6 ^ 2:6 55:9 ^ 0:7M51 (NGC 5194) 143:2 ^ 0:9 26:2 ^ 3:4NGC 7177 83:6 ^ 1:2 49:2 ^ 1:0NGC 7217 75:8 ^ 6:5 28:7 ^ 0:6NGC 2146 133:5 ^ 0:2 64:3 ^ 0:9NGC 3310 176:8 ^ 4:3 35:9 ^ 0:8NGC 3353 ± ±NGC 1023 78:2 ^ 3:5 60:4 ^ 5:3NGC 6340 107:9 ^ 8:2 23:1 ^ 1:5NGC 6384 32:9 ^ 2:7 37:4 ^ 4:7
4 We have adopted the equivalent radius, introduced by de Vaucouleurs
et al. (1976; Second Reference Catalog) and defined by req ���������a=p
p,
where a is the area enclosed by the isophote, i.e., the radius of the circle
whose area is equal to that of the isophote.

Surface photometry of nearby active galaxies 17
q 2000 RAS, MNRAS 312, 2±32
Figure 8. Top panel: surface brightness profiles in the V (*), R (W) and I (e) bands; middle panels: I-band ellipticity and polar angle profiles; bottom panels:
R 2 I and V 2 I colour profiles.

18 M. SaÂnchez-Portal et al.
q 2000 RAS, MNRAS 312, 2±32
Figure 9. Top panel: surface brightness profiles in the V (*), R (W) and I (e) bands; middle panels: I-band ellipticity and polar angle profiles; bottom panels:
R 2 I and V 2 I colour profiles.

Surface photometry of nearby active galaxies 19
q 2000 RAS, MNRAS 312, 2±32
Figure 10. Top panel: surface brightness profiles in the V (*), R (W) and I (e) bands; middle panels: I-band ellipticity and polar angle profiles; bottom panels:
R 2 I and V 2 I colour profiles.

20 M. SaÂnchez-Portal et al.
q 2000 RAS, MNRAS 312, 2±32
Figure 11. Top panel: surface brightness profiles in the V (*), R (W) and I (e) bands; middle panels: I-band ellipticity and polar angle profiles; bottom panels:
R 2 I and V 2 I colour profiles.

Surface photometry of nearby active galaxies 21
q 2000 RAS, MNRAS 312, 2±32
Figure 12. Top panel: surface brightness profiles in the V (*), R (W) and I (e) bands; middle panels: I-band ellipticity and polar angle profiles; bottom panels:
R 2 I and V 2 I colour profiles.

22 M. SaÂnchez-Portal et al.
q 2000 RAS, MNRAS 312, 2±32
Figure 13. Top panel: surface brightness profiles in the V (*), R (W) and I (e) bands; middle panels: I-band ellipticity and polar angle profiles; bottom panels:
R 2 I and V 2 I colour profiles.

Surface photometry of nearby active galaxies 23
q 2000 RAS, MNRAS 312, 2±32
Figure 14. Top panel: surface brightness profiles in the V (*), R (W) and I (e) bands; middle panels: I-band ellipticity and polar angle profiles; bottom panels:
R 2 I and V 2 I colour profiles.

24 M. SaÂnchez-Portal et al.
q 2000 RAS, MNRAS 312, 2±32
Figure 15. Top panel: surface brightness profiles in the V (*), R (W) and I (e) bands; middle panels: I-band ellipticity and polar angle profiles; bottom panels:
R 2 I and V 2 I colour profiles.

Surface photometry of nearby active galaxies 25
q 2000 RAS, MNRAS 312, 2±32
Figure 16. Top panel: surface brightness profiles in the V (*), R (W) and I (e) bands; middle panels: I-band ellipticity and polar angle profiles; bottom panels:
R 2 I and V 2 I colour profiles.

26 M. SaÂnchez-Portal et al.
q 2000 RAS, MNRAS 312, 2±32
Figure 17. Top panel: surface brightness profiles in the V (*), R (W) and I (e) bands; middle panels: I-band ellipticity and polar angle profiles; bottom panels:
R 2 I and V 2 I colour profiles.

Surface photometry of nearby active galaxies 27
q 2000 RAS, MNRAS 312, 2±32
Figure 18. Top panel: surface brightness profiles in the V (*), R (W) and I (e) bands; middle panels: I-band ellipticity and polar angle profiles; bottom panels:
R 2 I and V 2 I colour profiles.

28 M. SaÂnchez-Portal et al.
q 2000 RAS, MNRAS 312, 2±32
Figure 19. Top panel: surface brightness profiles in the V (*), R (W) and I (e) bands; middle panels: I-band ellipticity and polar angle profiles; bottom panels:
R 2 I and V 2 I colour profiles.

Surface photometry of nearby active galaxies 29
q 2000 RAS, MNRAS 312, 2±32
Figure 20. Top panel: surface brightness profiles in the V (*), R (W) and I (e) bands; middle panels: I-band ellipticity and polar angle profiles; bottom panels:
R 2 I and V 2 I colour profiles.

30 M. SaÂnchez-Portal et al.
strong, well-localized, hump-like inner isophotal twist or a jump
in the polar angle profile; outer isophotal twists may result from
tidal effects (Nieto et al. 1992). In many cases, the criteria
coincide with the previous morphological classification given in
RC3 (Table 2). However, there are several important features and
discrepancies.
(1) NGC 3227. We fail to detect a bar from our ellipticity and
polar angle profiles. In our images, a large-scale bar-like shape is
seen at PA , 1608; the Ks ellipticity profile from Mulchaey et al.
(1997), shows a maximum at about 50 arcsec (5 kpc), but cannot
trace the full length of the bar.
(2) NGC 4151. While not obvious in our frames, a large-scale
bar with PA , 1308 is clearly seen in photographic U and IIIa-J
plates from Simkin (1975). Our ellipticity profile, very close to the
Ks one from Mulchaey et al. (1997), shows a maximum at
req . 4:2 kpc.
(3) NGC 513. A clear hump-like isophotal twist is observed at
req . 1:2 kpc, indicating the possible existence of a bar at
PA , 1158; there is no previous morphological classification.
The broad-band images show two weak spiral arms tightly bound
to the bulge. These features lead us to classify this galaxy as
SABa.
(4) NGC 1068. A maximum in ellipticity is seen at req . 1 kpc,
with PA , 608. The bar is also clearly seen in the broad-band
images, confirming previous results (e.g. Scoville et al. 1988;
Thronson et al. 1989; Xanthopoulos 1996). Its classification
should therefore be modified from SAb to SABb.
q 2000 RAS, MNRAS 312, 2±32
Figure 21. Distribution of morphological Hubble types of the sample galaxies.

Surface photometry of nearby active galaxies 31
(5) Mrk 622. A clear maximum in ellipticity at req . 2 kpc is
observed; there is no previous accurate morphological classifi-
cation for this galaxy. MacKenty (1990) classifies this object as
S0/a. While the galaxy has a disc, we did not observe any trace
of spiral structure. Therefore we classify the galaxy as SB0.
(6) M51. A local maximum in ellipticity is seen at
req . 0:45 kpc, with PA , 1508. This effect can be due either to
a small inner bar or to the presence of the tightly bound spiral
arms. We still consider this galaxy as unbarred.
4 D I S C U S S I O N
Fig. 21 shows the distribution of Hubble morphological types
ranging from ellipticals �T � 25� to irregulars �T � 210�according to the nuclear type for the sample galaxies. The
reduced size of the sample prevents us from performing a detailed
statistical analysis. The greatest frequency corresponds to early-
type spirals, from Sa �T � 1� to Sbc �T � 4�. Three out of 15 of
the Seyfert nuclei lie in lenticular galaxies of S0 �T � 22� and
S0a �T � 0� type. This ratio is lower than that observed in
Xanthopoulos (1996) sample, 44 per cent (12 out of 27), and close
to that obtained by MacKenty (1990), 18±27 per cent for a sample
of 51 galaxies. On the other hand, a slight tendency for Seyfert 2
nuclei to inhabit galaxies of later morphological type than Seyfert
1 nuclei, can be guessed from our sample data. Khachikian &
Weedman (1971) observed certain preference for Seyfert 2 nuclei
to lie in spiral galaxies, and in amorphous objects in the case of
Seyfert 1 nuclei. Our LINERs appear generally in early spirals,
while the starburst galaxies are spirals of type Sab and Sbc.
As stated before, there are controversial clues about the
connection between bars and nuclear activity. Table 5 shows the
incidence of bars (according to our revised classification) in the
different nuclear types of the sample. A high fraction of the
objects that present any kind of nuclear activity, about 71 per cent,
are barred. This fraction is higher if only Seyfert galaxies are
considered, about 87 per cent (,71 per cent of Seyfert 1 galaxies,
100 per cent of Seyfert 2). These values are higher that those
obtained by MacKenty (1990) (about 30 per cent in spiral
galaxies) and Xanthopoulos (1996) (42 per cent in Seyfert 1 and
60 per cent in Seyfert 2), and similar to the fraction obtained by
Simkin, Su & Schwartz (1980) (about 70 per cent). If we adopt a
mean value of 59 per cent of barred objects for galaxies of any
nuclear kind (Simkin et al. 1980), our result can reinforce the
clues of connection between bars and nuclear activity. Never-
theless, near-infrared Ks band observations from Mulchaey et al.
(1997) of a sample of 33 Seyfert galaxies and the same number of
normal galaxies reveal that the incidence of bars in the sample
Seyfert and normal galaxies is roughly the same, about 70 per
cent; many normal galaxies formerly classified as unbarred show
bars in the near-infrared. On the other hand, a significant fraction
of Seyfert galaxies do not present evidence of bars even in the
near-infrared. Mulchaey & Regan (1997) suggest that maybe
kiloparsec-scale bars are not a universal fuelling mechanism in
Seyfert galaxies; alternatively, a possible explanation for the lack
of bars in some Seyfert galaxies is that the bars were recently
destroyed, possibly by the formation of the central black hole.
AC K N OW L E D G M E N T S
We are grateful to Emily Xanthopoulos for her critical analysis
that largely contributed towards improving the paper.
The JKT is operated on the island of La Palma by the Isaac
Newton Group in the Spanish Observatorio del Roque de los
Muchachos of the Instituto de AstrofuÂsica de Canarias. We thank
CAT for awarding observing time.
R E F E R E N C E S
Alvarez Alvarez M., 1997, Master's thesis, Univ. AutoÂnoma de Madrid
Argyle R. W., Mayer C. J., Pike C. D., Jorden P. R., 1998 (February), A
User Guide to the JKT CCD Camera,
Arsenault R., 1989, A&A, 217, 66
Burstein D., Heiles C., 1984, ApJS, 54, 33
Davies L. E., Cawson M., Davies R. L., Illingworth G., 1985, AJ, 90, 169
De Robertis M. M., Hayhoe K., Yee H. K. C., 1998, ApJS, 115, 163
de Vaucouleurs G., de Vaucouleurs A., Corwin H. G., Jr, 1976, Second
Reference Catalog of Bright Galaxies, Univ. Texas Monograph. Univ.
Texas Press, Austin (RC2)
de Vaucouleurs G., de Vaucouleurs A., Corwin H. G. Jr., Buta R., Paturel
G., Fouque P., 1991, Third Reference Catalog of Bright Galaxies.
Springer, New York (RC3)
Ford H. C., Crane P. C., Jacoby G. H., Lawrie D. G., van der Hulst J. M.,
1985, ApJ, 293, 132
Fosbury R. A. E., Mebold U., Goss W. M., Dopita M. A., 1978, MNRAS,
183, 549
Granato G. L., Zitelli V., Bonoli F., Danese L., Bonoli C., Delpino F., 1993,
ApJS, 89, 35
Heckman T. M., 1980a, A&A, 87, 142
Heckman T. M., 1980b, A&A, 87, 152
Ho L. C., Filippenko A. V., Sargent W. L. W., 1995, ApJS, 98, 477
Hunt L. K., Malkan M. A., Salvati M., Mandolesi N., Palazzi E., Wade R.,
1997, ApJS, 108, 229
Khachikian E. Y., Weedman D. W., 1971, Afz, 7, 389
Kodaira K., Okamura S., Ichikawa S., 1990, Photometric Atlas of Northern
Bright Galaxies. Univ. Tokyo Press
Kotilainen J. K., Ward M. J., 1994, MNRAS, 266, 953
Landolt A. U., 1983, AJ, 88, 439
MacKenty J. W., 1990, ApJS, 72, 231
MaÂrquez I., Moles M., 1994, AJ, 108, 90
Massey P., Strobel K., Barnes J. V., Anderson E., 1988, ApJ, 328, 315
Mulchaey J. S., Regan M. W., 1997, ApJ, 482, L135
Mulchaey J. S., Regan M. W., Kundu A., 1997, ApJS, 110, 299
Nieto J. L., Bender R., Poulain P., Surma P., 1992, A&A, 257, 97
Norman C., Scoville N., 1988, ApJ, 332, 124
Pedlar A., Kukula M. J., Longley D. P. T., Muxlow T. W. B., Axon D. J.,
Baum S., O'Dea C., Unger S. W., 1993, MNRAS, 263, 471
Penston M. V. et al., 1981, MNRAS, 196, 857
Perry J. J., 1992, in Filippenko A. V., ed., ASP Conf. Ser. Vol. 31,
Relationships between Active Galactic Nuclei and starburst Galaxies.
Astron Soc. Pac., San Francisco, p. 169
Pogge R. W., 1989a, ApJ, 345, 730
Pogge R. W., 1989b, ApJS, 71, 433
Rees M. J., 1984, ARA&A, 22, 471
SaÂnchez-Portal M., 1996, PhD thesis, Univ. AutoÂnoma de Madrid
Schweizer F., 1983, in Athanassoula E., ed., Internal Kinematics and
Dynamics of Galaxies. Reidel, Dordrecht, p. 319
q 2000 RAS, MNRAS 312, 2±32
Table 5. Bar incidence versus nuclear type.
Nuclear type Barred Unbarred EllipticalSB type SAB type
Sy 1 1 4 1 1Sy 2 5 3 0 0LINER 0 2 3 1Starburst 1 1 1 0
Total 17 5 2

32 M. SaÂnchez-Portal et al.
Scoville N. Z., Matthews K., Carico D. P., Sanders D. B. 1988, ApJ, 327,
L61
Seaton M. J., 1975, MNRAS, 170, 475
Simkin S. M., 1975, ApJ, 200, 567
Simkin S. M., Su H. J., Schwarz M. P., 1980, ApJ, 237, 404
Stone R. P. S., 1977, ApJ, 218, 767
Terlevich R. J., 1992 in Filippenko, A. V. ed., ASP Conf. Ser Vol. 31,
Relationships between Active Galactic Nuclei and Starburst Galaxies.
Astron. Soc. Pac., San Francisco, p. 133
Terlevich R. J., SaÂnchez-Portal M., DõÂaz A. I., Terlevich E., 1991,
MNRAS, 249, 36
Thronson H. A., Jr et al., 1989, ApJ, 343, 158
Ulvestad J., Wilson A. S., 1984, ApJ, 285, 439
Ulvestad J., Wilson A. S., Sramek R. A., 1981, ApJ, 247, 419
Varela A. M., 1992, PhD thesis, Instituto de AstrofõÂsica de Canarias,
VeÂron-Cetty M. P., VeÂron P., 1985, A Catalogue of Quasars and Active
Nuclei. ESO Scientific Report No. 4,
Wrobel J. M., Heeschen D. S., 1988, ApJ, 335, 677
Xanthopoulos E., 1996, MNRAS, 280, 6
Yee H. K., 1983, ApJ, 272, 473
This paper has been typeset from a TEX/LATEX file prepared by the author.
q 2000 RAS, MNRAS 312, 2±32


![Optical and Infrared Photometry of the Nearby Type I[CLC]a[/CLC] Supernova 2001[CLC]el[/CLC](https://static.fdokumen.com/doc/165x107/631f65313fc948596809c568/optical-and-infrared-photometry-of-the-nearby-type-iclcaclc-supernova-2001clcelclc.jpg)