DEEP FABRY-PEROT Hα OBSERVATIONS OF NGC 7793: A VERY EXTENDED Hα DISK AND A TRULY DECLINING...
28
arXiv:0802.2545v1 [astro-ph] 18 Feb 2008 Accepted for Publication in The Astronomical Journal Deep Fabry-Perot Hα Observations of NGC 7793: a Very Extended Hα Disk and a Truly Declining Rotation Curve I. Dicaire 1 , C. Carignan 1 , P. Amram 2 , M. Marcelin 2 , J. Hlavacek–Larrondo 1 , M.–M. de Denus-Baillargeon 1 , O. Daigle 1,2 and O. Hernandez 1 ABSTRACT Deep Hα observations of the Sculptor Group galaxy NGC 7793 were ob- tained on the ESO 3.60m and the Marseille 36cm telescopes at La Silla, Chile. Hα emission is detected all the way to the edge of the H I disk, making of the H II disk of NGC 7793 one of the largest ever observed in a quiet non-AGN late– type system. Even in the very outer parts, the H II ionizing sources are probably mainly internal (massive stars in the disk) with an unlikely contribution from the extragalactic ionizing background. The Hα kinematics confirms what had already been seen with the H I observations: NGC 7793 has a truly declining rotation curve. However, the decline is not Keplerian and a dark halo is still needed to explain the rotation velocities in the outer parts. Subject headings: instrumentation: interferometers – techniques: radial veloci- ties – galaxies: kinematics and dynamics – galaxies: individual (NGC 7793) – galaxies: ISM 1. Introduction NGC 7793 is one of the 5 bright members of the classical Sculptor Group along with NGC 55, NGC 247, NGC 253 and NGC 300. Sculptor is the closest group of galaxies outside the Local Group. It covers an area of ∼ 20 ◦ in diameter centered on the constellation Sculptor at α =0 h 30 m and δ = −30 ◦ (de Vaucouleurs 1959). However, it is still debated whether 1 Laboratoire d’Astrophysique Exp´ erimentale, D´ epartement de physique, Universit´ e de Montr´ eal, C. P. 6128, Succ. centre-ville, Montr´ eal, Qu´ e., Canada H3C 3J7 2 Laboratoire d’Astrophysique de Marseille, Observatoire Astronomique Marseille Provence, Universit´ e de Provence & CNRS, 2 place Le Verrier, F-13248 Marseille CEDEX 04, France
-
Upload
independent -
Category
Documents
-
view
0 -
download
0
Transcript of DEEP FABRY-PEROT Hα OBSERVATIONS OF NGC 7793: A VERY EXTENDED Hα DISK AND A TRULY DECLINING...

arX
iv:0
802.
2545
v1 [
astr
o-ph
] 1
8 Fe
b 20
08
Accepted for Publication in The Astronomical Journal
Deep Fabry-Perot Hα Observations of NGC 7793:
a Very Extended Hα Disk and a Truly Declining Rotation Curve
I. Dicaire1, C. Carignan1, P. Amram2, M. Marcelin2, J. Hlavacek–Larrondo1,
M.–M. de Denus-Baillargeon1, O. Daigle1,2 and O. Hernandez1
ABSTRACT
Deep Hα observations of the Sculptor Group galaxy NGC 7793 were ob-
tained on the ESO 3.60m and the Marseille 36cm telescopes at La Silla, Chile.
Hα emission is detected all the way to the edge of the H I disk, making of the
H II disk of NGC 7793 one of the largest ever observed in a quiet non-AGN late–
type system. Even in the very outer parts, the H II ionizing sources are probably
mainly internal (massive stars in the disk) with an unlikely contribution from
the extragalactic ionizing background. The Hα kinematics confirms what had
already been seen with the H I observations: NGC 7793 has a truly declining
rotation curve. However, the decline is not Keplerian and a dark halo is still
needed to explain the rotation velocities in the outer parts.
Subject headings: instrumentation: interferometers – techniques: radial veloci-
ties – galaxies: kinematics and dynamics – galaxies: individual (NGC 7793) –
galaxies: ISM
1. Introduction
NGC 7793 is one of the 5 bright members of the classical Sculptor Group along with
NGC 55, NGC 247, NGC 253 and NGC 300. Sculptor is the closest group of galaxies outside
the Local Group. It covers an area of ∼ 20◦ in diameter centered on the constellation Sculptor
at α = 0h30m and δ = −30◦ (de Vaucouleurs 1959). However, it is still debated whether
1Laboratoire d’Astrophysique Experimentale, Departement de physique, Universite de Montreal, C. P.
6128, Succ. centre-ville, Montreal, Que., Canada H3C 3J7
2Laboratoire d’Astrophysique de Marseille, Observatoire Astronomique Marseille Provence, Universite de
Provence & CNRS, 2 place Le Verrier, F-13248 Marseille CEDEX 04, France
– 2 –
Sculptor is really a group. Karachentsev et al. (2003) suggest instead that it may be part of
a filament that extends along the line of sight from the Local Group out to ∼ 5 Mpc.
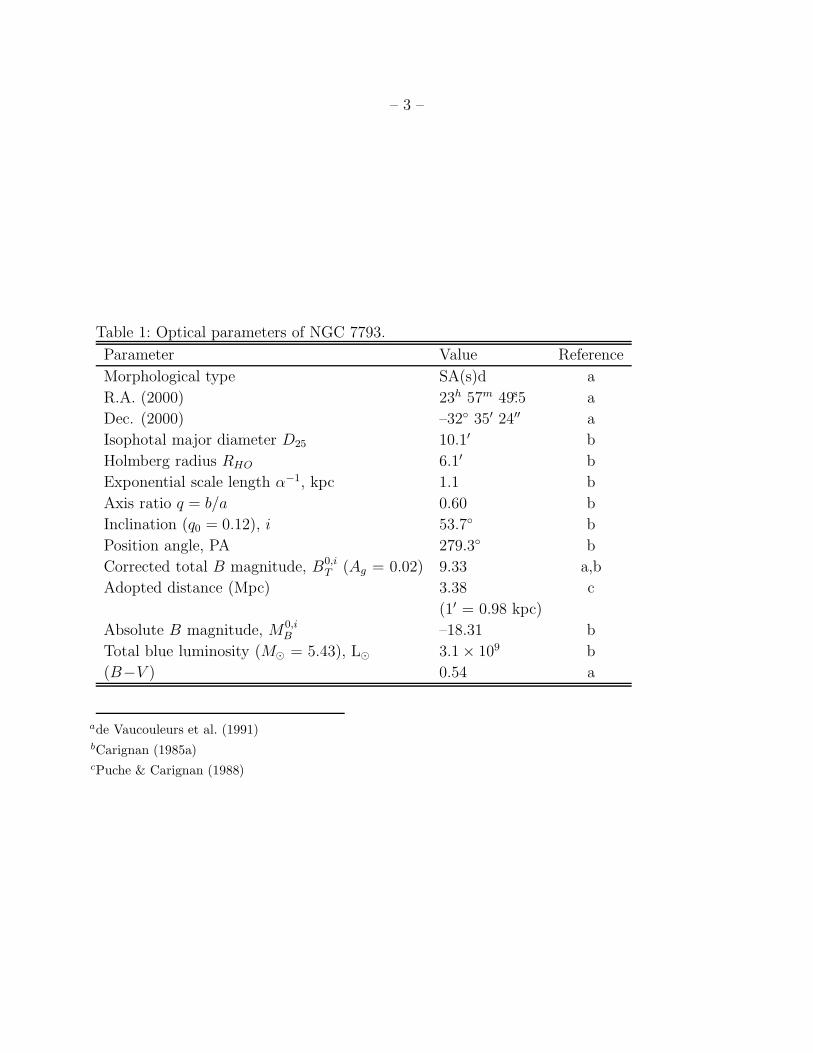
The optical parameters of NGC 7793 are summarized in Table 1. It is a typical Sd
galaxy with a very tiny bulge and a filamentary spiral structure (see figs 1 & 2). It is an
intrinsically small system with an exponential scale length α−1 ≃ 1 kpc. For this study,
a distance of 3.38 Mpc (Puche & Carignan 1988) is adopted, based on numerous distance
indicators. However, somewhat larger distances of e.g. 3.82 (Karachentsev et al. 2003) and
3.91 Mpc (Karachentsev 2005) have also been suggested. For our adopted distance, NGC
7793 has an absolute B magnitude of –18.3 for a total blue luminosity of ∼ 3.1 × 10⁹ L⊙ .
Previous kinematical studies of NGC 7793 were done in the optical, using Fabry-Perot in-
terferometry by Davoust & de Vaucouleurs (1980). Their Hα rotation curve (RC) extends to
∼ 4′, which barely reaches the maximum velocity. Ten years later, deep VLA H I observations
(13.5 hours in C/D configuration) allowed one to derive the rotation curve twice as far, out
to ∼ 8′ (Carignan & Puche 1990). A remarkable result of those H I observations was that,
contrary to most spirals, the rotation curve is not flat in the outer parts but appears to be
declining (∆Vrot ≃ 30 km s−1 or 25% of Vmax between the maximum velocity and the last
point of the RC), even after a careful modeling (tilted–ring model) of the warp (∆PA≃ 20◦)
in the outer H I disk. While the RC is declining in the outer parts, it is less steep than a pure
Keplerian decline and a dark halo is still needed to properly model the mass distribution.
It would be interesting to be able to check the uniqueness of this RC with independent
observations using another tracer than H I . As we have seen, previous Hα observations
(Davoust & de Vaucouleurs 1980) only extend to ∼ 4′ or 80% of the optical radius R25.
However, deep Hα imaging with a 68 A (FWHM) filter (Ferguson et al. 1996) showed that
the diffuse ionized gas (DIG, also referred to as warm ionized medium, WIM) component in
NGC 7793 easily extended out to R25. Thus, one of the main motivations of the observations
presented in this paper was the hope to extend the Hα kinematics, at least out to that point,
in order to confirm (or not) the decline of the H I RC.
The other motivation was to try to detect that DIG component out to very low levels, if
possible at radii larger than R25. Large DIG components have been seen in nearby starburst
and active galaxies (Veilleux et al. 2003) and can sometimes have sizes comparable to the
H I component (see e.g. NGC 1068), but not much is known on the extent of the DIG
component of quiet late–type systems. Comprehensive studies of the large scale structure of
DIG components have been done on edge–on systems (Rand et al. 1990; Dettmar & Schulz
1992; Veilleux et al. 1995), on selected small regions of M31 (Walterbos & Braun 1994), and
on large samples (Kennicutt et al. 1995; Zurita et al. 2000; Thilker et al. 2002; Meurer et al.
2006; Oey et al. 2007).
– 3 –
Table 1: Optical parameters of NGC 7793.
Parameter Value Reference
Morphological type SA(s)d a
R.A. (2000) 23h 57m 49.s5 a
Dec. (2000) –32◦ 35′ 24′′ a
Isophotal major diameter D25 10.1′ b
Holmberg radius RHO 6.1′ b
Exponential scale length α−1, kpc 1.1 b
Axis ratio q = b/a 0.60 b
Inclination (q0 = 0.12), i 53.7◦ b
Position angle, PA 279.3◦ b
Corrected total B magnitude, B0,iT (Ag = 0.02) 9.33 a,b
Adopted distance (Mpc) 3.38 c
(1′ = 0.98 kpc)
Absolute B magnitude, M0,iB –18.31 b
Total blue luminosity (M⊙ = 5.43), L⊙ 3.1 × 10⁹ b
(B−V ) 0.54 a
ade Vaucouleurs et al. (1991)bCarignan (1985a)cPuche & Carignan (1988)
– 4 –
Massive stars clearly provide the largest source of Lyman continuum (Lyc) photons
in spiral galaxies; an issue concerns whether the bulk of these photons are deposited over
localized regions, such as the Stromgren spheres which define H II regions, or whether a
significant fraction can escape from the regions of recent star formation where they were
created and thus ionize the interstellar medium over much larger scales (Ferguson et al.
1996). The large scale radial distribution of the DIG across galactic disks can provide
stringent constraints on the source of its ionization. For example, if the number of Lyc
photons produced in star–forming regions were the only factor responsible for producing the
DIG, then the ionized gas distribution should follow very closely, both on small and large
scales, the distribution of discrete H II regions. This addresses the possible internal sources
of ionization.
However, if ionized gas is detected past the H I truncation edge (Corbelli et al. 1989;
van Gorkom 1993), one possible explanation for that truncation could be that, at large
radii, the thin H I disks get fully ionized by the metagalactic UV background, as discussed
by Bland–Hawthorn et al. (1997). This is another incentive to try to push the detection of
the diffuse Hα as far out as possible. If Hα could be detected that far, it could even be used
to put a limit on that UV background.
Section II will present the new Fabry-Perot Hα observations and discuss data reduction
while Section III will derive the kinematical parameters and the rotation curves. This will
be followed in Section IV by a study of the mass distribution and Section V will discuss
the extent of the DIG. Finally, the principal results will be discussed in Section VI and a
summary and the main conclusions will be given in Section VII.
2. Observations & Data Reduction
The Fabry-Perot (FP) observations were obtained on the Marseille 36cm (from 2005
October 27 to 2005 November 2) and on the ESO 3.6m (2005 November 3) telescopes at La
Silla, Chile, using the photon counting camera FaNTOmM (Gach et al. 2002; Hernandez et al.
2003). The same focal reducer, interference filter, Fabry-Perot etalon and camera were used
on both telescopes. The interference filter, with a peak transmission Tmax ∼ 80%, was
centered at λc = 6563A and had a FWHM of 30.4A . The interference order of the Fabry-
Perot interferometer was p = 765 at Hα for a free spectral range (FSR) of 8.6A or ∼390
km s−1 . The mean Finesse of the etalon was ∼ 18.5 (resolution ≃ 14000). The finesse is a
dimensionless value expressing the spectral resolution of the etalon (∆λ = FSR(A)F inesse
). The FSR
was scanned in 60 channels by steps of 0.14A. The photon counting camera FaNTOmM is based
on a Hamamatsu photocathode coupled with a Dalsa commercial CCD. The photocathode
– 5 –
has a quantum efficiency of ∼23% at Hα and the CCD has 1024x1024 12.5µm square pixels.
The CCD was operated in its low spatial resolution where pixels are binned 2x2 at 40 frames
per second.
A photon counting camera, such as FaNTOmM, is an essential tool for this kind of work.
Its ability to rapidly scan the FP interferometer allows the photometric variations to be
averaged out. For comparison, in CCD observations, each FP channel must be observed
for at least 5 continuous minutes to avoid the read-out noise of the CCD from masking the
weak galaxy’s signal. This means that photometric conditions must not significantly change
for ∼5 hours with CCD observations. In photon counting, channels are observed for 5 to
15 seconds and a complete cycle is obtained every 5 to 15 minutes. Many cycles are made
during an observation and since the data are analyzed on–line, SNR estimations can be
made throughout the observations and the observer can decide when to stop the integration.
The wavelength calibration is done using a Ne lamp at 6598.95A. Since the calibration lamp
is strong compared to galaxies’ fluxes, calibrations are done in analogic mode (non photon
counting). Typically, calibration channels are integrated 1 second each, such that a whole
calibration only takes 1 minute.
The galaxy was observed for a total of 100 minutes on the 3.60m (1.67 minutes/channel)
and for 1200 minutes (20 minutes/channel) over 4 nights on the 36cm telescope. Raw observa-
tional data consist of many data files that contain photons’ positions for every cycle/channel
duo. With a cycling of 10 seconds integration time per channel, one file was created every
10 seconds. The different steps of the data reduction are:
• integration of raw data files into an interferogram data cube (3D data cube sliced for
every Fabry-Perot channel);
• phase correction of interferograms to create wavelength-sorted data cubes (3D data
cube sliced for every wavelength interval);
• hanning spectral smoothing;
• sky emission removal;
• spatial binning/smoothing (e.g. adaptive binning);
• radial velocity map extraction from emission line positions;
• addition of astrometry information;
• kinematical information extraction.
– 6 –
All the reduction was performed with IDL routines inspired of the ADHOCw reduction
package (http://www.oamp.fr/adhoc/adhoc/adhocw.htm). Details on the data reduction
can be found in Hernandez et al. (2005), Chemin et al. (2006) and Daigle et al. (2006a) and
the routines are available at http://www.astro.umontreal.ca/∼odaigle/reduction. Especially,
the way the profiles are found, the way the sky emission is subtracted, which is a crucial step
when trying to detect very weak emission, the way the data is smoothed using an adaptive
smoothing technique are all described in details in Daigle et al. (2006b).

– 7 –
Fig. 1.— Fabry-Perot observations of NGC 7793 on the 3.60m. Top left : DSS Blue Band
image. Top right : SPITZER IRAC 3.6µmimage. Middle left : Hα monochromatic
image. Middle right : Hα velocity field. Bottom : PV diagram.
– 8 –
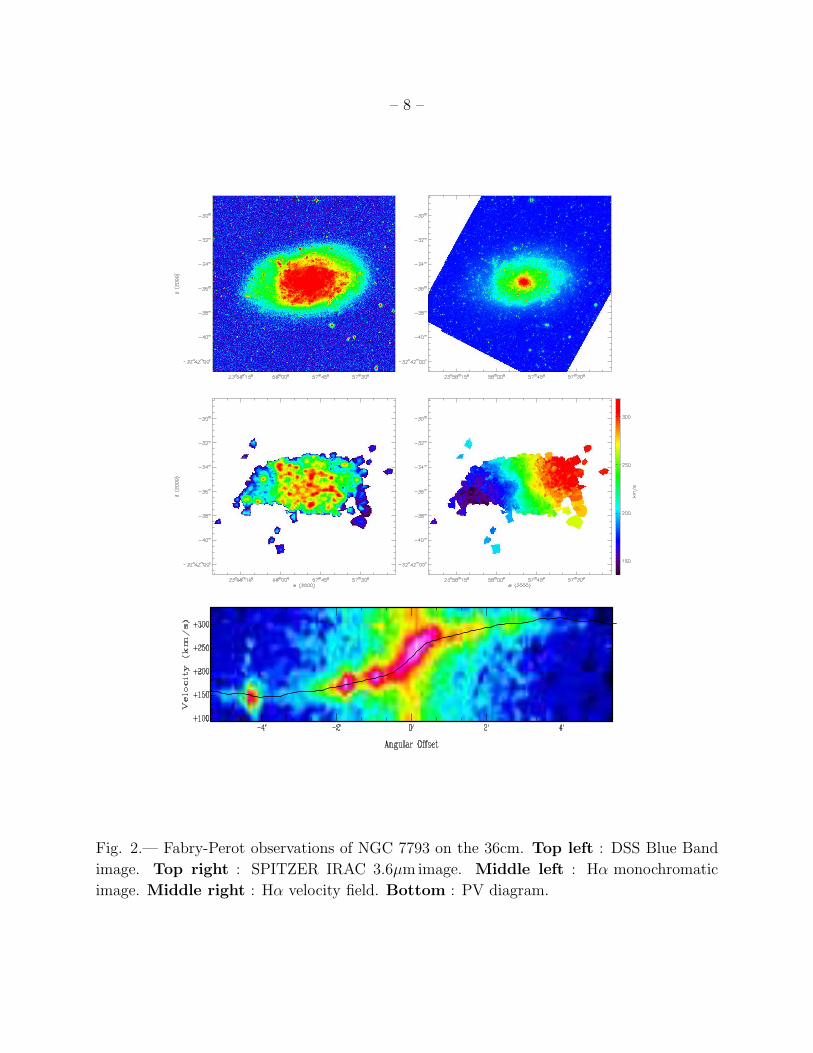
Fig. 2.— Fabry-Perot observations of NGC 7793 on the 36cm. Top left : DSS Blue Band
image. Top right : SPITZER IRAC 3.6µmimage. Middle left : Hα monochromatic
image. Middle right : Hα velocity field. Bottom : PV diagram.
– 9 –
A first attempt at detecting the DIG in the outer disk of NGC 7793 was done in October
1993, during 13 observing nights, for a cumulative total exposure time of 64 hours. The same
instrumentation was used (36cm telescope, focal reducer, interference filter and interferom-
eter), but the detector was different. This first data set was obtained with our old IPCS,
a Thompson camera based on a Silicium Nocticon TV tube technology (Boulesteix et al.
1984). However, the camera used to obtain the data set presented in this paper used a new
GaAs tube technology (Gach et al. 2002) and has a detective quantum efficiency ∼25%, at
least four times larger than the old Thompson IPCS. Thus, this second run was less time
consuming (20 hours instead of 64) for reaching a higher SNR. Moreover, the shortening of
the individual elementary exposure time together with the diminution of the total observ-
ing time and better reduction software (Daigle et al. 2006b) allowed a better removal of the
night sky lines which is critical at such a low signal level.
3. Kinematical Parameters and Rotation Curves
In order to derive the rotation curves, one must find the set of orientation parameters
(rotation center (x0, y0), systemic velocity Vsys, inclination i, position angle of the major axis
PA) that best represents the observed velocity fields, shown in fig. 1 and fig. 2, at all radii.
The data in an opening angle of 40◦ about the minor axis are excluded from the analysis
to minimize errors due to deprojection effects. A cosine weighting function (using the angle
θ from the major axis) is used for the rest of the data, which gives maximum weighting on
the major axis. The task ROTCUR in the reduction package GIPSY (Vogelaar & Terlouw
2001) is used to find those parameters.
Since they are correlated, the dynamical center and the systemic velocity are looked for
first, by keeping i and PA fixed (using the photometric values given in Table 1). We find that
(x0, y0) corresponds to the optical center and that Vsys = 238 ±3 km s−1 for the 3.60m and
230 ±4 km s−1 for the 36cm data. This can be compared to the Carignan & Puche (1990)
H I global profile midpoint velocity of 230 ±2 km s−1 and intensity-weighted mean velocity
of 235 ±4 km s−1 or to their systemic velocity derived in the same way from the H I velocity
field of 227 ±3 km s−1 . The agreement is very good considering that a slight zero point shift
can be expected since the calibration is done at the Ne wavelength and not at the observed
wavelength.
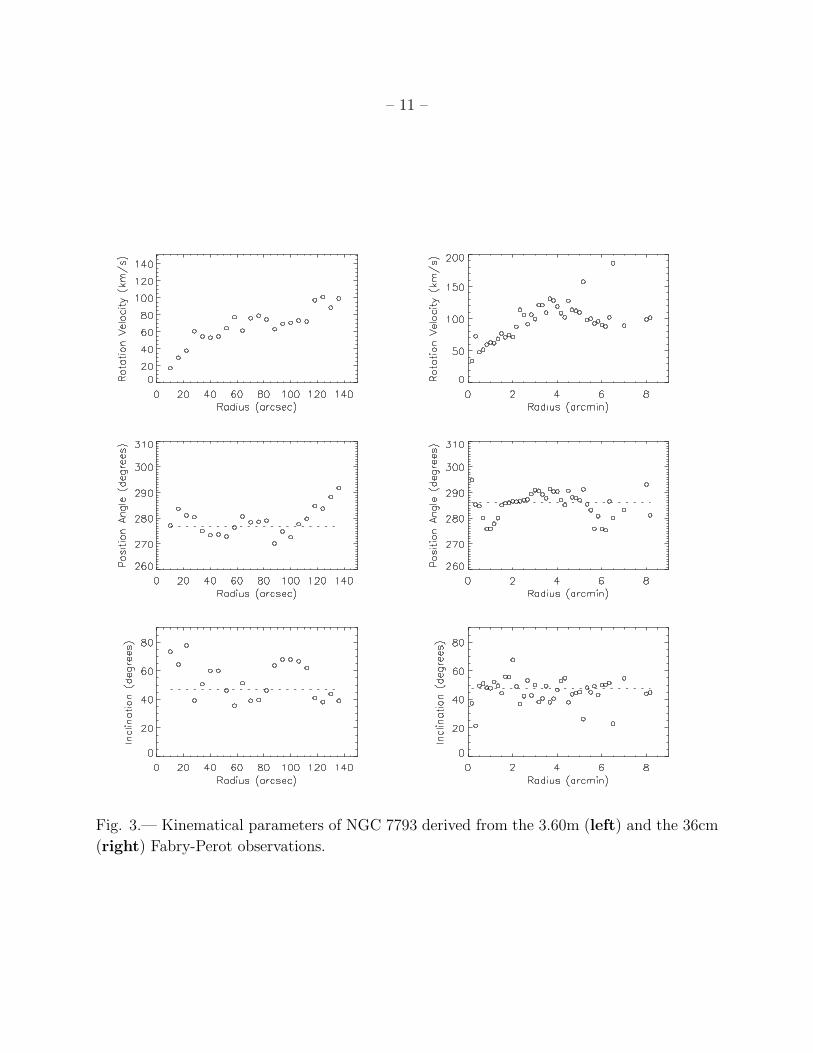
The next step is to obtain a least–squares solution for i, PA and Vrot in concentric annuli
in the plane of the galaxy, by keeping (x0, y0) and Vsys fixed. This is shown in Fig. 3. For
both data sets, an inclination i = 47◦ ±9◦ for the 3.6m and ±6◦ for the 36cm is adopted.
For the PA we found 277◦ ±3◦ for the 3.60m and 286◦ ±4◦ for the 36 cm. This is consistent
– 10 –
with the H I data (Carignan & Puche 1990) which show that the PA is smaller in the inner
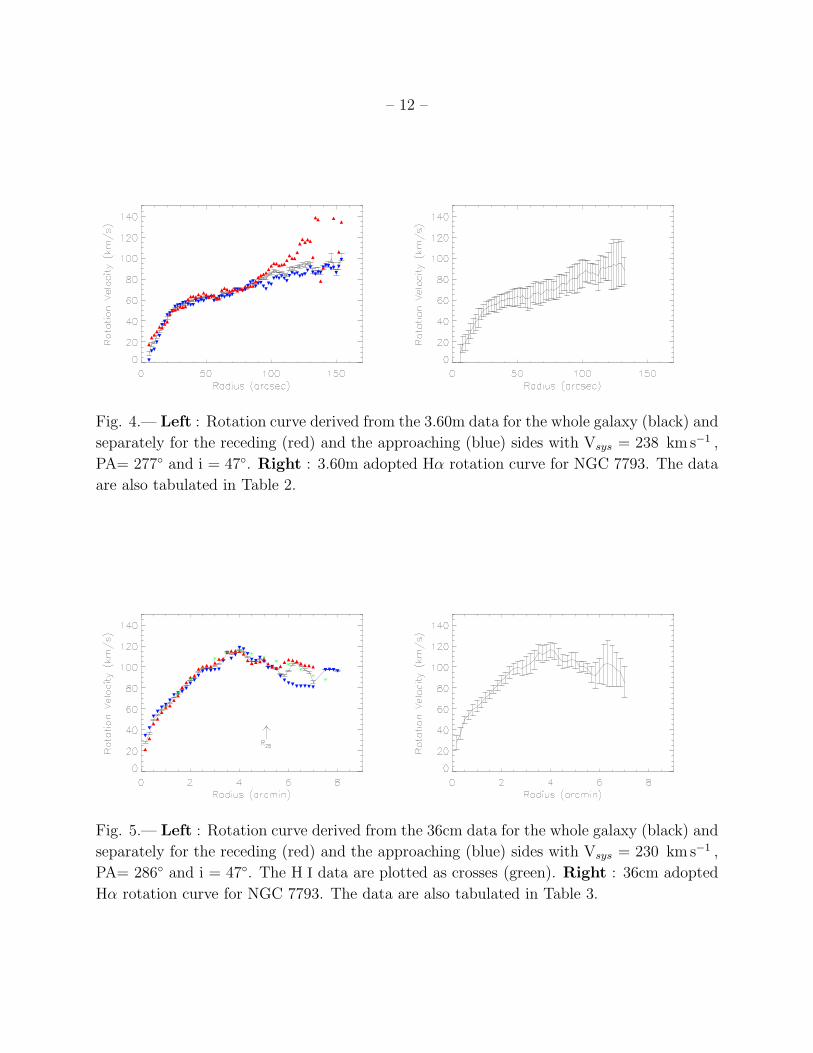
parts than in the outer parts. In order to see if the solution found is a good representation of
the whole galaxy, separate solutions are also obtained for the approaching and the receding
sides. The 3 solutions (both sides, approaching, receding) and the adopted rotation curves
are given in Fig. 4 for the 3.60m and in Fig. 5 for the 36cm data. The adopted errors are the
biggest difference between the kinematical solution for both sides and the separate solutions
for either the approaching or the receding sides or the intrinsic error from the tilted-ring
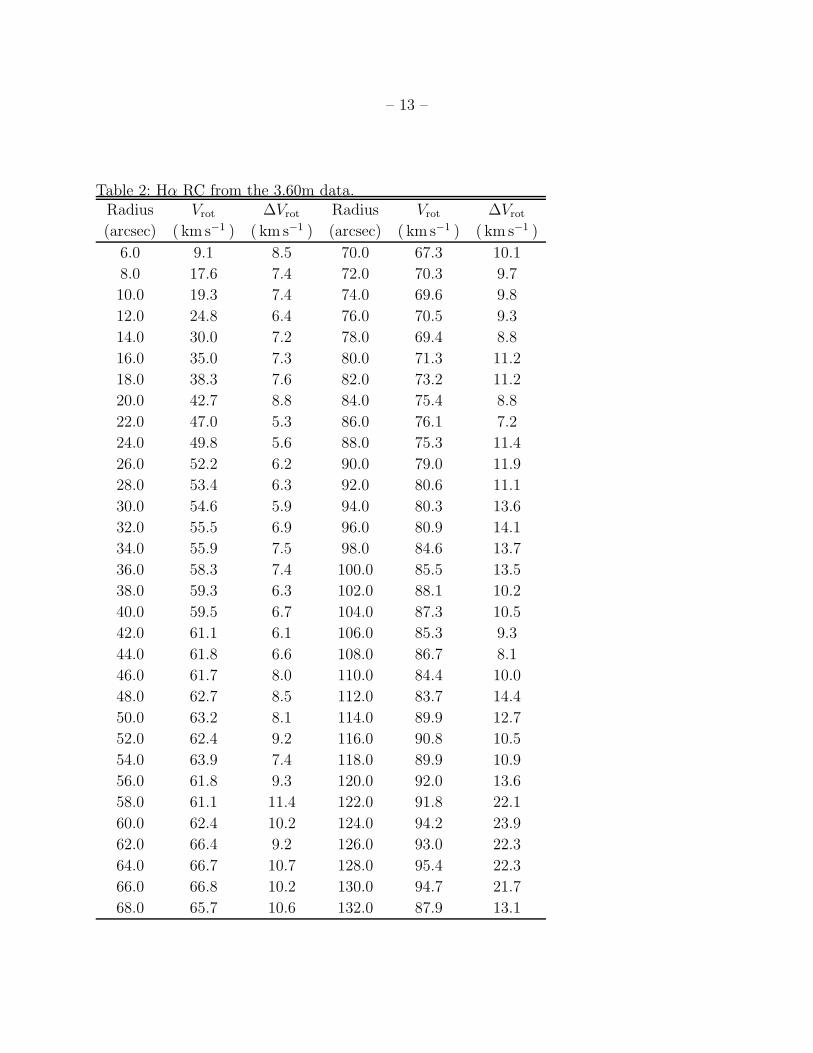
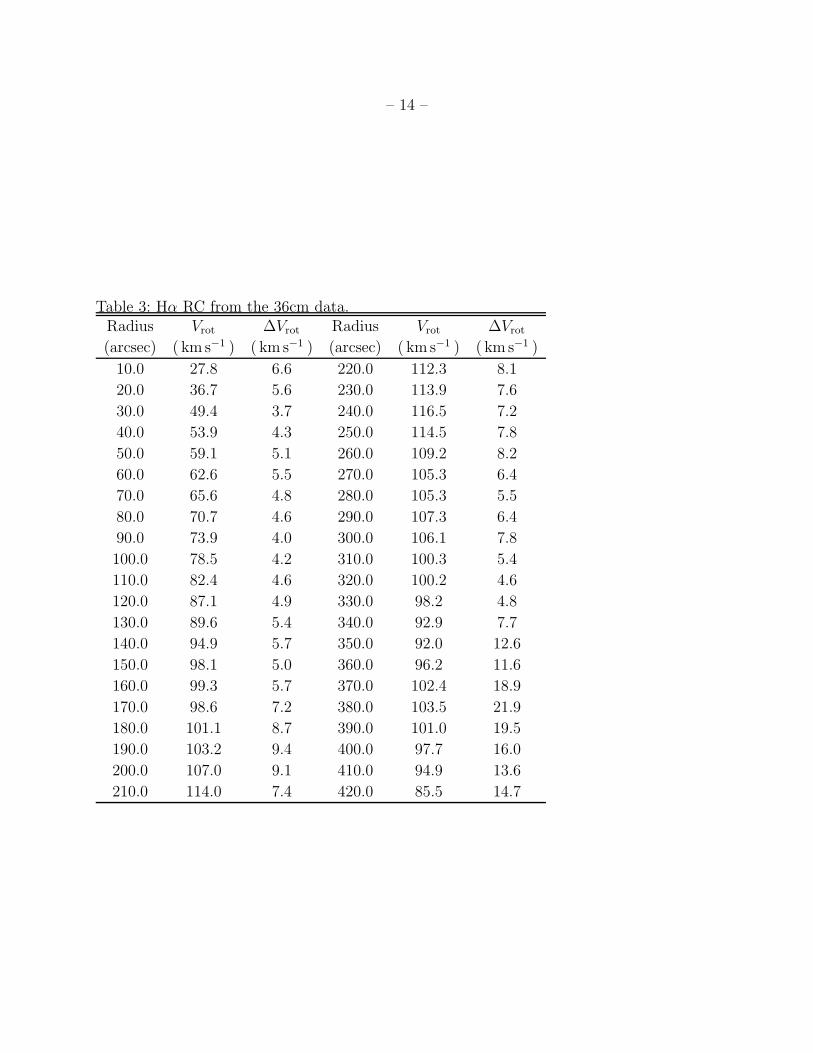
model, if larger. The values of the RCs are tabulated in Table 2 and Table 3, respectively.
For the 3.60m data of Fig. 4, only the velocity points up to 132′′ will be used because
further out there are not enough points on the receding side and the errors become too
large. Similarly, for the 36cm data in Fig. 5, even if the Hα emission is detected out to ∼8.5′
(∼ RHI), only the data up to 7 ′ will be used because there is no emission after that radius
on the receding side.
4. Mass Modeling
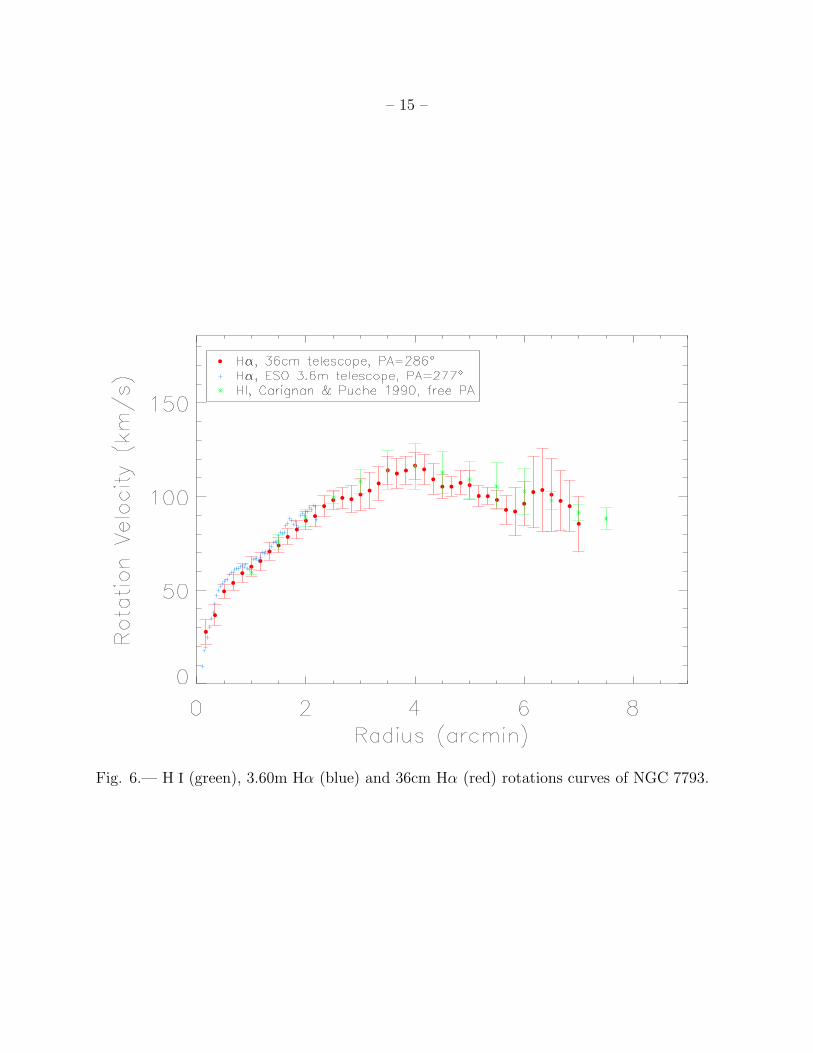
As can be seen in Fig. 6, the Hα RC is very similar to the H I RC (errors on the 3.60m
data were not plotted to facilitate the comparison; see Fig. 4) so that the mass models are
expected to be very similar. However, since the H I velocities are slightly lower in the very
inner parts and slightly higher in the intermediate parts, one could expect slight differences.
In order to compare our results with those obtained using the H I RC (Carignan & Puche
1990), the same approach for the study of the mass distribution will be used. The dark halo
is represented by an isothermal sphere which can be described by two free parameters: the
one-dimensional velocity dispersion σ and the core radius rc. The central density is then
given by ρ0 = 9σ2/4πGr2c . The other free parameter is the mass–to–light ratio (M/L)∗
of the stellar disk. Details on the method used can be found in Carignan (1985b) and
Carignan & Freeman (1985).
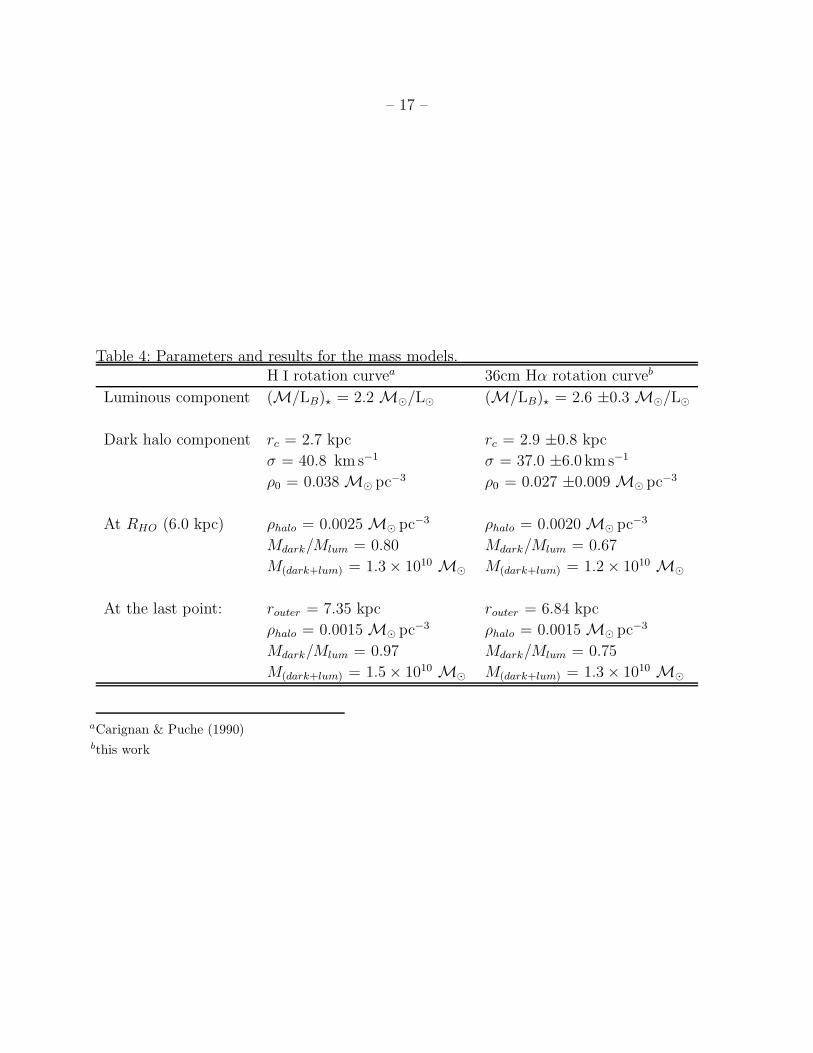
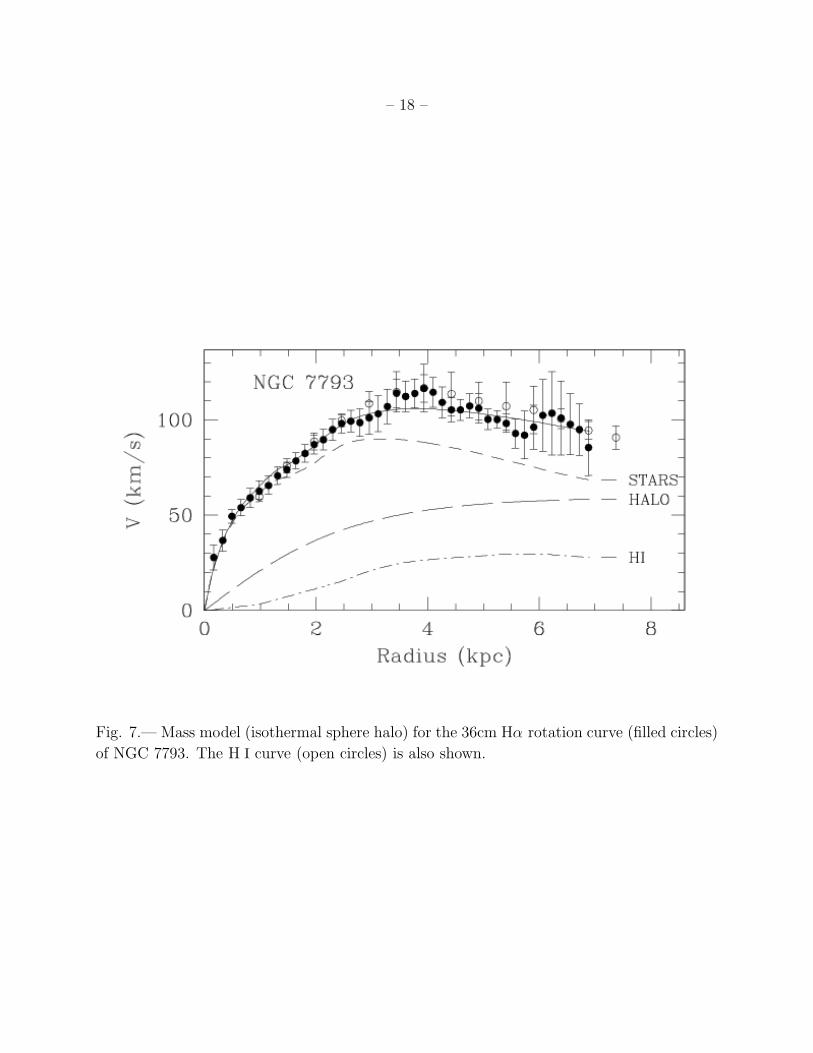
The parameters of the models and the main results are given in Table 4 and illustrated
in Fig. 7. As expected, the slightly higher Hα velocity ∼1 kpc gives a higher (M/LB)⋆ for
the stellar disk, thus reducing the dark component and the slightly lower Hα velocities ∼5
kpc also gives a lower density dark component. Those two factors, combined with the fact
that the H I RC extends slightly further out, explain the fact that the Mdark/Mlum goes down
from 0.97 to 0.75 at the last point. Nevertheless, within the uncertainties, one can say that
the Hα data confirms the results obtained with the H I data with Mdark/Mlum ≃ 0.75 − 1.0
at the last velocity point for a total mass for NGC 7793 of ∼ 1.3 − 1.5 × 10¹⁰M⊙. Again,
– 11 –
Fig. 3.— Kinematical parameters of NGC 7793 derived from the 3.60m (left) and the 36cm
(right) Fabry-Perot observations.
– 12 –
Fig. 4.— Left : Rotation curve derived from the 3.60m data for the whole galaxy (black) and
separately for the receding (red) and the approaching (blue) sides with Vsys = 238 kms−1 ,
PA= 277◦ and i = 47◦. Right : 3.60m adopted Hα rotation curve for NGC 7793. The data
are also tabulated in Table 2.
Fig. 5.— Left : Rotation curve derived from the 36cm data for the whole galaxy (black) and
separately for the receding (red) and the approaching (blue) sides with Vsys = 230 kms−1 ,
PA= 286◦ and i = 47◦. The H I data are plotted as crosses (green). Right : 36cm adopted
Hα rotation curve for NGC 7793. The data are also tabulated in Table 3.
– 13 –
Table 2: Hα RC from the 3.60m data.Radius Vrot ∆Vrot Radius Vrot ∆Vrot
(arcsec) ( km s−1 ) ( km s−1 ) (arcsec) ( km s−1 ) ( km s−1 )
6.0 9.1 8.5 70.0 67.3 10.1
8.0 17.6 7.4 72.0 70.3 9.7
10.0 19.3 7.4 74.0 69.6 9.8
12.0 24.8 6.4 76.0 70.5 9.3
14.0 30.0 7.2 78.0 69.4 8.8
16.0 35.0 7.3 80.0 71.3 11.2
18.0 38.3 7.6 82.0 73.2 11.2
20.0 42.7 8.8 84.0 75.4 8.8
22.0 47.0 5.3 86.0 76.1 7.2
24.0 49.8 5.6 88.0 75.3 11.4
26.0 52.2 6.2 90.0 79.0 11.9
28.0 53.4 6.3 92.0 80.6 11.1
30.0 54.6 5.9 94.0 80.3 13.6
32.0 55.5 6.9 96.0 80.9 14.1
34.0 55.9 7.5 98.0 84.6 13.7
36.0 58.3 7.4 100.0 85.5 13.5
38.0 59.3 6.3 102.0 88.1 10.2
40.0 59.5 6.7 104.0 87.3 10.5
42.0 61.1 6.1 106.0 85.3 9.3
44.0 61.8 6.6 108.0 86.7 8.1
46.0 61.7 8.0 110.0 84.4 10.0
48.0 62.7 8.5 112.0 83.7 14.4
50.0 63.2 8.1 114.0 89.9 12.7
52.0 62.4 9.2 116.0 90.8 10.5
54.0 63.9 7.4 118.0 89.9 10.9
56.0 61.8 9.3 120.0 92.0 13.6
58.0 61.1 11.4 122.0 91.8 22.1
60.0 62.4 10.2 124.0 94.2 23.9
62.0 66.4 9.2 126.0 93.0 22.3
64.0 66.7 10.7 128.0 95.4 22.3
66.0 66.8 10.2 130.0 94.7 21.7
68.0 65.7 10.6 132.0 87.9 13.1
– 14 –
Table 3: Hα RC from the 36cm data.Radius Vrot ∆Vrot Radius Vrot ∆Vrot
(arcsec) ( km s−1 ) ( km s−1 ) (arcsec) ( km s−1 ) ( km s−1 )
10.0 27.8 6.6 220.0 112.3 8.1
20.0 36.7 5.6 230.0 113.9 7.6
30.0 49.4 3.7 240.0 116.5 7.2
40.0 53.9 4.3 250.0 114.5 7.8
50.0 59.1 5.1 260.0 109.2 8.2
60.0 62.6 5.5 270.0 105.3 6.4
70.0 65.6 4.8 280.0 105.3 5.5
80.0 70.7 4.6 290.0 107.3 6.4
90.0 73.9 4.0 300.0 106.1 7.8
100.0 78.5 4.2 310.0 100.3 5.4
110.0 82.4 4.6 320.0 100.2 4.6
120.0 87.1 4.9 330.0 98.2 4.8
130.0 89.6 5.4 340.0 92.9 7.7
140.0 94.9 5.7 350.0 92.0 12.6
150.0 98.1 5.0 360.0 96.2 11.6
160.0 99.3 5.7 370.0 102.4 18.9
170.0 98.6 7.2 380.0 103.5 21.9
180.0 101.1 8.7 390.0 101.0 19.5
190.0 103.2 9.4 400.0 97.7 16.0
200.0 107.0 9.1 410.0 94.9 13.6
210.0 114.0 7.4 420.0 85.5 14.7
– 15 –
Fig. 6.— H I (green), 3.60m Hα (blue) and 36cm Hα (red) rotations curves of NGC 7793.
– 16 –
one can see that even if the RC is declining over the second half of the radius range, a dark
halo is still needed to reproduce the observed kinematics.
5. Hα Extent
The first mention that NGC 7793 had an extended ionized component was by Monnet
(1971) from quite shallow photographic data. A deeper and more detailed study was done
more recently by Ferguson et al. (1996). They showed that the observed Hα luminosity of
the DIG component of NGC 7793 was large, accounting for ∼ 40% of the total Hα emission,
similar to what is seen in M31 (Walterbos & Braun 1994) or the SMC (Kennicutt et al.
1995). Ferguson et al. (1996) argue that the integrated minimum Lyman continuum (Lyc)
power required to sustain the DIG is enormous and can only easily be met by the ionizing
output from massive star formation; the mechanical energy from supernovae and stellar winds
falls short of that required by at least a factor of 2. Their results support the hypothesis
that the DIG is photoionized by Lyc photons leaking out of discrete H II regions.
A comparison between our deep Fabry-Perot Hα map and the deep Hα continuum sub-
tracted image from Ferguson et al. shows a very good general agreement. Nevertheless, we
reach fainter diffuse Hα emission in the outskirts of the galaxy located between H II regions.
In addition, spurs are visible on our image that were not detected by Ferguson et al. (1996).
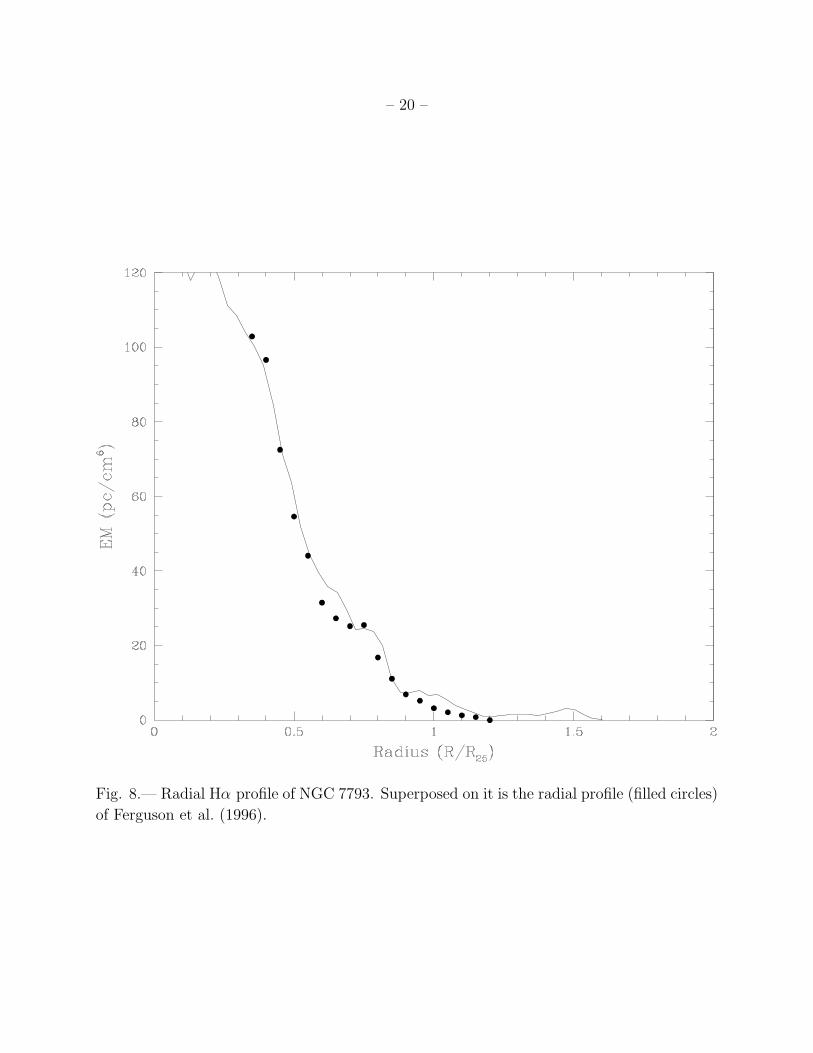
Fig. 8 shows the Hα radial profile of NGC 7793, derived using the GIPSY task ELLINT
(Vogelaar & Terlouw 2001). Since our data were not photometrically calibrated, our profile
was adjusted in order to be in rough agreement with the profile of Ferguson et al. (1996) in
the outer parts. This should be looked at as just an order of magnitude representation since
the Ferguson et al. (1996) data were obtained in imagery with a 68A filter which included
not only Hα but also the [N II ] lines. While they corrected for the [N II ] contamination
using [N II ]/Hα = 0.22, Bland–Hawthorn et al. (1997) found a ratio close to unity in the
outer parts of the other Sculptor Group galaxy NGC 253. So, even if the intensity scale
could be off by a factor of a few, this is sufficient to show that our long Fabry-Perot ob-
servations (20 hours total or 20 minutes per channel) on a 36 cm telescope nearly reach
the limit of the H I disk (DHI = 1.7D25 ; Carignan & Puche 1990). To be able to reach so
large radii is interesting since it was estimated that if the truncation edge (Corbelli et al.
1989; van Gorkom 1993) of the H I disks is due to ionization of the hydrogen by the cosmic
background radiation, the expected flux (Bland–Hawthorn et al. 1994, 1997) should be an
Hα emission measure Em(Hα ) ∼ 0.2 − 2.0 pc cm−6, which is the level reached by our deep
observations.
Contrary to what was found by Bland–Hawthorn et al. (1997) (hereafter referred to as
– 17 –
Table 4: Parameters and results for the mass models.H I rotation curvea 36cm Hα rotation curveb
Luminous component (M/LB)⋆ = 2.2 M⊙/L⊙ (M/LB)⋆ = 2.6 ±0.3 M⊙/L⊙
Dark halo component rc = 2.7 kpc rc = 2.9 ±0.8 kpc
σ = 40.8 km s−1 σ = 37.0 ±6.0 km s−1
ρ0 = 0.038 M⊙ pc−3 ρ0 = 0.027 ±0.009 M⊙ pc−3
At RHO (6.0 kpc) ρhalo = 0.0025 M⊙ pc−3 ρhalo = 0.0020 M⊙ pc−3
Mdark/Mlum = 0.80 Mdark/Mlum = 0.67
M(dark+lum) = 1.3 × 10¹⁰ M⊙ M(dark+lum) = 1.2 × 10¹⁰ M⊙
At the last point: router = 7.35 kpc router = 6.84 kpc
ρhalo = 0.0015 M⊙ pc−3 ρhalo = 0.0015 M⊙ pc−3
Mdark/Mlum = 0.97 Mdark/Mlum = 0.75
M(dark+lum) = 1.5 × 10¹⁰ M⊙ M(dark+lum) = 1.3 × 10¹⁰ M⊙
aCarignan & Puche (1990)bthis work
– 18 –
Fig. 7.— Mass model (isothermal sphere halo) for the 36cm Hα rotation curve (filled circles)
of NGC 7793. The H I curve (open circles) is also shown.
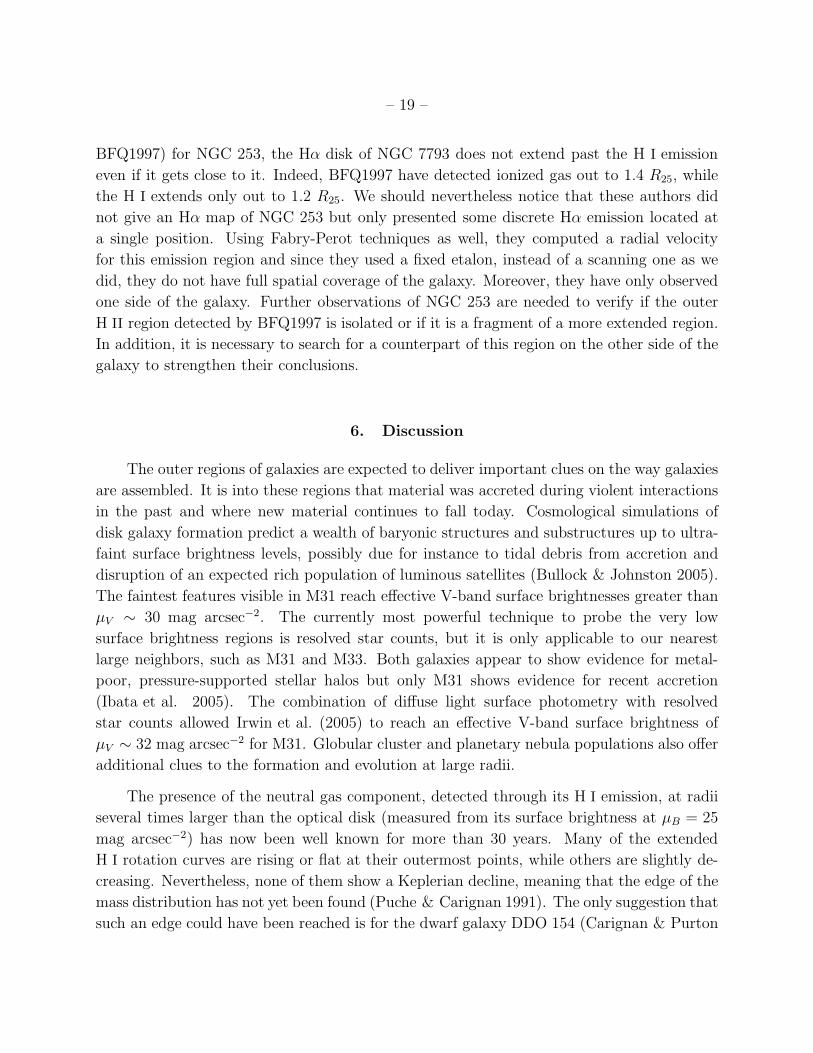
– 19 –
BFQ1997) for NGC 253, the Hα disk of NGC 7793 does not extend past the H I emission
even if it gets close to it. Indeed, BFQ1997 have detected ionized gas out to 1.4 R25, while
the H I extends only out to 1.2 R25. We should nevertheless notice that these authors did
not give an Hα map of NGC 253 but only presented some discrete Hα emission located at
a single position. Using Fabry-Perot techniques as well, they computed a radial velocity
for this emission region and since they used a fixed etalon, instead of a scanning one as we
did, they do not have full spatial coverage of the galaxy. Moreover, they have only observed
one side of the galaxy. Further observations of NGC 253 are needed to verify if the outer
H II region detected by BFQ1997 is isolated or if it is a fragment of a more extended region.
In addition, it is necessary to search for a counterpart of this region on the other side of the
galaxy to strengthen their conclusions.
6. Discussion
The outer regions of galaxies are expected to deliver important clues on the way galaxies
are assembled. It is into these regions that material was accreted during violent interactions
in the past and where new material continues to fall today. Cosmological simulations of
disk galaxy formation predict a wealth of baryonic structures and substructures up to ultra-
faint surface brightness levels, possibly due for instance to tidal debris from accretion and
disruption of an expected rich population of luminous satellites (Bullock & Johnston 2005).
The faintest features visible in M31 reach effective V-band surface brightnesses greater than
µV ∼ 30 mag arcsec−2. The currently most powerful technique to probe the very low
surface brightness regions is resolved star counts, but it is only applicable to our nearest
large neighbors, such as M31 and M33. Both galaxies appear to show evidence for metal-
poor, pressure-supported stellar halos but only M31 shows evidence for recent accretion
(Ibata et al. 2005). The combination of diffuse light surface photometry with resolved
star counts allowed Irwin et al. (2005) to reach an effective V-band surface brightness of
µV ∼ 32 mag arcsec−2 for M31. Globular cluster and planetary nebula populations also offer
additional clues to the formation and evolution at large radii.
The presence of the neutral gas component, detected through its H I emission, at radii
several times larger than the optical disk (measured from its surface brightness at µB = 25
mag arcsec−2) has now been well known for more than 30 years. Many of the extended
H I rotation curves are rising or flat at their outermost points, while others are slightly de-
creasing. Nevertheless, none of them show a Keplerian decline, meaning that the edge of the
mass distribution has not yet been found (Puche & Carignan 1991). The only suggestion that
such an edge could have been reached is for the dwarf galaxy DDO 154 (Carignan & Purton
– 20 –
Fig. 8.— Radial Hα profile of NGC 7793. Superposed on it is the radial profile (filled circles)
of Ferguson et al. (1996).
– 21 –
1998). Deep H I observations have shown that H I disks are abruptly truncated at column
densities near 1018−1019 atoms cm−2, where the rotation curves still do not have a Keplerian
behavior (e.g. Van Gorkom 1993). If the metagalactic UV background is sufficiently strong,
beyond a certain galactic radius the cold gas may become ionized (Bochkarev & Siuniaev
1977)
The total Hα emission from star forming galaxies is divided roughly in half, between
discrete H II regions and the DIG. Pioneering work by Reynolds (1984) established that
only the massive OB stars are able to ionize the DIG. On the other hand, all the observers
agree on the fact that the DIG fraction seems to be independent of galaxy parameters
such as star formation rate and Hubble type. This looks a bit controversial. More recently,
Reynolds et al. (1999) and Collins & Rand (2001) suspected that OB stars cannot exclusively
explain the ionization state of the DIG. Dopita et al. (2006) suggested that part of the DIG
may consist of extremely evolved filamentary H II regions that may be difficult to detect.
On the other hand, if ionizing radiation escapes from H II regions to ionize the DIG, it
does escape from the galaxies and affects the ionization state of the intergalactic medium
(IGM) and the galactic medium of external galaxies which may be partially at the origin of
this UV radiation. Indeed, a key question is the origin of the ultra-violet photons responsible
for ionizing the hydrogen in the intergalactic medium (the Lyα forest). The most likely
sources of ionizing photons are young hot stars in galaxies and QSOs (Barkana & Loeb
2001) but their exact origin remains one of the unsolved questions of modern cosmology.
Observations of high-redshift quasars imply that the reionization of cosmic hydrogen was
completed by z∼6 (e.g. Fan et al. 2006, and reference therein). Lack of observational evidence
and theoretical uncertainties makes it difficult to estimate the contribution made by both
sources and leads to inconsistent results. To complicate the scheme, the relative contribution
of QSOs and star forming galaxies depends on the lookback time (Fan et al. 2006, and
reference therein).
Recently, based on the first data release of the SINGG survey of HI-selected galaxies
(Meurer et al. 2006), Oey et al. (2007) have undertaken a quantification of the ionization
in neutral galaxies and the diffuse and warm ionized medium (NGC 7793 is unfortunately
not included in the first SINGG data release of 109 galaxies). They concluded that the
mean fraction of diffuse ionized gas in their sample is ∼0.59, slightly higher but consistent
with the value ∼0.40 found in previous samples (e.g. Thilker et al. 2002; Zurita et al. 2000;
Wang et al. 1999; Hoopes et al. 1996) and also consistent with the value ∼0.50 found by
Ferguson et al. (1996) for NGC 7793. The difference between Oey et al. (2007) and previous
studies may be due to selection effects favoring large, optically bright and nearby galaxies
with high star formation rates. NGC 7793 is closer than any (except one) of the first
– 22 –
SINGG data release. We have computed, for NGC 7793, its Hα effective (half light) radius
∼ 1.97±0.05 kpc (∼ 120 arcsec). Refering to equation (1) from Oey et al. (2007), and using
the Hα total luminosity of 4.1 1040 erg.s−1 computed by Ferguson et al. (1996), we found that
the logarithm of effective surface brightness Log(ΣHα) = 38.65 Log(erg s−1 kpc−2. Following
Oey et al. (2007), this brings NGC 7793 to be classified as a normal galaxy with respect to
its star formation rate.
6.1. Possible Origins of the Ionization: Internal and/or External
Several mechanisms for the ionization of the neutral hydrogen and for heating the elec-
tron population belonging to the DIG may be found in the literature. BFQ1997 review them
in the specific context of NGG 253. The main source of ionization and heating may be
(see references in BFQ1997): the metagalactic ionizing background; compact halo sources;
compact disk sources (white dwarf populations or horizontal-branch stars, young enough to
produce significant UV emission); ram pressure heating (NGC 253 and NGC 7793 lie both in
the Sculptor group having little intracluster medium); turbulence-driven MHD-wave heating;
mixing layers driven by bulk flows; galactic fountain material driven by the inner starburst
through shocks; dilute photoionization; gas phase depletion (induced by the formation of
grains); low energy cosmic-ray electrons and young stellar disk.
BFQ1997 ruled out most of these mechanisms, except the ionization by the hot young
stars of the disk. Even if those young stars are in the disk and most of them further in,
the warp of the H I disk (which is the case for both NGC 253 and NGC 7793) makes it
possible to expose it to their radiation. In particular, they ruled out the ionization by the
cosmic UV background which is suspected to be ∼5 times below the ionizing flux necessary
to explain the emission seen in NGC 253. As the Hα disk does not reach the outskirts of
the H I disk of NGC 7793, it is very unlikely that the source of ionization of the DIG is the
metagalactic UV background. Indeed, if the metagalactic UV background was at the origin
of the ionization it should have principally affected the outer H I regions, which is not the
case. An alternative could be that the Hα detection level is not yet low enough to be able
to detect the ionization by the cosmic UV background radiation, thus, this should mean
that the expected flux should have an Hα emission measure Em(Hα ) lower than what was
measured for NGC 7793, namely ∼ 0.2 − 2.0 pc cm−6.
– 23 –
6.2. A Truly Declining Rotation Curve
The existence of falling RCs was first claimed in the context of the effect of cluster
environments on the member galaxies. Following the work of Dressler (1980), the increase
of intergalactic gas and of gravitational interactions expected toward the centers of clusters
should not only affect the morphological types of the systems but also their kinematics
and mass distribution. Whitmore et al. (1988), from long-slit emission-line observations,
presented evidence for a correlation in the sense that the inner-cluster spirals tend to have
falling RCs, while those of the outer cluster and the vast majority of field spirals seem to
have flat or even rising RCs. However, Amram et al. (1993), using full 3-D Fabry-Perot
data did not confirm these correlations and moreover found that many galaxies for which
Whitmore et al. (1988) claimed a falling RC, had in fact a flat or even rising RC after a
careful analysis of the Fabry-Perot 2D velocity fields (Amram et al. 1996).
Declining RCs have been seen before in other systems (Casertano & van Gorkom 1991;
Honma & Sofue 1997; Ryder et al. 1998; Sofue & Rubin 2001; Noordermeer 2007). However,
those galaxies are most of the time earlier type systems (S0 - Sbc) with highly-concentrated
stellar light distribution and the maximum rotation velocity is reached at small radii (few
hundreds kpc and < α−1). This is certainly not the case for NGC 7793 which has a very
small bulge and a relatively diffuse (exponential) light distribution and where Vmax is reached
at ∼ 4α−1. Keplerian declines have also been observed in a few edge-on systems (e.g. NGC
891: Sancisi & Allen (1979); Oosterloo et al. (2007), NGC 3079: Veilleux et al. (1995) &
NGC 4244: Olling (1996)), but the interpretation in the case of those galaxies is much more
difficult. Finally, a truncation of the halo at ∼ 10 kpc was advocated to explain the decline
of the last two points of the RCs of NGC 5204 (Sicotte & Carignan 1997) and NGC 253
(Bland–Hawthorn et al. 1997), but here the decrease of Vmax and the last velocity point is
only ∼ 10% of Vmax and ∼ 10% of rmax, while, for NGC 7793, the decrease is ∼ 25% of Vmax
and over about half the radius range.
So, for late-type nearly bulgeless galaxies, the decreasing RC of NGC 7793 is rather
unique. As can be seen in Fig. 6, the decline of the RC seen with the H I data is confirmed
by the Hα 36cm data and the kinematical analysis of the 3 sets of data (H I & Hα ) give very
similar results. Since a bulge component can not be invoked to explain the falling gradient of
the RC, NGC 7793 really seems to have a genuine declining RC. The new data also confirm
that the decline is slower than Keplerian and that a dark component is still necessary to
explain the observed kinematics.
– 24 –
7. Summary and Conclusions
Deep Hα observations of NGC 7793 have been presented. The main results are:
• A total of 20 hours of observations was obtained on the Marseille 36cm telescope which
allowed to reach sensitivities of the order of Em(Hα ) ∼ 0.2 − 2.0 pc cm−6;
• this allowed the detection of diffuse Hα emission out to the edge of the H I disk;
• a warp of the disk plane, already seen in the H I data is also seen in the H II disk;
• a RC is derived out to 2.2′ from the 3.6m data and out to 7′ from the 36cm data;
• the two Hα RCs superposed exactly with the H I RC;
• the Hα results confirm the H I findings that NGC 7793 has a truly declining rotation
curve;
• a model of the mass distribution gives a total mass for NGC 7793 of M(dark+lum) =
1.3 − 1.5 × 10¹⁰ M⊙ for Mdark/Mlum = 0.75-1.0 at the last velocity point.
This was our first experiment of doing such long integrations using a 36cm telescope
coupled with our FaNTOmM scanning Fabry-Perot system. This yielded very interesting results
for NGC 7793 by detecting diffuse Hα emission all the way to the edge of the H I disk and
confirming its peculiar kinematics. In the near future, we intend to carry out the same kind
of observations for all the Sculptor Group galaxies, hoping to reach even fainter levels. This
should be possible with an even more sensitive camera soon available (Daigle et al. 2004,
2006c), based on an EMCCD, which should allow us to increase the detective quantum
efficiency by a factor ∼ 3-4.
We would like to thank the staff of the ESO La Silla Observatory for their support.
We acknowledge support from the Natural Sciences and Engineering Research Council of
Canada and the Fonds Quebecois de la recherche sur la nature et les technologies. The
Digitized Sky Surveys (DSS images) were produced at the Space Telescope Science Institute
under U.S. Government grant NAG W-2166. The images of these surveys are based on
photographic data obtained using the Oschin Schmidt Telescope on Palomar Mountain and
the UK Schmidt Telescope. The plates were processed into the present compressed digital
form with the permission of these institutions. The IR images were obtained by the Spitzer
Space Telescope, which is operated by the Jet Propulsion Laboratory, California Institute of
Technology under a contract with NASA.
– 25 –
REFERENCES
Amram, P., Sullivan III, W. T., Balkowski, C., Marcelin, M. & Cayatte, V. 1993, A&A, 403,
L59
Amram, P., Balkowski, C., Boulesteix, J., Cayatte, V., Marcelin, M. & Sullivan III, W. T.
1996, A&A, 310, 737
Barkana, R. & Loeb, A. 2001, Phys. Rep., 349, 125
Bland–Hawthorn, J., Taylor, K., Veilleux, S. & Shopbell, P. L. 1994, ApJ, 437, L95
Bland–Hawthorn, J., Freeman, K. C. & Quinn, P. J. 1997, ApJ, 490, 143 (BFQ1997)
Bochkarev, N. G. & Siuniaev, R. A. 1977, Soviet Ast., 21, 542
Boulesteix, J., Georgelin, Y. P., Marcelin, M. & Monnet, G. 1984, Proc. SPIE, 445, 37
Bullock, J. & Johnstone, K. 2005, ApJ, 635, 931
Carignan, C. 1985a, ApJS, 58, 107
Carignan, C. 1985b, ApJ, 299, 59
Carignan, C. & Freeman, K. C. 1985, ApJ, 294, 494
Carignan, C. & Puche, D. 1990, AJ, 100, 394
Carignan, C. & Purton, C. 1998, ApJ, 156, 125
Casertano, S. & van Gorkom, J. H. 1991, AJ, 101, 1231
Chemin, L., Balkowski, C., Cayatte, V., Carignan, C., Amram, P., Garrido, O., Hernandez,
O., Marcelin, M., Adami, C., Boselli, A. & Boulesteix, J. 2006, MNRAS, 366, 812
Collins, J. A. & Rand, R. J. 2001, ApJ, 551, 57
Corbelli, E., Schneider, S. E. & Salpeter, E. E. 1989, AJ, 97, 390
Daigle, O., Gach, J.-L., Guillaume, C., Balard, P. & Boissin, O. 2004, Proc. SPIE, 5499, 219
Daigle, O., Carignan, C., Amram, P., Hernandez, O., Chemin, L., Balkowski, C. & Kenni-
cutt, R. 2006a, MNRAS, 367, 469
Daigle, O., Carignan, C., Hernandez, O., Chemin, L. & Amram, P. 2006b, MNRAS, 368,
1016
– 26 –
Daigle, O., Carignan, C. & Blais–Ouellette, S. 2006c, in High Energy, Optical, and Infrared
Detectors for Astronomy II. Eds David A. Dom and Anrew D. Holland, Proc. SPIE,
6276, 62761F
Davoust, E. & de Vaucouleurs, G. 1980, ApJ, 242, 30
Dettmar, R. J. & Schulz, H. 1992, A&A, 254, L25
de Vaucouleurs, G. 1959, ApJ, 130, 718
de Vaucouleurs, G., de Vaucouleurs, A., Corwin, H. G. Jr., Buta, R. J., Paturel, G. & Fouque,
P. 1991, Third Reference Catalogue of Bright Galaxies (New–York: Springer)
Dopita, M., Fischera, J., Sutherland, R. S., Kewley, L. J., Tuffs, R. J., Popescu, C. C., van
Breugel, W., Groves, B. A. & Leitherer, C. 2006, ApJ, 647, 244
Dressler, A. 1980, ApJ, 236, 351
Fan, X., Strauss, M. A., Becker, R. H., White, R. L., Gunn, J. E., Knapp, G. R., Richards,
G. T., Schneider, D. P., Brinkmann, J. & Fukugita, M. 2006, AJ, 132, 117
Ferguson, A. M. N., Wyse, R. F. G., Gallagher III, J. S. & Hunter, D.A. 1996, AJ, 111, 2265
Gach, J.–L., Hernandez, O., Boulesteix, J., Amram, P., Boissin, O., CArignan, C., Garrido,
O., Marcelin, M., Ostlin, G., Plana, H. & Rampazzo, R. 2002, PASP, 114, 1043
Hernandez, O., Gach, J.–L., Carignan, C. & Boulesteix, J. 2003, in Instrument Design and
Performance for Optical/Infrared Ground-based Telescopes, Eds Iye, M. & Moor-
wood, A. F. M., Proceedings of the SPIE, 4841, 1472
Hernandez, O., Carignan, C., Amram, P., Chemin, L. & Daigle, O. 2005, MNRAS, 360, 1201
Honma, M. & Sofue, Y. 1997, PASJ, 49, 539
Hoopes, C. G., Walterbos, R. A. M. & Greenawalt, B. E. 1996, AJ, 112, 1429
Ibata, R., Chapman, S., Ferguson, A. M. N., Lewis, G., Irwin, M. & Tanvir, N. 2005, ApJ,
634, 287
Irwin, M. J., Ferguson, A. M. N., Ibata, R. A., Lewis, G. F. & Tanvir, N. R. 2005, ApJ, 628,
L105
Karachentsev, I. D. 2003, A&A, 404, 93
– 27 –
Kennicutt, R. C., Bresolin, F., Bomans, D. J., Bothun, G. D., & Thompson, I. B. 1995, AJ,
109, 594
Meurer, G. R. et al. 2006, ApJS, 165, 307
Monnet, G. 1971, A&A, 12, 379
Noodermeer, E., van der Hulst, J. M., Sancisi, R., Swaters, R. S. & van Albada, T. S. 2007,
MNRAS, 376, 1513
Oey, M. S. et al. 2007, ApJ, 661, 801
Oosterloo, T., Fraternali, F. & Sancisi, R. 2007, AJ, 134, 1019
Olling, R. P. 1996, AJ, 112, 457
Puche, D. & Carignan, C. 1988, AJ, 95, 1025
Puche, D. & Carignan, C. 1991, ApJ, 378, 487
Rand, R. J., Kulkarni, S. R. & Hester, J. J. 1990, ApJ, 352, 1
Reynolds, R. J. 1984, ApJ, 378, 487
Reynolds, R. J., Haffner, L. M. & Tufte, S. L. 1999, ApJ, 525, L21
Ryder, S. D., Zasov, A. V., McIntyre, V. J., Walsh, W. & Sil’chenko, O. K. 1998, MNRAS,
293, 411
Sancisi, R. & Allen, R. J. 1979, A&A, 74, 73
Sicotte, V. & Carignan, C. 1997, AJ, 113, 609
Sofue, Y. & Rubin, V. 2001, ARA&A, 39, 137
Thilker, D. A., Walterbos, R. A. M., Braun, R. & Hoopes, C. G. 2002, AJ, 124, 3118
van Gorkom, J. H. 1993, in The Environment and Evolution of Galaxies, ed. J.M. Shull &
H.A. Thronson (Dorfrecht: Kluwer), p. 345
Veilleux, S., Cecil, G. & Bland–Hawthorn, J. 1995, ApJ, 445, 152
Veilleux, S., Shopbell, P. L., Bland–Hawthorn, J. & Cecil, G. 2003, ApJ, 126, 2185
– 28 –
Vogelaar, M. G. R. & Terlouw, J. P. 2001, in Astronomical Data Analysis Software and
Systems X, eds F. R. Harnden Jr., F. A. Primiri & H. E. Payne, ASP Conf. Series,
238, 358
Walterbos, R. A. M. & Braun, R. 1994, ApJ, 431, 156
Wang, J., Heckman, T. M. & Lehnert, M. D. 1999, ApJ, 515, 97
Whitmore, B. C., Forbes, D. A. & Rubin, V. C. 1988, ApJ, 333, 542
Zurita, A., Rozas, M. & Beckman, J. E. 2000, A&A, 363, 9
This preprint was prepared with the AAS LATEX macros v5.2.