The late-time light curve of the type Ia supernova 2000cx
27
arXiv:astro-ph/0409338v1 14 Sep 2004 Astronomy & Astrophysics manuscript no. sissa February 2, 2008 (DOI: will be inserted by hand later) The late-time light curve of the Type Ia supernova 2000cx ⋆ Jesper Sollerman 1 , Jan Lindahl 1,2 , Cecilia Kozma 1 , Peter Challis 3 , Alexei V. Filippenko 4 , Claes Fransson 1 , Peter M. Garnavich 5 , Bruno Leibundgut 6 , Weidong Li 4 , Peter Lundqvist 1 , Peter Milne 7 , Jason Spyromilio 6 , and Robert P. Kirshner 3 1 Stockholm Observatory, AlbaNova, Department of Astronomy, 106 91 Stockholm, Sweden 2 Onsala Space Observatory, Chalmers University of Technology, 439 92 Onsala, Sweden 3 Harvard-Smithsonian Center for Astrophysics, 60 Garden Street, Cambridge, MA 02138, USA 4 Department of Astronomy, University of California, Berkeley, CA 94720-3411, USA 5 Physics Department, University of Notre Dame, Notre Dame, IN 46566, USA 6 European Southern Observatory, Karl-Schwarzschild-Strasse 2, D-85748 Garching, Germany 7 Steward Observatory, University of Arizona, 933 North Cherry Avenue, Tucson, AZ 85721, USA Received — ?, Accepted — ? Abstract. We have conducted a systematic and comprehensive monitoring programme of the Type Ia supernova 2000cx at late phases using the VLT and HST. The VLT observations cover phases 360 to 480 days past maximum brightness and include photometry in the BV RIJH bands, together with a single epoch in each of U and Ks. While the optical bands decay by about 1.4 mag per 100 days, we find that the near-IR magnitudes stay virtually constant during the observed period. This means that the importance of the near-IR to the bolometric light curve increases with time. The finding is also in agreement with our detailed modeling of a Type Ia supernova in the nebular phase. In these models, the increased importance of the near-IR is a temperature effect. We note that this complicates late-time studies where often only the V band is well monitored. In particular, it is not correct to assume that any optical band follows the bolometric light curve at these phases, and any conclusions based on such assumptions, e.g., regarding positron-escape, must be regarded as premature. A very simple model where all positrons are trapped can reasonably well account for the observations. The nickel mass deduced from the positron tail of this light curve is lower than found from the peak brightness, providing an estimate of the fraction of late-time emission that is outside of the observed wavelength range. Our detailed models show the signature of an infrared catastrophe at these epochs, which is not supported by the observations. Key words. supernovae: general; supernovae: individual: SN 2000cx 1. Introduction Type Ia supernovae (SNe Ia) are believed to be the de- structive thermonuclear explosions of white dwarfs (e.g., Hoyle & Fowler 1960; see for a review Leibundgut 2000). During the first years, their light curves are powered by the radioactive decay of freshly nucleosynthesized 56 Ni, releasing MeV γ -rays and positrons in the ejecta. The uni- formity of the early-time light curves has enabled the use of SNe Ia for measuring cosmological distances (Schmidt et al. 1998; Riess et al. 1998; Perlmutter et al. 1999). The peak luminosity of such an explosion is given by the amount of ejected 56 Ni, and the early bolometric light Send offprint requests to : [email protected] ⋆ Based on observations collected at the European Southern Observatory, Paranal, Chile (ESO Programmes 67.D-0134 and 68.D-0114). Also based in part on observations with the NASA/ESA Hubble Space Telescope. These HST observations are associated with proposals GO-8602 and GO-9114. curve can thus be used to determine this important quan- tity (Arnett 1982; Contardo et al. 2000). The shape of the light curve at the early post-maximum phase (40–120 days past explosion) is determined by the fraction of the γ -rays that are thermalized. While the massive Type II SNe (like SN 1987A) generally trap most γ -rays, resulting in late-time light curves tracking the radioactive decay of 0.98 mag per 100 days, the light curves of SNe Ia decline much faster. This is because the small progenitor masses and the high expansion velocities of SNe Ia quickly make the ejecta transparent to the γ -rays. At phases later than about 200 days past the explo- sion, virtually all γ -rays escape freely from the ejecta, and the luminosity is then provided by the kinetic energy de- posited by the positrons. Whether or not the positrons are able to escape from the ejecta depends on the strength and geometry of the magnetic field (Colgate et al. 1980; Ruiz- Lapuente & Spruit 1998; Milne et al. 1999, 2001). While a
Transcript of The late-time light curve of the type Ia supernova 2000cx

arX
iv:a
stro
-ph/
0409
338v
1 1
4 Se
p 20
04Astronomy & Astrophysics manuscript no. sissa February 2, 2008(DOI: will be inserted by hand later)
The late-time light curve of the Type Ia supernova 2000cx ⋆
Jesper Sollerman1, Jan Lindahl1,2, Cecilia Kozma1, Peter Challis3, Alexei V. Filippenko4, Claes Fransson1,Peter M. Garnavich5, Bruno Leibundgut6, Weidong Li4, Peter Lundqvist1, Peter Milne7, Jason
Spyromilio6, and Robert P. Kirshner3
1 Stockholm Observatory, AlbaNova, Department of Astronomy, 106 91 Stockholm, Sweden2 Onsala Space Observatory, Chalmers University of Technology, 439 92 Onsala, Sweden3 Harvard-Smithsonian Center for Astrophysics, 60 Garden Street, Cambridge, MA 02138, USA4 Department of Astronomy, University of California, Berkeley, CA 94720-3411, USA5 Physics Department, University of Notre Dame, Notre Dame, IN 46566, USA6 European Southern Observatory, Karl-Schwarzschild-Strasse 2, D-85748 Garching, Germany7 Steward Observatory, University of Arizona, 933 North Cherry Avenue, Tucson, AZ 85721, USA
Received — ?, Accepted — ?
Abstract. We have conducted a systematic and comprehensive monitoring programme of the Type Ia supernova2000cx at late phases using the VLT and HST. The VLT observations cover phases 360 to 480 days past maximumbrightness and include photometry in the BV RIJH bands, together with a single epoch in each of U and Ks.While the optical bands decay by about 1.4 mag per 100 days, we find that the near-IR magnitudes stay virtuallyconstant during the observed period. This means that the importance of the near-IR to the bolometric light curveincreases with time. The finding is also in agreement with our detailed modeling of a Type Ia supernova in thenebular phase. In these models, the increased importance of the near-IR is a temperature effect. We note thatthis complicates late-time studies where often only the V band is well monitored. In particular, it is not correctto assume that any optical band follows the bolometric light curve at these phases, and any conclusions based onsuch assumptions, e.g., regarding positron-escape, must be regarded as premature. A very simple model whereall positrons are trapped can reasonably well account for the observations. The nickel mass deduced from thepositron tail of this light curve is lower than found from the peak brightness, providing an estimate of the fractionof late-time emission that is outside of the observed wavelength range. Our detailed models show the signatureof an infrared catastrophe at these epochs, which is not supported by the observations.
Key words. supernovae: general; supernovae: individual: SN 2000cx
1. Introduction
Type Ia supernovae (SNe Ia) are believed to be the de-structive thermonuclear explosions of white dwarfs (e.g.,Hoyle & Fowler 1960; see for a review Leibundgut 2000).During the first years, their light curves are powered bythe radioactive decay of freshly nucleosynthesized 56Ni,releasing MeV γ-rays and positrons in the ejecta. The uni-formity of the early-time light curves has enabled the useof SNe Ia for measuring cosmological distances (Schmidtet al. 1998; Riess et al. 1998; Perlmutter et al. 1999).
The peak luminosity of such an explosion is given bythe amount of ejected 56Ni, and the early bolometric light
Send offprint requests to: [email protected]⋆ Based on observations collected at the European Southern
Observatory, Paranal, Chile (ESO Programmes 67.D-0134 and68.D-0114). Also based in part on observations with theNASA/ESA Hubble Space Telescope. These HST observationsare associated with proposals GO-8602 and GO-9114.
curve can thus be used to determine this important quan-tity (Arnett 1982; Contardo et al. 2000). The shape ofthe light curve at the early post-maximum phase (40–120days past explosion) is determined by the fraction of theγ-rays that are thermalized. While the massive Type IISNe (like SN 1987A) generally trap most γ-rays, resultingin late-time light curves tracking the radioactive decay of0.98 mag per 100 days, the light curves of SNe Ia declinemuch faster. This is because the small progenitor massesand the high expansion velocities of SNe Ia quickly makethe ejecta transparent to the γ-rays.
At phases later than about 200 days past the explo-sion, virtually all γ-rays escape freely from the ejecta, andthe luminosity is then provided by the kinetic energy de-posited by the positrons. Whether or not the positrons areable to escape from the ejecta depends on the strength andgeometry of the magnetic field (Colgate et al. 1980; Ruiz-Lapuente & Spruit 1998; Milne et al. 1999, 2001). While a
2 Sollerman et al.: SN 2000cx @ late phases
weak and radially combed magnetic field might allow anincreasing fraction of the positrons to escape, thus pro-viding a steep light curve, a strong, tangled magnetic fieldwould efficiently trap all the positrons, and keep the lightcurve at the radioactive decay rate.
The study of the positron phase of the light curve couldthus potentially help answer questions about the magneticfield configuration in exploding white dwarfs, as well as toconstrain the contribution of supernova explosions to thediffuse Galactic 511 keV background. Previous attemptsto study the positron phase of the light curve have, how-ever, been hampered by the lack of both observationaldata and detailed modeling.
As a first step to investigate whether observations ofthe positron phase can establish any conclusions aboutpositron escape, we have attempted a photometric studyat late phases of the Type Ia SN 2000cx, and modeled itslight curve in some detail.
1.1. SN 2000cx
SN 2000cx was discovered on 17.5 July 2000 (Yu et al.2000; UT dates are used throughout our paper). It was lo-cated 23.′′0 west and 109.′′3 south of the nucleus of the S0galaxy NGC 524. It was classified as a SN Ia, with a spec-trum resembling that of the peculiar SN 1991T (Chornocket al. 2000; see Filippenko 1997 for a review of super-nova spectra). The recession velocity of NGC 524 is only∼ 2400 km s−1, and SN 2000cx became the brightest su-pernova observed that year. Furthermore, the favorableposition far from the galaxy center made it a good targetfor late-time photometry. The early-time photometry hasbeen extremely well covered by Li et al. (2001) and byCandia et al. (2003). The B-band maximum occurred onJuly 26.3 (MJD 51752.2) at B = 13.42 mag. The early de-cline rate was determined to be ∆m15(B) = 0.93 (Li et al.2001). The light curve around peak was rather unusual.It was a fast riser but a slow decliner (Li et al. 2001),and SN 2000cx has therefore been labeled a peculiar su-pernova. The unusual early light curve may have beenrelated to the presence of high-velocity material (Branchet al. 2004).
Here we report on our late-time observations of SN2000cx obtained with the Very Large Telescope (VLT)and the Hubble Space Telescope (HST). Preliminary re-sults have been reported by Sollerman et al. (2004) andthe results presented here supersede that report. The ob-servations, data reduction, and photometry are describedin Sect. 2. The results are presented in Sect. 3, and in Sect.4 we discuss the late-time light curves of SNe Ia in general.In Sect. 5 we describe our detailed modeling, and Sect. 6discusses the modeling in conjunction with the data. Ourmain conclusions are summarized in Sect. 7.
2. Observations and data analysis
2.1. Optical imaging with the VLT
The field of SN 2000cx was observed in the opti-cal (UBV RI) range during several epochs between 359and 480 days past maximum light. These observationswere obtained with the Focal Reducer and low disper-sion Spectrograph (FORS) instruments1 at the EuropeanSouthern Observatory (ESO) VLT. FORS2 was used forthe first epoch of observations. This instrument was at-tached to the fourth of the four VLT Unit telescopes(UT4). The subsequent observations were all conductedwith FORS1, which was then mounted at the Cassegrainfocus of UT3. A log of the observations is given in Table 1.
Both of the FORS instruments were equipped with2048 × 2048 pixel CCDs having 24 µm pixels. We usedthe standard resolution mode that gives a field-of-view of6.′8 × 6.′8 with a pixel size on the sky of 0.′′20. An imageof the field of the supernova is displayed in Fig. 1, anda detail of the region around the supernova is shown inFig. 2.
All observations were split into several exposures withsmall telescope shifts in between. This was to avoid heavysaturation of a nearby bright star, and to allow for removalof cosmic rays. The observations were all conducted inservice mode by the Paranal staff.
The data were reduced with the NOAO IRAF soft-ware.2 We have bias-subtracted and twilight-sky flattenedall the frames and then combined the exposures in thesame filters using a sigma clipping rejection.
Our first and last epochs of observation were photo-metric and on the first epoch we observed the followingstandard fields of Landolt (1992) with FORS2: Mark A,PG 1323-086, PG 2331+055, and SA 109-949. There werein total 15 stars useful for obtaining the photometric so-lutions in these fields. The instrumental magnitudes ofthe standard stars were all measured with an aperture of15 pixel radius. The sky background was estimated us-ing an annulus of inner radius 30 pixels and outer radius40 pixels. We used the package PHOTCAL to calculate thetransformation equations to determine zero points, colorterms, and atmospheric extinction terms.
The color terms we obtained were actually very similarto the averaged transformations provided by ESO.3 Sincethe ESO measurements are based on a larger number ofstandard stars, we decided to fix the color and extinctionterms to the values determined by ESO.
This procedure allowed us to calibrate a number of lo-cal stars in the field of SN 2000cx. Photometry of the su-pernova was then tied to the system of Landolt standardsvia these field stars, so that accurate supernova photom-etry could be established also on non-photometric nights.
1 http://www.eso.org/instruments/fors1/2 IRAF, http://iraf.noao.edu/iraf/web/, is distributed by
NOAO.3 www.eso.org/observing/dfo/quality/FORS2/qc/photcoeff/photcoeffs fors2.h
Sollerman et al.: SN 2000cx @ late phases 3
To check the nightly zero points we also reduced thestandard stars for the last epoch of observations. On thatnight we observed 3 standard fields with FORS1: PG2213-006, Rubin 152, and SA100-269, with a total of 9 use-ful standard stars (Landolt 1992). For the 14 local stan-dard stars chosen all over the CCD frame, the magni-tude differences between the first and last epochs had aroot-mean-square (rms) of 0.015 mag in the V band. Thelargest difference, in the B band, was still less than 0.04mag. The magnitudes for our local standards are givenin Table 2, together with their offsets from the supernova.These magnitudes were measured in a 6-pixel radius aper-ture, and aperture corrected using the task MKAP. Errorsin the aperture correction were typically less than 0.01mag, but reached 0.016 mag in the U band. The magni-tude errors for the standard stars reported in Table 2 arethe photometric errors from PHOT added in quadrature tothe rms difference in magnitude between the two epochs.The error budget for the local standards is certainly be-low 0.05 mag in all bands, possibly with the exception ofthe U band, which is always more difficult (e.g., Suntzeff2000). The U -band uncertainties in Table 2 are simply theerror estimates from PHOT, including errors for the trans-formations.
The supernova photometry was performed on eachepoch in a 6-pixel radius aperture. The magnitudes forthe supernova are given in Table 3. These magnitudesare aperture-corrected and tied to the Landolt standardsvia the local standards. Here we have estimated the su-pernova magnitudes as the mean value of the differentialmagnitudes compared to our 14 local standards as given inTable 2. The estimated uncertainties given in Table 3 arecombined from the error estimate by PHOT and the stan-dard deviation for the 14 different magnitude estimatesfor each filter and epoch. The latter error should to someextent also encapsulate uncertainties in aperture correc-tions, color transformations, and zero points.
2.2. Infrared observations
Near-infrared observations were obtained using theInfrared Spectrometer And Array Camera (ISAAC)4 at-tached to UT1 of the ESO VLT. A log of the observationsis given in Table 4, and regions of two images are displayedin Fig. 2.
We used the Short Wavelength (SW) imaging modewith the Rockwell Hawaii HgCdTe 1024×1024 pixel arraydetector. The pixel size on the sky was 0.′′147 and the field-of-view was 2.′5 × 2.′5. The observations were performed inthe J , H , and Ks bands in jitter mode, with small offsetsperformed between each image in order to allow for skysubtraction. As the supernova was positioned far out fromthe core of the galaxy, we did not have to dither separatelyfor sky.
For the J band, the detector integration times (DITs)were 30 s, and each observation was built up from 3 DITs
4 http://www.eso.org/instruments/isaac/
per exposure (NDITs). This means that we stayed on thesame spot in the sky for ∼ 1.5 minutes. The number ofexposures (NEXP) in each observational block was typi-cally 15 in the J band, which gives total exposure times(NDIT×DIT×NEXP) of 1350 s per observing block inthe J band. The exposure times for the other bands canbe seen in Table 4. We performed Ks observations of SN2000cx only for the first epoch, due to our limited amountof observing time.
The data were reduced with the Eclipse5 and NOAOIRAF software. Dark and flatfield images were preparedusing standard Eclipse recipes. The sky background levelwas subtracted and the images were summed using theroutine jitter within Eclipse.
Photometric standard stars are observed regularlywith ISAAC in service mode. We reduced the J , H , and Ks
images of S279-F (Persson et al. 1989) from our first epoch,as well as J and H images of S234-E (Persson et al. 1989),FS10, FS19, and FS32 (Hawarden et al. 2001) obtained onour last epoch of observations. From these images we mea-sured the flux of the standard stars to establish zero pointsfor the given night and passband. The average Paranal at-mospheric extinction of 0.11 mag airmass−1 was used inthe J band, as well as 0.06 and 0.07 mag airmass−1 in theH and Ks bands, respectively.6
In this way we were able to establish local standardstars in the field of SN 2000cx, although due to the smallerfield of view of ISAAC, these were not the same stars asin the optical. The magnitudes of the local standard starswere measured using aperture photometry, and the mag-nitudes were aperture corrected using isolated and well-exposed stars. The magnitudes for the standard stars areshown in Table 5. The listed errors in J and H are the er-rors from PHOT and the rms magnitude difference betweenthe two epochs added in quadrature. For the Ks bandwe have only listed errors from PHOT, since this band wasused only at the first epoch. Thus, the somewhat smallererrors listed in this band are likely to be underestimatedaccordingly.
The magnitudes of the supernova were again measuredusing differential photometry, and the uncertainties es-timated as rms errors from comparison with the 14 lo-cal standard stars, added in quadrature with the errorsfrom PHOT. The supernova near-IR magnitudes are listedin Table 6. We note that the supernova itself was fainterthan most of our local standard stars at these late phases.This means that the error budget estimated by compar-ison with the standard stars is probably too optimistic.At these faint levels, sky subtraction errors in the near-IRare likely to dominate the errors. In fact, we verified ourreductions by an independent estimate using the XDIMSUM
package. However, by measuring ten sources close to thesupernova, which all had magnitudes comparable to thesupernova itself, we found a significant scatter in the es-timated magnitudes between the different epochs. From
5 http://www.eso.org/projects/aot/eclipse/6 http://www.eso.org/instruments/isaac/imaging standards.html

4 Sollerman et al.: SN 2000cx @ late phases
this exercise, we instead estimate an error of ±0.15 magin the supernova near-IR magnitudes.
2.3. Late HST photometry
SN 2000cx was also observed with HST. A log of the HSTobservations is given in Table 7.
We retrieved the data from the HST science archive,which delivers the fully reduced WFPC2 images. The pho-tometry was performed using the HSTPhot package as de-scribed by Dolphin (2000). This software fits point-spreadfunctions (PSF) to the detected objects, and also accountsfor charge transfer efficiencies and aperture corrections.Following Li et al. (2002), we used option 10 to measurethe supernova magnitudes. This option uses local sky de-termination and default aperture corrections. The mag-nitudes in the WFPC system and error estimates fromHSTPhot for SN 2000cx are also given in Table 7. An im-age of the supernova in the PC chip was presented by Liet al. (2002, their Fig. 1 bottom right). The supernova liesin a clean and isolated region, which ensures that aper-ture photometry in our high quality ground-based datais adequate for this object. We also do not see any signsof a light echo (cf. Schmidt et al. 1994). No other staris detected close to the supernova position; moreover, theV − K and near-IR colors are not consistent with anystellar type, ruling out significant contamination from aforeground star in the late-time near-IR data.
2.4. Optical spectroscopy
At the first epoch of optical observations, 360 days pastmaximum, we also performed spectroscopy of SN 2000cx.On 24 July 2001 we obtained a 2400 s exposure usingFORS2 on UT4. We used the 300V grism together withorder-sorting filter GG375 and a 1.′′3 wide slit. Two nightslater, on 26 July 2001, this was complemented by another2400 s spectrum with the 300I grism and the OG590 filter.Together these two spectra cover the wavelength region ∼
3700–9200 A.The spectra were reduced in a standard way, including
bias subtraction, flat fielding, and wavelength calibrationusing spectra of a Helium-Argon lamp. Flux calibrationwas done relative to the spectrophotometric standard starLTT377 with the 300V grism and to G158-100 with the300I grism. The absolute flux calibration of the combinedspectrum was obtained relative to our broad-band pho-tometry.
3. Results
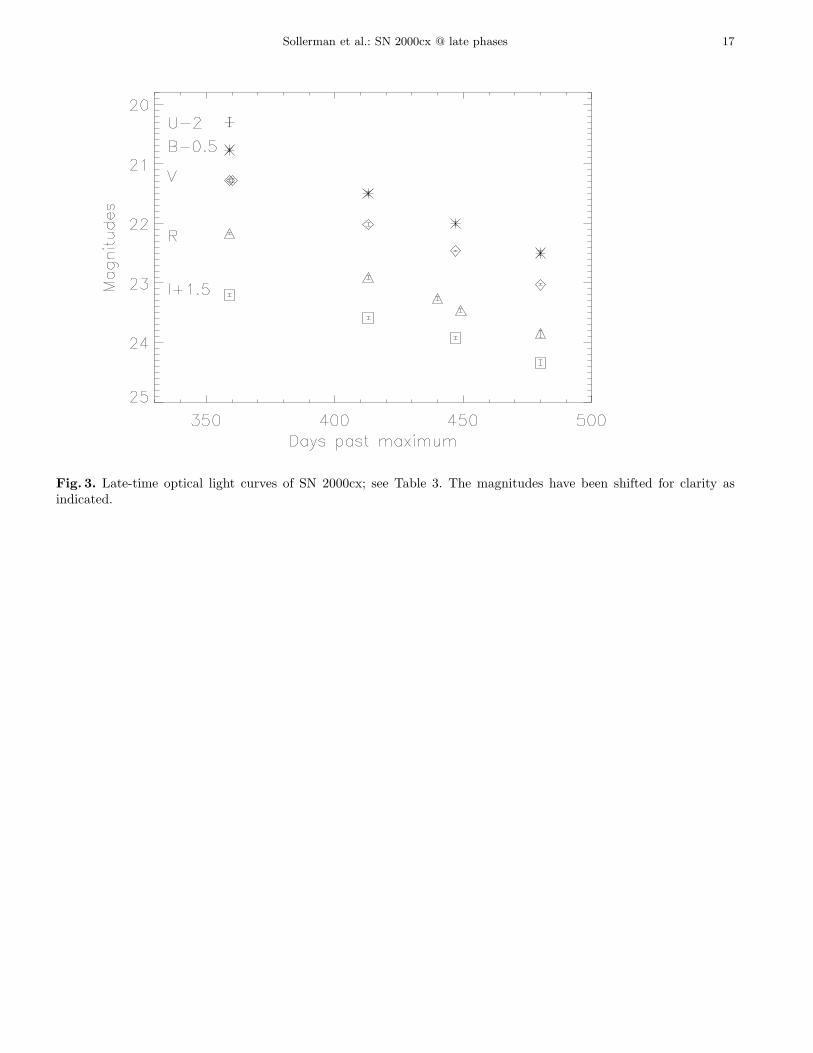
In Fig. 3 we plot the UBV RI photometry from our VLTobservations. The flux from the supernova can be seen todecrease exponentially. A linear fit to the magnitudes givesthe slopes presented in Table 8. The BV R light curvesdecline by about 1.4 mag per 100 days. This is consistentwith the SNe Ia light curve slopes at earlier epochs (e.g.,Turatto et al. 1990), and also reasonably consistent with
the early light curve of SN 2000cx as published by Li etal. (2001). In Fig. 4 we plot the V and R light curves fromthat study, together with our late-time data. The dashedlines are the extrapolations of the late-time slopes to theearly-time data. The I band, on the other hand, does notfollow the other bands at late phases. At 0.88 mag per 100days, this passband declines significantly more slowly.
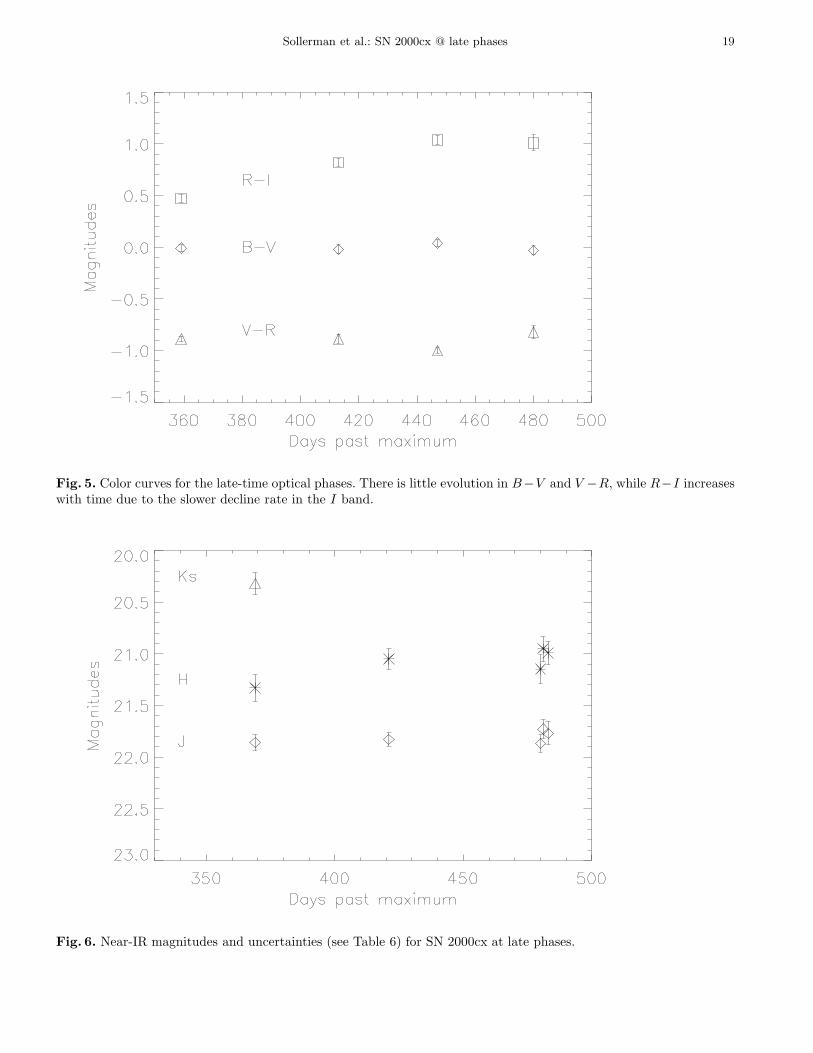
The color evolution between 360 and 480 days pastmaximum is not very strong in the optical range. In Fig. 5we show the B − V , V − R, and R − I color evolution.Only in the R − I color can a clear trend be seen, due tothe shallower slope in the I-band light curve.
The near-IR magnitudes from the VLT are plotted inFig. 6. There is no evidence for any fading of the supernovaflux during the observed epoch. This result is new andshows that substantial color evolution is indeed present atthese very late phases. A linear fit to the JH light curvesgives the decline rates presented in Table 8. The 1σ errorson the decline rate were derived for a photometric errorof ±0.15 mag at each date.
Finally, also the very late-time observations with theHST have been added to the earlier light curves in Fig. 4.The earliest HST data, from day 348, have already beenpublished by Li et al. (2002). They measured the WFPC2magnitudes in the very same way as we have done, andwith the same results (their Table 1). The magnitudewe have plotted in the R-band light curve in Fig. 4is the F675W magnitude, and should be converted tothe Cousins R-band system. Li et al. (2002) obtainedR = 22.14 mag with a rough conversion using the trans-formation from Dolphin (2000).7 This is still consistentwith our late light curve. In fact, as also noted by Li etal. (2002), the transformations used for converting mag-nitudes between these systems are not really applicableto emission-line objects. A better method may be to useour late-time spectrum obtained 360 days past maximum,to define the filter transformation. We used this spec-trum, and integrated the flux under the filter functionsfor both the R-band filter and the HST F675W filter usingthe SYNPHOT task pltrans. This gave an offset of 0.23(Vega) mag, which converts our measured F675W magni-tude to R = 22.21 mag, and similarly F814W to I = 21.68mag. Both transformations would make the HST magni-tudes undershoot the light curves from the VLT, as illus-trated by the added error bar in Fig. 4 for the transformedR-band magnitude at day 348. The later F555W magni-tudes would accordingly have 0.15 mag added to convertto the V band. This is, however, under the assumptionthat the spectrum stays constant, and we have not takenthis transformation into account in Fig. 4 or in the follow-ing discussion, where such an offset would not affect ourconclusions in any way.
7 Li et al. (2002) report R = 22.10 mag from an approxima-tion, but the more detailed calculation for these transforma-tions gives R = 22.14 mag.

Sollerman et al.: SN 2000cx @ late phases 5
3.1. Bolometric luminosity
The wide UBV RIJHK coverage of our broad-band mag-nitudes allow an attempt to construct a UV-optical-IR(hereafter UVOIR) “bolometric” light curve. Such a lightcurve should represent the fraction of γ-ray and positronenergy that is thermalized in the ejecta, although at theselate phases some fraction of the energy is also escaping ateven longer wavelengths.
To derive an absolute bolometric light curve we needthe distance and reddening to SN 2000cx. The host extinc-tion is expected to be small, since the supernova occurredin an S0 galaxy, and far outside the central region. Earlyhigh-resolution spectra show no evidence for host galaxyNa I D absorption (Lundqvist et al. 2005). There is, how-ever, a weak Galactic component of Na I D, consistentwith the galactic reddening in the direction of SN 2000cxas derived by Schlegel et al. (1998), E(B − V ) = 0.082mag. We will use this value for the total extinction to-ward SN 2000cx. The distance to SN 2000cx was reviewedin Candia et al. (2003) and is not very well constrained.8
We will use a distance modulus of 32.47 mag in accordancewith their analysis.
We made a simple UVOIR light curve in the follow-ing way. For the earlier epochs, we use the optical data(BV RI) from Li et al. (2001), the near-IR data (JHK)from Candia et al. (2003) and assume that U ≈ B + 0.2(Candia et al. 2003, their Fig. 3). For our late VLT obser-vations we assume that the U − B and H − K colors areconstant during these epochs. We convert the magnitudesto flux using Fugutaki et al. (1995) and Allen (2000) forthe optical and near-IR magnitudes, respectively. We thensimply integrate the flux from U (0.36 µm) to K (2.2 µm)to form the UVOIR light curve. No assumptions are madeon the fraction of emission lost outside this band (but seeSuntzeff 1996). Where observations are missing, we sim-ply interpolate. The extinction correction is done usingthe extinction law from Fitzpatrick (1999). The resultinglight curve is displayed in Fig. 7.
4. Light curves of SNe Ia
There exist a rich literature regarding the light curves ofSNe Ia (e.g., Leibundgut 2000, and references therein).Almost all such studies concern the early phases of thesupernova, when it is bright and relatively easy to observe.The importance of these early phases has been greatlyemphasized with the realization that SNe Ia can be usedfor accurate measurements of cosmological distances.
The light curves of SNe Ia are powered by the deposi-tion in the expanding SN ejecta of the γ-rays and positronsproduced by the decay chain 56Ni →
56Co →56Fe. The
shape of the early-time light curve of a SN Ia dependsessentially on the fact that optical photons created by the
8 The distance measurements to NGC 524 are actually quitedisaccording. Surface Brightness Fluctuation measurements in-dicate a distance modulus of 31.84 ± 0.20, while a supernovaestimate gives 32.53 ± 0.35.
thermalization of the γ-rays and positrons do not imme-diately escape from the optically thick ejecta. Maximumlight occurs when the instantaneous rates of deposition ofhard radiation and emission of optical light are roughlyequal (Arnett 1982). With time, the delay between en-ergy deposition and emission of optical radiation becomesprogressively smaller.
In this work we instead concentrate on the late phases.In the nebular phase, the ejecta are essentially opticallythin. The light curves at these phases are still driven by theradioactive decay of 56Co, which decays on a timescale of111.3 days. However, the few SNe Ia for which there existwell-monitored light curves at phases up to several hun-dred days decline substantially faster than this. Actually,such observations were available even before the under-standing that 56Co powers the light curves, and early sug-gestions for the powering included nuclei with faster decaytimes, such as californium (Baade et al. 1956, see Colgateet al. 1997 for an interesting historical perspective). Fromnucleosynthesis arguments it was soon realized that mostof the burned material is iron-group elements, and mostimportantly 56Ni. The observed rapid decline rate of thelight curves is now instead interpreted in terms of escapeof the γ-rays from the ejecta. As the ejecta expand, theoptical depth decreases and a progressively larger fractionof the γ-rays escapes thermalization.
A simple toy model for the late emission can some-times be instructive to understand the decay of a su-pernova light curve (e.g., Sollerman et al. 2002). Inthis model the flux from the decay of 56Co evolves ase−t/111.3
× (1 − 0.966e−τ), where the optical depth, τ =
(t1/t)2, decreases due to the homologous expansion, and
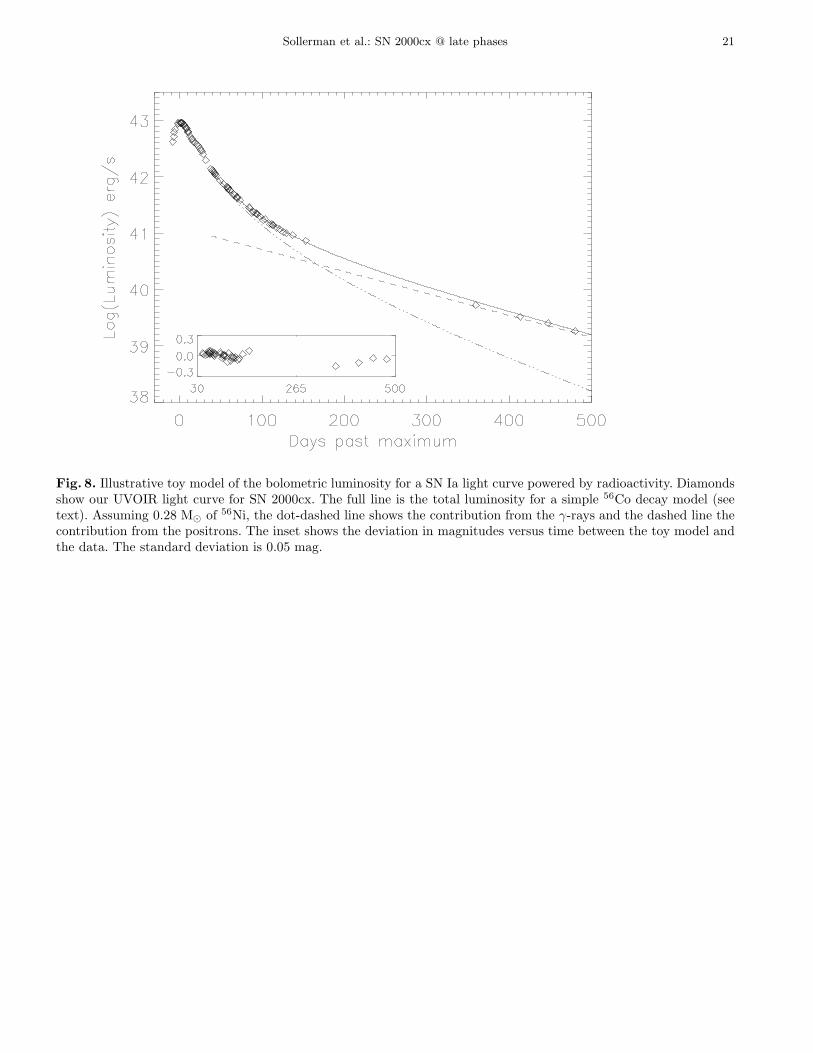
t1 sets the time when the optical depth to γ-rays is unity.Furthermore, 3.4% of the energy in these decays is in theform of the kinetic energy of the positrons, which are hereassumed to be fully trapped. Such a simplistic model canreasonably well fit the ’bolometric’ light curve of a SN Iaafter the diffusion phase, with only two free parameters(Fig. 8).
As the γ-rays escape the ejecta, the relative impor-tance of the positrons will increase, and as soon as thetrapping of the γ-rays decreases to below 3.4% the lightcurve enters the positron-dominated phase. The shape ofthe bolometric light curve will then depend on whetheror not the positrons are fully trapped. The simple modeldescribed above assumes full trapping, which is likely thecase if the ejecta of SNe Ia have a strong and tangledmagnetic field. In this case the light curve should flattenout and approach the decay time of 56Co in the positron-dominated phase (see Fig. 8). However, late-time observa-tions of SNe Ia in optical passbands have indicated thatthe light curve continues to fall rapidly also at epochs laterthan 200 days.
This has been interpreted in two different ways. Itcould be that the positrons escape from the ejecta, andtherefore cannot efficiently power the late-time light curve.Alternatively, more and more of the emission may emerge

6 Sollerman et al.: SN 2000cx @ late phases
at longer wavelengths outside our observational coverage.To investigate these scenarios was the main motivation forour observational campaign of SN 2000cx.
The progressive transparency of positrons was sug-gested by Arnett (1979) and this positron escape scenariowas elaborated by Colgate et al. (1980). It was obser-vationally investigated by Cappellaro et al. (1997) andmore recently by Milne et al. (1999, 2001), who suggestedthat positron escape must indeed occur in at least someSNe Ia in order to explain their late-time light curves.Ruiz-Lapuente & Spruit (1998) reached similar conclu-sions and connected them to the theory of the white dwarfmagnetic field. If positron escape is indeed needed to ex-plain the rapidly declining late-time light curves, this im-plies weak or radially combed magnetic fields.
These comparisons between observations and simplemodels have, however, several caveats. Most importantly,the observations of late-time light curves are relativelysparse, and are available in a few passbands only. It istherefore not possible to construct true bolometric lightcurves. At earlier phases, attempts to construct UVOIRlight curves for SNe Ia are indeed useful for comparisons tomodels (e.g., Contardo et al. 2000). At these phases, theUVOIR light curve embraces most of the emitted light(Suntzeff 1996; Contardo et al. 2000). This assumption isnot necessarily valid at later phases, but has often beenadopted due to the lack of detailed observations.
For example, the work of Cappellaro et al. (1997) sim-ply assumed that the late V -band light curve follows thebolometric light curve at late phases. A similar assump-tion was made by Milne et al. (1999, 2001). However, wenote that as the input heating decreases and the ejectaexpand, the temperature is likely to decrease as well, andcolor evolution could then mimic the effect of positronescape.
To address this question requires comprehensive mod-eling of the nebular phase of the supernova. With a modelthat predicts where the emission will emerge, direct com-parisons with filter-band curves can be made. The at-tempts to build a self-consistent model for a nebular SNIa took off with the PhD thesis of Axelrod (1980). He ar-gued against positron escape and instead suggested thatthe emission at late phases would emerge in the far-IR,thereby introducing the concept of the “infrared catastro-phe.” This is a thermal instability that occurs when thetemperature drops below what is needed to excite the op-tical atomic levels, and the cooling is abruptly taken overby the far-IR fine-structure lines.
To be able to interpret our observations of SN 2000cx,we have therefore constructed detailed models for the latephases of SNe Ia.
5. Modeling
We have modeled the emission from a SN Ia in the nebularphase, 100–1000 days after explosion. The adopted codeis an updated version of the code described by Kozma &Fransson (1998a), and applied to SN 1987A by Kozma &
Fransson (1998a, 1998b). Below is a brief summary of themodel.
5.1. The model
The supernova ejecta are powered by the decay of radioac-tive isotopes formed in the explosion. In the model we in-clude the decays of 56Ni, 57Ni, and 44Ti. 56Ni first decaysto 56Co on a time scale of 8.8 days and then to stable56Fe on a time scale of 111.26 days (all decay times are e-folding). In the decay of 56Co a fraction (3.4%) of theenergy is released in the form of kinetic energy of thepositrons. 57Ni decays rapidly (51.4 h) to 57Co, whichthen decays to stable 57Fe on a time scale of 391 days.The decay time scale of 44Ti is 87 years and this decaychain also includes emission of positrons. At the epochswe are modeling, the decay of 56Co dominates the energyinput. The γ-rays emitted in the decays scatter off freeand bound electrons in the medium, and give rise to fastelectrons (with an energy of ∼0.01–1 MeV). These non-thermal electrons, as well as the positrons emitted in thedecays, deposit their energy by heating, ionizing, or excit-ing the ejecta. The amount of energy going into these threedifferent channels depends on the composition and degreeof ionization and is calculated by solving the Boltzmannequation as formulated by Spencer & Fano (1954). Detailsof this calculation are given in Kozma & Fransson (1992).In our model the γ-ray and positron deposition is calcu-lated for the different compositions and ionizations. Weassume that the positrons are deposited locally, withinthe regions containing the newly synthesized iron.
As input to our calculations we use the density struc-ture, abundances, and velocity structure from model W7(Nomoto et al. 1984; Thielemann et al. 1986). The modelis spherically symmetric containing zones of varying com-positions. Also, the amounts of radioactive elements aretaken from the W7 input model. We have made no at-tempts to alter the model to accomplish a better fit to theobservations.
The temperature, ionization, and level populations ineach zone are calculated time-dependently. We find thatsteady state is a good approximation up to ∼ 500 days.Thereafter, time dependence becomes increasingly impor-tant.
In addition to the atomic data given in Kozma &Fransson (1998a), the code has been updated to modelSNe Ia. In particular we have extended and updated ourtreatment of the iron-peak elements. We have includedcharge transfer reactions between the iron ions (Liu et al.1998) and extended the ionization balance for cobalt. Forthe iron ions we have updated the total recombinationrates and added rates to individual levels (Nahar 1996;Nahar 1997; Nahar et al. 1997). In addition to the ironions we solve Co II, Co III, Ni I, and Ni II as multilevelatoms.

Sollerman et al.: SN 2000cx @ late phases 7
5.2. Line transfer
For the line transfer we use the Sobolev approximation(Sobolev 1957, 1960; Castor 1970). The Sobolev approxi-mation turns the line transfer into a purely local process:either the photon is re-absorbed on the spot or it escapesthe medium. As the ejecta are expanding homologously,with a velocity much larger than the thermal velocity ofthe matter, this is a good approximation for an individ-ual, well-separated line. However, especially in the UV,there are many overlapping lines, and one can expect UVscattering to be important. The effect of line scatteringis to alter the emergent UV spectrum, but it also affectsthe UV field within the ejecta. The ionization of elementswith low ionization potential is sensitive to the UV field(see Kozma & Fransson 1998a). During scattering the UVphotons are shifted toward longer wavelengths, both dueto a pure Doppler shift, but also because of the increasedprobability of splitting the UV photons into several pho-tons of longer wavelengths. A more accurate treatment ofthe line scattering is therefore expected to decrease theimportance of photoionization.
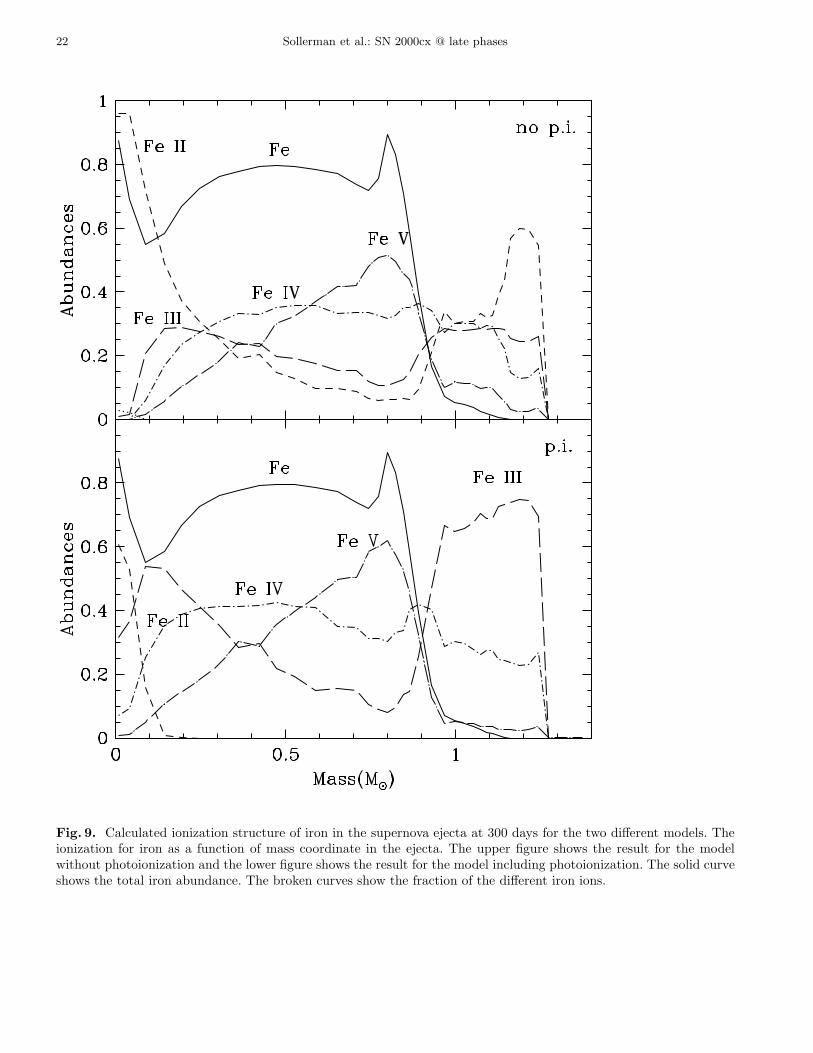
To probe the effects of photoionization we have there-fore made two model calculations, one without and theother including photoionization. These models to someextent represent the two extremes. The model includingphotoionization completely ignores the effects of UV scat-tering, while the model without photoionization assumesthat all UV photons are redistributed to longer wave-lengths. In the model including photoionization, we findthat the ejecta are photoionized mainly by recombinationemission. At 300 days the dominant contribution to thephotoionization of Fe II is due to recombination to Fe III.The ionization structure of these models is displayed inFig. 9, for the models both with and without photoion-ization included. This figure shows only the ionization foriron, which dominates the emission from SNe Ia at theselate phases. The final output of the calculations is the de-tailed evolution of the emission of the ejecta at all wave-lengths. Fig. 10 shows the modeled and observed spectraof SN 2000cx at ∼ 360 days past maximum. Convolvingthe calculated spectra with the filter functions we also ob-tain passband light curves from the model. In Fig. 11 weshow the light curves from this model, together with ourlate-time observations of SN 2000cx.
6. Discussion
Although most SNe Ia are rather homogeneous in theirproperties, some are quite different. SN 2000cx was clearlyphotometrically peculiar at early phases (Li et al. 2001).It provided a bad fit to standard supernova light curvesaround maximum light, and showed anomalously blue col-ors after maximum. It is not at all clear, however, howthe early appearance correlates with the later phases. Ithas recently been suggested that the peculiarities at earlyphases were related to a fast-moving clump just outsidethe supernova photosphere (Branch et al. 2004). This is
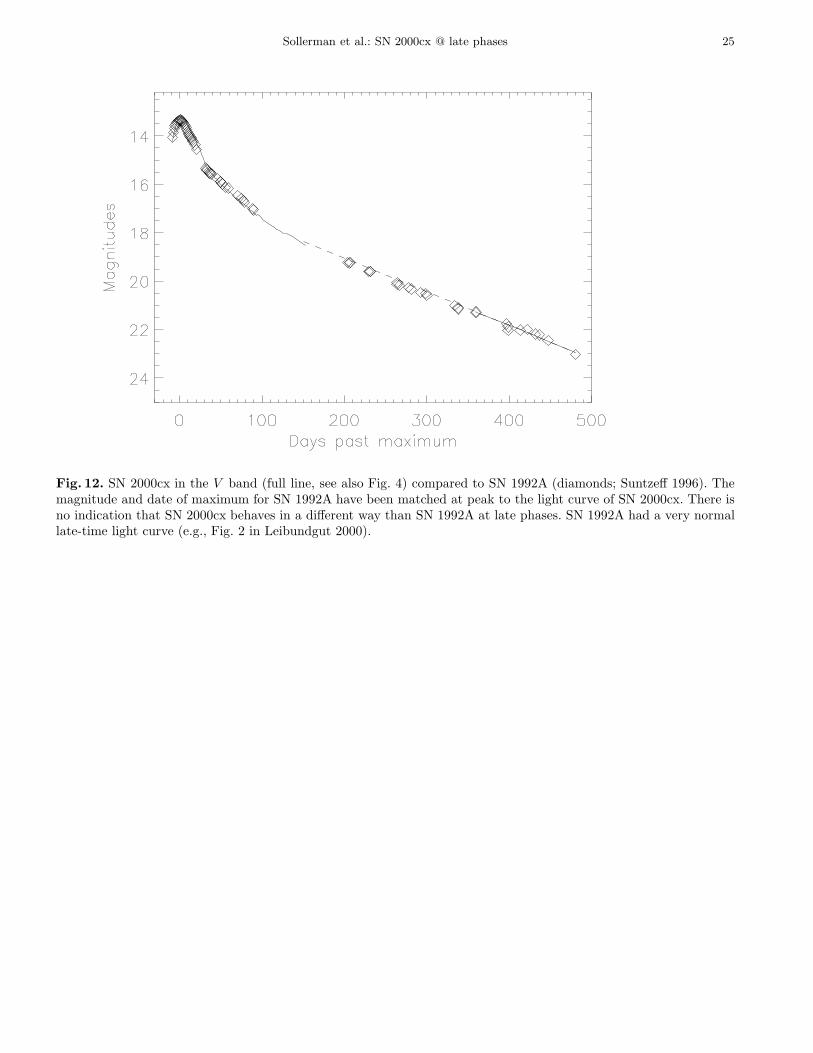
unlikely to affect the emission at later phases. Here weuse our late-time observations of SN 2000cx for a generaldiscussion of the late-time emission from SNe Ia. We alsonote that our modeling is totally generic, and in no wayadapted to fit this particular supernova. Instead of adjust-ing input parameters to improve the fits to the data, wewill use the models for a general discussion. In Fig. 12 wealso compare the V -band light curve of SN 2000cx withthe light curve of another well-observed SN Ia, SN 1992A,and show that the late-time behavior of SN 2000cx is notvery different. A future larger sample of SN Ia late-timelight curves, in particular in the near-IR, is neverthelessneeded to assess the applicability of SN 2000cx for a gen-eral discussion.
6.1. The importance of near-IR light curves
The main result of these observations is the constant emis-sion in the near-IR during the observed epochs (Fig. 6).We are not aware of other such systematic observation of alate-time near-IR light curve of a SN Ia. In fact, very littlehas been published in this respect since the sparse, but pi-oneering, observations presented by Elias & Frogel (1983).Recently, two late-time H-band data points for SN 1998bu(250–350 days past maximum) suggest that this SN Ia alsohad a flat near-IR light curve at late phases (Spyromilioet al. 2004).
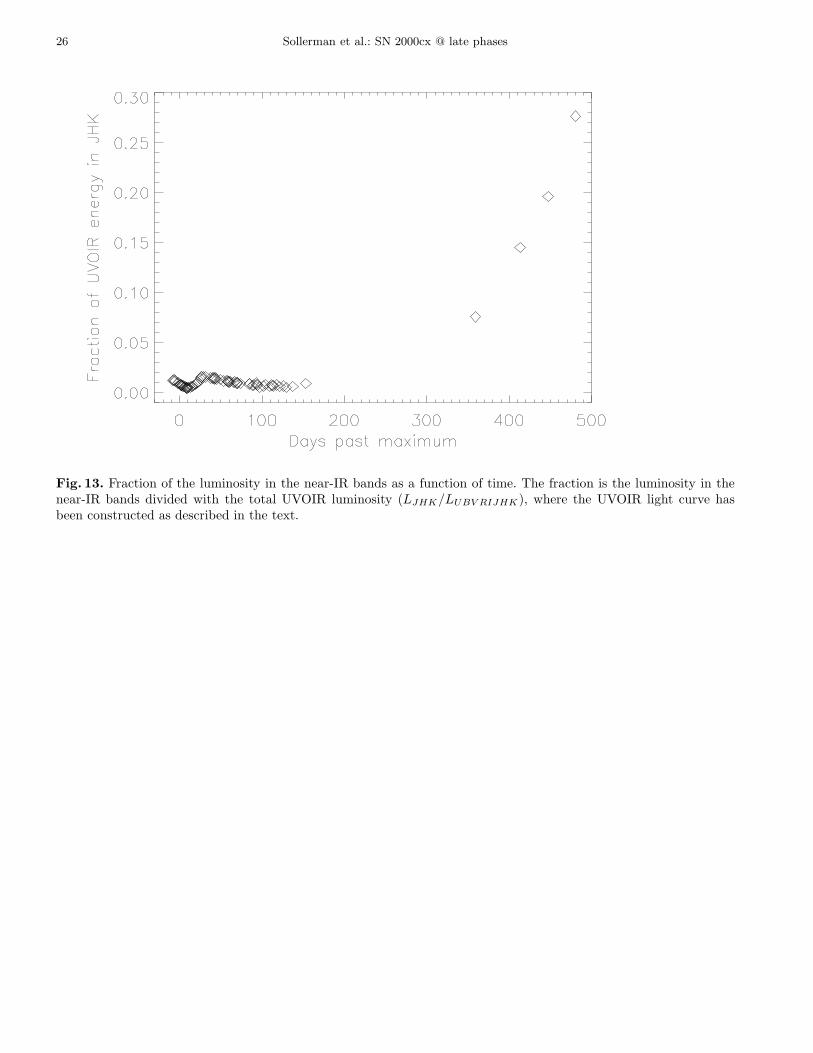
Our constant J-band and H-band light curves imme-diately highlight the main point of our study, the increas-ing importance of the near-IR at late phases. From ourconstructed UVOIR light curve, we can investigate wheremost of the energy emerges. In Fig. 13 we show the fractionof energy in the near-IR bands compared to the UVOIRluminosity as it evolves with time. This color evolution isalso seen in Fig. 7 where the UVOIR light curve is plottedtogether with the (arbitrarily shifted) V -band light curve.While the V band follows the UVOIR light curve reason-ably well at early phases, at the later epochs the V banddeclines faster than the UVOIR curve.
The increasing importance of the near-IR can also beseen in our detailed modeling. In Fig. 11 the light curvesfor the B band through H-band are shown for both ob-servations and models. We find generally good agreementbetween observations and models, with a steeper slope inthe B, V , R, and I bands, and almost constant light curvesin the J and H bands. The almost constant emission inthe near-IR bands is due to a shift of emission from ironlines in the optical to the strong near-IR [Fe II] lines, whichdominate the J and H bands. In this way, the temperaturedecrease in the ejecta gives a color evolution momentar-ily compensating the decreasing radioactive input in thenear-IR bands.
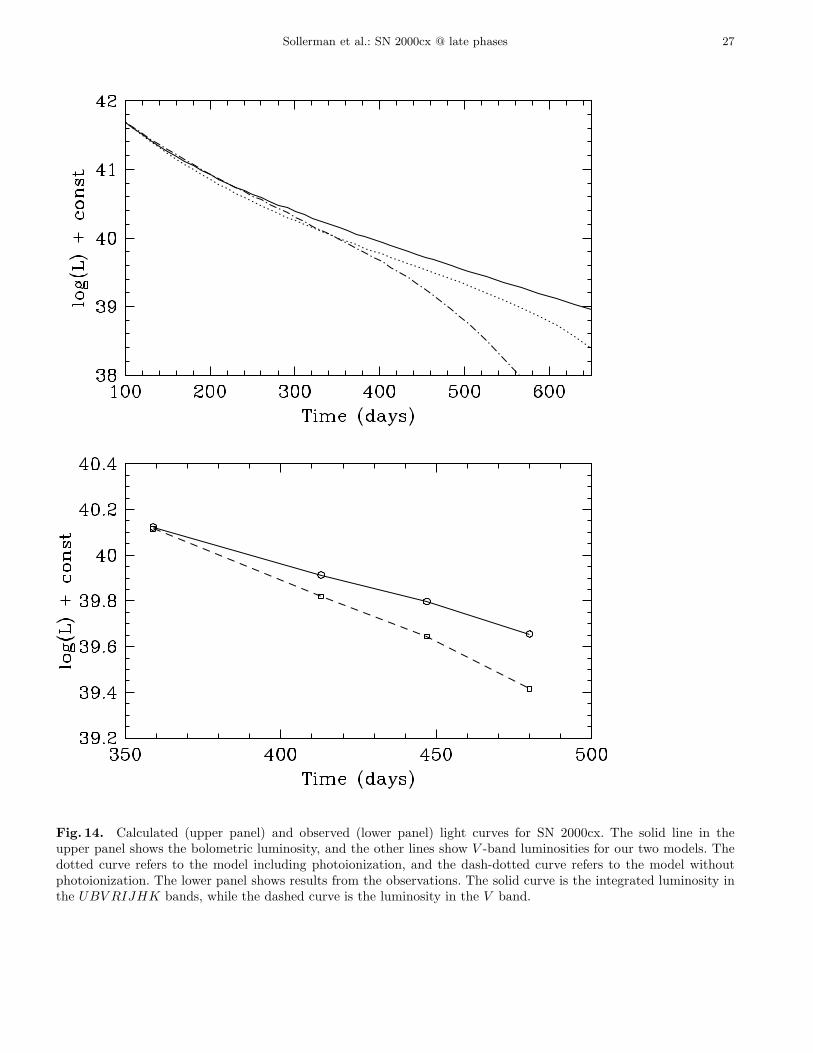
While our observations only cover the UVOIR range,the models naturally incorporate the true bolometric lightcurves. Figure 14 shows a comparison of this bolomet-ric light curve and the V -band light curve. Here we canclearly see that the V band does not follow the bolomet-

8 Sollerman et al.: SN 2000cx @ late phases
ric light curve at the epochs of our observations. For themodel without photoionization the V band drops rapidlyaround 400–500 days, while for the photoionization modelthe drop is significantly less rapid. The evolution in theV band reflects the temperature and ionization evolutionof the ejecta. The temperatures in the model with pho-toionization are higher, and therefore a larger fraction ofthe luminosity is emerging in the V band. For the modelwithout photoionization the emission is emerging at longerwavelengths. The lower panel of Fig. 14 shows the ob-served UVOIR light curve compared with the observedV -band light curve (i.e., this is basically a close-up of thelate phases shown in Fig. 7). The implications are furtherdiscussed below.
6.2. The Nickel mass
The simple toy model adopted for the light curve in Fig. 8provides a reasonable fit to the UVOIR light curve. Thisexercise reveals several potentially interesting aspects ofthe light curve.
We note that the slope of the four late epochs in theUVOIR light curve is ∼ 1.0 mag per 100 days. Intriguingly,this is the same as the decay time scale of 56Co and inthe simple model the good match is solely due to power-ing of the kinetic energy of completely trapped positrons(dashed curve, Fig. 8). If this interpretation is valid, andif the UVOIR light curve describes the true bolometricluminosity of the supernova at these epochs, the nickelmass can be directly deduced. The toy model light curvein Fig. 8 is from
L = 1.3×1043 MNi e−t/111.3 (1 − 0.966e−τ), in units oferg s−1, where MNi is the amount of 56Ni in solar massesand the other parameters are as defined in section 4 above.For this simple scenario, only including 56Co, the param-eter t1 is related to the time when positrons start to dom-inate (tpos) by tpos = 5.27 t1. In a least-squares sense, thebest fit is for a nickel mass of 0.28 M⊙and t1 = 31.5 days(fitting all data later than day 50).
Two ways to derive nickel masses from the photome-try of SNe Ia have been employed (see, e.g., Leibundgut& Suntzeff 2003 for a review). Cappellaro et al. (1997)adopted a simple light-curve model for the late epochs ofthe supernova light curve and used the V band as a surro-gate for the bolometric luminosity. This is in a way similarto the discussion above, but we have already noted thatat these late phases it is not correct to assume the V bandto closely follow the bolometric light curve.
The standard way to derive a nickel mass has ratherbeen to use the peak luminosity. According to Arnett’srule (Arnett 1982; Pinto & Eastman 2000), the luminos-ity at the peak directly reflects the input powering fromthe radioactivity. This has been used by Contardo et al.(2000) and others to derive nickel masses for a number ofSNe Ia. The main uncertainty is usually the poorly knowndistances and extinctions to the supernovae.
Using the formalism of Contardo et al., the peakUVOIR luminosity in Fig. 8 corresponds to ∼ 0.46 M⊙ of56Ni. In fact, since we have omitted any flux outside the0.36–2.2 µm range, the actual peak luminosity must besomewhat higher (Candia et al. 2003; Suntzeff 1996).9
We derive a smaller nickel mass from the late phasescompared to the peak, given the same distance modulusand extinction. This is likely due to the fact that at thesephases, even the UVOIR light curve does not encapsulatethe total bolometric luminosity. If so, this can then beused to derive the fraction of emission outside the coveredbands. We thus see that our observations indicate that at500 days about 40% of the emission is emerging outsideour observed range, most likely redward of the K band.
This agrees reasonably well with our detailed models,where we can see that only about 75% of the emissionat 400 days is in the UVOIR wavelength range, whilethe mid-IR and far-IR include most of the remainingpower. Adjusting the derived nickel mass for this recovers∼0.4 M⊙ of 56Ni.
The late-time UVOIR slope points to complete (or atleast constant) trapping of positrons, and gives no hintof temporal color evolution out of the observed bands.The models do in fact show a slow evolution, in that theUVOIR range progressively lose energy to the far-IR, butthis is also one of the aspects where the model is clearlynot completely correct (see Sect. 6.3).
In our models we have used a nickel mass of0.6 M⊙ from the W7 model, and the same distance modu-lus and reddening as adopted for SN 2000cx. However, thefits to the data in Fig. 11 are not really good enough to de-termine the nickel mass with any precision. A lower nickelmass would clearly enhance the rapid luminosity drop, butthis is also affected by the density (i.e., the assumed ejectamass and expansion velocity).
6.3. The IR catastrophe
The significance of a thermal instability for SNe Ia at latephases was recognized by Axelrod (1980). At low temper-atures the cooling of the ejecta is rapidly shifted from theoptical into the IR fine-structure lines (e.g., [Fe I] 24 µm,[Fe II] 26 µm). This so-called “infrared catastrophe” woulddrastically decrease the flux in the optical. Fransson et al.(1996) also found a rapid decrease in the optical flux at∼ 500 days past explosion in their modeling, and realizedthat this was not in accordance with late-time optical ob-servations of SN 1972E. Now, 10 years later, the accuracyof the atomic data needed for these models, as well as thecomputing facilities, have improved significantly. Still, ournew models show the same effect.
9 The peak luminosity of SN 2000cx from Candia et al.(2003), log (L/erg s−1) ≈ 43.05, corresponds according toContardo et al. (2000) to ∼0.56 M⊙, but Contardo et al. alsodid not include the UV part of the spectrum. The actual nickelmass of course depends crucially on the assumed distance,which is rather uncertain; we adopt 31.2 Mpc.

Sollerman et al.: SN 2000cx @ late phases 9
In Fig. 11 it can be seen that the curves for the modelwithout photoionization drops quickly after 400–600 days.The faster drop in this model is due to a lower temperaturein the ejecta. Again, this rapid drop in flux is in conflictwith the late-time observations (in particular the very lastepoch). Since these models attempt to include our bestknowledge of the physics of the emission of the supernova,the reason for this discrepancy is important to understand.
When looking at the ionization structure for the twomodels at 300 days (Fig. 9), we find that the degree ofionization is significantly higher in the photoionizationmodel. Especially in the outermost region (where the ironabundance is small) the amount of Fe III, at the expenseof Fe II, increases when the photoionization is turned on.It is the recombination emission (to Fe III) from the un-derlying regions that photoionizes Fe II. In both modelsthe amount of Fe I is negligible at this epoch. In fact,although our spectral calculations based on these ioniza-tion structures give a decent fit to the observed spectrum(Fig. 10), it appears as if the model with lower ioniza-tion does the best job. The light curve models in Fig. 11do instead favor the models including photoionization. Aproper treatment of the UV scattering is thus clearly im-portant, but since the differences in the light-curve slopesare mainly a temperature effect there are other scenar-ios which might provide similar results. To avoid the IRcatastrophe there is basically a need to keep the ejectawarmer than a critical temperature where this instabilitysets in. This can be obtained in several ways. For exam-ple, a higher nickel mass would give higher temperatureand ionization. Another possible mechanism is clumpingof the ejecta, which would give regions of lower and higherdensities, and the low-density regions would be hotter dueto less efficient cooling. Yet another scenario which wouldaffect the temperature structure in the ejecta is the non-local deposition of positrons. These matters are beyondthe scope of the current investigation and will be discussedelsewhere.
6.4. Positron escape
The above results demonstrate the difficulty in interpret-ing supernova light curves for which observations only ex-ist over a limited wavelength range.
Milne et al. (2001) used a Monte Carlo scheme to sim-ulate the deposition of γ-rays and positrons in the ejecta.They claim that late light curves of SNe Ia can be repro-duced only if a substantial fraction of the positrons escapefrom the ejecta. They based that claim upon the sugges-tion that at late phases (& 40 days), the V band con-stitutes a constant (∼25%) fraction of the 3500–9700 Aemission, which they loosely referred to as the bolometricluminosity. We show that by including UVOIR photome-try in the determination of a bolometric luminosity, at latephases the V band is seen to deviate from the bolometricluminosity for SN 2000cx.
In Fig. 14 we compare the bolometric light curve tothe V -band light curve for our model calculations and ob-servations. These model calculations assume instant andlocal deposition of the positrons. Even in this case of fullpositron trapping we find an increasing deviation betweenthe bolometric and V -band light curve with time. Thelower panel of Fig. 14 shows our observations, where wealso find that the slope of the bolometric and V -band lightcurves differs. A comparison to a true bolometric lightcurve would further increase this effect.
It is clear that this shift of the emission into the IRpassbands with time will mimic the effect of positron es-cape. Deviations between simple models and the V -bandlight curve should therefore not be interpreted in terms ofthe degree of positron escape. Instead, a detailed and con-sistent knowledge of the temperature and ionization evo-lution of the ejecta is required. This means that many pre-vious studies of positron escape from the late-time ejectain SNe Ia in fact require more detailed observations andmodeling than hitherto appreciated to draw definitive con-clusions on positron trapping.
6.5. The very late-time light curve
Lastly, we note that the V -band decline appears to levelout in the two final HST observations; the slope is only0.65 mag per 100 days between day 557 and 693 in theF555W HST observations. It is hazardous to draw anygeneral conclusions from a single passband since there aremany ways to power the late-time light curve of a su-pernova (see, e.g., Sollerman et al. 2002). This section istherefore rather speculative.
First of all, there could of course be a late-time lightecho, as seen for SN 1998bu. However, the SO host galaxyshould be clear of dust and the HST images show no ev-idence for a ring. We note also that the SN Ia 1992Adisplayed a slow F555W evolution at these late phases(Cappellaro et al. 1997). This behavior may thus begeneric for thermonuclear supernovae.
The final bright V -band observation immediatelyshows that the IR catastrophe as indicated in the modelsdoes not occur at these phases. As noted previously, thereare many possible solutions to this dilemma.
Potentially, 44Ti could become important at latephases, since it decays on a time scale of 87 years, and thedecay mainly results in positrons. However, to influencethe light curve at our last epoch of observations requiresa large abundance of titanium — as much as 7% of theoriginal mass of 56Ni. This is much more than in the W7model, which we have used for our detailed calculations,and is likely ruled out from nucleosynthesis arguments atthe temperatures reached in SN Ia burning fronts.
We emphasize that this late observation is only in theV band, and is not representing the bolometric luminos-ity. Thus, any effect that could boost the emission in thisband relative to the other bands would give a shallowerslope in the V band. In our model calculations we find that

10 Sollerman et al.: SN 2000cx @ late phases
after ∼ 650/800 days (with/without photoionization) Fe Idominates the emission in the V band. Fe I emits rela-tively more in the V band and this results in a flatteningof the V -band light curve (see also Fransson et al. 1996).However, even though our modeled slope of the V -bandlight curve levels out, the total flux of Fe I is clearly too lowcompared to the observations. Also, the epoch at whichFe I starts to dominate is too late. A model with a clumpymedium could possibly overcome these problems. Anotherpossible effect is indeed a longer lifetime of the positronsthat allows time-dependent effects to become dominant.This is very speculative and more very late-time observa-tions of SNe Ia are needed before any serious discussioncan be made.
7. Summary
We have conducted a systematic and comprehensive moni-toring programme of the SN Ia 2000cx at late phases usingthe VLT and HST. The VLT observations cover phases 360to 480 days past maximum and includes photometry in the(U)BV RIJH(K) bands. While the optical bands decayby about 1.4 mag per 100 days, we find that the near-IRmagnitudes stay virtually constant during the observedperiod. This means that the importance of the near-IR tothe bolometric light curve increases with time. The find-ing is also in agreement with our detailed modeling of aSN Ia in the nebular phase. In these models, the increasedcontribution of the near-IR is simply a temperature effect.We note that this complicates late-time studies where of-ten only the V band is well monitored. In particular, itis not correct to assume that any optical band followsthe bolometric light curve at these phases, and any con-clusions based on such assumptions must be regarded aspremature.
We have found that a very simple model where allpositrons are trapped can reasonably well account forthe UVOIR observations. The nickel mass deduced fromthe positron tail of the light curve is lower than foundfrom the peak brightness, which provides the fraction ofemission outside the observed range at the late phases.Our detailed models show the signature of an infraredcatastrophe at these epochs, which is not supportedby the observations. More importantly, at the observedepochs, the gradual lowering in temperature increasesthe importance of the near-infrared emission. Theseconclusions are drawn from observations of a singlesupernova, which was clearly unusual at the peak. Wesupport this generalization by detailed modeling andcomparisons to the late-time light curve of SN 1992A.It is clear, however, that these suggestions have tobe verified by more data of thermonuclear supernovaeat very late phases. Such a programme is currentlyongoing. The investigation of positron escape fromSNe Ia thus awaits observations that better representthe bolometric luminosity as well as more realistic models.
Acknowledgements. We are grateful to Ken Nomoto for provid-ing the W7 model, and to Sultana Nahar for providing recom-bination rates for the iron ions. We also thank Nick Suntzefffor important input in the early phases of this project. Wethank the ESO VLT staff for their assistance with the ob-servations. A.V.F. is grateful for NSF grants AST-9987438and AST-0307894, as well as for NASA grants GO-8602 andGO-9114 from the Space Telescope Science Institute (STScI),which is operated by AURA, Inc., under NASA contract NAS5-26555.
References
Allen, C. W. 2000, Allen’s Astrophysical Quantities, 4th edi-tion 2000, ed. A. N. Cox
Arnett, W. D. 1979, ApJ, 230, 37
Arnett, W. D. 1982, ApJ, 253, 785Axelrod, T. C. 1980, PhD Thesis, University of California,
Santa CruzBaade, W., Burbidge, G. R., Hoyle, F., et al. 1956, PASP, 68,
296
Branch, D., Thomas, R. C., Baron, E., et al. 2004, ApJ, 606,413
Candia, P., Krisciunas, K., Suntzeff, N. B., et al. 2003, PASP,115, 277
Castor, J. I. 1970, MNRAS, 149, 111Chornock, R., Leonard, D. C., Filippenko, A. V., et al. 2000,
IAUC 7463Colgate, S. A., Petscheck, A. G., & Kriese, J. T. 1980, ApJ,
237, L81Colgate, S., Fryer, C., & Hand, K. P. 1997, in Thermonuclear
Supernovae, ed. P. Ruiz-Lapuente, R. Canal, & J. Isern(Dordrecht: Kluwer), p. 273
Contardo, G., Leibundgut, B., & Vacca, W. D. 2000, A&A,359, 876
Dolphin, A. E. 2000, PASP, 112, 1383
Elias, J. H., & Frogel, J. A. 1983, ApJ, 268, 718Filippenko, A. V. 1997, ARA&A, 35, 309
Fitzpatrick, E. L. 1999, PASP, 111, 63
Fransson, C., Houck, J., & Kozma, C. 1996, in IAU Coll. 145,Supernovae and supernova remnants, ed. R. McCray andZ. Wang (Cambridge: Cambridge Univ. Press), p. 211
Fukugita, M., Shimasaku, K., & Ichikawa, T. 1995, PASP, 107,945
Hawarden, T. G., Leggett, S. K., Letawsky, M. B., Ballantyne,D. R., & Casali, M. M. 2001, MNRAS, 325, 563
Hoyle, F., & Fowler, W. A. 1960, ApJ, 132, 565Kozma, C., & Fransson, C. 1992, ApJ, 390, 602
Kozma, C., & Fransson, C. 1998a, ApJ, 496, 946Kozma, C., & Fransson, C. 1998b, ApJ, 497, 431
Landolt, A. 1992, AJ, 104, 340Leibundgut, B. 2000, A&ARv, 10, 179
Leibundgut, B., & Suntzeff, N. B. 2003, in Supernovae andGamma-Ray Bursters, ed. K. Weiler (New York: Springer),p. 77
Li, W., Filippenko, A. V., Gates, E., et al. 2001, PASP, 113,1178
Li, W., Filippenko, A. V., Van Dyk, S., et al. 2002, PASP, 114,403
Liu, W., Jeffery, D. J., & Schultz D.R., 1998, ApJ, 494, 812
Lundqvist, P., Sollerman, J., Mattila, S., et al. 2005, in prepa-ration

Sollerman et al.: SN 2000cx @ late phases 11
Mazzali, P., Nomoto, K., Cappellaro, E., et al. 2001, ApJ, 547,988
Milne, P.A., The, L.S., & Leising, D. 1999, ApJS, 124, 503Milne, P.A., The, L.S., & Leising, D. 2001, ApJ, 559, 1019Nahar, S. N. 1996, Phys. Rev. A, 53, 2417Nahar, S. N. 1997, Phys. Rev. A, 55, 1980Nahar, S. N., Bautista, M. A., & Pradhan, A. K. 1997, ApJ,
479, 497Nomoto, K., Thielemann, F.-K., & Yokoi K. 1984, ApJ, 286,
644Perlmutter, S., Aldering, G., Goldhaber, G., et al. 1999, ApJ,
517, 565Persson, S. E., Murphy, D. C., Krzeminski, W., Roth, M., &
Rieke, M. J. 1998, AJ, 116, 2475Pinto, P., & Eastman, R. 2000, ApJ, 530, 757Riess, A. G., Filippenko, A. V., Challis, P., et al. 1998, AJ,
116, 1009Ruiz-Lapuente P., & Spruit H. 1998, ApJ, 500, 360Schlegel, D. J., Finkbeiner, D. P., & Davis, M. 1998, ApJ, 500,
525Schmidt, B. P., Suntzeff, N. B., Phillips, M. M., et al. 1994,
ApJ, 434, 19Schmidt, B. P., Kirshner, R. P., Leibundgut, B., et al. 1998,
ApJ, 507, 46Sobolev, V. 1957, Soviet Astron., 1, 678Sobolev, V. 1960, Moving Envelope of Stars (Cambridge:
Harvard Univ. Press)Sollerman, J., Holland, S. T., Challis, P., et al. 2002, A&A,
386, 944Sollerman, J., Kozma, C., & Lindahl, J. 2004, in proceedings
of IAU 192 (astro-ph 0311075)Spencer, L. V., & Fano, U. 1954, Phys. Rev., 93, 1172Spyromilio, J., Gilmozzi, R., Sollerman, J., et al. 2004, accepted
by A&ASuntzeff, N. B. 2000, in Cosmic Explosions, ed. S. S. Holt &
W. W. Zhang (New York: American Inst. of Physics), p.65
Suntzeff, N. B. 1996, in IAU Coll. 145, Supernovae and su-pernova remnants, ed. R. McCray & Z. Wang (Cambridge:Cambridge Univ. Press), p. 41
Thielemann, F.-K., Nomoto, K., & Yokoi K. 1986, A&A, 158,17
Turatto, M., Cappellaro, E., Barbon, R., Della Valle, M.,Ortolani, S., & Rosino, L. 1990, AJ, 100, 771
Yu, C., Modjaz, M., & Li, W. 2000, IAUC 7458
12 Sollerman et al.: SN 2000cx @ late phases
Table 1. Log of optical VLT observations, SN 2000cx.
Date Filter MJDa Exposure Airmassa Seeing(UT) (s) (arcsec)
2001 07 21 B 52111.36 2x300 1.31 1.052001 07 21 V 52111.37 2x240 1.29 0.982001 07 21 R 52111.38 2x240 1.27 0.912001 07 21 I 52111.38 2x500 1.25 0.902001 07 21 U 52111.40 2x780 1.23 1.052001 07 22 V 52112.34 2x300 1.38 0.912001 09 13 V 52165.25 3x300 1.23 0.942001 09 13 I 52165.26 3x800 1.22 0.862001 09 13 B 52165.29 3x400 1.21 0.922001 09 13 R 52165.31 4x400 1.23 0.872001 10 10 R 52192.13 750+418 1.34 0.932001 10 17 I 52199.15 8x650 1.24 0.682001 10 17 B 52199.22 4x750 1.24 0.672001 10 17 V 52199.25 4x750 1.35 0.862001 10 19 R 52201.22 4x750 1.25 0.862001 11 19 I 52232.02 8x650 1.38 0.922001 11 19 R 52232.08 4x750 1.21 0.782001 11 20 V 52233.02 4x750 1.36 0.842001 11 20 B 52233.06 4x750 1.24 0.79a Refers to the first exposure.
Table 2. Magnitudes for local standards in the optical.
OffsetsaU B V R I
115.12 W 17.86 N 23.69 (0.18)b 23.29 (0.04) 22.45 (0.02) 22.00 (0.01) 21.48 (0.02)134.48 E 154.34 S 21.59 (0.03) 21.54 (0.03) 20.77 (0.02) 20.29 (0.01) 19.76 (0.01)140.48 E 88.12 S 24.16 (0.20) 23.04 (0.03) 21.48 (0.02) 20.58 (0.01) 19.55 (0.01)52.08 W 116.12 S 22.59 (0.06) 21.94 (0.02) 20.86 (0.02) 20.23 (0.01) 19.57 (0.01)40.55 W 106.03 S 22.73 (0.07) 22.62 (0.04) 21.80 (0.01) 21.30 (0.01) 20.73 (0.02)158.45 E 45.25 N 22.40 (0.07) 23.17 (0.04) 22.38 (0.01) 21.84 (0.02) 21.29 (0.03)156.22 E 187.75 N 21.52 (0.03) 21.68 (0.01) 21.18 (0.02) 20.85 (0.02) 20.47 (0.01)188.73 E 6.06 S 24.13 (0.22) 23.04 (0.02) 21.60 (0.02) 20.72 (0.02) 19.67 (0.01)24.84 W 12.28 N 24.51 (0.29) 23.59 (0.03) 22.69 (0.03) 22.15 (0.02) 21.49 (0.02)62.29 W 9.51 N 24.55 (0.28) 23.88 (0.04) 22.97 (0.03) 22.45 (0.02) 21.83 (0.03)68.48 W 121.36 S 23.01 (0.10) 23.09 (0.02) 22.15 (0.02) 21.60 (0.01) 20.95 (0.01)109.51 W 180.10 N 23.77 (0.15) 23.57 (0.03) 22.86 (0.03) 22.39 (0.02) 21.86 (0.02)88.22 W 78.11 S 23.02 (0.09) 23.08 (0.02) 22.34 (0.02) 21.88 (0.02) 21.32 (0.02)82.48 E 104.51 S 23.86 (0.18) 24.05 (0.04) 22.92 (0.03) 22.01 (0.02) 21.18 (0.02)a Offsets in arcseconds measured from the supernova.b Numbers in parentheses are uncertainties
Table 3. Late-time optical magnitudes of SN 2000cx.
MJDa PhasebU B V R I
52000+ (days)
111.4 359 22.30 (0.08) 21.27 (0.03) 21.28 (0.01) 22.17 (0.02) 21.70 (0.03)112.3 360 21.28 (0.03)165.3 413 22.00 (0.03) 22.02 (0.03) 22.91 (0.03) 22.09 (0.03)192.1 440 23.26 (0.04)199.2 447 22.50 (0.03) 22.46 (0.01) 22.42 (0.03)201.2 449 23.46 (0.03)232.5 480 23.00 (0.04) 23.03 (0.02) 23.85 (0.06) 22.84 (0.05)a Refers to the first exposure.b Days past maximum B-band light.
Sollerman et al.: SN 2000cx @ late phases 13
Table 4. Log of near-IR observations, SN 2000cx.
Date Filter MJDa Exposureb Airmassa Seeing(UT) (s) (arcsec)
2001 07 31 J 52121.35 30x3x13 1.25 0.612001 07 31 H 52121.37 15x6x13 1.22 0.402001 07 31 Ks 52121.40 12x6x16 1.21 0.392001 09 21 J 52173.22 30x3x13 1.23 0.492001 09 21 J 30x3x15 0.492001 09 21 H 52173.26 15x6x13 1.21 0.402001 09 21 H 15x6x14 0.402001 11 19 J 52232.01 30x3x15 1.40 0.632001 11 19 J 30x3x13 0.632001 11 19 H 52232.05 15x6x13 1.25 0.482001 11 19 H 15x6x14 0.482001 11 20 J 52233.01 30x3x15 1.42 0.602001 11 20 J 30x3x13 0.602001 11 20 H 52233.05 15x6x13 1.26 0.442001 11 20 H 15x6x14 0.442001 11 22 J 52235.01 30x3x15 1.38 1.002001 11 22 J 30x3x13 1.002001 11 22 H 52235.05 15x6x13 1.24 0.682001 11 22 H 15x6x14 0.68a Refers to the first exposure.b DITxNDITxNEXP
Table 5. Magnitudes of local standards in the near-IR.
OffsetsaJ H Ks
5.34 E 2.23 S 18.10 (0.06) 17.47 (0.03) 17.15 (0.01)17.04 W 18.25 S 20.23 (0.08) 19.22 (0.06) 18.35 (0.03)80.87 W 17.36 N 18.45 (0.06) 17.84 (0.02) 17.57 (0.02)33.98 W 26.71 N 19.87 (0.05) 19.07 (0.04) 18.77 (0.04)36.80 W 21.81 N 18.30 (0.05) 17.66 (0.03) 17.29 (0.02)83.25 W 70.93 N 16.08 (0.04) 15.42 (0.01) 15.14 (0.01)
105.06 W 40.36 N 17.54 (0.05) 17.12 (0.02) 17.02 (0.01)130.73 W 29.53 N 19.03 (0.06) 18.31 (0.03) 18.10 (0.02)103.50 W 56.17 N 20.37 (0.07) 19.72 (0.07) 19.55 (0.06)49.27 W 12.32 N 18.29 (0.06) 18.14 (0.03) 17.87 (0.02)97.35 W 66.92 N 21.13 (0.07) 20.47 (0.07) 20.07 (0.09)
115.60 W 17.95 N 20.94 (0.06) 20.46 (0.07) 20.23 (0.10)37.25 W 25.82 N 20.37 (0.07) 19.70 (0.05) 19.50 (0.06)57.13 W 40.81 N 20.01 (0.07) 19.04 (0.04) 18.14 (0.02)
a Offsets in arcseconds measured from the supernova.
14 Sollerman et al.: SN 2000cx @ late phases
Table 6. Late-time near-IR magnitudes of SN 2000cx.
MJDa PhasebJ H Ks
52000+ (days)
121.4 369 21.86 (0.08)c 21.33 (0.13) 20.32 (0.11)173.3 421 21.83 (0.07) 21.05 (0.10)232.0 480 21.87 (0.09) 21.15 (0.14)233.0 481 21.73 (0.09) 20.95 (0.12)235.0 483 21.77 (0.11) 20.99 (0.11)a Refers to the first exposure.b Days past maximum B-band light.c Numbers in parentheses are uncertainties. However, as discussed in Sect. 2.2 the total IR uncertaintiesfor the faint supernova are likely as large as 0.15 mags at these epochs.
Table 7. HST observations of SN 2000cx.
Date Phasea Filter Magnitude Exposure PI(UT) (Days) (s)
2001 07 10 348 F675W 21.98±0.06 280 Filippenko2001 07 10 348 F814W 21.41±0.06 280 Filippenko2002 02 03 557 F439W 24.38±0.25 2100 Kirshner2002 02 03 557 F555W 24.32±0.08 2100 Kirshner2002 06 19 693 F555W 25.20±0.17 4200 Kirshnera Days past B-band maximum light
Table 8. Decline rates in the VLT dataa
B V R I J H
1.42 (0.04) 1.38 (0.01) 1.40 (0.03) 0.88 (0.04) −0.06 (0.15) −0.23 (0.15)a mag per 100 days between 360 and 480 days; errors in parenthesis are 1σ.
Sollerman et al.: SN 2000cx @ late phases 15
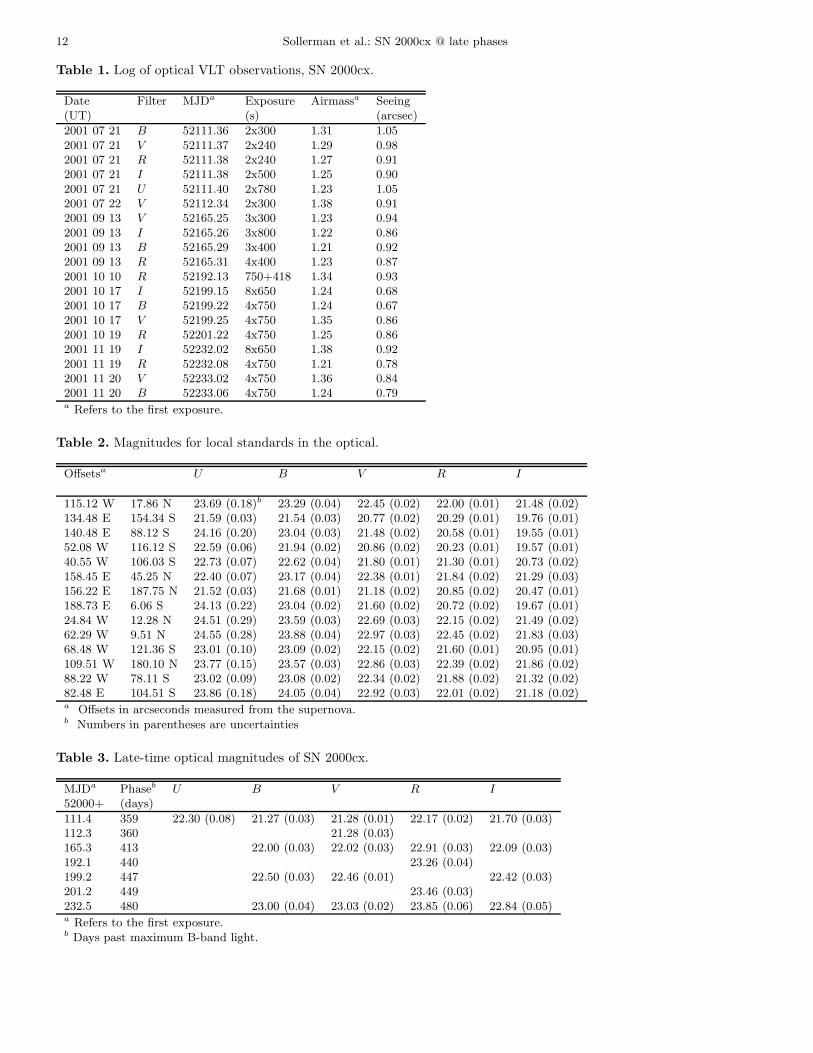
Fig. 1. V -band image obtained with VLT/FORS on 21July 2001, 359 days past maximum light. This is basicallythe full FORS field of view, 6.8′ × 6.8′. North is up andeast to the left. The supernova is 23′′ west and 109′′ southof the nucleus of NGC 524. The region containing thesupernova is marked by a rectangle, and shown in detailin Fig. 2.
16 Sollerman et al.: SN 2000cx @ late phases
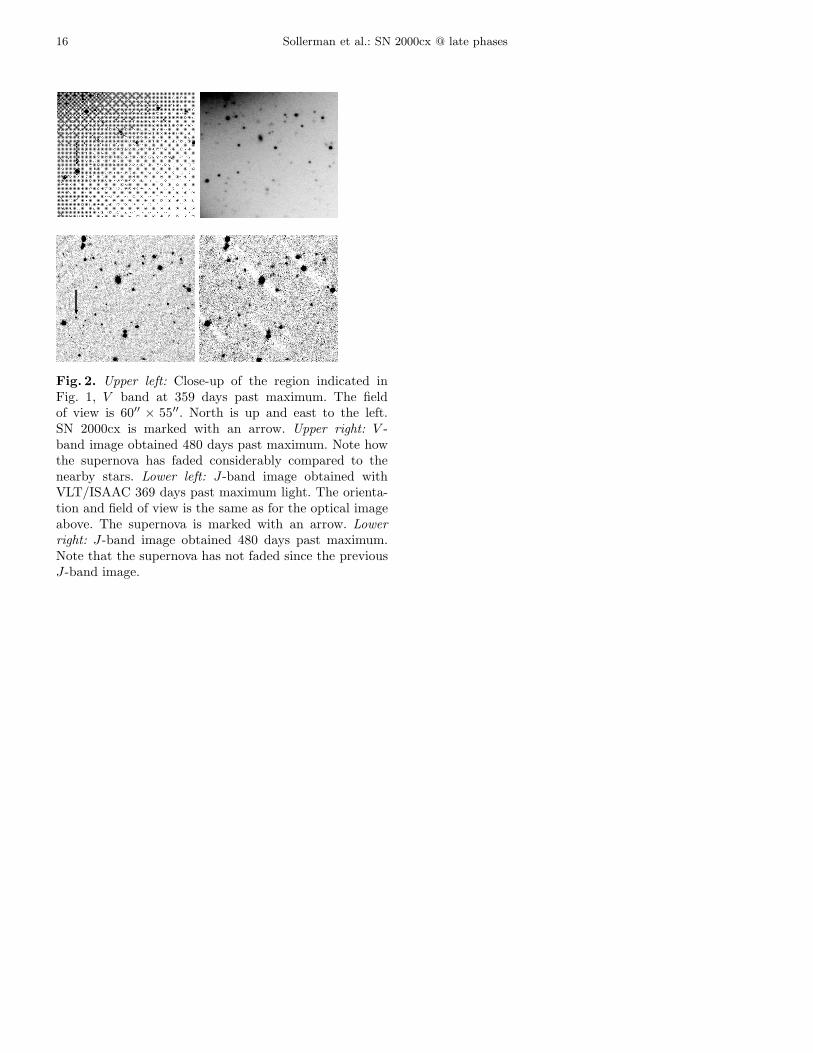
Fig. 2. Upper left: Close-up of the region indicated inFig. 1, V band at 359 days past maximum. The fieldof view is 60′′ × 55′′. North is up and east to the left.SN 2000cx is marked with an arrow. Upper right: V -band image obtained 480 days past maximum. Note howthe supernova has faded considerably compared to thenearby stars. Lower left: J-band image obtained withVLT/ISAAC 369 days past maximum light. The orienta-tion and field of view is the same as for the optical imageabove. The supernova is marked with an arrow. Lowerright: J-band image obtained 480 days past maximum.Note that the supernova has not faded since the previousJ-band image.
Sollerman et al.: SN 2000cx @ late phases 17
Fig. 3. Late-time optical light curves of SN 2000cx; see Table 3. The magnitudes have been shifted for clarity asindicated.

18 Sollerman et al.: SN 2000cx @ late phases
Fig. 4. The optical light curves of SN 2000cx. The early data are from Li et al. (2001). The R-band light curve hasbeen shifted as indicated for clarity. The full lines are the best linear fits to the late-time VLT data, with slopesas given in Table 8. The dashed line is an extrapolation of this slope back to the early light curve. The late HSTphotometry is displayed with larger symbols. For the R-band point at 348 days past maximum, we have indicated thelikely transformation from HST magnitudes to the R-band system (lower error bar).
Sollerman et al.: SN 2000cx @ late phases 19
Fig. 5. Color curves for the late-time optical phases. There is little evolution in B−V and V −R, while R−I increaseswith time due to the slower decline rate in the I band.
Fig. 6. Near-IR magnitudes and uncertainties (see Table 6) for SN 2000cx at late phases.

20 Sollerman et al.: SN 2000cx @ late phases
Fig. 7. UVOIR light curve for SN 2000cx. The early-epoch data are from Li et al. (2001, (U)BV RI) and Candia etal. (2003, JHK). The UVOIR curve is shown with the full line, while the dashed line is the V -band luminosity shiftedarbitrarily along the ordinate. The details and assumptions for the construction of the UVOIR light curve are givenin the text. The adopted distance is 31.2 Mpc.
Sollerman et al.: SN 2000cx @ late phases 21
Fig. 8. Illustrative toy model of the bolometric luminosity for a SN Ia light curve powered by radioactivity. Diamondsshow our UVOIR light curve for SN 2000cx. The full line is the total luminosity for a simple 56Co decay model (seetext). Assuming 0.28 M⊙ of 56Ni, the dot-dashed line shows the contribution from the γ-rays and the dashed line thecontribution from the positrons. The inset shows the deviation in magnitudes versus time between the toy model andthe data. The standard deviation is 0.05 mag.
22 Sollerman et al.: SN 2000cx @ late phases
Fig. 9. Calculated ionization structure of iron in the supernova ejecta at 300 days for the two different models. Theionization for iron as a function of mass coordinate in the ejecta. The upper figure shows the result for the modelwithout photoionization and the lower figure shows the result for the model including photoionization. The solid curveshows the total iron abundance. The broken curves show the fraction of the different iron ions.

Sollerman et al.: SN 2000cx @ late phases 23
Fig. 10. Observed (middle) and modeled spectra of SN 2000cx at ∼ 360 days. The upper (dash-dotted) spectrum isa model calculation without photoionization, while the lower (dotted) spectrum is from a model including photoion-ization. The model spectra have been displaced by ±2 dex, respectively. The most prominent feature is the emissionbetween 4500 and 5500 A. In the model including photoionization it is totally dominated by Fe III emission, whilein the model without photoionization it is a mixture of Fe II and Fe III emission. The feature at 4700 A is in thismodel mostly Fe III, while the emission at 5300 A is dominated by Fe II. From the comparison between observed andmodeled spectra we find somewhat better agreement for the model without photoionization.

24 Sollerman et al.: SN 2000cx @ late phases
26
24
22
20
18 B
26
24
22
20
18V
26
24
22
20
18 R
26
24
22
20
18I
0 200 400 600
26
24
22
20
18
Time (days)
J
0 200 400 600
24
22
20
18
16
Time (days)
H
Fig. 11. Light curves for the B to H bands. The open circles are our observations obtained with the VLT and HST. Twomodels are shown, one including photoionization (dotted curve), and the other without photoionization (dash-dottedcurve).
Sollerman et al.: SN 2000cx @ late phases 25
Fig. 12. SN 2000cx in the V band (full line, see also Fig. 4) compared to SN 1992A (diamonds; Suntzeff 1996). Themagnitude and date of maximum for SN 1992A have been matched at peak to the light curve of SN 2000cx. There isno indication that SN 2000cx behaves in a different way than SN 1992A at late phases. SN 1992A had a very normallate-time light curve (e.g., Fig. 2 in Leibundgut 2000).
26 Sollerman et al.: SN 2000cx @ late phases
Fig. 13. Fraction of the luminosity in the near-IR bands as a function of time. The fraction is the luminosity in thenear-IR bands divided with the total UVOIR luminosity (LJHK/LUBV RIJHK), where the UVOIR light curve hasbeen constructed as described in the text.
Sollerman et al.: SN 2000cx @ late phases 27
Fig. 14. Calculated (upper panel) and observed (lower panel) light curves for SN 2000cx. The solid line in theupper panel shows the bolometric luminosity, and the other lines show V -band luminosities for our two models. Thedotted curve refers to the model including photoionization, and the dash-dotted curve refers to the model withoutphotoionization. The lower panel shows results from the observations. The solid curve is the integrated luminosity inthe UBV RIJHK bands, while the dashed curve is the luminosity in the V band.


![Optical Light Curve of the Type I[CLC]a[/CLC] Supernova 1998[CLC]bu[/CLC] in M96 and the Supernova Calibration of the Hubble Constant](https://static.fdokumen.com/doc/165x107/632035b7069357aa45061842/optical-light-curve-of-the-type-iclcaclc-supernova-1998clcbuclc-in-m96.jpg)