UBRI photometry of globular clusters in the Leo group galaxy ...
11
Mon. Not. R. Astron. Soc. 345, 949–959 (2003) UBRI photometry of globular clusters in the Leo group galaxy NGC 3379 Shannon Whitlock, Duncan A. Forbes and Michael A. Beasley Centre for Astrophysics & Supercomputing, Swinburne University, Hawthorn, VIC 3122, Australia Accepted 2003 July 14. Received 2003 July 11; in original form 2003 May 8 ABSTRACT We present wide-area UBRI photometry for globular clusters around the Leo group galaxy NGC 3379. Globular cluster candidates are selected from their B-band magnitudes and their (U − B ) o versus ( B − I ) o colours. A colour–colour selection region was defined from photometry of the Milky Way and M31 globular cluster systems. We detect 133 globular cluster candidates, which supports previous claims of a low specific frequency for NGC 3379. The Milky Way and M31 reveal blue and red subpopulations, with (U − B ) o and ( B − I ) o colours indicating mean metallicities similar to those expected based on previous spectroscopic work. The stellar population models of Maraston and Brocato et al. are consistent with both subpopulations being old, and with metallicities of [Fe/H] ∼−1.5 and −0.6 for the blue and red subpopulations, respectively. The models of Worthey do not reproduce the (U − B ) o colours of the red (metal-rich) subpopulation for any modelled age. For NGC 3379 we detect a blue subpopulation with similar colours, and presumably age/metallicity, to that of the Milky Way and M31 globular cluster systems. The red sub- population is less well defined, perhaps due to increased photometric errors, but indicates a mean metallicity of [Fe/H] ∼−0.6. Key words: globular clusters: general – galaxies: individual: NGC 3379 – galaxies: star clusters. 1 INTRODUCTION In the last few years, it has become clear that globular cluster (GC) systems have complex colour distributions, indicating two or more subpopulations within a single elliptical galaxy (Ashman & Zepf 1992; Secker et al. 1995; Whitmore et al. 1995; Geisler, Lee & Kim 1996; Forbes, Brodie & Huchra 1997; Bridges et al. 1997; Kissler-Patig & Gebhardt 1998; Kundu & Whitmore 2001; Larsen et al. 2001). The subpopulations have different metallicities and pos- sibly ages, indicating multiple epochs or mechanisms of formation. As GCs are thought to trace the star formation and chemical en- richment episodes of their host galaxy (e.g. Forbes & Forte 2001), understanding how they formed will provide important constraints on the process of galaxy formation and evolution. The main scenar- ios for GC formation include the following. (i) The merger of two gas-rich (spiral) galaxies may lead to the formation of an elliptical galaxy and create an additional population of GCs in the process (Ashman & Zepf 1992). As the GCs produced in the merger formed from enriched gas they should be of higher metallicity and thus redder than the indigenous (metal-poor) GC population. Thus we expect a metal-poor old population (∼13 Gyr) E-mail: [email protected] (SW); [email protected] (DAF); [email protected] (MAB) plus a metal-rich young population with an age similar to that of the merger itself. (ii) A multi-phase collapse (Forbes et al. 1997) can also produce two distinct GC populations. Here the blue GCs formed in an early chaotic phase of galaxy formation from metal-poor gas and the red GCs form later from enriched gas in the same phase that produces the bulk of the galaxy starlight. A multi-phase collapse also predicts an old metal-poor subpopulation and one slightly younger ( age ∼2–4 Gyr) metal-rich one. (iii) Cote, Marzke & West (1998) describe the build-up of the GC systems of bright ellipticals via the accretion of mostly metal- poor GCs from dwarf galaxies. In this picture the metal-rich GCs are indigenous and the metal-poor ones are acquired. Here both the GC subpopulations will be about the same age (i.e. old) but have different metallicities. (iv) Formation of GC systems in hierarchical merging is de- scribed in Beasley et al. (2002). In this prescription blue GCs form in pre-galactic clumps. These gaseous clumps merge generating a second generation of red GCs, along with galactic star formation. Late stage mergers of more stellar clumps may include accreted GCs. Thus the hierarchical picture contains elements of the other three. In a hierarchical universe, the metal-poor GCs will be old and the the metal-rich GCs will have a mean age that depends on galaxy mass and environment. Perhaps the best direct test of these competing GC formation models is to determine the mean age and metallicity of the GC C 2003 RAS Downloaded from https://academic.oup.com/mnras/article/345/3/949/973541 by guest on 21 March 2022
-
Upload
khangminh22 -
Category
Documents
-
view
1 -
download
0
Transcript of UBRI photometry of globular clusters in the Leo group galaxy ...

Mon. Not. R. Astron. Soc. 345, 949–959 (2003)
UBRI photometry of globular clusters in the Leo group galaxy NGC 3379
Shannon Whitlock,� Duncan A. Forbes� and Michael A. Beasley�
Centre for Astrophysics & Supercomputing, Swinburne University, Hawthorn, VIC 3122, Australia
Accepted 2003 July 14. Received 2003 July 11; in original form 2003 May 8
ABSTRACTWe present wide-area UBRI photometry for globular clusters around the Leo group galaxy NGC3379. Globular cluster candidates are selected from their B-band magnitudes and their (U −B)o versus (B − I )o colours. A colour–colour selection region was defined from photometryof the Milky Way and M31 globular cluster systems. We detect 133 globular cluster candidates,which supports previous claims of a low specific frequency for NGC 3379.
The Milky Way and M31 reveal blue and red subpopulations, with (U − B)o and (B − I )o
colours indicating mean metallicities similar to those expected based on previous spectroscopicwork. The stellar population models of Maraston and Brocato et al. are consistent with bothsubpopulations being old, and with metallicities of [Fe/H] ∼ −1.5 and −0.6 for the blueand red subpopulations, respectively. The models of Worthey do not reproduce the (U − B)o
colours of the red (metal-rich) subpopulation for any modelled age.For NGC 3379 we detect a blue subpopulation with similar colours, and presumably
age/metallicity, to that of the Milky Way and M31 globular cluster systems. The red sub-population is less well defined, perhaps due to increased photometric errors, but indicates amean metallicity of [Fe/H] ∼ −0.6.
Key words: globular clusters: general – galaxies: individual: NGC 3379 – galaxies: starclusters.
1 I N T RO D U C T I O N
In the last few years, it has become clear that globular cluster (GC)systems have complex colour distributions, indicating two or moresubpopulations within a single elliptical galaxy (Ashman & Zepf1992; Secker et al. 1995; Whitmore et al. 1995; Geisler, Lee &Kim 1996; Forbes, Brodie & Huchra 1997; Bridges et al. 1997;Kissler-Patig & Gebhardt 1998; Kundu & Whitmore 2001; Larsenet al. 2001). The subpopulations have different metallicities and pos-sibly ages, indicating multiple epochs or mechanisms of formation.As GCs are thought to trace the star formation and chemical en-richment episodes of their host galaxy (e.g. Forbes & Forte 2001),understanding how they formed will provide important constraintson the process of galaxy formation and evolution. The main scenar-ios for GC formation include the following.
(i) The merger of two gas-rich (spiral) galaxies may lead to theformation of an elliptical galaxy and create an additional populationof GCs in the process (Ashman & Zepf 1992). As the GCs producedin the merger formed from enriched gas they should be of highermetallicity and thus redder than the indigenous (metal-poor) GCpopulation. Thus we expect a metal-poor old population (∼13 Gyr)
�E-mail: [email protected] (SW); [email protected] (DAF);[email protected] (MAB)
plus a metal-rich young population with an age similar to that of themerger itself.
(ii) A multi-phase collapse (Forbes et al. 1997) can also producetwo distinct GC populations. Here the blue GCs formed in an earlychaotic phase of galaxy formation from metal-poor gas and the redGCs form later from enriched gas in the same phase that producesthe bulk of the galaxy starlight. A multi-phase collapse also predictsan old metal-poor subpopulation and one slightly younger (� age∼2–4 Gyr) metal-rich one.
(iii) Cote, Marzke & West (1998) describe the build-up of theGC systems of bright ellipticals via the accretion of mostly metal-poor GCs from dwarf galaxies. In this picture the metal-rich GCsare indigenous and the metal-poor ones are acquired. Here both theGC subpopulations will be about the same age (i.e. old) but havedifferent metallicities.
(iv) Formation of GC systems in hierarchical merging is de-scribed in Beasley et al. (2002). In this prescription blue GCs formin pre-galactic clumps. These gaseous clumps merge generating asecond generation of red GCs, along with galactic star formation.Late stage mergers of more stellar clumps may include accretedGCs. Thus the hierarchical picture contains elements of the otherthree. In a hierarchical universe, the metal-poor GCs will be old andthe the metal-rich GCs will have a mean age that depends on galaxymass and environment.
Perhaps the best direct test of these competing GC formationmodels is to determine the mean age and metallicity of the GC
C© 2003 RAS
Dow
nloaded from https://academ
ic.oup.com/m
nras/article/345/3/949/973541 by guest on 21 March 2022
950 S. Whitlock, D. A. Forbes and M. A. Beasley
subpopulations for a large number of galaxies. In principle, the bestway to do this is from GC spectra. Indeed this is an active area ofresearch, using the world largest telescopes, and is returning excit-ing new results (e.g. Kissler-Patig et al. 1998; Forbes et al. 2001;Larsen et al. 2002; Beasley et al. 2003). However, it is also verytime-consuming. Photometry is more efficient, but optical colourssuffer from the well-known age–metallicity degeneracy. This situa-tion can be improved by extending photometry to the near-infrared(e.g. Puzia et al. 2002) or ultraviolet. Photometry in the U (3600 A)band is very rare for GC systems beyond the Local Group (the ∼70GCs in NGC 5128 with U-band photometry from Rejkuba 2001 isone exception). This is largely due to the poor blue response of mostCCDs in use today and the low fraction of U-band light emitted byold stellar populations such as GCs.
Here we present UBRI photometry of GCs associated with the LeoGroup galaxy NGC 3379, obtained with the blue-sensitive CCDs ofthe Isaac Newton Telescope 2.5-m Wide Field Camera. By extendingthe traditional optical photometry to bluer U-band wavelengths, wecan better probe the metallicity distribution of the GC system inNGC 3379. We also utilize some smaller field-of-view images takenwith the Gemini North 8-m telescope to aid in the selection of GCcandidates.
NGC 3379 (M105) is a moderate luminosity E1 galaxy in thenearby (D = 11.5 Mpc, m − M = 30.30) Leo Group. In a photo-graphic study of NGC 3379, Harris & van den Bergh (1981) esti-mated a total GC population of 290 ± 150. This translates into alow specific frequency SN of 1.1 ± 0.6 (assuming MV = −21.06).Ajhar, Blakeslee & Tonry (1994) obtained VRI CCD images ofNGC 3379, detecting some 60 GCs. However, they did not de-tect any obvious bimodality in the GC colour distribution. The firstclear detection of bimodality came from the Hubble Spcae Tele-scope (HST) study by Larsen et al. (2001). They found peaks at(V − I )o = 0.96 and 1.17 for the blue and red subpopulations,respectively.
2 O B S E RVAT I O N S A N D DATA R E D U C T I O N
Broad-band UBRI images covering the Leo galaxies NGC 3379,3384 and 3389 were obtained using the 2.5-m Isaac Newton Tele-scope (INT) on 2000 February 6 and 8. The Wide Field Camera(WFC) comprises four thinned EEV 4096 × 2048 CCDs, with pixelsof 0.33 arcsec and provides a field-of-view of approximately 30 ×30 arcmin2. Observing conditions were photometric over the twonights with seeing of 1.5 arcsec in the U- and I-bands and 2.2 arc-sec in the B- and R-bands. The total exposure times were roughly2000 (U), 3000 (B), 1500 (R) and 1000 s (I). In addition tothe galaxy observations, several standard star fields from Landolt(1992) were obtained over both the nights that bracket the galaxyobservations.
Basic data reduction was performed using IRAF and specially writ-ten software by A. Terlevich. This consisted of master bias subtrac-tion, non-linear correction, flat-fielding using combined sky flats,alignment and co-addition of individual frames. The galaxy framesand standard stars were reduced in an identical manner. Raw magni-tudes of between 10 and 30 stars were obtained for each filter usingthe IRAF task QPHOT, after determining the optimal aperture size. Thezero-point for each filter was determined by a simple linear fit to thestellar raw magnitudes versus stellar colour and a correction for air-mass. The airmass extinction coefficients of KU = 0.46, KB = 0.22,KR = 0.08 and K I = 0.04 mag/airmass have been taken from theINT WFC web page. The final airmass-corrected, 1-s zero-points
are ZU = 22.98 ± 0.01, ZB = 24.84 ± 0.02, ZR = 24.65 ± 0.02 andZI = 23.96 ± 0.01. The BRI zero-points compare well with thosedetermined by Miles et al. (in preparation) from the same observ-ing run and the zero-points listed on the INT/WFC web-page. Anindependent estimate of the U-band zero-point (ZU = 22.98 ±0.05) was made by F. Reda (private communication) by compar-ing various aperture magnitudes for NGC 3379 to that listed inHypercat (http://www-obs.univ-lyon1.fr/hypercat/). Finally, we ad-justed these zero-points for Galactic extinction using values fromthe NASA Extragalactic Data base (http://ned.ipac.caltech.edu), i.e.AU = 0.132, AB = 0.105, AR = 0.065, AI = 0.047.
3 G A L A X Y M O D E L L I N G
In order to better reveal the inner GCs, we subtracted a model ofNGC 3379. Galaxy subtraction was performed using the STSDAS
ISOPHOTE package (see Forbes & Thomson 1992). A galaxy model,with a varying centre, ellipticity and position angle, was fitted in allfour filters. Isophotes were modelled out to ∼350 arcsec (20 kpc).A 3σ clip criterion over five iterations was used to remove deviantpixels (e.g. bright objects) from the fit. The model-subtracted imageswere visually inspected and iterated if necessary to provide a smoothtransition from the background level to the model-subtracted region.The resulting residual images made it easier to identify the innerGCs.
4 I N I T I A L O B J E C T F I N D I N GA N D S E L E C T I O N
The four filter (i.e. UBRI) images of the Leo galaxy triplet werealigned to within a fraction of a pixel and trimmed using the IMA-LIGN task. We then used DAOFIND to select GC candidates in eachfilter independently. Selection criteria consisted of a signal-to-noiseratio (S/N) threshold of 6 and a point-spread function full width athalf maximum (PSF FWHM) adjusted to the seeing conditions ineach filter. Additionally, roundness criteria ranging between valuesof −1.0 and 1.0 and a sharpness range of 0 to 1.0 provided goodexclusion of extended objects. The resulting data base of GC can-didates consisted of over 3000 objects for each filter. The PHOT taskwas used to measure the magnitude and error of each object in allfour bands as found by DAOFIND. A simple script was written toperform the first stage of filtering and reduce the number of candi-dates to only those detected in all four bands. This spatial coordinatematching reduced the data set to 1200 objects with measured UBRImagnitudes. The same script determined galactocentric coordinatesfor each object based on the galaxy centre taken from the galaxymodel (with the centre position constant within a fraction of a pixel).The reduced candidate list was then visually inspected to eliminatethe small number of remaining galaxy-like extended objects or CCDartefacts.
5 M I L K Y WAY A N D M 3 1 G L O BU L A RC L U S T E R C O L O U R S
To aid in the selection and interpretation of Leo group GCs, we useobservations of Milky Way and M31 GCs (essentially the only twogalaxies that have well-studied GC systems in the U-band). Data forthe Milky Way GC system comes from the compilation of Harris(1996). From this list, de-reddened U-, B- and I-band photometryexists for 95 GCs. Data for the M31 GC system come from Barmbyet al. (2000). De-reddened magnitudes for 148 GCs were supplied
C© 2003 RAS, MNRAS 345, 949–959
Dow
nloaded from https://academ
ic.oup.com/m
nras/article/345/3/949/973541 by guest on 21 March 2022

NGC 3379 globular clusters 951
Figure 1. (U − B)o versus (B − I )o colour distribution for the MilkyWay (top) and M31 (lower) GCs. The distribution for the two galaxies aresimilar, although they have slightly different slopes. The effect of 0.5 magof extinction in the V band is also shown.
by Barmby (private communication). In Fig. 1 we show the (U −B)o versus (B − I )o colour distribution for the Milky Way and M31GC systems. To our knowledge this is the first time the (U − B)o
versus (B − I )o colour distribution for the GCs of these galaxieshave been examined together.
The data define a relatively tight distribution in this plot coveringa range of ∼1.5 mag in each colour, with the M31 GCs extendingto slightly redder colours. In general, the distributions for the twogalaxies are qualitatively similar. However, we do note that the slopeof the Milky Way distribution, (U − B)o = 0.725 × (B − I )o −1.047 (rms = 0.088), is somewhat flatter than that for M31, (U −B)o = 1.202 × (B − I )o − 1.850 (rms = 0.122). This may representintrinsic differences in the GC systems of the two galaxies, but ismore likely to be due to the uncertain reddening corrections thathave been applied. Both galaxies reveal a dominant grouping of blueGCs, with a less well-defined tail to redder colours. We associatethe former with the metal-poor GC subpopulation and the latter withthe metal-rich GC subpopulation in these galaxies. The location ofthese subpopulations in colour space will be discussed in more detailbelow. Noting the general similarities of the two distributions, wehave combined the Milky Way and M31 GC samples to define amean GC colour–colour distribution. This is shown in Fig. 2. Aleast-squares fit to the combined sample is also shown. The best-fitting line is of the form (U − B)o = 0.94 × (B − I )o − 1.39, withan rms spread about the best fit of ∼0.12 mag. We use this colour–colour relation and spread to help us define the colours expected forGCs in NGC 3379.
Figure 2. (U − B)o versus (B − I )o colour distribution for the combinedMilky Way (circles) and M31 (triangles) GC samples. A least-squares fitto the combined sample is also shown. The best-fitting line is of the form(U − B)o = 0.94 × (B − I )o − 1.39, with an rms spread about the best fitof ∼ 0.12 mag.
6 G L O BU L A R C L U S T E R S I N T H E C E N T R A LR E G I O N O F N G C 3 3 7 9
Images of the central regions of NGC 3379 have been taken withthe GMOS instrument on the Gemini North Telescope in 2003February. Three fields, each covering 5 arcmin near the galaxy cen-tre, were observed as shown in Fig. 3. These images, in Sloan filtersg′, r′ and i′, form the pre-acquisition imaging for an upcoming spec-troscopic run. As they were obtained under excellent seeing condi-tions (∼0.7 arcsec) the expected contamination rates for candidateGCs based on the Gemini data will be significantly less than for theINT data (obtained under ∼2-arcsec seeing). Candidate GCs fromthe Gemini data have been selected on the basis of their size (i.e.compactness) and colour (0.5 < g′ − i ′ < 1.5 and 0.3 < g′ − r ′ <
1.0) by Faifer & Forte (private communication).By spatially matching the Gemini object list with the initial INT
object list (described above), we identified 125 matches. In Fig. 4we show a colour–magnitude diagram for these Gemini-selectedobjects, with magnitudes taken from our INT photometry. Next werestricted the object list in B magnitude. An upper limit of B = 19was chosen to exclude bright stars and/or compact dwarf galaxies.This limit is 4σ brighter than the expected GC turnover magnitudefor NGC 3379, and corresponds to MB = −11.3. We also imposeda lower magnitude cut-off of B = 23, to avoid any colour bias in thesample. These selection criteria are also shown in Fig. 4.
The resulting subset in a (U − B)o versus (B − I )o colour–colour diagram is shown in Fig. 5. This figure also shows the region
C© 2003 RAS, MNRAS 345, 949–959
Dow
nloaded from https://academ
ic.oup.com/m
nras/article/345/3/949/973541 by guest on 21 March 2022

952 S. Whitlock, D. A. Forbes and M. A. Beasley
150 arcsec
Figure 3. Grey-scale image of the Leo triplet field from the INT/WFC. NGC 3379 has been modelled and subtracted with its centre indicated by a cross.Small circles represent globular cluster candidates. The three large squares indicate the three regions covered by the Gemini/GMOS imaging. North is up andeast is to the left. A 150-arcsec (8.4 kpc) size scale is shown.
of expected colours for GCs. The region ranges from 1.0 < (B −I )o < 2.4, and within 0.7 mag in (U − B)o of the mean Milky Wayplus M31 fit. The (B − I )o range was chosen to be similar to thatof the Milky Way and M31, i.e. covering the full metallicity range
0 1 2 3
24
22
20
18
Figure 4. Colour–magnitude diagram for the candidate GCs from Gem-ini/GMOS images, using magnitudes from the INT/WFC. The expected GCturnover magnitude for NGC 3379 at a distance modulus of m − M = 30.30is Bo = 23.5. The data show a hint of bimodality at (B − I )o ∼ 1.6 and 1.9.The dashed lines indicate the upper and lower magnitude cuts applied to thissample.
expected of GCs but allowing for an additional 0.25 mag in AV
reddening. The range in (U − B)o corresponds to the scatter seen
0 1 2 3-2
-1
0
1
2
0 1 2 3-2
-1
0
1
2
Figure 5. (U − B)o versus (B − I )o colour distribution for the candidateGCs selected from Gemini/GMOS images, after applying spatial matchingand B-magnitude cuts. Most of the data lie in a parameter space definedfrom the M31 and Milky Way distribution, indicating that the contaminationfrom background objects in the Gemini data is indeed quite small. The datasuggest a clear blue subpopulation with colours (U − B)o ∼ 0.1 and (B −I )o ∼1.65. A red subpopulation is not clearly identified in this colour–colourdiagram.
C© 2003 RAS, MNRAS 345, 949–959
Dow
nloaded from https://academ
ic.oup.com/m
nras/article/345/3/949/973541 by guest on 21 March 2022
NGC 3379 globular clusters 953
1 1.5 20
5
10
Figure 6. Histogram of (B − I )o colours for candidate GCs after colour–colour selection from Gemini/GMOS imaging. Two clear peaks are seen.A KMM statistical test confirms peaks at (B − I )o = 1.65 and 1.90 withsimilar number of GCs in each subpopulation.
in the combined Milky Way and M31 data sets of 0.12 mag, addedin quadrature with our typical (U − B)o photometric error. Most ofthe data lie in the defined region, indicating that the contaminationin the Gemini data is indeed low. The data show a group of blueGCs with values (U − B)o ∼ 0.1 and (B − I )o ∼ 1.65. A second,red subpopulation is difficult to identify clearly.
If we examine only the (B − I )o colours of the objects withinthe colour-selected region, we then obtain the histogram shown inFig. 6. Visually, and via a KMM statistical test (Ashman, Bird &Zepf 1994), the Gemini GC candidates are clearly bimodal. Thepeaks are located at (B − I )o = 1.65 and 1.90.
7 L A R G E A R E A S T U DY O F T H E N G C 3 3 7 9G L O BU L A R C L U S T E R S Y S T E M
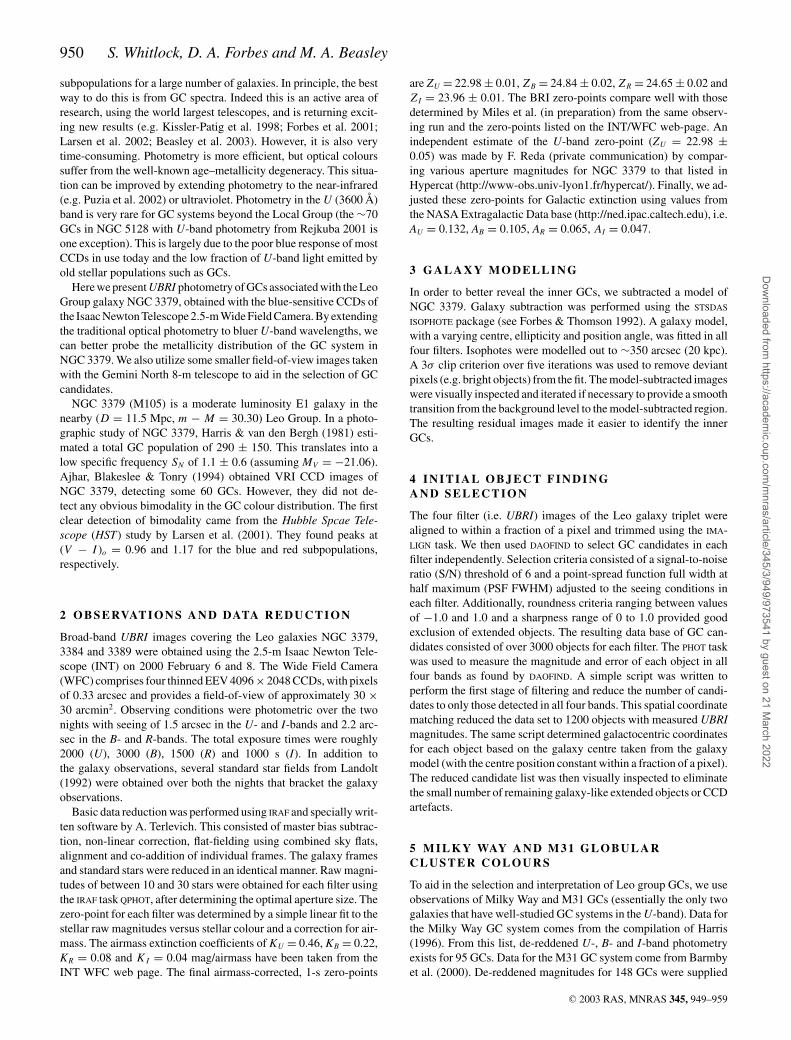
In order to extend our study beyond the central few arcmin of NGC3379 (i.e. that covered by the Gemini imaging), we now return tothe INT imaging. We restrict candidate GCs to lie within 5.5 arcmin(18 kpc) in galactocentric radius, as beyond this radius we no longerwitness a decline in the surface density of detected objects (seeFig. 7). Thus the majority of objects interior to this radius appearto be associated with NGC 3379. This radial selection also ensuresthere are very few, if any GCs associated with NGC 3384 (projectedseparation of 7.2 arcmin) in our final object list.
We then applied the same B-magnitude selection (i.e. 19 < Bo <
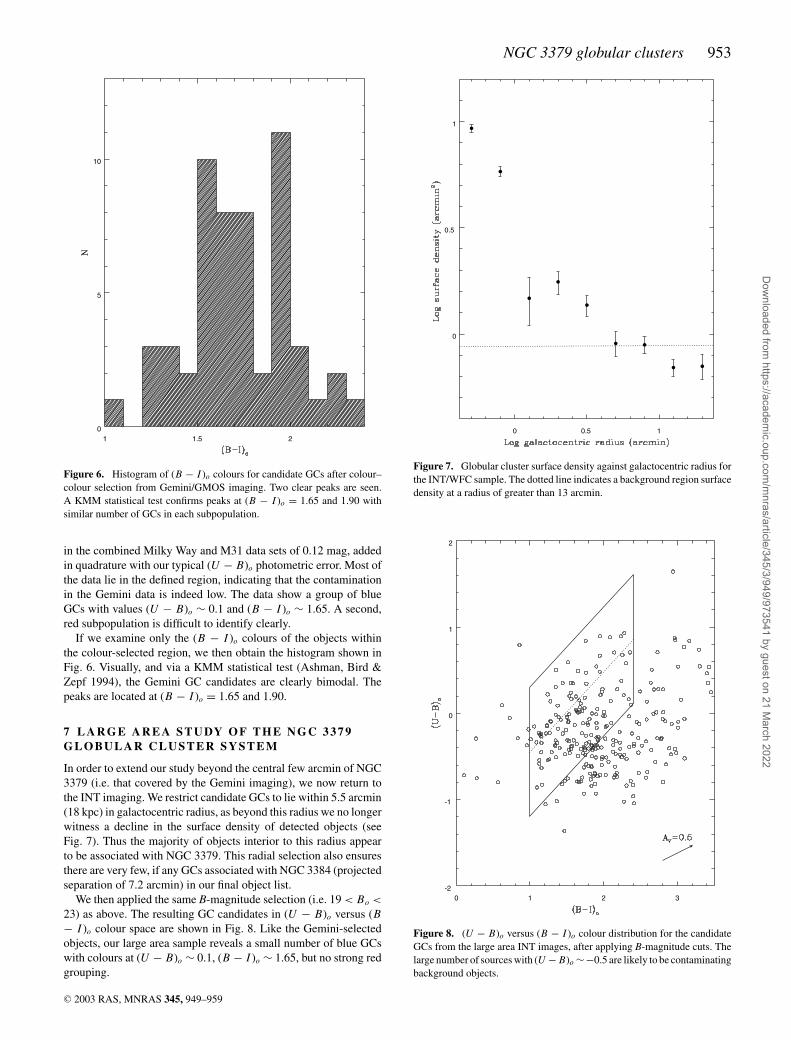
23) as above. The resulting GC candidates in (U − B)o versus (B− I )o colour space are shown in Fig. 8. Like the Gemini-selectedobjects, our large area sample reveals a small number of blue GCswith colours at (U − B)o ∼ 0.1, (B − I )o ∼ 1.65, but no strong redgrouping.
0 0.5 1
0
0.5
1
Figure 7. Globular cluster surface density against galactocentric radius forthe INT/WFC sample. The dotted line indicates a background region surfacedensity at a radius of greater than 13 arcmin.
0 1 2 3-2
-1
0
1
2
Figure 8. (U − B)o versus (B − I )o colour distribution for the candidateGCs from the large area INT images, after applying B-magnitude cuts. Thelarge number of sources with (U − B)o ∼−0.5 are likely to be contaminatingbackground objects.
C© 2003 RAS, MNRAS 345, 949–959
Dow
nloaded from https://academ
ic.oup.com/m
nras/article/345/3/949/973541 by guest on 21 March 2022

954 S. Whitlock, D. A. Forbes and M. A. Beasley
We find 133 candidate GCs within the colour-selected region.The measured magnitudes and positions of these objects are listedin Appendix A. How does this final number compare with the totalnumber of GCs estimated by Harris & van den Bergh (1981) of 290± 150? Our data have complete radial coverage (with the possibilityof missing a few GCs in the very inner regions) but clearly under-sample the GC luminosity function. We reach magnitudes similarto, or slightly brighter than, the expected turnover magnitude. Thuscrudely we expect a factor of 2–2.5× more GCs than we detected,i.e. 266–333.
Examination of the colour-selected region, however, suggests thatit contains a number of background objects, i.e. objects with a widerange of (B − I )o colours and a mean (U − B)o colour of about−0.5. These were not generally seen in the Gemini-selected data,and are presumably not GCs but background galaxies. So the totalnumber of GCs in NGC 3379 may be closer to 250 than 300. Bothvalues are consistent with the low GC specific frequency found byHarris & van den Bergh (1981).
In order to further investigate this issue we have defined a back-ground region of the same central area as studied above but lo-cated at a galactocentric radius of more than 13.3 arcmin (44 kpc).The background objects, after B-magnitude selection, are shownin Fig. 9. Indeed, these background objects cover a range in (B −I )o with a mean (U − B)o of about −0.5. In Fig. 10 we show the(B − I )o colour distribution for GC candidates before and afterstatistical background subtraction. Two GC subpopulations are re-vealed with peaks around (B − I )o ∼ 1.65 and 1.90. As with theGemini-selected data, the blue subpopulation is easily identified inboth colour–colour space and in the (B − I )o distribution. How-ever, the red subpopulation is only clearly identified in the (B − I )o
distribution.
0 1 2 3-2
-1
0
1
2
Figure 9. (U − B)o versus (B − I )o colour distribution of the backgroundobjects, from an area matched to that for Fig. 8. Some of the backgroundobjects have colours that fall within the globular cluster selection region.
.5 20
5
10
15
20
1 1.5 20
5
10
15
20
Figure 10. Histogram of (B − I )o colours for candidate GCs. The openhistogram shows the objects within the colour selection region. The shadedhistogram shows the distribution after applying a statistical background cor-rection. Both before and after background correction, the histogram showsevidence for two subpopulations at (B − I )o ∼ 1.65 and 1.90.
8 G L O BU L A R C L U S T E R M E A N AG E SA N D M E TA L L I C I T I E S
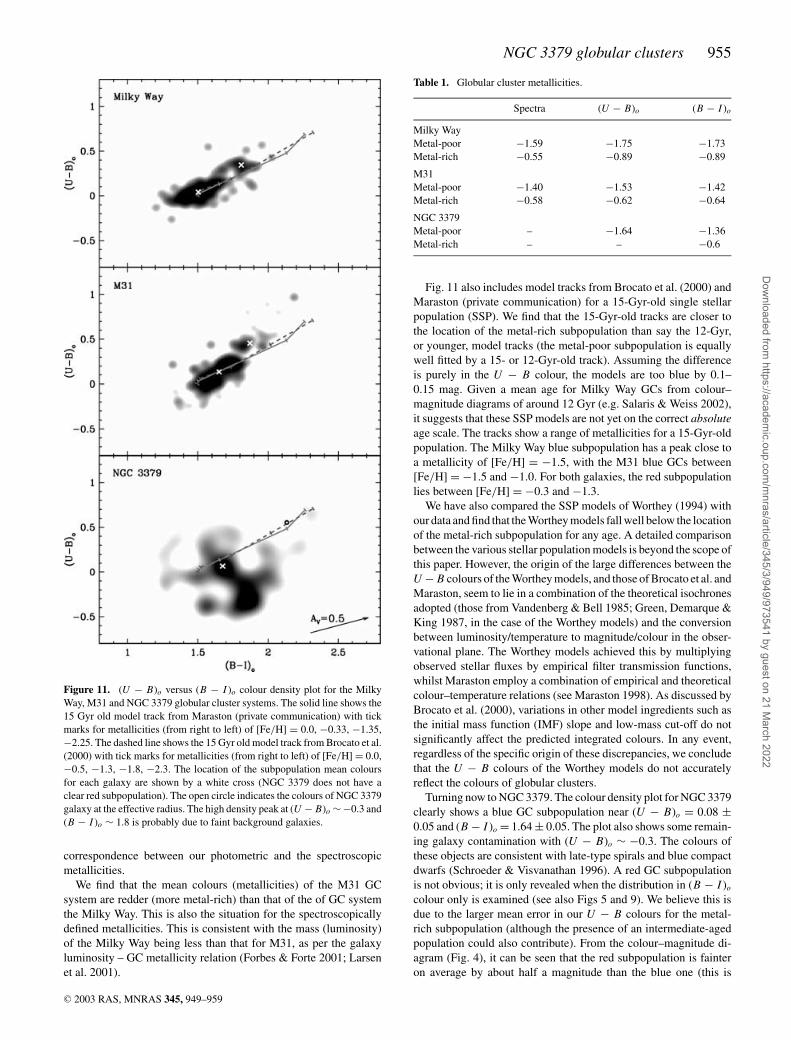
In order to interpret our data on NGC 3379 we compare it to sim-ilar data for the Milky Way and M31 GC systems. To aid in thisinterpretation we have created smoothed colour density plots usinga Gaussian smoothing kernel. In Fig. 11 we show the density plotsfor the MW and M31 (i.e. a smoothed version of Fig. 1), with abackground-subtracted density plot from the large area coverage ofNGC 3379 (i.e. Fig. 7 minus Fig. 8).
We first discuss the Milky Way and M31 GC systems. For theMilky Way, the data reveals the dominant blue subpopulation at(U − B)o = 0.04 and (B − I )o = 1.51, with an uncertainty in thepeak location of ±0.05. The red subpopulation is harder to define asit contains fewer GCs. However, a small enhancement can be seenat (U − B)o ∼ 0.35 and (B − I )o ∼ 1.81. The distribution for M31is similar to that for the Milky Way. We estimate the dominant bluesubpopulation to be at (U − B)o = 0.12 and (B − I )o = 1.62 ±0.05. The red subpopulation appears to have a centre around (U −B)o = 0.45 and (B − I )o = 1.90 ± 0.05.
An empirical transformation between (U − B)o and (B − I )o
to [Fe/H] is given by Barmby et al. (2000). Barmby et al. cal-culated these transformations based on spectroscopic metallici-ties for ∼80 Milky Way GCs. Using these transformations wecan calculate ‘photometric metallicities’ based on our colour es-timates. These are summarized in Table 1. The mean metallic-ity of the two subpopulations from spectroscopy are [Fe/H] =−1.59, −0.55 and −1.40, −0.58 for the Milky Way andM31, respectively (Forbes et al. 2000). Table 1 shows a good
C© 2003 RAS, MNRAS 345, 949–959
Dow
nloaded from https://academ
ic.oup.com/m
nras/article/345/3/949/973541 by guest on 21 March 2022
NGC 3379 globular clusters 955
Figure 11. (U − B)o versus (B − I )o colour density plot for the MilkyWay, M31 and NGC 3379 globular cluster systems. The solid line shows the15 Gyr old model track from Maraston (private communication) with tickmarks for metallicities (from right to left) of [Fe/H] = 0.0, −0.33, −1.35,−2.25. The dashed line shows the 15 Gyr old model track from Brocato et al.(2000) with tick marks for metallicities (from right to left) of [Fe/H] = 0.0,−0.5, −1.3, −1.8, −2.3. The location of the subpopulation mean coloursfor each galaxy are shown by a white cross (NGC 3379 does not have aclear red subpopulation). The open circle indicates the colours of NGC 3379galaxy at the effective radius. The high density peak at (U − B)o ∼ −0.3 and(B − I )o ∼ 1.8 is probably due to faint background galaxies.
correspondence between our photometric and the spectroscopicmetallicities.
We find that the mean colours (metallicities) of the M31 GCsystem are redder (more metal-rich) than that of the of GC systemthe Milky Way. This is also the situation for the spectroscopicallydefined metallicities. This is consistent with the mass (luminosity)of the Milky Way being less than that for M31, as per the galaxyluminosity – GC metallicity relation (Forbes & Forte 2001; Larsenet al. 2001).
Table 1. Globular cluster metallicities.
Spectra (U − B)o (B − I )o
Milky WayMetal-poor −1.59 −1.75 −1.73Metal-rich −0.55 −0.89 −0.89
M31Metal-poor −1.40 −1.53 −1.42Metal-rich −0.58 −0.62 −0.64
NGC 3379Metal-poor – −1.64 −1.36Metal-rich – – −0.6
Fig. 11 also includes model tracks from Brocato et al. (2000) andMaraston (private communication) for a 15-Gyr-old single stellarpopulation (SSP). We find that the 15-Gyr-old tracks are closer tothe location of the metal-rich subpopulation than say the 12-Gyr,or younger, model tracks (the metal-poor subpopulation is equallywell fitted by a 15- or 12-Gyr-old track). Assuming the differenceis purely in the U − B colour, the models are too blue by 0.1–0.15 mag. Given a mean age for Milky Way GCs from colour–magnitude diagrams of around 12 Gyr (e.g. Salaris & Weiss 2002),it suggests that these SSP models are not yet on the correct absoluteage scale. The tracks show a range of metallicities for a 15-Gyr-oldpopulation. The Milky Way blue subpopulation has a peak close toa metallicity of [Fe/H] = −1.5, with the M31 blue GCs between[Fe/H] = −1.5 and −1.0. For both galaxies, the red subpopulationlies between [Fe/H] = −0.3 and −1.3.
We have also compared the SSP models of Worthey (1994) withour data and find that the Worthey models fall well below the locationof the metal-rich subpopulation for any age. A detailed comparisonbetween the various stellar population models is beyond the scope ofthis paper. However, the origin of the large differences between theU − B colours of the Worthey models, and those of Brocato et al. andMaraston, seem to lie in a combination of the theoretical isochronesadopted (those from Vandenberg & Bell 1985; Green, Demarque &King 1987, in the case of the Worthey models) and the conversionbetween luminosity/temperature to magnitude/colour in the obser-vational plane. The Worthey models achieved this by multiplyingobserved stellar fluxes by empirical filter transmission functions,whilst Maraston employ a combination of empirical and theoreticalcolour–temperature relations (see Maraston 1998). As discussed byBrocato et al. (2000), variations in other model ingredients such asthe initial mass function (IMF) slope and low-mass cut-off do notsignificantly affect the predicted integrated colours. In any event,regardless of the specific origin of these discrepancies, we concludethat the U − B colours of the Worthey models do not accuratelyreflect the colours of globular clusters.
Turning now to NGC 3379. The colour density plot for NGC 3379clearly shows a blue GC subpopulation near (U − B)o = 0.08 ±0.05 and (B − I )o = 1.64 ± 0.05. The plot also shows some remain-ing galaxy contamination with (U − B)o ∼ −0.3. The colours ofthese objects are consistent with late-type spirals and blue compactdwarfs (Schroeder & Visvanathan 1996). A red GC subpopulationis not obvious; it is only revealed when the distribution in (B − I )o
colour only is examined (see also Figs 5 and 9). We believe this isdue to the larger mean error in our U − B colours for the metal-rich subpopulation (although the presence of an intermediate-agedpopulation could also contribute). From the colour–magnitude di-agram (Fig. 4), it can be seen that the red subpopulation is fainteron average by about half a magnitude than the blue one (this is
C© 2003 RAS, MNRAS 345, 949–959
Dow
nloaded from https://academ
ic.oup.com/m
nras/article/345/3/949/973541 by guest on 21 March 2022

956 S. Whitlock, D. A. Forbes and M. A. Beasley
presumably due to additional line blanketing in the more metal-richGCs). Larsen et al. (2001) also found evidence for the red GCs be-ing systematically fainter than the blue ones. For their small sampleof 21 blue and 24 red GCs, they estimated V-band turnover mag-nitudes of 22.57 for the blue GCs and 23.02 for the red GCs. ForNGC 3379, this results in an additional colour error of ∼0.3 mag forthe metal-rich subpopulation. This effect may be spreading out the(fainter) metal-rich subpopulation. Our B − I colour errors are gen-erally half those in U − B, and hence are less affected. If we consider(B − I )o colour only, i.e. the histograms of Figs 6 (Gemini selected)and 10 (INT selected), then we estimate that the red subpopulationhas a mean colour of (B − I )o ∼ 1.9.
The intrinsic U − B and B − I colours of the blue subpopulationin NGC 3379 are intermediate between those of the Milky Way andM31 GC systems. The Barmby et al. (2000) transformation leads toa photometric metallicity of [Fe/H] = −1.64 ± 0.14 from (U − B)o
and −1.36 ± 0.14 from (B − I )o for the blue subpopulation. Thisis consistent with the metallicity indicated by the Maraston ([Fe/H]∼ −1.35) and Brocato et al. ([Fe/H] ∼ −1.5) 15 Gyr SSP tracks.The photometric metallicity for the red subpopulation, based on(B − I )o colour only, is estimated to be [Fe/H] ∼ −0.6. Thesevalues are summarized in Table 1.
The ages of the GC subpopulations in NGC 3379 are less wellconstrained by our data. However, similarities between NGC 3379and the Milky Way and M31 GC colours suggests that the bluesubpopulation in all three galaxies has a similar, old age. From thecolour–magnitude diagram of Fig. 4, the red subpopulation in NGC3379 is fainter in the mean than the blue GCs. This effectively rulesout a young (i.e. <3 Gyr) age.
9 C O N C L U S I O N S
Magnitudes and colours, from the Isaac Newton Telescope, for133 candidate globular clusters around NGC 3379 are presented.Our detection rate is consistent with a low specific frequency.These candidates, and a subsample selected from imaging withthe Gemini North Telescope, reveal evidence for a blue and redsubpopulation.
We have compared the (U − B)o versus (B − I )o colours of theNGC 3379 globular cluster system with that for the Milky Way andM31. The Milky Way and M31 reveal similar GC colour distribu-tions, although with slightly different slopes (which may simply bethe result of uncertain reddening corrections). The metal-poor andmetal-rich subpopulations can be seen as a dominant blue and a lesswell-defined red peak. Using the single stellar population modelsof Maraston (private communication) and Brocato et al. (2000), wefind that the mean colours of both subpopulations are best repro-duced by their 15-Gyr-old tracks. Even so, small colour differencesbetween the model and the measurements exist. As the mean age ofthe Milky Way globular clusters is thought to be closer to 12 Gyr, itsuggests that these model require a relative age adjustment. The esti-mated mean metallicities of the two subpopulations are very similarto those measured previously from spectroscopy. We also investi-gated the models of Worthey (1994), and found they were unable toreproduce the (U − B)o colour of the metal-rich subpopulation inM31 and the Milky Way for any age.
For NGC 3379 we detect a blue subpopulation with very similar(U − B)o and (B − I )o colours, and presumably age/metallicity, tothat of the Milky Way and M31 globular cluster systems. Thus theblue GCs in NGC 3379 are consistent with being very old and witha mean metallicity of [Fe/H] ∼ −1.5. The red subpopulation is lesswell-defined, perhaps due to increased photometric errors, but has
a similar mean (B − I )o colour to the Milky Way and M31 globularcluster systems. This implies a mean photometric metallicity of[Fe/H] ∼ −0.6.
AC K N OW L E D G M E N T S
We thank M. Pierce and J. Strader for useful comments. We alsothank A. Terlevich for his help in observing and the initial datareduction. The data used in this project were obtained with IsaacNewton Telescope at La Palma Observatory and the Gemini NorthTelescope. This research has made use of the NASA/IPAC Extra-galactic Data base (NED) which is operated by the Jet PropulsionLaboratory, California Institute of Technology, under contract withthe National Aeronautics and Space Administration.
R E F E R E N C E S
Ajhar E. A., Blakeslee J. P., Tonry J. L., 1994, AJ, 108, 2087Ashman K. M., Zepf S. E., 1992, ApJ, 384, 50Ashman K. A., Bird C. M., Zepf S. E., 1994, AJ, 108, 2348Barmby P., Huchra J. P., Brodie J. P., Forbes D. A., Schroder L. L., Grillmair
C. J., 2000, AJ, 119, 727Beasley M. A., Baugh C. M., Forbes D. A., Sharples R. M., Frenk C. S.,
2002, MNRAS, 333, 383Beasley M. A., Forbes D., Brodie J., Kissler-Patig M., 2003, MNRAS,
submittedBridges T. J., Ashman K. M., Zepf S. E., Carter, D., Hanes D. A., Sharples
R. M., Kavelaars J. J., 1997, MNRAS, 284, 376Brocato E., Castellani V., Poli F., Raimondo G., 2000, A&AS, 146, 91Cote P., Marzke R. O., West M. J., 1998, ApJ, 501, 554Forbes D. A., Forte J. C., 2001, MNRAS, 322, 257Forbes D. A., Thomson R. C., 1992, MNRAS, 254, 723Forbes D. A., Brodie J. P., Huchra J., 1997, AJ, 113, 887Forbes D. A., Masters K. L., Minniti D., Barmby P., 2000, A&A, 358,
471Forbes D. A., Beasley M. A., Brodie J. P., Kissler-Patig M., 2001, ApJ, 563,
L143Geisler D., Lee M. G., Kim E., 1996, AJ, 111, 1529Green E. M., Demarque P., King C. R., 1987, The Revised Yale Isochrones
and Luminosity Functions. Yale Observatory, New HavenHarris W. E., 1996, AJ, 112, 1487Harris W. E., van den Bergh S., 1981, AJ, 86, 1981Kissler-Patig M., Gebhardt K., 1998, AJ, 116, 2237Kissler-Patig M., Brodie J. P., Schroder L. L., Forbes D. A., Grillmair C. J.,
Huchra J. P., 1998, AJ, 115, 105Kundu A., Whitmore B. C., 2001, AJ, 122, 1251Landolt A. U., 1992, PASP, 104, 336Larsen S. S., Brodie J. P., Huchra J. P., Forbes D. A., Grillmair C. J., 2001,
AJ, 121, 2974Larsen S. S., Brodie J. P., Beasley M. A., Forbes D. A., 2002, AJ, 124,
828Maraston C., 1998, MNRAS, 300, 872Puzia T. H., Zepf S. E., Kissler-Patig M., Hilker M., Minniti D., Goudfrooij
P., 2002, A&A, 391, 453Rejkuba M., 2001, A&A, 369, 812Salaris M., Weiss A., 2002, A&A, 388, 492Secker J., Geisler D., McLauglin D. E., Harris W. E., 1995, AJ, 109,
1019Schroeder A., Visvanathan N., 1996, A&AS, 1181, 441Vandenberg D. A., Bell R. A., 1985, ApJS, 58, 561Whitmore B. C., Sparks W. B., Lucas R. A., Macchetto F. D., Biretta J. A.,
1995, ApJ, 454, L73Worthey G., 1994, ApJS, 95, 107
C© 2003 RAS, MNRAS 345, 949–959
Dow
nloaded from https://academ
ic.oup.com/m
nras/article/345/3/949/973541 by guest on 21 March 2022

NGC 3379 globular clusters 957
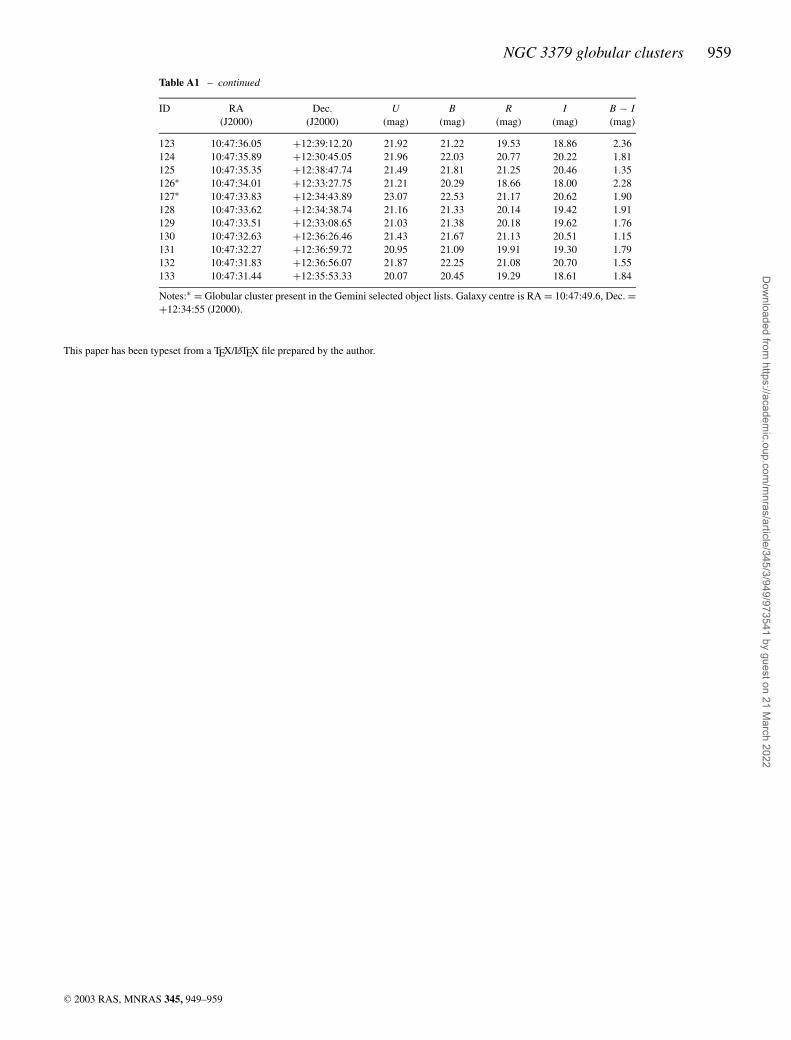
A P P E N D I X A
Table A1 lists the positions and colours of the candidate globular clusters in NGC 3379 identified in this study.
Table A1. Candidate Globular Clusters around NGC 3379.
ID RA Dec. U B R I B − I(J2000) (J2000) (mag) (mag) (mag) (mag) (mag)
001 10:48:11.36 +12:34:32.14 20.18 20.17 18.79 18.16 2.00002 10:48:11.22 +12:35:42.37 21.93 22.30 20.96 20.46 1.84003 10:48:10.99 +12:33:50.10 20.92 21.29 20.02 19.41 1.89004 10:48:10.04 +12:35:09.40 21.28 21.66 20.65 19.94 1.73005 10:48:06.50 +12:37:57.63 22.36 21.68 20.25 19.43 2.25006 10:48:06.36 +12:36:10.70 22.18 22.58 21.42 20.84 1.74007 10:48:06.35 +12:35:33.91 22.33 22.66 21.29 20.86 1.80008 10:48:05.74 +12:34:17.05 21.34 21.65 20.43 19.73 1.92009 10:48:05.61 +12:37:15.56 23.08 22.98 21.13 20.60 2.37010 10:48:05.28 +12:33:07.97 21.08 21.56 20.62 20.08 1.48011 10:48:05.22 +12:36:48.93 21.16 21.62 20.65 20.09 1.54012 10:48:04.74 +12:38:16.43 22.41 23.00 21.73 21.87 1.13013 10:48:04.44 +12:34:12.39 21.62 21.67 20.55 20.28 1.39014∗ 10:48:04.33 +12:35:41.48 23.18 22.69 21.38 20.75 1.95015∗ 10:48:04.09 +12:38:36.88 20.54 20.85 19.85 19.34 1.51016 10:48:03.19 +12:38:56.00 22.83 22.69 21.24 21.41 1.28017 10:48:03.17 +12:34:36.48 20.32 20.66 19.92 19.57 1.09018 10:48:02.40 +12:39:12.83 22.53 22.95 21.73 21.39 1.56019 10:48:01.77 +12:32:48.29 21.77 22.02 20.80 20.19 1.83020∗ 10:48:01.68 +12:35:59.72 21.81 21.66 20.56 19.99 1.67021 10:48:01.59 +12:32:39.15 22.15 22.60 21.84 21.30 1.29022 10:48:01.23 +12:34:20.79 23.14 22.80 21.82 21.03 1.77023 10:48:01.01 +12:34:16.68 23.27 22.89 21.78 20.65 2.24024 10:48:00.74 +12:39:26.23 21.25 21.55 20.76 20.54 1.01025 10:48:00.57 +12:33:41.88 22.77 23.00 21.89 21.73 1.27026∗ 10:48:00.28 +12:32:50.55 21.53 21.67 20.35 19.63 2.04027∗ 10:47:58.61 +12:33:57.32 22.85 22.50 21.72 20.94 1.55028 10:47:58.29 +12:39:34.80 22.29 22.38 21.63 21.10 1.28029 10:47:57.68 +12:32:08.49 21.71 22.25 21.48 21.01 1.24030∗ 10:47:57.64 +12:34:29.41 23.34 22.84 21.83 21.49 1.35031∗ 10:47:56.56 +12:33:29.09 21.06 21.16 20.02 19.63 1.52032 10:47:56.51 +12:32:09.45 21.51 22.37 21.73 21.28 1.09033 10:47:55.19 +12:30:37.16 22.71 22.76 21.76 21.25 1.50034 10:47:55.16 +12:30:21.77 20.19 20.53 19.79 19.38 1.16035 10:47:55.13 +12:32:05.35 21.38 21.69 21.01 20.10 1.59036∗ 10:47:54.21 +12:38:36.91 23.08 22.78 21.98 21.43 1.35037∗ 10:47:53.97 +12:36:32.31 22.36 21.69 20.47 19.75 1.95038∗ 10:47:53.91 +12:34:54.28 23.25 22.66 21.50 21.14 1.52039 10:47:53.81 +12:31:09.03 20.05 20.28 19.49 19.16 1.12040 10:47:53.75 +12:32:56.42 20.60 20.89 19.66 18.98 1.91041∗ 10:47:53.74 +12:33:48.33 22.47 22.27 21.09 20.65 1.62042∗ 10:47:53.48 +12:34:55.67 21.88 21.67 20.68 20.14 1.53043∗ 10:47:53.32 +12:34:14.15 22.61 22.62 21.44 20.72 1.90044∗ 10:47:53.29 +12:35:05.76 23.23 22.53 21.01 20.38 2.14045∗ 10:47:52.46 +12:36:00.51 23.14 22.25 20.75 20.02 2.23046 10:47:51.71 +12:32:52.10 22.78 22.89 21.58 20.79 2.10047 10:47:51.37 +12:40:08.89 22.24 22.73 21.56 21.08 1.65048∗ 10:47:50.99 +12:35:49.78 20.78 20.75 19.53 19.05 1.71049 10:47:50.75 +12:30:22.69 21.93 22.17 21.24 20.73 1.44050∗ 10:47:50.68 +12:35:30.07 21.49 21.31 20.13 19.57 1.74051∗ 10:47:50.56 +12:35:32.43 21.57 21.35 20.15 19.39 1.96052∗ 10:47:50.47 +12:35:19.56 22.49 22.44 21.37 20.53 1.91053∗ 10:47:50.43 +12:34:37.76 22.18 21.83 20.65 20.39 1.44054∗ 10:47:50.42 +12:33:49.17 22.53 22.04 20.84 20.39 1.65055 10:47:50.26 +12:32:22.91 21.59 22.41 21.30 21.25 1.16056 10:47:50.10 +12:31:06.72 22.42 22.76 21.75 21.39 1.37057∗ 10:47:49.67 +12:34:33.57 20.22 20.11 18.88 18.42 1.69058∗ 10:47:49.66 +12:34:11.20 22.82 22.24 20.80 19.94 2.30059∗ 10:47:48.96 +12:35:23.11 21.50 21.66 20.68 20.43 1.23
C© 2003 RAS, MNRAS 345, 949–959
Dow
nloaded from https://academ
ic.oup.com/m
nras/article/345/3/949/973541 by guest on 21 March 2022

958 S. Whitlock, D. A. Forbes and M. A. Beasley
Table A1 – continued
ID RA Dec. U B R I B − I(J2000) (J2000) (mag) (mag) (mag) (mag) (mag)
060 10:47:48.60 +12:37:03.83 21.72 21.77 20.79 20.27 1.50061 10:47:48.59 +12:35:32.40 20.98 21.15 20.25 19.77 1.38062∗ 10:47:48.20 +12:35:45.07 21.59 21.70 20.45 19.98 1.72063∗ 10:47:48.00 +12:35:07.78 21.29 21.67 20.38 20.10 1.57064∗ 10:47:47.91 +12:34:38.75 21.94 22.34 20.86 20.94 1.40065∗ 10:47:47.90 +12:36:22.85 23.01 22.79 21.82 21.55 1.24066∗ 10:47:47.87 +12:35:05.17 21.61 21.54 20.41 19.86 1.68067∗ 10:47:47.80 +12:34:15.41 22.84 21.94 20.51 19.99 1.95068∗ 10:47:47.78 +12:36:41.23 21.62 21.90 20.73 20.00 1.90069 10:47:47.40 +12:37:19.00 22.38 22.63 21.81 20.87 1.76070∗ 10:47:47.30 +12:34:05.47 22.86 22.59 21.39 20.60 1.98071 10:47:46.85 +12:36:52.44 21.85 22.21 21.50 20.87 1.34072 10:47:46.78 +12:31:37.35 21.92 22.34 22.11 20.81 1.53073 10:47:46.48 +12:32:34.57 22.12 22.50 21.38 21.16 1.34074 10:47:46.30 +12:31:19.99 21.95 21.86 20.73 20.49 1.37075 10:47:46.22 +12:38:49.41 20.19 20.61 19.33 18.87 1.75076∗ 10:47:45.79 +12:34:48.40 21.99 21.99 20.63 20.15 1.84077∗ 10:47:45.65 +12:34:51.91 21.73 22.00 20.79 20.07 1.93078 10:47:45.54 +12:40:08.99 20.81 21.32 20.42 19.97 1.35079 10:47:45.44 +12:31:33.17 21.57 21.80 21.03 20.58 1.22080 10:47:45.19 +12:39:57.83 21.40 21.65 20.89 20.52 1.13081 10:47:43.76 +12:30:45.96 20.07 20.18 19.09 18.40 1.78082∗ 10:47:43.67 +12:33:34.16 22.32 22.47 21.26 21.41 1.06083∗ 10:47:43.55 +12:37:04.17 22.20 22.34 21.35 21.11 1.23084∗ 10:47:43.34 +12:36:46.37 22.58 22.34 21.09 20.79 1.55085∗ 10:47:42.25 +12:34:47.47 22.51 22.49 21.30 20.82 1.67086 10:47:42.14 +12:35:08.62 21.99 22.62 21.87 21.46 1.15087∗ 10:47:42.11 +12:36:10.11 22.31 22.34 21.14 20.34 2.00088∗ 10:47:41.84 +12:35:40.68 23.10 22.26 21.12 20.50 1.76089∗ 10:47:41.30 +12:36:50.81 22.91 22.87 21.80 21.24 1.63090 10:47:40.91 +12:31:37.45 21.54 22.08 21.51 20.81 1.26091∗ 10:47:40.82 +12:34:05.12 22.01 22.47 21.29 20.75 1.72092 10:47:40.80 +12:39:42.82 21.54 21.86 20.68 20.33 1.53093 10:47:40.73 +12:32:17.44 19.61 19.70 18.79 18.42 1.28094 10:47:40.61 +12:38:57.95 19.74 19.93 18.98 18.44 1.49095∗ 10:47:40.61 +12:35:22.13 20.50 20.60 19.59 19.09 1.51096∗ 10:47:40.60 +12:35:53.78 20.94 20.91 19.87 19.28 1.63097 10:47:40.51 +12:37:22.36 22.43 22.26 21.05 20.70 1.56098 10:47:40.03 +12:34:36.04 22.68 22.83 21.57 20.80 2.03099∗ 10:47:39.71 +12:33:58.78 22.64 22.17 20.98 20.41 1.76100∗ 10:47:39.70 +12:32:26.12 20.82 20.76 19.55 19.02 1.74101 10:47:39.47 +12:35:37.17 21.30 21.75 20.85 20.60 1.15102 10:47:39.44 +12:39:37.58 22.54 22.26 20.96 20.08 2.18103 10:47:39.33 +12:30:53.43 22.11 21.90 20.33 19.63 2.27104 10:47:39.32 +12:39:42.28 21.91 22.14 21.15 20.43 1.71105 10:47:39.24 +12:35:35.50 21.49 21.91 20.87 20.21 1.69106∗ 10:47:39.24 +12:35:01.26 23.30 22.95 21.53 21.37 1.58107 10:47:39.01 +12:36:45.95 22.66 22.52 21.37 20.42 2.10108 10:47:38.98 +12:35:26.48 22.84 22.68 21.10 20.34 2.34109 10:47:38.89 +12:39:38.32 22.50 22.50 21.91 20.97 1.53110 10:47:38.60 +12:35:57.03 22.01 22.42 21.39 20.62 1.79111 10:47:38.31 +12:31:53.19 21.45 21.44 20.28 19.79 1.65112∗ 10:47:38.28 +12:35:10.56 21.96 22.44 21.17 20.69 1.75113 10:47:38.21 +12:39:28.19 20.90 20.98 20.00 19.56 1.42114 10:47:37.84 +12:31:04.88 22.59 22.70 21.19 20.80 1.90115 10:47:37.76 +12:33:33.40 21.32 21.07 19.75 19.09 1.98116∗ 10:47:37.66 +12:34:14.78 21.80 21.82 21.32 20.47 1.35117 10:47:37.49 +12:38:56.74 22.23 22.77 22.28 21.65 1.13118 10:47:37.34 +12:36:02.54 21.61 21.96 20.66 20.33 1.63119∗ 10:47:37.14 +12:35:21.82 22.00 22.03 20.80 20.02 2.01120 10:47:36.91 +12:37:21.02 21.81 20.93 19.46 18.84 2.09121 10:47:36.35 +12:34:41.33 20.08 20.35 19.57 19.20 1.14122 10:47:36.06 +12:35:53.02 22.10 22.23 21.08 20.63 1.61
C© 2003 RAS, MNRAS 345, 949–959
Dow
nloaded from https://academ
ic.oup.com/m
nras/article/345/3/949/973541 by guest on 21 March 2022
NGC 3379 globular clusters 959
Table A1 – continued
ID RA Dec. U B R I B − I(J2000) (J2000) (mag) (mag) (mag) (mag) (mag)
123 10:47:36.05 +12:39:12.20 21.92 21.22 19.53 18.86 2.36124 10:47:35.89 +12:30:45.05 21.96 22.03 20.77 20.22 1.81125 10:47:35.35 +12:38:47.74 21.49 21.81 21.25 20.46 1.35126∗ 10:47:34.01 +12:33:27.75 21.21 20.29 18.66 18.00 2.28127∗ 10:47:33.83 +12:34:43.89 23.07 22.53 21.17 20.62 1.90128 10:47:33.62 +12:34:38.74 21.16 21.33 20.14 19.42 1.91129 10:47:33.51 +12:33:08.65 21.03 21.38 20.18 19.62 1.76130 10:47:32.63 +12:36:26.46 21.43 21.67 21.13 20.51 1.15131 10:47:32.27 +12:36:59.72 20.95 21.09 19.91 19.30 1.79132 10:47:31.83 +12:36:56.07 21.87 22.25 21.08 20.70 1.55133 10:47:31.44 +12:35:53.33 20.07 20.45 19.29 18.61 1.84
Notes:∗ = Globular cluster present in the Gemini selected object lists. Galaxy centre is RA = 10:47:49.6, Dec. =+12:34:55 (J2000).
This paper has been typeset from a TEX/LATEX file prepared by the author.
C© 2003 RAS, MNRAS 345, 949–959
Dow
nloaded from https://academ
ic.oup.com/m
nras/article/345/3/949/973541 by guest on 21 March 2022