Dynamical Friction in DE Globular Cluster Systems
25
arXiv:astro-ph/0102079v1 5 Feb 2001 Dynamical Friction in dE Globular Cluster Systems Jennifer M. Lotz 1 , Rosemary Telford 2 , Henry C. Ferguson 3 Bryan W. Miller 4 , Massimo Stiavelli 3 and Jennifer Mack 3 ABSTRACT The dynamical friction timescale for globular clusters to sink to the center of a dwarf elliptical galaxy (dE) is significantly less than a Hubble time if the halos have King-model or isothermal profiles and the globular clusters formed with the same radial density profile as the underlying stellar population. We examine the summed radial distribution of the entire globular cluster systems and the bright globular cluster candi- dates in 51 Virgo and Fornax Cluster dEs for evidence of dynamical friction processes. We find that the summed distribution of the entire globular cluster population closely follows the exponential profile of the underlying stellar population. However, there is a deficit of bright clusters within the central regions of dEs (excluding the nuclei), perhaps due to the orbital decay of these massive clusters into the dE cores. We also predict the magnitude of each dE’s nucleus assuming the nuclei form via dynamical friction. The observed trend of decreasing nuclear luminosity with decreasing dE luminosity is much stronger than predicted if the nuclei formed via simple dynamical friction pro- cesses. We find that the bright dE nuclei could have been formed from the merger of orbitally decayed massive clusters, but the faint nuclei are several magnitudes fainter than expected. These faint nuclei are found primarily in M V > -14 dEs which have high globular cluster specific frequencies and extended globular cluster systems. In these galaxies, supernovae-driven winds, high central dark matter densities, extended dark matter halos, the formation of new star clusters, or tidal interactions may act to prevent dynamical friction from collapsing the entire globular cluster population into a single bright nucleus. Subject headings: dark matter – galaxies: dwarf – galaxies: kinematics and dynamics – galaxies: star clusters 1 Henry A. Rowland Department of Physics and Astronomy, Johns Hopkins University, 3400 N. Charles St., Baltimore, MD 21218; [email protected] 2 Department of Physics and Astronomy, University of Wales, Cardiff, Wales, U.K. CF2 3YB; Telfor- dRE@Cardiff.ac.uk 3 Space Telescope Science Institute, 3700 San Martin Dr., Baltimore, MD 21218; [email protected], [email protected], [email protected] 4 Gemini Observatory, Casilla 603, La Serena, Chile; [email protected]
-
Upload
independent -
Category
Documents
-
view
3 -
download
0
Transcript of Dynamical Friction in DE Globular Cluster Systems

arX
iv:a
stro
-ph/
0102
079v
1 5
Feb
200
1
Dynamical Friction in dE Globular Cluster Systems
Jennifer M. Lotz 1, Rosemary Telford 2, Henry C. Ferguson 3
Bryan W. Miller 4, Massimo Stiavelli 3 and Jennifer Mack 3
ABSTRACT
The dynamical friction timescale for globular clusters to sink to the center of a
dwarf elliptical galaxy (dE) is significantly less than a Hubble time if the halos have
King-model or isothermal profiles and the globular clusters formed with the same radial
density profile as the underlying stellar population. We examine the summed radial
distribution of the entire globular cluster systems and the bright globular cluster candi-
dates in 51 Virgo and Fornax Cluster dEs for evidence of dynamical friction processes.
We find that the summed distribution of the entire globular cluster population closely
follows the exponential profile of the underlying stellar population. However, there is a
deficit of bright clusters within the central regions of dEs (excluding the nuclei), perhaps
due to the orbital decay of these massive clusters into the dE cores. We also predict
the magnitude of each dE’s nucleus assuming the nuclei form via dynamical friction.
The observed trend of decreasing nuclear luminosity with decreasing dE luminosity is
much stronger than predicted if the nuclei formed via simple dynamical friction pro-
cesses. We find that the bright dE nuclei could have been formed from the merger of
orbitally decayed massive clusters, but the faint nuclei are several magnitudes fainter
than expected. These faint nuclei are found primarily in MV > −14 dEs which have
high globular cluster specific frequencies and extended globular cluster systems. In
these galaxies, supernovae-driven winds, high central dark matter densities, extended
dark matter halos, the formation of new star clusters, or tidal interactions may act to
prevent dynamical friction from collapsing the entire globular cluster population into a
single bright nucleus.
Subject headings: dark matter – galaxies: dwarf – galaxies: kinematics and dynamics –
galaxies: star clusters
1Henry A. Rowland Department of Physics and Astronomy, Johns Hopkins University, 3400 N. Charles St.,
Baltimore, MD 21218; [email protected]
2Department of Physics and Astronomy, University of Wales, Cardiff, Wales, U.K. CF2 3YB; Telfor-
3Space Telescope Science Institute, 3700 San Martin Dr., Baltimore, MD 21218;
[email protected], [email protected], [email protected]
4Gemini Observatory, Casilla 603, La Serena, Chile; [email protected]

– 2 –
1. Introduction
Dwarf elliptical galaxies (dEs) are small, low mass (∼ 109 M⊙), low luminosity (MB > −16),
elliptical shaped galaxies with little or no gas and no ongoing star formation. They are the most
common type of galaxy in the local universe, outnumbering giant galaxies and dwarf irregulars in
nearby clusters (Binggeli, Sandage & Tammann 1985; Ferguson & Sandage 1988) and appearing
in roughly the same numbers as dwarf irregulars in low-density environments such as the Local
Group (Grebel 1997). In “bottom-up” hierarchical merging scenarios of galaxy formation, dwarf-
sized objects are the fundamental building blocks of larger galaxies. If dEs formed via gravitational
collapse onto compact dark matter halos, then they may present a fossil record of the seeds of
giant galaxy formation. On the other hand, if dEs form from the tidal debris of galaxy collisions
(Mirabel, Dottori, & Lutz 1992; Barnes & Hernquist 1992; Hunsberger, Charlton, & Zaritsky
1996), then they are but a side-effect of giant galaxy formation. A better understanding of dE
star formation histories and the nature of dE dark matter halos can help distinguish between these
different formation scenarios.
The variation of structure and chemical abundance with dE galaxy mass is most simply un-
derstood as the result of rapid star-formation within a dark matter halo, terminated by supernova-
driven winds (Dekel & Silk 1986). However, the varied star-formation histories of the Local Group
dwarf spheroidal (dSph) and dE galaxies suggest that the picture is more complicated, at least for
these nearby examples (Grebel 1997). Constraints on the ages and metallicities of the more exten-
sive dE populations in nearby clusters are somewhat ambiguous, although integrated optical and
infrared colors and spectral features (Thuan 1985; Caldwell & Bothun 1987; James 1994; Bothun
& Mould 1988) suggest that dEs are primarily old, metal-poor populations with a few exceptions.
Environmental effects, such as tidal interactions, galaxy harassment, and ram-pressure stripping,
may play a large role in the transformation of gas-rich proto-dEs into the gas-poor dEs and regulate
their star formation processes (e.g. Moore, Lake & Katz 1998).
Brighter than MB = −14, over 50% of dEs possess compact stellar nuclei (Sandage, Binggeli
& Tammann 1985). The nuclei for the most part appear as unresolved sources (even at HST
resolution) projected very near the isophotal center of the galaxy. These could, at least in principle,
be the merged conglomeration of globular clusters that have spiraled into the centers of the galaxies
(Tremaine, Ostriker, & Spitzer 1975). However, there are reasons to suspect that dE nucleus
formation may not be so straight-forward. Within the Virgo and Fornax clusters, the spatial
distributions of the dE,N galaxies and dE galaxies brighter than MB = −14 are significantly
different. The dE,N galaxies follow the radial distribution of the early-type (E and S0s) giant
galaxies, while the bright dEs (no N) galaxies follow the radial distribution of the spirals and
irregulars (Ferguson & Sandage 1989). It is difficult to see how a purely internal process for the
formation of dE nuclei such as dynamical friction could mimic such an environmental effect. Also,
the dE,N galaxies have a somewhat higher globular cluster specific frequency SN (the number of
clusters normalized to galaxy luminosity MV = −15) than non-nucleated dE, even when the nuclei
are not counted as clusters, which also suggests a different origin for the two galaxy types (Miller

– 3 –
et al. 1998, 2001). And finally, dynamical friction calculations suggest that if nuclei are formed
by the merger of decayed clusters, faint dEs should be more likely to be nucleated because they
have shorter cluster decay times for fixed cluster mass; however it is the bright dEs which are more
likely to be nucleated (Sandage, Binggeli, & Tammann 1985). An alternative scenario to dynamical
friction as the dE nuclear formation mechanism suggests that dE nuclei are the remnants of the last
burst of star-formation during the transition from dwarf irregulars (dIs) to dEs (Davies & Phillips
1988).
Globular cluster formation is often associated with periods of vigorous star formation, such as
the initial monolithic gravitational collapse of proto-galaxies (Harris 1991) or starbursts sparked by
galaxy mergers and interactions (e.g. the Antennae, Whitmore & Schweizer 1995). The character-
istics of the resulting cluster system record the time since formation and the properties of the host
galaxy. The colors of the clusters reflect their ages and abundances, which constrain the star for-
mation history of the host galaxy. The current number of clusters depends on the globular cluster
formation efficiency and the cluster destruction efficiency of the host galaxy, which may vary with
Hubble type and galaxy mass. The globular cluster specific frequency SN is a function of Hubble
type and may give insight into the formation of the globular cluster system (GCS) and host galaxy.
The present spatial distribution of the clusters traces the host galaxy’s gravitational potential and
dark matter component as well as constrains the initial radial distribution and kinematics of the
cluster population.
In the Local Group, observations of the dSph GCSs have presented some interesting puzzles.
Recent observations of the globular cluster systems of the Local Group dwarf spheroidals Sagittarius
and Fornax have shown a significant age spread in these systems (Buonanno et al. 1999; Fusi Pecci
et al. 1995; Montegriffo et al. 1998). The epoch of globular cluster formation for these two
galaxies lasted for least 3-7 Gyr and the youngest globular cluster is ∼ 5-7 Gyr old. These galaxies
also have extremely high specific frequencies (SN > 25) - in other words, they have more clusters
than expected for such faint, low mass systems (van den Bergh 1995). Finally, despite their short
dynamical friction timescales, both Fornax and Sagittarius have retained extended globular systems
(Oh, Lin, & Richer 2000).
We have embarked on a Hubble Space Telescope (HST) snapshot survey of globular cluster
systems in dE galaxies in nearby clusters and groups. A primary goal of the study is to determine
whether the globular cluster specific frequency is high (SN & 3), like giant ellipticals, or low
(SN < 1), like dwarf irregulars. The relatively high values of SN found in the first half of our
survey (Miller et al. 1998) suggest that dEs (and especially nucleated dEs) are not simply the
faded remnants of dwarf irregular galaxies that have been stripped of their gas. In this paper,
we consider the constraints on dE evolution provided by their nuclear properties and the spatial
distributions of their globular clusters and search for evidence of dynamical friction processes.
A globular cluster orbiting a galaxy will experience a drag force due to its gravitational inter-
action with the surrounding stars and dark matter. Over time, this “dynamical friction” (Chan-

– 4 –
drasekhar 1943) will cause the globular cluster to lose energy and spiral in toward the bottom of
the gravitational well. The timescale over which this happens depends on the mass of the globular
cluster, its orbit, and the velocity distribution function of the particles with which it is interacting.
In §3 we show that for the simplest assumptions – that the globular clusters began with the same
radial distribution as the stars, that their orbits are isotropic, and that the dark matter distribution
is an isothermal or King sphere – the dynamical friction timescales are significantly shorter than
a Hubble time. In §4 we then examine the radial distribution of globular clusters in the 51 dE
galaxies in our HST snapshot survey for evidence of these dynamical friction processes. We find
that the bright clusters (excluding the nuclei) show a 4 σ depletion relative to an exponential radial
profile, consistent with the orbital decay of these clusters into the dE centers. In §5 we simulate
the formation of dE nuclei via dynamical friction. Our simulations for the fainter dEs predict
nuclei several magnitudes brighter than observed. These dEs have high globular cluster specific
frequencies and extended globular cluster systems but very short predicted decay timescales. We
discuss in §6 the processes which may be working against the orbital decay of the globular clusters
into a single bright nucleus in the faintest dEs.
2. Observations and Data Analysis
HST WFPC2 snapshot images (HST Cycle 6 6352 and Cycle 7 7377 programs) in F555W (2 ×230 seconds) and F814W (300 seconds) were taken of each galaxy, with the galaxy centered on chip 3.
The DAOFIND detection algorithm was run on the F555W image and circular aperture photometry
of all detected objects was done using a 3 pixel radius aperture. The average aperture corrections for
the WF chips are -0.275 ± 0.014 for F555W and -0.307 ± 0.015 for F814W. The V −I colors (0.5 <
V −I < 1.5) and size (FWHM < 2.5 pixels) were used to select globular cluster candidates. Objects
detected on chips 2 and 4 that met our selection criteria were considered background/foreground
objects and were used to determine the background/foreground contamination of chip 3. All of the
dE nuclei in the sample were compact enough to be considered globular cluster candidates, and,
thus, were not well resolved even with the high resolution of HST WFPC2 (∼ 0.1 ′′ per pixel ). We
assumed distance moduli of 31.2 for the Virgo Cluster, 31.4 for the Fornax Cluster, and 30.3 for
the Leo Group. More details on the data reduction and object selection can be found in Miller et
al. (1998).
Assuming that the globular clusters have a luminosity function (LF) similar to the Local Group
GCLF, we detect 85-90% of the clusters in Virgo and Fornax (down to MV ∼ −6) (Figure 1a) and
98% of the clusters in Leo. Therefore we multiply the total number of Virgo and Fornax globular
cluster candidates by 1.15 to correct for incompleteness. However, because we wish to obtain
the radial profiles of the globular cluster systems, we must also determine the completeness as a
function of radius from the center of the host galaxy. Dwarf galaxies are generally of low surface
brightness, µo > 21 V magnitudes/arcsec2 (Binggeli & Cameron 1991), so we expect the globular
cluster detection efficiency to worsen significantly only in the central regions of the dE. Simulations

– 5 –
of a GCS for a V=15.2 (MV = −16 at Virgo) dE show that the cluster detection rate is ∼ 70% for
r < r0 and is > 95% for r > 3r0 (Figure 1b). It is the faint clusters which are missed and clusters
brighter than MV = −7.0 at the distance of Virgo and Fornax are detected at all radii.
Zero to twenty-five globular cluster candidates were found for each galaxy (Tables 1 and 2).
The IRAF task ELLIPSE was used to determine the center, exponential scalelength r0, and angle
of orientation for each galaxy. The isophotal radial distance (the semi-major axis length of the
intersecting galactic isophote) for each globular cluster candidate was calculated. Because each
galaxy possesses only a small number of globular cluster candidates, a composite globular cluster
radial distribution was created by scaling each globular cluster system by the host galaxy’s expo-
nential scalelength. Before summing the radial profiles of the entire dE sample, the profiles were
corrected for background/foreground object contamination by subtracting the estimated number
of background objects per radial bin for each dE. The summed profile was then corrected for radial
incompleteness effects.
3. Dynamical Friction Timescales
The observed radial distribution of a galaxy’s GCS depends on 1) the initial radial distribu-
tion; 2) the cumulative effects of dynamical friction (which in turn depend on the host galaxy’s
gravitational potential well and dynamical structure, as well as the mass distribution of the clus-
ters); and 3) the efficiency of destruction mechanisms near the galaxy’s center such as bulge and
disk shocking. Because dEs are without bulges or disks, we will assume that the destruction of
observable globular clusters due such shocks is minimal. However, if dEs possess central densities
> 1 M⊙ pc−3, globular clusters passing through the central regions may experience some tidal
stripping. Here we assume that dynamical friction is the dominant destruction mechanism.
The simplest hypothesis for the dE GCSs is that they started out with the same spatial and
velocity distributions as the underlying stellar population. Durrell et al. (1996) summed the radial
distributions for 11 dE GCS and found that dE GCS systems extended no more than 2.5 kpc from
the galaxies’ centers and followed the same distribution as the stellar light. However, an earlier
study by Minniti et al. (1996) of the summed GCS of four Local Group dEs found evidence for
more extended dE GCS. The GCS of giant galaxies are generally more spatially extended than the
stars; no GCS has been found to be more centrally concentrated that the rest of the galaxy (Harris
1991). Because most GCSs are associated with a spatially extended component of galaxies, globular
clusters could have formed before the bulk of the galaxy’s star formation during a rapid monolithic
collapse of proto-galactic halos. Another scenario predicting initially extended radial distributions
suggests that globular clusters form from cool gas in the outer halo shocked by a starburst-driven
galactic wind (Taniguichi, Trentham, & Ikeuchi 1999). However, the extended GCSs observed in
giant ellipticals may result from the preferential destruction of globular clusters near the galaxy’s
center by bulge and disk shocking (Murali & Weinberg 1997; Vesperini 1997). Globular clusters may
also form out of tidally shocked gas during galaxy mergers and strong interactions; observations of

– 6 –
forming star clusters in nearby mergers show that these clusters have the same radial distribution as
the underlying stellar populations (Whitmore et al. 1993; Schweizer et al. 1996). For the purposes
of this paper, we will assume that dE GCSs initially had the same spatial distribution as the host
galaxy’s stars.
Constraints on the structure of dE gravitational potential wells are particularly hard to come
by, given the difficulty in observing such faint, generally low surface-brightness objects. Most
studies have been limited to using the central stellar velocity dispersions (σ) of Local Group objects.
Peterson & Caldwell (1993) find a tight correlation between the dE luminosity and σ, in agreement
with supernovae-driven wind dE formation models (Dekel & Silk 1986). Bright dEs with MV ∼ −17
have σ ∼ 60 km s−1 and faint dEs with MV ∼ −12 have σ ∼ 15 km s−1. Mass estimates from these
velocity measurements assuming isotropic King profiles suggest that dEs are increasingly dominated
by dark matter at fainter magnitudes (Aaronson 1983; Pryor & Kormendy 1990). However, the
stellar velocity dispersion for some dEs are not isotropic - measurements of the anisotropy parameter
(v/σ)∗ (= vσ/
√
ǫ/(1 − ǫ), where v is the rotational velocity, σ is the mean velocity dispersion, and
ǫ is the ellipticity at the radius where v is measured) yield values less than 0.4 (Bender & Nieto
1990). But the Bender & Nieto (1990) sample only contains two dEs and for simplicity we assume
that dE dark matter halos are isotropic. Here we calculate the dynamical friction timescales for
two isotropic potentials - the isothermal halo and the King model. We assume dEs to have circular
velocities (vc =√
2σ for the isothermal model, vc =√
3σ for the King model) between 10-100 km
s−1 for MV = −12 to −17.
The time for the orbit of a globular cluster of mass M in an isothermal halo with a circular
velocity vc to decay from an initial radius ri to the center is
tDF =2.64 × 10²
lnΛ
(
ri
2 kpc
)2( vc
250 km s−1
)
(
106 M⊙
M
)
Gyr (1)
(Binney & Tremaine 1987). If we assume that the globular cluster distribution generally follows
the stellar light, the initial globular cluster radii should be comparable to dE half-light (effective)
radii (∼ 500 pc to 1.5 kpc, Peterson & Caldwell 1993).
The Coulomb logarithm lnΛ is given by
lnΛ = ln
(
bmaxV2
G(M + m)
)
, (2)
where bmax is the maximum impact parameter between the cluster and interacting particle, V is
the typical velocity of the system (for which we assume V ∼ vc) and m is the mass of the particle
(star). The value of bmax for dE galaxies is unknown and may range between 0.5 to 3 kpc. However,
this introduces only a 10-15 % uncertainty to the dynamical friction timescale. We assume bmax =
1 kpc for all of our calculations.
Hernandez & Gilmore (1998) have recently re-addressed the dynamical friction timescales for
dwarf galaxies, assuming dwarf dark matter halos are well represented by constant density core

– 7 –
region of a King distribution (King 1966). If the dark matter distribution has an approximately
constant-density core with radius rk, the dynamical friction timescale for clusters with ri = rk
becomes
tDF =4
3vc
(
rk
kpc
)2 (
105 M⊙
M
)(
1
lnΛ
)
Gyr. (3)
(Following Hernandez & Gilmore, here we have defined the “dynamical friction timescale” to be
the time for the globular cluster orbit to decay to 1/16th of its initial radius.) The core radius of
the King model is defined as rk = (9σ2/4πGρ)1/2. The light profiles of dEs are reasonably well
fit by King models, although bright dEs tend to have central excesses (Binggeli & Cameron 1991).
Typical stellar King core radii are on the order of 1 kpc. However, dEs are likely to be dark matter
dominated and the extent of their dark matter halos is not well known. Pryor & Kormendy (1990)
found the best dark matter models for the Draco and Ursa Minor dSphs were either isotropic with
similar dark matter and stellar core radii or highly anisotropic with dark matter scale radii ≥ 10
stellar core radii. Dwarf spirals may also be fit with King profiles, but have larger dark matter core
radii (2-8 kpc, Burkert 1995) .
In Figure 2, we plot the dynamical friction timescale as a function of circular velocity for
dwarf-sized isothermal and King halos assuming different initial/ dark matter core radii and cluster
masses. In the isothermal halo, clusters with masses ≥ 3 × 10⁵ M⊙ and initial radii ≤ 1 kpc will
spiral into the center in less than 10 Gyr. In the King halo, clusters with masses ≥ 2 × 10⁵ M⊙
in a rk ≤ 1 kpc dark matter halo will spiral into the center in less than 10 Gyr. Thus, for simple
yet reasonable assumptions, i.e. that dEs are adequately modeled by isotropic isothermal or King
profiles, that the dark matter and initial globular cluster distributions follow the stellar profile, and
that the clusters have ages similar to Galactic globular clusters (> 10 Gyr), the dE GCSs should
be significantly affected by dynamical friction processes. The effects are stronger for fainter, lower
mass dwarf galaxies.
4. Evolution of dE globular cluster radial distributions
As the orbits of globular clusters decay under dynamical friction, the massive clusters will sink
into the center more quickly than the smaller clusters. We have run a simple Monte Carlo simulation
to trace the evolution of the radial distribution of a typical dE globular cluster system. The
simulation uses the analytic expression for radial decay due to dynamical friction in an isothermal
sphere (Equation 1). Because dynamical friction decreases energy from a globular cluster at a rate
proportional to dV 2 but decreases angular momentum at a rate proportional to dV , a globular
cluster acting under dynamical friction will decay into orbits of maximum angular momentum
(Hernandez & Gilmore 1998). Therefore we assume that the orbits of the globular clusters are
circular. The clusters initially follow the exponential profile of the underlying stellar population
and have the present day globular cluster mass function, independent of radius. The simulation

– 8 –
was run 100,000 times for three cases: vc = 50 km s−1 and r0 = 2 kpc; vc =30 km s−1 and r0 = 1
kpc; and vc =15 km s−1 and r0 = 0.5 kpc (Figure 3).
The simulated globular cluster radial profiles in Figure 3 demonstrate the increasing impact
of dynamical friction on smaller, lower mass dwarfs. For the first two cases, dynamical friction has
little effect on the summed profile of the entire GCS and only the massive clusters within the inner
scalelengths fall into the galaxy’s core within 10 Gyr. In the 50 km s−1 dE, all clusters with masses
> 5×10⁵ M⊙ and radii < 1 kpc (1/2 r0) merge into the center within 10 Gyr. In the 30 km s−1 dE,
all clusters with masses > 5× 10⁵ M⊙ and initial radii < 2 kpc (2 r0) merge into the center within
10 Gyr. As the inner-most massive clusters are destroyed, some of the massive clusters originally
found in the outer regions sink into the central few scalelengths. The remaining less massive and
more extended clusters sink more slowly inwards and retain the exponential radial distribution in
the outer regions of the dE. However, in the 15 km s−1, 0.5 kpc simulation, after 10 Gyr ∼ 85% of
all clusters have merged into the center and 99.9% of MV < −8.0 clusters have been destroyed. In
the faintest and smallest dE, most of the globular clusters should merge to form a bright nucleus
in less than a Hubble time.
We have examined the summed radial distribution of both the bright (MV < −8), non-nucleus
cluster candidates and the entire GCSs of our dE sample for evidence of these dynamical friction
processes. Because our sample includes dEs with −11.9 > MB > −17.3, we expect the impact
of dynamical friction on our summed radial distribution will be most noticeable in the deficit of
massive clusters in the inner regions of dE. For each dE, we typically detect only a few globular
cluster candidates in excess of the background. Without radial velocities, it is impossible to de-
termine if a given globular cluster candidate is associated with the dE or is a background galaxy
or foreground star. Figure 4 shows the magnitude distribution of globular cluster candidates and
background/foreground objects satisfying the same color and compactness criteria. Significant con-
tamination by background objects affects the brightest bins; roughly 30% of the brightest cluster
candidates which fall on chip 3 and have MV < −8 are likely to be background objects. Assuming
M/LV = 2, a MV = −8 cluster has a mass ∼ 2.5 × 10⁵ M⊙. The dynamical friction timescale for
a 2.5× 10⁵ M⊙ cluster with an initial radius of 1 kpc in an isothermal halo with vc ∼ 40 km s−1 is
∼ 5 Gyr, thus the dynamical friction effects should be apparent for these bright clusters.
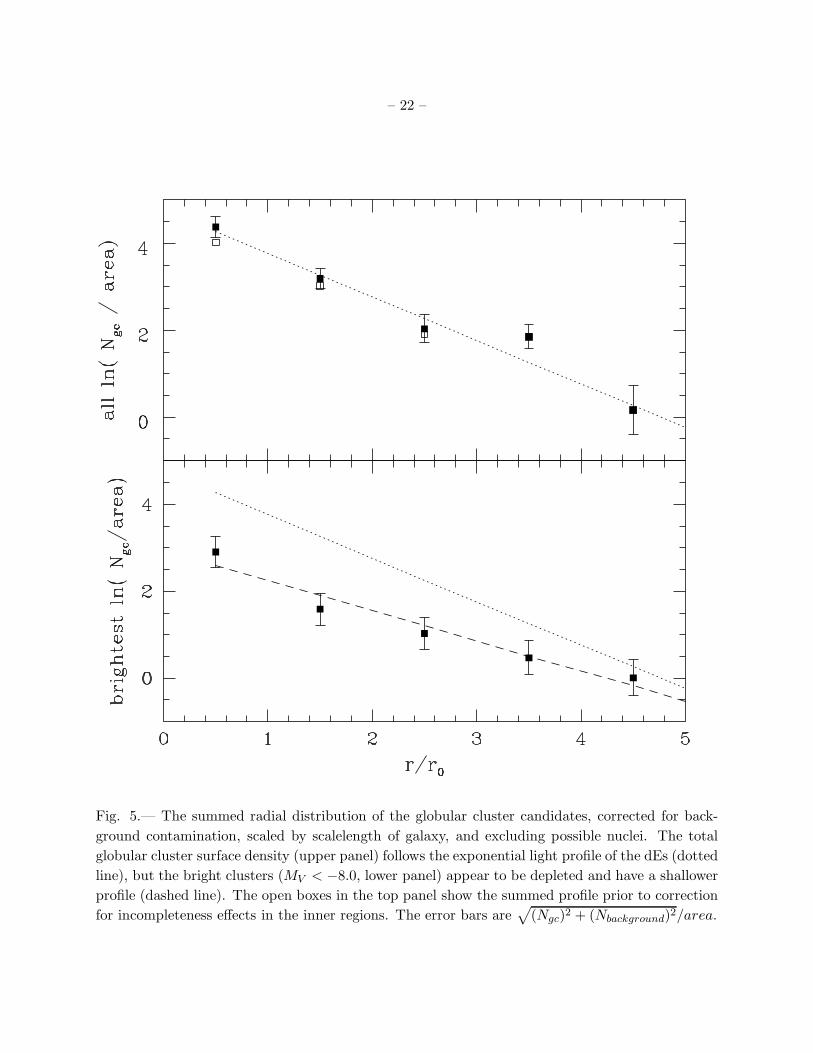
We have scaled the entire globular cluster system of each dE by the host galaxy’s exponential
scalelength r0, subtracted out the background contamination, and summed the radial distributions
of our 51 dEs to create a composite globular cluster radial distribution (top half of Figure 5). The
nuclei are excluded from this radial distribution. The summed distribution was corrected for radial
dependence on incompleteness, as determined in Figure 1b. This composite globular cluster radial
profile is well fit by an exponential profile and follows the light profile of dEs:
ln(Ngc/area) = (−0.97 ± 0.12) × (r
r0) + (4.76 ± 0.45) (RMS = 0.29). (4)
No deficit below the exponential profile for the entire summed globular cluster distribution is appar-
ent; however, the effect of dynamical friction on the total distribution is likely to be undetectable

– 9 –
(Figure 3).
In the bottom of Figure 5, we have plotted the radial distribution of the bright (MV < −8.0)
non-nuclear cluster candidates, corrected for the 30% contamination, scaled by the exponential
scalelength of the galaxy and summed over the entire dE sample. We have done no correction for
incompleteness because the correction should be very small for clusters brighter than MV = −7.0,
even in the central regions of the dEs. The best linear fit to this profile is ∼ 4σ shallower than an
exponential profile:
ln(Ngc/area) = (−0.68 ± 0.07) × (r
r0) + (2.93 ± 0.25) (RMS = 0.21). (5)
Thus, it appears that there is a significant deficit of bright, massive globular clusters in the inner
regions of our sample dEs.
5. Formation of dE nuclei via dynamical friction
Our Monte Carlo simulation of the evolution of dE globular cluster systems’ radial profiles
shows that massive clusters quickly spiral into the centers of dE. The brightest globular cluster
candidate in a dE is often the nucleus with < MV >= −10.3 (M ∼ 3 × 10⁶ M⊙, assuming M/LV
=2). Most of the nuclei in our sample lie in a fairly small (V − I) range between 0.85 and 1.10,
consistent with a 12 Gyr stellar population and a metallicity range between 1/100 and 1/5 solar
(Figure 6). The fainter nuclei are also found in fainter galaxies, which generally have fewer clusters
overall (top of Figure 7). There is a slight color-magnitude relation where the fainter nuclei are
bluer. One can imagine a scenario where fainter, less massive galaxies initially have fewer clusters
and lower metallicities, and form fainter, bluer nuclei. The nuclei of FCC25 and FCC1714 lie outside
of these trends. FCC 25 is ∼ 0.4 magnitudes redder than the other nuclei and could be a background
galaxy. FCC 1714 is ∼ 0.3 magnitudes bluer and could also be a background/foreground object or
a < 1 Gyr old cluster.
We ran another set of Monte Carlo simulations to predict the magnitude of each dE nucleus
in our sample of dE,N based on each galaxy’s intrinsic properties (Table 1). Again, the simulation
randomly sampled the cluster mass function and an exponential radial distribution and allowed
the clusters to orbitally decay for 5 Gyr. Any cluster with a final radius ≤ 0 was merged into the
nucleus. The velocity dispersion σ was estimated using the σ - luminosity relation for dEs (Dekel
& Silk 1987, Peterson & Caldwell 1993) and converted to circular velocity assuming vc =√
2σ.
Each galaxy’s exponential scalelength was measured from our HST WFPC2 I image (Table 1).
The initial number of clusters was estimated by correcting the present day number of clusters by
the dynamical friction destruction efficiency. The globular cluster destruction efficiency due to
dynamical friction depends on the host galaxy’s scalelength and circular velocity. dE,N with less
than 2 detected clusters were excluded due to the uncertainty in calculating the globular cluster
destruction efficiency. After 5 Gyr, ∼ 15% of globular clusters will merge into a nucleus in a vc =
– 10 –
50 km s−1, r0 = 2 kpc dE and ∼ 80% of globular clusters will merge into a nucleus in a vc = 15 km
s−1, r0 = 500 pc dE. Note that, if dynamical friction is as efficient at destroying globular clusters
as our simulations suggest, then the faintest dEs initially formed with up to ten times as many
clusters as we observe today.
Assuming nuclei form via dynamical friction, we predict a much weaker trend of nuclear mag-
nitude with galaxy magnitude than observed (bottom of Figure 7). While the fainter galaxies
generally have fewer globular clusters from which to form nuclei, they should have shorter dynam-
ical friction timescales and thus should be more efficient at destroying clusters and forming nuclei.
However, our simulation over-predicts the mass of the nuclei in most of our sample. Figure 8 plots
the predicted MV magnitude of the nucleus vs. the observed MV magnitude for each dE,N. Nuclei
which fall on or below the solid line may have formed via dynamical friction processes within 5
Gyr. Thus, even the bright nucleus of VCC1254 (MV = −12.59 ± 0.02) may have been formed
from the decayed remnants of massive globular clusters. However, many of the faint nuclei (found
primarily in the MV > −14 galaxies) are several magnitudes fainter than predicted.
Many of these faint galaxies have extremely high SN (Tables 1 and 2) and possess extended
GCS. Dynamical friction arguments would suggest that most of the clusters in these diffuse galaxies
should have merged into a single bright nucleus and the globular cluster population we observe
today is less than a third of the original population. Clearly, dynamical friction is not as effective
at destroying globular clusters and forming nuclei in the faint dEs as our simple simulations predict.
While the faint nuclei may have been formed via the orbital decay of massive globular clusters,
some mechanism seems to have minimized the dynamical decay of the GCSs in these dEs.
6. Possible mechanisms working against dynamical friction
We have detected evidence for the action of dynamical friction in the radial distribution of
the bright non-nuclear globular clusters in dE galaxies and found that the brightest nuclei are
consistent with formation via the orbital decay of massive clusters in the center of the host dE.
However, our Monte Carlo simulations of the formation of dE nuclei do not adequately reproduce
the strong observed trend of decreasing nuclear luminosity with decreasing galaxy luminosity. In
the faint dEs, some mechanism is working against dynamical friction to prevent the collapse of
the entire globular cluster system. This result is reminiscent of the observations of the Fornax
and Sagittarius dSph GCSs. Both of these MV > −14 Local Group dSph possess high specific
frequencies and extended GCSs, despite extremely short dynamical friction timescales. In this
section we consider the mechanisms which may counteract or minimize the dynamical drag on the
globular clusters in faint dE.
1) The globular clusters in the faintest dEs could be younger than their dynamical friction
timescales (≤ 5 Gyr). Many Local Group dSph possess significant numbers of intermediate age
stars (1-8 Gyr), and several “young” globular clusters (4-8 Gyr) are associated with the Sagittarius

– 11 –
and Fornax dSph (Grebel 1997, van den Bergh 2000). Combined with the existence of numerous
faint blue galaxies in the field, this suggests that many dwarf galaxies experienced a secondary
starburst between z ∼ 0.5 - 1.5. Although the dE globular clusters have colors and luminosities
similar to the 12-14 Gyr globular clusters in our Galaxy, the age-metallicity degeneracy prevents
us from constraining their ages to better than a few Gyr. However, for the Fornax dSph, where
globular cluster ages can be constrained by color magnitude diagrams, the youngest globular cluster
is still several Gyr older than its dynamical friction timescale (Oh, Lin, & Richer 2000).
2) dEs may have undergone significant mass loss due to supernovae-driven winds during the
formation of their first stars. The fractional mass lost increases with decreasing mass, thus the
smallest objects suffered the greatest mass loss (Dekel & Silk 1986). The galaxy’s globular cluster
system may have become more extended than the remaining stars as a result of the supernovae-
driven wind, and take longer to spiral inward under the influence of dynamical friction. If they
formed in the galaxy’s halo before the onset of the wind (McLaughlin 1999) or as the wind shocked
the galaxy’s outer halo (Taniguichi et al. 1999), they would initially possess a radial profile more
extended than the stellar light. The initial extent of this globular cluster halo may increase with
increasing mass loss and decreasing initial mass. However, it is difficult to see how the GCSs could
then evolve to match the exponential stellar profile at the present day.
3) The structure of the dark matter halos may be significantly different from the stellar halos.
An increase in either the dark matter density or the dark matter core radius relative to the stellar
density or core radius will increase the velocity dispersion of the dark matter and the dynamical
friction timescale of the globular clusters (Hernandez & Gilmore 1998). The M/L estimates for dEs
predict that most of the mass is in dark matter; thus the interaction with the dark matter rather
than with the stars will dominate the drag on the globular clusters. The faintest dEs may have high
dark matter densities (Dekel & Silk 1986; Peterson & Caldwell 1993) which would slow down the
orbital decay of the clusters. The Local Group dSph show a trend towards increasing mass to light
ratios with decreasing luminosity (Peterson & Caldwell 1993; Mateo 1998). Also, the distribution of
dark matter in dEs is very poorly constrained. Dwarf spirals and other LSBs for which HI rotation
curves may be measured show dark matter halos which extend several scalelengths beyond the
stellar profiles. If dEs are gas-stripped dwarf irregulars and spirals, they too should have extended
dark matter halos.
Expressing the dynamical friction time scale of Equation (3) in terms of the density (see also
Carollo 1999 for a different derivation) yields for clusters starting with the core radius the relation
tDF =1.26 × 10²
ln Λ
(
rk
2 kpc
)3 (
106M⊙
M
)(
ρ
M⊙pc−3
)1/2
Gyr, (6)
with the density given by ρ0 = 0.55 ( V0100 km s−1 )2 (1kpc
rk)2 M⊙ pc−3. Our results would imply dE
dark matter densities in excess of ∼ 1 M⊙ pc−3 or dE dark matter core radii > 2 kpc for the faintest
dE.
Modified Newtonian Dynamics (MOND) offers a possible alternative to dark-matter dominated
– 12 –
dEs. MOND has been successful at explaining the velocity rotation curves of low surface brightness
disk galaxies; dSph and dEs should also provide a strong test for MOND (McGaugh & de Blok
1998). However, a full derivation of dynamical friction taking into account the effects of MOND is
needed to determine if MOND is consistent with our results and that is beyond the scope of this
paper.
4) The clusters may be heated in such a way that counters their orbital decay via dynamical
friction. Oh, Lin & Richer (2000) recently attempted to identify possible heating mechanisms for
the Fornax dSph GCS. One possible mechanism for injecting kinetic energy into the GCS is by
scattering of the globular clusters after close encounters with massive black holes (MBH ≥ MGC).
Such scattering may also occur once a massive nucleus has formed. However, repeated encounters
are likely to destroy the clusters.
Oh et al. (2000) also examine the effects of the tidal disruption of the Fornax dSph by the
Galaxy. While the tidal forces increase the globular cluster orbital eccentricities and velocity
dispersions, the strong tidal forces can not increase the GCS kinetic energy enough to counter
the dynamical friction drag. But, if Fornax has experienced significant mass loss (50-90 %) via
tidal stripping over many internal dynamical timescales, the clusters will retain their energy in a
shallower gravitational potential well and their orbital radii will increase, countering the drag of
dynamical friction.
The dEs in our sample were selected to not be close companions of giant galaxies, for fear
that the dE globular cluster candidates would be contaminated by those of the giant companion.
However, the tidal field of the entire cluster of galaxies may play a role in heating their GCSs. Oh
& Lin (2000) model the effects of the extra-galactic tidal field of the Virgo Cluster on dE GCSs.
dEs within the inner regions of Virgo experience a relatively weak external tidal perturbation and
therefore their GCSs are able to decay under dynamical friction and coalesce into nuclei. But in the
outskirts of Virgo, dEs may be tidally disrupted and suffer significant mass loss as in the Fornax
dSph simulation. Less massive galaxies are more likely to be disrupted and thus less likely to form
nuclei.
7. Conclusions
We have examined high resolution HST WFPC2 V and I images of dE galaxies for evidence
of dynamical friction in their globular cluster systems and nuclear properties. We find that, within
the inner few scalelengths, our sample appears to be depleted of bright clusters, but there are no
other observable effects on the summed profile. Monte Carlo simulations of the evolution of dE
globular cluster systems show that the brighter nuclei may have formed via orbital decay into the
galaxy’s core. However, the observed trend of fainter nuclei in fainter galaxies is much stronger
than expected if the nuclei form via simple dynamical friction processes. In these galaxies, some
mechanism must be working against the orbital decay of the globular clusters. Mass loss via
– 13 –
supernova-driven winds, high dark matter densities and/or large dark matter cores, the formation
of new star clusters, and tidal stripping may all conspire together to counteract the dynamical drag
on the faintest dE GCSs and inhibit the formation of bright nuclei. We will obtain Cycle 9 HST
WFPC2 observations of ∼ 30 brighter dEs with larger GCS to improve our statistics.
We wish to thank Rosie Wyse and Brad Whitmore for useful discussions about dynamical
friction and globular cluster detection. We also thank our referee, Tad Pryor, for his very con-
structive and helpful comments. Support for this work was provided by NASA through grants
GO-06352.01-95A and GO-07377-01-96A from the Space Telescope Science Institute, which is op-
erated by the Association of Universities for Research in Astronomy, Incorporated, under NASA
contracted NAS5-26555.
REFERENCES
Aaronson, M. 1983, ApJ, 266, L11
Barnes, J. & Hernquist, L. 1992, Nature, 360, 715
Bender, R. & Nieto, J.L. 1990, A&A, 239, 97
Binggeli, B. & Cameron, L.M. 1991, A&A, 252, 27
Binggeli, B., Sandage, A., & Tammann, G.A. 1985, AJ, 90, 1681
Binney, J. & Tremaine, S. 1987, Galactic Dynamics, (Princeton: Princeton University Press)
Bothun, G. D. & Mould, J. R. 1988, ApJ, 324, 123
Buonanno, R., Corsi, C.E., Castellani, M., Marconi, G., Fusi Pecci, F., & Zinn, R. 1999, AJ, 118,
1671
Burkert, A. 1995, ApJ, 447, L25
Caldwell, N. & Bothun, G. D. 1987, AJ 94:1126.
Carollo, C. M. 1999, ApJ, 523, 566
Chandrasekhar, S. 1943, ApJ, 97, 255
Davies, J. I. & Phillips, S. 1988, MNRAS 233:553.
Dekel, A. & Silk, J. 1986, ApJ, 303, 39
Dominguez-Tenreiro, R. & Gomez-Flechoso, M.A. 1998, MNRAS, 294, 465
Durrell, P. R., Harris, W.E., Geisler, D., Pudritz, R.E. 1996, AJ, 112, 972
Fall, S.M. & Rees, M.J. 1977, MNRAS, 181, 37
Ferguson, H.C. & Sandage, A. 1988, AJ, 96, 1520
Ferguson, H.C., & Sandage, A. 1989, ApJ, 346, L53
Fusi Pecci, F., Bellazzini, M., Cacciari, C., & Ferraro, F.R. 1995, AJ, 110, 1664

– 14 –
Grebel, E. 1997, Rev. Mod. Astron., 10, 29
Harris, W. 1991, ARAA, 29, 543
Hernandez, X. & Gilmore, G., 1998, MNRAS, 297, 517
Hunsberger, S.D., Charlton, J. & Zaritsky, D. 1996, ApJ, 462, 50
James, P.A. 1994, MNRAS, 269, 176
King, I. 1966, AJ, 71, 64
Mateo, M. 1998 ARAA, 36, 435
McGaugh, S.S. , & de Blok, W.J.G. 1998, ApJ, 499, 66
McLaughlin, D. 1999, ApJ, 117, 2398
Miller, B.W., Lotz, J.M., Ferguson, H.C., Stiavelli, M., & Whitmore, B.C. 1998, ApJ, 508, L133
Miller, B.W., et al. 2001, in prep.
Minniti, D., Meylan, G., & Kissler-Patig, M. 1996, A&A, 312, 49
Mirabel, I.F., Dottori, H., & Lutz, D. 1992, A&A, 256L, 19
Montegriffo, P., Bellazzini, M., Ferraro, F.R., Martins, D., Sarajedini, A., & Fusi Pecci, F. 1998,
MNRAS, 294, 315
Moore, B., Lake, G., & Katz, N. 1998, ApJ, 495, 139
Murali, C., & Weinberg, M. D. 1997, MNRAS, 288, 767
Oh, K.S., Lin, D.N.C., & Richer, H.B. 2000, ApJ, 531, 727
Oh, K.S., & Lin, D.N.C. 2000, ApJ, 543, 620.
Peterson, R.C., & Caldwell, N. 1993, AJ, 105, 1411
Pryor, C. & Kormendy, J. 1990, AJ, 100, 127
Sandage, A., Binggeli, B., & Tammann G.A. 1985, AJ, 90, 1759
Schweizer, F., Miller, B.W., Whitmore, B., Fall, S.M., 1996, AJ, 112, 1839
Taniguchi, Y., Trentham, N., & Ikeuchi, S. 1999, ApJ, 526, L13
Thuan, T.X. 1985, ApJ, 299 881
Tremaine, S.D., Ostriker, J.P., & Spitzer, L. 1975, ApJ, 196, 407
Tremaine, S. & Weinberg, M. 1984, MNRAS, 209, 729
van den Bergh, S. 1995, AJ, 110, 2700
van den Bergh, S. 2000, ApJ, 530, 777
Vesperini, E. 1998, MNRAS, 287, 917
Whitmore, B.C. & Schweizer, F. 1995, AJ, 109, 960

– 15 –
Whitmore, B.C., Schweizer, F., Leitherer, C., Borne, K., & Robert, C. 1993, AJ, 106, 1354
This preprint was prepared with the AAS LATEX macros v5.0.

– 16 –
Table 1. Nucleated Dwarf Elliptical Galaxies 1
Galaxy Type MB2 MV Cycle MV nuc V-Inuc r0(′′) r0(kpc) Ngc SN
3
VCC1073 dE3,N -17.0 -17.4 6 -11.62 ± 0.03 1.08 ± 0.04 8.6 ± 0.5 0.71 ± 0.04 18.8 ± 6.2 2.1 ± 0.7
FCC136 dE2,N -16.6 -17.2 6 -11.50 ± 0.03 1.07 ± 0.04 8.4 ± 1.3 0.77 ± 0.12 20.1 ± 5.6 2.7 ± 0.8
VCC1876 dE5,N -16.3 -16.6 6 -10.74 ± 0.03 1.00 ± 0.04 10.5 ± 0.3 0.86 ± 0.03 24.7 ± 6.8 5.5 ± 1.6
VCC1254 dE0,N -16.2 -16.5 6 -12.59 ± 0.02 1.04 ± 0.04 7.7 ± 0.2 0.63 ± 0.02 24.6 ± 8.2 6.2 ± 2.2
FCC324 dS01(8) -16.1 -16.4 6 -8.95 ± 0.04 0.91 ± 0.06 13.9 ± 0.3 1.30 ± 0.04 12.0 ± 4.8 3.3 ± 1.4
FCC150 dE4,N -15.7 -16.2 6 -11.11 ± 0.03 1.05 ± 0.04 5.5 ± 0.3 0.51 ± 0.03 7.4 ± 4.2 2.4 ± 1.4
VCC452 dE4,N -15.4 -15.8 6 -8.85 ± 0.04 0.94 ± 0.06 7.8 ± 0.4 0.64 ± 0.04 11.4 ± 5.8 5.3 ± 2.7
FCC316 dE3,N -15.1 -15.2 6 -9.62 ± 0.03 1.08 ± 0.05 8.2 ± 0.3 0.75 ± 0.03 17.8 ± 5.7 14.6 ± 4.9
FCC174 dE1,N -14.7 -15.3 6 -9.90 ± 0.03 0.93 ± 0.05 4.9 ± 0.5 0.45 ± 0.05 9.8 ± 3.8 7.2 ± 2.9
VCC503 dE3,N -14.4 -14.5 6 -9.43 ± 0.03 0.89 ± 0.05 6.3 ± 0.4 0.52 ± 0.03 1.7 ± 3.6 2.8 ± 6.0
FCC254 dE0,N -13.8 -14.7 6 -10.70 ± 0.03 0.92 ± 0.04 10.5 ± 0.5 0.97 ± 0.05 5.7 ± 4.1 7.7 ± 5.7
FCC25 dE0,N -13.7 · · · 7 -9.80 ± 0.03 1.37 ± 0.04 6.1 ± 0.3 0.57 ± 0.03 5.2 ± 3.7 8.2 ± 5.8
VCC896 dE3,N -13.4 · · · 7 -8.60 ± 0.04 1.01 ± 0.09 8.8 ± 0.6 0.75 ± 0.05 5.8 ± 3.9 12.0 ± 8.1
LGC50 dE,N -13.3 -14.0 6 -8.90 ± 0.03 0.82 ± 0.05 10.2 ± 0.4 0.54 ± 0.02 5.5 ± 3.1 13.9 ± 9.2
VCC240 dE2,N -13.0 -13.9 6 -9.89 ± 0.03 0.91 ± 0.04 9.5 ± 1.0 0.78 ± 0.08 8.6 ± 4.1 23.6 ± 14.
VCC529 dE4,N -13.0 · · · 7 -9.85 ± 0.03 0.92 ± 0.04 6.6 ± 0.5 0.56 ± 0.05 3.5 ± 3.6 10.4 ± 10.9
VCC1530 dE2,N -12.9 · · · 7 -9.90 ± 0.03 0.88 ± 0.04 5.9 ± 0.3 0.50 ± 0.03 7.5 ± 4.2 28.6 ± 13.5
VCC1783 dE5,N -12.8 · · · 7 -9.15 ± 0.03 0.95 ± 0.05 11.6 ± 0.4 0.95 ± 0.03 0 ± 3.5 0 ± 13.9
VCC1714 dE4,N -12.7 · · · 7 -12.03 ± 0.02 0.58 ± 0.03 12.0 ± 0.8 1.02 ± 0.07 0.6 ± 3.4 2.3 ± 13.5
VCC1272 dE1,N -12.7 · · · 7 -7.84 ± 0.06 0.87 ± 0.09 4.2 ± 0.4 0.35 ± 0.04 1.7 ± 3.5 6.9 ± 14.1
FCC238 dE5,N -12.7 · · · 7 -9.27 ± 0.05 0.91 ± 0.04 7.0 ± 0.7 0.65 ± 0.07 2.3 ± 2.0 9.2 ± 8.0
FCC189 dE4,N -12.6 · · · 7 -9.12 ± 0.03 0.83 ± 0.05 2.4 ± 0.3 0.22 ± 0.03 1.2 ± 3.3 5.5 ± 15.9
VCC1252 dE0,N -12.4 · · · 7 -9.21 ± 0.03 0.90 ± 0.05 4.7 ± 0.5 0.39 ± 0.04 6.3 ± 3.8 33.2 ± 20.0
VCC1363 dE3,N -12.2 · · · 7 -8.98 ± 0.03 0.93 ± 0.05 3.7 ± 0.2 0.30 ± 0.02 0 ± 2.2 0 ± 15.2
VCC1077 dE0,N -12.0 · · · 7 -8.69 ± 0.04 0.94 ± 0.06 3.3 ± 0.3 0.28 ± 0.03 1.2 ± 3.9 8.7 ± 29.4
FCC59 dE0,N -12.0 · · · 7 -8.69 ± 0.04 0.85 ± 0.06 11.0 ± 2.2 1.02 ± 0.20 0 ± 3.1 0 ± 25.8
FCC146 dE4,N -11.9 · · · 7 -8.06 ± 0.05 1.04 ± 0.08 3.3 ± 0.4 0.31 ± 0.04 1.7 ± 2.9 15.7 ± 26.6
1 Cycle 6 data also presented in Miller et al. 1998.
2 from Ferguson & Sandage 1990
3SN = Ngc × 100.4(MV +15.0), MV assumed to be MB − 0.8 where MV not measured.
– 17 –
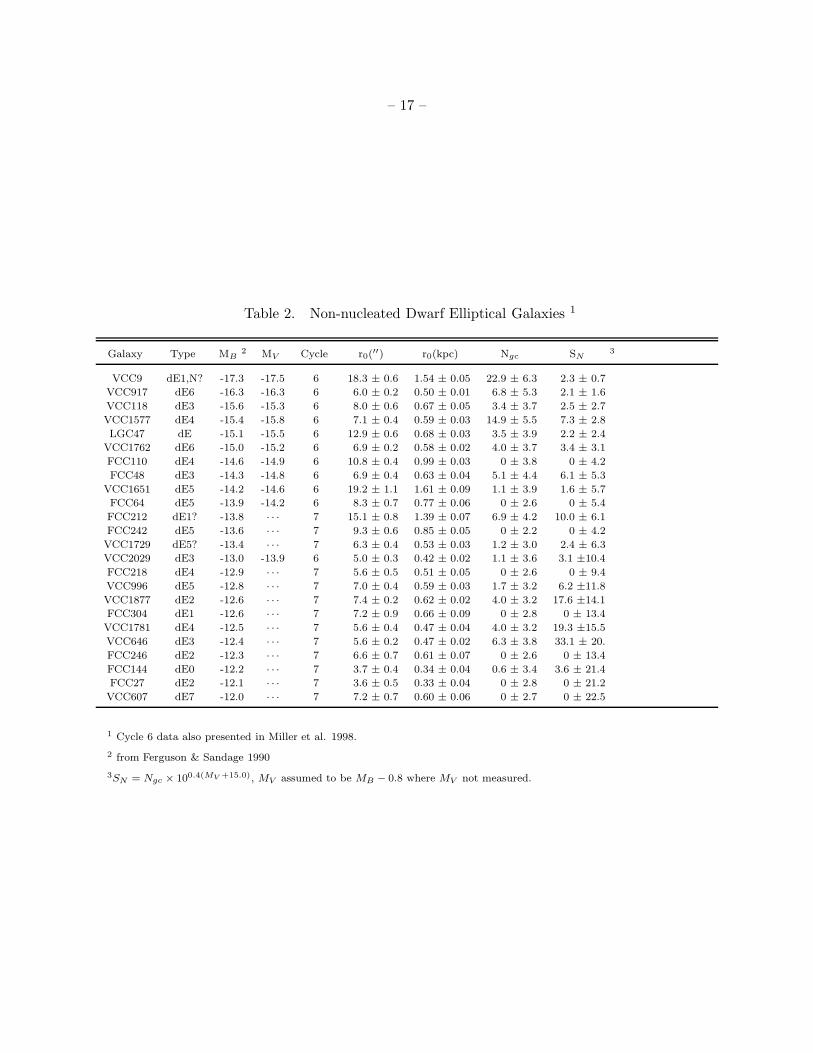
Table 2. Non-nucleated Dwarf Elliptical Galaxies 1
Galaxy Type MB2 MV Cycle r0(′′) r0(kpc) Ngc SN
3
VCC9 dE1,N? -17.3 -17.5 6 18.3 ± 0.6 1.54 ± 0.05 22.9 ± 6.3 2.3 ± 0.7
VCC917 dE6 -16.3 -16.3 6 6.0 ± 0.2 0.50 ± 0.01 6.8 ± 5.3 2.1 ± 1.6
VCC118 dE3 -15.6 -15.3 6 8.0 ± 0.6 0.67 ± 0.05 3.4 ± 3.7 2.5 ± 2.7
VCC1577 dE4 -15.4 -15.8 6 7.1 ± 0.4 0.59 ± 0.03 14.9 ± 5.5 7.3 ± 2.8
LGC47 dE -15.1 -15.5 6 12.9 ± 0.6 0.68 ± 0.03 3.5 ± 3.9 2.2 ± 2.4
VCC1762 dE6 -15.0 -15.2 6 6.9 ± 0.2 0.58 ± 0.02 4.0 ± 3.7 3.4 ± 3.1
FCC110 dE4 -14.6 -14.9 6 10.8 ± 0.4 0.99 ± 0.03 0 ± 3.8 0 ± 4.2
FCC48 dE3 -14.3 -14.8 6 6.9 ± 0.4 0.63 ± 0.04 5.1 ± 4.4 6.1 ± 5.3
VCC1651 dE5 -14.2 -14.6 6 19.2 ± 1.1 1.61 ± 0.09 1.1 ± 3.9 1.6 ± 5.7
FCC64 dE5 -13.9 -14.2 6 8.3 ± 0.7 0.77 ± 0.06 0 ± 2.6 0 ± 5.4
FCC212 dE1? -13.8 · · · 7 15.1 ± 0.8 1.39 ± 0.07 6.9 ± 4.2 10.0 ± 6.1
FCC242 dE5 -13.6 · · · 7 9.3 ± 0.6 0.85 ± 0.05 0 ± 2.2 0 ± 4.2
VCC1729 dE5? -13.4 · · · 7 6.3 ± 0.4 0.53 ± 0.03 1.2 ± 3.0 2.4 ± 6.3
VCC2029 dE3 -13.0 -13.9 6 5.0 ± 0.3 0.42 ± 0.02 1.1 ± 3.6 3.1 ±10.4
FCC218 dE4 -12.9 · · · 7 5.6 ± 0.5 0.51 ± 0.05 0 ± 2.6 0 ± 9.4
VCC996 dE5 -12.8 · · · 7 7.0 ± 0.4 0.59 ± 0.03 1.7 ± 3.2 6.2 ±11.8
VCC1877 dE2 -12.6 · · · 7 7.4 ± 0.2 0.62 ± 0.02 4.0 ± 3.2 17.6 ±14.1
FCC304 dE1 -12.6 · · · 7 7.2 ± 0.9 0.66 ± 0.09 0 ± 2.8 0 ± 13.4
VCC1781 dE4 -12.5 · · · 7 5.6 ± 0.4 0.47 ± 0.04 4.0 ± 3.2 19.3 ±15.5
VCC646 dE3 -12.4 · · · 7 5.6 ± 0.2 0.47 ± 0.02 6.3 ± 3.8 33.1 ± 20.
FCC246 dE2 -12.3 · · · 7 6.6 ± 0.7 0.61 ± 0.07 0 ± 2.6 0 ± 13.4
FCC144 dE0 -12.2 · · · 7 3.7 ± 0.4 0.34 ± 0.04 0.6 ± 3.4 3.6 ± 21.4
FCC27 dE2 -12.1 · · · 7 3.6 ± 0.5 0.33 ± 0.04 0 ± 2.8 0 ± 21.2
VCC607 dE7 -12.0 · · · 7 7.2 ± 0.7 0.60 ± 0.06 0 ± 2.7 0 ± 22.5
1 Cycle 6 data also presented in Miller et al. 1998.
2 from Ferguson & Sandage 1990
3SN = Ngc × 100.4(MV +15.0), MV assumed to be MB − 0.8 where MV not measured.

– 18 –
Fig. 1.— Completeness of the globular cluster detection as a function of globular cluster luminosity
and distance from host galaxy center for a V = 15.2, r0 = 15 ′′ dE (MV = -16.0 at the distance of
Virgo).

– 19 –
Fig. 2.— The dynamical friction timescale for dwarf-sized isothermal and King halos as a function
of circular velocity.

– 20 –
Fig. 3.— The evolution of the entire (solid lines) and bright (MV < −8) (dashed lines) globular
cluster radial profiles under the influence of dynamical friction in an isothermal halo after 0 (top
line), 5 (middle), and 10 (bottom) Gyr.

– 21 –
Fig. 4.— The luminosity distribution of Fornax and Virgo dE globular cluster candidates (solid
line) and background objects (dashed line) for which 0.5 < (V −I) < 1.5 and FWHM < 2.5 pixels.
– 22 –
Fig. 5.— The summed radial distribution of the globular cluster candidates, corrected for back-
ground contamination, scaled by scalelength of galaxy, and excluding possible nuclei. The total
globular cluster surface density (upper panel) follows the exponential light profile of the dEs (dotted
line), but the bright clusters (MV < −8.0, lower panel) appear to be depleted and have a shallower
profile (dashed line). The open boxes in the top panel show the summed profile prior to correction
for incompleteness effects in the inner regions. The error bars are√
(Ngc)2 + (Nbackground)2/area.

– 23 –
Fig. 6.— MV vs. V − I for the dE nuclei. Most nuclei have colors similar to old metal-poor
Galactic globular clusters and have a slight trend towards redder colors with increasing luminosity.
The nucleus of FCC25 is ∼ 0.4 magnitude redder than the rest of the nuclei and could be a
background galaxy. The nucleus of VCC1714 is ∼ 0.3 magnitudes bluer than the rest of the nuclei
and is consistent with an age < 1 Gyr.

– 24 –
Fig. 7.— MV of dE nuclei vs. MB of host galaxy. Fainter galaxies tend to have fainter nuclei
(top). Our simulation of dE nucleus formation (bottom) predicts a much weaker trend of nuclear
luminosity with host galaxy luminosity.
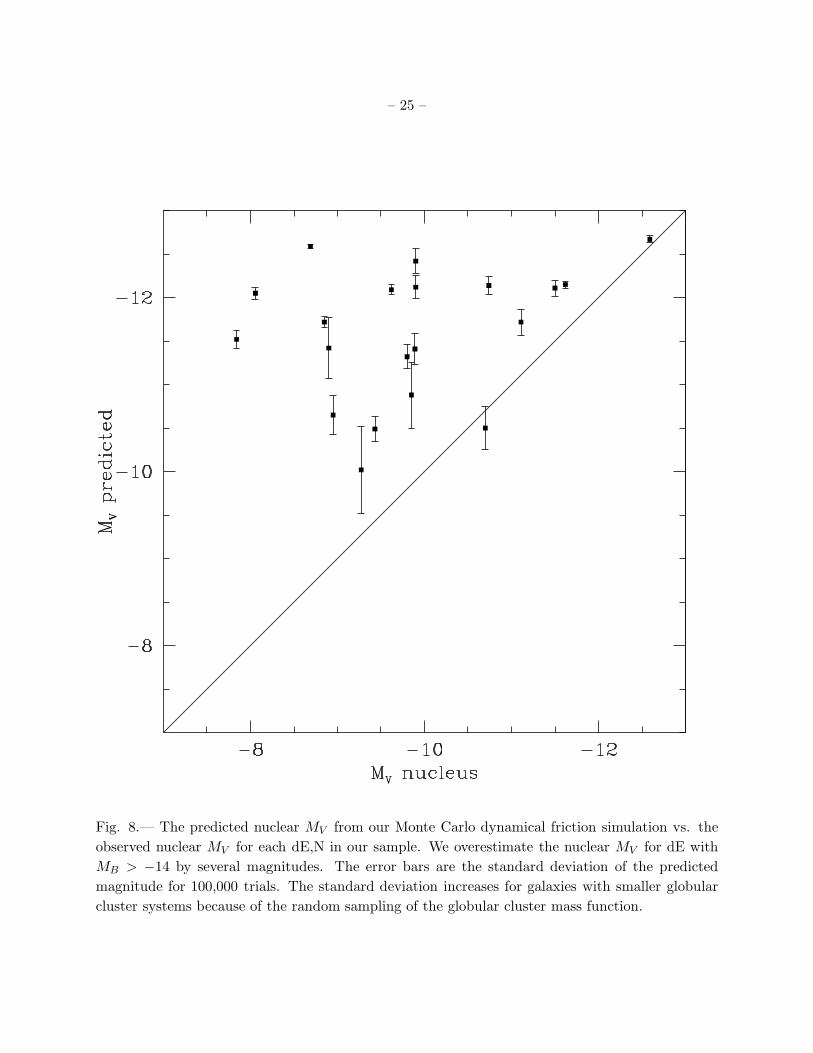
– 25 –
Fig. 8.— The predicted nuclear MV from our Monte Carlo dynamical friction simulation vs. the
observed nuclear MV for each dE,N in our sample. We overestimate the nuclear MV for dE with
MB > −14 by several magnitudes. The error bars are the standard deviation of the predicted
magnitude for 100,000 trials. The standard deviation increases for galaxies with smaller globular
cluster systems because of the random sampling of the globular cluster mass function.