A homogeneous set of globular cluster relative distances and reddenings
12
arXiv:astro-ph/0408462v1 25 Aug 2004 Astronomy & Astrophysics manuscript no. Recio-Blanco January 22, 2014 (DOI: will be inserted by hand later) A Homogenous Set of Globular Cluster Relative Distances and Reddenings ⋆ A. Recio-Blanco 1 , G. Piotto 1 , F. De Angeli 1 , S. Cassisi 2,3 , M. Riello 1,4 , M. Salaris 5 , A. Pietrinferni 2 , M. Zoccali 6 , and A. Aparicio 3 1 Dipartimento di Astronomia, Universit` a di Padova, Vicolo dell’Osservatorio 2, I-35122 Padova, Italy e-mail: recio,piotto,deangeli,[email protected] 2 INAF, Osservatorio Astronomico di Collurania, Via M. Maggini, 64100, Teramo, Italy e-mail: cassisi,[email protected] 3 Instituto de Astrof´ ısica de Canarias, Via La´ ctea s/n, 382002 La Laguna Tenerife, Spain e-mail: [email protected] 4 ESO, Karl-Schwarschild-Str. 2, D-85748 Garching bei M¨ unchen, Germany 5 Astrophysics Research Institute, Liverpool John Moores University, Twelve Quays House, Birkenhead, CH41 1LD, UK [email protected] 6 Departamento de Astronomia, P. Universidad Catolica, Av. Vicuna Mackenna 4860, 7832-0436 Macul, Santiago - Chile e-mail: [email protected] Received ...; accepted ... Abstract. We present distance modulus and reddening determinations for 72 Galactic globular clusters from the homogeneous photometric database of Piotto et al. (2002), calibrated to the HST flight F439W and F555W bands. The distances have been determined by comparison with theoretical absolute magnitudes of the ZAHB. For low and intermediate metallicity clusters, we have estimated the apparent Zero Age Horizontal Branch (ZAHB) magnitude from the RR Lyrae level. For metal rich clusters, the ZAHB magnitude was obtained from the fainter envelope of the red HB. Reddenings have been estimated by comparison of the HST colour-magnitude diagrams (CMD) with ground CMDs of low reddening template clusters. The homogeneity of both the photometric data and the adopted methodological approach allowed us to obtain highly accurate relative cluster distances and reddenings. Our results are also compared with recent compilations in the literature. Key words. globular clusters: general — stars: horizontal-branch — stars: distances 1. Introduction Galactic Globular Clusters (GGCs) are extremely useful astro- nomical probes. Because they are the oldest objects for which we can estimate the age, GGCs are commonly used to infer relevant information on both the Galaxy formation timescale and the early Universe. Moreover, they constitute a well suited laboratory to study both the evolution of low-mass stars, and stellar dynamics. Two key parameters needed in GGC studies are their distances and reddenings. As an example, the use of the absolute magnitude of turnoff stars in the cluster colour- magnitude-diagram (CMD) to determine the cluster age (see, e.g. Vandenberg, Stetson & Bolte 1996; Salaris & Weiss 1998, and references therein) needs an accurate distance estimate. Send offprint requests to: A. Recio-Blanco. New address: Observatoire de la Cote d’Azur (France). e-mail: [email protected] ⋆ Based on observations with the Hubble Space Telescope Also, the comparison between various observed features of their CMDs (e.g., the absolute magnitude of the luminosity function red giant branch bump, or the level of the tip of the red giant branch) and the theoretical counterparts does require a preliminar knowledge of both the cluster reddening and the distance. A definitive assessment of both the absolute and relative GGC distance scale is still lacking, mostly due to the fact that the ’traditional’ Population II standard candle, e.g. the bright- ness of RR Lyrae pulsating stars, is not yet reliably calibrated empirically (e.g. Cacciari 2003). This is partially due to the paucity of RR Lyrae stars in the solar neighbourhood, and the consequent large errors in RR Lyrae parallax determina- tions, even for the recent Hipparcos data (Groenewegen & Salaris 1999), and also to the existence of significant systematic and random uncertainties in other less direct methods applied to determine the RR Lyrae intrinsic brightness (Bono 2003). The advent of Hipparcos parallaxes has on the other hand improved the accuracy of the GGC distance determination
-
Upload
independent -
Category
Documents
-
view
0 -
download
0
Transcript of A homogeneous set of globular cluster relative distances and reddenings
arX
iv:a
stro
-ph/
0408
462v
1 2
5 A
ug 2
004
Astronomy & Astrophysicsmanuscript no. Recio-Blanco January 22, 2014(DOI: will be inserted by hand later)
A Homogenous Set of Globular Cluster Relative Distances andReddenings ⋆
A. Recio-Blanco1, G. Piotto1, F. De Angeli1, S. Cassisi2,3, M. Riello1,4, M. Salaris5, A. Pietrinferni2, M. Zoccali6,and A. Aparicio3
1 Dipartimento di Astronomia, Universita di Padova, Vicolodell’Osservatorio 2, I-35122 Padova, Italye-mail:recio,piotto,deangeli,[email protected]
2 INAF, Osservatorio Astronomico di Collurania, Via M. Maggini, 64100, Teramo, Italye-mail:cassisi,[email protected]
3 Instituto de Astrofısica de Canarias, Via Lactea s/n, 382002 La Laguna Tenerife, Spaine-mail:[email protected]
4 ESO, Karl-Schwarschild-Str. 2, D-85748 Garching bei Munchen, Germany
5 Astrophysics Research Institute, Liverpool John Moores University, Twelve Quays House, Birkenhead, CH41 1LD, [email protected]
6 Departamento de Astronomia, P. Universidad Catolica, Av. Vicuna Mackenna 4860, 7832-0436 Macul, Santiago - Chilee-mail:[email protected]
Received ...; accepted ...
Abstract. We present distance modulus and reddening determinations for 72 Galactic globular clusters from the homogeneousphotometric database of Piotto et al. (2002), calibrated tothe HST flightF439W andF555W bands. The distances have beendetermined by comparison with theoretical absolute magnitudes of the ZAHB. For low and intermediate metallicity clusters, wehave estimated the apparent Zero Age Horizontal Branch (ZAHB) magnitude from the RR Lyrae level. For metal rich clusters,the ZAHB magnitude was obtained from the fainter envelope ofthe red HB. Reddenings have been estimated by comparison ofthe HST colour-magnitude diagrams (CMD) with ground CMDs oflow reddening template clusters. The homogeneity of boththe photometric data and the adopted methodological approach allowed us to obtain highly accurate relative cluster distancesand reddenings. Our results are also compared with recent compilations in the literature.
Key words. globular clusters: general — stars: horizontal-branch — stars: distances
1. Introduction
Galactic Globular Clusters (GGCs) are extremely useful astro-nomical probes. Because they are the oldest objects for whichwe can estimate the age, GGCs are commonly used to inferrelevant information on both the Galaxy formation timescaleand the early Universe. Moreover, they constitute a well suitedlaboratory to study both the evolution of low-mass stars, andstellar dynamics.
Two key parameters needed in GGC studies are theirdistances and reddenings. As an example, the use of theabsolute magnitude of turnoff stars in the cluster colour-magnitude-diagram (CMD) to determine the cluster age (see,e.g. Vandenberg, Stetson & Bolte 1996; Salaris & Weiss 1998,and references therein) needs an accurate distance estimate.
Send offprint requests to: A. Recio-Blanco.New address: Observatoire de la Cote d’Azur (France). e-mail:[email protected]⋆ Based on observations with the Hubble Space Telescope
Also, the comparison between various observed features oftheir CMDs (e.g., the absolute magnitude of the luminosityfunction red giant branch bump, or the level of the tip of thered giant branch) and the theoretical counterparts does requirea preliminar knowledge of both the cluster reddening and thedistance.
A definitive assessment of both the absolute and relativeGGC distance scale is still lacking, mostly due to the fact thatthe ’traditional’ Population II standard candle, e.g. the bright-ness of RR Lyrae pulsating stars, is not yet reliably calibratedempirically (e.g. Cacciari 2003). This is partially due to thepaucity of RR Lyrae stars in the solar neighbourhood, andthe consequent large errors in RR Lyrae parallax determina-tions, even for the recentHipparcos data (Groenewegen &Salaris 1999), and also to the existence of significant systematicand random uncertainties in other less direct methods appliedto determine the RR Lyrae intrinsic brightness (Bono 2003).
The advent ofHipparcos parallaxes has on the other handimproved the accuracy of the GGC distance determination
2 Recio-Blanco et al.: Globular cluster distances with HST photometry
by the subdwarf Main Sequence (MS) fitting technique (e.g..Carretta et al. 2000). The problem here is that this method canbe reliably applied only to a handful of low reddening clusters,with deep and well calibrated high accuracy MS photometry; inaddition, current uncertainties on the metallicity scale of bothclusters and subdwarfs, and on the cluster reddenings may stillcause sizable uncertainties on the distances derived by meansof this method (compare, e.g., the results by Carretta et al.2000with Reid 1997, 1998).
In order to assess the accuracy and reliability of the var-ious methods used to infer GGC distances, it is important tocompare the distance measurements obtained with as many aspossible different and independent distance indicators, such asthe aforementioned empirical MS fitting, the RR Lyrae method,and the fitting of theoretical Horizontal Branch (HB) modelstotheir observational counterpart. This kind of comparison is rel-evant not only for checking the consistency between the variousdistance indicators, but also for verifying the reliability of theadopted, if any, theoretical scenario, as in the case of distancesbased on the fit to HB models. On this respect, we note thata database ofrelative distances and reddenings is of extremeimportance: once we have accurate absolute distances and red-denings for a set of GGCs, this database can be easily used toobtain the absolute values for all the other clusters.
In the last decade, we have been working on a long-termproject aimed at carrying out a detailed quantitative analysis ofthe various evolutionary sequences in the CMD of GGCs. Ourmain goals include the derivation of an accurate GGC relativeage scale (Rosenberg et al. 1999, Piotto et al. 2000), and a testof the accuracy of theoretical models for low-mass metal-poorstars. The main body of this investigation has been performedby adopting an homogeneous and self-consistent photometricdataset (available at http://dipastro.pd.astro.it/globulars), basedon both ground based observations (Rosenberg et al 2000a,2000b), and Hubble Space Telescope data (the HST snap-shot catalogue: Piotto et al. 2002). This large observationaldatabase has also been used to investigate the level of agree-ment between theory and observations concerning evolution-ary timescales (Zoccali and Piotto 2000), the brightness andsize of the luminosity function Red Giant Branch (RGB) bump(Zoccali et al. 1999; Bono et al. 2001; Riello et al. 2003), themixing length parameter (Palmieri et al. 2002), the initialhe-lium content (Zoccali et al. 2000; Cassisi et al. 2003; Salariset al. 2004), the HB morphology (Piotto et al. 1999), the bluestraggler stellar population (Piotto et al. 2004). The majority ofthese works needed an as accurate as possible distance and red-dening determination, and in most cases we used a new set ofdistances and reddenings, based on our photometrically homo-geneous HST snapshot database. In this paper we present andthoroughly discuss how we obtained the distances and redden-ings adopted in the works above mentioned.
Distance estimates have been obtained from the fitting oftheoretical HB models to the observed counterpart in the CMD.We accurately measured the observed HB luminosity level and,in turn, the distance modulus, for about 40% of the total GGCpopulation, covering most of the GGC metallicity range. Ourrelative distances and reddenings are more accurate than pre-vious compilations, becausethey are based on a homogeneous
photometric database, and have been derived by applying con-sistently the same technique to all clusters. Moreover, the theo-retical HB models we employed (Pietrinferni et al. 2004) havebeen computed accounting for the most updated input physics.
The plan of the paper is as follows: in Section 2, we de-scribe briefly the photometric database and the theoreticalmod-els. Section 3 presents the actual measurements and the valuesof the distance moduli. We compare our distance estimates withrelevant data available in the literature in Section 4 and, finally,the main conclusions are summarized in Section 5.
2. The observational and theoretical databases
2.1. The cluster database
The distance determinations presented here are based on thelarge photometric data set from Piotto et al. (2002), observedwith HST in theF439W andF555W bands, calibrated to theWFPC2 flight system. The complete database includes a totalof 74 GGCs, and represents an unique opportunity to measurefundamental parameters of GGCs.
The observations, preprocessing, photometric reduction,and calibration of the instrumental magnitudes to the HSTflight system, as well as the artificial star experiments per-formed to derive the star count completeness, are reported infull details in Piotto et al. (2002). For the purpose of this paper,we point out that all the data have been processed following thesame reduction steps: after the pre-processing, the instrumen-tal photometry for each cluster was obtained with DAOPHOTII /ALLFRAME (Stetson, 1987; Stetson, 1994), the correctionfor the CTE effect and the calibration to the flight system wasaccomplished following the prescriptions by Dolphin (2000).
2.2. The GGCs metallicity scale
One of the pivotal problems in estimating both distancesand ages for GGCs is the adopted metallicity scale. As re-cently stated by Rutledge, Hesser & Stetson (1997, see alsoVandenBerg 2000; Caputo & Cassisi 2002 and Kraft & Ivans2003) current estimates of the [Fe/H] values for GGCs are af-fected by an uncertainty of the order of at least 0.15 dex. Thesituation becomes even more uncertain when we consider theα−element enhancement in GGC stars: the measurements ofα−elements are affected by both random and systematic uncer-tainties, they have been obtained in an heterogeneous way, andonly for a very limited number of GGCs.
In order to properly account for these unavoidable draw-backs we decided, as in our previous works, to adopt the twomost widely used scales for the metal abundance in GGCs: theZinn & West (1984) scale (hereinafter ZW), and the Carretta& Gratton (1997, hereinafter CG) one. As for theα−elementenhancement, due to the lack of self-consistent and accuratemeasurements for a sizeable sample of GGCs, we adopt the fol-lowing assumption: a mean [α/Fe]=0.3 dex for metal-poor andmetal-intermediate clusters ([Fe/H] < −1.0), and [α/Fe]=0.2dex for metal-rich clusters ([Fe/H] ≥ −1.0). The choice ofthe former value is based on the estimates provided by Carney(1996), while the latter is obtained as a mean between the

Recio-Blanco et al.: Globular cluster distances with HST photometry 3
values collected by Carney (1996) and by Salaris & Cassisi(1996).
In order to estimate the global cluster metallicity byaccounting for the proper [Fe/H] value, and the chosenα−element enhancement, we have adopted the prescriptionsprovided by Salaris, Chieffi & Straniero (1993), i.e.:
[M /H] = [Fe/H] + log(0.638f + 0.362) ; logf = [α/Fe]
We assume an uncertainty of the order of± 0.15 dex on[M /H], which accounts for the uncertainties on both [Fe/H]and [α/Fe] measurements (Rutledge et al. 1997).
2.3. The theoretical framework
The theoretical predictions adopted in this investigationarebased on the updated set of stellar models by Pietrinferni etal. (2004), and we refer the interested reader to that paperfor a complete discussion about these models1. For the pur-poses of this paper, we briefly list the main changes in theadopted physical inputs with respect to previous works (Cassisi& Salaris 1997):
– the radiative opacity is obtained from the OPAL tables(Iglesias & Rogers 1996) for temperatures larger than 104
K, and from Alexander & Ferguson (1994) for lower tem-peratures. Conductive opacity for electron degenerate mat-ter is computed following Potekhin (1999).
– We updated the energy loss rates for plasma-neutrino pro-cesses by using the most recent and accurate results pro-vided by Haft, Raffelt & Weiss (1994). For all other pro-cesses we still rely on the same prescriptions adopted byCassisi & Salaris (1997).
– The nuclear reaction rates have been updated by using theNACRE database (Angulo et al. 1999), with the excep-tion of the12C(α, γ)16O reaction. For this reaction we nowadopt the more accurate recent determination by Kunz etal. (2002).
– The accurate Equation of State (EOS) by A. Irwin has beenused. An exhaustive description of this EOS is still in prepa-ration (Irwin et al. 2004) but a brief discussion of its maincharacteristics can be found in Cassisi, Salaris & Irwin(2003). It is enough to mention here that this EOS, whoseaccuracy and reliability is similar to the OPAL EOS de-veloped at the Livermore Laboratories (Rogers, Swenson& Iglesias 1996) and recently updated in the treatment ofsome physical inputs (Rogers & Nayfonov 2002), allows usto compute self-consistent stellar models in all evolutionaryphases relevant to present investigation.
– The extension of the convective zones is fixed by means ofthe classical Schwarzschild criterion. Induced overshootingand semiconvection during the He-central burning phaseare accounted for following Castellani et al. (1985). Thethermal gradient in the superadiabatic regions is determined
1 All the theoretical models adopted in present work as well asamore extended set of evolutionary results and isochrones can be foundat the URL site: http://www.te.astro.it/BASTI/index.php.
according to the mixing length theory, whose free param-eter has been calibrated by computing a solar standardmodel.
– The set of evolutionary models has been computed formetallicities in the range: 0.0001 ≤ Z ≤ 0.04. However,in the present work only the models for metallicityequal or lower than the solar one have been used. Weadopt the scaled-solar heavy element mixture (Grevesse &Noels 1993).
– As far as the initial He-abundance is concerned, we adoptthe estimate recently provided by Salaris et al. (2004) onthe basis of new measurements of theR parameter in a largesample of GGCs2. They found an initial He-abundance forGGC stars of the order ofY = 0.245, which is in fairagreement with recent empirical measurements of the cos-mological baryon density provided by W-MAP (Spergelet al. 2003). To reproduce the calibrated initial solar He-abundance we useddY/dZ ≈ 1.4 (Pietrinferni et al. 2004).
– For each fixed chemical composition, we have adopted theHe core mass and the surface He abundance at the RGBtip of a star igniting central He burning at an age of about∼ 12 Gyr. Once the RGB progenitor mass is chosen, a suit-able set of Zero Age Horizontal Branch (ZAHB) modelsfor different assumptions about the mass of the H-rich stel-lar envelope – i.e., about the efficiency of mass loss duringthe RGB phase – has been computed. In brief, the initialmodels of our HB sequences have a fully homogeneous H-rich envelope around the He core mass of the selected pro-genitor; the proper ZAHB model is obtained when all thesecondary elements involved in the H-burning through theCNO-cycle are relaxed to their equilibrium values.
– Bolometric magnitudes have been transformed to HSTF555W magnitudes according to the transformations pro-vided by Origlia & Leitherer (2000), which based on theatmosphere models computed by Bessell, Castelli & Plez(1998).
From the computed ZAHB models, we have estimated theZAHB brightness at the level of the RR Lyrae instability strip,i.e., at logTe ≈ 3.85. In Table 1 we list, for each assumed chem-ical composition, the bolometric magnitude, the star mass andthe HST F555W magnitude of the ZAHB at logTe = 3.85.
By performing a quadratic regression to these data, we ob-tain the following dependence of the ZAHB F555W magnitudeon the stellar total metallicity:
MZAHBF555W = 0.981+ 0.410[M/H] + 0.061[M/H]2 1)
with r2 = 0.99, which is valid in the metallicity range:−2.3 ≤[M/H] ≤ 0.063.
2 We recall that this cluster database is exactly the same adopted inthe present work.
3 We notice that the ’solar metallicity’ models correspond to[M /H]=0.06, instead of 0.0. The reason is that our adopted models donot include diffusion - which we know is active in the Sun, but accord-ing to some empirical evidence (Bonifacio et al. 2002 and referencestherein) is possibly inhibited at least at the surface of low-mass, metal-poor stars. When diffusion is included the ’solar metallicity’ compo-

4 Recio-Blanco et al.: Globular cluster distances with HST photometry
Table 1.Theoretical predictions for the ZAHB luminosity, evo-lutionary mass and absolute F555W magnitude at the RR Lyraeinstability strip as a function of [M/H].
[M/H] M/M⊙ log(L/L⊙) F555W (mag)
-2.27 0.821 1.780 0.351-1.79 0.721 1.732 0.468-1.27 0.650 1.687 0.564-0.96 0.620 1.653 0.634-0.66 0.594 1.614 0.721-0.25 0.565 1.540 0.8840.06 0.543 1.489 0.988
The models adopted in this work have been computed byneglecting atomic diffusion. However, Castellani et al. (1997)and Cassisi et al. (1998) have shown that the effect of atomicdiffusion on the ZAHB brightness at the level of the RR Lyraeinstability strip is to decrease it of about∆log(L/L⊙) ≈ 0.02,i.e.,∆F555W ≈ +0.05 mag. This means that, if we would ac-count for the occurrence of atomic diffusion, the derived dis-tance modulus estimates (see next section) would be decreasedonly by about 0.05 mag.
As stated above, our theoretical ZAHB luminosities arebased on updated stellar models, computed by accounting forthe ‘best’ physics presently available. However we are awareof remaining uncertainties affecting the prediction of the HBbrightness, as discussed by several authors (Vandenberg etal.2000, De Santis & Cassisi 1999, Cassisi et al. 1998 and ref-erences therein). We refer the reader to the quoted papers fordeeper analysis on this subject. Here we will compare the dis-tances obtained using our ZAHB models with independent em-pirical determinations, in order to test the accuracy of themod-els we employed.
3. Distance moduli determination
The distance modulus for each cluster in the database was ob-tained by comparing the F555W apparent ZAHB magnitudewith the theoretical absolute magnitude as obtained from equa-tion 1). A standard method for deriving the ZAHB magnitudefor both intermediate and metal-poor clusters is to adopt themean magnitude of the corresponding RR Lyrae stars. Thishowever was not possible in our case because the Piotto etal. (2002) photometry covers a very short time interval and,as a consequence, the RR Lyrae stars were always measured atrandom pulsation phases.
In order to overcome this problem, we have undertakenan approach similar to the one already used by Zoccali et al.(1999)4. We first divided the clusters into two samples on thebasis of their metallicity: the low- and intermediate-metallicity
sition would provide [M/H]=0.0 only at the solar age for solar-likemodels.
4 We refer the reader to the quoted reference for a detailed discus-sion on the difficulty of measuring the ZAHB luminosity at the levelof the RR Lyrae instability strip in those clusters characterized by avery blue or red horizontal branch.
Fig. 1. Comparison between the ground-based CMD ofNGC1851 obtained by Walker (1998) and the HST CMD one,transformed to the standard Johnson system. The location ofthe RR Lyrae stars as observed by Walker (1998) is also shown(asterisks). The horizontal line displays the mean RR Lyraelu-minosity level.
Fig. 2. Determination of the mean RR Lyrae F555W magni-tude in the cluster NGC362 by comparing its CMD with thetemplate CMD of NGC1851. The horizontal line displays theestimated mean RR Lyrae magnitude.
(hereinafter LIM) clusters ([Fe/H] < −1.0), and the metal-rich(hereinafter MR) clusters ([Fe/H] ≥ −1.0). In the following,we describe in details the different approaches we used to esti-mate the ZAHB level for the two different cluster samples.

Recio-Blanco et al.: Globular cluster distances with HST photometry 5
3.1. The ZAHB luminosity level for LIM clusters
Since the HB morphology does strongly depend on the clustermetallicity, we selected five clusters, all with metallicity lowerthan – or approximately equal to – [Fe/H]=−1.0, to use as tem-plate clusters. They have been selected according to the follow-ing prescriptions:
– low interstellar reddening;– a sizeable population of RR Lyrae variables;– accurate ground-based photometric data for both static and
pulsating stars.
The selected clusters are NGC 1851( Walker, 1998), NGC 4590(Walker 1994), NGC 5272 (Buonanno et al. 1994), NGC 5904(Caputo et al. 1999) and NGC 6362 (Walker 2001, priv. com.).
By using the histogram of the observed RR Lyrae meanmagnitudes, we estimated the mean RR Lyrae luminosity levelin the standard Johnson system, for all the five clusters selectedfrom the literature. These clusters will be used to determine theZAHB level in other GGCs, that cannot fulfill all three con-ditions listed before, within a narrow metallicity range aroundthe template ones.
The metallicity of the templates on the ZW scale, the [Fe/H]range within which they have been employed, and the meanVand F555W magnitudes of their RR Lyrae stars are listed inTable 2.
We took care that all the selected template clusters had areddening E(B−V)<0.1, in order to minimize calibration errorsin the determination of the RR Lyrae level when comparing theground-based CMDs with the HST snapshot ones transferredin the Johnson system (see below).
The method for estimating the ZAHB luminosity level inthe F555W HST band, adopted for all LIM clusters, is the fol-lowing:
– the mean RR Lyrae luminosity level in the ground-basedJohnson system for the template clusters has been trans-lated into the HSTflight photometric system. Due to thefact that there are non-negligible differences between thestandard ground-based Johnson photometry and the HSTflight photometry, this has been accomplished following atwo-step procedure. As a first step, we have superposedthe ground-based CMD to the corresponding HST snapshotCMD calibrated to the Johnson system. This has allowedus to set the RR Lyrae mean magnitude measured on thegroundbased CMD on the HST snapshot CMD. After this,we have transferred the RR Lyrae mean level to the CMD inthe WFPC2 flight system. This allowed us to measure theRR Lyreae meanF555W magnitude in the WFPC2 flightsystem. The mean apparent magnitude of the template clus-ter RR Lyrae stars has been then transformed into the ap-parent ZAHB magnitude by accounting for the formula byCassisi & Salaris (1996)5. The use of this relation is partic-ularly justified by the fact that all the template clusters havea sizeable population of RR Lyraes stars.
5 It is important to notice that this relation was originally obtainedfor the V-band magnitude. However, by using HB models and syn-thetic CMDs we have verified that it is valid also for the F555Wband
Fig. 3. Determination of F555W magnitude of the ZAHB forthe metal-rich cluster NGC 104.Left panel: the HST CMD ofthe cluster.Right panel: the histogram of the stellar cluster pop-ulation within the box shown in the left panel.
mZAHBF555W = mRR−Lyrae
F555W + 0.152+ 0.041[M/H]
NGC 5272, was not included in the Piotto et al. (2002)database. For that reason, we overlapped its CMD to thesnapshot CMD of NGC 1904 ([Fe/H]=−1.6) in order to fixthe RR Lyrae level, and then adopted the snapshot CMDof NGC 1904 as template to determine the ZAHB level ofthe clusters in the corresponding (see table. 2) metallicityinterval.
– the ZAHB F555W magnitude for each remaining clus-ter in our sample has been determined in the followingway. The appropriate template HST snapshot CMD cali-brated to the flight system has been shifted in both mag-nitude and colour over the CMD of the cluster, until theirHBs overlap, as illustrated in Fig. 2. In particular, we havebeen careful to match the region of the blue HBs aroundthe point where the HB becomes vertical in the (F555W,F439W − F555W) plane. The location of this point on theCMD depends only on the bolometric correction, and is in-dependent on metallicity (Brocato et al. 1998). This proce-dure allowed us to obtain both the mZAHB
F555W magnitude andthe E(F439W − F555W) reddening relative to the templateone.
3.2. High metallicity clusters
For clusters with [Fe/H] ≥ -1.0, showing generally a red HBand no RR Lyrae stars, the magnitude mZAHB
F555W was derived ac-cording to the following relation (see Zoccali et al. (1999)formore details):
mZAHBF555W = mle
F555W − 3σF555W

6 Recio-Blanco et al.: Globular cluster distances with HST photometry
Table 2.Cluster templates for the measurement of the average RR Lyrae level. The estimated error in the mean RR Lyrae F555Wmagnitude is of the order of 0.05 mag.
Cluster [Fe/H] metallicity range < V(RR) > < F555W(RR) >
NGC 6362 −1.1 −1.1<[Fe/H]< −0.8 15.29 15.30NGC 1851 −1.2 −1.3<[Fe/H]≤ −1.1 16.04 16.04NGC 5904 −1.4 −1.5<[Fe/H]≤ −1.3 15.07 15.10NGC 1904 −1.7 −1.8<[Fe/H]≤ −1.5 16.17 16.16NGC 4590 −2.1 [Fe/H]≤ −1.8 15.58 15.65
where mleF555W is the magnitude of the lower (fainter) envelope
of the red HB, previously determined on the histogram of themagnitude distribution of the HB stars, as shown in Figure 3,andσF555W is the photometric error at the HB magnitude in-terval, estimated through artificial star experiments. In general,σF555W is of the order of 0.02 mag, representing very small de-viations in magnitude. Where possible (i.e. for clusters with ared HB, but a metallicity low enough to be able to determinethe RR Lyrae level by comparison with the template clusters),we have verified that the two methods give consistent ZAHBmagnitudes.
The final apparent distance moduli for all our clusterswere calculated by simply computing the difference (mZAHB
F555W -MZAHB
F555W ), where the absolute ZAHB magnitudes were obtainedfrom Eq. 1. Tables 3 and 4 list the distance moduli and red-denings obtained for our data set. Note that, due to the CMDphotometry accuracy, we could measure the distance to 72 outof the 74 clusters in the snapshot sample. For 2 clusters, fieldstar contamination and/or differential reddening made impossi-ble to measure the ZAHB magnitude.
For each cluster, the total E(F439W − F555W) reddeningwas determined by adding the shift in colour of the CMD fit tothe reddening of the corresponding template. For the metal richclusters ([Fe/H]>-0.8), no reddening determination was there-fore possible.
The E(F439W − F555W) reddening of the templates wascalculated starting from the E(B − V) values tabulated byHarris (2003), and by interpolating the relationship givenbyHoltzman et al. (1995) between E(B − V) and the extinctionsAF555W and AF439W .
The error in (m-M)F555W has been determined considering:i) the error in matching the CMDs of the templates to find theRR Lyrae level in the flight system (∼ 0.04 magnitudes), ii) theerror in matching the CMD of the template with that of the ob-ject cluster (∼ 0.07 magnitudes), iii) the photometric error atthe level of the ZAHB (∼ 0.02 magnitudes), iv) the standarddeviation of the mean of the RR Lyrae magnitudes, and v) thephotometric error of the template clusters. The first two errorswhere determined repeating several times the match and con-sidering the scatter in the results.
Column 5 of Tables 3 and 4 lists our reddening values trans-formed to the Johnson system by interpolating the relation-ship given by Holtzman et al. (1995) between the extinctionsAF555W and AF439W and E(B − V).
4. Comparison with other datasets
The relative distances inferred from Tabs. 3 and 4 are themost accurate ones that can be obtained for such a huge setof GGCs with the present observational techniques6. They arebased on a photometrically homogeneous database, and theyhave been obtained following the same methodology. In this re-spect, the empirical measurement of the apparent magnitudeofthe ZAHBs are robust. The assumptions we made in estimatingour distance moduli are clearly stated. One can easily adoptadifferent relationship between the theoretical ZAHB brightnessand the metallicity, and obtain apparent distances starting fromthe observed ZAHB levels listed in Tabs. 3 and 4. The same isvalid for the reddenings, and consequently absolute distances.
In view of the significant importance of the GGC distancemodulus estimates, it is worth to compare the present resultswith others in the astronomical literature. We have selectedthree recent and independent works dealing with GGC dis-tances and reddenings: Harris (2003), Ferraro et al. (1999),and Carretta et al. (2000, 2003). The Harris (2003) catalogueis a database of parameters for GGCs collected from the lit-erature, and therefore coming from photometrically inhomo-geneous CMDs, and based on different methods for the HBlevel measurements. Although it represents a very useful toolfor analizing the general properties of the GGC system, thislimitation has to be taken into account. Ferraro et al. (1999)have compiled an extensive catalogue of parameters for a sam-ple of 61 clusters, including their distances. These have beenobtained by using, as a standard candle, different theoreticaldeterminations of the HB brightness (see Ferraro et al. 1999fordetails). Again, the Ferraro et al. (1999) observational database,as the Harris (2003) one, is not photometrically homogeneous.Carretta et al. (2000, 2003) have provided the distance to asmall sample of GGCs by adopting the MS fitting method. Dueto the impressive care devoted in deriving the subdwarfs pa-rameters such as metallicity, color, and absolute visual magni-tude, as well as cluster metallicity and reddening, their distancemeasurements appear the most accurate ones presently avail-able for GGCs. Therefore, despite the small number of objectsinvolved, the Carretta et al. measurements provide an importantcheck of the accuracy and reliability of the distances presentedin this paper.
6 For a limited number of clusters it is surely possible to havemoreaccurate relative and absolute distances, as shown by Carretta et al.(2000).

Recio-Blanco et al.: Globular cluster distances with HST photometry 7
ID m(ZAHB) (m-M) Reddening E(B-V) [Fe/H] [Fe/H]F555W F555W ZW CG
ic1257 20.20 19.69±0.10 0.71 0.72 ....... ......ic4499 17.75 17.22±0.10 0.15 0.15 -1.5 -1.29n0104 14.16 13.41±0.08 ....... ....... -0.71 -0.70n0362 15.50 14.85±0.10 0.005 0.004 -1.27 -1.15n1261 16.85 16.26±0.09 0.01 0.01 -1.31 -1.17n1851 16.15 15.52±0.10 0.02 0.02 -1.36 -1.20n1904 16.25 15.71±0.08 0.01 0.01 -1.69 -1.37n2808 16.35 15.70±0.09 0.14 0.14 -1.37 -1.21n3201 14.85 14.32±0.08 0.24 0.25 -1.61 -1.23n4590 15.73 15.30±0.08 0.05 0.05 -2.09 -1.99n4147 16.98 16.50±0.08 0.01 0.01 -1.80 -1.55n4372 15.58 15.15±0.09 0.40 0.42 -2.08 -1.93n4833 15.70 15.21±0.08 0.28 0.29 -1.86 -1.58n5024 16.83 16.38±0.08 0.01 0.01 -2.04 -1.86n5634 17.68 17.20±0.09 0.01 0.01 -1.82 -1.57n5694 18.53 18.06±0.08 0.12 0.12 -1.92 -1.69n5824 18.53 18.06±0.08 0.12 0.12 -1.87 -1.63n5904 15.20 14.59±0.08 0.03 0.03 -1.40 -1.11n5927 16.79 15.90±0.08 ....... ....... -0.30 -0.14n5946 17.60 17.01±0.09 0.63 0.64 -1.37 -1.21n5986 16.70 16.17±0.08 0.26 0.27 -1.67 -1.42n6093 16.35 15.85±0.08 0.21 0.22 -1.68 -1.43n6139 18.05 17.54±0.09 0.71 0.72 -1.65 -1.40n6171 15.79 15.11±0.09 0.48 0.49 -0.99 -0.97n6205 15.05 14.51±0.08 0.01 0.01 -1.65 -1.39n6218 14.80 14.24±0.20 0.21 0.22 -1.61 -1.37n6229 18.10 17.53±0.09 0.02 0.02 -1.54 -1.32n6235 17.00 16.42±0.09 0.30 0.31 -1.40 -1.22n6256 18.22 17.42±0.09 1.18 1.18 ....... .....n6266 16.30 15.69±0.09 0.53 0.54 -1.28 -1.15n6273 16.55 16.04±0.08 0.33 0.34 -1.68 -1.43n6284 17.50 16.90±0.08 0.28 0.29 -1.40 -1.22n6287 17.13 16.70±0.08 0.65 0.66 -2.05 -1.88n6293 16.48 16.02±0.08 0.61 0.62 -1.92 -1.69n6304 16.39 15.58±0.09 ....... ....... -0.59 -0.60n6316 17.92 17.07±0.10 ....... ....... -0.47 -0.44n6325 18.05 17.41±0.09 1.02 1.03 -1.44 -1.25
Table 3.Apparent ZAHB F555W magnitude (Col. 2), corresponding distance modulus in F555W (Col. 3), the reddening in flightsystem E(F439W-F555W) (Col. 4), the reddening in Johnson system E(B-V) (Col. 5) and the metallicity in the Zinn & West andCarretta & Gratton scales (Col. 6 and 7 respectively).
It is worth remembering that our apparent distance modulusdeterminations have been obtained in the HST F555W band.Even if this photometric band is similar to the Johnson visualband (used in the other works), it is not exactly the same. Inorder to perform a meaningful comparison, for clusters with[Fe/H] < -0.8, we transformed the F555W apparent distancemodulus estimates into extinction corrected ones, by usingourestimates of E(F439W − F555W), and the relation presentedby Holtzman et al. (1995, Table 12). For comparison purposes,we also transformed the E(B − V) values of Harris (2003) intothe corresponding E(F439W − F555W) reddenings by calcu-lating the extinctions coefficents AF555W and AF439W followingHoltzman et al. (1995).
Fig. 4 shows a comparison of our reddenings and thoseof Harris (2003). There is an overall good agreement downE(F439W − F555W)∼ 0.75, though the dispersion of the
differences increases at increasing reddening. For reddeningslarger than 0.75, there seems to be a systematic trend. This isvery likely due to problems in the transformations of Harris’E(B − V) to the E(F439W − F555W). The transformations ofHoltzman et al. (1995) from the E(B − V) in the Johnson sys-tem to the extinctions coefficents in the WFPC2 flight systemare likely less reliable for E(B − V)> 0.75. On the other hand,our reddening measurements, as derived from the overlap ofthe object and the template CMDs, could be also more uncer-tain for very high, sometimes differential, reddenings.
In Figs. 5 and 6, we perform a comparison between ourabsolute distance modulus determinations and those of Harris(2003), Ferraro et al. (1999), and Carretta et al. (2000, 2003)as a function of cluster reddening and metallicity, respectively.Because of the problems on the transformation of reddeningsto the flight systems for high extinctions, we did not use clus-
8 Recio-Blanco et al.: Globular cluster distances with HST photometry
ID m(ZAHB) (m-M) Reddening E(B-V) [Fe/H] [Fe/H]F555W F555W ZW CG
n6342 17.07 16.28±0.09 ....... ....... -0.62 -0.64n6355 17.80 17.25±0.10 0.77 0.78 -1.5 -1.29n6356 17.65 16.81±0.09 ....... ....... -0.62 -0.64n6362 15.42 14.71±0.09 0.08 0.08 -1.08 -0.96n6380 19.62 18.75±0.15 1.58 1.58 -1.00 -0.98n6388 17.99 16.49±0.09 ....... ....... -0.74 -0.77n6401 17.85 17.19±0.15 0.90 0.91 -1.13 -1.06n6402 17.40 16.82±0.09 0.65 0.66 -1.39 -1.22n6440 18.92 17.99±0.09 ....... ....... -0.26 -0.06n6441 17.96 17.13±0.09 ....... ....... -0.59 -0.60n6453 17.80 17.25±0.09 0.61 0.62 -1.53 -1.31n6517 19.20 18.61±0.09 1.23 1.23 -1.34 -1.19n6522 16.80 16.23±0.09 0.53 0.54 -1.44 -1.25n6539 18.52 17.71±0.09 ....... ....... -0.66 -0.69n6540 15.95 15.31±0.09 0.52 0.53 ....... .......n6544 15.25 14.71±0.08 0.76 0.77 -1.56 -1.33n6569 17.62 16.91±0.08 0.56 0.57 -0.86 -0.88n6584 16.60 16.04±0.09 0.02 0.02 -1.54 -1.32n6624 16.11 15.24±0.10 ....... ....... -0.35 -0.23n6637 16.04 15.27±0.09 ....... ....... -0.59 -0.60n6638 16.97 16.27±0.10 0.38 0.39 -1.15 -1.08n6642 16.70 16.11±0.09 0.43 0.44 -1.29 -1.16n6652 16.06 15.38±0.08 0.13 0.13 -0.89 -0.90n6681 15.75 15.20±0.08 0.06 0.06 -1.51 -1.30n6712 16.22 15.53±0.09 0.38 0.39 ....... .......n6717 15.80 15.19±0.20 0.22 0.23 -1.32 -1.18n6723 15.55 14.89±0.10 0.05 0.05 -1.09 -1.04n6760 17.92 17.09±0.08 ....... ....... -0.52 -0.51n6838 14.54 13.75±0.10 ....... ....... -0.58 -0.70n6864 17.70 17.10±0.09 0.20 0.21 -1.32 -1.18n6934 16.95 16.41±0.10 0.08 0.08 -1.54 -1.32n6981 16.90 16.32±0.08 0.05 0.05 -1.54 -1.32n7078 15.88 15.48±0.11 0.09 0.09 -2.15 -2.12n7089 16.03 15.50±0.09 0.01 0.01 -1.62 -1.38n7099 15.23 14.81±0.08 0.03 0.03 -2.13 -1.91
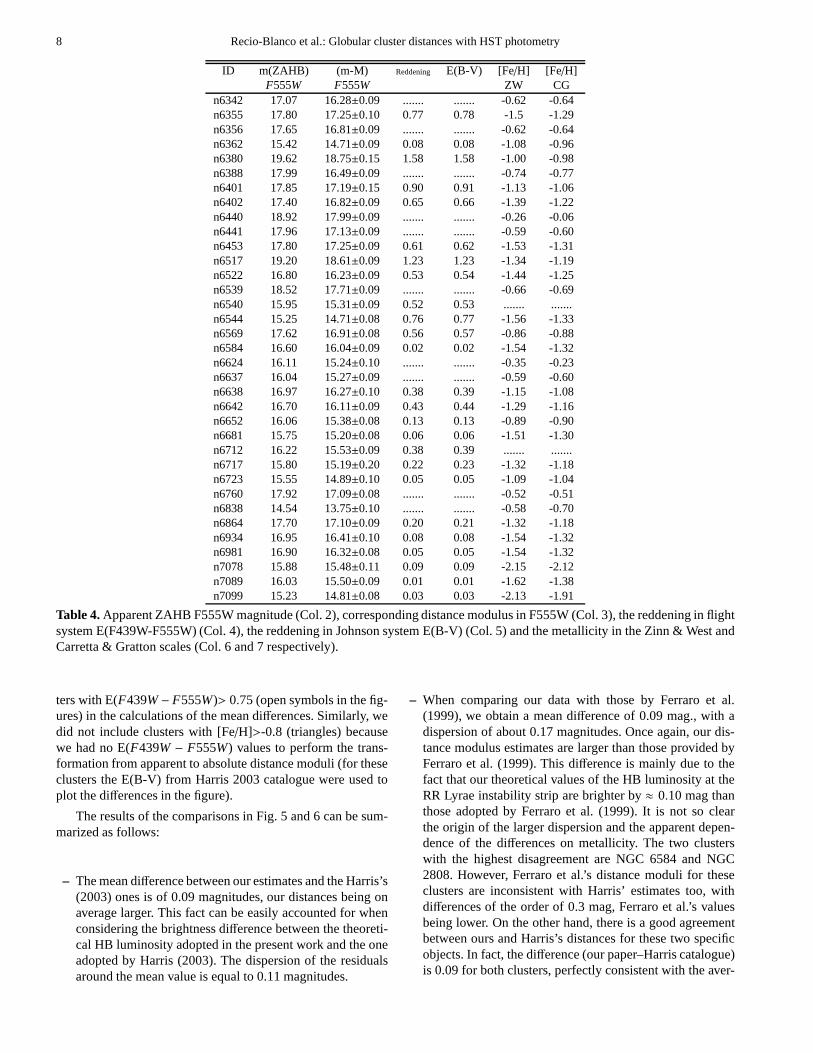
Table 4.Apparent ZAHB F555W magnitude (Col. 2), corresponding distance modulus in F555W (Col. 3), the reddening in flightsystem E(F439W-F555W) (Col. 4), the reddening in Johnson system E(B-V) (Col. 5) and the metallicity in the Zinn & West andCarretta & Gratton scales (Col. 6 and 7 respectively).
ters with E(F439W − F555W)> 0.75 (open symbols in the fig-ures) in the calculations of the mean differences. Similarly, wedid not include clusters with [Fe/H]>-0.8 (triangles) becausewe had no E(F439W − F555W) values to perform the trans-formation from apparent to absolute distance moduli (for theseclusters the E(B-V) from Harris 2003 catalogue were used toplot the differences in the figure).
The results of the comparisons in Fig. 5 and 6 can be sum-marized as follows:
– The mean difference between our estimates and the Harris’s(2003) ones is of 0.09 magnitudes, our distances being onaverage larger. This fact can be easily accounted for whenconsidering the brightness difference between the theoreti-cal HB luminosity adopted in the present work and the oneadopted by Harris (2003). The dispersion of the residualsaround the mean value is equal to 0.11 magnitudes.
– When comparing our data with those by Ferraro et al.(1999), we obtain a mean difference of 0.09 mag., with adispersion of about 0.17 magnitudes. Once again, our dis-tance modulus estimates are larger than those provided byFerraro et al. (1999). This difference is mainly due to thefact that our theoretical values of the HB luminosity at theRR Lyrae instability strip are brighter by≈ 0.10 mag thanthose adopted by Ferraro et al. (1999). It is not so clearthe origin of the larger dispersion and the apparent depen-dence of the differences on metallicity. The two clusterswith the highest disagreement are NGC 6584 and NGC2808. However, Ferraro et al.’s distance moduli for theseclusters are inconsistent with Harris’ estimates too, withdifferences of the order of 0.3 mag, Ferraro et al.’s valuesbeing lower. On the other hand, there is a good agreementbetween ours and Harris’s distances for these two specificobjects. In fact, the difference (our paper–Harris catalogue)is 0.09 for both clusters, perfectly consistent with the aver-

Recio-Blanco et al.: Globular cluster distances with HST photometry 9
Fig. 4. Comparison of the reddenings from this paper with those of Harris (2003). The E(B − V) values of Harris (2003) havebeen transformed into the corresponding E(F439W − F555W) reddenings by calculating the extinctions coefficents AF555W
and AF439W following Holtzman et al. (1995). The differences are plotted as a function of the cluster reddening. Clusters withE(F439W − F555W)>0.75 (open symbols) are not considered in the mean.
age zero point difference between us and Harris. Finally, wenote that the disagreement between Ferraro’s and Harris’values is particularly high for intermediate metallicity clus-ters.
– The comparison with the data by Carretta et al. (2000,2003) shows that the average difference in the derived truedistance estimates is of the order of only -0.015 mag andthe dispersion around the mean value of the difference is ofthe order of 0.084 mag.
Our distance modulus zero point appears to be in good agree-ment with those provided by Carretta et al. (2000, 2003). Evenif this comparison is possible only for a very small number ofclusters, this evidence strongly supports the accuracy andreli-ability of our distance estimates. In addition, the dispersion ofthe differences is smaller than the difference rms in the com-parisons with Harris (2003) and Ferraro (1999) et al. furtherstrengthening the overall accuracy of our distance estimates.
5. Final remarks
We have employed a large sample of GGC CMDs, obtainedand analized in a fully homogeneous and self-consistent frame-work, to estimate the apparent cluster ZAHB luminosity levelsas well as the cluster reddenings.
By using updated stellar evolution models, and in particu-lar new predictions about the ZAHB luminosity level, we haveprovided an estimate of the distances to all clusters. Even if weare aware of remaining systematic uncertainties which can af-fect theoretical ZAHB absolute magnitudes, we are confidentthat at least our relative distances are reliable. In addition, weremark that by using the apparent mZAHB
F555W values listed in table3) and 4), which are completely model independent, any in-terested reader can derive distance estimates by using the pre-ferred theoretical framework.
In order to assess the intrinsic accuracy of the present re-sults, we have performed a comparison between current dataand similar measurements presented by Harris (2003), Ferraroet al. (1999) and Carretta et al. (2002, 2003). This comparisonshowed that there are some problems in the determination ofthe extinction coefficients in the WFPC2 flight system from theclassical E(B − V) system for E(B − V)>0.75, using Holtzmanet al. (1995) recipe.
We have also to notice the fine agreement achieved in thecomparison with the empirical MS-fitting distances by Carrettaet al. (2000, 2003). This lends strong support to both our rel-ative and absolute ZAHB distance scale. Accurate empiricalanalysis like the Carretta et al. ones, extended to a larger sam-ple of objects, are needed in order to definitely confirm the re-liability of our ZAHB absolute distances.

10 Recio-Blanco et al.: Globular cluster distances with HSTphotometry
Fig. 5.Comparison of the distance moduli from this paper with thoseof Harris (2003), Ferraro et al. (1999), Carretta et al. (2000)and Carretta et al. (2003, filled triangles). The differences (our measurements with repect to the literature ones) are plotted as afunction of the cluster reddening. Clusters with E(F439W − F555W)>0.75 (open symbols) or [Fe/H]>-0.8 (triangles) have notbeen used in the calculation of the mean differences and standard deviations.
Acknowledgements. ARB recognizes the support of the IstitutoNazionale di Astrofisica(INAF). GP and SC recognize partial sup-port from the Ministero dell’Istruzione, Universita e Ricerca (MIUR,PRIN2002, PRIN2003), and from the Agenzia Spaziale Italiana (ASI).
References
Alexander, D. R., & Ferguson, J. W. 1994, ApJ, 437, 879Angulo, C. et al. 1999, Nucl. Phys. A, 656, 3Bedin, L. R., Piotto, G., Zoccali, M., Stetson, P.B., Saviane, I., Cassisi,
S., & Bono, G. 2000, A&A, 363, 159Behr, B.B., Cohen, J. G., McCarthy, J. K., & Djorgovski, S. G.1999,
ApJ, 517, L31Behr, B.B.,Djorgovski, S. G., Cohen, J. G., McCarthy, J. K.,Cote, P.,
Piotto, G., & Zoccali, M. 2000, ApJ, 528, 849 [B00a]Behr, B.B., Cohen, J. G., & McCarthy, J. K. 2000b, ApJ, 531, L37
[B00b]Bessell, M. S.; Castelli, F.; Plez, B, 1998 A&A, 333, 231Bonifacio, P., Pasquini, L., Spite, F., Bragaglia, A., Carretta, E.,
Castellani, V., Centurion, M. et al. 2002, A&A, 390, 91Bono, G., Cassisi, S., Zoccali, M., & Piotto, G. 2001, ApJ, 546, L109Bono, G. 2003, Proceedings of the workshop “Stellar Candles”, ed.
W. Gieren & D. Alloin, Lect. Notes Phys. 635, 85Buonanno, R.; Corsi, C. E.; Buzzoni, A.; Cacciari, C.; Ferraro, F. R.;
Fusi Pecci, F., 1994, A&A, 290, 69Cacciari, C., 2003, New Horizons in Globular Cluster Astronomy,
ASP Conference Proceedings, Vol. 296, 329
Caputo, F.; Castellani, V.; Marconi, M.; Ripepi, V., 1999, MNRAS,306, 815
Caputo, F., & Cassisi, S. 2002, MNRAS, 333, 825Carney, B. W. 1996, PASP, 108, 900 (C96)Carretta, E., & Gratton, R. G. 1997, A&AS, 121, 95 (CG)Carretta, E., Gratton, R. G., Clementini, G., Fusi Pecci, F.2000, ApJ,
533, 215Carretta, E., private communicationCassisi, S.; Salaris, M., 1997, MNRAS, 285, 593Cassisi, S.; Castellani, V.; degl’Innocenti, S.; Weiss, A.1998, A&AS,
129, 267Cassisi, S., Castellani, V., degl’Innocenti, S., Salaris,M., & Weiss, A.
1999, A&AS, 134, 103Cassisi, S., Salaris, M., & Irwin, A. W. 2003, ApJ, 588, 852Castellani, V., Chieffi, A., Tornambe, A., & Pulone, L. 1985, ApJ, 296,
204Castellani, V.; Ciacio, F.; degl’Innocenti, S.; Fiorentini, G. 1997 A&A,
322, 801Catelan, M., Borissova, J., Sweigart, A. V., & Spassova, N. 1998, ApJ,
494, 265De Santis, R.; Cassisi, S., 1999, MNRAS, 308, 97 Dolphin, A. E. 2000
PASP, 112, 1397Dubath, P., Meylan, G., Mayor, M. et al. 1990, A&A, 239, 142Grevesse, N., & Noels, A., 1993, in: Prantzos, N., Vangioni-Flam,
E., Casse, M. (eds.) , Origin and Evolution of the Elements,(Cambridge University Press), 15
Groenewegen, M.A.T. & Salaris, M. 1999, A&A, 384, L33Grundahl, F., Catelan, M., Landsman, W. B., Stetson, P. B., &
Andersen, M. I. 1999, ApJ , 524, 242 [G99]

Recio-Blanco et al.: Globular cluster distances with HST photometry 11
Fig. 6. Same as Figure 4, but with the differences plotted as a function of metallicity from Carretta &Gratton (1997) (leftcolumn) panel, and Zinn & West (1984) (right column). Clusters with E(F439W −F555W)>0.75 (open symbols) or [Fe/H]>-0.8(triangles) have not been used in the calculation of the meandifferences and standard deviations.
Haft, M., Raffelt, G., & Weiss, A. 1994, ApJ, 425, 222Harris, W.E. 1996, AJ, 112, 1487 [H96]Harris, W.E. 2003, revised version of [H96]Holtzman, J. A., Burrows, C. J., Casertano, S., et al. 1995, PASP, 107,
1065Iglesias, C. A.; Rogers, F. J., 1996, ApJ, 464, 943Kraft, R. P.; Ivans, I. I., 2003, PASP, 115, 143Kunz, R., et al. 2002, ApJ, 567, 643Origlia, L.; Leitherer, C., 2000, AJ, 119, 2018Palmieri, R.; Piotto, G.; Saviane, I.; Girardi, L.; Castellani, V., 2002,
A&A, 392, 115Piotto, G. et al. 1999, AJ, 118, 1737 [P99]Pietrinferni, A., Cassisi, S., Salaris, M. & Castelli, F. 2004, ApJ,sub-
mitted toPiotto, G.; Rosenberg, A.; Saviane, I.; Aparicio, A.; Zoccali, M.,
2000, Proceedings of the 35th Liege International AstrophysicsColloquium, 471
Piotto, G. et al. 2002, A&A, 391, 945Piotto, G., De Angeli, F, Djorgovski, S.G., Bono, G., Cassisi, S.,
Meylan, G., Recio-Blanco, A., Rich, M. R., Davies, M. B., ApJL,2004, submited
Potekhin, A.Y. 1999, A&A, 351, 787Recio-Blanco, A., Piotto, G., Aparicio, A. & Renzini, A. 2002, ApJ,
572, L71 [R02]Reid, I.N. 1997, AJ, 114, 161Reid, I.N. 1998, AJ, 115, 204Renzini, A. 1977;in Advanced Stages in Stellar Evolution,Geneva
Observatory, p.149Rogers, F. J., Swenson, F. J., & Iglesias, C. A. 1996, ApJ, 456, 902Rogers, F. J., & Nayfonov, A. 2002, ApJ, 576, 1064Rosenberg, A.; Saviane, I.; Piotto, G. & Aparicio, A., 1999,AJ, 118,
2306Rosenberg, A., Piotto, G., Saviane, I., & Aparicio, A. 2000,A&AS,
144, 5Rosenberg, A., Aparicio, A., Saviane, I., & Piotto, G. 2000,A&AS,
145, 451Rutledge, G. A.; Hesser, J. E.; Stetson, P. B., 1997, PASP, 109, 907Salaris, M., Chieffi, A. & Straniero, O. 1993, ApJ, 414, 580Salaris, M.; Cassisi, S., 1996, A&A, 305, 858Salaris, M. & Weiss, A. 1998, A&A, 335, 943Salaris, M.; Riello, M.; Cassisi, S. & Piotto, G. 2004, A&A,in press,
astro-ph/0403600

12 Recio-Blanco et al.: Globular cluster distances with HSTphotometry
Spergel et al. 2003, ApJS, 148, 175Stetson, P. B. 1987, PASP, 99, 191Stetson, P. B. 1994, PASP, 106, 250VandenBerg, D. A. , Stetson, P. B. , Bolte, M., 1996, ARA&A, 34, 461VandenBerg, D. A. 2000, ApJS, 129, 315VandenBerg, D. A., Swenson, F. J., Rogers, F. J., Iglesias, C. A., &
Alexander, D. R. 2000, ApJ, 532, 430Walker, A. R., 1994, 1994, AJ, 108, 555Walker, A. R., 1998, AJ, 116, 220Walker, A. R., 2001, private communication.Zinn, R., & West, M. J. 1984, ApJS, 55, 45 (ZW)Zoccali, M., Cassisi, S., Piotto, G., Bono, G., & Salaris, M.1999, ApJ,
518, L49 (Z99)Zoccali, M.; Piotto, G., 2000, A&A, 358, 943Zoccali, M., Cassisi, S., Bono, G., Piotto, G., Rich, R. M., Djorgovski,
S. G. 2000, ApJ, 538, 289