Upper limits on gravitational wave emission from 78 radio pulsars
Upload
khangminh22Category
view
0download
0
MNRAS 000, 1–20 (2015) Preprint 16 February 2022 Compiled using MNRAS LATEX style file v3.0
A Census of X-ray Millisecond Pulsars in Globular Clusters
JiaQi Zhao,1★ Craig O. Heinke1†1 Physics Dept., CCIS 4-183, University of Alberta, Edmonton, AB, T6G 2E1, Canada
Accepted XXX. Received YYY; in original form ZZZ
ABSTRACTWe present a comprehensive census of X-ray millisecond pulsars (MSPs) in 29 Galactic globular clusters (GCs), including 68MSPs with confirmed X-ray luminosities and 107 MSPs with X-ray upper limits. We compile previous X-ray studies of GCMSPs, and add new analyses of six MSPs (PSRs J1326−4728A, J1326−4728B, J1518+0204C, J1717+4308A, J1737−0314A,and J1807−2459A) discovered in five GCs. Their X-ray spectra are well described by a single blackbody model, a single power-law model, or a combination of them, with X-ray luminosities ranging from 1.9×1030 erg s−1 to 8.3×1031 erg s−1. We find thatmost detected X-ray MSPs have luminosities between ∼ 1030 erg s−1 to 3 × 1031 erg s−1. Redback pulsars are a relatively brightMSP population with X-ray luminosities of ∼ 2 × 1031–3 × 1032 erg s−1. Black widows show a bi-modal distribution in X-rayluminosities, with eclipsing black widows between ∼ 7× 1030 and 2× 1031 erg s−1, while the two confirmed non-eclipsing blackwidows are much fainter, with 𝐿𝑋 of 1.5 − 3 × 1030 erg s−1, suggesting an intrinsic difference in the populations. We estimatethe total number of MSPs in 36 GCs by considering the correlation between the number of MSPs and stellar encounter rate inGCs, and suggest that between 600–1500 MSPs exist in these 36 GCs. Finally, we estimate the number of X-ray detectable MSPsin the Galactic bulge, finding that 1–86 MSPs with 𝐿𝑋 > 1033 erg s−1, and 20–900 MSPs with 𝐿𝑋 > 1032 erg s−1, should bedetectable there.Key words: stars: neutron – pulsars: general – globular clusters: general – globular clusters: individual: NGC 5139 – X-rays:stars
1 INTRODUCTION
Galactic globular clusters (GCs) are ideal birthplaces for low-massX-ray binaries (LMXBs), since the high stellar densities in GC coresprovide significant chances for stellar interactions, such as tidal cap-ture and exchange interactions (see e.g., Fabian et al. 1975; Hills1976). LMXBs are the progenitors of millisecond pulsars (MSPs),where the neutron star (NS) is spun up by accreting mass and angu-lar momentum from its companion to a period of a few milliseconds(Alpar et al. 1982; Bhattacharya & van den Heuvel 1991; Papittoet al. 2013). Therefore, it is not surprising that GCs show an over-abundance of MSPs compared to the Galactic field, and many MSPsexist in binary systems.Rotation-powered MSPs are rapidly and stably spinning pulsars,
with spin periods 𝑃 . 25 ms and spin-down rates ¤𝑃 ∼ 10−20, withlifetimes of Gyrs. Apart from isolated MSPs, MSPs in binaries canbe further categorized according to the degeneracy of the compan-ion star. Those MSPs coupled with non-degenerate companion starsare usually referred to as ‘spider’ MSPs, and based on the compan-ion masses, they are further grouped as redbacks (𝑀𝑐 ∼ 0.2 M� ,hereafter RBs) and black widows (𝑀𝑐 ∼ 0.02 M� , hereafter BWs),respectively. In addition, it is common that Eclipses of the radioemission commonly occur in observations of spider pulsars, whichcan be explained as the radio emission from the MSP being absorbed
★ E-mail: [email protected]† E-mail: [email protected]
and/or scattered by the plasma produced at the collision between therelativistic pulsar wind and material from the companion (Fruchter& Goss 1992; Thompson et al. 1994; Stappers et al. 2001; Polzinet al. 2018; Zhao et al. 2020a). On the other hand, the companionstars of MSPs may also be compact objects, and particularly whitedwarfs (WDs) are the most common companions among these MSPbinaries (e.g. Lorimer 2008).
MSPs are generally faint X-ray sources, with typical luminosi-ties of 𝐿𝑋 . 1031 erg s−1. The X-rays from MSPs commonly areobserved with blackbody-like spectra (e.g. Zavlin et al. 2002; Bog-danov et al. 2006), indicating a thermal emission origin likely pro-duced from the hotspots at the NS magnetic poles, heated by thereturning particles accelerated in the pulsar magnetosphere (Hard-ing & Muslimov 2002). Broad, sinusoidal X-ray pulsations can beobserved from nearby MSPs showing thermal emission, providingevidence for the hotspots/polar cap hypothesis (see, e.g. Guillot et al.2019). A few MSPs are relatively X-ray-bright with 𝐿𝑋 & 1032 ergs−1, up to ∼ 1033 erg s−1, and their X-ray emission usually showsnon-thermal properties (e.g. power-law spectra). For instance, themost luminous X-ray MSP in GCs found to date is PSR B1821−24in M28, with 𝐿𝑋 = 1.4 × 1033 erg s−1 (0.3–8 keV, Saito et al. 1997;Becker et al. 2003; Bogdanov et al. 2011). Moreover, the X-ray pul-sations from this MSP were clearly observed in two narrow pulses(Saito et al. 1997; Rutledge et al. 2004), implying highly beamednon-thermal emission originating from the pulsar magnetosphere.The other type of non-thermal X-ray emission from MSPs, i.e. non-pulsed non-thermal emission, is typically detected from spider pul-
© 2015 The Authors
arX
iv:2
202.
0704
0v1
[as
tro-
ph.H
E]
14
Feb
2022
2 J. Zhao & C. O. Heinke
sars, and believed to be produced by relativistic intra-binary shocksas a result of collisions between the pulsar wind and a matter outflowfrom the companion (e.g. Arons & Tavani 1993; Wadiasingh et al.2018; Kandel et al. 2019). Alternatively, a pulsar wind nebula or bowshock could also produce non-thermal X-ray emission (e.g. Stapperset al. 2003; Romani et al. 2017), although pulsar wind nebulae areunlikely to be detectable (i.e. 𝐿𝑋 < 1029 erg/s) for the spindownpowers typical ( ¤𝐸 ∼ 1033 erg/s) of GC MSPs (Kargaltsev & Pavlov2010 show the relation between pulsar wind nebula 𝐿𝑋 and ¤𝐸). Bowshocks are unlikely to produce significant X-ray emission for MSPsin GCs, due to the low gas content of GCs (Freire et al. 2001b) andthe low space velocities of MSPs in GCs.X-ray studies of GC MSPs have been presented for a few GCs,
especially pulsar-rich clusters such as 47 Tuc (Bogdanov et al. 2006),NGC6397 (Bogdanov et al. 2010),M28 (Bogdanov et al. 2011),NGC6752 (Forestell et al. 2014), and recently on Terzan 5 (Bogdanov et al.2021), M62 (Oh et al. 2020) and M13 (Zhao et al. 2021), as wellas for several individual MSPs in globular clusters (e.g. Bassa et al.2004; Amato et al. 2019). These studies provide opportunities tostatistically investigate the X-ray properties of GC MSPs. However,different groups may apply different energy bands for spectral fittingand analysis, making it difficult to study those GC MSPs togetherdirectly. Possenti et al. (2002) used a sample of 39 pulsars, includingboth MSPs and normal pulsars in GCs and the Galactic field, to re-examine the correlation between X-ray and spin-down luminosities,where they converted all the fluxes to 2–10 keV. Recently, Lee et al.(2018) focused on X-ray MSPs in the Galactic field and conducted asurvey of their X-ray properties. They simply applied a pure power-law model for all of the sampled MSPs and normalized the energyband to 2–10 keV as well. However, the derived X-ray luminositiesof MSPs in these works may have large uncertainties, mainly due tothe difficulties of measuring distances to the fieldMSPs (e.g. Igoshevet al. 2016). By contrast, the distance to a GC can be measured muchmore accurately than to a field MSP, and hence the uncertainty ofdistance to MSPs in a GC may be largely reduced (now <5%, e.g.Baumgardt & Vasiliev 2021).In this paper, we present an X-ray survey for all the radio-detected
MSPs in Galactic GCs which have Chandra X-ray observatory data,andwhich lack the confusion of bright LMXBs.We also report the X-ray spectral analyses of two newly found MSPs in the cluster OmegaCentauri, using archivalChandra observations, and statistically studythe X-ray properties of GC MSPs, with particular attention to theimplications for X-ray studies of the population of MSPs in theGalactic Center. This paper is organized as follows. In Section 2, wedescribed the criteria of data collection, reduction and normalization.In Section 3, we present the results of X-ray spectral fitting for sixnew MSPs in five GCs, and catalog X-ray sources in three GCs. Wethen present our X-ray census of GC MSPs, and further analyses oftheir X-ray properties. We discuss our results and the implications inSection 4, and we draw conclusions in Section 5.
2 DATA COLLECTION AND REDUCTION
Based on the catalogue of pulsars in globular clusters (230 pulsarsin 36 GCs to date)1, we first produced a list of MSPs in GCs bydefining their spinning periods of 𝑃 . 25 ms. The boundary ofrotational periods between normal pulsars and MSPs is not solid andmay vary depending on the research of interests. Here we chose ∼ 25
1 http://www.naic.edu/~pfreire/GCpsr.html
ms as the upper limit. This initial filtering gave 210 MSPs in total,and each GC in the catalogue harbours at least one MSP. Table 1 listsall the 36 GCs studied in this work, as well as other parameters.To obtain the X-ray luminosities of these MSPs, we looked into
Chandra X-ray Observatory (CXO) observations. Except NGC 5986and NGC 6749, which have no CXO observation yet, all GCs havebeen observed at least once with a total exposure time >10 ks. How-ever, five GCs (NGC 1851, NGC 6441, NGC 6624, NGC 6712, andM15) are not feasible for the X-ray analysis of MSPs or other faintX-ray sources, given that one or more bright (𝐿𝑋 > 1036 erg/s)XRBs are present, producing a high X-ray background throughoutthe cluster core (see Verbunt & Lewin 2006, for a review of GCX-ray sources). Hence there remain 29 GCs where we can deter-mine or constrain the X-ray luminosities of known MSPs. SeveralGCs and the MSPs therein have been observed and studied in X-raysthoroughly, such as 47 Tuc, M28, etc. (see Introduction), while otherGCs have had deep surveys of X-ray sources before MSPs were de-tected therein (e.g. Henleywillis et al. 2018). Also, Bahramian et al.(2020) provided a comprehensive catalogue of faint X-ray sourcesin 38 GCs, which may contain information about MSPs. In addition,to test the robustness of X-ray luminosities derived by Bahramianet al. (2020), we collected a dozen MSPs with well determined X-rayluminosities in the literature, and compared the literature values withthe corresponding X-ray luminosities in the Bahramian catalogue.We found the values agree within their errors, and hence the X-rayluminosities presented by Bahramian et al. (2020) appear reliable.Three GCs (M53, NGC 6342, and NGC 6517), however, do not havepublished X-ray surveys yet, though archival CXO data is availableon them. Therefore, we collected and extracted X-ray information(e.g. fluxes and luminosities) of GCMSPs based on previous studiesof them. To normalize the X-ray energy range, we use unabsorbedX-ray luminosities in the 0.3–8 keV band as the normalization, andall the X-ray MSPs and sources studied in other energy bands wereconverted into the 0.3–8 keV band via the Chandra proposal plan-ning tool, pimms2. Generally, the errors introduced by assuming aspectrum to convert bands (e.g. 0.5-2 to 0.3-8) in pimms are < 20%,if 𝑁𝐻 does not exceed 1022 cm−2. These errors, however, are gen-erally small when compared with the statistical errors of low countsources3, typical of MSPs in this work. The choice of energy band0.3–8 keV emphasizes theX-ray emission fromMSPs, including boththermal and non-thermal X-rays.
2.1 GC MSPs with X-ray analysis
A few GCs contain a large number of MSPs, like 38 MSPs found inTerzan 5 and 27 MSPs found in 47 Tuc, and hence they are of greatinterest to study the X-ray properties of GC MSPs. Given the deepX-ray observations by CXO as well as radio timing observations ofthese MSPs, their X-ray spectra may be well extracted and modeled,and therefore we can simply obtain their X-ray luminosities andother properties from corresponding studies. For instance, there are20MSPs in 47 Tuc that have spectral analysis with well fitted modelsand unabsorbed luminosities (seeBogdanov et al. 2006;Bhattacharyaet al. 2017). Similarly, most MSPs in M13 and NGC 6752, and manyin Terzan 5 and M28, also have well determined X-ray luminosities(Bogdanov et al. 2011; Forestell et al. 2014; Linares et al. 2014;Bogdanov et al. 2021; Zhao et al. 2021).
2 https://asc.harvard.edu/toolkit/pimms.jsp3 See https://cxc.harvard.edu/ciao/why/pimms.html for more de-tails.
MNRAS 000, 1–20 (2015)
X-ray MSPs in GCs 3
Table 1. Parameters for the GCs in this work.
GC Name Distance𝑎 𝑁H𝑏 NMSP𝑐 NMSP,T𝑑 Encounter Rate𝑒 Lim. 𝐿𝑋
𝑓 Reference of(kpc) (cm−2) ΓSE (erg s−1) Lim. 𝐿𝑋
47 Tuc (NGC 104) 4.5 3.48 × 10²⁰ 27 23 1000 +154−134 3 × 1029 1
NGC 1851 12.1 1.74 × 10²⁰ 13 1 1530 +198−186 ∗
M53 (NGC 5024) 17.9 1.74 × 10²⁰ 3 0 35.4 +12.4−9.6 3 × 1031 2
𝜔 Cen (NGC 5139) 5.2 1.05 × 10²¹ 5 2 90.4 +26.3−20.4 1 × 1030 3
M3 (NGC 5272) 10.2 8.71 × 10¹⁹ 6 2 194.0 +33.1−18.0 2 × 1031 4
M5 (NGC 5904) 7.5 2.61 × 10²⁰ 7 3 164.0 +38.6−0.4 5 × 1030 5
NGC 5986 10.4 2.44 × 10²¹ 1 0 61.9 +15.9−10.4 ∗∗
M4 (NGC 6121) 2.2 3.05 × 10²¹ 1 1 26.90 +11.60−9.56 3 × 1029 5
M13 (NGC 6205) 7.4 1.74 × 10²⁰ 6 6 68.9 +18.1−14.6 5 × 1030 5
M12 (NGC 6218) 4.8 1.66 × 10²¹ 1 0 13.00 +5.44−4.03 6 × 1030 5
M10 (NGC 6254) 4.4 2.44 × 10²¹ 2 0 31.40 +4.34−4.08 5 × 1030 5
M62 (NGC 6266) 6.8 4.09 × 10²¹ 7 6 1670 +709−569 3 × 1030 5
M92 (NGC 6341) 8.3 1.74 × 10²⁰ 1 1 270.0 +30.1−29.0 6 × 1030 5
NGC 6342 8.5 4.01 × 10²¹ 1 0 44.8 +14.4−12.5 5 × 1031 2
Terzan 1 6.7 1.73 × 10²² 6 0 0.292 +0.274−0.170 2 × 1031 5
M14 (NGC 6402) 9.3 5.23 × 10²¹ 5 1 124.0 +31.8−30.2 6 × 1031 5
NGC 6397 2.3 1.57 × 10²¹ 2 2 84.1 +18.3−18.3 1 × 1029 5
Terzan 5 6.9 1.99 × 10²² 38 37 6800 +1040−3020 1 × 1030 5
NGC 6440 8.5 9.32 × 10²¹ 7 5 1400 +628−477 4 × 1031 6
NGC 6441 11.6 4.09 × 10²¹ 5 3 2300 +974−635 ∗
NGC 6517 10.6 9.41 × 10²¹ 8 6 338.0 +152.0−97.5 3 × 1031 2
NGC 6522 7.7 4.18 × 10²¹ 4 1 363.0 +113.0−98.5 5 × 1030 5
NGC 6539 7.8 8.89 × 10²¹ 1 1 42.1 +28.6−15.3 5 × 1031 5
NGC 6544 3.0 6.62 × 10²¹ 2 2 111.0 +67.8−36.5 6 × 1030 5
NGC 6624 7.9 2.44 × 10²¹ 9 3 1150 +113−178 ∗
M28 (NGC 6626) 5.5 3.48 × 10²¹ 13 8 648.0 +83.8−91.1 8 × 1029 5
NGC 6652 10.0 7.84 × 10²⁰ 2 0 700 +292−189 2 × 1031 7
M22 (NGC 6656) 3.2 2.96 × 10²¹ 2 2 77.5 +31.9−25.9 8 × 1029 5
NGC 6712 6.9 3.92 × 10²¹ 1 1 30.80 +5.63−6.64 ∗
NGC 6749 7.9 1.31 × 10²² 2 1 51.5 +40.7−20.9 ∗∗
NGC 6752 4.0 3.48 × 10²⁰ 9 6 401 +182−126 3 × 1029 8
NGC 6760 7.4 6.71 × 10²¹ 2 2 56.9 +26.6−19.4 1 × 1031 5
M71 (NGC 6838) 4.0 2.18 × 10²¹ 2 1 1.470 +0.146−0.138 2 × 1030 9
M15 (NGC 7078) 10.4 8.71 × 10²⁰ 5 4 4510 +1360−986 ∗
M2 (NGC 7089) 11.5 5.23 × 10²⁰ 5 0 518.0 +77.6−71.4 6 × 1031 5
M30 (NGC 7099) 8.1 2.61 × 10²⁰ 2 1 324.0 +124.0−81.2 2 × 1030 5
Notes: 𝑎 Distance to GCs collected from Harris (1996, 2010 edition).𝑏 Hydrogen column number density towards GCs calculated based on correlation between 𝑁H and optical extinction, 𝐴𝑉
(Bahramian et al. 2015).𝑐 Number of discovered MSPs.𝑑 Number of discovered MSPs with precise timing positions.𝑒 Stellar encounter rate ΓSE estimated by Bahramian et al. (2013), with 1-𝜎 errors.𝑓 The limiting unabsorbed X-ray luminosity estimated in the band 0.3–8 keV. Reference: (1) Cheng et al. (2019); (2) this work(see section 3.2); (3) Henleywillis et al. (2018); (4) Zhao et al. (2019); (5) Bahramian et al. (2020); (6) Pooley et al. (2002);(7) Stacey et al. (2012); (8) Forestell et al. (2014); (9) Elsner et al. (2008).∗ Severely contaminated by bright X-ray sources (see Verbunt & Lewin 2006).∗∗ No CXO observations
While new MSPs are continuously being discovered in GCs (e.g.Pan et al. 2021b; Ridolfi et al. 2021), most do not yet have precisetiming positions. Alternatively, we can constrain the X-ray lumi-nosities for MSPs without precise timing positions by setting upperlimits using the known cluster X-ray sources. Given the detailedmultiwavelength analyses of several GCs (e.g. Pooley et al. 2002;Edmonds et al. 2003; Heinke et al. 2005), most X-ray sources with𝐿𝑋 & 3×1032 erg s−1 have been identified as CVs, LMXBs, etc, andonly faint X-ray sources (𝐿𝑋 . 1032 erg s−1) often remain uniden-tified. Since MSPs are typically faint X-ray emitters, we can thendefine the X-ray luminosity upper limit of those MSPs without X-ray
identifications in one GC as the luminosity of the brightest uniden-tified X-ray source in that GC. Hence we simply use one upper limitof X-ray luminosity for each cluster for all the MSPs without knownpositions in that cluster. While for those MSPs with published timingpositions but not studied yet in X-rays, we briefly look into theirX-ray luminosities and place upper limits for them (see below). Itis a conservative definition but fair enough to give us a sense of theX-ray brightness of those MSPs.
We note that X-ray studies of GC sources generally assume a singlepower-law spectrum with a fixed photon index Γ for all the detectedfaint sources (e.g. Cackett et al. 2006; Henleywillis et al. 2018), and
MNRAS 000, 1–20 (2015)
4 J. Zhao & C. O. Heinke
consequently the fitted parameters might not reflect their intrinsicX-ray properties.
2.2 GC X-ray analysis in this work
Webriefly analyzeCXOobservations of threeGCs (M53,NGC6342,and NGC 6517) that have not been studied yet to constrain the X-rayluminosities of the sources therein. Also, we analyze X-ray spectraof six MSPs with clear X-ray counterparts at their precise timingpositions in five GCs (𝜔 Cen, M5, M92, M14, and NGC 6544). Inaddition, we extract X-ray flux limits for those MSPs with timingpositions but without an X-ray counterpart to calculate their upperlimits of X-ray luminosities (25 MSPs in 10 GCs; see Table A1).We note that MSPs with new timing positions in the cluster M62will require detailed X-ray studies, as the potential counterparts arelocated in a crowded core where careful astrometric considerationswill be necessary (see e.g. Bogdanov et al. 2021 for a similar analysisof Terzan 5). Therefore, we only give upper limits of their X-rayluminosities in this paper, and will study them carefully in futurework. The data reduction and analysis were performed using ciao4(version 4.13, caldb 4.9.4, Fruscione et al. 2006). All the Chandraobservation data were first reprocessed using the chandra_reproscript to create new level 2 event files that apply the latest calibrationupdates and bad pixel files. Plus, we filtered the data to the energyband 0.3–8 keV to keep consistency. No background flares weredetected in the CXO observations, except for M92 and NGC 6544(see below).Furthermore, we checked the astrometry between the X-ray im-
ages and the radio timing positions for the clusters where we performX-ray analysis. We first ran the wavdetect script, a Mexican-HatWavelet source detection algorithm5, to get the X-ray positions ofbright sources on the S3 chip (the aimpoint chip for most Chandraobservations), or the I0-I3 chips for the 𝜔 Cen observations. Thenwe checked Gaia Data Release 3 (DR3; Gaia Collaboration et al.2016, 2021) to see if there are one or more bright Gaia stars (withG-band magnitude < 16 mag to reduce the number of chance co-incidences) within 1′′ of the Chandra sources, outside the clusterhalf-light radius. We applied the mean value of the offsets betweenChandra and Gaia detections in each cluster to MSP positions tocorrect absolute astrometry, and used the corrected positions for thefollowing analysis. We found the offsets are (+0.110′′, −0.125′′),(+0.194′′, −0.017′′), (−0.011′′, −0.163′′), and (+0.012′′, +0.052′′)for the clusters 𝜔 Cen, M92, M14, and NGC 6544, respectively, inR.A. and Dec.For the cluster M5, however, we could not find any eligible
Chandra-Gaia matches to refine the astrometric alignment. How-ever, based on the radio timing position of PSR J1518+0204C (orM5C) in M5, we found its X-ray counterpart on the Chandra imagevia wavdetect, with a radial offset of ∼0.4′′ to the radio position.Since the overall 90% uncertainty circle of Chandra X-ray absoluteposition has a radius of 0.8′′,6 and the probability of a spurious as-sociation is low (about 1% chance of the pulsar lying within 1′′ofone of the 8 X-ray sources in the core), we argue that the Chandraabsolute astrometric accuracy for M5 is satisfactory for the followinganalysis.
4 Chandra Interactive Analysis of Observations, available at https://cxc.cfa.harvard.edu/ciao/.5 https://cxc.cfa.harvard.edu/ciao/threads/wavdetect/6 see https://cxc.harvard.edu/cal/ASPECT/celmon/
Table 2. Chandra observations of M53, NGC 6342, and NGC 6517
Date of Observation ExposureGC Name Instrument Observation ID Time (ks)
M53 ACIS-S 2006 Nov 13 6560 24.5NGC 6342 ACIS-S 2009 Jul 10 9957 15.8NGC 6517 ACIS-S 2009 Feb 04 9597 23.6
2.2.1 M53, NGC 6342, and NGC 6517
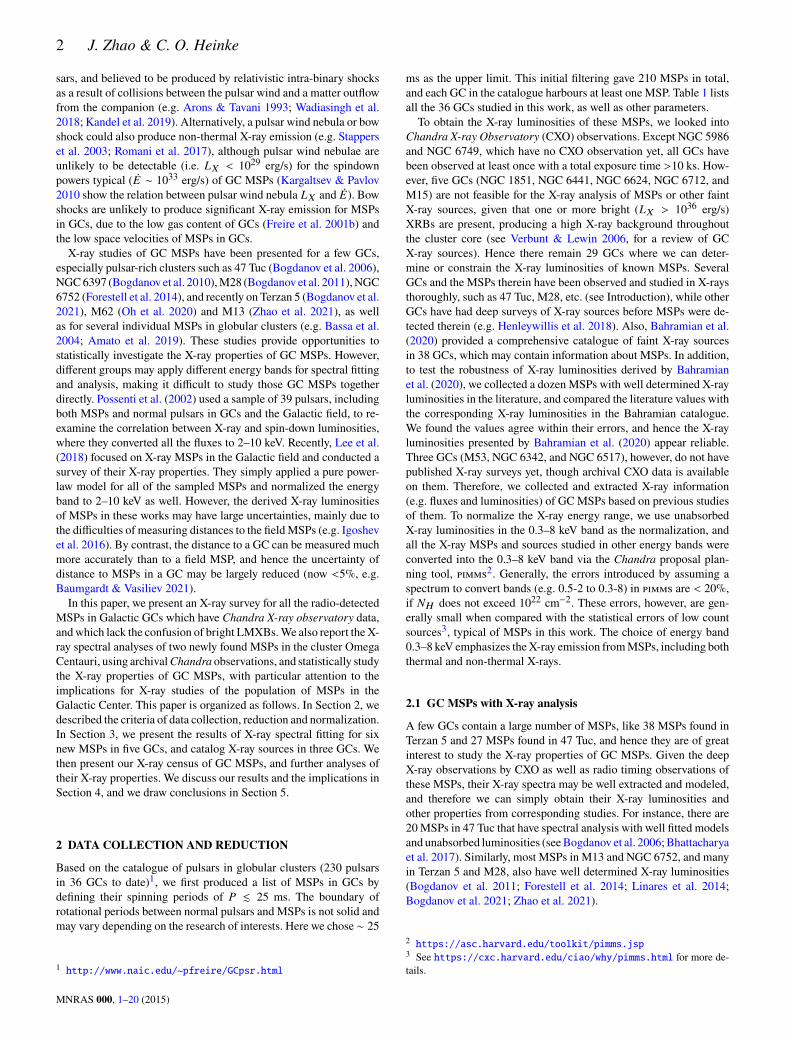
Each of M53, NGC 6342, and NGC 6517 has been observed onceby CXO in the VFAINT mode, with exposure times ranging from15 ks to 25 ks (see Table 2). We formally detected X-ray sources ineach GC by using wavdetect. We set the wavelet scales of 1.0, 1.4,2.0, and 4.0, and the significance threshold of 10−6 (false positivesper pixel). The detected X-ray sources are shown in Figure 1 (greencontours). To generate the X-ray luminosities of those sources, wefirst extracted their spectra from the detection regions provided bywavdetect (shown in Fig. 1) running dmextract in ds9. (We alsotried to extract spectra using 1′′ radii circular regions and found thatthe results changed little, e.g. the spectral results remained withinthe errors. Hence we used the regions generated by wavdetect forconvenience.) With additional known observation information (e.g.Chandra cycles, detectors), we converted count rates into unabsorbedX-ray fluxes and luminosities via pimms, assuming a power-law spec-trum with a photon index of 1.7 for those sources, and distances fromHarris (1996, 2010 revision). The choice of a power-law model witha photon index of 1.7 is a compromise that is typical of backgroundAGN (Giacconi et al. 2001), and of globular cluster X-ray sources at𝐿𝑋 ∼ 1031 erg s−1 (e.g. Zhao et al. 2020b, their Fig. 4), typical forthese observations (see Table 5).
2.2.2 𝜔 Cen
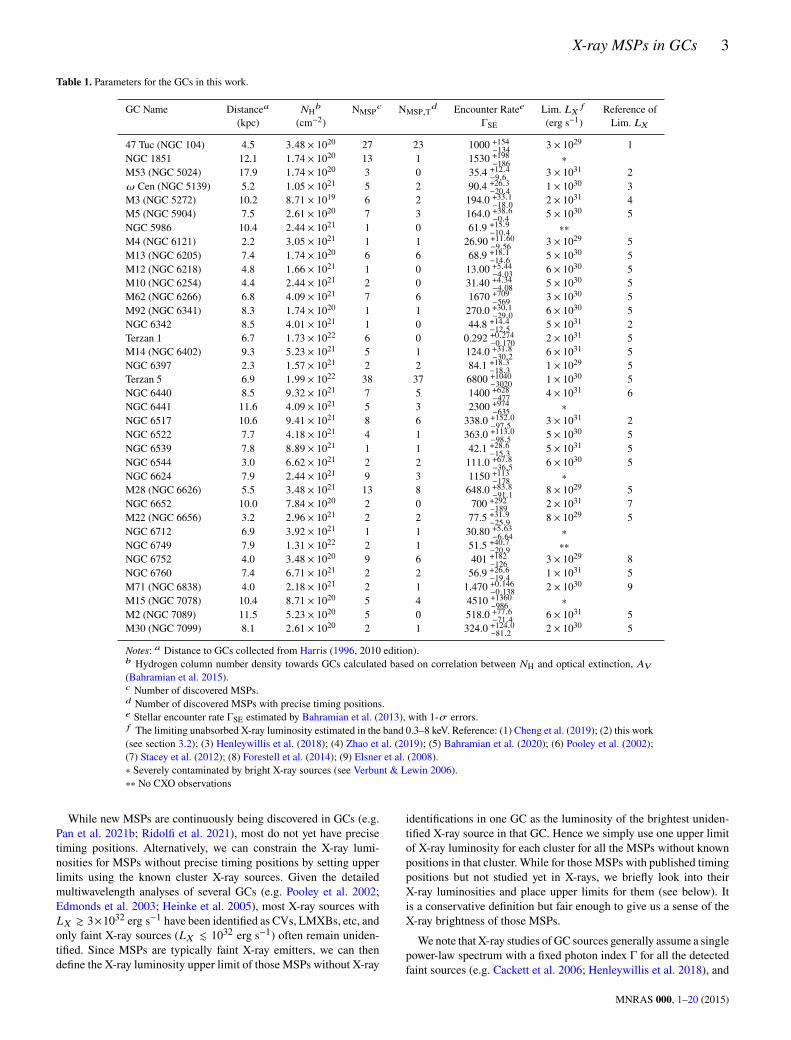
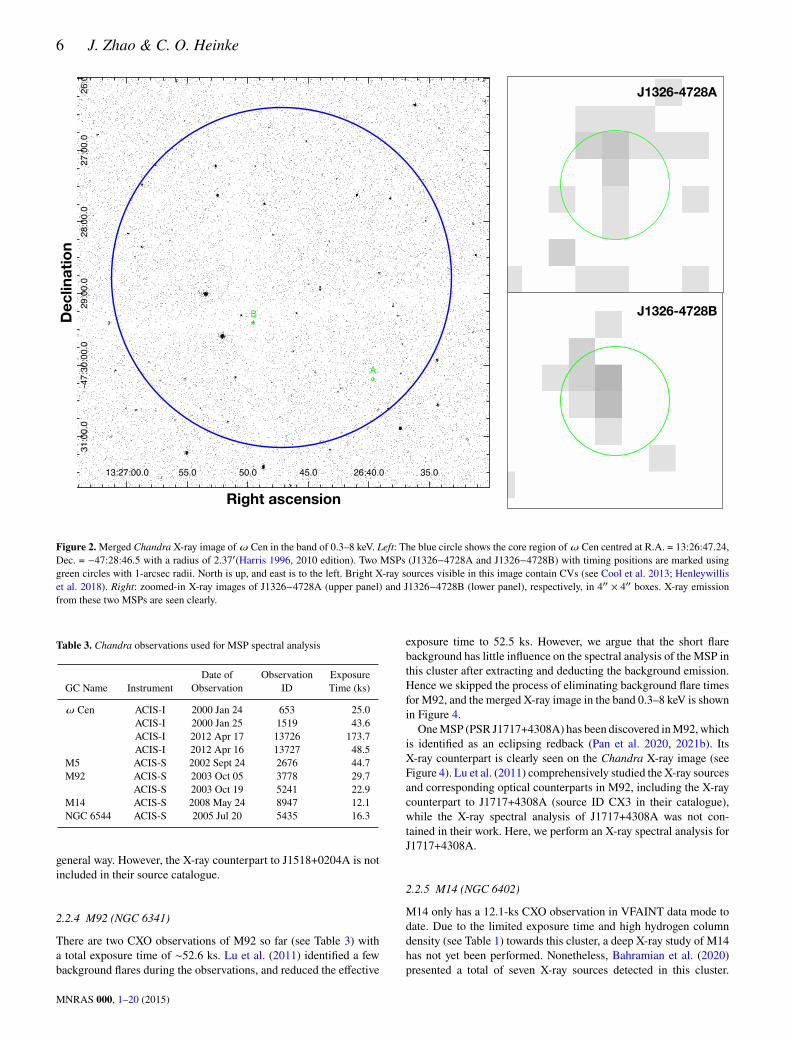
The X-ray data of 𝜔 Cen used in this work consist of four CXOobservations, with a total exposure time of 290.1 ks (see Table 3).All of the four observations were imaged using the ACIS-I imagingarray and configured in VFAINTmode.We created a co-added X-rayimage of 𝜔 Cen in 0.3–8 keV band by merging four level 2 event filesusing merge_obs (Figure 2).Since 𝜔 Cen has had a deep and comprehensive X-ray study re-
cently by Henleywillis et al. (2018) (see also Cool et al. 2013), weonly focus on the MSPs in 𝜔 Cen discovered since their work. Thereare five MSPs found to date in 𝜔 Cen (Dai et al. 2020), and only twoof them (J1326−4728A and J1326−4728B) have precise timing po-sitions. To analyse the X-ray spectra and obtain luminosities of thesetwoMSPs, we first extractedX-ray emission from the circular regionswith a 1-arcsec radius centred on the radio timing positions (greencircles in Figure 2) by using specextract. We performed the ex-traction process for each observation separately, and then combinedthe spectra for eachMSP correspondingly using combine_spectra.The background was taken from source-free annular areas around theMSPs.
2.2.3 M5 (NGC 5904)
M5 has been observed once by CXO with an exposure time of 44.7ks in the FAINT data mode. Figure 3 shows the X-ray image ofM5 in the band 0.3–8 keV. Seven MSPs have been found in thiscluster so far (Wolszczan et al. 1989; Anderson et al. 1997; Hesselset al. 2007; Pan et al. 2021a, and another, yet unpublished, by
MNRAS 000, 1–20 (2015)
X-ray MSPs in GCs 5
53.0 52.5 52.0 51.5 51.0 50.5 18:01:50.0 49.5 49.0 48.5 48.0
-8:57:00.0
10.0
20.0
30.0
40.0
50.0
58:00.0
4.0 13.0 12.0 11.0 17:21:10.0 09.0 08.0 07.0 06.0
34:30.0
-19:35:00.0
30.0
36:00.0
02.0 13:13:00.0 58.0 56.0 54.0 52.0 12:50.0
30.0
11:00.0
30.0
18:10:00.0
30.0
09:00.0
(a) M53 (b) NGC 6342
(c) NGC 6517
Right ascension Right ascension
Right ascension
Dec
linat
ion
Dec
linat
ion
Dec
linat
ion
50.9 50.8 50.7 50.6 18:01:50.5 50.4 50.3 50.2 50.1
26.0
28.0
-8:57:30.0
32.0
34.0
36.0
Figure 1. Chandra X-ray images in the band 0.3–8 keV of M53, or NGC 5024 (a); NGC 6342 (b); and NGC 6517 (c), respectively. The smaller blue circle ineach panel shows the core region of the corresponding GC with a radius of 0.35′, 0.05′, and 0.06′, respectively, while the larger blue circle shows the half-lightradius of 1.31′, 0.73′, and 0.50′, respectively (Harris 1996, 2010 edition). Green contours indicate X-ray sources detected by wavdetect (see text for details).For each cluster, the GC region searched was defined as 1.2 times the half-light radius. North is up, and east is to the left. For NGC 6517, we also marked outthe MSPs therein with known timing positions using magenta circles with 1′′ radii, while the zoomed-in figure shows the central 10′′ × 10′′ region. We note thatPSR J1801−0857D in NGC 6517 has timing positions though, it is distant from the centre with an offset of 1.2′and hence not included in this figure.
FAST, 7), while only three of them (J1518+0204A, J1518+0204B,and J1518+0204C) have precise timing positions (marked by greencircles in Figure 3;Anderson et al. 1997; Pallanca et al. 2014).Amongthese threeMSPs, J1518+0204A shows a clear X-ray detection on the
7 https://crafts.bao.ac.cn/pulsar/SP2/
Chandra image (see the inset box in Figure 3), and its counterpart isdetected by wavdetect. Hence we are able to performX-ray spectralanalysis for J1518+0204A.We note that no individual X-ray study ofM5 has yet been published, while Bahramian et al. (2020) presentedthe X-ray source detections and source properties of this cluster in a
MNRAS 000, 1–20 (2015)
6 J. Zhao & C. O. Heinke
50.2 13:26:50.0 49.8 49.6 49.4 49.2 49.0
22.5
23.0
23.5
24.0
24.5
-47:29:25.0
25.5
26.0
26.5
27.0
27.5
40.2 13:26:40.0 39.8 39.6 39.4 39.2
09.5
-47:30:10.0
10.5
11.0
11.5
12.0
12.5
13.0
13.5
14.0
J1326-4728A
J1326-4728B
13:27:00.0 55.0 50.0 45.0 26:40.0 35.0
26:0
27:00.0
28:00.0
29:00.0
-47:30:00.0
31:00.0
B
A
Right ascension
Dec
linat
ion
Figure 2.Merged Chandra X-ray image of 𝜔 Cen in the band of 0.3–8 keV. Left: The blue circle shows the core region of 𝜔 Cen centred at R.A. = 13:26:47.24,Dec. = −47:28:46.5 with a radius of 2.37′(Harris 1996, 2010 edition). Two MSPs (J1326−4728A and J1326−4728B) with timing positions are marked usinggreen circles with 1-arcsec radii. North is up, and east is to the left. Bright X-ray sources visible in this image contain CVs (see Cool et al. 2013; Henleywilliset al. 2018). Right: zoomed-in X-ray images of J1326−4728A (upper panel) and J1326−4728B (lower panel), respectively, in 4′′ × 4′′ boxes. X-ray emissionfrom these two MSPs are seen clearly.
Table 3. Chandra observations used for MSP spectral analysis
Date of Observation ExposureGC Name Instrument Observation ID Time (ks)
𝜔 Cen ACIS-I 2000 Jan 24 653 25.0ACIS-I 2000 Jan 25 1519 43.6ACIS-I 2012 Apr 17 13726 173.7ACIS-I 2012 Apr 16 13727 48.5
M5 ACIS-S 2002 Sept 24 2676 44.7M92 ACIS-S 2003 Oct 05 3778 29.7
ACIS-S 2003 Oct 19 5241 22.9M14 ACIS-S 2008 May 24 8947 12.1NGC 6544 ACIS-S 2005 Jul 20 5435 16.3
general way. However, the X-ray counterpart to J1518+0204A is notincluded in their source catalogue.
2.2.4 M92 (NGC 6341)
There are two CXO observations of M92 so far (see Table 3) witha total exposure time of ∼52.6 ks. Lu et al. (2011) identified a fewbackground flares during the observations, and reduced the effective
exposure time to 52.5 ks. However, we argue that the short flarebackground has little influence on the spectral analysis of the MSP inthis cluster after extracting and deducting the background emission.Hence we skipped the process of eliminating background flare timesfor M92, and the merged X-ray image in the band 0.3–8 keV is shownin Figure 4.OneMSP (PSR J1717+4308A) has been discovered inM92,which
is identified as an eclipsing redback (Pan et al. 2020, 2021b). ItsX-ray counterpart is clearly seen on the Chandra X-ray image (seeFigure 4). Lu et al. (2011) comprehensively studied the X-ray sourcesand corresponding optical counterparts in M92, including the X-raycounterpart to J1717+4308A (source ID CX3 in their catalogue),while the X-ray spectral analysis of J1717+4308A was not con-tained in their work. Here, we perform an X-ray spectral analysis forJ1717+4308A.
2.2.5 M14 (NGC 6402)
M14 only has a 12.1-ks CXO observation in VFAINT data mode todate. Due to the limited exposure time and high hydrogen columndensity (see Table 1) towards this cluster, a deep X-ray study of M14has not yet been performed. Nonetheless, Bahramian et al. (2020)presented a total of seven X-ray sources detected in this cluster.
MNRAS 000, 1–20 (2015)

X-ray MSPs in GCs 7
40.0 38.0 36.0 34.0 32.0 15:18:30.0 28.0 26.0
30.0
06:00.0
30.0
2:05:00.0
30.0
04:00.0
30.0
C
B
A
Right ascension
Dec
linat
ion
5:18:33.0 32.9 32.9 32.8 32.8 32.7 32.7
2:04:50
49.5
49.0
48.5
48.0
47.5
47.0
46.5
46.0
Figure 3. Chandra X-ray image of M5 in the band 0.3–8 keV. The smallerblue circle shows the 0.44′ core radius of M5, while the larger one shows the1.77′ half-light radius, and both are centred at R.A. = 15:18:33.22, Dec. =+02:04:51.7 (Harris 1996, 2010 edition). North is up, and east is to the left.Three MSPs (J1518+0204A, J1518+0204B, and J1518+0204C) with timingpositions are labeled with green circles with 1′′ radii, while the inset 4′′ × 4′′box shows the zoomed-in image of J1518+0204C .
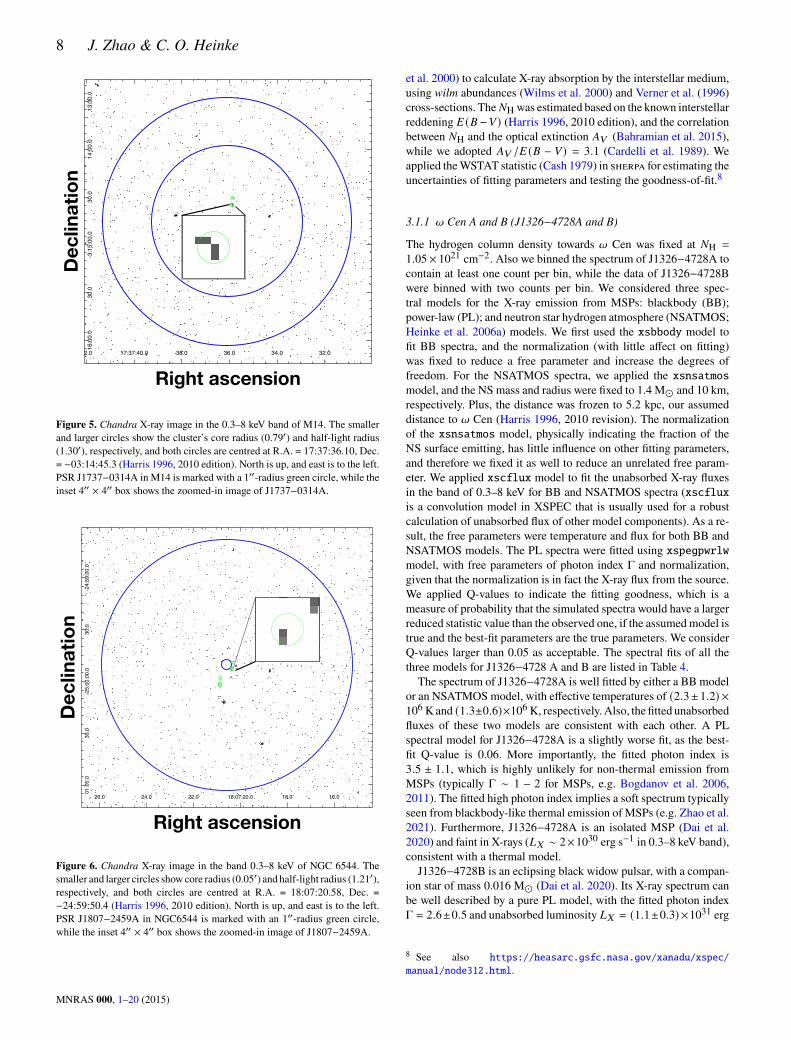
Five MSPs have been found recently in M14 by Pan et al. (2021b),although only PSR J1737−0314A has a published precise timing so-lution. The timing solution for PSR J1737−0314A indicates a blackwidow system, but the discovery observation was not long enoughto exclude the possibility of eclipses, given the orbital period of∼5.5 hours with an observation length of 2 hours (Pan et al. 2021b).Hence it is not clear if this pulsar is eclipsing. None of the X-raysources published by Bahramian et al. (2020) are the counterpartto J1737−0314A, though there appears to be X-ray emission at itstiming position. In this work, we extract and analyze the X-ray spec-trum of J1737−0314A based on its timing position. The ChandraX-ray image and X-ray emission from J1737−0314A can be foundin Figure 5.
2.2.6 NGC 6544
There is one CXO observation of NGC 6544, with ∼16.3 ks exposuretime and FAINT data configuration. SinceNGC6544 is a cluster withsubstantial background flaring, we eliminated the high backgroundtimes by limiting the count rate <15 counts s−1 from the entirechip S3, resulting in an effective exposure time of ∼12.7 ks. NGC6544 is a so-called core-collapsed GC, with a core radius of only0.05′′ (Harris 1996, 2010 edition). Two MSPs (J1807−2459A andJ1807−2459B)with timing positions have been discovered in this GC(D’Amico et al. 2001; Ransom et al. 2001; Lynch et al. 2012), whileonly J1807−2459A shows a clear X-ray counterpart (see Figure 6).Bahramian et al. (2020) published eight X-ray sources in NGC 6544,although the X-ray counterpart to J1807−2459A is not included. Weperform X-ray analysis for this MSP in this paper.
Right ascension
Dec
linat
ion
5:18:33.0 32.9 32.9 32.8 32.8 32.7 32.7
2:04:50
49.5
49.0
48.5
48.0
47.5
47.0
46.5
46.0
4.0 12.0 17:17:10.0 08.0 06.0 04.0 02.0
09:00.0
30.0
43:08:00.0
30.0
A
6.8 06.7 06.6 17:17:06.5 06.4 06.3 06.2
0706.0
05.0
43:08:04.0
03.0
02.0
01.0
Figure 4. Merged Chandra X-ray image of M92 in the band 0.3–8 keV. Thesmaller blue circle shows the 0.26′ core radius, while the larger one shows the1.02′ half-light radius of M92, and both are centred at R.A. = 17:17:07.39,Dec. = +43:08:09.4 (Harris 1996, 2010 edition). North is up, and east is tothe left. The only discovered MSP (J1717+4308A) in M92 is marked witha 1′′-radius green circle, while the inset 4′′ × 4′′ box shows the zoomed-inimage of J1717+4308A. Other bright X-ray sources in the image contain CVs(see Lu et al. 2011).
2.2.7 Other MSPs with timing positions
There is another group of MSPs that have radio timing positions buthave no or few X-ray counts from corresponding regions, like theMSPs in NGC 6517 (see Figure 1.c). In this work, we briefly investi-gate their X-ray properties to further constrain the X-ray luminositydistribution of GC MSPs. For these MSPs, we apply CXO observa-tions of their corresponding GCs and extract their X-ray fluxes withina circle with 1-arcsec radius and centred at their timing positions.We use srcflux in ds9 to calculate the unabsorbed X-ray fluxes inthe band 0.3–8 keV, by assuming a single power-law model with aphoton index of 1.7 and fixed values of 𝑁H to corresponding GCs(see Table 1). If a GC has multiple archival CXO observations, weapply the one with longest exposure time. We note that, since twotransient LMXBs have been discovered in the cluster NGC 6440 byChandra (see e.g., in’t Zand et al. 2001; Heinke et al. 2010), we needto choose the observation (Obs ID: 947) that was not influenced bythe two transients to obtain reasonable X-ray upper limits for theMSPs therein. In addition, if no X-ray counts are detected in thecircular region for a MSP, we place the limiting X-ray luminosity ofthe corresponding GC (see Table 1) as its upper limit.
3 ANALYSIS AND RESULTS
3.1 New X-ray spectral fits in this work
We used sherpa, ciao’s modeling and fitting tool, to perform thespectral fits. We assumed fixed hydrogen column densities (𝑁H)towards corresponding GCs and applied the xstbabsmodel (Wilms
MNRAS 000, 1–20 (2015)
8 J. Zhao & C. O. Heinke
Right ascension
Dec
linat
ion
5:18:33.0 32.9 32.9 32.8 32.8 32.7 32.7
2:04:50
49.5
49.0
48.5
48.0
47.5
47.0
46.5
46.0
2.0 17:37:40.0 38.0 36.0 34.0 32.0
13:30.0
14:00.0
30.0
-3:15:00.0
30.0
16:00.0
A
36.1 36.1 36.0 17:37:36.0 35.9 35.9 35.8 35.8 35.7
32.0
33.0
34.0
-3:14:35.0
36.0
37.0
Figure 5. Chandra X-ray image in the 0.3–8 keV band of M14. The smallerand larger circles show the cluster’s core radius (0.79′) and half-light radius(1.30′), respectively, and both circles are centred at R.A. = 17:37:36.10, Dec.= −03:14:45.3 (Harris 1996, 2010 edition). North is up, and east is to the left.PSR J1737−0314A in M14 is marked with a 1′′-radius green circle, while theinset 4′′ × 4′′ box shows the zoomed-in image of J1737−0314A.
26.0 24.0 22.0 18:07:20.0 18.0 16.0
-24:59:00.0
30.0
-25:00:00.0
30.0
01:00.0
A
B
20.5 20.5 20.4 18:07:20.4 20.3 20.3 20.2
50.5
51.0
51.5
52.0
52.5
-24:59:53.0
53.5
54.0
54.5
55.0
Right ascension
Dec
linat
ion
Figure 6. Chandra X-ray image in the band 0.3–8 keV of NGC 6544. Thesmaller and larger circles showcore radius (0.05′) and half-light radius (1.21′),respectively, and both circles are centred at R.A. = 18:07:20.58, Dec. =−24:59:50.4 (Harris 1996, 2010 edition). North is up, and east is to the left.PSR J1807−2459A in NGC6544 is marked with an 1′′-radius green circle,while the inset 4′′ × 4′′ box shows the zoomed-in image of J1807−2459A.
et al. 2000) to calculate X-ray absorption by the interstellar medium,using wilm abundances (Wilms et al. 2000) and Verner et al. (1996)cross-sections. The 𝑁H was estimated based on the known interstellarreddening 𝐸 (𝐵−𝑉) (Harris 1996, 2010 edition), and the correlationbetween 𝑁H and the optical extinction 𝐴𝑉 (Bahramian et al. 2015),while we adopted 𝐴𝑉 /𝐸 (𝐵 − 𝑉) = 3.1 (Cardelli et al. 1989). Weapplied theWSTAT statistic (Cash 1979) in sherpa for estimating theuncertainties of fitting parameters and testing the goodness-of-fit.8
3.1.1 𝜔 Cen A and B (J1326−4728A and B)
The hydrogen column density towards 𝜔 Cen was fixed at 𝑁H =
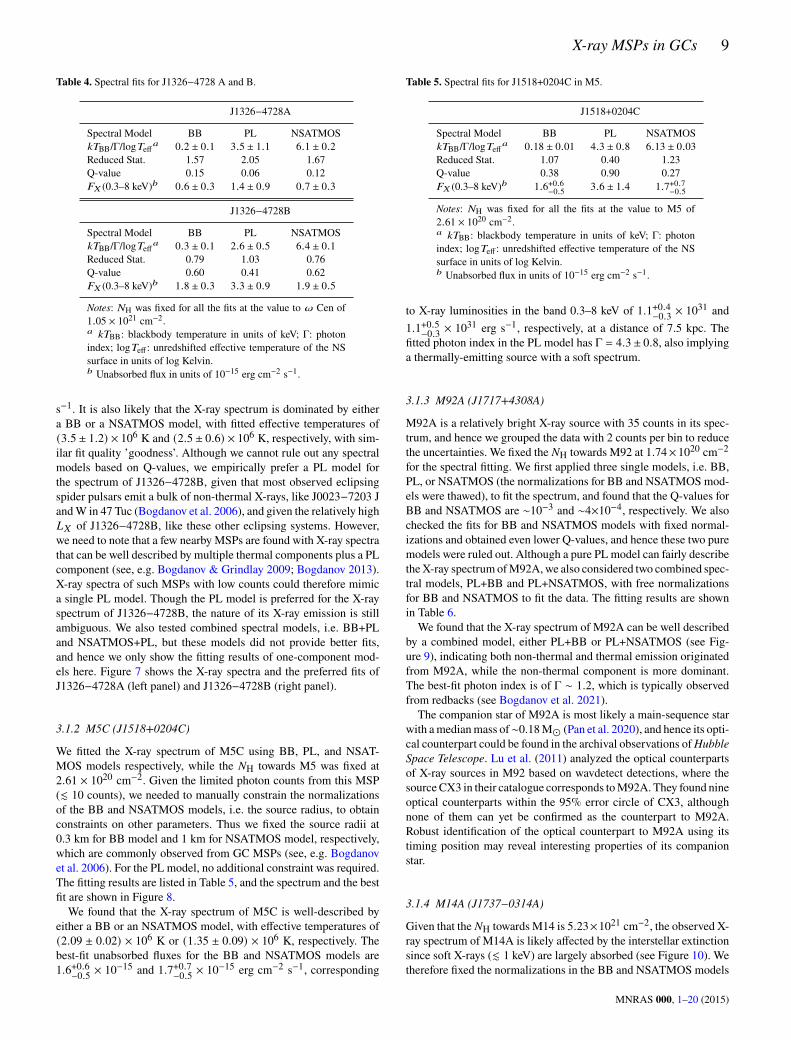
1.05× 1021 cm−2. Also we binned the spectrum of J1326−4728A tocontain at least one count per bin, while the data of J1326−4728Bwere binned with two counts per bin. We considered three spec-tral models for the X-ray emission from MSPs: blackbody (BB);power-law (PL); and neutron star hydrogen atmosphere (NSATMOS;Heinke et al. 2006a) models. We first used the xsbbody model tofit BB spectra, and the normalization (with little affect on fitting)was fixed to reduce a free parameter and increase the degrees offreedom. For the NSATMOS spectra, we applied the xsnsatmosmodel, and the NS mass and radius were fixed to 1.4 M� and 10 km,respectively. Plus, the distance was frozen to 5.2 kpc, our assumeddistance to 𝜔 Cen (Harris 1996, 2010 revision). The normalizationof the xsnsatmos model, physically indicating the fraction of theNS surface emitting, has little influence on other fitting parameters,and therefore we fixed it as well to reduce an unrelated free param-eter. We applied xscflux model to fit the unabsorbed X-ray fluxesin the band of 0.3–8 keV for BB and NSATMOS spectra (xscfluxis a convolution model in XSPEC that is usually used for a robustcalculation of unabsorbed flux of other model components). As a re-sult, the free parameters were temperature and flux for both BB andNSATMOS models. The PL spectra were fitted using xspegpwrlwmodel, with free parameters of photon index Γ and normalization,given that the normalization is in fact the X-ray flux from the source.We applied Q-values to indicate the fitting goodness, which is ameasure of probability that the simulated spectra would have a largerreduced statistic value than the observed one, if the assumedmodel istrue and the best-fit parameters are the true parameters. We considerQ-values larger than 0.05 as acceptable. The spectral fits of all thethree models for J1326−4728 A and B are listed in Table 4.The spectrum of J1326−4728A is well fitted by either a BB model
or an NSATMOSmodel, with effective temperatures of (2.3±1.2) ×106Kand (1.3±0.6)×106K, respectively.Also, the fitted unabsorbedfluxes of these two models are consistent with each other. A PLspectral model for J1326−4728A is a slightly worse fit, as the best-fit Q-value is 0.06. More importantly, the fitted photon index is3.5 ± 1.1, which is highly unlikely for non-thermal emission fromMSPs (typically Γ ∼ 1 − 2 for MSPs, e.g. Bogdanov et al. 2006,2011). The fitted high photon index implies a soft spectrum typicallyseen from blackbody-like thermal emission of MSPs (e.g. Zhao et al.2021). Furthermore, J1326−4728A is an isolated MSP (Dai et al.2020) and faint in X-rays (𝐿𝑋 ∼ 2×1030 erg s−1 in 0.3–8 keV band),consistent with a thermal model.J1326−4728B is an eclipsing black widow pulsar, with a compan-
ion star of mass 0.016 M� (Dai et al. 2020). Its X-ray spectrum canbe well described by a pure PL model, with the fitted photon indexΓ = 2.6±0.5 and unabsorbed luminosity 𝐿𝑋 = (1.1±0.3) ×1031 erg
8 See also https://heasarc.gsfc.nasa.gov/xanadu/xspec/manual/node312.html.
MNRAS 000, 1–20 (2015)
X-ray MSPs in GCs 9
Table 4. Spectral fits for J1326−4728 A and B.
J1326−4728A
Spectral Model BB PL NSATMOS𝑘𝑇BB/Γ/log𝑇eff𝑎 0.2 ± 0.1 3.5 ± 1.1 6.1 ± 0.2Reduced Stat. 1.57 2.05 1.67Q-value 0.15 0.06 0.12𝐹𝑋 (0.3–8 keV)𝑏 0.6 ± 0.3 1.4 ± 0.9 0.7 ± 0.3
J1326−4728B
Spectral Model BB PL NSATMOS𝑘𝑇BB/Γ/log𝑇eff𝑎 0.3 ± 0.1 2.6 ± 0.5 6.4 ± 0.1Reduced Stat. 0.79 1.03 0.76Q-value 0.60 0.41 0.62𝐹𝑋 (0.3–8 keV)𝑏 1.8 ± 0.3 3.3 ± 0.9 1.9 ± 0.5
Notes: 𝑁H was fixed for all the fits at the value to 𝜔 Cen of1.05 × 1021 cm−2.𝑎 𝑘𝑇BB: blackbody temperature in units of keV; Γ: photonindex; log𝑇eff : unredshifted effective temperature of the NSsurface in units of log Kelvin.𝑏 Unabsorbed flux in units of 10−15 erg cm−2 s−1.
s−1. It is also likely that the X-ray spectrum is dominated by eithera BB or a NSATMOS model, with fitted effective temperatures of(3.5 ± 1.2) × 106 K and (2.5 ± 0.6) × 106 K, respectively, with sim-ilar fit quality ’goodness’. Although we cannot rule out any spectralmodels based on Q-values, we empirically prefer a PL model forthe spectrum of J1326−4728B, given that most observed eclipsingspider pulsars emit a bulk of non-thermal X-rays, like J0023−7203 JandW in 47 Tuc (Bogdanov et al. 2006), and given the relatively high𝐿𝑋 of J1326−4728B, like these other eclipsing systems. However,we need to note that a few nearby MSPs are found with X-ray spectrathat can be well described by multiple thermal components plus a PLcomponent (see, e.g. Bogdanov & Grindlay 2009; Bogdanov 2013).X-ray spectra of such MSPs with low counts could therefore mimica single PL model. Though the PL model is preferred for the X-rayspectrum of J1326−4728B, the nature of its X-ray emission is stillambiguous. We also tested combined spectral models, i.e. BB+PLand NSATMOS+PL, but these models did not provide better fits,and hence we only show the fitting results of one-component mod-els here. Figure 7 shows the X-ray spectra and the preferred fits ofJ1326−4728A (left panel) and J1326−4728B (right panel).
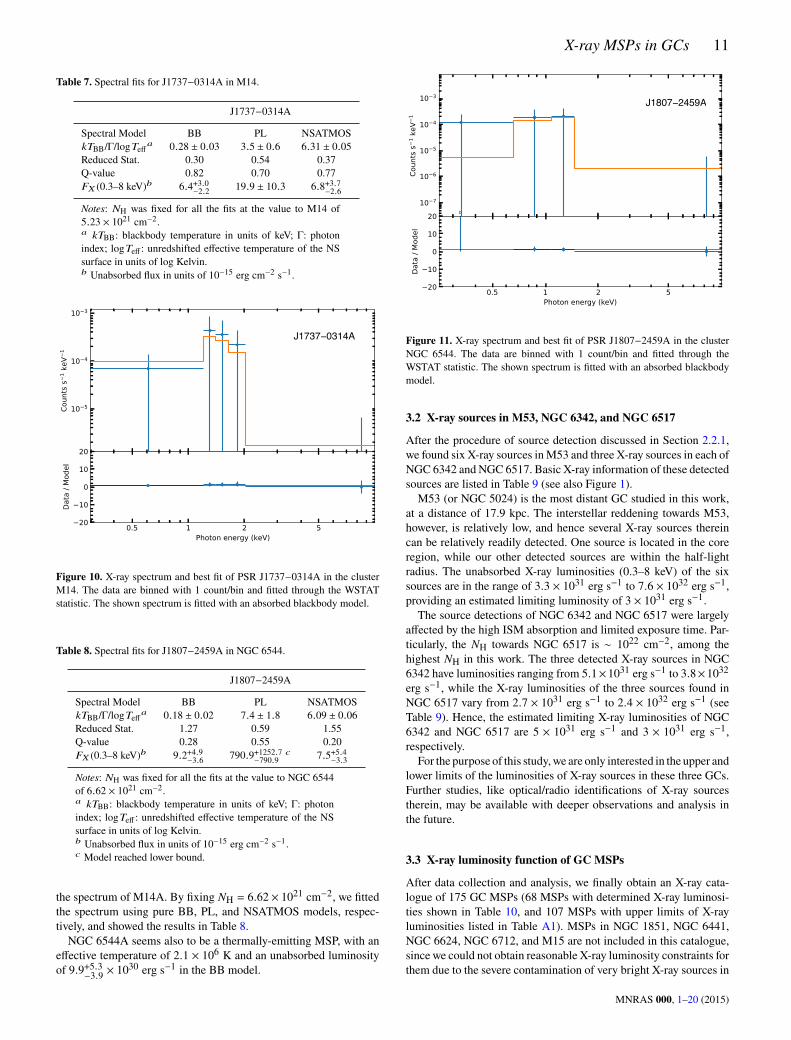
3.1.2 M5C (J1518+0204C)
We fitted the X-ray spectrum of M5C using BB, PL, and NSAT-MOS models respectively, while the 𝑁H towards M5 was fixed at2.61 × 1020 cm−2. Given the limited photon counts from this MSP(. 10 counts), we needed to manually constrain the normalizationsof the BB and NSATMOS models, i.e. the source radius, to obtainconstraints on other parameters. Thus we fixed the source radii at0.3 km for BB model and 1 km for NSATMOS model, respectively,which are commonly observed from GC MSPs (see, e.g. Bogdanovet al. 2006). For the PL model, no additional constraint was required.The fitting results are listed in Table 5, and the spectrum and the bestfit are shown in Figure 8.We found that the X-ray spectrum of M5C is well-described by
either a BB or an NSATMOS model, with effective temperatures of(2.09 ± 0.02) × 106 K or (1.35 ± 0.09) × 106 K, respectively. Thebest-fit unabsorbed fluxes for the BB and NSATMOS models are1.6+0.6−0.5 × 10
−15 and 1.7+0.7−0.5 × 10⁻¹⁵ erg cm−2 s−1, corresponding
Table 5. Spectral fits for J1518+0204C in M5.
J1518+0204C
Spectral Model BB PL NSATMOS𝑘𝑇BB/Γ/log𝑇eff𝑎 0.18 ± 0.01 4.3 ± 0.8 6.13 ± 0.03Reduced Stat. 1.07 0.40 1.23Q-value 0.38 0.90 0.27𝐹𝑋 (0.3–8 keV)𝑏 1.6+0.6−0.5 3.6 ± 1.4 1.7+0.7−0.5
Notes: 𝑁H was fixed for all the fits at the value to M5 of2.61 × 1020 cm−2.𝑎 𝑘𝑇BB: blackbody temperature in units of keV; Γ: photonindex; log𝑇eff : unredshifted effective temperature of the NSsurface in units of log Kelvin.𝑏 Unabsorbed flux in units of 10−15 erg cm−2 s−1.
to X-ray luminosities in the band 0.3–8 keV of 1.1+0.4−0.3 × 1031 and
1.1+0.5−0.3 × 1031 erg s−1, respectively, at a distance of 7.5 kpc. The
fitted photon index in the PL model has Γ = 4.3± 0.8, also implyinga thermally-emitting source with a soft spectrum.
3.1.3 M92A (J1717+4308A)
M92A is a relatively bright X-ray source with 35 counts in its spec-trum, and hence we grouped the data with 2 counts per bin to reducethe uncertainties. We fixed the 𝑁H towards M92 at 1.74×1020 cm−2
for the spectral fitting. We first applied three single models, i.e. BB,PL, or NSATMOS (the normalizations for BB and NSATMOS mod-els were thawed), to fit the spectrum, and found that the Q-values forBB and NSATMOS are ∼10−3 and ∼4×10⁻⁴, respectively. We alsochecked the fits for BB and NSATMOS models with fixed normal-izations and obtained even lower Q-values, and hence these two puremodels were ruled out. Although a pure PL model can fairly describetheX-ray spectrum ofM92A,we also considered two combined spec-tral models, PL+BB and PL+NSATMOS, with free normalizationsfor BB and NSATMOS to fit the data. The fitting results are shownin Table 6.We found that the X-ray spectrum of M92A can be well described
by a combined model, either PL+BB or PL+NSATMOS (see Fig-ure 9), indicating both non-thermal and thermal emission originatedfrom M92A, while the non-thermal component is more dominant.The best-fit photon index is of Γ ∼ 1.2, which is typically observedfrom redbacks (see Bogdanov et al. 2021).The companion star of M92A is most likely a main-sequence star
with amedianmass of∼0.18M� (Pan et al. 2020), and hence its opti-cal counterpart could be found in the archival observations ofHubbleSpace Telescope. Lu et al. (2011) analyzed the optical counterpartsof X-ray sources in M92 based on wavdetect detections, where thesourceCX3 in their catalogue corresponds toM92A. They found nineoptical counterparts within the 95% error circle of CX3, althoughnone of them can yet be confirmed as the counterpart to M92A.Robust identification of the optical counterpart to M92A using itstiming position may reveal interesting properties of its companionstar.
3.1.4 M14A (J1737−0314A)
Given that the 𝑁H towards M14 is 5.23×1021 cm−2, the observed X-ray spectrum of M14A is likely affected by the interstellar extinctionsince soft X-rays (. 1 keV) are largely absorbed (see Figure 10). Wetherefore fixed the normalizations in the BB and NSATMOS models
MNRAS 000, 1–20 (2015)

10 J. Zhao & C. O. Heinke
J1326� 4728A− J1326� 4728B−
Figure 7. X-ray spectra and best fits of two MSPs in 𝜔 Cen, J1326−4728A (left, fit with an absorbed blackbody) and J1326−4728B (right, fit with an absorbedpower-law), respectively, in energy range of 0.3-8 keV. The data of J1326−4728A are binned with 1 count/bin, while the data of J1326−4728B are binned with2 count/bin. Both spectra are fitted via the WSTAT statistic.
J1518+0204C
Figure 8.X-ray spectrum and best fit of PSR J1518+0204C in the cluster M5.The data are binned with 1 count/bin and fitted through the WSTAT statistic.The shown spectrum is fitted with an absorbed blackbody model.
Table 6. Spectral fits for J1717+4308A in M92.
J1717+4308A
Spectral Model PL PL+BB PL+NSATMOSΓ𝑎 1.8 ± 0.3 1.2 ± 0.6 1.2 ± 0.5𝑘𝑇BB/log𝑇eff𝑎 − 0.16 ± 0.04 6.0 ± 0.1Reduced Stat. 1.23 1.27 1.24Q-value 0.23 0.21 0.23𝐹𝑋 (0.3–8 keV)𝑏 8.8 ± 1.7 10.3+4.3−3.0 (7.8
+2.2−2.2) 10.1+2.6−2.6 (7.6
+2.1−2.2)
Notes: 𝑁H was fixed for all the fits at the value to M92 of 1.74 × 1020 cm−2.𝑎 𝑘𝑇BB: blackbody temperature in units of keV; Γ: photon index; log𝑇eff :unredshifted effective temperature of the NS surface in units of log Kelvin.𝑏 Unabsorbed flux in units of 10−15 erg cm−2 s−1. The values in parenthesesrepresent the flux of the PL component.
J1717+4308A
Figure 9. X-ray spectrum and best fit of PSR J1717+4308A in the clusterM92. The data are binned with 2 count/bin and fitted through the WSTATstatistic. The shown spectrum is fitted with a power-law component plus anNSATMOS component.
with the same values applied for M5C (see above) to get reasonablefits. The fitting results for M14A are listed in Table 7.The X-ray emission generated from M14A is most likely thermal-
dominated, given the fitted photon index in the PL model is Γ =
3.5 ± 0.6. The spectral fits via a pure BB or a pure NSATMOSmodel have similar quality. The unabsorbed luminosity (0.3–8 keV)indicated by the BB model is 6.6+3.1−2.3 × 10
31 erg s−1 at the distanceof 9.3 kpc, making it the most X-ray-luminous BW so far.
3.1.5 NGC 6544A (J1807−2459A)
The observed X-ray spectrum of NGC 6544A is also significantlyimpacted by the interstellar extinction towards the cluster (see Fig-ure 11). Hence, we applied a similar fitting process as used for fitting
MNRAS 000, 1–20 (2015)
X-ray MSPs in GCs 11
Table 7. Spectral fits for J1737−0314A in M14.
J1737−0314A
Spectral Model BB PL NSATMOS𝑘𝑇BB/Γ/log𝑇eff𝑎 0.28 ± 0.03 3.5 ± 0.6 6.31 ± 0.05Reduced Stat. 0.30 0.54 0.37Q-value 0.82 0.70 0.77𝐹𝑋 (0.3–8 keV)𝑏 6.4+3.0−2.2 19.9 ± 10.3 6.8+3.7−2.6
Notes: 𝑁H was fixed for all the fits at the value to M14 of5.23 × 1021 cm−2.𝑎 𝑘𝑇BB: blackbody temperature in units of keV; Γ: photonindex; log𝑇eff : unredshifted effective temperature of the NSsurface in units of log Kelvin.𝑏 Unabsorbed flux in units of 10−15 erg cm−2 s−1.
J1737−0314A
Figure 10. X-ray spectrum and best fit of PSR J1737−0314A in the clusterM14. The data are binned with 1 count/bin and fitted through the WSTATstatistic. The shown spectrum is fitted with an absorbed blackbody model.
Table 8. Spectral fits for J1807−2459A in NGC 6544.
J1807−2459A
Spectral Model BB PL NSATMOS𝑘𝑇BB/Γ/log𝑇eff𝑎 0.18 ± 0.02 7.4 ± 1.8 6.09 ± 0.06Reduced Stat. 1.27 0.59 1.55Q-value 0.28 0.55 0.20𝐹𝑋 (0.3–8 keV)𝑏 9.2+4.9−3.6 790.9+1252.7−790.9
𝑐 7.5+5.4−3.3
Notes: 𝑁H was fixed for all the fits at the value to NGC 6544of 6.62 × 1021 cm−2.𝑎 𝑘𝑇BB: blackbody temperature in units of keV; Γ: photonindex; log𝑇eff : unredshifted effective temperature of the NSsurface in units of log Kelvin.𝑏 Unabsorbed flux in units of 10−15 erg cm−2 s−1.𝑐 Model reached lower bound.
the spectrum of M14A. By fixing 𝑁H = 6.62 × 1021 cm−2, we fittedthe spectrum using pure BB, PL, and NSATMOS models, respec-tively, and showed the results in Table 8.NGC 6544A seems also to be a thermally-emitting MSP, with an
effective temperature of 2.1 × 10⁶ K and an unabsorbed luminosityof 9.9+5.3−3.9 × 10
30 erg s−1 in the BB model.
J1807−2459A
Figure 11. X-ray spectrum and best fit of PSR J1807−2459A in the clusterNGC 6544. The data are binned with 1 count/bin and fitted through theWSTAT statistic. The shown spectrum is fitted with an absorbed blackbodymodel.
3.2 X-ray sources in M53, NGC 6342, and NGC 6517
After the procedure of source detection discussed in Section 2.2.1,we found six X-ray sources inM53 and three X-ray sources in each ofNGC 6342 and NGC 6517. Basic X-ray information of these detectedsources are listed in Table 9 (see also Figure 1).M53 (or NGC 5024) is the most distant GC studied in this work,
at a distance of 17.9 kpc. The interstellar reddening towards M53,however, is relatively low, and hence several X-ray sources thereincan be relatively readily detected. One source is located in the coreregion, while our other detected sources are within the half-lightradius. The unabsorbed X-ray luminosities (0.3–8 keV) of the sixsources are in the range of 3.3 × 1031 erg s−1 to 7.6 × 1032 erg s−1,providing an estimated limiting luminosity of 3 × 1031 erg s−1.The source detections of NGC 6342 and NGC 6517 were largely
affected by the high ISM absorption and limited exposure time. Par-ticularly, the 𝑁H towards NGC 6517 is ∼ 1022 cm−2, among thehighest 𝑁H in this work. The three detected X-ray sources in NGC6342 have luminosities ranging from 5.1×1031 erg s−1 to 3.8×1032erg s−1, while the X-ray luminosities of the three sources found inNGC 6517 vary from 2.7 × 1031 erg s−1 to 2.4 × 1032 erg s−1 (seeTable 9). Hence, the estimated limiting X-ray luminosities of NGC6342 and NGC 6517 are 5 × 1031 erg s−1 and 3 × 1031 erg s−1,respectively.For the purpose of this study,we are only interested in the upper and
lower limits of the luminosities of X-ray sources in these three GCs.Further studies, like optical/radio identifications of X-ray sourcestherein, may be available with deeper observations and analysis inthe future.
3.3 X-ray luminosity function of GC MSPs
After data collection and analysis, we finally obtain an X-ray cata-logue of 175 GC MSPs (68 MSPs with determined X-ray luminosi-ties shown in Table 10, and 107 MSPs with upper limits of X-rayluminosities listed in Table A1). MSPs in NGC 1851, NGC 6441,NGC 6624, NGC 6712, and M15 are not included in this catalogue,since we could not obtain reasonable X-ray luminosity constraints forthem due to the severe contamination of very bright X-ray sources in
MNRAS 000, 1–20 (2015)
12 J. Zhao & C. O. Heinke
Table 9. Basic X-ray properties of catalogue sources in M53, NGC 6342, and NGC 6517.
GC Source Position (J2000) Counts𝑎 𝐹𝑋 (0.3–8 keV)𝑏
ID 𝛼 (hh:mm:ss) 𝛿 (◦:′:′′) (0.3–8 keV) (×10−15 erg cm−2 s−1)
M53 1 13:12:58.4792 +18:09:25.378 13.9 ± 3.7 4.1 ± 1.1M53 2 13:12:51.7781 +18:09:33.452 34.9 ± 5.9 10.2 ± 1.7M53 3 13:12:52.2771 +18:09:57.910 67.7 ± 8.2 19.8 ± 2.4M53 4 13:12:56.0651 +18:10:01.569 19.7 ± 4.5 5.8 ± 1.3M53 5 13:12:58.5790 +18:10:29.349 2.9 ± 1.7 0.9 ± 0.5M53 6 13:12:55.3503 +18:10:35.137 13.7 ± 3.7 4.0 ± 1.1
NGC 6342 1 17:21:08.7022 −19:35:54.729 20.9 ± 4.6 15.6 ± 3.4NGC 6342 2 17:21:09.7821 −19:35:21.656 7.9 ± 2.8 5.9 ± 2.1NGC 6342 3 17:21:09.6572 −19:35:16.323 58.9 ± 7.7 43.9 ± 5.7
NGC 6517 1 18:01:50.6799 −8:57:33.665 25.1 ± 5.1 17.8 ± 3.6NGC 6517 2 18:01:51.4020 −8:57:25.036 4.8 ± 2.2 3.4 ± 1.6NGC 6517 3 18:01:49.7506 −8:58:02.592 2.8 ± 1.7 2.0 ± 1.2𝑎 Estimated net counts obtained by dmextract; errors are set to 1-𝜎.𝑏 Unabsorbed fluxes assuming a PL model with a photon index Γ = 1.7; errors are set to 1-𝜎.
these globular clusters. Also, X-ray luminosities for MSPs in NGC5986 and NGC 6749 are unavailable because of the lack of sensitive(Chandra) X-ray observations.Using this catalogue, we are able to empirically investigate the X-
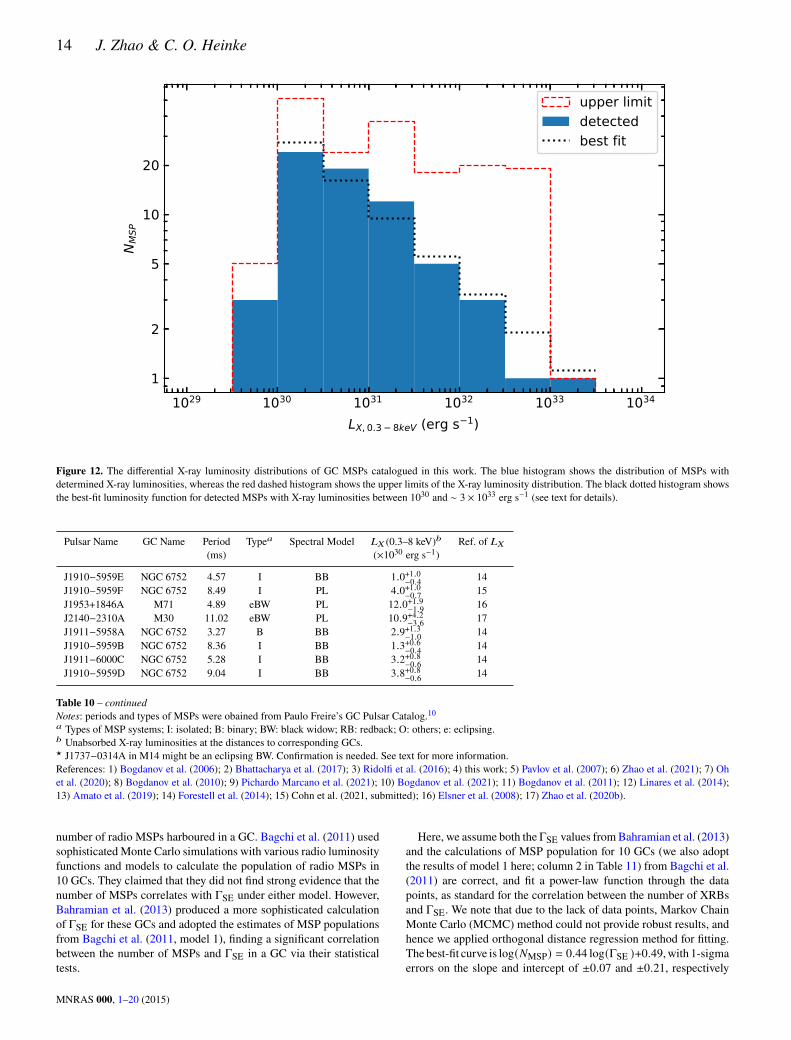
ray luminosity function of GCMSPs. Figure 12 shows the differentialX-ray luminosity distributions for two groups,MSPswith determinedX-ray luminosities (blue histogram) and allMSPs in our catalogue in-cluding those with upper limits (red dashed histogram), respectively.We found that most detected GCMSPs have X-ray luminosities rang-ing from ∼ 1030 to ∼ 3 × 1031 erg s−1 in the band 0.3–8 keV. Andthe X-ray luminosity distribution of measured GCMSPs is plausiblya power-law-like pattern, well described by 𝑁MSP ∝ 𝐿𝑋
−0.46±0.07
(see the black dotted histogram in Figure 12; 1-sigma confidencelevel; though this distribution is likely strongly affected by our notcorrecting for censorship of the data—that is, by the upper limits). Onthe other hand, the upper limits of X-ray luminosities are distributedmore evenly between 1030 and 1033 erg s−1 (likely reflecting the var-ied X-ray exposures of GCs, principally). At the bright end, we seethe well-known X-ray-bright MSP, B1821−24A (𝐿𝑋 ∼ 1.4 × 1033erg s−1) in M28, alone.We also investigate the X-ray luminosity functions for different
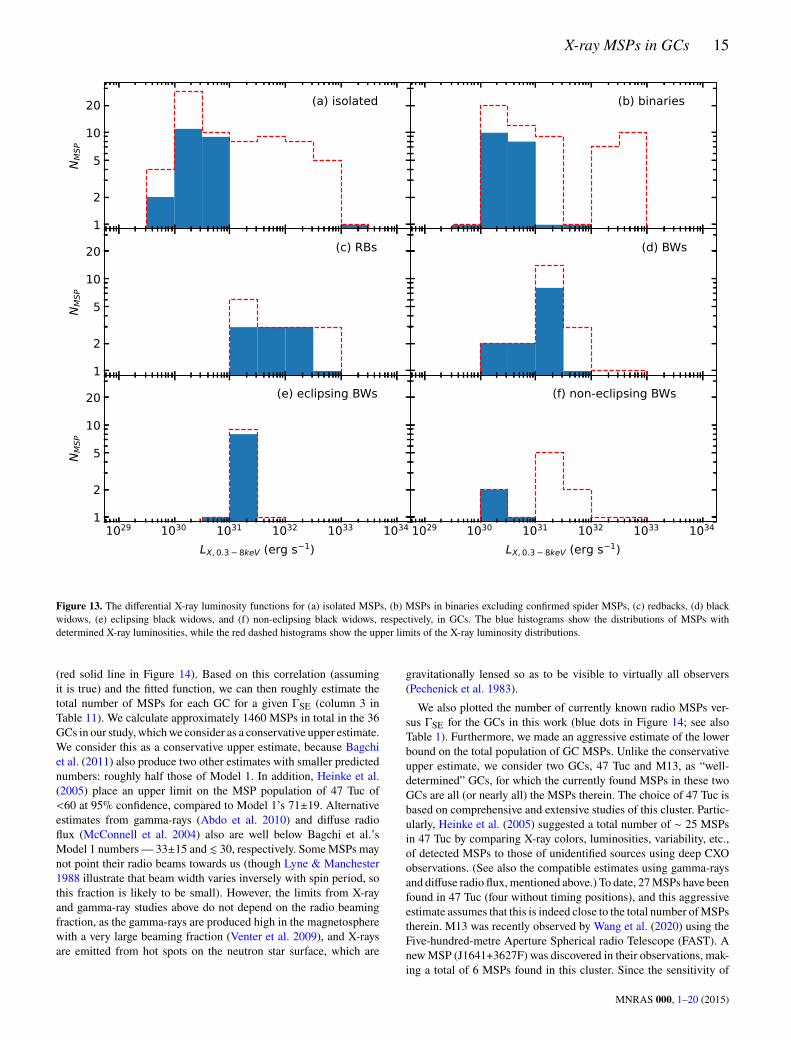
MSP groups separately (Figure 13). It is found that all the isolatedMSPs in GCs, except M28A, are relatively faint, with X-ray lumi-nosities lower than 1030 erg s−1 (see Figure 13a). Most of the MSPsin binary systems, excluding confirmed spider pulsars, are also faintin X-rays and of similar luminosity distribution with isolated MSPs(Figure 13b). It can interpreted as the same origin of X-ray emis-sion from those MSP systems, that is thermal X-rays generated fromhotspots near the NS magnetic poles. It is noticeable that all the de-tected RBs are among the brighter GC MSP population, with X-rayluminosities of 1.7× 1031–3.4× 1032 erg s−1 (Figure 13c), implyingthat non-thermal X-ray emission produced by intra-binary shocksdominates over thermal emission from the NS surface. More intrigu-ingly, the X-ray luminosities of detected eclipsing BWs are between𝐿𝑋 (0.3–8 keV) = 7.0 × 1030 and 2.0 × 1031 erg s−1 , while the con-firmed non-eclipsing BWs are almost an order of magnitude fainter(1.5× 1030 and 3× 1030 erg s−1) than the eclipsing BWs, except oneat 9.9 × 1030 erg s−1 (Figure 13e and f). (Again, additional observa-tions are needed to confirm if J1737−0314A is eclipsing, so we didnot count it as either an eclipsing or a non-eclipsing BW; see also2.2.5). This observed difference could suggest the population of non-
eclipsing black widows are basically the same as the eclipsing blackwidows except for inclination (as suggested by Freire 2005, notingthe lower mass functions of the non-eclipsing systems). In this case,the difference in 𝐿𝑋 is also due to inclination (following the modelsof the intra-binary shocks that indicate the synchrotron X-rays maybe beamed in the plane of the binary to some extent). Alternatively,the population of non-eclipsing black widows are actually differentfrom the eclipsing black widows. These systems may have similar in-clinations, but lower-mass companions, that do not produce as strongwinds (see e.g. Bailes et al. 2011; Kaplan et al. 2018).However, we need to note some observational biases that may
significantly impact the X-ray luminosity distributions of GC MSPs.Given that few GCs have limiting X-ray luminosities lower than ∼1030 erg s−1 (see Table 1), many very faint X-ray MSPs (𝐿𝑋 < 1030erg s−1) are not detectable. For instance, a few nearby MSPs in theGalactic field have been found to show very faint X-ray luminosities,down to ∼ 1 × 1029 erg s−1 (e.g. PSR J1400−1431, Swiggum et al.2017). Also, most MSPs in Terzan 5 remain undetectable in X-rays due to the high absorption towards this GC, even though it hasbeen observed extensively by CXO (see e.g. Bogdanov et al. 2021).Furthermore, the upper limits of X-ray luminosities for some MSPsmay be quite conservative. Particularly, we simply placed one upperlimit for all the MSPs without timing solutions in each GC, definedas the X-ray luminosity of the most luminous unidentified X-raysource in that GC. Therefore, we note that the upper limit of X-ray luminosity distribution does not necessarily reflect the estimatednumber of MSPs in each luminosity range, as they could be ordersof magnitude dimmer than the placed upper limits.
3.4 Number of MSPs versus stellar encounter rate
We re-examined the correlation between the number of MSPs andstellar encounter rate (ΓSE) for GCs in this work (see Table 1).It is well established that the number of X-ray binaries in a GChas a strong correlation with the GC stellar encounter rate (see e.g.Pooley et al. 2003; Heinke et al. 2003; Bahramian et al. 2013). Onewould naturally assume a correlation between the number of MSPsand ΓSE in a GC, since MSPs are offspring of LMXBs. However,the difficulty to establish such a correlation is determining the total
MNRAS 000, 1–20 (2015)
X-ray MSPs in GCs 13
Table 10. Determined X-ray luminosities of GC MSPs
Pulsar Name GC Name Period Type𝑎 Spectral Model 𝐿𝑋 (0.3–8 keV)𝑏 Ref. of 𝐿𝑋
(ms) (×1030 erg s−1)
J0023−7204C 47 Tuc 5.76 I BB 1.7+0.3−0.6 1J0024−7204D 47 Tuc 5.36 I BB 3.3+0.4−0.8 1J0024−7205E 47 Tuc 3.54 B BB 5.0+0.6−0.9 1J0024−7204F 47 Tuc 2.62 I BB 2.3+1.0−0.4 2J0024−7204H 47 Tuc 3.21 B BB 3.2+0.3−0.8 1J0023−7203J 47 Tuc 2.10 eBW BB+PL 11.6+2.3−3.7 1J0024−7204L 47 Tuc 4.35 I BB 8.6+0.8−1.0 1J0023−7205M 47 Tuc 3.68 I BB 2.4+0.3−0.7 1J0024−7204N 47 Tuc 3.05 I BB 2.4+0.4−0.7 1J0024−7204O 47 Tuc 2.64 eBW BB+PL 10.8+3.5−2.1 1J0024−7204Q 47 Tuc 4.03 B BB 2.4+0.3−0.7 1J0024−7204R 47 Tuc 3.48 eBW BB 7.0+0.4−1.4 1J0024−7204S 47 Tuc 2.83 B BB 4.2+0.7−0.7 2J0024−7204T 47 Tuc 7.59 B BB 1.5+0.3−0.6 1J0024−7203U 47 Tuc 4.34 B BB 3.2+0.3−0.8 1J0024−7204W 47 Tuc 2.35 eRB BB+PL 26.4+1.0−6.3 1J0024−7201X 47 Tuc 4.77 B BB 2.2+0.6−0.6 3J0024−7204Y 47 Tuc 2.20 B BB 2.5+0.2−0.7 1J0024−7205Z 47 Tuc 4.55 I BB 3.5+0.5−0.5 2J0024−7205aa 47 Tuc 3.69 I BB 0.9+0.4−0.3 2J0024−7204ab 47 Tuc 3.70 I BB 2.0+0.4−0.5 2J1326−4728A 𝜔 Cen 4.11 I BB 1.9+1.0−1.0 4J1326−4728B 𝜔 Cen 4.79 eBW PL 10.7+3.0−3.0 4J1518+0204C M5 2.48 eBW BB 10.8+4.0−3.8 4B1620−26 M4 11.08 O BB 3.0+0.7−0.7 5J1641+3627B M13 3.53 B PL 9.2+4.6−4.6 6J1641+3627C M13 3.72 I BB 3.9+1.3−0.7 6J1641+3627D M13 3.12 B BB 5.9+1.3−0.7 6J1641+3627E M13 2.49 eBW PL 12.5+4.6−4.6 6J1641+3627F M13 3.00 B BB 7.9+1.3−0.7 6J1701−3006B M62 3.59 eRB PL 101.0+25.9−21.0 7J1701−3006C M62 7.61 B PL 59.0+12.0−12.0 7J1717+4308A M92 3.16 eRB BB+PL 83.3+21.4−21.4 4J1737−0314A M14 1.98 BW★ BB 66.2+31.1−22.8 4J1740−5340A NGC 6397 3.65 eRB PL 22.2+2.6−2.5 7J1740−5340B NGC 6397 5.79 eRB PL 67.0+0.5−0.1 8, 9J1748−2446A Terzan 5 11.56 eRB PL 89.9+27.2−27.2 10J1748−2446E Terzan 5 2.20 B PL 1.9+0.7−0.2 10J1748−2446F Terzan 5 5.54 I PL 5.3+1.9−1.5 10J1748−2446H Terzan 5 4.93 I PL 4.4+1.7−1.4 10J1748−2446K Terzan 5 2.97 I PL 1.3+0.6−0.5 10J1748−2446L Terzan 5 2.24 I PL 8.3+2.0−1.8 10J1748−2446N Terzan 5 8.67 B PL 1.4+0.6−0.4 10J1748−2446O Terzan 5 1.68 eBW PL 20.3+3.2−3.2 10J1748−2446P Terzan 5 1.73 eRB PL 335.6+21.4−18.4 10J1748−2446Q Terzan 5 2.81 B PL 0.6+0.5−0.4 10J1748−2446V Terzan 5 2.07 B PL 21.0+9.8−7.0 10J1748−2446X Terzan 5 3.00 B PL 3.1+1.3−1.3 10J1748−2446Z Terzan 5 2.46 B PL 6.8+1.3−1.3 10J1748−2446ad Terzan 5 1.40 eRB PL 139.1+16.6−12.5 10J1807−2459A NGC 6544 3.06 BW BB 9.9+5.3−3.9 4B1821−24A M28 3.05 I PL 1375.7+47.1−32.6 11J1824−2452C M28 4.16 B PL 2.0+0.6−0.5 11J1824−2452E M28 5.42 I PL 2.3+0.7−0.6 11J1824−2452F M28 2.45 I PL 1.4+0.4−0.3 11J1824−2452H M28 4.63 eRB PL 17.4+3.3−13.0 11J1824−2452I M28 3.93 eRB PL 220.0+40.0−40.0 12J1824−2452J M28 4.04 BW PL 1.5+0.2−0.2 11J1824−2452K M28 4.46 B PL 6.2+0.9−0.9 11J1836−2354A M22 3.35 BW PL 3.0+1.6−1.0 13
MNRAS 000, 1–20 (2015)
14 J. Zhao & C. O. Heinke
1029 1030 1031 1032 1033 1034
LX, 0.3 8keV (erg s 1)
1
2
5
10
20
NM
SP
upper limitdetectedbest fit
Figure 12. The differential X-ray luminosity distributions of GC MSPs catalogued in this work. The blue histogram shows the distribution of MSPs withdetermined X-ray luminosities, whereas the red dashed histogram shows the upper limits of the X-ray luminosity distribution. The black dotted histogram showsthe best-fit luminosity function for detected MSPs with X-ray luminosities between 1030 and ∼ 3 × 1033 erg s−1 (see text for details).
Pulsar Name GC Name Period Type𝑎 Spectral Model 𝐿𝑋 (0.3–8 keV)𝑏 Ref. of 𝐿𝑋
(ms) (×1030 erg s−1)
J1910−5959E NGC 6752 4.57 I BB 1.0+1.0−0.4 14J1910−5959F NGC 6752 8.49 I PL 4.0+1.0−0.7 15J1953+1846A M71 4.89 eBW PL 12.0+1.9−1.9 16J2140−2310A M30 11.02 eBW PL 10.9+4.2−3.6 17J1911−5958A NGC 6752 3.27 B BB 2.9+1.3−1.0 14J1910−5959B NGC 6752 8.36 I BB 1.3+0.6−0.4 14J1911−6000C NGC 6752 5.28 I BB 3.2+0.8−0.6 14J1910−5959D NGC 6752 9.04 I BB 3.8+0.8−0.6 14
Table 10 – continuedNotes: periods and types of MSPs were obained from Paulo Freire’s GC Pulsar Catalog.10𝑎 Types of MSP systems; I: isolated; B: binary; BW: black widow; RB: redback; O: others; e: eclipsing.𝑏 Unabsorbed X-ray luminosities at the distances to corresponding GCs.★ J1737−0314A in M14 might be an eclipsing BW. Confirmation is needed. See text for more information.References: 1) Bogdanov et al. (2006); 2) Bhattacharya et al. (2017); 3) Ridolfi et al. (2016); 4) this work; 5) Pavlov et al. (2007); 6) Zhao et al. (2021); 7) Ohet al. (2020); 8) Bogdanov et al. (2010); 9) Pichardo Marcano et al. (2021); 10) Bogdanov et al. (2021); 11) Bogdanov et al. (2011); 12) Linares et al. (2014);13) Amato et al. (2019); 14) Forestell et al. (2014); 15) Cohn et al. (2021, submitted); 16) Elsner et al. (2008); 17) Zhao et al. (2020b).
number of radio MSPs harboured in a GC. Bagchi et al. (2011) usedsophisticated Monte Carlo simulations with various radio luminosityfunctions and models to calculate the population of radio MSPs in10 GCs. They claimed that they did not find strong evidence that thenumber of MSPs correlates with ΓSE under either model. However,Bahramian et al. (2013) produced a more sophisticated calculationof ΓSE for these GCs and adopted the estimates of MSP populationsfrom Bagchi et al. (2011, model 1), finding a significant correlationbetween the number of MSPs and ΓSE in a GC via their statisticaltests.
Here, we assume both the ΓSE values fromBahramian et al. (2013)and the calculations of MSP population for 10 GCs (we also adoptthe results of model 1 here; column 2 in Table 11) from Bagchi et al.(2011) are correct, and fit a power-law function through the datapoints, as standard for the correlation between the number of XRBsand ΓSE. We note that due to the lack of data points, Markov ChainMonte Carlo (MCMC) method could not provide robust results, andhence we applied orthogonal distance regression method for fitting.The best-fit curve is log(𝑁MSP) = 0.44 log(ΓSE )+0.49, with 1-sigmaerrors on the slope and intercept of ±0.07 and ±0.21, respectively
MNRAS 000, 1–20 (2015)
X-ray MSPs in GCs 15
1029 1030 1031 1032 1033 1034
LX, 0.3 8keV (erg s 1)
1
2
5
10
20
NM
SP
(a) isolated
1029 1030 1031 1032 1033 1034
(b) binaries
1029 1030 1031 1032 1033 1034
LX, 0.3 8keV (erg s 1)
1
2
5
10
20
NM
SP
(c) RBs
1029 1030 1031 1032 1033 1034
(d) BWs
1029 1030 1031 1032 1033 1034
LX, 0.3 8keV (erg s 1)
1
2
5
10
20
NM
SP
(e) eclipsing BWs
1029 1030 1031 1032 1033 1034
LX, 0.3 8keV (erg s 1)
(f) non-eclipsing BWs
Figure 13. The differential X-ray luminosity functions for (a) isolated MSPs, (b) MSPs in binaries excluding confirmed spider MSPs, (c) redbacks, (d) blackwidows, (e) eclipsing black widows, and (f) non-eclipsing black widows, respectively, in GCs. The blue histograms show the distributions of MSPs withdetermined X-ray luminosities, while the red dashed histograms show the upper limits of the X-ray luminosity distributions.
(red solid line in Figure 14). Based on this correlation (assumingit is true) and the fitted function, we can then roughly estimate thetotal number of MSPs for each GC for a given ΓSE (column 3 inTable 11). We calculate approximately 1460 MSPs in total in the 36GCs in our study,whichwe consider as a conservative upper estimate.We consider this as a conservative upper estimate, because Bagchiet al. (2011) also produce two other estimates with smaller predictednumbers: roughly half those of Model 1. In addition, Heinke et al.(2005) place an upper limit on the MSP population of 47 Tuc of<60 at 95% confidence, compared to Model 1’s 71±19. Alternativeestimates from gamma-rays (Abdo et al. 2010) and diffuse radioflux (McConnell et al. 2004) also are well below Bagchi et al.’sModel 1 numbers— 33±15 and . 30, respectively. SomeMSPs maynot point their radio beams towards us (though Lyne & Manchester1988 illustrate that beam width varies inversely with spin period, sothis fraction is likely to be small). However, the limits from X-rayand gamma-ray studies above do not depend on the radio beamingfraction, as the gamma-rays are produced high in the magnetospherewith a very large beaming fraction (Venter et al. 2009), and X-raysare emitted from hot spots on the neutron star surface, which are
gravitationally lensed so as to be visible to virtually all observers(Pechenick et al. 1983).We also plotted the number of currently known radio MSPs ver-
sus ΓSE for the GCs in this work (blue dots in Figure 14; see alsoTable 1). Furthermore, we made an aggressive estimate of the lowerbound on the total population of GC MSPs. Unlike the conservativeupper estimate, we consider two GCs, 47 Tuc and M13, as “well-determined” GCs, for which the currently found MSPs in these twoGCs are all (or nearly all) the MSPs therein. The choice of 47 Tuc isbased on comprehensive and extensive studies of this cluster. Partic-ularly, Heinke et al. (2005) suggested a total number of ∼ 25 MSPsin 47 Tuc by comparing X-ray colors, luminosities, variability, etc.,of detected MSPs to those of unidentified sources using deep CXOobservations. (See also the compatible estimates using gamma-raysand diffuse radio flux, mentioned above.) To date, 27MSPs have beenfound in 47 Tuc (four without timing positions), and this aggressiveestimate assumes that this is indeed close to the total number ofMSPstherein. M13 was recently observed by Wang et al. (2020) using theFive-hundred-metre Aperture Spherical radio Telescope (FAST). AnewMSP (J1641+3627F) was discovered in their observations, mak-ing a total of 6 MSPs found in this cluster. Since the sensitivity of
MNRAS 000, 1–20 (2015)
16 J. Zhao & C. O. Heinke
their radio observations reached down to a flux density of 0.4 `Jyto a candidate with a signal to noise ratio of 7 (Wang et al. 2020),corresponding to a pseudo radio luminosity of ∼0.02 mJy kpc2 at1.4 GHz, below which no MSPs in GCs have been detected (mostGC MSPs have radio specific luminosities of & 1 mJy kpc2 at 1.4GHz), we can confidently assume all or nearly all the MSPs in M13have been found. We therefore fitted a power-law model across thesetwo data points, finding a correlation of log(𝑁MSP) = 0.56 log(ΓSE) − 0.26 (blue dashed line in Figure 14). We normalized the MSPpopulations in other GCs to this model, assuming an MSP popula-tion proportional to their stellar encounter rates, and thus obtaineda rough lower bound (henceforth our "aggressive" estimate) of theMSP population for them (see column 4 in Table 11).It is noticeable that there is one cluster, Terzan 1 (leftmost blue
dot in Figure 14), that falls significantly outside both our aggressiveand conservative model predictions. Since Terzan 1 is a so-called‘core-collapsed’ and heavily obscured cluster and its structural pa-rameters are poorly measured, the calculation of ΓSE depending oncore values, such as core density and core radius, is generally notconsidered reliable (see Cackett et al. 2006; Bahramian et al. 2013).An alternative explanation of the discrepancy between the numberof MSPs (and also of XRBs) and ΓSE in Terzan 1 is that most starsin Terzan 1 have been stripped due to Galactic tides, leaving a coreunusually rich in binaries (de Marchi et al. 1999). This is particularlyplausible for Terzan 1, considering that it is located very close to theGalactic centre (Cackett et al. 2006).
4 DISCUSSION
The radio MSPs in𝜔 Cen were not discovered until a more advancedreceiver, an ultra-wide-bandwidth low-frequency receiver (Hobbset al. 2020), was installed and used on the Parkes radio telescope.Before that, however, some studies in other bands had hinted at theexistence of MSPs in 𝜔 Cen. For example, Abdo et al. (2010) sug-gested a total of 19±9MSPs harboured in𝜔Cen based on gamma-raydetection of the cluster by the Fermi Large Area Telescope (LAT). AdeepX-ray survey of𝜔Cen byHenleywillis et al. (2018) also impliedthe presence of MSPs, given that tens of unidentified sources havesimilar X-ray colours with theMSPs detected in 47 Tuc. Intriguingly,the X-ray counterpart to one of the MSPs in 𝜔 Cen (J1326−4728B;analyzed in this work) has been detected in previous X-ray studies(Haggard et al. 2009; Henleywillis et al. 2018, source ID 13d in theirtables).However, it is possible to nominate unidentified sources detected
in other bands (e.g. X-rays and gamma-rays) as radioMSP candidatesbased on their observational properties. In fact, a large number ofradio MSPs have recently been discovered by targeting LAT unasso-ciated sources (see e.g. Ray et al. 2012). Moreover, dedicated anal-ysis with X-ray, gamma-ray and optical observations also can leadto discoveries of new MSPs. For instance, Bogdanov et al. (2010)suggested an X-ray source in the cluster NGC 6397 (source ID U18in their work) as a strong MSP candidate, given its similar X-ray andoptical properties to those of the known MSP, PSR J1740−5340, inthe cluster. Later, Zhao et al. (2020a) found the radio counterpart toU18 using the Australia Telescope Compact Array, while PichardoMarcano et al. (2021) reported the optical modulation of the com-panion star to U18, and both of their studies provided strong evidencethat U18 is a “hidden” redback MSP. The radio pulsations from thissource have been detected recently by the Parkes radio telescope (LeiZhang et al. 2021, in prep.), verifying it as a redback MSP (PSRJ1740−5340B). The reason of previous non-detection of radio pul-
Table 11. Estimates of MSP population in GCs
GC Name N𝑎calc N𝑏
cons N𝑐aggr N𝑑
unid Ref.
47 Tuc (NGC 104) 71 ± 19 ∼ 65 27𝑒 0 1NGC 1851 − ∼ 78 ∼ 34 −M53 (NGC 5024) − ∼ 15 ∼ 4 5 2𝜔 Cen (NGC 5139) − ∼ 23 ∼ 7 7 3M3 (NGC 5272) 24 ± 12 ∼ 32 ∼ 11 2 4M5 (NGC 5904) 24 ± 11 ∼ 29 ∼ 10 1 5NGC 5986 − ∼ 19 ∼ 6 −M4 (NGC 6121) − ∼ 13 ∼ 4 0 6M13 (NGC 6205) 25 ± 11 ∼ 20 6𝑒 3 5,7M12 (NGC 6218) − ∼ 10 ∼ 2 0 8M10 (NGC 6254) − ∼ 14 ∼ 4 0 5M62 (NGC 6266) − ∼ 82 ∼ 36 4 9M92 (NGC 6341) − ∼ 37 ∼ 13 5 10NGC 6342 − ∼ 17 ∼ 5 2 2Terzan 1 − ∼ 2 ∼ 0 0 11M14 (NGC 6402) − ∼ 26 ∼ 8 4 5NGC 6397 − ∼ 22 ∼ 7 0 12Terzan 5 167 ± 33 ∼ 151 ∼ 79 26 13NGC 6440 88 ± 39 ∼ 75 ∼ 33 4 14NGC 6441 − ∼ 94 ∼ 43 −NGC 6517 46 ± 23 ∼ 40 ∼ 15 1 2NGC 6522 − ∼ 42 ∼ 15 1 5NGC 6539 − ∼ 16 ∼ 5 4 5NGC 6544 − ∼ 25 ∼ 8 1 5NGC 6624 − ∼ 69 ∼ 29 −M28 (NGC 6626) 120 ± 40 ∼ 54 ∼ 21 7 5NGC 6652 − ∼ 56 ∼ 22 3 15M22 (NGC 6656) − ∼ 21 ∼ 6 1 5NGC 6712 − ∼ 14 ∼ 4 −NGC 6749 − ∼ 18 ∼ 5 −NGC 6752 44 ± 20 ∼ 43 ∼ 16 0 16NGC 6760 − ∼ 18 ∼ 5 0 5M71 (NGC 6838) − ∼ 4 ∼ 1 0 17,18M15 (NGC 7078) 79 ± 30 ∼ 126 ∼ 63 −M2 (NGC 7089) − ∼ 49 ∼ 19 6 5M30 (NGC 7099) − ∼ 40 ∼ 14 0 19
Total − ∼ 1457 ∼ 587 87
Notes: 𝑎 Calculations of MSP population for 10 GCs by Bagchi et al. (2011)𝑏 Conservative estimates of GC MSP population𝑐 Aggressive estimates of GC MSP population𝑑 Unidentified X-ray sources with 𝐿𝑋 > 1032 erg s−1 (0.3–8 keV)𝑒 Selected as normalizationReference of Nunid: (1) Heinke et al. (2005); (2) this work; (3) Henleywilliset al. (2018); (4) Zhao et al. (2019); (5) Bahramian et al. (2020); (6) Bassaet al. (2004); (7) Servillat et al. (2011); (8) Lu et al. (2009); (9) Oh et al.(2020); (10) Lu et al. (2011); (11) Cackett et al. (2006); (12) Bogdanov et al.(2010); (13) Heinke et al. (2006b); (14) Pooley et al. (2002); (15) Stacey et al.(2012); (16) Forestell et al. (2014); (17) Elsner et al. (2008); (18) Huang et al.(2010); (19) Zhao et al. (2020b)
sations can be interpreted as scattering of the radio pulsations bywind from the companion (Zhao et al. 2020a).Considering the fact that there might be a group of hidden
MSPs observed in X-rays but without radio confirmation, like PSRsJ1326−4728B and J1740−5340B, it is also interesting to investigatethe faint unidentified X-ray sources, especially those with 𝐿𝑋 > 1032erg s−1, where the non-thermal X-ray emission dominates. We countall the unidentified X-ray sources with 𝐿𝑋 > 1032 erg s−1 (0.3–8keV) in our studied GCs in Table 11 (column 5). We found a total of87 unidentified X-ray sources with 𝐿𝑋 > 1032 erg s−1 in 29 GCs,while we did not find any unidentified sources with 𝐿𝑋 > 1033 erg
MNRAS 000, 1–20 (2015)

X-ray MSPs in GCs 17
10 1 100 101 102 103 104
Stellar Encounter Rate (Bahramian et al. 2013)
1
10
100
NM
SP
Estimates of NMSP for 10 GCs (Bagchi et al. 2011)Detected NMSP in 47 TucDetected NMSP in M13Detected NMSP in other GCs
Figure 14. The number of MSPs in a globular cluster versus the stellar encounter rate. The blue dots show the numbers of currently known radio MSPs in GCs,while the red squares show the estimated MSP population for 10 GCs calculated by Bagchi et al. (2011, model 1). The red solid line shows the best-fit power-lawmodel using the data points from Bagchi et al. (2011), and the yellow shade represents the 1-sigma interval. The blue dashed line shows the power-law modelfitted to the data points of 47 Tuc and M13 (see text for details). All the stellar encounter rates of GCs and their corresponding errors were extracted fromBahramian et al. (2013).
s−1 in those GCs. However, we note a special case, the X-ray sourceB in NGC 6652 (see Heinke et al. 2001; Stacey et al. 2012), whichis suggested as a transitional MSP (tMSP) in a recent work by Pad-uano et al. (2021). It is considered to be in an accretion-poweredstate currently, with an average X-ray luminosity of ∼ 1.8× 1034 ergs−1. However, since we cannot completely confirm the nature of thissource until its rotation-poweredMSP state is detected, we just treat itas an unidentified sourcewith 𝐿𝑋 > 1033 erg s−1 in this work. Terzan5 contains a large number of unidentified X-ray sources, which weattribute to its high stellar encounter rate (the highest among knownGCs, Bahramian et al. 2013), and the large interstellar extinctiontowards the cluster (Massari et al. 2012), which makes identificationof optical counterparts extremely difficult (cf. Testa et al. 2012; Fer-raro et al. 2015); a general search for optical/infrared counterpartsof Terzan 5 X-ray sources has not yet been conducted. Another twointeresting GCs are M14 and M2, where the MSPs therein were dis-covered recently by FAST (Pan et al. 2021b). All the detected MSPsin these two clusters are found in binary systems, while one BW andtwo eclipsing RB MSPs were found in M14. Since it is common thateclipsing RBs have X-ray luminosities of 𝐿𝑋 & 1032 erg s−1 (seeTable 10), the X-ray counterparts to the two newly found RBs mightbe included in those unidentified sources. However, due to the lack ofdeep X-ray observations and radio timing solutions of these MSPs,investigation of their X-ray properties is not yet possible.
Our results allow an estimate of the X-ray detectable MSP popula-tion in the Galactic centre. An excess of gamma-rays, peaking at ∼ 2GeV, has been found towards the Galactic centre (also known as theGalactic Centre Excess, or GCE, see e.g., Hooper & Goodenough
2011; Gordon&Macías 2013; Ajello et al. 2016; Daylan et al. 2016),the origin of which remains unclear. Some studies suggested that theexcess is generated from dark matter annihilation (e.g. Hooper &Goodenough 2011; Daylan et al. 2016; Ackermann et al. 2017; DiMauro 2021), whereas other groups claimed that a population of un-resolved MSPs in the Galactic bulge produces the observed gamma-ray excess (e.g., Abazajian & Kaplinghat 2012; Brandt & Kocsis2015; Gonthier et al. 2018; Macias et al. 2018). If a large numberof MSPs are present in the Galactic centre, one can also expect theyare emitting X-rays. While Fermi LAT has a relatively poor angularresolution of (∼1 degree),11 Chandra’s high angular resolution of 0.5arcsec12 allows the possible detection of X-ray counterparts to MSPsas point sources in the Galactic centre. However, the large interstel-lar extinction towards the Galactic centre absorbs nearly all X-rayemission below 2 keV, rendering faint MSPs producing only softblackbody-like emission (the majority of MSPs) undetectable. Onlya few X-ray-bright MSPs with substantial magnetospheric (such asPSR B1821−24A in M28) or shock-powered (redbacks) X-ray emis-sion might be detected around the Galactic centre by Chandra, oreven XMM-Newton (with its larger point-spread function of ∼10").Using our X-ray census of GCMSPs and our estimates of the total
population of MSPs in those GCs, we are able to estimate the pop-ulation of easily detectable X-ray MSPs (𝐿𝑋 > 1033 erg s−1 in theband 0.3–8 keV) in the Galactic bulge. We first adopt the prediction
11 https://fermi.gsfc.nasa.gov/science/instruments/table1-1.html12 https://asc.harvard.edu/proposer/POG/
MNRAS 000, 1–20 (2015)

18 J. Zhao & C. O. Heinke
Table 12. Estimates of the number of X-ray MSPs in the bulge
𝐿𝑎𝑋(erg s−1) N𝑏
det N𝑐upp N𝑑
est
> 1032 5 41 21 − 908> 3 × 1032 2 20 5 − 480> 1033 1 2 1.2 − 86𝑎Unabsorbed luminosities in 0.3–8 keV𝑏Number of detected MSPs in GCs𝑐Upper limit of the number of MSPs in GCs𝑑Estimated number of MSPs in the bulge
by Gonthier et al. (2018), who suggested a total of ∼11,000 MSPsin the Galactic bulge are needed to produce the GCE. The numberof MSPs required to explain the GCE has been estimated at 10,000–20,000 (Yuan & Zhang 2014), 2,000–14,000 (Cholis et al. 2015),∼40,000 (Ploeg et al. 2017), or ∼10,000 (Gonthier et al. 2018), andconsequently our estimation may also vary from other predictions ofthe number of MSPs. To calculate a lower limit of detectable X-rayMSPs in the Galactic center, we assume PSR B1821−24A is the onlyMSP with an X-ray luminosity more than 1033 erg s−1 among 1500MSPs (the conservative estimate in Table 11), and the MSP pop-ulation in the Galactic bulge keeps the same proportion. Allowingfor small-number statistics (Gehrels 1986) gives an estimate of >1MSP above 1033 erg/s for 8,700 MSPs (a 1𝜎 lower limit), and thuspredicts of order 1 MSP with 𝐿𝑋 > 1033 erg/s in the Galactic bulge.On the other hand, if we assume the upper limit of the number ofMSPs with 𝐿𝑋 > 1033 erg s−1 (2; considering NGC 6652B) andtake the “aggressive” lower estimate of 590 MSPs in these GCs, thenwe obtain an upper limit (1𝜎) of easily detectable MSPs of 1 MSPabove 1033 erg/s for 126 MSPs, and thus predict of order 86 sucheasily detectable MSPs in the Galactic Centre. Performing the samecalculation for 𝐿𝑋 > 1032 erg/s (still very achievable with Chandrain the Galactic Centre) gives a predicted range of 20 to 910 X-raydetectable MSPs in the Galactic Centre. These predictions are con-sistent with those of Berteaud et al. (2020), which used an alternativemethod of inferring X-ray luminosity functions from gamma-ray lu-minosity functions. Careful study of X-ray sources in the GalacticBulge may be able to identify plausible MSP candidates, or rule outsuch anMSP candidate population, which would favour a darkmatterinterpretation for the GCE. We will look into available Chandra andXMM-Newton observations towards the Galactic Centre to identifycandidate MSPs therein, in future works.
5 CONCLUSIONS
In thiswork,we compiledX-ray luminosities ofMSPs inGCs, includ-ing new X-ray analysis. We analysed the X-ray spectra of two MSPs(PSR J1326−4728A and J1326−4728B) in the cluster𝜔Cen. The un-absorbedX-ray luminosities in the band 0.3–8 keV of these twoMSPsare ∼ 2×1030 erg s−1 and ∼ 1×1031 erg s−1, respectively. The X-rayspectrum of PSR J1326−4728A is well described by either a BB or aNSATMOS model, indicating thermal X-ray emission from the neu-tron star surface. The spectrum of PSR J1326−4728B is well-fit by aPL model, with a photon index of 2.6± 0.5. Its spectrum reflects thebulk of non-thermal X-ray emission from the MSP, which is com-monly observed from eclipsing spider pulsars and likely produced byintra-binary shocks. We also presented new X-ray analyses for PSRsJ1518+0204C, J1717+4308A, J1737−0314A, and J1807−2459A inGCs M5, M92, M14, and NGC 6544, respectively. The X-ray spec-
trum of J1717+4308A is well described by a composition of a PLmodel and a BB model, with a photon index of 1.2±0.6 and an ef-fective temperature of (1.9±0.5)×106 K. The unabsorbed luminosityin the band 0.3–8 keV of J1717+4308A is (8.3±2.1)×1031 erg s−1,consisting of both thermal and non-thermal emission. The spectra ofother three newly analyzedMSPs (J1518+0204C, J1737−0314A, andJ1807−2459A) are well fitted by a single BB model, with X-ray lu-minosities (0.3–8 keV) ranging from ∼1.1×1031 erg s−1 to 6.6×1031erg s−1. We also catalogued the X-ray sources in the clusters M53,NGC 6342, and NGC 6517. We found a total of 12 X-ray sources inthese three GCs, with X-ray luminosities ranging from ∼ 3 × 1031erg s−1 to ∼ 8 × 1032 erg s−1.We presented a comprehensive census of X-rayMSPs in 29 Galac-
tic GCs. We reported the X-ray luminosities or upper limits for 175GCMSPs in our catalogue, and normalized the energy band to 0.3–8keV. We determined X-ray luminosities for 68 GC MSPs and con-strained the luminosities for others, except MSPs in 2 GCs that haveno Chandra observations, and in 5 GCs that are severely contami-nated by bright X-ray sources. We investigated the empirical MSPX-ray luminosity function using our catalogue, finding that most de-tected GC X-ray MSPs have luminosities between ∼ 1 × 1030 ergs−1 and ∼ 3 × 1031 erg s−1. The X-ray luminosities for eclipsingspider MSPs are generally higher than other types of MSPs, with𝐿𝑋 & 1031 erg s−1.We re-examined the correlation between the number of MSPs and
stellar encounter rate in a GC. Using the estimates of numbers ofMSPs in several clusters from Bagchi et al. (2011) and the stellarinteraction rates of Bahramian et al. (2013), we found a relationof log(𝑁MSP) = 0.44 log(ΓSE)+0.49, which we take as an upperlimit to the numbers of MSPs in clusters. We also estimated a lowerlimit using the numbers of known MSPs in the most well-observedclusters 47 Tuc and M13, and assuming that other clusters followthe same relation of stellar interaction rate and number of MSPs,log(𝑁MSP) = 0.56 log(ΓSE)−0.26. We estimated the total number ofMSPs in each of the GCs in this work using both fitting relations,and suggested a conservative upper estimate of 1500 MSPs and anaggressive lower estimate of 590 MSPs, respectively, in those 36GCs.We empirically estimated the population of detectable MSPs in
the Galactic bulge, assuming the gamma-ray excess is produced by alarge number of unresolved MSPs. Based on our census of GC X-rayMSPs, we suggested of order 1-90 MSPs with 𝐿𝑋 > 1033 erg s−1 inthe Galactic centre, and of order 20-900 MSPs with 𝐿𝑋 > 1032 ergs−1 there. As these sources are likely detected in existing archivalChandra and XMM-Newton observations, dedicated searches mayuncover the proposed Galactic Bulge MSP population.
ACKNOWLEDGEMENTS
We thank Sharon Morsink, Erik Rosolowsky and Gregory Sivakofffor helpful discussions. JZ thanks Zhichen Pan for the updated infor-mation of the timing position ofM92A. COH is supported byNSERCDiscovery Grant RGPIN-2016-04602. JZ is supported by the ChinaScholarship Council (CSC). This work has made use of data obtainedfrom the Chandra Data Archive and the Chandra Source Catalogue,and software provided by the Chandra X-ray Centre (CXC) in theapplication packages ciao, sherpa, ds9, and pimms. This work hasmade use of data from the European Space Agency (ESA) missionGaia (https://www.cosmos.esa.int/gaia), processed by theGaia Data Processing and Analysis Consortium (DPAC, https://www.cosmos.esa.int/web/gaia/dpac/consortium). Fund-
MNRAS 000, 1–20 (2015)

X-ray MSPs in GCs 19
ing for the DPAC has been provided by national institutions, in partic-ular the institutions participating in theGaiaMultilateral Agreement.This research has made use of NASA’s Astrophysics Data SystemBibliographic Services and arXiv. This research has made use ofthe VizieR catalogue access tool, CDS, Strasbourg, France (DOI :10.26093/cds/vizier). The original description of the VizieR servicewas published in 2000, A&AS 143, 23
DATA AVAILABILITY
The Chandra data used in this article are available in the Chan-dra Data Archive (https://cxc.harvard.edu/cda/) by search-ing the Observation ID listed in Table 2 and Table 3 in the Searchand Retrieval interface, ChaSeR (https://cda.harvard.edu/chaser/). The Gaia data used in this work are available in theVizieR Information System (https://vizier.cds.unistra.fr/index.gml).
REFERENCES
Abazajian K. N., Kaplinghat M., 2012, Phys. Rev. D, 86, 083511Abdo A. A., et al., 2010, A&A, 524, A75Ackermann M., et al., 2017, ApJ, 840, 43Ajello M., et al., 2016, ApJ, 819, 44Alpar M. A., Cheng A. F., Ruderman M. A., Shaham J., 1982, Nature, 300,728
Amato R., D’Aı A., Del Santo M., de Martino D., Marino A., Di Salvo T.,Iaria R., Mineo T., 2019, MNRAS, 486, 3992
Andersen B. C., Ransom S. M., 2018, ApJ, 863, L13Anderson S. B., Wolszczan A., Kulkarni S. R., Prince T. A., 1997, ApJ, 482,870
Arons J., Tavani M., 1993, ApJ, 403, 249Bagchi M., Lorimer D. R., Chennamangalam J., 2011, MNRAS, 418, 477Bahramian A., Heinke C. O., Sivakoff G. R., Gladstone J. C., 2013, ApJ, 766,136
Bahramian A., Heinke C. O., Degenaar N., Chomiuk L., Wijnands R., StraderJ., Ho W. C. G., Pooley D., 2015, MNRAS, 452, 3475
Bahramian A., et al., 2020, ApJ, 901, 57Bailes M., et al., 2011, Science, 333, 1717Bassa C., et al., 2004, ApJ, 609, 755Baumgardt H., Vasiliev E., 2021, MNRAS, 505, 5957Becker W., et al., 2003, ApJ, 594, 798Begin S., 2006, PhD thesis, University of British Columbia,doi:http://dx.doi.org/10.14288/1.0066153, https://open.library.ubc.ca/collections/ubctheses/24/items/1.0066153
Berteaud J., Calore F., Clavel M., Serpico P. D., Dubus G., Petrucci P.-O.,2020, arXiv e-prints, p. arXiv:2012.03580
Bhattacharya D., van den Heuvel E. P. J., 1991, Phys. Rep., 203, 1Bhattacharya S., Heinke C. O., Chugunov A. I., Freire P. C. C., Ridolfi A.,Bogdanov S., 2017, MNRAS, 472, 3706
Bogdanov S., 2013, ApJ, 762, 96Bogdanov S., Grindlay J. E., 2009, ApJ, 703, 1557Bogdanov S., Grindlay J. E., Heinke C. O., Camilo F., Freire P. C. C., BeckerW., 2006, ApJ, 646, 1104
Bogdanov S., van den Berg M., Heinke C. O., Cohn H. N., Lugger P. M.,Grindlay J. E., 2010, ApJ, 709, 241
Bogdanov S., et al., 2011, ApJ, 730, 81Bogdanov S., Bahramian A., Heinke C. O., Freire P. C. C., Hessels J. W. T.,Ransom S. M., Stairs I. H., 2021, ApJ, 912, 124
Brandt T. D., Kocsis B., 2015, ApJ, 812, 15Cackett E. M., et al., 2006, MNRAS, 369, 407Cadelano M., Ransom S. M., Freire P. C. C., Ferraro F. R., Hessels J. W. T.,Lanzoni B., Pallanca C., Stairs I. H., 2018, ApJ, 855, 125
Camilo F., Lorimer D. R., Freire P., Lyne A. G., Manchester R. N., 2000,ApJ, 535, 975
Cardelli J. A., Clayton G. C., Mathis J. S., 1989, ApJ, 345, 245Cash W., 1979, ApJ, 228, 939Cheng Z., Li Z., Li X., Xu X., Fang T., 2019, ApJ, 876, 59Cholis I., Hooper D., Linden T., 2015, J. Cosmology Astropart. Phys., 2015,043
Cool A. M., Haggard D., Arias T., Brochmann M., Dorfman J., Gafford A.,White V., Anderson J., 2013, ApJ, 763, 126
D’Amico N., Bailes M., Lyne A. G., Manchester R. N., Johnston S., FruchterA. S., Goss W. M., 1993, MNRAS, 260, L7
D’Amico N., Lyne A. G., Manchester R. N., Possenti A., Camilo F., 2001,ApJ, 548, L171
Dai S., Johnston S., Kerr M., Camilo F., Cameron A., Toomey L., KumamotoH., 2020, ApJ, 888, L18
Daylan T., Finkbeiner D. P., Hooper D., Linden T., Portillo S. K. N., RoddN. L., Slatyer T. R., 2016, Physics of the Dark Universe, 12, 1
DeCesar M. E., Ransom S. M., Kaplan D. L., Ray P. S., Geller A. M., 2015,ApJ, 807, L23
Deich W. T. S., Middleditch J., Anderson S. B., Kulkarni S. R., Prince T. A.,Wolszczan A., 1993, ApJ, 410, L95
Di Mauro M., 2021, Phys. Rev. D, 103, 063029Edmonds P. D., Gilliland R. L., Heinke C. O., Grindlay J. E., 2003, ApJ, 596,1177
Elsner R. F., et al., 2008, ApJ, 687, 1019Fabian A. C., Pringle J. E., Rees M. J., 1975, MNRAS, 172, 15Ferraro F. R., Pallanca C., Lanzoni B., CadelanoM., Massari D., DalessandroE., Mucciarelli A., 2015, ApJ, 807, L1
Forestell L. M., Heinke C. O., Cohn H. N., Lugger P. M., Sivakoff G. R.,Bogdanov S., Cool A. M., Anderson J., 2014, MNRAS, 441, 757
Freire P. C. C., 2005, in Rasio F. A., Stairs I. H., eds, Astronomical Societyof the Pacific Conference Series Vol. 328, Binary Radio Pulsars. p. 405(arXiv:astro-ph/0404105)
Freire P. C., Camilo F., LorimerD.R., LyneA.G.,Manchester R.N., D’AmicoN., 2001a, MNRAS, 326, 901
Freire P. C., Kramer M., Lyne A. G., Camilo F., Manchester R. N., D’AmicoN., 2001b, ApJ, 557, L105
Freire P. C. C., Hessels J. W. T., Nice D. J., Ransom S. M., Lorimer D. R.,Stairs I. H., 2005, ApJ, 621, 959
Freire P. C. C., Ransom S. M., Bégin S., Stairs I. H., Hessels J. W. T., FreyL. H., Camilo F., 2008, ApJ, 675, 670
Freire P. C. C., et al., 2017, MNRAS, 471, 857Fruchter A. S., Goss W. M., 1992, ApJ, 384, L47Fruscione A., et al., 2006, in Silva D. R., Doxsey R. E., eds, Society of Photo-Optical Instrumentation Engineers (SPIE) Conference Series Vol. 6270,Society of Photo-Optical Instrumentation Engineers (SPIE) ConferenceSeries. p. 62701V, doi:10.1117/12.671760
Gaia Collaboration et al., 2016, A&A, 595, A1Gaia Collaboration et al., 2021, A&A, 649, A1Gehrels N., 1986, ApJ, 303, 336Giacconi R., et al., 2001, ApJ, 551, 624Gonthier P. L., Harding A. K., Ferrara E. C., Frederick S. E., Mohr V. E., KohY.-M., 2018, ApJ, 863, 199
Gordon C., Macías O., 2013, Phys. Rev. D, 88, 083521Guillot S., et al., 2019, ApJ, 887, L27Haggard D., Cool A. M., Davies M. B., 2009, ApJ, 697, 224Harding A. K., Muslimov A. G., 2002, ApJ, 568, 862Harris W. E., 1996, AJ, 112, 1487Heinke C. O., Edmonds P. D., Grindlay J. E., 2001, ApJ, 562, 363Heinke C. O., Grindlay J. E., Lugger P. M., Cohn H. N., Edmonds P. D., LloydD. A., Cool A. M., 2003, ApJ, 598, 501
Heinke C. O., Grindlay J. E., Edmonds P. D., Cohn H. N., Lugger P. M.,Camilo F., Bogdanov S., Freire P. C., 2005, ApJ, 625, 796
Heinke C. O., Rybicki G. B., Narayan R., Grindlay J. E., 2006a, ApJ, 644,1090
Heinke C. O., Wijnands R., Cohn H. N., Lugger P. M., Grindlay J. E., PooleyD., Lewin W. H. G., 2006b, ApJ, 651, 1098
Heinke C. O., et al., 2010, ApJ, 714, 894
MNRAS 000, 1–20 (2015)

20 J. Zhao & C. O. Heinke
Henleywillis S., Cool A. M., Haggard D., Heinke C., Callanan P., Zhao Y.,2018, MNRAS, 479, 2834
Hessels J. W. T., Ransom S. M., Stairs I. H., Kaspi V. M., Freire P. C. C.,2007, ApJ, 670, 363
Hills J. G., 1976, MNRAS, 175, 1PHobbs G., et al., 2020, Publ. Astron. Soc. Australia, 37, e012Hooper D., Goodenough L., 2011, Physics Letters B, 697, 412Huang R. H. H., Becker W., Edmonds P. D., Elsner R. F., Heinke C. O., HsiehB. C., 2010, A&A, 513, A16
Igoshev A., Verbunt F., Cator E., 2016, A&A, 591, A123Kandel D., Romani R. W., An H., 2019, ApJ, 879, 73Kaplan D. L., Stovall K., van Kerkwijk M. H., Fremling C., Istrate A. G.,2018, ApJ, 864, 15
Kargaltsev O., Pavlov G. G., 2010, in Comastri A., Angelini L., Cappi M.,eds, American Institute of Physics Conference Series Vol. 1248, X-rayAstronomy 2009; Present Status, Multi-Wavelength Approach and FuturePerspectives. pp 25–28 (arXiv:1002.0885), doi:10.1063/1.3475228
Kulkarni S. R., Anderson S. B., Prince T. A., Wolszczan A., 1991, Nature,349, 47
Lee J., Hui C. Y., Takata J., Kong A. K. H., Tam P. H. T., Cheng K. S., 2018,ApJ, 864, 23
Linares M., et al., 2014, MNRAS, 438, 251Lorimer D. R., 2008, Living Reviews in Relativity, 11, 8Lu T.-N., Kong A. K. H., Bassa C., Verbunt F., Lewin W. H. G., AndersonS. F., Pooley D., 2009, ApJ, 705, 175
Lu T.-N., Kong A. K. H., Verbunt F., Lewin W. H. G., Anderson S. F., PooleyD., 2011, ApJ, 736, 158
Lynch R. S., Ransom S. M., Freire P. C. C., Stairs I. H., 2011, ApJ, 734, 89Lynch R. S., Freire P. C. C., Ransom S. M., Jacoby B. A., 2012, ApJ, 745,109
Lyne A. G., Manchester R. N., 1988, MNRAS, 234, 477Lyne A. G., Mankelow S. H., Bell J. F., Manchester R. N., 2000, MNRAS,316, 491
Macias O., Gordon C., Crocker R. M., Coleman B., Paterson D., Horiuchi S.,Pohl M., 2018, Nature Astronomy, 2, 387
Manchester R. N., Lyne A. G., Robinson C., D’Amico N., Bailes M., Lim J.,1991, Nature, 352, 219
Massari D., et al., 2012, ApJ, 755, L32McConnell D., Deshpande A. A., Connors T., Ables J. G., 2004, MNRAS,348, 1409
Oh K., Hui C. Y., Li K. L., Kong A. K. H., 2020, MNRAS, 498, 292Paduano A., et al., 2021, MNRAS, 506, 4107Pallanca C., RansomS.M., Ferraro F. R., Dalessandro E., Lanzoni B., HesselsJ. W. T., Stairs I., Freire P. C. C., 2014, ApJ, 795, 29
Pan Z., et al., 2020, ApJ, 892, L6Pan Z., et al., 2021a, arXiv e-prints, p. arXiv:2103.14927Pan Z., et al., 2021b, ApJ, 915, L28Papitto A., et al., 2013, Nature, 501, 517Pavlov G. G., Kargaltsev O., Garmire G. P., Wolszczan A., 2007, ApJ, 664,1072
Pechenick K. R., Ftaclas C., Cohen J. M., 1983, ApJ, 274, 846Pichardo Marcano M., Rivera Sandoval L. E., Maccarone T. J., Zhao Y.,Heinke C. O., 2021, MNRAS, 503, L51
Ploeg H., Gordon C., Crocker R., Macias O., 2017, J. Cosmology Astropart.Phys., 2017, 015
Polzin E. J., et al., 2018, MNRAS, 476, 1968Pooley D., et al., 2002, ApJ, 573, 184Pooley D., et al., 2003, ApJ, 591, L131Possenti A., Cerutti R., Colpi M., Mereghetti S., 2002, A&A, 387, 993Possenti A., D’AmicoN.,Manchester R. N., Camilo F., LyneA. G., SarkissianJ., Corongiu A., 2003, ApJ, 599, 475
Possenti A., D’Amico N., Corongiu A., Manchester D., Sarkissian J., CamiloF., Lyne A., 2005, in Rasio F. A., Stairs I. H., eds, Astronomical Societyof the Pacific Conference Series Vol. 328, Binary Radio Pulsars. p. 189
Prager B. J., Ransom S. M., Freire P. C. C., Hessels J. W. T., Stairs I. H.,Arras P., Cadelano M., 2017, ApJ, 845, 148
Qian L., Pan Z., 2021, arXiv e-prints, p. arXiv:2107.02749
Ransom S. M., Greenhill L. J., Herrnstein J. R., Manchester R. N., CamiloF., Eikenberry S. S., Lyne A. G., 2001, ApJ, 546, L25
Ransom S. M., Stairs I. H., Backer D. C., Greenhill L. J., Bassa C. G., HesselsJ. W. T., Kaspi V. M., 2004, ApJ, 604, 328
Ransom S. M., Hessels J. W. T., Stairs I. H., Freire P. C. C., Camilo F., KaspiV. M., Kaplan D. L., 2005, Science, 307, 892
Ray P. S., et al., 2012, arXiv e-prints, p. arXiv:1205.3089Ridolfi A., et al., 2016, MNRAS, 462, 2918Ridolfi A., et al., 2021, MNRAS, 504, 1407Robinson C., Lyne A. G., Manchester R. N., Bailes M., D’Amico N., JohnstonS., 1995, MNRAS, 274, 547
Romani R. W., Slane P., Green A. W., 2017, ApJ, 851, 61Rutledge R. E., Fox D. W., Kulkarni S. R., Jacoby B. A., Cognard I., BackerD. C., Murray S. S., 2004, ApJ, 613, 522
Saito Y., Kawai N., Kamae T., Shibata S., Dotani T., Kulkarni S. R., 1997,ApJ, 477, L37
Servillat M., Webb N. A., Lewis F., Knigge C., van den Berg M., Dieball A.,Grindlay J., 2011, ApJ, 733, 106
Stacey W. S., Heinke C. O., Cohn H. N., Lugger P. M., Bahramian A., 2012,ApJ, 751, 62
Stappers B. W., Bailes M., Lyne A. G., Camilo F., Manchester R. N., SandhuJ. S., Toscano M., Bell J. F., 2001, MNRAS, 321, 576
Stappers B.W., Gaensler B.M., Kaspi V.M., van der KlisM., LewinW.H. G.,2003, Science, 299, 1372
Swiggum J. K., et al., 2017, ApJ, 847, 25Testa V., et al., 2012, A&A, 547, A28Thompson C., Blandford R. D., Evans C. R., Phinney E. S., 1994, ApJ, 422,304
Thorsett S. E., Arzoumanian Z., McKinnon M. M., Taylor J. H., 1993, ApJ,405, L29
Venter C., Harding A. K., Guillemot L., 2009, ApJ, 707, 800Verbunt F., LewinW.H.G., 2006, Globular cluster X-ray sources. pp 341–379Verner D. A., Ferland G. J., Korista K. T., Yakovlev D. G., 1996, ApJ, 465,487
Wadiasingh Z., Venter C., Harding A. K., Böttcher M., Kilian P., 2018, ApJ,869, 120
Wang L., et al., 2020, ApJ, 892, 43Wilms J., Allen A., McCray R., 2000, ApJ, 542, 914Wolszczan A., Anderson S., Kulkarni S., Prince T., 1989, IAU Circ., 4880, 1Yuan Q., Zhang B., 2014, Journal of High Energy Astrophysics, 3, 1Zavlin V. E., Pavlov G. G., Sanwal D., Manchester R. N., Trümper J., HalpernJ. P., Becker W., 2002, ApJ, 569, 894
Zhang L., et al., 2020, ApJ, 905, L8ZhaoY., Heinke C. O., CohnH. N., Lugger P.M., Cool A.M., 2019,MNRAS,483, 4560
Zhao Y., et al., 2020a, MNRAS, 493, 6033Zhao Y., et al., 2020b, MNRAS, 499, 3338Zhao J., Zhao Y., Heinke C. O., 2021, MNRAS, 502, 1596de Marchi G., Leibundgut B., Paresce F., Pulone L., 1999, A&A, 343, L9in’t Zand J. J. M., van Kerkwijk M. H., Pooley D., Verbunt F., Wijnands R.,Lewin W. H. G., 2001, ApJ, 563, L41
APPENDIX A: UPPER LIMITS OF X-RAY LUMINOSITIES
We present the upper limits of X-ray luminosities for 107 GC MSPsin Table A1. These MSPs are not eligible for performing specificX-ray spectral analysis, and hence we placed an upper limit of 𝐿𝑋
for each of them. The criteria of determining upper limits have beendiscussed in Section 2.
This paper has been typeset from a TEX/LATEX file prepared by the author.
MNRAS 000, 1–20 (2015)
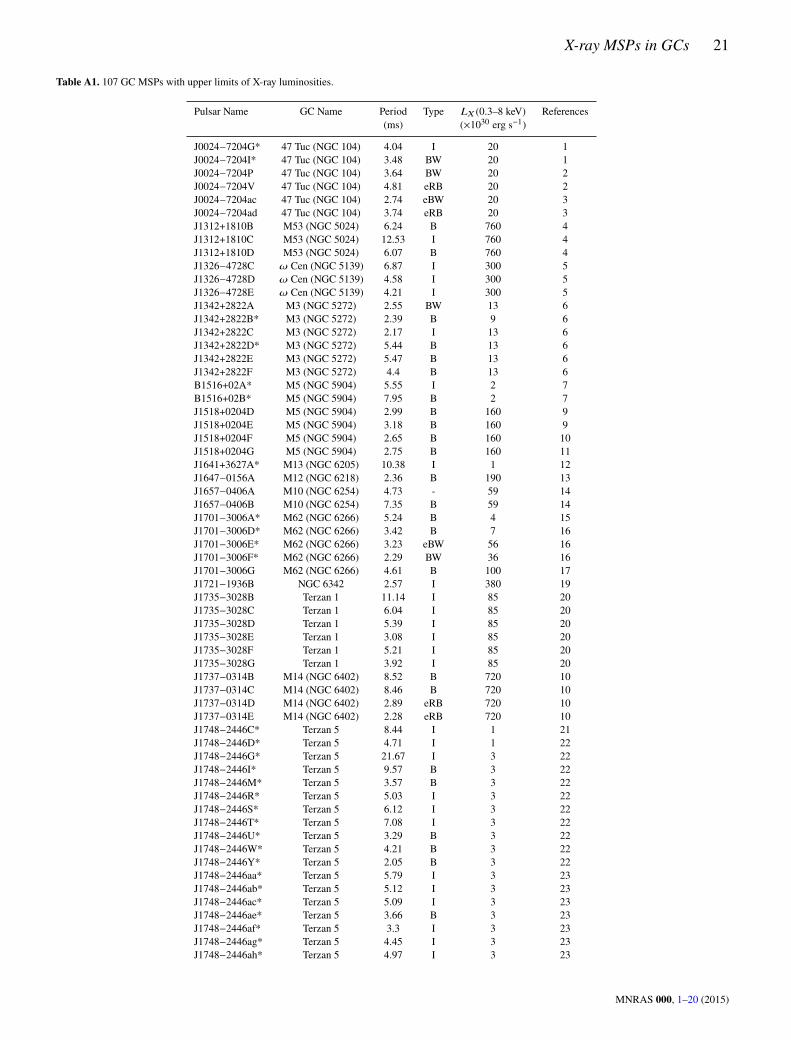
X-ray MSPs in GCs 21
Table A1. 107 GC MSPs with upper limits of X-ray luminosities.
Pulsar Name GC Name Period Type 𝐿𝑋 (0.3–8 keV) References(ms) (×1030 erg s−1)
J0024−7204G* 47 Tuc (NGC 104) 4.04 I 20 1J0024−7204I* 47 Tuc (NGC 104) 3.48 BW 20 1J0024−7204P 47 Tuc (NGC 104) 3.64 BW 20 2J0024−7204V 47 Tuc (NGC 104) 4.81 eRB 20 2J0024−7204ac 47 Tuc (NGC 104) 2.74 eBW 20 3J0024−7204ad 47 Tuc (NGC 104) 3.74 eRB 20 3J1312+1810B M53 (NGC 5024) 6.24 B 760 4J1312+1810C M53 (NGC 5024) 12.53 I 760 4J1312+1810D M53 (NGC 5024) 6.07 B 760 4J1326−4728C 𝜔 Cen (NGC 5139) 6.87 I 300 5J1326−4728D 𝜔 Cen (NGC 5139) 4.58 I 300 5J1326−4728E 𝜔 Cen (NGC 5139) 4.21 I 300 5J1342+2822A M3 (NGC 5272) 2.55 BW 13 6J1342+2822B* M3 (NGC 5272) 2.39 B 9 6J1342+2822C M3 (NGC 5272) 2.17 I 13 6J1342+2822D* M3 (NGC 5272) 5.44 B 13 6J1342+2822E M3 (NGC 5272) 5.47 B 13 6J1342+2822F M3 (NGC 5272) 4.4 B 13 6B1516+02A* M5 (NGC 5904) 5.55 I 2 7B1516+02B* M5 (NGC 5904) 7.95 B 2 7J1518+0204D M5 (NGC 5904) 2.99 B 160 9J1518+0204E M5 (NGC 5904) 3.18 B 160 9J1518+0204F M5 (NGC 5904) 2.65 B 160 10J1518+0204G M5 (NGC 5904) 2.75 B 160 11J1641+3627A* M13 (NGC 6205) 10.38 I 1 12J1647−0156A M12 (NGC 6218) 2.36 B 190 13J1657−0406A M10 (NGC 6254) 4.73 - 59 14J1657−0406B M10 (NGC 6254) 7.35 B 59 14J1701−3006A* M62 (NGC 6266) 5.24 B 4 15J1701−3006D* M62 (NGC 6266) 3.42 B 7 16J1701−3006E* M62 (NGC 6266) 3.23 eBW 56 16J1701−3006F* M62 (NGC 6266) 2.29 BW 36 16J1701−3006G M62 (NGC 6266) 4.61 B 100 17J1721−1936B NGC 6342 2.57 I 380 19J1735−3028B Terzan 1 11.14 I 85 20J1735−3028C Terzan 1 6.04 I 85 20J1735−3028D Terzan 1 5.39 I 85 20J1735−3028E Terzan 1 3.08 I 85 20J1735−3028F Terzan 1 5.21 I 85 20J1735−3028G Terzan 1 3.92 I 85 20J1737−0314B M14 (NGC 6402) 8.52 B 720 10J1737−0314C M14 (NGC 6402) 8.46 B 720 10J1737−0314D M14 (NGC 6402) 2.89 eRB 720 10J1737−0314E M14 (NGC 6402) 2.28 eRB 720 10J1748−2446C* Terzan 5 8.44 I 1 21J1748−2446D* Terzan 5 4.71 I 1 22J1748−2446G* Terzan 5 21.67 I 3 22J1748−2446I* Terzan 5 9.57 B 3 22J1748−2446M* Terzan 5 3.57 B 3 22J1748−2446R* Terzan 5 5.03 I 3 22J1748−2446S* Terzan 5 6.12 I 3 22J1748−2446T* Terzan 5 7.08 I 3 22J1748−2446U* Terzan 5 3.29 B 3 22J1748−2446W* Terzan 5 4.21 B 3 22J1748−2446Y* Terzan 5 2.05 B 3 22J1748−2446aa* Terzan 5 5.79 I 3 23J1748−2446ab* Terzan 5 5.12 I 3 23J1748−2446ac* Terzan 5 5.09 I 3 23J1748−2446ae* Terzan 5 3.66 B 3 23J1748−2446af* Terzan 5 3.3 I 3 23J1748−2446ag* Terzan 5 4.45 I 3 23J1748−2446ah* Terzan 5 4.97 I 3 23
MNRAS 000, 1–20 (2015)
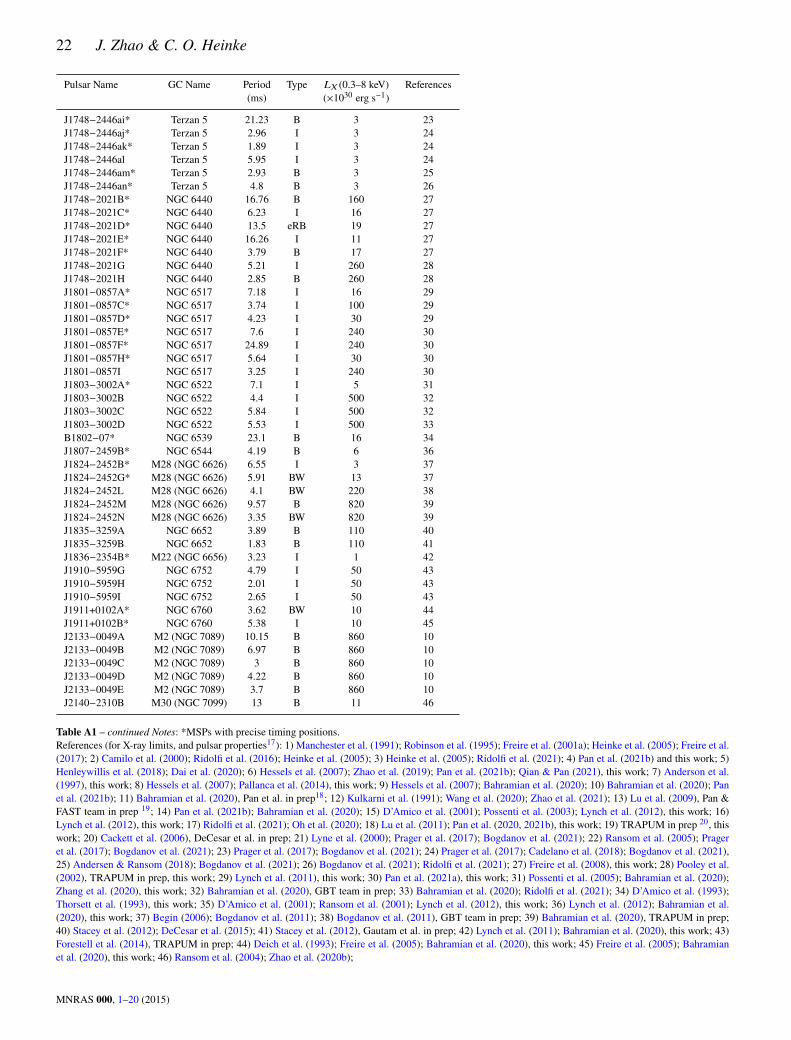
22 J. Zhao & C. O. Heinke
Pulsar Name GC Name Period Type 𝐿𝑋 (0.3–8 keV) References(ms) (×1030 erg s−1)
J1748−2446ai* Terzan 5 21.23 B 3 23J1748−2446aj* Terzan 5 2.96 I 3 24J1748−2446ak* Terzan 5 1.89 I 3 24J1748−2446al Terzan 5 5.95 I 3 24J1748−2446am* Terzan 5 2.93 B 3 25J1748−2446an* Terzan 5 4.8 B 3 26J1748−2021B* NGC 6440 16.76 B 160 27J1748−2021C* NGC 6440 6.23 I 16 27J1748−2021D* NGC 6440 13.5 eRB 19 27J1748−2021E* NGC 6440 16.26 I 11 27J1748−2021F* NGC 6440 3.79 B 17 27J1748−2021G NGC 6440 5.21 I 260 28J1748−2021H NGC 6440 2.85 B 260 28J1801−0857A* NGC 6517 7.18 I 16 29J1801−0857C* NGC 6517 3.74 I 100 29J1801−0857D* NGC 6517 4.23 I 30 29J1801−0857E* NGC 6517 7.6 I 240 30J1801−0857F* NGC 6517 24.89 I 240 30J1801−0857H* NGC 6517 5.64 I 30 30J1801−0857I NGC 6517 3.25 I 240 30J1803−3002A* NGC 6522 7.1 I 5 31J1803−3002B NGC 6522 4.4 I 500 32J1803−3002C NGC 6522 5.84 I 500 32J1803−3002D NGC 6522 5.53 I 500 33B1802−07* NGC 6539 23.1 B 16 34J1807−2459B* NGC 6544 4.19 B 6 36J1824−2452B* M28 (NGC 6626) 6.55 I 3 37J1824−2452G* M28 (NGC 6626) 5.91 BW 13 37J1824−2452L M28 (NGC 6626) 4.1 BW 220 38J1824−2452M M28 (NGC 6626) 9.57 B 820 39J1824−2452N M28 (NGC 6626) 3.35 BW 820 39J1835−3259A NGC 6652 3.89 B 110 40J1835−3259B NGC 6652 1.83 B 110 41J1836−2354B* M22 (NGC 6656) 3.23 I 1 42J1910−5959G NGC 6752 4.79 I 50 43J1910−5959H NGC 6752 2.01 I 50 43J1910−5959I NGC 6752 2.65 I 50 43J1911+0102A* NGC 6760 3.62 BW 10 44J1911+0102B* NGC 6760 5.38 I 10 45J2133−0049A M2 (NGC 7089) 10.15 B 860 10J2133−0049B M2 (NGC 7089) 6.97 B 860 10J2133−0049C M2 (NGC 7089) 3 B 860 10J2133−0049D M2 (NGC 7089) 4.22 B 860 10J2133−0049E M2 (NGC 7089) 3.7 B 860 10J2140−2310B M30 (NGC 7099) 13 B 11 46
Table A1 – continued Notes: *MSPs with precise timing positions.References (for X-ray limits, and pulsar properties17): 1) Manchester et al. (1991); Robinson et al. (1995); Freire et al. (2001a); Heinke et al. (2005); Freire et al.(2017); 2) Camilo et al. (2000); Ridolfi et al. (2016); Heinke et al. (2005); 3) Heinke et al. (2005); Ridolfi et al. (2021); 4) Pan et al. (2021b) and this work; 5)Henleywillis et al. (2018); Dai et al. (2020); 6) Hessels et al. (2007); Zhao et al. (2019); Pan et al. (2021b); Qian & Pan (2021), this work; 7) Anderson et al.(1997), this work; 8) Hessels et al. (2007); Pallanca et al. (2014), this work; 9) Hessels et al. (2007); Bahramian et al. (2020); 10) Bahramian et al. (2020); Panet al. (2021b); 11) Bahramian et al. (2020), Pan et al. in prep18; 12) Kulkarni et al. (1991); Wang et al. (2020); Zhao et al. (2021); 13) Lu et al. (2009), Pan &FAST team in prep 19; 14) Pan et al. (2021b); Bahramian et al. (2020); 15) D’Amico et al. (2001); Possenti et al. (2003); Lynch et al. (2012), this work; 16)Lynch et al. (2012), this work; 17) Ridolfi et al. (2021); Oh et al. (2020); 18) Lu et al. (2011); Pan et al. (2020, 2021b), this work; 19) TRAPUM in prep 20, thiswork; 20) Cackett et al. (2006), DeCesar et al. in prep; 21) Lyne et al. (2000); Prager et al. (2017); Bogdanov et al. (2021); 22) Ransom et al. (2005); Prageret al. (2017); Bogdanov et al. (2021); 23) Prager et al. (2017); Bogdanov et al. (2021); 24) Prager et al. (2017); Cadelano et al. (2018); Bogdanov et al. (2021),25) Andersen & Ransom (2018); Bogdanov et al. (2021); 26) Bogdanov et al. (2021); Ridolfi et al. (2021); 27) Freire et al. (2008), this work; 28) Pooley et al.(2002), TRAPUM in prep, this work; 29) Lynch et al. (2011), this work; 30) Pan et al. (2021a), this work; 31) Possenti et al. (2005); Bahramian et al. (2020);Zhang et al. (2020), this work; 32) Bahramian et al. (2020), GBT team in prep; 33) Bahramian et al. (2020); Ridolfi et al. (2021); 34) D’Amico et al. (1993);Thorsett et al. (1993), this work; 35) D’Amico et al. (2001); Ransom et al. (2001); Lynch et al. (2012), this work; 36) Lynch et al. (2012); Bahramian et al.(2020), this work; 37) Begin (2006); Bogdanov et al. (2011); 38) Bogdanov et al. (2011), GBT team in prep; 39) Bahramian et al. (2020), TRAPUM in prep;40) Stacey et al. (2012); DeCesar et al. (2015); 41) Stacey et al. (2012), Gautam et al. in prep; 42) Lynch et al. (2011); Bahramian et al. (2020), this work; 43)Forestell et al. (2014), TRAPUM in prep; 44) Deich et al. (1993); Freire et al. (2005); Bahramian et al. (2020), this work; 45) Freire et al. (2005); Bahramianet al. (2020), this work; 46) Ransom et al. (2004); Zhao et al. (2020b);
MNRAS 000, 1–20 (2015)
Copyright © 2022 FDOKUMEN