Sequences for controlling laser excitation with femtosecond three-pulse four-wave mixing
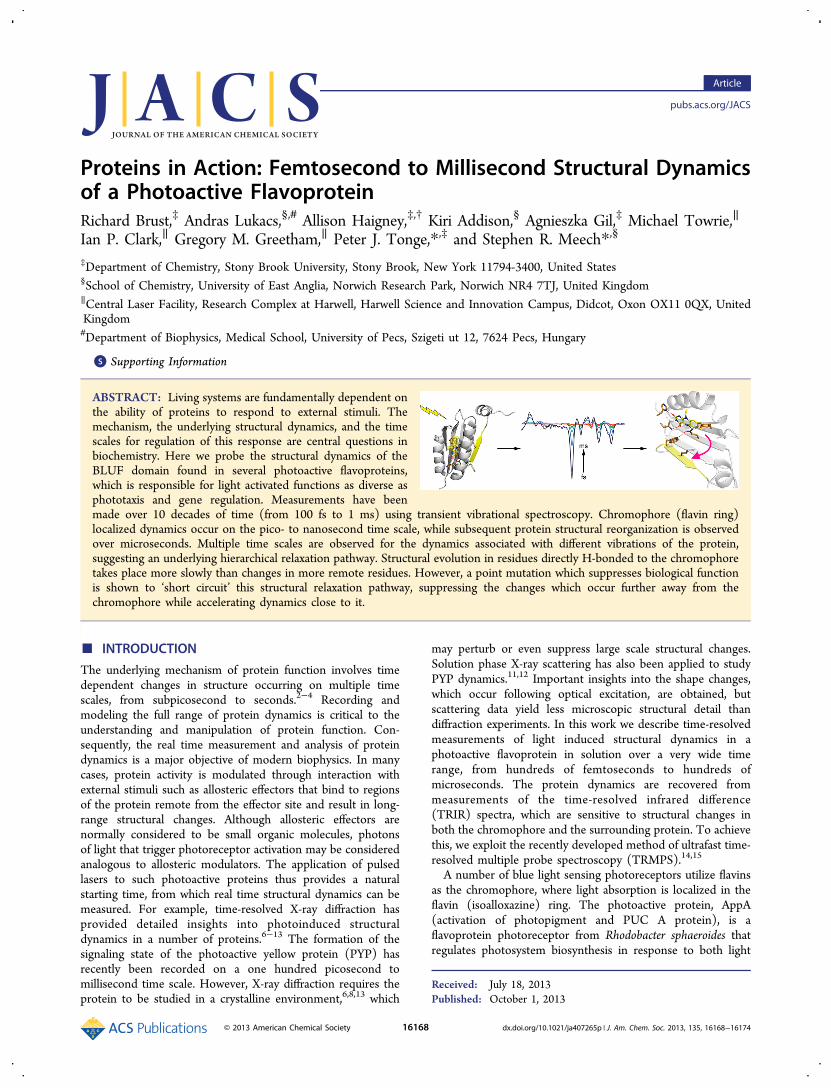
Proteins in Action: Femtosecond to Millisecond Structural Dynamicsof a Photoactive FlavoproteinRichard Brust,‡ Andras Lukacs,§,# Allison Haigney,‡,† Kiri Addison,§ Agnieszka Gil,‡ Michael Towrie,∥
Ian P. Clark,∥ Gregory M. Greetham,∥ Peter J. Tonge,*,‡ and Stephen R. Meech*,§
‡Department of Chemistry, Stony Brook University, Stony Brook, New York 11794-3400, United States§School of Chemistry, University of East Anglia, Norwich Research Park, Norwich NR4 7TJ, United Kingdom∥Central Laser Facility, Research Complex at Harwell, Harwell Science and Innovation Campus, Didcot, Oxon OX11 0QX, UnitedKingdom#Department of Biophysics, Medical School, University of Pecs, Szigeti ut 12, 7624 Pecs, Hungary
*S Supporting Information
ABSTRACT: Living systems are fundamentally dependent onthe ability of proteins to respond to external stimuli. Themechanism, the underlying structural dynamics, and the timescales for regulation of this response are central questions inbiochemistry. Here we probe the structural dynamics of theBLUF domain found in several photoactive flavoproteins,which is responsible for light activated functions as diverse asphototaxis and gene regulation. Measurements have beenmade over 10 decades of time (from 100 fs to 1 ms) using transient vibrational spectroscopy. Chromophore (flavin ring)localized dynamics occur on the pico- to nanosecond time scale, while subsequent protein structural reorganization is observedover microseconds. Multiple time scales are observed for the dynamics associated with different vibrations of the protein,suggesting an underlying hierarchical relaxation pathway. Structural evolution in residues directly H-bonded to the chromophoretakes place more slowly than changes in more remote residues. However, a point mutation which suppresses biological functionis shown to ‘short circuit’ this structural relaxation pathway, suppressing the changes which occur further away from thechromophore while accelerating dynamics close to it.
■ INTRODUCTION
The underlying mechanism of protein function involves timedependent changes in structure occurring on multiple timescales, from subpicosecond to seconds.2−4 Recording andmodeling the full range of protein dynamics is critical to theunderstanding and manipulation of protein function. Con-sequently, the real time measurement and analysis of proteindynamics is a major objective of modern biophysics. In manycases, protein activity is modulated through interaction withexternal stimuli such as allosteric effectors that bind to regionsof the protein remote from the effector site and result in long-range structural changes. Although allosteric effectors arenormally considered to be small organic molecules, photonsof light that trigger photoreceptor activation may be consideredanalogous to allosteric modulators. The application of pulsedlasers to such photoactive proteins thus provides a naturalstarting time, from which real time structural dynamics can bemeasured. For example, time-resolved X-ray diffraction hasprovided detailed insights into photoinduced structuraldynamics in a number of proteins.6−13 The formation of thesignaling state of the photoactive yellow protein (PYP) hasrecently been recorded on a one hundred picosecond tomillisecond time scale. However, X-ray diffraction requires theprotein to be studied in a crystalline environment,6,8,13 which
may perturb or even suppress large scale structural changes.Solution phase X-ray scattering has also been applied to studyPYP dynamics.11,12 Important insights into the shape changes,which occur following optical excitation, are obtained, butscattering data yield less microscopic structural detail thandiffraction experiments. In this work we describe time-resolvedmeasurements of light induced structural dynamics in aphotoactive flavoprotein in solution over a very wide timerange, from hundreds of femtoseconds to hundreds ofmicroseconds. The protein dynamics are recovered frommeasurements of the time-resolved infrared difference(TRIR) spectra, which are sensitive to structural changes inboth the chromophore and the surrounding protein. To achievethis, we exploit the recently developed method of ultrafast time-resolved multiple probe spectroscopy (TRMPS).14,15
A number of blue light sensing photoreceptors utilize flavinsas the chromophore, where light absorption is localized in theflavin (isoalloxazine) ring. The photoactive protein, AppA(activation of photopigment and PUC A protein), is aflavoprotein photoreceptor from Rhodobacter sphaeroides thatregulates photosystem biosynthesis in response to both light
Received: July 18, 2013Published: October 1, 2013
Article
pubs.acs.org/JACS
© 2013 American Chemical Society 16168 dx.doi.org/10.1021/ja407265p | J. Am. Chem. Soc. 2013, 135, 16168−16174

and oxygen levels.16,17 The protein comprises two domains: anN-terminal blue-light utilizing flavin (BLUF) domain, whichbinds the flavin adenine dinucleotide (FAD) chromophore(Figure 1A), and a C-terminal domain that is the binding site
for the transcription factor, PpsR. In low light, low oxygenenvironments AppA sequesters PpsR, but under blue lightillumination, it undergoes a conformational change resulting inthe release of the transcription factor, which then binds to DNAto inhibit photosystem biosynthesis.18,19 The BLUF domain isof particular interest since it is a modular unit found in anumber of blue light sensing proteins where it controlsfunctions as diverse as phototaxis, the photophobic responseand gene expression.17,20−22 Recently, it was proposed that themodular nature of the BLUF domain lends itself to applicationsin the emerging field of optogenetics.23
BLUF domain proteins exhibit a two state, reversiblephotocycle characterized by a ca. 10 nm red shift in theabsorption spectrum of the flavin ring of FAD, which itselfremains intact and in its oxidized state in both dark andsignaling states.21,22 The red shift occurs within 1 ns and thephotocycle is completed by recovery of the dark adapted(dAppA) ground state in 30 min.24 A number of crystalstructures have been solved for the N-terminal BLUF domainof AppA (AppABLUF), revealing an intricate H-bonding networksurrounding the chromophore (Figure 1B).5,25 Studies of thestructure of dAppABLUF and its light adapted signaling state(lAppABLUF) suggest that a key step in forming the signalingstate is rotation of the conserved glutamine (Q63 in AppA)adjacent to the flavin ring; in-line with this, Q63 is found to bean essential residue for photoactivity.5,26 On the basis ofprevious work and our study of the photoinactive mutantQ63E, we proposed a refinement to this model in whichtautomerization of Q63 precedes rotation, leading to theformation of a new H-bond to the flavin C4O carbonyl(Figure 1C).27,28 This is consistent with stationary statevibrational spectra, where a red shift in the C4O stretchmode (indicative of stronger H-bonding) is observed between
dark and light adapted states.5,19 Other conserved residuescritical to photoactivation include Y21 and W104.29 In thefollowing, we report femtosecond to millisecond TRIR ofdAppABLUF and two of its mutants (W104A and M106A) asthey evolve from the dark to the signaling state. We probe boththe evolution in protein structure and the pathway of thestructure change as it propagates away from the chromophore.
■ EXPERIMENTAL METHODSMaterials. FAD (disodium salt) was from Sigma Aldrich. D2O
(99.9 atom %) and [U-13C6]-D-glucose (99 atom %) were fromCambridge Isotope Laboratories. Ampicillin (disodium salt), 100xMEM vitamins, and Minimal media were from Fisher.
Protein Expression and Purification. Mutants were prepared bysite directed mutagenesis using pfu Turbo (Agilent). For W104A, theprimers used were 5′ TTT GCG GGA GCG CAC ATG CAG CTCTCC TGC TCG 3′ (forward) and 5′ CGA GCA GGA GAG CTGCAT GTG CGC TCC CGC AAA 3′ (reverse). For M106A, theprimers used were 5′ TTT GCG GGA TGG CAC GCG CAG CTCTCC TGC TCG 3′ (forward) and 5′ CGA GCA GGA GAG CTGCGC GTG CCA TCC CGC AAA 3′ (reverse). AppABLUF, its mutantsand [U-13C]-AppABLUF were expressed in BL21(DE3) Escherichia colicells and purified as described previously.28
Steady State Fourier Transform Infrared (FTIR) Spectrosco-py. Light minus dark FTIR spectra were obtained on a Vertex 80(Bruker) FTIR spectrometer. Here, 80 μL of 2 mM protein was placedbetween two CaF2 plates equipped with a 50 μm spacer. 128 scanswere accumulated at a 3 cm−1 resolution. The light state was generatedby 3 min irradiation using a 460 nm high power mounted LED(Prizmatix). The LED used had a mounted objective providing afocused blue beam on the surface of the infrared cell.
TRMPS. The TRMPS method exploits the high signal-to-noise andstable pulse-to-pulse timing of a 10 kHz amplified titanium sapphirelaser pumping OPAs for the generation of ∼50 fs IR probe pulses,described elsewhere.14 A second 1 kHz amplified titanium sapphirelaser provides the visible pump pulses (450 nm, ∼100 fs, 1 μJ, ∼120μm diameter spot size at the sample). The two amplifiers aresynchronized with the 65 MHz repetition rate of the common titaniumsapphire seed laser, with the seed laser optically delayed before the 1kHz amplifier to achieve 100 fs to 15 ns relative pump−probe delays.For delay times between 15 ns and 100 μs, the oscillator seed pulsetrain is used to add steps of 15 ns to the pump laser delay. For timesbetween 100 μs and 1 ms, the 10 kHz probe pulses provide a datapoint every 0.1 ms, until the following pump pulse starts theexperiment again every 1 ms (at the 1 kHz repetition rate of the pumplaser). Pump polarization was set to 54.7° relative to the IR beam toeliminate contributions from orientational relaxation.
■ RESULTS AND DISCUSSION
Chromophore Dynamics. Figure 2A shows the timedependent TRIR spectra for dAppABLUF between 2 ps and 10ns after 450 nm excitation of the flavin ring of FAD, thechromophore responsible for blue light absorption in photo-active flavoproteins. These difference spectra comprise thefollowing: negative bands (bleaches) associated with depletionof the flavin ground state population, or with photoinducedchanges in the vibrational spectrum of the protein, occurringeither directly through electronic excitation at t = 0 or as aresult of subsequent structural dynamics; positive bandsassociated with vibrations of the electronically excited state ofthe flavin, or with modes of the protein which shift as a result ofelectronic excitation, or of products formed subsequently. Thedominant subnanosecond relaxation is well fit by abiexponential function with components of tens and hundredsof picoseconds consistent with an inhomogeneous distributionof ground state structures leading to a distribution of decay
Figure 1. Structure and H-bonding of FAD in AppABLUF. (A) Crystalstructure of AppABLUF showing flavin binding between helices 1 and 2.(B) The H-bonding network around the flavin that includes the keyresidues Y21, Q63, W104, and M106. The figure was made usingPymol,1 and the structure 1YRX.pdb.5 (C) Details of the proposed H-bonding network changes in dAppABLUF around the chromophorefollowing photoexcitation.
Journal of the American Chemical Society Article
dx.doi.org/10.1021/ja407265p | J. Am. Chem. Soc. 2013, 135, 16168−1617416169
rates (Supporting Information Table S1).27,28,30 The twohighest frequency bleach modes at 1700 and 1650 cm−1 areassociated with two carbonyl stretches of the FAD ground state,and are sensitive to the H-bond environment.31−34 The intensebleach at 1547 cm−1 and the weaker one at 1580 cm−1 are FADring modes. The two positive peaks formed immediately onexcitation at 1408 and 1383 cm−1 are not assigned to specificvibrational modes, but are associated with the excited state ofthe chromophore rather than with frequency shifted proteinmodes, as proven by comparison with the TRIR of the flavinring in free solution (Supporting Information Figure S1).The mechanism of the primary photochemical step in AppA
underlying the data of Figure 2A is controversial. Ultrafastoptical spectroscopy assigned the primary step to electrontransfer between excited FAD and an adjacent conservedtyrosine residue, Y21 (Figure 1B) followed by protontransfer.24,35−37 The resultant changes in electronic structurewere proposed to lead to changes in the H-bonding networkprior to back electron transfer. This assignment was based onanalysis of the complex multiphase kinetics and observations ofa radical-like spectrum in the transient visible absorption of arelated BLUF domain protein, PixD.30 We proposed analternative mechanism for AppA photoactivity where excitationof FAD itself is sufficient to induce a change in the H-bondingnetwork, giving rise to keto−enol tautomerization in Q63,which then leads on to the required structure change. Thisassignment was based on the absence of radical states of FADin the subnanosecond TRIR spectra of dAppABLUF,
27 theobserved prompt perturbation of the protein network onexcitation and the relative quenching and recovery kinetics ofFAD.27,28 There is theoretical support for both mecha-
nisms,38−40 and importantly, both agree that light inducedstructure change in the network of amino acids surroundingFAD occurs within 1 ns, which ultimately leads to formation ofthe signaling state.The focus of this paper is on the previously hidden evolution
in protein structure, which propagates from the N-terminalFAD binding site to ultimately release PpsR at the C-terminal,thus controlling photosystem biosynthesis. This requiresanalysis of the TRIR spectra beyond 10 ns.
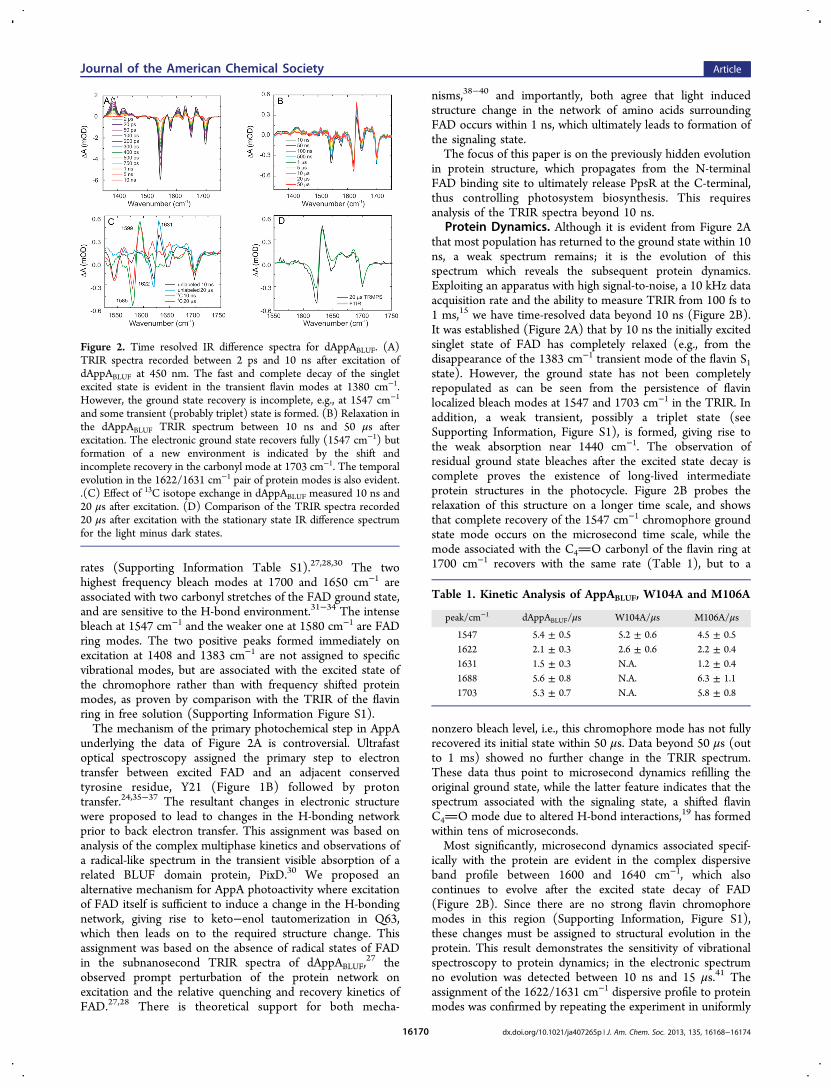
Protein Dynamics. Although it is evident from Figure 2Athat most population has returned to the ground state within 10ns, a weak spectrum remains; it is the evolution of thisspectrum which reveals the subsequent protein dynamics.Exploiting an apparatus with high signal-to-noise, a 10 kHz dataacquisition rate and the ability to measure TRIR from 100 fs to1 ms,15 we have time-resolved data beyond 10 ns (Figure 2B).It was established (Figure 2A) that by 10 ns the initially excitedsinglet state of FAD has completely relaxed (e.g., from thedisappearance of the 1383 cm−1 transient mode of the flavin S1state). However, the ground state has not been completelyrepopulated as can be seen from the persistence of flavinlocalized bleach modes at 1547 and 1703 cm−1 in the TRIR. Inaddition, a weak transient, possibly a triplet state (seeSupporting Information, Figure S1), is formed, giving rise tothe weak absorption near 1440 cm−1. The observation ofresidual ground state bleaches after the excited state decay iscomplete proves the existence of long-lived intermediateprotein structures in the photocycle. Figure 2B probes therelaxation of this structure on a longer time scale, and showsthat complete recovery of the 1547 cm−1 chromophore groundstate mode occurs on the microsecond time scale, while themode associated with the C4O carbonyl of the flavin ring at1700 cm−1 recovers with the same rate (Table 1), but to a
nonzero bleach level, i.e., this chromophore mode has not fullyrecovered its initial state within 50 μs. Data beyond 50 μs (outto 1 ms) showed no further change in the TRIR spectrum.These data thus point to microsecond dynamics refilling theoriginal ground state, while the latter feature indicates that thespectrum associated with the signaling state, a shifted flavinC4O mode due to altered H-bond interactions,19 has formedwithin tens of microseconds.Most significantly, microsecond dynamics associated specif-
ically with the protein are evident in the complex dispersiveband profile between 1600 and 1640 cm−1, which alsocontinues to evolve after the excited state decay of FAD(Figure 2B). Since there are no strong flavin chromophoremodes in this region (Supporting Information, Figure S1),these changes must be assigned to structural evolution in theprotein. This result demonstrates the sensitivity of vibrationalspectroscopy to protein dynamics; in the electronic spectrumno evolution was detected between 10 ns and 15 μs.41 Theassignment of the 1622/1631 cm−1 dispersive profile to proteinmodes was confirmed by repeating the experiment in uniformly
Figure 2. Time resolved IR difference spectra for dAppABLUF. (A)TRIR spectra recorded between 2 ps and 10 ns after excitation ofdAppABLUF at 450 nm. The fast and complete decay of the singletexcited state is evident in the transient flavin modes at 1380 cm−1.However, the ground state recovery is incomplete, e.g., at 1547 cm−1
and some transient (probably triplet) state is formed. (B) Relaxation inthe dAppABLUF TRIR spectrum between 10 ns and 50 μs afterexcitation. The electronic ground state recovers fully (1547 cm−1) butformation of a new environment is indicated by the shift andincomplete recovery in the carbonyl mode at 1703 cm−1. The temporalevolution in the 1622/1631 cm−1 pair of protein modes is also evident..(C) Effect of 13C isotope exchange in dAppABLUF measured 10 ns and20 μs after excitation. (D) Comparison of the TRIR spectra recorded20 μs after excitation with the stationary state IR difference spectrumfor the light minus dark states.
Table 1. Kinetic Analysis of AppABLUF, W104A and M106A
peak/cm−1 dAppABLUF/μs W104A/μs M106A/μs
1547 5.4 ± 0.5 5.2 ± 0.6 4.5 ± 0.51622 2.1 ± 0.3 2.6 ± 0.6 2.2 ± 0.41631 1.5 ± 0.3 N.A. 1.2 ± 0.41688 5.6 ± 0.8 N.A. 6.3 ± 1.11703 5.3 ± 0.7 N.A. 5.8 ± 0.8
Journal of the American Chemical Society Article
dx.doi.org/10.1021/ja407265p | J. Am. Chem. Soc. 2013, 135, 16168−1617416170
13C labeled protein, U-13C dAppABLUF; TRIR data recordedafter 10 ns and 20 μs are shown in Figure 2C. Both parts of thedispersive line shape are red-shifted by 36 ± 2 cm−1 from theunlabeled spectrum, consistent with an isotope shift. Incontrast, modes assigned to the FAD chromophore areunshifted.28 The assignment of the dispersive band to proteinis in good agreement with the stationary state IR differencespectra of Masuda and co-workers, who proposed on the basisof the observed frequencies that these changes arose from aCO (amide) mode of the β-sheet structure, which is linkedto FAD bound in the α-helix region by the key residues W104,Q63 and Y21 (Figure 1B).19
In figure 2D the TRIR spectrum recorded at 20 μs iscompared with a steady state IR difference spectrum recordedwith the same (approximately 3 cm−1) resolution. Thesespectra show that the structural dynamics associated with theseprotein modes are essentially complete within 20 μs, with nofurther changes in TRIR being observed out to 1 ms. Theformation of the signaling state within 20 μs is however longerthan the nanosecond time scale associated with the red shift ofthe FAD chromophore observed by ultrafast electronicspectroscopy.41 The microsecond time scale is significant inthe light of an NMR study of light and dark adapted forms ofthe BLUF domain, which suggested that the structural changeswhich occur are of small scale but take place in residuesrelatively remote from the FAD chromophore, including in theβ-sheet.42 The present data thus show that structural changestaking place at distances in excess of 10 Å from thechromophore can occur on the microsecond time scale.Further detail can be recovered from analysis of the kinetics
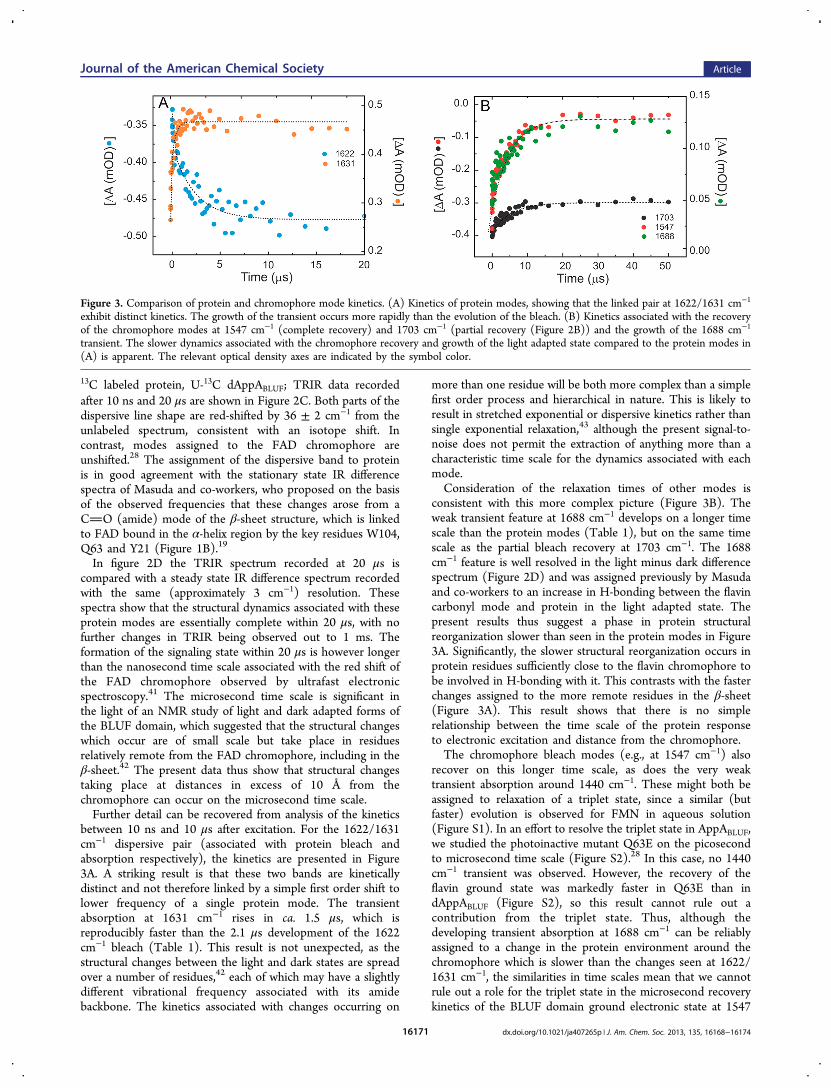
between 10 ns and 10 μs after excitation. For the 1622/1631cm−1 dispersive pair (associated with protein bleach andabsorption respectively), the kinetics are presented in Figure3A. A striking result is that these two bands are kineticallydistinct and not therefore linked by a simple first order shift tolower frequency of a single protein mode. The transientabsorption at 1631 cm−1 rises in ca. 1.5 μs, which isreproducibly faster than the 2.1 μs development of the 1622cm−1 bleach (Table 1). This result is not unexpected, as thestructural changes between the light and dark states are spreadover a number of residues,42 each of which may have a slightlydifferent vibrational frequency associated with its amidebackbone. The kinetics associated with changes occurring on
more than one residue will be both more complex than a simplefirst order process and hierarchical in nature. This is likely toresult in stretched exponential or dispersive kinetics rather thansingle exponential relaxation,43 although the present signal-to-noise does not permit the extraction of anything more than acharacteristic time scale for the dynamics associated with eachmode.Consideration of the relaxation times of other modes is
consistent with this more complex picture (Figure 3B). Theweak transient feature at 1688 cm−1 develops on a longer timescale than the protein modes (Table 1), but on the same timescale as the partial bleach recovery at 1703 cm−1. The 1688cm−1 feature is well resolved in the light minus dark differencespectrum (Figure 2D) and was assigned previously by Masudaand co-workers to an increase in H-bonding between the flavincarbonyl mode and protein in the light adapted state. Thepresent results thus suggest a phase in protein structuralreorganization slower than seen in the protein modes in Figure3A. Significantly, the slower structural reorganization occurs inprotein residues sufficiently close to the flavin chromophore tobe involved in H-bonding with it. This contrasts with the fasterchanges assigned to the more remote residues in the β-sheet(Figure 3A). This result shows that there is no simplerelationship between the time scale of the protein responseto electronic excitation and distance from the chromophore.The chromophore bleach modes (e.g., at 1547 cm−1) also
recover on this longer time scale, as does the very weaktransient absorption around 1440 cm−1. These might both beassigned to relaxation of a triplet state, since a similar (butfaster) evolution is observed for FMN in aqueous solution(Figure S1). In an effort to resolve the triplet state in AppABLUF,we studied the photoinactive mutant Q63E on the picosecondto microsecond time scale (Figure S2).28 In this case, no 1440cm−1 transient was observed. However, the recovery of theflavin ground state was markedly faster in Q63E than indAppABLUF (Figure S2), so this result cannot rule out acontribution from the triplet state. Thus, although thedeveloping transient absorption at 1688 cm−1 can be reliablyassigned to a change in the protein environment around thechromophore which is slower than the changes seen at 1622/1631 cm−1, the similarities in time scales mean that we cannotrule out a role for the triplet state in the microsecond recoverykinetics of the BLUF domain ground electronic state at 1547
Figure 3. Comparison of protein and chromophore mode kinetics. (A) Kinetics of protein modes, showing that the linked pair at 1622/1631 cm−1
exhibit distinct kinetics. The growth of the transient occurs more rapidly than the evolution of the bleach. (B) Kinetics associated with the recoveryof the chromophore modes at 1547 cm−1 (complete recovery) and 1703 cm−1 (partial recovery (Figure 2B)) and the growth of the 1688 cm−1
transient. The slower dynamics associated with the chromophore recovery and growth of the light adapted state compared to the protein modes in(A) is apparent. The relevant optical density axes are indicated by the symbol color.
Journal of the American Chemical Society Article
dx.doi.org/10.1021/ja407265p | J. Am. Chem. Soc. 2013, 135, 16168−1617416171
cm−1. We complemented the above analysis of individualassigned modes with a global analysis of the ps −μs spectrum(Supporting Information Figure S3), assuming a sequence offirst order kinetics, which reproduced the behavior describedhere.Modification of Protein Dynamics in W104A Ap-
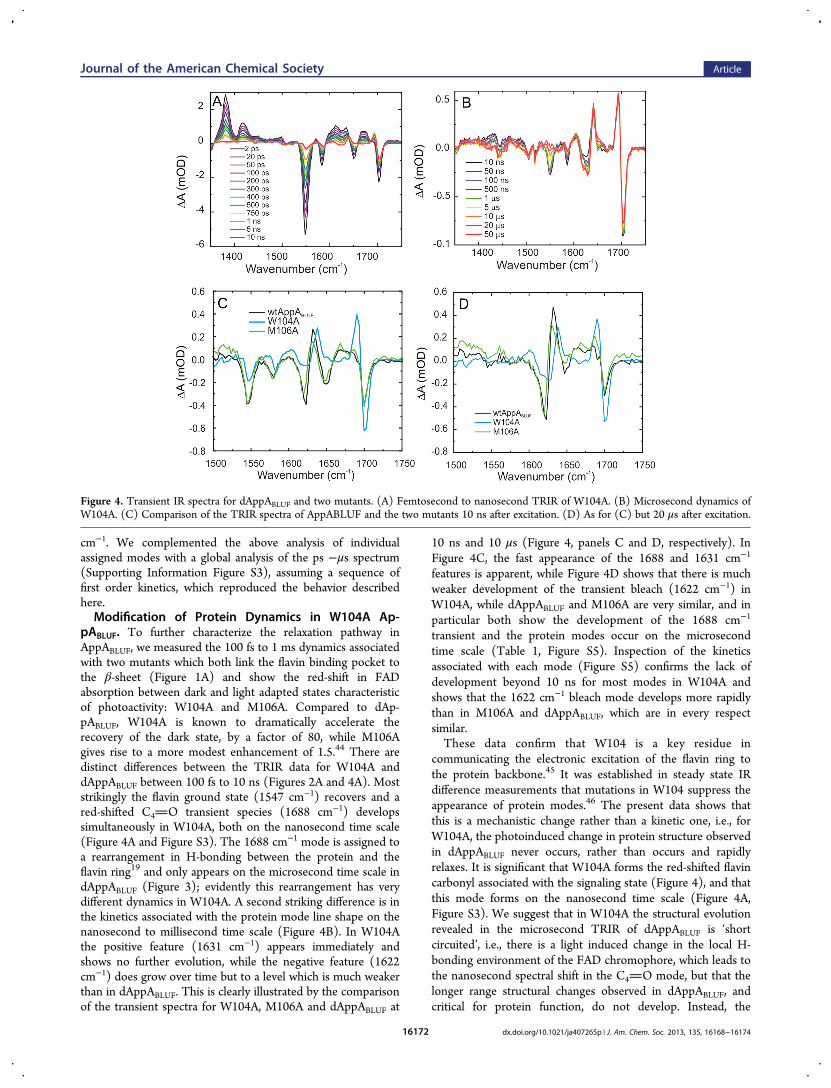
pABLUF. To further characterize the relaxation pathway inAppABLUF, we measured the 100 fs to 1 ms dynamics associatedwith two mutants which both link the flavin binding pocket tothe β-sheet (Figure 1A) and show the red-shift in FADabsorption between dark and light adapted states characteristicof photoactivity: W104A and M106A. Compared to dAp-pABLUF, W104A is known to dramatically accelerate therecovery of the dark state, by a factor of 80, while M106Agives rise to a more modest enhancement of 1.5.44 There aredistinct differences between the TRIR data for W104A anddAppABLUF between 100 fs to 10 ns (Figures 2A and 4A). Moststrikingly the flavin ground state (1547 cm−1) recovers and ared-shifted C4O transient species (1688 cm−1) developssimultaneously in W104A, both on the nanosecond time scale(Figure 4A and Figure S3). The 1688 cm−1 mode is assigned toa rearrangement in H-bonding between the protein and theflavin ring19 and only appears on the microsecond time scale indAppABLUF (Figure 3); evidently this rearrangement has verydifferent dynamics in W104A. A second striking difference is inthe kinetics associated with the protein mode line shape on thenanosecond to millisecond time scale (Figure 4B). In W104Athe positive feature (1631 cm−1) appears immediately andshows no further evolution, while the negative feature (1622cm−1) does grow over time but to a level which is much weakerthan in dAppABLUF. This is clearly illustrated by the comparisonof the transient spectra for W104A, M106A and dAppABLUF at
10 ns and 10 μs (Figure 4, panels C and D, respectively). InFigure 4C, the fast appearance of the 1688 and 1631 cm−1
features is apparent, while Figure 4D shows that there is muchweaker development of the transient bleach (1622 cm−1) inW104A, while dAppABLUF and M106A are very similar, and inparticular both show the development of the 1688 cm−1
transient and the protein modes occur on the microsecondtime scale (Table 1, Figure S5). Inspection of the kineticsassociated with each mode (Figure S5) confirms the lack ofdevelopment beyond 10 ns for most modes in W104A andshows that the 1622 cm−1 bleach mode develops more rapidlythan in M106A and dAppABLUF, which are in every respectsimilar.These data confirm that W104 is a key residue in
communicating the electronic excitation of the flavin ring tothe protein backbone.45 It was established in steady state IRdifference measurements that mutations in W104 suppress theappearance of protein modes.46 The present data shows thatthis is a mechanistic change rather than a kinetic one, i.e., forW104A, the photoinduced change in protein structure observedin dAppABLUF never occurs, rather than occurs and rapidlyrelaxes. It is significant that W104A forms the red-shifted flavincarbonyl associated with the signaling state (Figure 4), and thatthis mode forms on the nanosecond time scale (Figure 4A,Figure S3). We suggest that in W104A the structural evolutionrevealed in the microsecond TRIR of dAppABLUF is ‘shortcircuited’, i.e., there is a light induced change in the local H-bonding environment of the FAD chromophore, which leads tothe nanosecond spectral shift in the C4O mode, but that thelonger range structural changes observed in dAppABLUF, andcritical for protein function, do not develop. Instead, the
Figure 4. Transient IR spectra for dAppABLUF and two mutants. (A) Femtosecond to nanosecond TRIR of W104A. (B) Microsecond dynamics ofW104A. (C) Comparison of the TRIR spectra of AppABLUF and the two mutants 10 ns after excitation. (D) As for (C) but 20 μs after excitation.
Journal of the American Chemical Society Article
dx.doi.org/10.1021/ja407265p | J. Am. Chem. Soc. 2013, 135, 16168−1617416172
ground state structure recovers on a time scale similar to that ofdAppABLUF (Table 1).Such a short-range change in structure is consistent with the
eighty-fold increase in the rate of dark state recovery in W104A,compared to dAppABLUF and with biochemical measurementsof AppA antirepressor activity, which showed much loweractivity for W104A than for wild type.29 Evidently, a spectralshift alone is not sufficient to indicate a photoactive state of theBLUF domain.
■ CONCLUSIONS
Time resolved infrared spectroscopy has revealed the time scaleand pathway of structural dynamics in a BLUF domain.Structural dynamics were probed on the 100 fs to 1 ms timescale. Following electronic excitation, the primary events areassociated with relaxation of the flavin excited electronic state.This occurs on a subnanosecond time scale, and mainly resultsin recovery of the initial ground state, with a minor fraction ofexcited states leading to perturbation of the local structure ofthe protein and possibly some triplet state formation. Thesecondary steps involve protein structural dynamics whichconvert these local perturbations into the changes whicheventually form the signaling state, releasing the repressormolecule. The time scale for these protein structural dynamicsis 1−5 μs. The fastest steps communicate optical excitation tothe protein via the W104 residue in 1−2 μs, and more than oneresidue is involved, such that different protein modes presentdifferent response times. There are also slower dynamics whichreflect relaxation in the vicinity of the chromophore, showingthat the rate of structural change is not simply related todistance from the chromophore. In the W104A mutant,communication to the protein is suppressed, but fast H-bondrearrangements still occur around the chromophore, suggestingchanges in the chromophore spectrum alone are not a goodmeasure of photoactivity.
■ ASSOCIATED CONTENT
*S Supporting InformationTransient IR spectra of FMN in solution and Q63E; somefurther kinetic data. This material is available free of charge viathe Internet at http://pubs.acs.org.
■ AUTHOR INFORMATION
Corresponding [email protected]@uea.ac.uk
Present Address†A.H.: The Wistar Institute, Philadelphia, PA 19104, USA.
FundingFunded by EPSRC (EP/K000764/1) to SRM), STFC(program 101005 to S.R.M. and P.J.T.) and NSF (CHE-1223819 to P.J.T.).
NotesThe authors declare no competing financial interest.
■ ACKNOWLEDGMENTS
The authors are grateful to STFC for access to the central laserfacility. R.B. and A.G. thank the OPPF for their assistance insample preparation. K.A. thanks UEA for the award of astudentship.
■ REFERENCES(1) The Pymol Molecular Graphics System, Version 1.5.0.4.Shrodinger, LLC.(2) Agarwal, P. K.; Billeter, S. R.; Rajagopalan, P. T. R.; Benkovic, S.J.; Hammes-Schiffer, S. Proc. Natl. Acad. Sci. U. S. A. 2002, 99, 2794.(3) Yang, H.; Luo, G. B.; Karnchanaphanurach, P.; Louie, T. M.;Rech, I.; Cova, S.; Xun, L. Y.; Xie, X. S. Science 2003, 302, 262.(4) Lange, O. F.; Lakomek, N. A.; Fares, C.; Schroder, G. F.; Walter,K. F. A.; Becker, S.; Meiler, J.; Grubmuller, H.; Griesinger, C.; deGroot, B. L. Science 2008, 320, 1471.(5) Anderson, S.; Dragnea, V.; Masuda, S.; Ybe, J.; Moffat, K.; Bauer,C. Biochemistry 2005, 44, 7998.(6) Cho, H. S.; Dashdorj, N.; Schotte, F.; Graber, T.; Henning, R.;Anfinrud, P. Proc. Natl. Acad. Sci. U. S. A. 2010, 107, 7281.(7) Ihee, H.; Rajagopal, S.; Srajer, V.; Pahl, R.; Anderson, S.; Schmidt,M.; Schotte, F.; Anfinrud, P. A.; Wulff, M.; Moffat, K. Proc. Natl. Acad.Sci. U. S. A. 2005, 102, 7145.(8) Schotte, F.; Cho, H. S.; Kaila, V. R. I.; Kamikubo, H.; Dashdorj,N.; Henry, E. R.; Graber, T. J.; Henning, R.; Wulff, M.; Hummer, G.;Kataoka, M.; Anfinrud, P. A. Proc. Natl. Acad. Sci. U. S. A. 2012, 109,19256.(9) Ihee, H.; Lorenc, M.; Kim, T. K.; Kong, Q. Y.; Cammarata, M.;Lee, J. H.; Bratos, S.; Wulff, M. Science 2005, 309, 1223.(10) Kim, K. H.; Muniyappan, S.; Oang, K. Y.; Kim, J. G.; Nozawa,S.; Sato, T.; Koshihara, S. Y.; Henning, R.; Kosheleva, I.; Ki, H.; Kim,Y.; Kim, T. W.; Kim, J.; Adachi, S.; Ihee, H. J. Am. Chem. Soc. 2012,134, 7001.(11) Kim, T. W.; Lee, J. H.; Choi, J.; Kim, K. H.; van Wilderen, L. J.;Guerin, L.; Kim, Y.; Jung, Y. O.; Yang, C.; Kim, J.; Wulff, M.; vanThor, J. J.; Ihee, H. J. Am. Chem. Soc. 2012, 134, 3145.(12) Ramachandran, P. L.; Lovett, J. E.; Carl, P. J.; Cammarata, M.;Lee, J. H.; Jung, Y. O.; Ihee, H.; Timmel, C. R.; van Thor, J. J. J. Am.Chem. Soc. 2011, 133, 9395.(13) Jung, Y. O.; Lee, J. H.; Kim, J.; Schmidt, M.; Moffat, K.; Srajer,V.; Ihee, H. Nat. Chem. 2013, 5, 212.(14) Greetham, G. M.; Burgos, P.; Cao, Q. A.; Clark, I. P.; Codd, P.S.; Farrow, R. C.; George, M. W.; Kogimtzis, M.; Matousek, P.; Parker,A. W.; Pollard, M. R.; Robinson, D. A.; Xin, Z. J.; Towrie, M. Appl.Spectrosc. 2011, 64, 1311.(15) Greetham, G. M.; Sole, D.; Clark, I. P.; Parker, A. W.; Pollard,M. R.; Towrie, M. Rev. Sci. Instrum. 2012, 83.(16) Gomelsky, M.; Klug, G. Trends Biochem. Sci. 2002, 27, 497.(17) Losi, A.; Gartner, W. Photochem. Photobiol. 2010, 87, 491.(18) Willis, V. C.; Gizinski, A. M.; Banda, N. K.; Causey, C. P.;Knuckley, B.; Cordova, K. N.; Luo, Y.; Levitt, B.; Glogowska, M.;Chandra, P.; Kulik, L.; Robinson, W. H.; Arend, W. P.; Thompson, P.R.; Holers, V. M. J. Immunol. 2011, 186, 4396.(19) Masuda, S.; Hasegawa, K.; Ono, T. Biochemistry 2005, 44, 1215.(20) Ito, S.; Murakami, A.; Sato, K.; Nishina, Y.; Shiga, K.; Takahashi,T.; Higashi, S.; Iseki, M.; Watanabe, M. Photochem. Photobiol. Sci.2005, 4, 762.(21) Masuda, S.; Bauer, C. E. Cell 2002, 110, 613.(22) Masuda, S. Plant Cell Physiol. 2013, 54, 171.(23) Stierl, M.; Stumpf, P.; Udwari, D.; Gueta, R.; Hagedorn, R.;Losi, A.; Gartner, W.; Petereit, L.; Efetova, M.; Schwarzel, M.; Oertner,T. G.; Nagel, G.; Hegemann, P. J. Biol. Chem. 2011, 286, 1181.(24) Laan, W.; Gauden, M.; Yeremenko, S.; van Grondelle, R.;Kennis, J. T. M.; Hellingwerf, K. J. Biochemistry 2006, 45, 51.(25) Jung, A.; Domratcheva, T.; Tarutina, M.; Wu, Q.; Ko, W. H.;Shoeman, R. L.; Gomelsky, M.; Gardner, K. H.; Schlichting, L. Proc.Natl. Acad. Sci. U. S. A. 2005, 102, 12350.(26) Grinstead, J. S.; Hsu, S. T. D.; Laan, W.; Bonvin, A.;Hellingwerf, K. J.; Boelens, R.; Kaptein, R. ChemBioChem 2006, 7, 187.(27) Stelling, A. L.; Ronayne, K. L.; Nappa, J.; Tonge, P. J.; Meech, S.R. J. Am. Chem. Soc. 2007, 129, 15556.(28) Lukacs, A.; Haigney, A.; Brust, R.; Zhao, R. K.; Stelling, A. L.;Clark, I. P.; Towrie, M.; Greetham, G. M.; Meech, S. R.; Tonge, P. J. J.Am. Chem. Soc. 2011, 133, 16893.
Journal of the American Chemical Society Article
dx.doi.org/10.1021/ja407265p | J. Am. Chem. Soc. 2013, 135, 16168−1617416173

(29) Masuda, S.; Tomida, Y.; Ohta, H.; Takamiya, K. I. J. Mol. Biol.2007, 368, 1223.(30) Bonetti, C.; Stierl, M.; Mathes, T.; van Stokkum, I. H. M.;Mullen, K. M.; Cohen-Stuart, T. A.; van Grondelle, R.; Hegemann, P.;Kennis, J. T. M. Biochemistry 2009, 48, 11458.(31) Haigney, A.; Lukacs, A.; Brust, R.; Zhao, R. K.; Towrie, M.;Greetham, G. M.; Clark, I.; Illarionov, B.; Bacher, A.; Kim, R. R.;Fischer, M.; Meech, S. R.; Tonge, P. J. J. Phys. Chem. B 2012, 116,10722.(32) Haigney, A.; Lukacs, A.; Zhao, R. K.; Stelling, A. L.; Brust, R.;Kim, R. R.; Kondo, M.; Clark, I.; Towrie, M.; Greetham, G. M.;Illarionov, B.; Bacher, A.; Romisch-Margl, W.; Fischer, M.; Meech, S.R.; Tonge, P. J. Biochemistry 2011, 50, 1321.(33) Kondo, M.; Nappa, J.; Ronayne, K. L.; Stelling, A. L.; Tonge, P.J.; Meech, S. R. J. Phys. Chem. B 2006, 110, 20107.(34) Lukacs, A.; Zhao, R. K.; Haigney, A.; Brust, R.; Greetham, G.M.; Towrie, M.; Tonge, P. J.; Meech, S. R. J. Phys. Chem. B 2012, 116,5810.(35) Alexandre, M. T. A.; van Wilderen, L. J. G.; van Grondelle, R.;Hellingwerf, K. J.; Groot, M. L.; Kennis, J. T. M. Biophys. J. 2005, 88,509A.(36) Gauden, M.; Grinstead, J. S.; Laan, W.; van Stokkum, I. H. M.;Avila-Perez, M.; Toh, K. C.; Boelens, R.; Kaptein, R.; van Grondelle,R.; Hellingwerf, K. J.; Kennis, J. T. M. Biochemistry 2007, 46, 7405.(37) Mathes, T.; van Stokkum, I. H. M.; Bonetti, C.; Hegemann, P.;Kennis, J. T. M. J. Phys. Chem. B 2011, 115, 7963.(38) Domratcheva, T.; Grigorenko, B. L.; Schlichting, I.; Nemukhin,A. V. Biophys. J. 2008, 94, 3872.(39) Nunthaboot, N.; Tanaka, F.; Kokpol, S. J. Photochem. Photobiol.,A 2009, 207, 274.(40) Nunthaboot, N.; Tanaka, F.; Kokpol, S. J. Photochem. Photobiol.,A 2010, 209, 79.(41) Gauden, M.; Yeremenko, S.; Laan, W.; van Stokkum, I. H. M.;Ihalainen, J. A.; van Grondelle, R.; Hellingwerf, K. J.; Kennis, J. T. M.Biochemistry 2005, 44, 3653.(42) Wu, Q.; Ko, W. H.; Gardner, K. H. Biochemistry 2008, 47,10271.(43) Osvath, S.; Herenyi, L.; Zavodszky, P.; Fidy, J.; Kohler, G. J. Biol.Chem. 2006, 281, 24375.(44) Dragnea, V.; Arunkumar, A. I.; Yuan, H.; Giedroc, D. P.; Bauer,C. E. Biochemistry 2009, 48, 9969.(45) Masuda, S.; Hasegawa, K.; Ono, T. A. Plant Cell Physiol, 2005,46, 1894.(46) Hasegawa, K.; Masuda, S.; Ono, T. A. Plant Cell Physiol, 2005,46, 136.
Journal of the American Chemical Society Article
dx.doi.org/10.1021/ja407265p | J. Am. Chem. Soc. 2013, 135, 16168−1617416174
Copyright © 2022 FDOKUMEN