
Chandra X-Ray Observations of 19 Millisecond Pulsars in the Globular Cluster 47 Tucanae
13
arXiv:astro-ph/0604318v1 13 Apr 2006 Draft version February 5, 2008 Preprint typeset using L A T E X style emulateapj v. 6/22/04 CHANDRA X-RAY OBSERVATIONS OF NINETEEN MILLISECOND PULSARS IN THE GLOBULAR CLUSTER 47 TUCANAE Slavko Bogdanov 1 , Jonathan E. Grindlay 1 , Craig O. Heinke 1,2,3 , Fernando Camilo 4 , Paulo C. C. Freire 5 , and Werner Becker 6 Draft version February 5, 2008 ABSTRACT We present spectral and long-timescale variability analyses of Chandra X-ray Observatory ACIS- S observations of the 19 millisecond pulsars (MSPs) with precisely known positions in the globular cluster 47 Tucanae. The X-ray emission of the majority of these MSPs is well described by a thermal (blackbody or neutron star hydrogen atmosphere) spectrum with a temperature T eff ∼ (1 - 3) × 10 6 K, emission radius R eff ∼ 0.1 - 3 km, and luminosity L X ∼ 10 30−31 ergs s −1 . For several MSPs, there is indication that a second thermal component is required, similar to what is seen in some nearby field MSPs. The observed radiation most likely originates from the heated magnetic polar caps of the MSPs. The small apparent scatter in L X is consistent with thermal emission from the polar caps of a global dipole field although the small emission areas may imply either a more complex small-scale magnetic field configuration near the neutron star surface or non-uniform polar cap heating. The radio- eclipsing binary MSPs 47 Tuc J, O, and W show a significant non-thermal (power-law) component, with spectral photon index Γ ∼ 1 - 1.5, which most likely originates in an intrabinary shock formed due to interaction between the relativistic pulsar wind and matter from the stellar companion. We re-examine the X-ray–spindown luminosity relation (L X - ˙ E) and find that for the MSPs with thermal spectra L X ∝ ˙ E β , where β ∼ 0.2 ± 1.1. Due to the large uncertainties in both parameters the result is consistent with both the linear L X - ˙ E relation and the flatter L X ∝ ˙ E 0.5 predicted by polar cap heating models. In terms of X-ray properties, we find no clear systematic differences between MSPs in globular clusters and in the field of the Galaxy. We discuss the implications of these results of the present understanding of the X-ray emission properties of MSPs. Subject headings: globular clusters: general — globular clusters: individual (47 Tucanae) — pulsars: general — stars: neutron — X-rays: stars 1. INTRODUCTION Millisecond pulsars (MSPs) represent a distinct popu- lation of rotation-powered pulsars, characterized by short spin periods, P 25 ms, and small intrinsic spin-down rates, ˙ P i ∼ 10 −20 , implying relatively low surface mag- netic dipole field strengths B surf ∝ (P ˙ P i ) 1/2 ∼ 10 8−10 G and large characteristic spindown ages τ ≡ P/2 ˙ P i 1 Gyr. These objects have been studied extensively at radio wavelengths since their discovery (Backer et al. 1982) but at X-ray energies, where the bulk of ob- servable radiation is expected, this has become possi- ble only relatively recently, owing to their intrinsic faint- ness (L X < 10 33 ergs s −1 ). The ROSAT observatory was the first to detect X-ray emission from MSPs, in- cluding 10 in the field of the Galaxy and one in the globular cluster M28 (see Becker & Tr¨ umper 1999, and references therein). In recent years, the unprecedented 1 Harvard-Smithsonian Center for Astrophysics, 60 Gar- den St., Cambridge, MA 02138; [email protected], [email protected], [email protected] 2 Northwestern University, Department of Physics and Astronomy, 2145 Sheridan Rd., Evanston IL 60208; [email protected] 3 Lindheimer Postdoctoral Fellow 4 Columbia Astrophysics Laboratory, Columbia Univer- sity, 550 West 120th Street, New York, NY 10027; fer- [email protected] 5 National Astronomy and Ionosphere Center, Arecibo Obser- vatory, HC3 Box 53995, PR 00612; [email protected] 6 Max-Planck-Institut f¨ ur Extraterrestrische Physik, D-85740 Garching bei M¨ unchen, Germany; [email protected] sensitivity and spatial resolution of the Chandra X- ray Observatory have allowed the detection of X-ray counterparts to radio MSPs in several globular clus- ters: 47 Tucanae and NGC 6397 (Grindlay et al. 2002), NGC 6752 (D’Amico et al. 2002), M4 (Bassa et al. 2004), possibly M30 (Ransom et al. 2004), and M71 (El- sner et al., in preparation). In addition, the Chan- dra and XMM-Newton telescopes have allowed much more detailed studies of the existing sample of X-ray- detected MSPs than previously possible (Zavlin et al. 2002; Becker & Aschenbach 2002; Becker et al. 2003; Webb, Olive, & Barret 2004a; Webb et al. 2004b). The X-ray emission detected from MSPs is observed to be both of non-thermal and thermal character. In the X-ray bright MSPs, B1821–24 and B1937+21, the nar- row X-ray pulse profiles indicate the emission is beamed and, therefore, must be non-thermal radiation origi- nating in the pulsar magnetosphere (Becker & Tr¨ umper 1999). Alternatively, as seen in the “black widow” pul- sar, B1957+20, non-pulsed non-thermal X-rays can be produced by interaction of the relativistic particle wind from the pulsar with matter from a stellar compan- ion or the interstellar medium (Stappers et al. 2003). Thermal emission observed from nearby MSPs (see e.g. Zavlin et al. 2002; Becker & Aschenbach 2002), is be- lieved to originate from the magnetic polar caps of the underlying neutron star (NS), heated by a backflow of en- ergetic particles from the pulsar magnetosphere (see e.g. Harding & Muslimov 2002; Zhang & Cheng 2003, and
Transcript of Chandra X-Ray Observations of 19 Millisecond Pulsars in the Globular Cluster 47 Tucanae

arX
iv:a
stro
-ph/
0604
318v
1 1
3 A
pr 2
006
Draft version February 5, 2008Preprint typeset using LATEX style emulateapj v. 6/22/04
CHANDRA X-RAY OBSERVATIONS OF NINETEEN MILLISECOND PULSARSIN THE GLOBULAR CLUSTER 47 TUCANAE
Slavko Bogdanov1, Jonathan E. Grindlay1, Craig O. Heinke1,2,3,Fernando Camilo4, Paulo C. C. Freire5, and Werner Becker6
Draft version February 5, 2008
ABSTRACT
We present spectral and long-timescale variability analyses of Chandra X-ray Observatory ACIS-S observations of the 19 millisecond pulsars (MSPs) with precisely known positions in the globularcluster 47 Tucanae. The X-ray emission of the majority of these MSPs is well described by a thermal(blackbody or neutron star hydrogen atmosphere) spectrum with a temperature Teff ∼ (1 − 3) × 106
K, emission radius Reff ∼ 0.1−3 km, and luminosity LX ∼ 1030−31 ergs s−1. For several MSPs, thereis indication that a second thermal component is required, similar to what is seen in some nearbyfield MSPs. The observed radiation most likely originates from the heated magnetic polar caps of theMSPs. The small apparent scatter in LX is consistent with thermal emission from the polar caps ofa global dipole field although the small emission areas may imply either a more complex small-scalemagnetic field configuration near the neutron star surface or non-uniform polar cap heating. The radio-eclipsing binary MSPs 47 Tuc J, O, and W show a significant non-thermal (power-law) component,with spectral photon index Γ ∼ 1 − 1.5, which most likely originates in an intrabinary shock formeddue to interaction between the relativistic pulsar wind and matter from the stellar companion. Were-examine the X-ray–spindown luminosity relation (LX −E) and find that for the MSPs with thermal
spectra LX ∝ Eβ , where β ∼ 0.2 ± 1.1. Due to the large uncertainties in both parameters the resultis consistent with both the linear LX − E relation and the flatter LX ∝ E0.5 predicted by polar capheating models. In terms of X-ray properties, we find no clear systematic differences between MSPsin globular clusters and in the field of the Galaxy. We discuss the implications of these results of thepresent understanding of the X-ray emission properties of MSPs.Subject headings: globular clusters: general — globular clusters: individual (47 Tucanae) — pulsars:
general — stars: neutron — X-rays: stars
1. INTRODUCTION
Millisecond pulsars (MSPs) represent a distinct popu-lation of rotation-powered pulsars, characterized by shortspin periods, P . 25 ms, and small intrinsic spin-down
rates, Pi ∼ 10−20, implying relatively low surface mag-netic dipole field strengths Bsurf ∝ (PPi)
1/2 ∼ 108−10 G
and large characteristic spindown ages τ ≡ P/2Pi & 1Gyr. These objects have been studied extensively atradio wavelengths since their discovery (Backer et al.1982) but at X-ray energies, where the bulk of ob-servable radiation is expected, this has become possi-ble only relatively recently, owing to their intrinsic faint-ness (LX < 1033 ergs s−1). The ROSAT observatorywas the first to detect X-ray emission from MSPs, in-cluding 10 in the field of the Galaxy and one in theglobular cluster M28 (see Becker & Trumper 1999, andreferences therein). In recent years, the unprecedented
1 Harvard-Smithsonian Center for Astrophysics, 60 Gar-den St., Cambridge, MA 02138; [email protected],[email protected], [email protected]
2 Northwestern University, Department of Physicsand Astronomy, 2145 Sheridan Rd., Evanston IL 60208;[email protected]
3 Lindheimer Postdoctoral Fellow4 Columbia Astrophysics Laboratory, Columbia Univer-
sity, 550 West 120th Street, New York, NY 10027; [email protected]
5 National Astronomy and Ionosphere Center, Arecibo Obser-vatory, HC3 Box 53995, PR 00612; [email protected]
6 Max-Planck-Institut fur Extraterrestrische Physik, D-85740Garching bei Munchen, Germany; [email protected]
sensitivity and spatial resolution of the Chandra X-ray Observatory have allowed the detection of X-raycounterparts to radio MSPs in several globular clus-ters: 47 Tucanae and NGC 6397 (Grindlay et al. 2002),NGC 6752 (D’Amico et al. 2002), M4 (Bassa et al.2004), possibly M30 (Ransom et al. 2004), and M71 (El-sner et al., in preparation). In addition, the Chan-dra and XMM-Newton telescopes have allowed muchmore detailed studies of the existing sample of X-ray-detected MSPs than previously possible (Zavlin et al.2002; Becker & Aschenbach 2002; Becker et al. 2003;Webb, Olive, & Barret 2004a; Webb et al. 2004b).
The X-ray emission detected from MSPs is observedto be both of non-thermal and thermal character. In theX-ray bright MSPs, B1821–24 and B1937+21, the nar-row X-ray pulse profiles indicate the emission is beamedand, therefore, must be non-thermal radiation origi-nating in the pulsar magnetosphere (Becker & Trumper1999). Alternatively, as seen in the “black widow” pul-sar, B1957+20, non-pulsed non-thermal X-rays can beproduced by interaction of the relativistic particle windfrom the pulsar with matter from a stellar compan-ion or the interstellar medium (Stappers et al. 2003).Thermal emission observed from nearby MSPs (see e.g.Zavlin et al. 2002; Becker & Aschenbach 2002), is be-lieved to originate from the magnetic polar caps of theunderlying neutron star (NS), heated by a backflow of en-ergetic particles from the pulsar magnetosphere (see e.g.Harding & Muslimov 2002; Zhang & Cheng 2003, and

2 Bogdanov et al.
Y
10"
R
W
O
L
F
SG,IT
N
E
D
Q
M
C
JU
H
Fig. 1.— A merged 0.3 − 6 keV image of all four Chandra ACIS-S observations of 47 Tucanae showing the positions of the X-raycounterparts of 19 millisecond pulsars. The 1′′ circles are centered on the radio MSP locations and enclose ≥ 90% of the total energy for0.5 − 1 keV thermal sources. The grayscale corresponds to number of counts increasing logarithmically from zero (white) to 8306 (black).North is up and east is to the left.
references therein).The detection of 16 MSPs in the globular cluster 47
Tucanae (NGC 104, henceforth 47 Tuc) by the Chan-dra ACIS-I instrument has granted an excellent op-portunity for a detailed study of the physical proper-ties of this class of objects (Grindlay et al. 2001, 2002).These pulsars were discovered at radio wavelengths byManchester et al. (1990, 1991), Robinson et al. (1995),and Camilo et al. (2000). With further pulse timing ob-servations, Freire et al. (2001a, 2003) were able to obtainprecise positions for 16 of the 22 MSPs presently knownin this globular cluster (Camilo & Rasio 2005). In addi-tion, Edmonds et al. (2002) detected the optical counter-part of 47 Tuc W, which does not have an accurate radiotiming position, by matching the binary phase and pe-riod of an optical candidate with that of the radio pulsar.Finally, timing solutions have recently been obtained for47 Tuc R and Y (Freire et al., in preparation) thus in-creasing the number of MSPs with known positions inthis cluster to 19. Grindlay et al. (2002) have reportedin detail on the analysis of the X-ray emission propertiesof the 47 Tuc MSPs, using the Chandra ACIS-I obser-vations mentioned above. However, due to the inherentfaintness of these sources (LX ∼ 1030−31 ergs s−1) andthe limited exposure time (72 kiloseconds of total data
obtained resulting in 1-30 detected counts for each MSP),the exact nature of the X-ray emission could not be deter-mined with great confidence, although some interestingconstraints could be placed. In the meantime, additionalX-ray observations of 47 Tuc have been carried out, al-lowing further study of the properties of globular clusterMSPs as well as MSPs in general.
In this paper, we present spectral and long-timescalevariability analyses of the X-ray counterparts of MSPs inthe globular cluster 47 Tuc based on deep Chandra ACIS-S observations. This paper extends the work presentedin Heinke et al. (2005). The work is organized in thefollowing manner: §2 describes the observations and datareduction procedure; in §3 we discuss the X-ray spectralproperties of the MSPs, while in §4 we investigate thelong-term temporal behavior of the X-ray emission; in§5 we compare the X-ray and radio pulsar properties.Finally, in §6 we discuss the implications of the resultspresented and offer conclusions in §7.
2. OBSERVATIONS AND DATA REDUCTION
The data set presented here consists of four 65-kilosecond observations of the core of the globular cluster47 Tuc with the S3 chip of the Chandra ACIS-S detectorat the focus. The first three observations were performed

X-rays from Millisecond Pulsars in 47 Tuc 3
between 2002 September 29 and October 3, while thefourth was carried out on 2002 October 11. These ob-servations have resulted in the detection of ∼300 X-raysources within the half-mass radius of 47 Tuc, includingX-ray counterparts to all of the 19 MSPs with knownpositions. In this present paper we focus on the counter-parts of the radio MSPs; for a comprehensive analysis ofthe other X-ray sources, see Heinke et al. (2005). Theinitial data reduction and image processing were per-formed using the CIAO7 3.0 software package and arealso described in detail by Heinke et al. (2005). Figure 1shows the combined image of all four observations with1′′ circles centered at the radio position of each MSP. TheCIAO tool WAVDETECT was able to detect an X-raysource at the position of each of the radio MSPs, includ-ing 47 Tuc C, L, M, Q, and T, which were not detectedor only marginally detected in the 2000 ACIS-I observa-tions (Grindlay et al. 2002). The MSPs 47 Tuc G andI, separated by just 0.′′12, could not be individually re-solved, whereas 47 Tuc F and S, separated by 0.′′7, wereagain identified as a single elongated source. In this pa-per, we also include analyses of MSP W, whose opticalcounterpart was found by Edmonds et al. (2002) to co-incide with the X-ray source W29 (Grindlay et al. 2001),and the MSPs R and Y, whose recently obtained radiotiming solutions (Freire et al., in preparation) place themat the positions of the X-ray sources W198 and W82, re-spectively.
To facilitate the spectral and variability analyses, thecounts for each MSP in the 0.3–8 keV energy band wereextracted from circular regions with 1′′ radii around theradio MSP positions. These circles enclose ≥90% of thetotal energy for 0.5–1 keV thermal sources. A slightlymore involved extraction method was required for 47 TucF and S, whose extraction circles overlap, as evident inFigure 1. The relative contribution of counts from eachMSP was determined by maximum likelihood fits of two-dimensional Gaussians to the five X-ray sources in thevicinity of the radio positions of F and S using the Sherpaapplication in CIAO. This procedure was carried out inthe 0.3–4 keV range, as well as in three narrow bands(0.3–0.8 keV, 0.8–1.5 keV, and 1.5–4 keV) to allow anapproximate spectral analysis. Using this method wefind that 62 ± 7% of the total counts can be attributedto S. For 47 Tuc G and I, this was not possible as theirradio positions are only 0.′′12 apart. However, the countrate observed from their position is roughly twice thatof a typical MSP in the sample and is, thus, consistentwith being combined emisson from both MSPs. The netcounts for most MSPs were obtained by subtracting thebackground rate, obtained from three source-free regionson the image, from the total.
In general, the background noise in the energy range ofinterest was found to be very low (∼1 background countper pixel over ∼260 ks of total exposure time). This wasnot the case for 47 Tuc L, which is located very nearthe bright X-ray source X9 (Grindlay et al. 2001). Thebackground for this MSP was obtained by considering asection of an annulus of width 2′′ around the positionsof X9, at the distance to L, while excluding the 1′′ ex-traction circle around the MSP. Using this background
7 Chandra Interactive Analysis of Observations(http://asc.harvard.edu/ciao/)
Fig. 2.— X-ray color-color diagram for the MSPs in 47 Tuc.The lines represent model tracks for absorbed power-law (dotted),blackbody (dashed), and neutron star hydrogen atmosphere (dot-dashed) spectra convolved with the ACIS-S instrument response.The open symbols mark values for the model tracks in intervals of0.025 keV for the blackbody (squares) and hydrogen atmosphere(circles) temperatures and 0.25 for the power-law photon index(triangles).
region we find that ∼30% of the gross number of countsare due to X9. For 47 Tuc R, situated 1.′′3 from thebright source W24, this procedure was not possible dueto a combination of the smaller distance to W24 and thelarge pixel size of the ACIS detector. However, the dis-tribution of counts within the 1′′ extraction region of Rsuggests that W24 contributes with no more than 10%to the total counts. In the case of MSP O, the degree ofcontamination is difficult to gauge due to severe crowd-ing. In addition, the X-ray counterpart of 47 Tuc O,W39, is very likely a blend of the MSP and a variablesource (see §4).
3. SPECTRAL ANALYSIS
To get a general sense of the X-ray properties ofthe MSPs, we have computed the hardness ratiosHR1=(medium counts)/(soft counts) and HR2=(hardcounts)/(medium counts) for each object and con-structed an X-ray color-color diagram. The soft (0.3–0.6keV), medium (0.6–1.5 keV), and hard (1.5–4 keV) en-ergy bands were selected so as to reduce the errors inHR2, allowing us to discriminate between the two fa-vored spectral models: thermal or non-thermal (power-law). The net counts in the three bands for each MSPare listed in Table 1, while the resulting X-ray color-colordiagram is shown in Figure 2. For comparison, we have

4 Bogdanov et al.
TABLE 1Net counts from the 19 MSPs in 47 Tuc.
Soft Medium Hard Total CntsMSP (0.3-0.6 keV) (0.6-1.5 keV) (1.5-4 keV) (0.3-4 keV)
C 12 ± 4 29 ± 5 4 ± 2 45 ± 7D 20 ± 5 60 ± 8 12 ± 4 92 ± 10E 39 ± 6 74 ± 9 11 ± 3 124 ± 11F+Sa 67 ± 8 159 ± 13 20 ± 5 246 ± 16Fa 15 ± 12 83 ± 21 12 ± 7 93 ± 18G+I 40 ± 6 102 ± 10 16 ± 4 158 ± 12H 24 ± 5 46 ± 7 2 ± 2 72 ± 9J 25 ± 5 80 ± 9 32 ± 6 137 ± 12L 37 ± 8 132 ± 14 11 ± 7 180 ± 18M 7 ± 3 47 ± 7 2 ± 2 56 ± 8N 20 ± 5 40 ± 7 10 ± 3 70 ± 9O 30 ± 6 61 ± 9 10 ± 4 101 ± 12Q 18 ± 4 40 ± 6 9 ± 3 67 ± 8R 41 ± 8 105 ± 11 16 ± 5 162 ± 14Sa 52 ± 12 76 ± 21 8 ± 7 153 ± 20T 10 ± 3 22 ± 5 6 ± 3 38 ± 7U 10 ± 3 67 ± 8 11 ± 3 88 ± 9W 60 ± 8 160 ± 13 86 ± 9 306 ± 18Y 16 ± 5 41 ± 7 5 ± 3 62 ± 9
aFor F and S, we quote the combined counts as well as thecounts for each MSP apportioned using the procedure de-scribed in the text.
also plotted values of HR1 and HR2 for simple absorbedmodels of blackbody, neutron star hydrogen atmosphere(Romani 1987; Zavlin, Pavlov, & Shibanov 1996; Lloyd2003), and power-law spectra for a range of temperaturesand photon indices, respectively.
The Chandra ACIS-I observations of 47 Tuc revealedthat the X-ray colors of the majority of the MSPs are con-sistent with those of soft, presumably thermal, sourceswith blackbody temperatures of kT ∼ 0.22 keV andemission radii of R < 0.6 km (Grindlay et al. 2002).The X-ray color-color diagram for the ACIS-S data(Fig. 2) shows that, with the exception of 47 TucJ and W, the MSPs are indeed soft sources althoughthe positions of the MSPs on the diagram are sugges-tive of a more complex spectrum, such as a compos-ite thermal and non-thermal (power-law) spectrum or amulti-temperature thermal spectrum. As Grindlay et al.(2002) and Ransom et al. (2004) argue, although consis-tent with the X-ray colors of the MSPs, a pure thermalbremsstrahlung spectrum is ruled out as it would requireunrealistically large plasma densities, which would be in-consistent with the observed dispersion measures.
The fivefold improvement in counting statistics, result-ing from the longer exposure time and the better softresponse of the ACIS-S compared to the ACIS-I obser-vations, permits a more precise determination of the na-ture of the X-ray emission via spectral fitting for the 47Tuc MSPs. For this purpose, we used the total countsextracted for each MSP from the four observations togenerate source and background spectra, along with thecorresponding response matrix and auxiliary files. TheMSP pairs 47 Tuc F and S, and G and I, were treatedas single sources as the individual spectra could not beseparated. For the fainter MSPs, the extracted countswere grouped into energy bins containing at least 10counts, while for the brighter MSPs each bin contained
at least 15 counts. The subsequent least-squares fits tothe spectra were performed using the XSPEC8 softwarepackage and were restricted to photon energies between0.3 and 8 keV. In the fitting process, we considered thefollowing spectral models as plausible physical descrip-tions of the MSP emission: a pure blackbody (BB), anunmagnetized neutron star hydrogen atmosphere (NSA;Lloyd 2003), a pure power-law (PL), a composite ther-mal and power-law (BB+PL or NSA+PL), and a two-temperature thermal model (BB+BB or NSA+NSA).Throughout this analysis the hydrogen column densitywas fixed at the nominal value for 47 Tuc, NH = (1.3 ±0.3)×1020 cm−2 (Gratton et al. 2003; Predehl & Schmitt1995; Cardelli, Clayton, & Mathis 1989). For theNSA model we assumed a value of zg =
[
1 −(2GMNS) /
(
c2RNS
) ]−1/2 − 1 = 0.31 for the gravi-tational redshift at the NS surface, appropriate for aMNS = 1.4 M⊙, RNS = 10 km star. Thus, the onlyfree parameters for the BB and NSA fits were the effec-tive temperature and BB/NSA normalization, while forthe PL model the free parameters were the photon indexand the normalization.
From the spectral fits we find that many of the 47Tuc MSP spectra are well described by a purely thermalspectrum (BB or NSA). For the BB model the fits yieldedeffective temperatures and radii of Teff ∼ (1.5−3.0)×106
K and Reff ∼ 0.1 − 0.5 km, respectively, while in thecase of the NSA model we obtained Teff ∼ (0.8 − 1.8) ×106 K and Reff ∼ 0.3 − 3 km. Tables 2 and 3 list thebest fit model, the corresponding values for the fittedparameters, and the unabsorbed flux for each MSP forthe BB and NSA model fits, respectively. Figure 3 showsrepresentative thermal spectra for the 47 Tuc MSPs.
It is apparent from the values of χ2ν listed in Tables
2 and 3, as well as Figure 3, that the spectra of sev-eral MSPs are poorly fit by a single temperature model,especially at energies above ∼1.5 keV. In addition, wefind the fits to be unacceptable for a PL or a compos-ite PL+BB/PL+NSA model as well. Motivated by theresults for the nearby MSPs J0437–4715 (Zavlin et al.2002) and J0030+0451 (Becker & Aschenbach 2002) weattempted fitting a two-temperature polar cap model tothe brighter thermal-emitting 47 Tuc MSPs, namely, D,E, L, and R. We found that a two-temperature spec-trum can account for the excess at >1.5 keV apparentin Figure 3, resulting in an improved fit, although thelimited count statistics do not allow us to reliably con-strain the emission areas. Nonetheless, if we fix the twotemperatures to values comparable to those of J0437–4715 and J0030+0451 we obtain very similar results forthe effective radii of the 47 Tuc MSPs to those obtainedfor the two field MSPs. Specifically, in the case of theNSA model, for T1 = 2.1 × 10⁶ K and T2 = 0.54 × 10⁶
K (Zavlin et al. 2002) the fits yielded R1 ∼ 0.3 km andR2 ∼ 2 km, respectively, while for a BB model with T1 =3.2× 10⁶ K and T2 = 1.4× 10⁶ K (Becker & Aschenbach2002), we obtain R1 ∼ 50 m and R2 ∼ 300 m. If weextend the analogy further, it seems plausible that thethermal emission from all 47 Tuc MSPs consists of twocomponents as well. This imples that the derived valuesof Teff and Reff listed in Tables 2 and 3 for the single
8 http://heasarc.gsfc.nasa.gov/docs/xanadu/xspec/

X-rays from Millisecond Pulsars in 47 Tuc 5
TABLE 2Best fit spectral models and unabsorbed fluxes for the 47 Tuc MSPs.
Spectral Teff Reffb Photon χ2
ν/dof FX (0.3-8 keV)MSP Modela (106 K) (km) Index (10−15 ergs cm−2 s−1)
C BB 2.02 ± 0.18 0.11 ± 0.08 - 0.29/3 0.71+0.14−0.26
D BB 2.20 ± 0.17 0.13 ± 0.06 - 1.96/8 1.37+0.18−0.35
E BB 1.75 ± 0.09 0.28 ± 0.17 - 1.60/6 2.08+0.26−0.36
F+S BB 2.19 ± 0.09 0.22 ± 0.11 - 1.05/10 3.80+0.31−0.56
G+I BB 2.21 ± 0.12 0.18 ± 0.10 - 0.96/12 2.540.19+−0.48
H BB 1.93 ± 0.13 0.17 ± 0.11 - 0.55/6 1.30+0.12−0.33
J BB+PL 1.73 ± 0.21 0.22 ± 0.17 1.00 ± 0.56 1.07/5 4.77+0.95−1.51 (3.28+0.19
−2.32)
Lc BB 2.27 ± 0.10 0.20 ± 0.10 - 2.04/11 3.54+0.32−0.41
M BB 2.22 ± 0.18 0.11 ± 0.07 - 0.40/4 1.01+0.14−0.30
N BB 2.07 ± 0.18 0.13 ± 0.09 - 1.94/5 0.98+0.17−0.30
Oc BB+PL 1.76 ± 0.15 0.28 ± 0.18 1.33 ± 0.79 1.21/10 4.44+1.44−0.86 (2.23+0.24
−1.73)
Q BB 2.24 ± 0.20 0.11 ± 0.07 - 1.17/5 1.00+0.13−0.30
R BB 2.51 ± 0.16 0.15 ± 0.08 - 2.54/7 2.87+0.17−0.56
T BB 1.56 ± 0.16 0.19 ± 0.17 - 2.09/2 0.63+0.13−0.26
U BB 2.76 ± 0.22 0.08 ± 0.06 - 0.55/6 1.32+0.12−0.33
W BB+PL 1.52 ± 0.28 0.29 ± 0.29 1.36 ± 0.24 1.22/14 10.90+0.40−2.61 (9.55+1.75
−1.44)
Y BB 2.24 ± 0.18 0.11 ± 0.07 - 1.16/4 1.03+0.10−0.28
aPL is a power-law and BB is a single temperature blackbody model. For all MSPs the hydrogen column density was fixedat NH = (1.3 ± 0.3) × 1020 cm−2. In the last column, the values in parentheses for J, O, and W represent the flux in the PLcomponent. All uncertainties quoted are 1σ.
TABLE 3Best fit spectral models and unabsorbed fluxes for the 47 Tuc MSPs.
Spectral Teff Reffb Photon χ2
ν/dof FX (0.3-8 keV)MSP Modela (106 K) (km) Index (10−15 ergs cm−2 s−1)
C NSA 1.12+0.23−0.19 0.57 ± 0.56 - 0.68/3 0.73+0.09
−0.29
D NSA 1.29+0.20−0.17 0.61 ± 0.51 - 1.40/8 1.54+0.05
−0.62
E NSA 0.88+0.12−0.11 1.75 ± 1.41 - 1.03/6 2.28+0.05
−0.75
F+S NSA 1.27+0.10−0.09 1.03 ± 0.64 - 0.77/10 4.09+0.14
−0.62
G+I NSA 1.28+0.12−0.12 0.84 ± 0.58 - 0.60/12 2.78+0.16
−0.50
H NSA 1.04+0.16−0.14 0.94 ± 0.79 - 0.59/6 1.39+0.03
−0.68
J NSA+PL 0.89+0.20−0.16 1.43 ± 1.40 1.0 1.00/6 4.69+1.07
−1.56 (3.09+1.99−0.38)
Lc NSA 1.42+0.12−0.12 0.78 ± 0.50 - 2.09/11 3.70+0.24
−0.72
M NSA 1.27+0.19−0.17 0.53 ± 0.45 - 0.45/4 1.08+0.08
−0.40
N NSA 1.20+0.22−0.19 0.61 ± 0.57 - 1.38/5 1.09+0.03
−0.50
Oc NSA+PL 0.98+0.17−0.15 1.48 ± 1.27 1.3 1.34/11 4.55+1.16
−1.49 (1.91+2.62−0.17)
Q NSA 1.30+0.26−0.21 0.51 ± 0.46 - 0.78/5 1.10+0.03
−0.43
R NSA 1.54+0.19−0.17 0.60 ± 0.45 - 1.60/7 3.19+0.13
0.92
T NSA 0.80+0.19−0.15 0 − 2.4 - 1.52/2 0.67+0.03
−0.32
U NSA 1.82+0.27−0.24 0.28 ± 0.22 - 0.49/6 1.40+0.07
−0.60
W NSA+PL 0.94+0.34−0.25 0 − 2.1 1.15 ± 0.34 1.17/14 11.32+2.45
−2.35 (9.21+2.11−1.99)
Y NSA 1.35+0.20−0.17 0.47 ± 0.40 - 0.98/4 1.10+0.07
0.33
aPL is a power-law and NSA is a single temperature NS hydrogen atmosphere model. For 47 Tuc J and O, the PL indexhas been fixed at the nominal value obtained for the BB+PL fit as the fit parameters cannot be reliably constrained for theNSA+PL with the PL index as a free parameter.bReff calculated assuming a distance of 4.5 kpc.cSpectrum may be contaminated by background/neighboring source(s).
component fit represent averages, weighted based on therelative temperatures and areas of the two emitting re-gions.
For the fainter MSPs, such as 47 Tuc C, M, N, Q,
and T, a pure power-law model, with a fairly steep spec-trum (Γ & 2.5), also yields an acceptable fit. However,we believe that this likely stems from the fact that atwo-temperature spectrum appears power-law-like in the

6 Bogdanov et al.
Fig. 3.— Representative X-ray spectra and best fit single-temperature thermal models (solid line) for the 47 Tuc MSPs. The lower panelfor each MSP shows the best fit residuals. See the electronic edition of The Astrophysical Journal for the spectra of all 47 Tuc MSPs.
energy range of interest (see e.g. Fig. 2 in Zavlin et al.2002). We also note that a broken power-law model, witha break at Eb ≈ 1.0 keV, is also a good description of theobserved emission from the 47 Tuc MSPs. In principle,such a spectrum could arise due to a deficit of radiatinghigh-energy particles in the pulsar magnetosphere. Abreak in the spectrum is observed in young normal pul-sars though at much higher energies (a few GeV, see e.g.,Thompson 1996). However, evidence against a purelynon-thermal model comes from optical observations ofPSR J0030+0451, an MSP with a qualitatively similarspectrum to those of the 47 Tuc pulsars, which show thatsuch a model grossly overestimates (by a factor of ∼500)the optical flux upper limits when extrapolated to lowerenergies (Koptsevich et al. 2003).
For the most luminous MSPs in the sample, namely47 Tuc J, O, and W, a composite NSA+PL or BB+PLmodel yields an acceptable fit, with the PL componentcontributing ∼70%, ∼50%, and ∼75% of the total flux,respectively. The spectral fits, shown in Figure 4, werefound to be acceptable for photon indices Γ ∼ 1.0 − 1.4.We note that although an F-test does not indicate that acomposite spectrum is statistically prefered over a purePL (but with a steeper photon index of Γ ∼ 1.5−2.0), thefainter thermal component is very likely genuine, giventhat the inferred values for Teff and Reff are very similarto those of the other 47 Tuc MSPs. The non-thermal X-rays from MSP W, and probably MSP J and O as well,most likely originate in an intrabinary shock (see §4) al-though for J and O at least a portion of this emission
may originate in the pulsar magnetosphere. For 47 TucO, which is near the crowded center of the globular clus-ter, the PL component may also be due to a backgroundX-ray source. The spectra of all other 47 Tuc MSPs may,in fact, contain a faint magnetospheric emission compo-nent, which is undetectable in our observations due tothe limited number of counts.
It is important to note that, in order to model the NSAand BB spectra of MSPs properly, one needs to take intoaccount the rotation of the NS, which induces a modula-tion in the projected area of the polar cap(s) at the spinperiod and, in the case of a NSA, in the observed spec-trum as well due to the energy dependence of the limbdarkening effects of a NS atmosphere (see e.g. Romani1987; Zavlin et al. 1996; Lloyd 2003). Therefore, thederived temperatures and radii represent time-averagedvalues integrated over the rotation period of the pulsar.As a consequence, the spectral fits may underestimatethe true flux by up to a factor of ∼2, even if we considerthe effects of gravitational redshift and bending of lightnear the NS surface (see e.g. Misner, Thorne, & Wheeler1970; Pechenick, Ftaclas, & Cohen 1983; Beloborodov2002). Unfortunately, in order to account for these ef-fects, one requires prior knowledge of the relative orien-tation of the pulsar spin and magnetic axes and the lineof sight, which is unavailable.
4. VARIABILITY ANALYSIS
Although the limited time resolution of the ACIS-Sobservations (3.2 seconds) precludes a timing analysis at

X-rays from Millisecond Pulsars in 47 Tuc 7
Fig. 4.— The X-ray spectra of 47 Tuc J, O, and W, whichexhibit non-thermal emission. The solid line shows the best-fitmodel consisting of a power-law (dashed line) and a thermal (dot-dashed line) component. The lower panel for each MSP shows thebest fit residuals.
the millisecond level, these observations in conjunctionwith the 2000 ACIS-I observations, permit us to investi-gate the temporal behavior of the MSP emission over alarge range of timescales from hours to years.
As expected, for the bulk of the sample we find nostatistically significant X-ray variability. For MSP O,however, there seems to be a gradual decrease in thephoton count rate, by a factor of ∼2 in total, especiallyat medium energies (0.6–1.5 keV), from the second to thefourth ACIS-S observation. There is no known physicalmechanism which could account for such a substantialvariation of the flux on timescales of days from an oldMSP such as 47 Tuc O. On the other hand, such behavioris typical of cataclysmic variables and chromosphericallyactive binaries with LX ∼ 1030−31 ergs s−1. Thus, we
conclude that this variation is most likely due to blend-ing of MSP O with such an X-ray source. This seemslikely as O is at the heart of the cluster (see Fig. 1),where the number density of X-ray sources is large. TheMSP R is found to be marginally variable between obser-vations, while MSP U exhibits possible variability withinthe third observation (Heinke et al. 2005). In both cases,the apparent variability is likely spurious considering theprobability of spurious detection and the number (19) oftrials.
For the 12 binary MSPs, we can also examine whetherthere exist any variations in the X-ray flux as a func-tion of orbital position. In this sense, 47 Tuc J, O,R, and W are of particular interest as they are in verycompact binaries with periods of 2.9, 3.3, 1.6, and 3.2hours, respectively. The former three MSPs are boundto very low mass degenerate companions (mc ∼ 0.03M⊙) and are eclipsed regularly at radio wavelengthsfor 10-25% of their orbits (Camilo et al. 2000; Freire2005). MSP W, on the other hand, has a significantlymore massive (mc & 0.13 M⊙) main-sequence secondary(Edmonds et al. 2002) and undergoes eclipses for about35–40% of the entire orbit (Freire 2005). For this analy-sis, the observations for the binary MSPs were first foldedat the binary period using the latest values for the or-bital periods Pb and the epochs of ascending node T0
(Freire et al. 2003, Freire et al. unpublished data). Thenet counts were then grouped in phase bins sized so as toallow detection of any large-amplitude variations in theX-ray photon count rate at the eclipse phases. For thesame purpose, we also performed Kolmogorov-Smirnovand Cramer-von Mises tests on the folded but unbinneddata, using an integer number of binary orbits.
For 47 Tuc J, O, and R we find no detectable variationin the X-ray count rate at any orbital phase and are onlyable to set very crude upper limits on the amplitude ofvariation of .60-80%. In contrast, 47 Tuc W exhibitsdramatic variations in the X-ray flux (significant at the99.9% level) as a function of orbital phase. This behaviorcan be naturally explained by the existence of a swept-back shocked stream of gas formed by interaction of thepulsar wind with matter from the irradiated companionissuing through the inner Lagrange point. The proper-ties of this intriguing system and its possible connectionto low mass X-ray binaries are described in depth byBogdanov, Grindlay, & van den Berg (2005).
5. X-RAY LUMINOSITY VERSUS PULSAR PARAMETERS
5.1. X-ray versus Spindown Luminosity
Rotation-powered pulsars, including MSPs, appear toexhibit a linear relation between their X-ray luminosityLX and rotational spindown luminosity E = 4π2IPi/P 3,where I is the NS moment of inertia typically assumedto be 1045 g cm2, with LX ∼ 10−3E (Becker & Trumper1997; Possenti et al. 2002). However, Grindlay et al.
(2002) have shown that the dependence of LX on Efor the 47 Tuc MSPs may be significantly flatter, withLX ∝ E0.5.
Using the present data, we can re-examine the LX − Erelation for the 47 Tuc MSPs. However, the measuredvalues of P and, hence, E for these MSPs are signifi-cantly affected by acceleration in the gravitational po-tential of the globular cluster. In order to obtain the
8 Bogdanov et al.
TABLE 4Derived E and LX for the 47 Tuc MSPs.
Ea LXb
MSP (×1034 ergs s−1) (×1030 ergs s−1)
C 0.05+0.12−0.05 2.6+2.9
−2.4
D 0.67+0.27−0.21 4.8+2.4
−2.7
E 3.12+0.79−0.79 8.9+9.8
−7.3
Fc 4.09+3.16−3.16 5.5+6.8
−4.2
G(+I) <1.72 9.3+9.3−7.3
Hd - 4.8+5.4−4.0
I <7.14 -J 3.22+1.61
−1.61 5.6+4.6−5.0
L 1.04+1.77−1.04 13.8+12.1
−9.8
M - 3.8+5.2−3.3
N 1.87+1.49−1.06 3.9+5.5
−3.4
O 3.12+0.85−1.13 9.3+8.1
−7.6
Q 1.82+0.12−0.12 3.9+5.5
−3.4
R 2.84+3.10−2.28 11.0+12.1
−8.6
Sc 2.27+0.49−2.27 8.9+9.9
−6.5
T 1.09+0.41−0.69 2.9+3.1
−2.7
U 3.98+0.21−0.21 5.1+7.8
−4.4
Wd - 5.9+3.3−5.9
Y 4.82+6.12−4.49 3.9+5.5
−3.4
aValues for E derived assuming a King model for 47 Tucusing the following parameters: distance D=4.5 kpc, centralvelocity dispersion vz(0) = 11.6 km s−1, core radius rc =23.1′′, and best fit constant gas density ne = 0.1 cm−3.bValues calculated using LX = 4πR
2σSBT
4, with R and T
taken from Table 2, and corrected for gravitational redshiftassuming 1 + zg = 1.31. For MSP G, LX is for G and Icombined.cLX apportioned based on procedure described in §2.dNo reliable measurements of P .
intrinsic period derivative Pi, we first determined thethree-dimensional position of each MSP relative to thecluster center by considering the projected radius andassuming that the observed differences in dispersion mea-sure within the MSP sample are solely due to a spreadin distance along the line of sight for an assumed uni-form intra-cluster plasma (Freire et al. 2001b). The clus-ter acceleration term for each MSP was then computedassuming a King model for the cluster using a centralvelocity dispersion of vz(0) = 11.6 km s−1, core radiusrc = 23.1′′, and distance D = 4.5 kpc (Meylan & Mayor1986; Freire et al. 2001b). Subtracting the acceleration
term from the observed P yields the intrinsic spindownrate Pi, which was then used to compute E. The result-ing values and their uncertainties are listed in Table 4.In this calculation we have not included MSP H, whichexhibits anomalous variations in P , and MSP W, whichcurrently has no measured P .
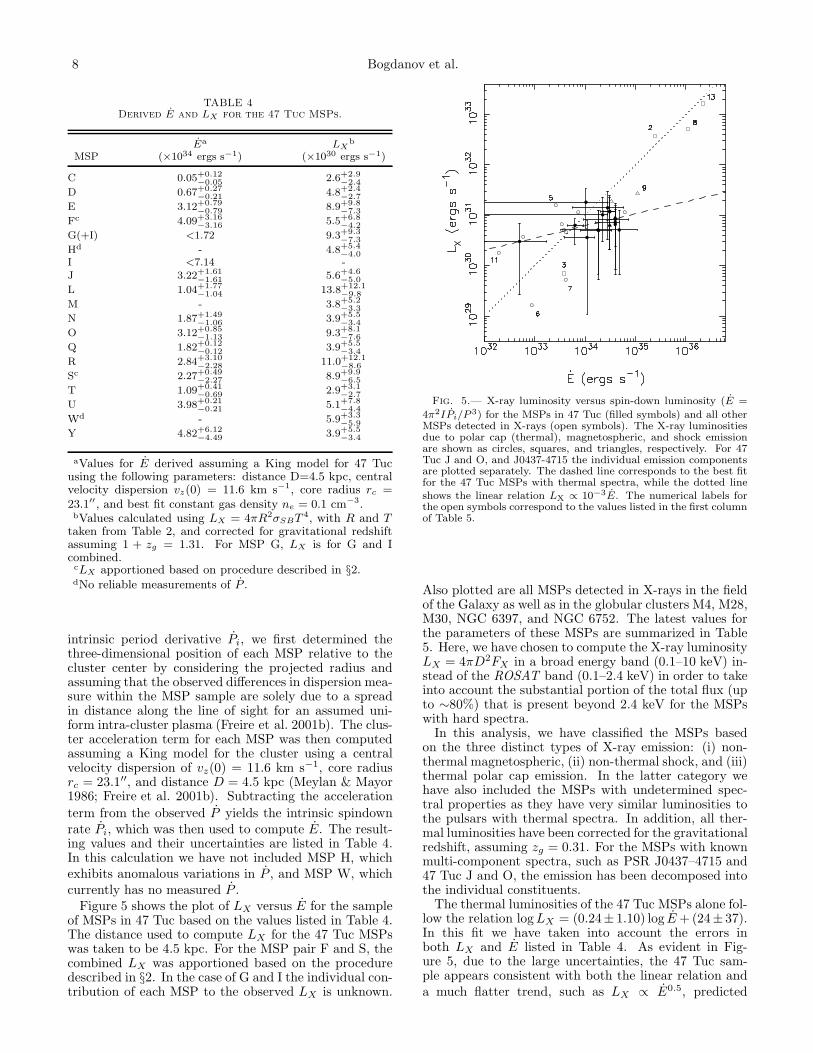
Figure 5 shows the plot of LX versus E for the sampleof MSPs in 47 Tuc based on the values listed in Table 4.The distance used to compute LX for the 47 Tuc MSPswas taken to be 4.5 kpc. For the MSP pair F and S, thecombined LX was apportioned based on the proceduredescribed in §2. In the case of G and I the individual con-tribution of each MSP to the observed LX is unknown.
Fig. 5.— X-ray luminosity versus spin-down luminosity (E =
4π2IPi/P 3) for the MSPs in 47 Tuc (filled symbols) and all otherMSPs detected in X-rays (open symbols). The X-ray luminositiesdue to polar cap (thermal), magnetospheric, and shock emissionare shown as circles, squares, and triangles, respectively. For 47Tuc J and O, and J0437-4715 the individual emission componentsare plotted separately. The dashed line corresponds to the best fitfor the 47 Tuc MSPs with thermal spectra, while the dotted lineshows the linear relation LX ∝ 10−3E. The numerical labels forthe open symbols correspond to the values listed in the first columnof Table 5.
Also plotted are all MSPs detected in X-rays in the fieldof the Galaxy as well as in the globular clusters M4, M28,M30, NGC 6397, and NGC 6752. The latest values forthe parameters of these MSPs are summarized in Table5. Here, we have chosen to compute the X-ray luminosityLX = 4πD2FX in a broad energy band (0.1–10 keV) in-stead of the ROSAT band (0.1–2.4 keV) in order to takeinto account the substantial portion of the total flux (upto ∼80%) that is present beyond 2.4 keV for the MSPswith hard spectra.
In this analysis, we have classified the MSPs basedon the three distinct types of X-ray emission: (i) non-thermal magnetospheric, (ii) non-thermal shock, and (iii)thermal polar cap emission. In the latter category wehave also included the MSPs with undetermined spec-tral properties as they have very similar luminosities tothe pulsars with thermal spectra. In addition, all ther-mal luminosities have been corrected for the gravitationalredshift, assuming zg = 0.31. For the MSPs with knownmulti-component spectra, such as PSR J0437–4715 and47 Tuc J and O, the emission has been decomposed intothe individual constituents.
The thermal luminosities of the 47 Tuc MSPs alone fol-low the relation log LX = (0.24± 1.10) log E + (24± 37).In this fit we have taken into account the errors inboth LX and E listed in Table 4. As evident in Fig-ure 5, due to the large uncertainties, the 47 Tuc sam-ple appears consistent with both the linear relation anda much flatter trend, such as LX ∝ E0.5, predicted
X-rays from Millisecond Pulsars in 47 Tuc 9
by the Harding & Muslimov (2002) polar cap heatingmodel. It is interesting to note that both field and clus-ter MSPs with thermal spectra occupy the same regionof the LX − E diagram. This suggests that in terms ofX-ray properties the two populations are indistinguish-able.
Curiously, despite the fundamentally different emissionmechanisms, all MSPs appear to follow the linear rela-tion LX ∝ 10−3E, and have an efficiency of convert-ing E to LX covering a surprisingly narrow range, withLX/E ∼ 10−4 − 10−3. This is not expected given thatin systems such as 47 Tuc J, O, and W, B1957+20, andJ1740–5340, whose emission most likely originates in anintrabinary shock, LX is determined, in part, by param-eters unrelated to the physics of the pulsar, such as thebinary separation, the properties of the companion star,and the volume of the shocked region. The small rangein LX/E may stem from the fact that in all cases thehigh-energy emission is, ultimately, driven by the sameunderlying particle acceleration and pair production pro-cesses occurring in the pulsar magnetosphere. However,the fact that MSPs with E . 1035 ergs s−1 appear to
have thermal spectra, whereas those with E ∼ 1036 ergss−1 show strong non-thermal emission, suggests a pro-found difference in the conditions in the pulsar magne-tosphere (see §6.3).
5.2. X-ray Luminosity versus Magnetic Field Strength
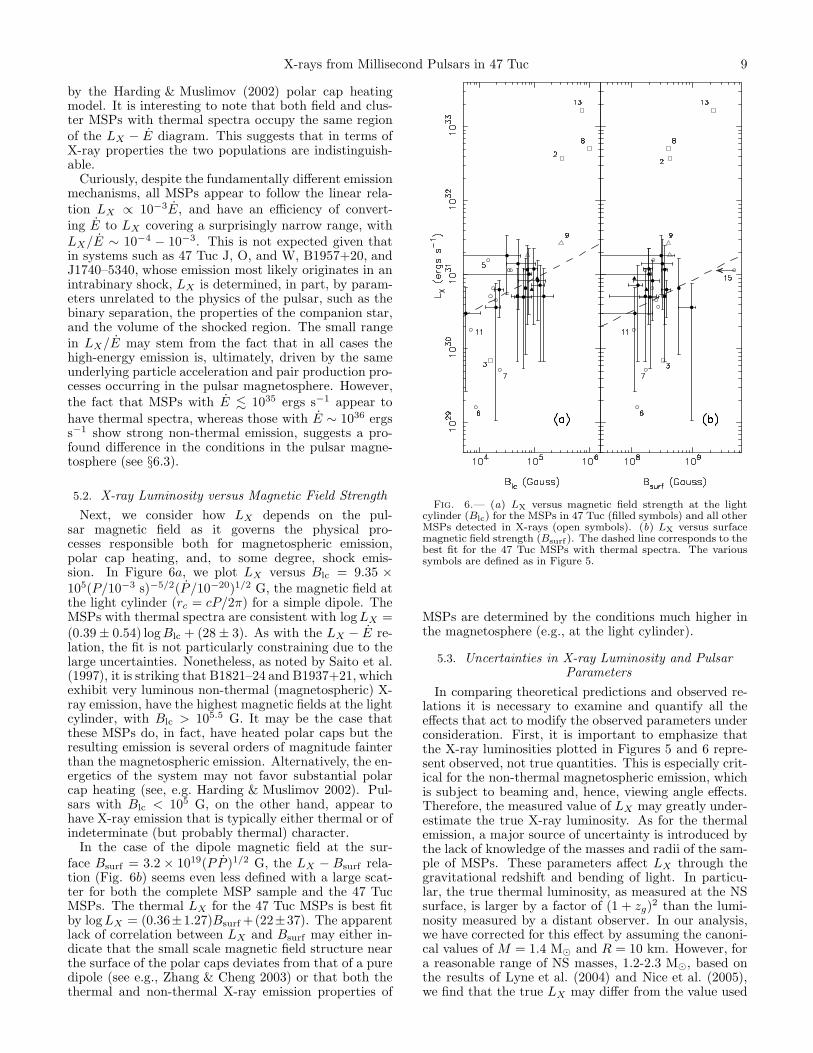
Next, we consider how LX depends on the pul-sar magnetic field as it governs the physical pro-cesses responsible both for magnetospheric emission,polar cap heating, and, to some degree, shock emis-sion. In Figure 6a, we plot LX versus Blc = 9.35 ×10⁵(P/10−3 s)−5/2(P /10−20)1/2 G, the magnetic field atthe light cylinder (rc = cP/2π) for a simple dipole. TheMSPs with thermal spectra are consistent with log LX =(0.39 ± 0.54) logBlc + (28 ± 3). As with the LX − E re-lation, the fit is not particularly constraining due to thelarge uncertainties. Nonetheless, as noted by Saito et al.(1997), it is striking that B1821–24 and B1937+21, whichexhibit very luminous non-thermal (magnetospheric) X-ray emission, have the highest magnetic fields at the lightcylinder, with Blc > 105.5 G. It may be the case thatthese MSPs do, in fact, have heated polar caps but theresulting emission is several orders of magnitude fainterthan the magnetospheric emission. Alternatively, the en-ergetics of the system may not favor substantial polarcap heating (see, e.g. Harding & Muslimov 2002). Pul-sars with Blc < 105 G, on the other hand, appear tohave X-ray emission that is typically either thermal or ofindeterminate (but probably thermal) character.
In the case of the dipole magnetic field at the sur-face Bsurf = 3.2 × 10¹⁹(PP )1/2 G, the LX − Bsurf rela-tion (Fig. 6b) seems even less defined with a large scat-ter for both the complete MSP sample and the 47 TucMSPs. The thermal LX for the 47 Tuc MSPs is best fitby log LX = (0.36±1.27)Bsurf +(22±37). The apparentlack of correlation between LX and Bsurf may either in-dicate that the small scale magnetic field structure nearthe surface of the polar caps deviates from that of a puredipole (see e.g., Zhang & Cheng 2003) or that both thethermal and non-thermal X-ray emission properties of
Fig. 6.— (a) LX versus magnetic field strength at the lightcylinder (Blc) for the MSPs in 47 Tuc (filled symbols) and all otherMSPs detected in X-rays (open symbols). (b) LX versus surfacemagnetic field strength (Bsurf ). The dashed line corresponds to thebest fit for the 47 Tuc MSPs with thermal spectra. The varioussymbols are defined as in Figure 5.
MSPs are determined by the conditions much higher inthe magnetosphere (e.g., at the light cylinder).
5.3. Uncertainties in X-ray Luminosity and PulsarParameters
In comparing theoretical predictions and observed re-lations it is necessary to examine and quantify all theeffects that act to modify the observed parameters underconsideration. First, it is important to emphasize thatthe X-ray luminosities plotted in Figures 5 and 6 repre-sent observed, not true quantities. This is especially crit-ical for the non-thermal magnetospheric emission, whichis subject to beaming and, hence, viewing angle effects.Therefore, the measured value of LX may greatly under-estimate the true X-ray luminosity. As for the thermalemission, a major source of uncertainty is introduced bythe lack of knowledge of the masses and radii of the sam-ple of MSPs. These parameters affect LX through thegravitational redshift and bending of light. In particu-lar, the true thermal luminosity, as measured at the NSsurface, is larger by a factor of (1 + zg)
2 than the lumi-nosity measured by a distant observer. In our analysis,we have corrected for this effect by assuming the canoni-cal values of M = 1.4 M⊙ and R = 10 km. However, fora reasonable range of NS masses, 1.2-2.3 M⊙, based onthe results of Lyne et al. (2004) and Nice et al. (2005),we find that the true LX may differ from the value used

10 Bogdanov et al.
TABLE 5Parameters for MSPs detected in X-rays outside of 47 Tuc.
P Pi D FX (0.1-10 keV)b
MSPa (ms) (10−20) (kpc) (10−13 ergs cm−2 s−1) References
1 J0030+0451 4.86 <1.0c 0.3 3.6 1, 22 J0218+4232 2.32 7.78 2.7 4.2 3, 43 J0437–4715 5.76 1.86 0.139d 12.9 (3.0) 5, 64 J0751+1807 3.48 0.73 1.1 0.47 7, 85 J1012+5307 5.26 0.97 >0.77d 1.3 9, 86 J1024–0719 5.16 <0.30c <0.20d 0.2 10, 11, 127 J1744–1134 4.07 0.71 0.357d 0.2 10, 13, 128 B1937+21 1.56 10.6 3.6 3.3 11, 149 B1957+20 1.61 1.15 2.5 0.9 11, 1510 J2124–3358 4.93 1.30 0.25 3.6 10, 11, 1211 B1620–26 (M4) 11.07 ∼0.67c 1.73d 0.03 16, 17, 1812 J1740–5340 (NGC 6397) 3.60 3.90 2.55d 0.24 19, 20, 2113 B1821–24 (M28) 3.05 162 5.5d 4.6 22, 2314 J1911–6000C (NGC 6752) 5.28 0.22 4.1d 0.01 2415 J2140–2310A (M30) 11.02 <209c 9.0d .0.007 25, 26
References. — (1) Lommen et al. 2000; (2) Becker & Achenbach 2002; (3) Navarro et al. 1995; (4) Webb, Olive, & Barret2004; (5) van Straten et al. 2002; (6) Zavlin et al. 2002; (7) Lundgren, Zepka, & Cordes 1995; (8) Webb et al. 2004; (9) Langeet al. 2001; (10) Toscano et al. 1998; (11) Toscano et al. 1999a; (12) Becker & Trumper 1999; (13) Toscano et al. 1999b; (14)Cusumano et al. 2003; (15) Stappers et al. 2003; (16) Lyne et al. 1988; (17) Richer et al. 1997; (18) Bassa et al. 2004; (19)D’Amico et al. 2001; (20) Bassa & Stappers 2004; (21) Grindlay et al. 2002; (22) Cognard & Backer 2004; (23) Becker et al.2003; (24) D’Amico et al. 2002; (25) Carreta et al. 2000; (26) Ransom et al. 2004.aFor the globular cluster MSPs the host cluster is given in parentheses.bTotal flux. For J0437-4715 the value in parentheses gives the non-thermal flux.cPoorly determined acceleration corrections.dAccurate distances/limits. Other estimates are obtained primarily from dispersion measure together with the Cordes & Lazio
(2002) electron density model and are rather uncertain (up to a factor of ∼2).
here by up to a factor of ∼1.8. In addition, for NS radiiin the range 9−16 km, the derived LX may deviate fromthe true value by .20%.
The parameters E, Bsurf , and Blc also depend onthe MSP mass and radius, as E ∝ MR2 and B ∝√
MR2/R3. For the same range of NS masses (1.2 − 2.3M⊙), the assumption of 1.4 M⊙ may result in a deviation
of up to ∼60% for E and ∼25% for Bsurf and Blc, fromthe true values. This implies that a spread in masseswithin the sample of MSPs would tend to increase thescatter about the derived relations in both coordinates(e.g. LX and E) and perhaps result in a skewed trend.Conversely, for a sample of MSPs that have very similarmasses but are systematically more or less massive thanthe canonical 1.4 M⊙, the result will be an offset in thederived intercept, with little effect on the slope of the log-log relation under consideration (e.g. log LX−log E). As
for RNS, for the range 9 − 16 km we find that E, Bsurf ,and Blc may differ by up to a factor of ∼2.6. The effectof the NS radius on the scatter in the trends discussedabove is uncertain due to lack of knowledge of the trueNS equation of state (EOS). For instance, in certain theo-retical models of the NS EOS a small change in MNS doesnot result in an appreciable change in RNS, while for oth-ers the opposite is the case (see e.g., Lattimer & Prakash2001, for details).
For the 47 Tuc MSP, the parameters derived from P aresubject to an additional uncertainty arising from lack ofknowledge of the magnitude of acceleration of the MSPsby the gravitational potential of the globular cluster. It
is important to note that the model-dependent values de-rived for Pi are sensitive to the assumptions made regard-ing the gravitational potential and gas density profile ofthe cluster. For simplicity, in this paper we have derivedPi for each MSP assuming a simple constant gas densityprofile. However, it is likely that in reality the gas dis-tribution of 47 Tuc is more complex. For instance, thenearly identical dispersion measures of the MSPs near thecluster center, namely 47 Tuc F, L, O, and S (Freire et al.2003), may be interpreted as being due to the presenceof a cavity in the plasma around the cluster core carvedout by the winds of these pulsars. Hence, obtaining ac-curate values of Pi may require implementation of moreelaborate models of the gas distribution, which will beexplored in detail elsewhere.
Another potential source of systematic uncertainty isthe presence of an observational selection effect. It isprobable that so far pulsar observations have sampledonly the most luminous and nearby MSPs. The existenceof X-ray faint MSPs, both in globular clusters and thefield of the Galaxy, would mean that the observed narrowrange of LX for the MSPs with thermal spectra is simplyan artifact of the limited sample of very low luminosityMSPs.
Given the large uncertainties discussed above, any con-clusions drawn for the apparent relations between LX
and quantities derived from the pulsar spin parametersshould be taken with much caution, as it is not possible,at present, to properly account for all effects that act tomodify the observed trends.

X-rays from Millisecond Pulsars in 47 Tuc 11
6. DISCUSSION
6.1. X-ray Properties of MSPs
The spectral fits described in §3 show that the ma-jority of 47 Tuc MSPs exhibit emission consistent with athermal model, with no indication of any magnetosphericemission. It is probable that the MSPs with seeminglypurely thermal emission do, in fact, have a fainter magne-tospheric X-ray component (<1030 ergs s−1). However, itremains unclear what determines the relative strengthsof these two X-ray production mechanisms. Althoughviewing angle dependences and beaming of the magneto-spheric radiation can explain why thermal emission dom-inates in many MSPs, it is more likely that the relativestrength of the two components is determined by thepoorly understood details of the magnetospheric emis-sion and polar cap heating mechanisms.
Grindlay et al. (2002) and Cheng & Taam (2003) haveraised the possibility that the very narrow range of ther-mal luminosities and small emission areas imply the ex-istence of a strong multipole magnetic field near the sur-face. However, the small range in LX is consistent witha simple dipole field if one considers general relativis-tic effects near the surface. In particular, gravitationalbending of light causes &75% of the NS surface to bevisible at any given time (see e.g. Pechenick et al. 1983;Pavlov & Zavlin 1997; Beloborodov 2002). As a conse-quence, the degree of modulation in the flux which arisesdue to rotation of the NS is greatly reduced. This, inturn, diminishes the scatter in LX for the sample ofMSPs that would otherwise result from different orienta-tions of the magnetic and spin axes relative to the line ofsight. Thus, although entirely plausible, the existence ofa multipole magnetic field need not be invoked to accountfor the small range in LX .
We note that the inferred radii of the thermally emit-ting areas obtained in §3 are indeed somewhat smallerthan the expected size of a magnetic polar cap for asimple dipole field, Rpc = (2πRNS/cP )1/2RNS (e.g.,Rpc = 2.6 km for a 3 ms pulsar). This likely arisesdue to the fact that we have fitted most MSP spectrawith a single temperature model, where in reality a two-temperature model is more appropriate, as suggested bythe results of §3. In adittion, due to variation of theprojected area of the polar caps, induced by the rotationof the star, fits to the time-integrated spectrum result inan underestimate of the effective emission area. However,even with a two temperature spectrum and a correctionfactor for the effective area, in the case of a BB model thetotal emitting region is still substantially smaller thanthe expected polar cap area. If the NS surface does, infact, radiate like a blackbody, this discrepancy may beindicative of either non-uniform polar cap heating or de-viations from a pure dipole field. For instance, the polarcap model of Harding & Muslimov predicts that the heat-ing rate by positrons should be highest near the rim ofthe polar cap (cf. Fig. 7 of Harding & Muslimov 2002),resulting in an annulus-shaped emitting region with anarea significantly smaller than that of the entire polarcap. Chen, Ruderman, & Zhu (1998) have argued that asmall emission area can arise if the MSP is an aligned ro-tator, resulting in a so-called “squeezed” polar cap. Theouter gap model of Zhang & Cheng (2003) also predictsthat the heated area should be significantly smaller than
the whole polar cap due to the presence of a small scalemultipole field near the surface. Finally, this result mayimply that a blackbody is simply not a valid approxima-tion of the NS surface. The discrepancy may, thus, be aconsequence of the fact that simplified blackbody modelsresult in higher derived temperatures and smaller emis-sion areas due to the fact that the X-ray spectra of light-element atmospheres are harder than blackbody spectra(Zavlin et al. 1996).
The results of this study as well as recent Chan-dra and XMM-Newton observations of nearby fieldMSPs (Zavlin et al. 2002; Becker & Aschenbach 2002;Webb et al. 2004a,b) have revealed that there are noclear systematic differences between the X-ray proper-ties of globular cluster and field MSPs, which could arise,for instance, due to different evolutionary paths. For ex-ample, the nearby field MSPs such as J0437–4715 andJ0030+0451, are quite similar to the bulk of 47 TucMSPs in terms of X-ray luminosity and spectral proper-ties. Also, B1821–24 in the globular cluster M28, is akinto B1937+21, characterized by large X-ray and spindownluminosities (LX > 1033 ergs s−1, E > 1036 ergs s−1),hard non-thermal spectra, and very narrow radio and X-ray pulse profiles (Becker & Trumper 1999). These sim-ilarities imply that if, in fact, multiple binary exchangesand accretion episodes occur for globular cluster MSPs,they may not significantly alter the elementary emissionproperties of the pulsar.
6.2. The Eclipsing Binary MSPs
Bogdanov et al. (2005) have shown that the binaryMSP 47 Tuc W exhibits large-amplitude X-ray vari-ability at the binary period. This modulation can beinterpreted as being due to geometric occultations ofan X-ray emitting intrabinary shock by the ∼0.15 M⊙
main-sequence companion. On the other hand, in thethree other systems in which radio eclipses are observed,namely 47 Tuc J, O, and R, we detect no such variabil-ity. The persistence of X-ray emission during the ra-dio eclipses confirms that at radio frequencies J, O, andR are not eclipsed by their respective binary compan-ions but rather by a tenuous ionized envelope formeddue to mass loss by the companion driven by the pulsarwind, as in the case of PSRs B1957+20 and J2051–0827(Arzoumanian, Fruchter, & Taylor 1994; Stappers et al.1996).
The unique X-ray behavior of 47 Tuc W is most cer-tainly the result of the presence of a main-sequence sec-ondary star instead of the typical very-low mass (∼0.03M⊙) degenerate companion found in “black widow”-likesystems such as J, O, and R. While the latter three sys-tems are expected end products of low-mass X-ray binaryevolution, 47 Tuc W is likely the result of an exchangeencounter in which the original very low-mass companionwas ejected from the binary (Freire 2005, and referencestherein). However, even if the current companion of MSPW is Roche-lobe filling, the existence of an intrabinaryshock implies that another accretion phase cannot com-mence as the energetic pulsar wind is constraining theoutflow of mass from the companion (see Bogdanov et al.2005, for details).
6.3. X-ray versus Radio MSP Properties

12 Bogdanov et al.
In §5 we have found that the log LX−log E relation forthe thermally emitting MSPs has a slope of β ∼ 0.2±1.1.Although such a trend is consistent with the predictionof the polar cap heating model of Harding & Muslimov(2002), LX ∝ E0.5, we cannot exclude the possibility
that the 47 Tuc MSPs follow the linear LX − E relation.Despite the large uncertainties, for the present sample
of MSPs detected in X-rays we still observe a generaltrend of decrease of LX as a function of spin down lu-minosity and magnetic field strength. If these parame-ters are, in turn, determined by the age of the MSP, it istempting to speculate that Figures 5 and 6 represent evo-lutionary diagrams. Here we consider a possible evolu-tionary path of a MSP described within the framework ofthe Harding & Muslimov (2002) electron-positron (e±)pair production model. For relatively young and ener-getic MSPs, such as PSR B1821–24 (τ ∼ 3× 10⁷ yr), e±
pairs are produced via curvature radiation (CR). Thesepairs, in turn, produce the observable X-ray/γ-ray andradio non-thermal magnetospheric emission. Althoughsome polar cap heating by a backflow of energetic par-ticles may occur in these objects, the non-thermal com-ponent (∼1033 ergs s−1) is several orders of magnitudebrighter, making it difficult to observe any emission fromthe polar caps. As the MSP ages, it undergoes rota-tional spindown and perhaps magnetic field decay, whichresult in a decline in the CR pair production rate. Ata certain stage, the magnetic field becomes too low topermit CR pair production so inverse Compton scatter-ing (ICS) of soft X-rays by accelerated electrons becomesan important channel for e± pair production. ICS pairproduction results in substantial polar cap heating by abackflow of positrons from the magnetosphere. Since thepolar cap heating rate has a weaker dependence on thespindown luminosity (Lh ∝ E1/2) than magnetospheric
emission (Lm ∝ E), the thermal emission will eventuallybecome dominant over the magnetospheric emission, asis observed in the majority of 47 Tuc MSPs and manyfield MSPs. At much later times, the MSP is expectedto cross the ICS pair production death line (see Fig. 1in Harding, Muslimov, & Zhang 2002) and will no longerbe observable as a pulsar, both in the radio and X-ray.In the end, as the polar caps cool, the MSP will fadeaway from view at X-ray energies as well.
7. CONCLUSION
We have presented a spectral analysis of the X-rayemission for the complete sample of known MSPs in 47Tuc. The X-ray spectra of the majority of MSPs are welldescribed by a thermal model, a BB or a NS hydrogenatmosphere, with Teff ∼ (1−3)×106 K, Reff ∼ 0.1−3 km,and LX ∼ 1030−31 ergs s−1 (0.3–8 keV). The small ob-served scatter in the thermal LX is consistent with a sim-ple dipole magnetic field configuration. A two temper-ature thermal model, reminiscent of that observed from
some nearby field MSPs, is also consistent with the emis-sion from the bulk of 47 Tuc MSPs and, in some cases,results in an improved fit. Such a spectrum could arisedue to non-uniform polar cap heating or lateral diffusionof heat accross the NS surface away from the regions di-rectly heated by particles from the magnetosphere. TheMSPs J, O, and W show a prominent non-thermal com-ponent in their spectra. At least part of the non-thermalX-rays are very likely due to interaction of the relativis-tic particle wind of the pulsar with matter from the com-panion. All other 47 Tuc MSPs exhibit no evidence of asignificant non-thermal X-ray component.
Our re-examination of the LX−E relation has revealedthat regardless of the emission mechanism responsiblefor production of the observed X-rays, the conversionefficiency of E to LX appears to be, in all cases, ∼10−4−10−3.
All of the 47 Tuc MSPs, with the exception of 47 TucW, display no large amplitude variability in their X-rayemission on timescales of days, weeks, and years. TheMSP W exhibits dramatic variations at the binary pe-riod, which can be attributed to the presence of an intra-binary shock that is eclipsed by the secondary star. Thelack of long term variations in the flux of most MSPscould potentially serve as a criterion for classification ofunidentified soft X-ray sources (Heinke et al. 2005).
Given that most of the ∼100 MSPs presently knownhave spin parameters similar to those of the 47 TucMSPs, we expect many of them to have predominantlythermal X-ray spectra. Moreover, for these MSPs, gravi-tational bending of light near the NS surface ensures thatat least one of the antipodal heated polar caps is alwaysobservable, while for a wide range of angles between themagnetic and spin axes and the line of sight both polarcaps are visible simultaneously for a large portion of theMSP spin period (see e.g. Nollert et al. 1989). This ef-fect invariably results in a 100% duty cycle, even if themagnetospheric emission beams never sweep across theEarth or if the radio emission is very faint or heavilyabsorbed/scattered. Therefore, many MSPs with heatedpolar caps may, in principle, be detectable at X-ray en-ergies even if they cannot be observed as radio pulsars.
Finally, based on our results, we conclude that in termsof the characteristics of their X-ray emission, there is noclear separation between MSPs in the field of the Galaxyand in globular clusters.
We would like to thank Peter Edmonds for insight-ful discussions, Don Lloyd for use of his NS hydrogenatmosphere model, and the referee Natalie Webb formany helpful comments. This work was supported byNASA Chandra grants GO2-3059A and G02-3059B. Theresearch presented here has made use of the NASA As-trophysics Data System.
REFERENCES
Arzoumanian, Z., Fruchter, A. S., & Taylor, J. H. 1994, ApJ, 426,85
Backer, D. C., Kulkarni, S. R., Heiles, C., Davis, M. M., & Goss,W. M. 1982, Nature, 300, 615
Bailes, M., Johnston, S., Bell, J. F., Lorimer, D. R., Stappers, B.W., Manchester, R. N., Lyne, A. G., Nicastro, L., D’Amico, N.,& Gaensler, B. M. 1997, ApJ, 481, 386
Bassa, C. G., Pooley, D., Homer, L., Verbunt, F., Gaensler, B. M.,Lewin, W. H. G., Anderson, S. F., Margon, B., Kaspi, V. M., &van der Klis, M. 2004, ApJ, 609, 755
Bassa, C. G. & Stappers, B. W. 2004, A&A, 425, 1143Becker, W. & Trumper, J. 1997, A&A, 326, 682Becker, W. & Trumper, J. 1999, ApJ, 341, 803

X-rays from Millisecond Pulsars in 47 Tuc 13
Becker, W. & Aschenbach, B. 2002, Proceedings of the 270. WE-Heraeus Seminar on Neutron Stars, Pulsars, and SupernovaRemnants, Eds. W. Becker, H. Lech, J. Trumper, p. 64
Becker, W., Swartz, D. A., Pavlov, G. G., Elsner, R. F., Grindlay,J. E., Mignani, R., Tennant, A. F., Backer, D., Pulone, L., Testa,V., & Weisskopf, M. C. 2003, ApJ, 594, 798
Beloborodov, A. M. 2002, ApJ, 566, L85Bogdanov, S., Grindlay, J. E., & van den Berg, M. 2005, ApJ, 630,
1029Camilo, F., Lorimer, D. R., Freire, P., Lyne, A. G., & Manchester,
R. N. 2000, ApJ, 535, 975Camilo. F. & Rasio, F. A. 2005, ASP Conf. Ser. Vol. 328: Binary
Radio Pulsars, eds. F. A. Rasio & I. H. Stairs (San Francisco:ASP), p. 147
Cardelli, J. A., Clayton, G. C., & Mathis, J. S. 1989, ApJ, 345, 245Carretta, E., Gratton, R. G., Clementini, G, & Fusi Pecci, F. 2000,
ApJ, 533, 215Chen, K., Ruderman, M., & Zhu, T. 1998, ApJ, 493, 397Cheng, K. S., & Taam, R. E. 2003, ApJ, 598, 1207Cognard, I. & Backer, D. C. 2004, ApJ, 612, L125Cordes, J. M. & Lazio, T. J. W. 2001, astro-ph/0207156Cusumano, G., Hermsen, W., Kramer, M., Kuiper, L., Lohmer,
O., Massaro, E., Mineo, T., Nicastro, L., Stappers, B. W. 2003,A&A, 410, L9
D’Amico, N., Lyne, A. G., Manchester, R. N., Possenti, A., &Camilo, F. 2001, ApJ, 548, L171
D’Amico, N., Possenti, A., Fici, L., Manchester, R. N., Lyne, A.G., Camilo, F., & Sarkissian, J. 2002, ApJ, 570, L89
Edmonds, P. D., Gilliland, R. L., Camilo, F., Heinke, C. O., &Grindlay, J. E. 2002, ApJ, 579, 741
Freire, P. C., Camilo, F., Lorimer, D. R., Lyne, A. G., Manchester,R. N., & D’Amico, N. 2001a, MNRAS, 326, 901
Freire, P. C., Kramer, M., Lyne, A. G., Camilo, F., Manchester, R.N., & D’Amico, N. 2001b, ApJ, 557, L105
Freire, P. C., Camilo, F., Kramer, M., Lorimer, D. R., Lyne, A. G.,Manchester, R. N., & D’ Amico, N. 2003, MNRAS, 340, 1359
Freire, P. C. C. 2005, ASP Conf. Ser. Vol. 328: Binary RadioPulsars, ed. F. A. Rasio & I. H. Stairs (San Francisco: ASP),p. 405
Gratton, R. G., Bragaglia, A., Carretta, E., Clementini, G.,Desidera, S., Grundahl, F., & Lucatello, S. 2003, A&A, 408, 529
Grindlay, J. E., Heinke, C., Edmonds, P. D., & Murray, S. S. 2001,Science, 292, 2290
Grindlay, J. E., Camilo, F., Heinke, C. O., Edmonds, P. D., Cohn,H., & Lugger, P. 2002, ApJ, 581, 470
Harding, A. K. & Muslimov, A. G. 2002, ApJ, 568, 862Harding, A. K., Muslimov, A. G., & Zhang, B. 2002, ApJ, 576, 366Heinke, C. O., Grindlay, J. E., Edmonds, P. D., Cohn, H. N.,
Lugger, P. M., Camilo, F., Bogdanov, S., & Freire, P. C. 2004,ApJ, 625, 796
Koptsevich, A. B., Lundqvist, P., Serafimovich, N. I., Shibanov,Yu. A., & Sollerman, J. 2003, A&A, 400, 265
Lange, C., Camilo, F., Wex, N., Kramer, M., Backer, D. C., Lyne,A. G., & Doroshenko, O. 2001, MNRAS, 326, 274
Lattimer, J. M. & Prakash, M. 2001, ApJ, 550, 426Lloyd, D. A. 2003, astro-ph/0303561Lommen, A. N., Zepka, A., Backer, D. C., McLaughlin, M., Cordes,
J. M., Arzoumanian, Z., & Xilouris, K. 2000, ApJ, 545, 1007Lundgren, S. C., Zepka, A. F., & Cordes, J. M. 1995, ApJ, 453,
L419Lyne, A. G., Biggs, J. D., Brinklow, A., McKenna, J., Ashworth,
M. 1988, Nature, 332, 45
Lyne, A. G., Burgay, M., Kramer, M., Possenti, A., Manchester,R. N., Camilo, F., McLaughlin, M. A., Lorimer, D. R., D’Amico,N., Joshi, B. C., Reynolds, J., Freire, P. C. C., Science, 303, 1153
Manchester, R. N., Lyne, A. G., Johnston, S., D’Amico, N., Lim,J., & Kniffen, D. A. 1990, Nature, 345, 598
Manchester, R. N., Lyne, A. G., Robinson, C., Bailes, M., &D’Amico, N. 1991, Nature, 352, 219
Meylan, G. & Mayor, M. 1986, A&A, 166, 122Misner, C. W, Thorne, K. S., & Wheeler, J. A. 1970, Gravitation
(New York: Freeman)Navarro, J., de Bruyn, G., Frail, D., Kulkarni, S. R., & Lyne, A.
G. 1995, ApJ, 455, L55Nice, D. J., Splaver, E. M., Stairs, I. H., Lohmer, O., Jessner, A.,
Kramer, M., Cordes, J. M., ApJ, 634, 1242Nollert, H. -P., Ruder, H, Herold, H., & Kraus, U. 1989, A&A, 208,
153
Pavlov, G. G, & Zavlin, V. E. 1997, ApJ, 490, L91Pechenick, K. R., Ftaclas, C., & Cohen, J. M. 1983, ApJ, 274, 846Possenti, A., Cerutti, R., Colpi, M., & Mereghetti, S. 2002, A&A,
387, 993Predehl, P. & Schmitt, J. H. M. M. 1995, A&A, 293, 889Ransom, S. M., Stairs, I. H., Backer, D. C., Greenhill, L. J., Hessels,
J. W. T., & Kaspi, V. M. 2004, ApJ, 604, 328Richer, H. B.. Fahlman, G. G.. Ibata, R. A., Pryor, C., Bell, R. A.,
Bolte, M., Bond, H. E., Harris, W. E., Hesser, J. E., Holland,S., Ivanans, N., Mandushev, G., Stetson, P. B., & Wood, M. A.1997, ApJ, 484, 741
Robinson, C., Lyne, A. G., Manchester, R. N., Bailes, M., D’Amico,N., & Johnston, S. 1995, MNRAS, 274, 547
Romani, R. W. 1987, ApJ, 313, 718Saito, Y., Kawai, N., Kamae, T., Shibata, S., Dotani, T., &
Kulkarni, S. R 1007, ApJ, 477, L37Stappers, B. W., Bailes, M., Lyne, A. G., Manchester, R. N.,
D’Amico, N., Tauris, T. M., Lorimer, D. R., Johnston, S., &Sandhu, J. S. 1996, ApJ, 465, L119
Stappers, B. W., Gaensler, B. M., Kaspi, V. M., van der Klis, M.,& Lewin, W. H. G. 2003, Science, 299, 1372
Thompson, D. J. 1996, Pulsars: Problems and Progress, IAUColloquium 160, Eds. S. Johnston, M.A. Walker, M. Bailes, p.307
Toscano, M., Bailes, M., Manchester, R., & Sandhu, J. 1998, ApJ,506, 863
Toscano, M., Sandhu, J. S., Bailes, M., Manchester, R. N., Britton,M. C., Kulkarni, S. R., Anderson, S. B., & Stappers, B. W. 1999a,MNRAS, 307, 925
Toscano, M., Britton, M. C., Manchester, R. N., Bailes, M.,Sandhu, J. S., Kulkarni, S. R., & Anderson, S. B. 1999b, ApJ,523, L171
van Straten, W., Bailes, M., Britton, M., Kulkarni, S. R, Anderson,S. B., Manchester, R. N., & Sarkissian, J. 2001, Nature, 412, 158
Webb, N. A., Olive, J. -F., & Barret, D. 2004, A&A, 417, 181Webb, N. A., Olive, J. -F., Barret, D., Kramer, M., Cognard, I., &
Lohmer, O. 2004, A&A, 419, 269Zavlin, V. E., Pavlov, G. G., & Shibanov, Yu. A., 1996, A&A, 315,
141Zavlin, V. E., Pavlov, G. G., Sanwal, D., Manchester, R. N.,
Trumper, J., Halpern, J. P., & Becker, W. 2002, ApJ, 569, 894Zhang, L. & Cheng, K. S. 2003, A&A, 398, 639