Lipidic phase membrane protein serial femtosecond crystallography
10
Lipidic phase membrane protein serial femtosecond crystallography Linda C Johansson 1 , David Arnlund 1 , Thomas A White 2 , Gergely Katona 1 , Daniel P DePonte 2 , Uwe Weierstall 3 , R Bruce Doak 3 , Robert L Shoeman 4 , Lukas Lomb 4 , Erik Malmerberg 1 , Jan Davidsson 5 , Karol Nass 6 , Mengning Liang 2 , Jakob Andreasson 7 , Andrew Aquila 2,8 , Sasa Bajt 8 , Miriam Barthelmess 8 , Anton Barty 2 , Michael J Bogan 9 , Christoph Bostedt 10 , John D Bozek 10 , Carl Caleman 2 , Ryan Coffee 10 , Nicola Coppola 2,18 , Tomas Ekeberg 7 , Sascha W Epp 11,12 , Benjamin Erk 11,12 , Holger Fleckenstein 2 , Lutz Foucar 4,11 , Heinz Graafsma 8 , Lars Gumprecht 2 , Janos Hajdu 7 , Christina Y Hampton 9 , Robert Hartmann 13 , Andreas Hartmann 13 , Günter Hauser 14,15 , Helmut Hirsemann 8 , Peter Holl 13 , Mark S Hunter 16 , Stephan Kassemeyer 4 , Nils Kimmel 14,15 , Richard A Kirian 3 , Filipe R N C Maia 17 , Stefano Marchesini 17 , Andrew V Martin 2 , Christian Reich 13 , Daniel Rolles 4,11 , Benedikt Rudek 11,12 , Artem Rudenko 11,12 , Ilme Schlichting 4,11 , Joachim Schulz 2 , M Marvin Seibert 7,18 , Raymond G Sierra 9 , Heike Soltau 13 , Dmitri Starodub 9 , Francesco Stellato 2 , Stephan Stern 2 , Lothar Strüder 14,15 , Nicusor Timneanu 7 , Joachim Ullrich 11,12 , Weixiao Y Wahlgren 1 , Xiaoyu Wang 3 , Georg Weidenspointner 14,15 , Cornelia Wunderer 8 , Petra Fromme 16 , Henry N Chapman 2,6 , John C H Spence 3 , and Richard Neutze 1 1 Department of Chemistry and Molecular Biology, University of Gothenburg, Gothenburg, Sweden 2 Center for Free-Electron Laser Science, Deutsches Elektronen-Synchrotron, Hamburg, Germany 3 Department of Physics, Arizona State University, Tempe, Arizona, USA 4 Max-Planck-Institut für Medizinische Forschung, Heidelberg, Germany 5 Department of Photochemistry and Molecular Science, Uppsala University, Uppsala, Sweden 6 Institute for Experimental Physics, University of Hamburg, Hamburg, Germany 7 Laboratory of Molecular Biophysics, Department of Cell and Molecular Biology, Uppsala University, Uppsala, Sweden © 2012 Nature America, Inc. All rights reserved. Correspondence should be addressed to R.N. ([email protected]).. 18 Present addresses: European XFEL GmbH, Hamburg, Germany (N.C.) and Linac Coherent Light Source, SLAC National Accelerator Laboratory, Menlo Park, California, USA (M.M.S.). Accession codes. Protein Data Bank: 4ac5. Note: Supplementary information is available on the Nature Methods website. AUTHOR CONTRIBUTIONS L.C.J., R.N., H.N.C., J.C.H.S. and P.F. conceived the experiment, which was designed with A.B., R.A.K., J.C.H.S., D.P.D., U.W., R.B.D., M.J.B., D.S., I.S., S.M. and J.H. S.W.E., R.H., D.R., A.R., L.F., N.K., P.H., B.R., B.E., A.H., C.R., G.W., L.S., G.H., H.G., J.U., I.S., H.S., M.B., H.H., L.G. and H.G. designed and set up the CAMP instrument and/or developed and operated the pnCCD detectors. C.B. and J.D.B. set up and aligned the beamline; L.C.J. and D.A. grew sponge phase crystals; U.W., R.B.D., J.C.H.S., D.P.D., R.L.S. and L.L. designed and operated the injector; H.N.C., A.B., A.A., J.S., D.P.D., U.W., R.B.D., S.B., M.J.B., L.G., J.H., M.M.S., N.T., J.A., S.S. and J.C.H.S. developed diffraction instrumentation; L.C.J., D.A., T.A.W., D.P.D., U.W., R.B.D., R.L.S., L.L., E.M., J.D., K.N., M.L., A.A., M.B., A.B., M.J.B., C.B., J.D.B., C.C., R.C., N.C., T.E., H.F., P.F., C.Y.H., M.S.H., S.K., R.A.K., F.R.N.C.M., A.V.M., I.S., M.M.S., R.G.S., F.S., N.T., X.W., C.W., H.N.C., J.C.H.S. and R.N. collected data; L.C.J., D.A., T.A.W., G.K., W.Y.W. and K.N. analyzed the diffraction data using software developed by J.C.H.S., T.A.W., R.A.K., A.B. and H.N.C.; L.C.J. and R.N. wrote the paper with discussion and improvements from all authors. COMPETING FINANCIAL INTERESTS The authors declare no competing financial interests. NIH Public Access Author Manuscript Nat Methods. Author manuscript; available in PMC 2012 September 10. Published in final edited form as: Nat Methods. ; 9(3): 263–265. doi:10.1038/nmeth.1867. NIH-PA Author Manuscript NIH-PA Author Manuscript NIH-PA Author Manuscript
Transcript of Lipidic phase membrane protein serial femtosecond crystallography
Lipidic phase membrane protein serial femtosecondcrystallography
Linda C Johansson1, David Arnlund1, Thomas A White2, Gergely Katona1, Daniel PDePonte2, Uwe Weierstall3, R Bruce Doak3, Robert L Shoeman4, Lukas Lomb4, ErikMalmerberg1, Jan Davidsson5, Karol Nass6, Mengning Liang2, Jakob Andreasson7,Andrew Aquila2,8, Sasa Bajt8, Miriam Barthelmess8, Anton Barty2, Michael J Bogan9,Christoph Bostedt10, John D Bozek10, Carl Caleman2, Ryan Coffee10, Nicola Coppola2,18,Tomas Ekeberg7, Sascha W Epp11,12, Benjamin Erk11,12, Holger Fleckenstein2, LutzFoucar4,11, Heinz Graafsma8, Lars Gumprecht2, Janos Hajdu7, Christina Y Hampton9,Robert Hartmann13, Andreas Hartmann13, Günter Hauser14,15, Helmut Hirsemann8, PeterHoll13, Mark S Hunter16, Stephan Kassemeyer4, Nils Kimmel14,15, Richard A Kirian3, FilipeR N C Maia17, Stefano Marchesini17, Andrew V Martin2, Christian Reich13, Daniel Rolles4,11,Benedikt Rudek11,12, Artem Rudenko11,12, Ilme Schlichting4,11, Joachim Schulz2, M MarvinSeibert7,18, Raymond G Sierra9, Heike Soltau13, Dmitri Starodub9, Francesco Stellato2,Stephan Stern2, Lothar Strüder14,15, Nicusor Timneanu7, Joachim Ullrich11,12, Weixiao YWahlgren1, Xiaoyu Wang3, Georg Weidenspointner14,15, Cornelia Wunderer8, PetraFromme16, Henry N Chapman2,6, John C H Spence3, and Richard Neutze1
1Department of Chemistry and Molecular Biology, University of Gothenburg, Gothenburg,Sweden2Center for Free-Electron Laser Science, Deutsches Elektronen-Synchrotron, Hamburg, Germany3Department of Physics, Arizona State University, Tempe, Arizona, USA4Max-Planck-Institut für Medizinische Forschung, Heidelberg, Germany5Department of Photochemistry and Molecular Science, Uppsala University, Uppsala, Sweden6Institute for Experimental Physics, University of Hamburg, Hamburg, Germany7Laboratory of Molecular Biophysics, Department of Cell and Molecular Biology, UppsalaUniversity, Uppsala, Sweden
© 2012 Nature America, Inc. All rights reserved.
Correspondence should be addressed to R.N. ([email protected])..18Present addresses: European XFEL GmbH, Hamburg, Germany (N.C.) and Linac Coherent Light Source, SLAC NationalAccelerator Laboratory, Menlo Park, California, USA (M.M.S.).
Accession codes. Protein Data Bank: 4ac5.
Note: Supplementary information is available on the Nature Methods website.
AUTHOR CONTRIBUTIONSL.C.J., R.N., H.N.C., J.C.H.S. and P.F. conceived the experiment, which was designed with A.B., R.A.K., J.C.H.S., D.P.D., U.W.,R.B.D., M.J.B., D.S., I.S., S.M. and J.H. S.W.E., R.H., D.R., A.R., L.F., N.K., P.H., B.R., B.E., A.H., C.R., G.W., L.S., G.H., H.G.,J.U., I.S., H.S., M.B., H.H., L.G. and H.G. designed and set up the CAMP instrument and/or developed and operated the pnCCDdetectors. C.B. and J.D.B. set up and aligned the beamline; L.C.J. and D.A. grew sponge phase crystals; U.W., R.B.D., J.C.H.S.,D.P.D., R.L.S. and L.L. designed and operated the injector; H.N.C., A.B., A.A., J.S., D.P.D., U.W., R.B.D., S.B., M.J.B., L.G., J.H.,M.M.S., N.T., J.A., S.S. and J.C.H.S. developed diffraction instrumentation; L.C.J., D.A., T.A.W., D.P.D., U.W., R.B.D., R.L.S., L.L.,E.M., J.D., K.N., M.L., A.A., M.B., A.B., M.J.B., C.B., J.D.B., C.C., R.C., N.C., T.E., H.F., P.F., C.Y.H., M.S.H., S.K., R.A.K.,F.R.N.C.M., A.V.M., I.S., M.M.S., R.G.S., F.S., N.T., X.W., C.W., H.N.C., J.C.H.S. and R.N. collected data; L.C.J., D.A., T.A.W.,G.K., W.Y.W. and K.N. analyzed the diffraction data using software developed by J.C.H.S., T.A.W., R.A.K., A.B. and H.N.C.; L.C.J.and R.N. wrote the paper with discussion and improvements from all authors.
COMPETING FINANCIAL INTERESTSThe authors declare no competing financial interests.
NIH Public AccessAuthor ManuscriptNat Methods. Author manuscript; available in PMC 2012 September 10.
Published in final edited form as:Nat Methods. ; 9(3): 263–265. doi:10.1038/nmeth.1867.
NIH
-PA Author Manuscript
NIH
-PA Author Manuscript
NIH
-PA Author Manuscript
8Photon Science, Deutsches Elektronen-Synchrotron, Hamburg, Germany9Photon Ultrafast Laser Science and Engineering Center Institute, Stanford Linear AcceleratorCenter (SLAC) National Accelerator Laboratory, Menlo Park, California, USA10Linac Coherent Light Source, SLAC National Accelerator Laboratory, Menlo Park, California,USA11Max Planck Advanced Study Group, Center for Free-Electron Laser Science, Hamburg,Germany12Max-Planck-Institut für Kernphysik, Heidelberg, Germany13PNSensor GmbH, München, Germany14Max-Planck-Institut Halbleiterlabor, München, Germany15Max-Planck-Institut für extraterrestrische Physik, Garching, Germany16Department of Chemistry and Biochemistry, Arizona State University, Tempe, Arizona, USA17Advanced Light Source, Lawrence Berkeley National Laboratory, Berkeley, California, USA
AbstractX-ray free electron laser (X-feL)-based serial femtosecond crystallography is an emerging methodwith potential to rapidly advance the challenging field of membrane protein structural biology.here we recorded interpretable diffraction data from micrometer-sized lipidic sponge phasecrystals of the Blastochloris viridis photosynthetic reaction center delivered into an X-feL beamusing a sponge phase micro-jet.
Studying membrane proteins remains a major challenge for structural biologists. Theseproteins contain hydrophobic and hydrophilic surfaces, are typically scarce and highlyflexible, frequently become unstable when removed from their natural membraneenvironment and are usually difficult to grow into large, well-ordered crystals suitable forconventional crystallography. Serial femtosecond crystallography1, which allows X-raydiffraction data to be recorded from thousands of sub-micrometer- to micrometer-sizedcrystals, holds great promise for the structural analysis of membrane proteins. This emergingmethod has been first demonstrated1 using sub-micrometer crystals of cyanobacterialphotosystem I (PSI) delivered to the X-ray beam using a thin liquid jet2. PSI, which is alarge membrane protein complex, is exceptional in that it crystallizes overnight at low ionicstrength3 (8 mM MgSO4). More representative membrane protein crystallization conditionsinvolve higher concentrations of salt (typically 50-300 mM) and polyethylene glycol (PEG;typically 10-35%), which pose challenges for micro-jet injection owing to higher viscosityand the risk that salt crystals or aggregates may clog the micro jet nozzle.
Lipidic cubic phase (LCP) crystallization of membrane proteins4-6 is a genericcrystallization method developed to mimic the natural lipid bilayer of membrane proteinsand thereby enhance their stability during crystallization. In the original formulation4,solubilized membrane proteins were first mixed with the lipid monoolein in the ratio 60:40to form the semisolid LCP, to which crystallization agents were then added. LCPcrystallization rapidly led to X-ray structures of archaeal rhodopsins6 and more recentlystructures of G protein-coupled receptors7 (Supplementary Note and Supplementary Table1).
Because of its semisolid nature, the LCP does not readily form a micrometer-sized jetrequired to deliver microcrystals in serial femtosecond crystallography1. In contrast, the
Johansson et al. Page 2
Nat Methods. Author manuscript; available in PMC 2012 September 10.
NIH
-PA Author Manuscript
NIH
-PA Author Manuscript
NIH
-PA Author Manuscript
closely related lipidic sponge phase (LSP), made by mixing monoolein and water with athird agent such as jeffamine or PEG that swells the cubic phase into a liquid phase6,8, canbe adapted to serial femtosecond crystallography. LSP crystallization was originallydeveloped from the observation that the LCP crystallization of the Rhodobacter sphaeroidesreaction center proceeded via an LSP8. Four independent LSP membrane protein structureshave been reported to date (Supplementary Table 1); it appears likely that crystals used fordetermining the structures of several G protein-coupled receptors and one bacterial oxidasegrew via a cubic-to-sponge-phase transition (Supplementary Note), and an LSPcrystallization screen gave leads from 8 of 11 membrane proteins tested9. In this work weadapted the LSP crystallization to yield showers of membrane protein microcrystals that weinjected across an X-ray free electron beam using microjet technology2. From the diffractiondata we recovered a new crystal form of the Bl. viridis photosynthetic reaction center(RCvir) solved using serial femtosecond crystallography.
For batch LSP crystallization experiments we modified earlier hanging-drop conditions10
(Online Methods): we dispensed 250 μl aliquots in septum-sealed glass vials (Fig. 1a).Because the sponge phase is less dense than water, it spontaneously separates8, with the LSPfloating on the top (Fig. 1a). We used optical microscopy to identify crystallizationconditions under which showers of microcrystals grew in the LSP over 2 weeks (Fig. 1b)and used cross-polarization analysis to confirm their ordered nature through birefringence(Supplementary Fig. 1). We shipped these sealed glass vials at room temperature to theLinac Coherent Light Source (LCLS) at SLAC National Laboratory, USA. We collected thecolored upper phase (Fig. 1a) and removed large crystals that could potentially block themicro-jet by passing the LSP through a 10-μm-cutoff metal filter (Online Methods andSupplementary Fig. 2). We injected these suspensions as a rapidly flowing liquid micro-jet2
across a focused X-FEL beam11. The sponge phase (Fig. 1a) readily flowed at a rate similarto that of water (10 μl min−1) and produced a stable jet ~4 μm in diameter (Fig. 2a).Because the diameter of this jet was of the same order of magnitude as that of the RCvirmicrocrystals, the LSP provided a low-background environment for serial femtosecondcrystallography.
We collected diffraction data at the Atomic Molecular and Optical (AMO) beamline12 of theLCLS on the Center for Free-Electron Laser Science Advanced Study Group multipurposechamber (CAMP) pn-junction charge-coupled devices13 (pnCCDs) with two verticallyoffset panels that we read out at 60 Hz, which was the repetition rate of the FEL X-raypulses. Each X-FEL pulse was nominally 70 fs in duration and contained up to 1013 2-keVX-rays (6.17 Å wavelength) focused into a 10 μm2 spot. The maximum resolutionaccessible with this energy and detector geometry was 7.4 Å, and reaction centermicrocrystals repeatedly diffracted to this resolution limit (Fig. 2b). Of the 365,035 recordedframes (~100 min of data collection), we observed 1,542 diffraction patterns of which weprocessed 265 in the space group P212121 (Fig. 2c) with unit cell axes a = 57.6 Å, b = 84.6Å, c = 375.8 Å and unit cell angles α = β = γ = 90° (Supplementary Fig. 3), representing anew crystal form of RCvir.
As we processed 265 diffraction patterns from 365,035 images, the hit rate was below 0.1%,approximately an order of magnitude lower than that obtained for PSI1. A probableexplanation for this difference is that the RCvir microcrystals tended to have a high mosaicspread (Supplementary Fig. 4), which, in combination with one cell axis being longer than300 Å, made data-processing challenging. Because we grew PSI microcrystals overnight on-site at the LCLS1, it is reasonable to expect that the quality of RCvir microcrystals wouldimprove if long-distance shipping at room temperature could be avoided. Furtherimprovements include more robust diffraction-spot finding and indexing routines andchanges in crystallization conditions to maximize the number of diffracting microcrystals.
Johansson et al. Page 3
Nat Methods. Author manuscript; available in PMC 2012 September 10.
NIH
-PA Author Manuscript
NIH
-PA Author Manuscript
NIH
-PA Author Manuscript
We processed these diffraction data using Monte Carlo methods14,15 because eachdiffraction pattern recorded only partial reflections from randomly oriented microcrystals.We summarize the crystallographic data recovered from this analysis in SupplementaryTable 2 and provide crystallographic statistics for each resolution shell in SupplementaryTable 3. The best molecular replacement solution (Online Methods) showed the crystals topack as stacked layers of 2D crystals typically found in lipidic phase crystallization6
(Supplementary Fig. 5). During structural refinement we cut the diffraction data to 8.2 Åresolution for which the multiplicity was greater than 4 and completeness was above 95%(Supplementary Table 3). Structural refinement yielded crystallographic R factor Rfactor andRfree values of 35% and 38%, respectively (Supplementary Table 2; in Supplementary Table4 we provide a breakdown by resolution shell) and both the 2Fobs - Fcalc (where Fobs andFcalc are the observed and calculated structure factor amplitudes) electron density map (Fig.3a) and composite omit map (Supplementary Fig. 6) clearly indicated transmembrane αhelices. Moreover, when we removed all four heme groups of the RCvir cytochrome subunitfrom the structural model, we recovered positive Fobs - Fcalc electron density associated witheach of these cofactors in the resulting omit map (Fig. 3b and Supplementary Fig. 7).
We also recovered well-performing micro-jets using LSPs derived from monoolein, waterand PEG 400, PEG 1500 or PEG 4000 (Supplementary Fig. 8). As jeffamine and PEGconditions form the basis of a validated LSP crystallization screen9, and PEG 400 has been acrystallization agent in all recent LCP crystal structures of G-protein-coupled receptors(Supplementary Table 1), the adaption of LSP crystallization to serial femtosecondcrystallography appears promising for solving membrane protein targets of unknownstructure.
Shorter X-ray wavelength beamlines (λ of ~1.5 Å) and higher repetition rates (120 Hz) haverecently become available at the LCLS. As such, high-resolution membrane protein crystalstructures should soon be achievable using X-FEL radiation. We estimate that an order of10,000 processed diffraction images will be needed for high-resolution electron densitymaps to be recovered using serial femtosecond crystallography, which would require three12-h shifts at the hit rate reported here. Nevertheless, because we solved the structure ofRCvir to 8.2 Å resolution by molecular replacement with only 265 processed images, thisbodes well for future applications of lipidic phase serial femtosecond crystallography tomembrane protein structural biology.
ONLINE METHODSGrowth and purification of reaction center from Bl. viridis
We cultivated the photosynthetic reaction center from Bl. viridis as described10. Wemodified the purification by using 250 ml POROS ‘50 micron’ HQ media (AppliedBiosystems Europe BV) packed in an XK 50/20 column (GE Healthcare) and a HiPrep26/60 Sephacryl S-300 column (GE Healthcare). This protocol yielded ~3 mg of pure RCvirper liter of cell culture.
Lipidic sponge phase batch crystallizationWe prepared LSPs as previously described10. We set up batch crystallizations in septum-sealed glass vials (Sigma-Aldrich) containing 100 μl protein (20-30 mg ml−1), 100 μl LSP(12% monoolein, 17.5% jeffamine M-600, 1.0 M Hepes (pH 8.0), 0.7 M (NH4)2SO4 and2.5% 1,2,3-heptanetriol) and 50 μl of 1.0-1.2 M trisodium citrate. These setups were left toequilibrate for 2-4 weeks at 20 °C. We diluted crystals 4:1 in a solution containing 0.1 MHepes (pH 8.0), 0.1% lauryldimethylamine-oxide (LDAO) before filtering in a 10-μm-cutoff titanium filter (VICI AG International). We developed the conditions for large-batch
Johansson et al. Page 4
Nat Methods. Author manuscript; available in PMC 2012 September 10.
NIH
-PA Author Manuscript
NIH
-PA Author Manuscript
NIH
-PA Author Manuscript

crystallization setups by initially screening for batch crystallization conditions using smallerbatch crystallization volumes (60 μl to 100 μl setups).
Liquid microjetWe delivered samples to the injector nozzle via a sample loop, and we injected these into theX-FEL beam at a flow rate of 10 μl min−1. The liquid capillary of the nozzle had an innerdiameter of 50 μm and the liquid was focused by coaxially flowing helium gas to acontinuous jet-stream of ~4 μm diameter2. We aligned the X-ray beam to hit the liquid inthe continuous jet region before the breakup into droplets occurred (Fig. 2a). For PEG-basedLSPs, we required an inner diameter of 100 μm for the jet to flow (Supplementary Fig. 8).These LSPs consisted of 40% PEG 400, PEG 1500 or PEG 4000 mixed with 30%Monoolein and 30% buffer (0.1 M Hepes, pH 8.0, 0.1 M NaCl and 0.1 M MgCl2).
Data collectionWe collected diffraction data at the atomic molecular and optical (AMO) beamline at theLinac Coherent Light Source12 using the CAMP instrument13. We recorded diffraction dataon two 76.8 mm by 38.4 mm pnCCDs located 64.7 mm and 67.7 mm from the sampleposition. The pnCCDs we offset asymmetrically such that X-ray diffraction was sampledfrom 3.5° to 49.0°, which maximized the sampled resolution (7.4 Å at the outer corners; Fig.2b). The X-ray wavelength at AMO was 6.17 Å, and we focused the beam to a 10 μm2 spot.
Data processingWe processed diffraction data using in-house code that called DirAx16 and MOSFLM17 forautomated indexing1. We indexed data from 265 diffraction images in P212121 with unit cellaxes a = 57.6 Å, b = 84.6 Å, c = 375.8 Å and α = β = γ = 90°. We did not observesubpopulations of other crystal forms (Supplementary Fig. 3). Small variations in the lengthof the c axis, however, arose perhaps owing to pulse-to-pulse fluctuations in the X-FELwavelength. Because every observation is a partial reflection, we scaled and merged thisintegrated data using Monte Carlo methods14,15. We estimated I/σ values for each resolutionbin (Supplementary Table 3) from reflections with both positive intensity and a multiplicityhigher than 1. NZ-test and L-test plots showed the expected distributions (SupplementaryFig. 9).
Molecular replacement and refinementWe obtained phases by molecular replacement using Phaser18 2.3.0 with PDB entry 2WJN10
as the search model. The best solution had a translation function Z score (TFZ) of 8.5, therotation function Z score (RFZ) of 5.8 and a log likelihood gain (LLG) of 81. This was welldiscriminated from second best solution with scores of TFZ, 4.6; RFZ, 5.8; and LLG, 39.We evaluated the crystal packing and confirmed that only the best molecular replacementsolution was physically meaningful. We performed 20 cycles of rigid body and restrainedrefinement using REFMAC19, converging to Rfactor = 35% and Rfree = 38%, and an overallfigure of merit of 0.62. During refinement we used simple Wilson scaling and a constantdensity (using default values) we assigned to the region of the unit cell not occupied byprotein atoms. We calculated the solvent mask using default parameters: increase van derWaals radius of non-ion atoms by 1.2 Å, increase ionic radius of potential ions by 0.8 Å,shrink the area of the mask by 0.8 Å after calculation. Crystallographic data statistics aresummarized in Supplementary Table 2, and resolution shell breakdowns of thecrystallographic data and refinement statistics are given in Supplementary Tables 3 and 4,respectively.
Johansson et al. Page 5
Nat Methods. Author manuscript; available in PMC 2012 September 10.
NIH
-PA Author Manuscript
NIH
-PA Author Manuscript
NIH
-PA Author Manuscript
Control map calculationsWe performed test calculations using two control datasets: one with the serial femtosecondcrystallography data randomly shuffled and another where all observations were set equal.Molecular replacement failed with both control datasets. When we combined the phasesgenerated using the molecular replacement solution recovered against the experimental datawith these control datasets, the resulting electron density maps did not show α-helicalstructure (Supplementary Fig. 10).
Omit map calculationsWe calculated Fobs - Fcalc omit electron density maps using REFMAC19 with all four hemesof the cytochrome subunit removed from the structural model (Fig. 3b and SupplementaryFig. 7).
Composite omit map calculationsWe calculated composite omit electron density maps (Supplementary Fig. 6) using theprogram CNS20,21 version 1.3 with ~5% of the structure excluded, no simulated annealing,no minimization and no bulk-solvent correction.
Supplementary MaterialRefer to Web version on PubMed Central for supplementary material.
AcknowledgmentsExperiments were carried out at the LCLS, a national user facility operated by Stanford University on behalf of theUS Department of Energy, Office of Basic Energy Sciences. We acknowledge financial support from the SwedishResearch Council (Vetenskapsrådet), the Swedish Foundation for International Cooperation in Research and HigherEducation, Stiftelsen Olle Engkvist Byggmästare, the Max Planck Society for funding the development andoperation of the CAMP instrument, the US National Science Foundation grant MCB 0919195, the US Departmentof Energy Office of Basic Energy Sciences through the Photon Ultrafast Laser Science and Engineering CenterInstitute at the SLAC National Accelerator Laboratory and the Energy Frontier Research Center for Bio-InspiredSolar Fuel Production (award DE-SC0001016), the Hamburg Ministry of Science and Research and Joachim HerzStiftung as part of the Hamburg Initiative for Excellence in Research and the Hamburg School for Structure andDynamics in Infection, US National Science Foundation (awards 0417142 and MCB-1021557), US NationalInstitutes of Health (awards 1R01GM095583-01 and 1U54GM094625-01), the Deutsche ForschungsgemeinschaftCluster of Excellence at the Munich Center for Advanced Photonics, Center for Biophotonics Science andTechnology at the University of California (cooperative agreement PHY 0120999).
References1. Chapman HN, et al. Nature. 2011; 470:73–77. [PubMed: 21293373]
2. DePonte DP, et al. J. Phys. D Appl. Phys. 2008; 41:195505.
3. Jordan P, et al. Nature. 2001; 411:909–917. [PubMed: 11418848]
4. Landau EM, Rosenbusch JP. Proc. Natl. Acad. Sci. USA. 1996; 93:14532–14535. [PubMed:8962086]
5. Caffrey M. Annu. Rev. Biophys. 2009; 38:29–51. [PubMed: 19086821]
6. Johansson LC, Wöhri AB, Katona G, Engstrom S, Neutze R. Curr. Opin. Struct. Biol. 2009;19:372–378. [PubMed: 19581080]
7. Rosenbaum DM, Rasmussen SG, Kobilka BK. Nature. 2009; 459:356–363. [PubMed: 19458711]
8. Wadsten P, et al. J. Mol. Biol. 2006; 364:44–53. [PubMed: 17005199]
9. Wöhri AB, et al. Structure. 2008; 16:1003–1009. [PubMed: 18611373]
10. Wöhri AB, et al. Biochemistry. 2009; 48:9831–9838. [PubMed: 19743880]
11. Emma P, et al. Nat. Photonics. 2010; 4:641–647.
12. Bozek JD. Eur. Phys. J. Spec. Top. 2009; 169:129–132.
Johansson et al. Page 6
Nat Methods. Author manuscript; available in PMC 2012 September 10.
NIH
-PA Author Manuscript
NIH
-PA Author Manuscript
NIH
-PA Author Manuscript
13. Strüder L, et al. Nucl. Instrum. Methods Phys. Res. A. 2010; 614:483–496.
14. Kirian RA, et al. Opt. Express. 2010; 18:5713–5723. [PubMed: 20389587]
15. Kirian RA, et al. Acta Crystallogr. A. 2011; 67:131–140. [PubMed: 21325716]
16. Duisenberg AJ. J. Appl. Cryst. 1992; 25:92–96.
17. Leslie AGW. Acta Crystallogr. D. Biol. Crystallogr. 2006; 62:48–57. [PubMed: 16369093]
18. McCoy AJ, et al. J. Appl. Cryst. 2007; 40:658–674. [PubMed: 19461840]
19. Murshudov GN, Vagin AA, Dodson EJ. Acta Crystallogr. 1997; d53:240–255.
20. Brunger AT, et al. Acta Crystallogr. D Biol. Crystallogr. 1998; 54:905–921. [PubMed: 9757107]
21. Brunger AT. Nat. Protoc. 2007; 2:2728–2733. [PubMed: 18007608]
Johansson et al. Page 7
Nat Methods. Author manuscript; available in PMC 2012 September 10.
NIH
-PA Author Manuscript
NIH
-PA Author Manuscript
NIH
-PA Author Manuscript
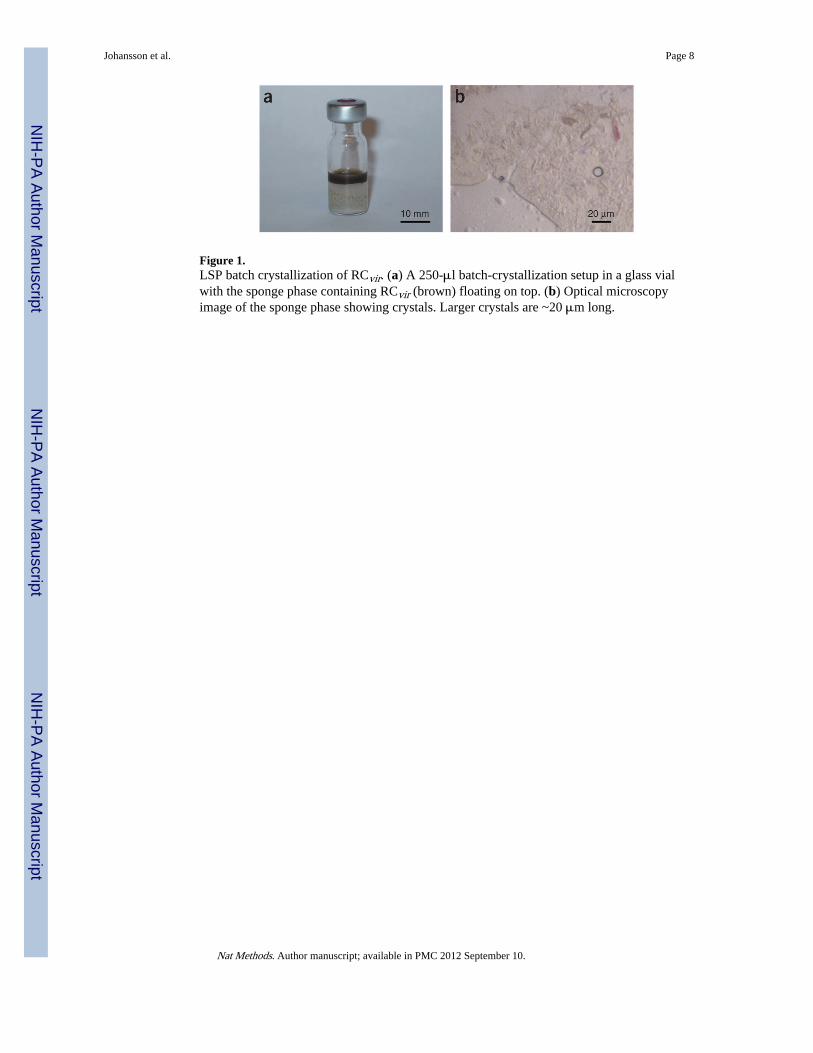
Figure 1.LSP batch crystallization of RCvir. (a) A 250-μl batch-crystallization setup in a glass vialwith the sponge phase containing RCvir (brown) floating on top. (b) Optical microscopyimage of the sponge phase showing crystals. Larger crystals are ~20 μm long.
Johansson et al. Page 8
Nat Methods. Author manuscript; available in PMC 2012 September 10.
NIH
-PA Author Manuscript
NIH
-PA Author Manuscript
NIH
-PA Author Manuscript
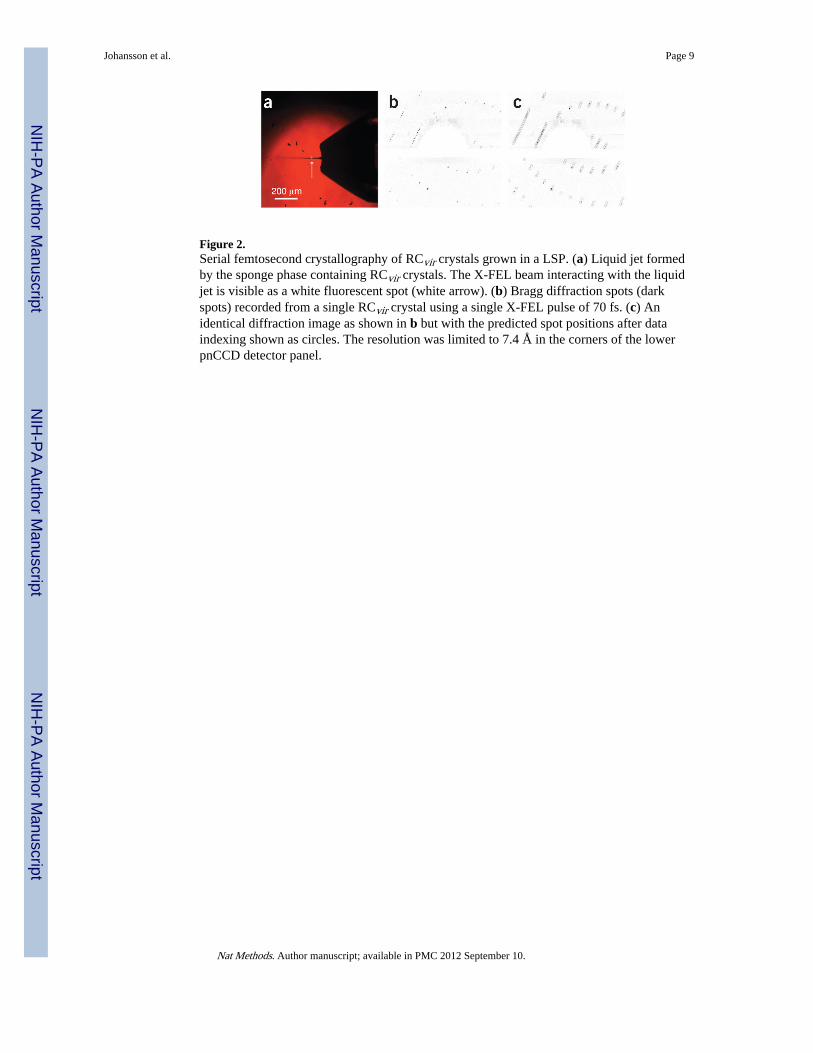
Figure 2.Serial femtosecond crystallography of RCvir crystals grown in a LSP. (a) Liquid jet formedby the sponge phase containing RCvir crystals. The X-FEL beam interacting with the liquidjet is visible as a white fluorescent spot (white arrow). (b) Bragg diffraction spots (darkspots) recorded from a single RCvir crystal using a single X-FEL pulse of 70 fs. (c) Anidentical diffraction image as shown in b but with the predicted spot positions after dataindexing shown as circles. The resolution was limited to 7.4 Å in the corners of the lowerpnCCD detector panel.
Johansson et al. Page 9
Nat Methods. Author manuscript; available in PMC 2012 September 10.
NIH
-PA Author Manuscript
NIH
-PA Author Manuscript
NIH
-PA Author Manuscript
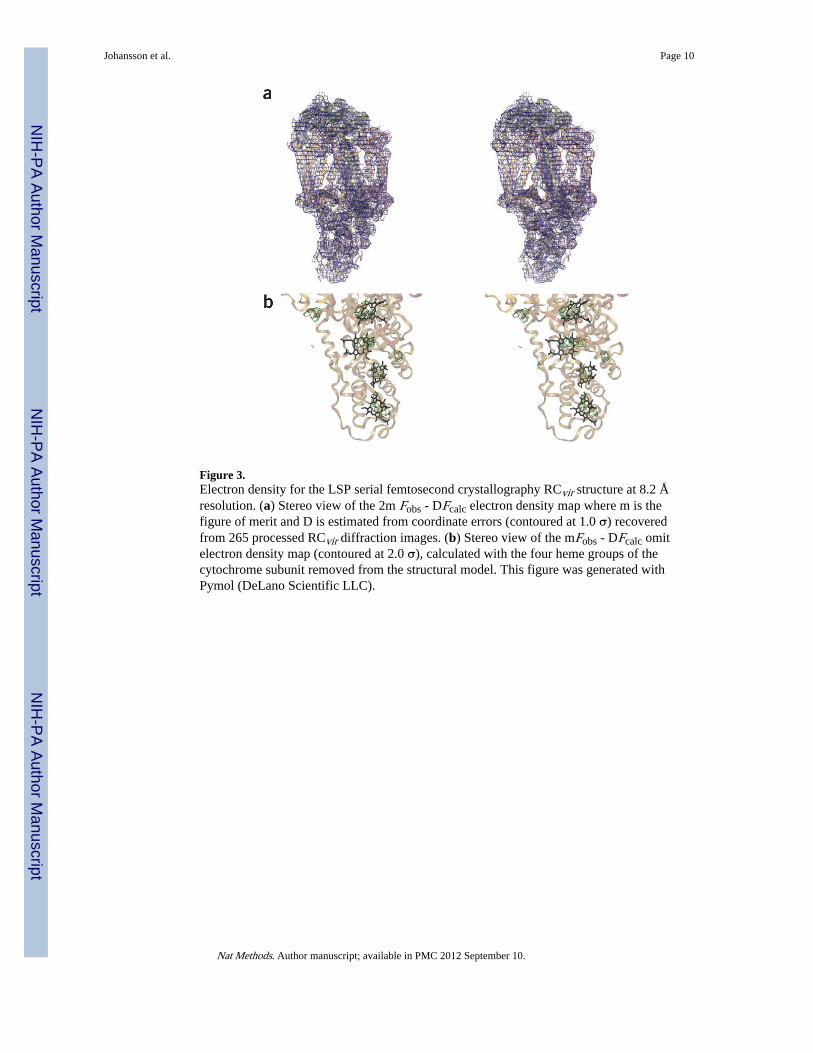
Figure 3.Electron density for the LSP serial femtosecond crystallography RCvir structure at 8.2 Åresolution. (a) Stereo view of the 2m Fobs - DFcalc electron density map where m is thefigure of merit and D is estimated from coordinate errors (contoured at 1.0 σ) recoveredfrom 265 processed RCvir diffraction images. (b) Stereo view of the mFobs - DFcalc omitelectron density map (contoured at 2.0 σ), calculated with the four heme groups of thecytochrome subunit removed from the structural model. This figure was generated withPymol (DeLano Scientific LLC).
Johansson et al. Page 10
Nat Methods. Author manuscript; available in PMC 2012 September 10.
NIH
-PA Author Manuscript
NIH
-PA Author Manuscript
NIH
-PA Author Manuscript

![Yackety yack [serial] - Internet Archive](https://static.fdokumen.com/doc/165x107/63276564e491bcb36c0b431c/yackety-yack-serial-internet-archive.jpg)


![Yackety yack [serial]](https://static.fdokumen.com/doc/165x107/6328fdedcedd78c2b50e548e/yackety-yack-serial.jpg)