
Abutment region dosimetry for serial tomotherapy
11
PII S0360-3016(99)00125-X PHYSICS CONTRIBUTION ABUTMENT REGION DOSIMETRY FOR SERIAL TOMOTHERAPY DANIEL A. LOW,PH.D., SASA MUTIC, M.S., JAMES F. DEMPSEY,PH.D., JERRY MARKMAN,SC.D., S. MURTY GODDU,PH.D., AND JAMES A. PURDY,PH.D. Division of Radiation Oncology, Mallinckrodt Institute of Radiology, Washington University Medical Center, St. Louis, MO, Purpose: A commercial intensity modulated radiation therapy system (Corvus, NOMOS Corp.) is presently used in our clinic to generate optimized dose distributions delivered using a proprietary dynamic multileaf collimator (DMLC) (MIMiC) composed of 20 opposed leaf pairs. On our accelerator (Clinac 600C/D, Varian Associates, Inc.) each MIMiC leaf projects to either 1.00 3 0.84 or 1.00 3 1.70 cm 2 (depending on the treatment plan and termed 1 cm or 2 cm mode, respectively). The MIMiC is used to deliver serial (axial) tomotherapy treatment plans, in which the beam is delivered to a nearly cylindrical volume as the DMLC is rotated about the patient. For longer targets, the patient is moved (indexed) between treatments a distance corresponding to the projected leaf width. The treatment relies on precise indexing and a method was developed to measure the precision of indexing devices. A treatment planning study of the dosimetric effects of incorrect patient indexing and concluded that a dose heterogeneity of 10% mm -1 resulted. Because the results may be sensitive to the dose model accuracy, we conducted a measurement-based investigation of the consequences of incorrect indexing using our accelerator. Although the indexing provides an accurate field abutment along the isocenter, due to beam divergence, hot and cold spots will be produced below and above isocenter, respectively, when less than 300° arcs were used. A preliminary study recently determined that for a 290° rotation in 1 cm mode, 15% cold and 7% hot spots were delivered to 7 cm above and below isocenter, respectively. This study completes the earlier work by investigating the dose heterogeneity as a function of position relative to the axis of rotation, arc length, and leaf width. The influence of random daily patient positioning errors is also investigated. Methods and Materials: Treatment plans were generated using 8.0 cm diameter cylindrical target volumes within a homogeneous rectilinear film phantom. The plans included both 1 and 2 cm mode, optimized for 300°, 240°, and 180° gantry rotations. Coronal-oriented films were irradiated throughout the target volumes and scanned using a laser film digitizer. The central target irradiated in 1 cm mode was also used to investigate the effects of incorrect couch indexing. Results: The dose error as a function of couch index error was 25% mm -1 , significantly greater than previously reported. The clinically provided indexing system yielded 0.10 mm indexing precision. The intrinsic dose distributions indicated that more heterogeneous dose distributions resulted from the use of smaller gantry angle ranges and larger leaf projections. Using 300° gantry angle and 1 cm mode yielded 7% hot and 15% cold spots 7 cm below and above isocenter, respectively. When a 180° gantry angle was used, the values changed to 22% hot and 27% cold spots for the same locations. The heterogeneities for the 2 cm mode were 70% greater than the corresponding 1 cm values. Conclusions: While serial tomotherapy is used to deliver highly conformal dose distributions, significant dosimetric factors must be considered before treatment. The patient must be immobilized during treatment to avoid dose heterogeneities caused by incorrect indexing due to patient movement. Even under ideal conditions, beam divergence can cause significant abutment-region dose heterogeneities. The use of larger gantry angle ranges, smaller leaf widths, and appropriate locations of the gantry rotation axis can minimize these effects. © 1999 Elsevier Science Inc. Intensity modulated radiation therapy, Radiation therapy quality assurance, Serial tomotherapy INTRODUCTION Serial (axial) tomotherapy is a modality of intensity modu- lated radiation therapy (IMRT), which is currently in clin- ical use throughout the world. The process of treatment planning and delivery of IMRT using serial tomotherapy has been described by Verellen et al. (1), Tsai et al. (2), and Low et al. (3). The commercial implementation of tomo- therapy uses a dynamic multileaf collimator (DMLC) with independently driven parallel-opposed leaf banks, simultaneously delivering dose to anywhere within two 0.84 cm or 1.70 cm thick (on our linear accelerator, termed 1 cm or 2 cm modes, respec- tively), 20 cm diameter roughly cylindrical volumes. The abut- ment region between the two leaf banks passes through the central axis and lies within the gantry rotation plane. The abutment between these two delivered slices is, therefore, ideal, and no Reprint requests to: Daniel A. Low, Ph.D., Division of Radia- tion Oncology, Mallinckrodt Institute of Radiology, 510 South Kingshighway Blvd., St. Louis, MO 63110. Tel: (314) 362-2636; Fax: (314) 362-2682; E-mail: [email protected]. Accepted for publication 22 March 1999. Int. J. Radiation Oncology Biol. Phys., Vol. 45, No. 1, pp. 193–203, 1999 Copyright © 1999 Elsevier Science Inc. Printed in the USA. All rights reserved 0360-3016/99/$–see front matter 193
Transcript of Abutment region dosimetry for serial tomotherapy
PII S0360-3016(99)00125-X
PHYSICS CONTRIBUTION
ABUTMENT REGION DOSIMETRY FOR SERIAL TOMOTHERAPY
DANIEL A. LOW, PH.D., SASA MUTIC, M.S., JAMES F. DEMPSEY, PH.D., JERRY MARKMAN, SC.D.,S. MURTY GODDU, PH.D., AND JAMES A. PURDY, PH.D.
Division of Radiation Oncology, Mallinckrodt Institute of Radiology, Washington University Medical Center, St. Louis, MO,
Purpose: A commercial intensity modulated radiation therapy system (Corvus, NOMOS Corp.) is presently usedin our clinic to generate optimized dose distributions delivered using a proprietary dynamic multileaf collimator(DMLC) (MIMiC) composed of 20 opposed leaf pairs. On our accelerator (Clinac 600C/D, Varian Associates,Inc.) each MIMiC leaf projects to either 1.00 3 0.84 or 1.003 1.70 cm2 (depending on the treatment plan andtermed 1 cm or 2 cm mode, respectively). The MIMiC is used to deliver serial (axial) tomotherapy treatmentplans, in which the beam is delivered to a nearly cylindrical volume as the DMLC is rotated about the patient.For longer targets, the patient is moved (indexed) between treatments a distance corresponding to the projectedleaf width. The treatment relies on precise indexing and a method was developed to measure the precision ofindexing devices. A treatment planning study of the dosimetric effects of incorrect patient indexing andconcluded that a dose heterogeneity of 10% mm-1 resulted. Because the results may be sensitive to the dose modelaccuracy, we conducted a measurement-based investigation of the consequences of incorrect indexing using ouraccelerator. Although the indexing provides an accurate field abutment along the isocenter, due to beamdivergence, hot and cold spots will be produced below and above isocenter, respectively, when less than 300° arcswere used. A preliminary study recently determined that for a 290° rotation in 1 cm mode, 15% cold and 7% hotspots were delivered to 7 cm above and below isocenter, respectively. This study completes the earlier work byinvestigating the dose heterogeneity as a function of position relative to the axis of rotation, arc length, and leafwidth. The influence of random daily patient positioning errors is also investigated.Methods and Materials: Treatment plans were generated using 8.0 cm diameter cylindrical target volumes withina homogeneous rectilinear film phantom. The plans included both 1 and 2 cm mode, optimized for 300°, 240°, and180° gantry rotations. Coronal-oriented films were irradiated throughout the target volumes and scanned usinga laser film digitizer. The central target irradiated in 1 cm mode was also used to investigate the effects ofincorrect couch indexing.Results: The dose error as a function of couch index error was 25% mm-1, significantly greater than previouslyreported. The clinically provided indexing system yielded 0.10 mm indexing precision. The intrinsic dose distributionsindicated that more heterogeneous dose distributions resulted from the use of smaller gantry angle ranges and largerleaf projections. Using 300° gantry angle and 1 cm mode yielded 7% hot and 15% cold spots 7 cm below and aboveisocenter, respectively. When a 180° gantry angle was used, the values changed to 22% hot and 27% cold spots forthe same locations. The heterogeneities for the 2 cm mode were 70% greater than the corresponding 1 cm values.Conclusions: While serial tomotherapy is used to deliver highly conformal dose distributions, significantdosimetric factors must be considered before treatment. The patient must be immobilized during treatment toavoid dose heterogeneities caused by incorrect indexing due to patient movement. Even under ideal conditions,beam divergence can cause significant abutment-region dose heterogeneities. The use of larger gantry angleranges, smaller leaf widths, and appropriate locations of the gantry rotation axis can minimize these effects.© 1999 Elsevier Science Inc.
Intensity modulated radiation therapy, Radiation therapy quality assurance, Serial tomotherapy
INTRODUCTION
Serial (axial) tomotherapy is a modality of intensity modu-lated radiation therapy (IMRT), which is currently in clin-ical use throughout the world. The process of treatmentplanning and delivery of IMRT using serial tomotherapyhas been described by Verellenet al. (1), Tsaiet al. (2), andLow et al. (3). The commercial implementation of tomo-
therapy uses a dynamic multileafcollimator (DMLC) withindependently driven parallel-opposed leaf banks, simultaneouslydelivering dose to anywhere within two 0.84 cm or 1.70 cm thick(on our linear accelerator, termed 1 cm or 2 cm modes, respec-tively), 20 cm diameter roughly cylindrical volumes. The abut-ment region between the two leaf banks passes through the centralaxis and lies within the gantry rotation plane. The abutmentbetween these two delivered slices is, therefore, ideal, and no
Reprint requests to: Daniel A. Low, Ph.D., Division of Radia-tion Oncology, Mallinckrodt Institute of Radiology, 510 SouthKingshighway Blvd., St. Louis, MO 63110. Tel: (314) 362-2636;
Fax: (314) 362-2682; E-mail: [email protected] for publication 22 March 1999.
Int. J. Radiation Oncology Biol. Phys., Vol. 45, No. 1, pp. 193–203, 1999Copyright © 1999 Elsevier Science Inc.Printed in the USA. All rights reserved
0360-3016/99/$–see front matter
193

significant dose distribution heterogeneities result in that region.However, when the target volume is longer than 1.68 cm, multipleabutting regions must be irradiated. The individually deliveredcylinder pairs are termed indexes by the manufacturer, and we willuse that terminology throughout this article.
When multiple indexes are used, the patient is moved byan amount corresponding to twice the leaf width projectedto isocenter. The process requires a highly precise couchmovement, or an unintended overlap or underlap will result.A couch immobilization and indexing device (CRANE,NOMOS Corp., Pittsburgh, PA, USA) is furnished by themanufacturer and is used to provide the precise motionrequired for accurate dose delivery. Carolet al. (4) deter-mined that the heterogeneity caused by such an indexingerror is 10% mm-1. However, that study was conductedusing only a treatment planning system, and the actual valuemay differ because of limitations in the dose-calculationmodel or because of the finite spatial resolution of thetreatment planning system commissioning data (5,6). Be-cause all patients at our institution have been treated withmore than one index, we elected to experimentally deter-mine the spatial precision of the couch indexing hardwareand the dosimetric consequences of incorrect indexing.
Even when the couch movements are precisely con-ducted, the dose distribution homogeneity in the abutmentregion suffers due to beam divergence. Similar to the con-ventional process of abutting fields they are precisely abut-ted along a single distance from the radiation source. Coldand hot spots are found upstream and downstream from thisdistance, respectively and in this case, the abutment distanceis selected to be at the isocenter. When parallel-opposedfields of the same field sizes are used, the hot and cold spotsnearly compensate. For most clinical applications, the com-mercial tomotherapy system uses arcs of less than 360°,with an arc angle range that is symmetric about the verticalaxis. For example, when the Varian gantry angle conventionis used, a common clinical angle range is 60° to 300°. Alarge portion of the beams from above (120° to 240°) do nothave corresponding opposed beams and will consequentlyyield dose heterogeneities due to the divergent beam abut-ments. These cold and hot spots will be termed the intrinsicabutment region heterogeneities. The magnitude of the het-erogeneities will depend on the total arc angle range, theprojected leaf size, and the distance from gantry rotationaxis. Low and Mutic (7) recently described a preliminarymeasurement of the abutment region dosimetry for the 1 cmmode and for a total arc angle of 290°. They measured thedose heterogeneity only along the vertical and horizontalaxes and found that the dose heterogeneity varied from 6%at 7.0 cm below isocenter to215% at 7.0 cm above iso-center. Little dose heterogeneity was seen lateral to iso-center, but no attempt was made to map the heterogeneity intwo dimensions. In this article, we describe measurementsto characterize the heterogeneity as a function of gantryangle, leaf width, and position relative to the gantry rotationaxis. In addition, a model is presented to determine the
effects of random daily patient setup error on the abutmentregion dosimetry for fractionated treatments.
Low and Mutic (7) incorrectly stated that the dose cal-culation algorithm applied beam divergence only in thetransverse plane and consequently the intrinsic dose distri-bution heterogeneities were not correctly modeled. Thetreatment planning system considers divergence in all threedimensions and the calculated dose distributions exhibit thecharacteristics of intrinsic abutment region dosimetry. How-ever, the magnitude of the dose distribution heterogeneitiesmay be influenced by the finite size pencil beams used in themodel and by the dose calculation resolution in the directionparallel to the couch index movement. Because of the sen-sitivity of the results on these parameters, we have notincluded calculated dose distributions in this article. We feelthat it is important for each user to independently determinethe accuracy of the calculated intrinsic abutment regiondose heterogeneities.
METHODS AND MATERIALS
Index devicesThe dose distributions were calculated on a three-dimen-
sional rectilinear dose matrix. When the patient was scannedhead first and supine, the positivex, y, and z axes corre-sponded to the patient’s left, posterior, and superior direc-tions, respectively. The investigated treatment setup usedthe couch placed parallel to the gantry axis of rotation, andthe couch immobilization and indexing system placed suchthat the couch was moved along the same direction.
Because of the potentially large dose errors introduced byincorrect indexing, a method was developed to measure thelongitudinal indexing error made by the commercial device.The CRANE is shown in Fig. 1; it consists of orthogonalrack-and-pinion drive mechanisms and corresponding lineardigital position readouts with 0.01 mm readout resolution.After an arc delivery is complete, the therapist disengagesthe motion locks and turns a hand crank, which activates thepinion gear. The readout mechanism is directly attached tothe movement system, and the therapist stops moving thecrank when the digital readout reaches the desired value.Ideally, this indicates that the couch, and, consequently, thepatient has been moved the appropriate amount, and aperfect abutment will take place. However, some frictionmay occur in the couch bearings causing a torque to beapplied to the indexing mechanism, slightly twisting itabout the vertical axis, and the patient will not be placed inthe appropriate location. Qualitative evidence of this hasbeen reported by Lowet al. (3).
Another device was developed by the manufacturer(miniCRANE; NOMOS Corp.) that does not rely on thecorrespondence between the rack-and-pinion and patientposition. The miniCRANE (Fig. 2) also uses a precisionlinear readout scale, but it is attached directly to the couchrail, closer to the radiation beam. An anodized aluminumplate with two vertical reflective white stripes is attached tothe movable portion of the digital scale. The therapist first
194 I. J. Radiation Oncology● Biology ● Physics Volume 45, Number 1, 1999

positions the patient at the nominal origin position (usingtraditional laser alignment marks for noninvasive immobi-lization) and aligns the reflective stripes to intercept thevertical alignment lasers. The longitudinal couch positionreadout is then set to 0.00, and the movable portion of thedigital scale is set to the first treatment position. The couchis moved so the reflective marks once again intercept thepositioning lasers, positioning the patient for the first treat-ment. Although the digital scale on the miniCRANE has thesame accuracy as the scale on the CRANE, there are sig-nificant differences between the two systems. As men-tioned, when using the CRANE, the movement of the pa-tient may not be the same as the digital scale due to frictionin the couch support bearings. However, the miniCRANE
relies on optical alignment of the lasers and scribe lines. Theprecision of that alignment relies on the skills of the thera-pist conducting the alignment procedure.
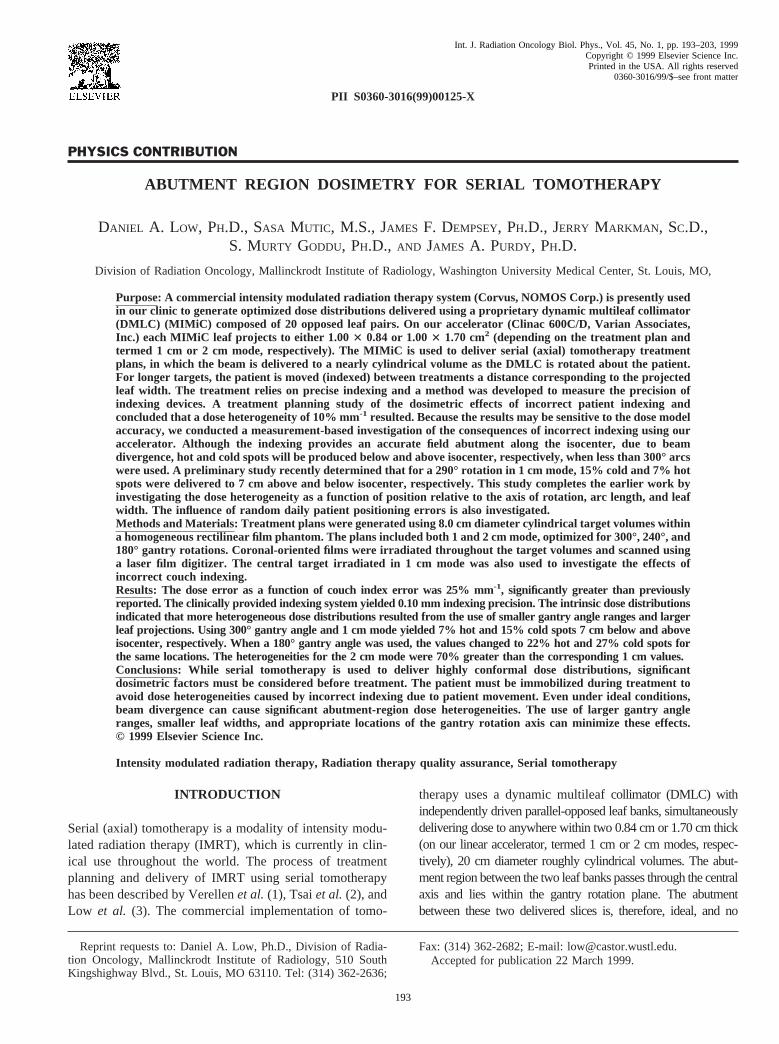
To identify the alignment precision and conduct subse-quent studies requiring precision phantom movement, adirect indexing device (Fig. 3) was developed that also useda digital position scale. The phantoms were positioned on astage riding on an optical rail system (selected for its posi-tional stability) that was bolted to an optical bench. Thebench was placed on the treatment couch and aligned so thatthe rail lay parallel to the gantry axis of rotation. Theposition scale was bolted directly between the stage and theoptical bench, providing a direct reading of the stand posi-tion. During most experiments, both the couch longitudinal
Fig. 1. Commercial indexing and couch immobilization device (CRANE).
Fig. 2. Commercial indexing device (miniCRANE) that relies on manual alignment of the room patient-positioninglasers and white scribe marks positioned on the device.
195Abutment dosimetry for serial tomotherapy● D. A. LOW et al.
lock and the CRANE were used to immobilize the couchwhile the stage and, correspondingly, the film phantomswere being moved. The CRANE was detached during theminiCRANE indexing precision test.
Index accuracyIndex precision measurements of the direct indexing de-
vice, the CRANE, and miniCRANE were obtained radio-graphically. A sheet of radiographic film (XV, Kodak,Rochester, NY, USA), oriented horizontally, was placedbetween two 4 cm thick sheets of Lucite and the assemblyplaced on the stage at a height passing through isocenter.The multileaf collimator leaves were opened to 0.84 cm (fora total field size of 1.68 cm), and the film was exposed to anet optical density of approximately 1.5. The couch wasmoved and the exposure repeated. The distance moved wasadjusted to between 1.72 cm and 1.64 cm in increments of0.01 cm. The resulting exposures exhibited correspondingunderlaps and overlaps between successive abutments. Aconfocal scanning laser digitizer (Dynascan, ComputerizedMedical Systems, St. Louis, MO, USA) was used to obtainthe dose profile (after suitable dose calibration) across thefilm and passing through the central axis projections. Thedigitizer has a spatial resolution and position spacing of 0.25mm. The relationship between the hot and cold spots and theintended movement was determined using the direct index-ing device results. A third-order polynomial fit was used tomodel this relationship, and the physical distance of filmmovement was determined by the measured hot and coldspots. Precision of the CRANE and miniCRANE move-ments was also determined using the same fit and themeasurements were repeated to ensure reproducible results.
Index errorThe hot and cold spots measured using the fixed fields
may not represent the dose heterogeneities when arc treat-
ments are used. The hot and cold spots for arc treatmentsresulting from incorrect indexing were measured using afluence distribution generated to irradiate a centrally located8 cm diameter cylindrical target volume. A rectilinear poly-styrene film phantom (8) was used with a radiographic filmplaced in the horizontal orientation. The cylindrical targetvolume was oriented such that the axis of symmetry layparallel to the gantry axis of rotation, passing through iso-center, and the length required six abutting indexes. Theindex movements were purposely conducted with position-ing errors of22, 21, 0, 11, and 12 mm, resulting inoverlaps and underlaps. The radiographic films werescanned using the densitometer, and the magnitudes of thehot and cold spots were determined for the associated over-laps and underlaps.
Intrinsic abutmentEven when the index movements are precisely con-
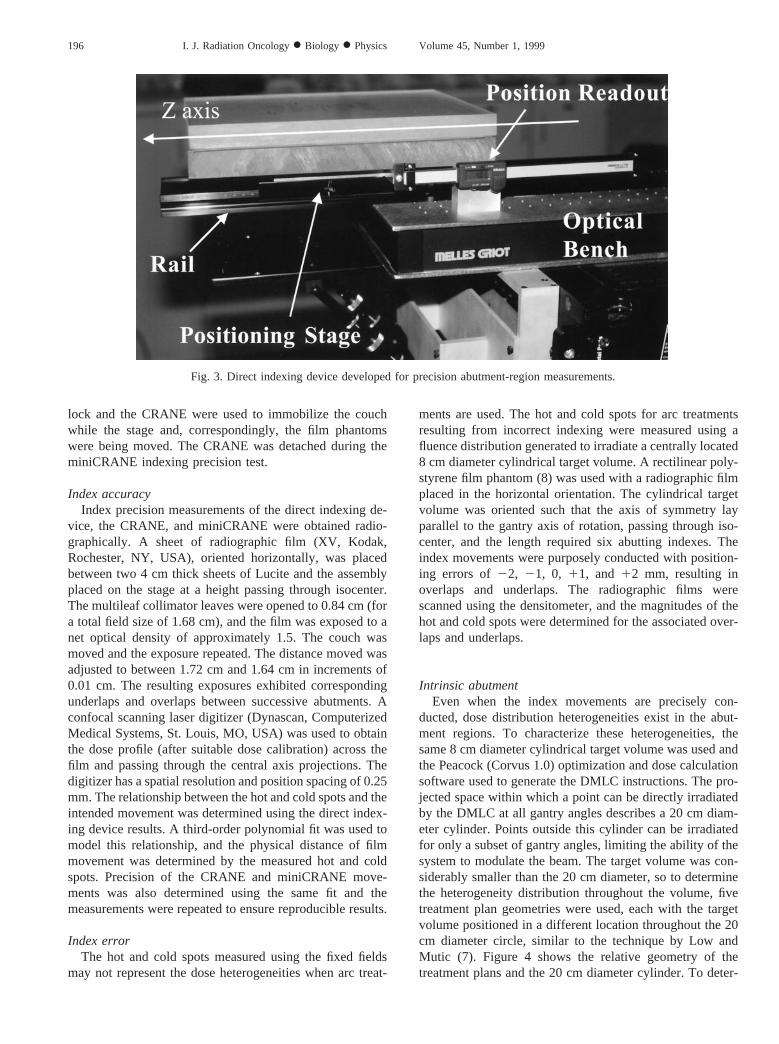
ducted, dose distribution heterogeneities exist in the abut-ment regions. To characterize these heterogeneities, thesame 8 cm diameter cylindrical target volume was used andthe Peacock (Corvus 1.0) optimization and dose calculationsoftware used to generate the DMLC instructions. The pro-jected space within which a point can be directly irradiatedby the DMLC at all gantry angles describes a 20 cm diam-eter cylinder. Points outside this cylinder can be irradiatedfor only a subset of gantry angles, limiting the ability of thesystem to modulate the beam. The target volume was con-siderably smaller than the 20 cm diameter, so to determinethe heterogeneity distribution throughout the volume, fivetreatment plan geometries were used, each with the targetvolume positioned in a different location throughout the 20cm diameter circle, similar to the technique by Low andMutic (7). Figure 4 shows the relative geometry of thetreatment plans and the 20 cm diameter cylinder. To deter-
Fig. 3. Direct indexing device developed for precision abutment-region measurements.
196 I. J. Radiation Oncology● Biology ● Physics Volume 45, Number 1, 1999
mine the sensitivity of the dose heterogeneities on gantryangle, three gantry rotation angles were investigated: 180°,240°, and 300°. Because of the interference of patient sup-port hardware, few facilities have used gantry rotations inexcess of 300°, and couch or patient interference has rarelylimited the gantry rotation angle to less than 180°. In eachcase, the angle refers to the total arc angle the gantry isrotated during delivery, but the leaves do not open on oursystem until the gantry has rotated 7.5°, and they close 7.5°before the end. Therefore, the irradiated arc range was 15°less than the overall rotation angle. The experiments wererepeated for the 2-cm leaf mode using the 180° and 300°rotation angles. In all cases, the direct indexing device wasused.
Radiographic films were placed at positions approxi-mately 1.3 cm apart along they axis. Dose contours wereobtained by scanning the films in thezdirection using 0.025cm spacing; obtaining profiles spaced each 0.5 cm along thex direction throughout the target volume. In the 1 cm mode,each target required six couch indexes, so the first twopositions were irradiated using the 180° arc plan, and thesecond and third pairs using the 240° and 300° plans,respectively. While five abutments resulted with this irradi-ation pattern, only the first, third, and fifth provided usefuldata. Because of limitations in the dose optimization engine,the doses delivered to the four leaf patterns within each pairof abutting fields were not precisely homogeneous. There-fore, it was not possible to use a simple peak extractionmethod to obtain the value of the hot and cold spots in theabutment region. Instead, it was assumed that the longitu-dinal dose distribution at the abutment region from eachindex could be modeled as a penumbra, with the abutmentregion dose as the sum of two opposing penumbrae. A fit to
the penumbra from the last arc was obtained and used tomodel the penumbraP(x) from each abutting arc with theformula:
P~ x! 5A
2 H 2
ptan21@a~ x 2 x0!# 1 1J (1)
where an overall scatter background was initially sub-tracted,A was the asymptotic dose,a was a parameter thatfit the penumbra slope, andx0 provided the penumbra offset.For each case, the relative dose and penumbra separationswere fit as free parameters to the measured distributions.The locations of the abutment region centers were obtaineddirectly from the film scans. After the data were fit, the twoadjoining penumbrae were renormalized to an asymptoticmagnitude of 1.0, and the sum was recalculated to deter-mine the peak height. The precision of this technique wasestimated to have a standard deviation of 2%. Similar dataanalyses were conducted for the 2 cm mode where only twoabutment region doses were acquired for each scan.
The results of the data analysis provided a matrix ofmeasured points within the 20 cm diameter treatment circle.To characterize the dose heterogeneities throughout thecircle, the hot and cold spots,H(x,y), were fit to the follow-ing form:
H~ x, y! 5 a 1 bx2 1 cy 1 d y2 (2)
and the coefficients were determined for each gantry anglerange and leaf width.
To model the effects of random intrafraction longitudinalpatient positioning variation, the extracted hot and cold spotpeaks were convolved with Gaussian distributions withstandard deviations of 1, 2, and 3 mm. The analytical fits tothe overlap data were used for the convolution, and theresulting peak heights were used to define the reduced hotand cold spots.
RESULTS
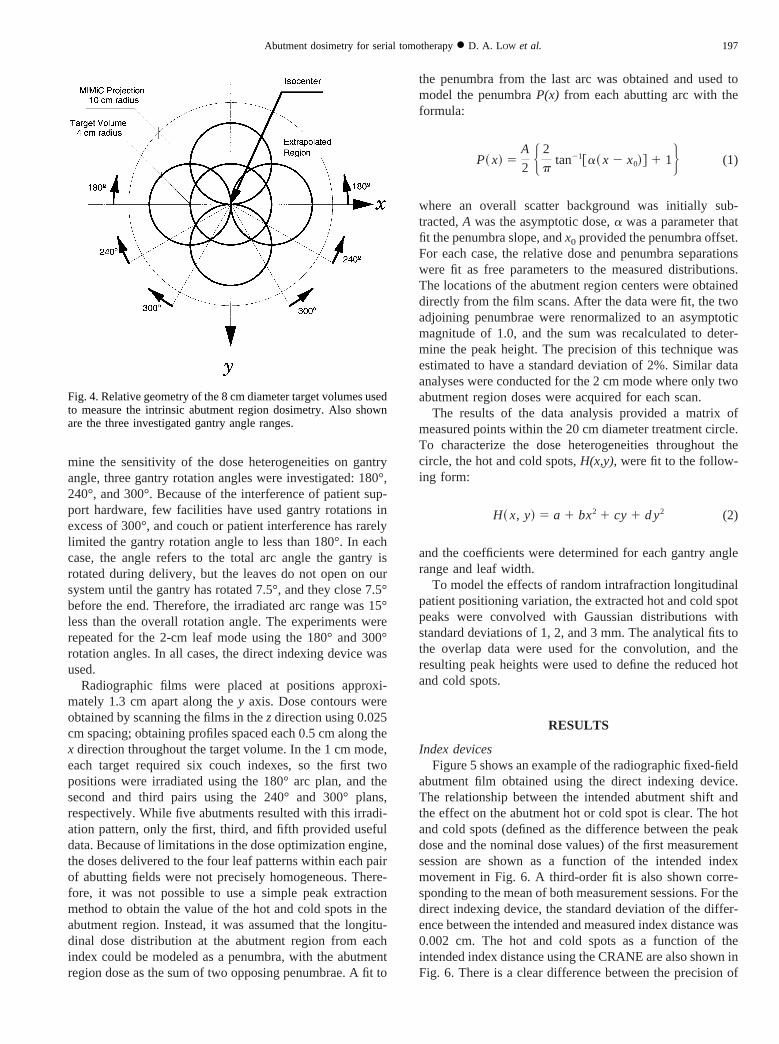
Index devicesFigure 5 shows an example of the radiographic fixed-field
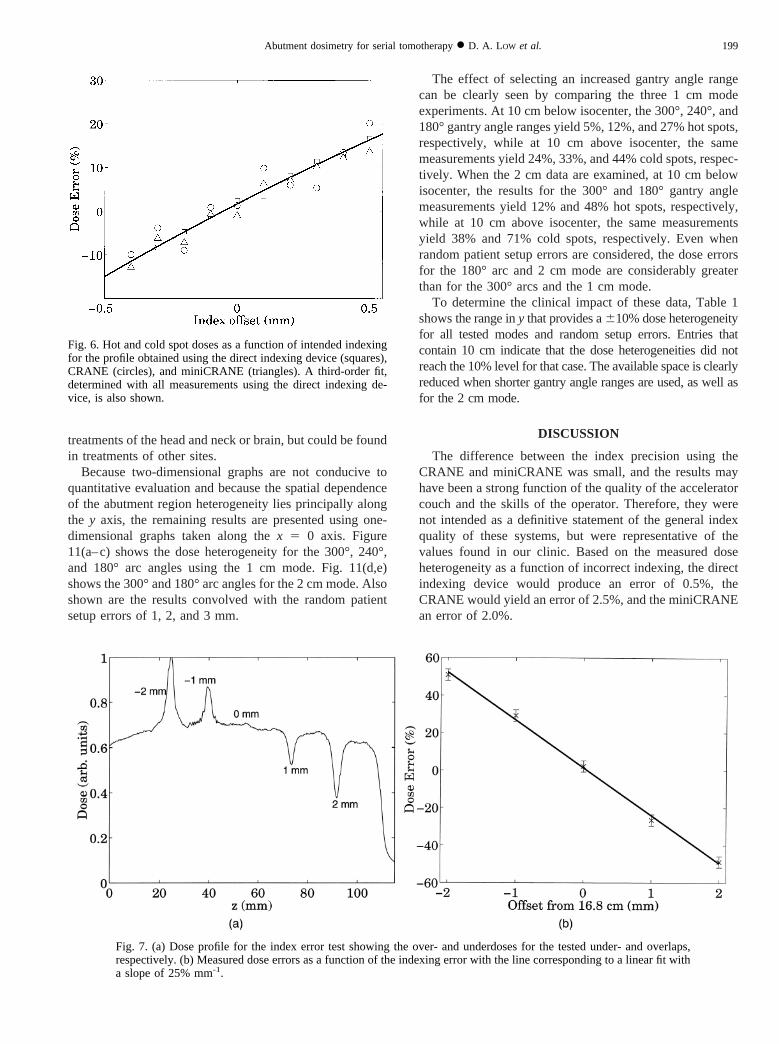
abutment film obtained using the direct indexing device.The relationship between the intended abutment shift andthe effect on the abutment hot or cold spot is clear. The hotand cold spots (defined as the difference between the peakdose and the nominal dose values) of the first measurementsession are shown as a function of the intended indexmovement in Fig. 6. A third-order fit is also shown corre-sponding to the mean of both measurement sessions. For thedirect indexing device, the standard deviation of the differ-ence between the intended and measured index distance was0.002 cm. The hot and cold spots as a function of theintended index distance using the CRANE are also shown inFig. 6. There is a clear difference between the precision of
Fig. 4. Relative geometry of the 8 cm diameter target volumes usedto measure the intrinsic abutment region dosimetry. Also shownare the three investigated gantry angle ranges.
197Abutment dosimetry for serial tomotherapy● D. A. LOW et al.
the CRANE and the direct indexing device, reflecting thestandard deviation of the difference between the intendedand measured distance of 0.010 cm. For the miniCRANE,the standard deviation of the difference between the in-tended and measured distance was 0.008 cm, slightly betterthan with the CRANE.
Index errorA doseprofile taken through the index error test is shown in
Fig. 7a, with the resulting hot and cold spots presented as afunction of the index error shown in Fig. 7b. A linear fit is alsoshown. The slope is equal to 25% mm-1, indicating the doseerror rate for small overlap errors. This is considerably largerthan the 10% mm-1 value quoted by Carolet al. (4) andindicates that great care must be taken to ensure that bothindexing accuracy and longitudinal patient stability are main-tained. Because the index accuracy was measured along thecentral axis (the region with the sharpest penumbra), it willexhibit the greatest sensitivity to index errors.
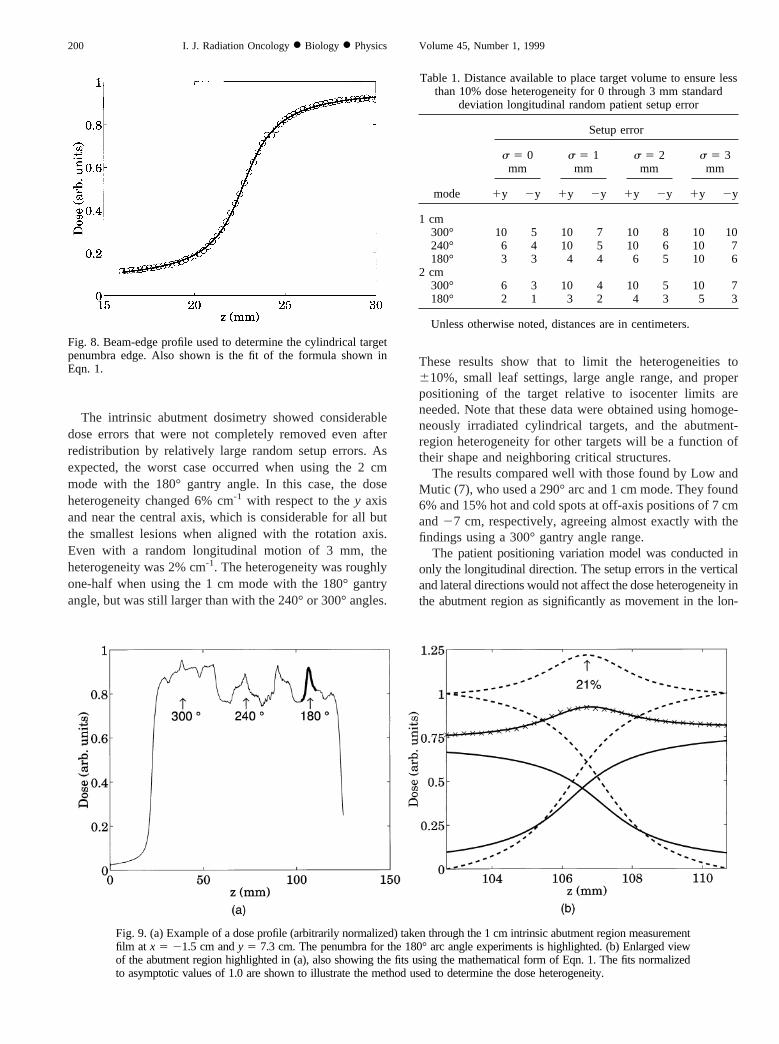
Intrinsic abutmentThe measured beam edge penumbra and corresponding fit
are shown in Fig. 8 and indicate that the arctangent functionadequately described the penumbra shape. An example of
one of the profiles taken through an abutment region isshown in Fig. 9a. The profile clearly shows the complexshape and differences of dose between the abutment re-gions. One of the abutment regions (180° arc, 1 cm mode)is highlighted for additional examination in Fig. 9b. The rawdata are shown, as well as the individual penumbra fits andthe resulting sum. For this example, the hot spot was mea-sured to be 21.7%6 2%.
Figure 10a shows a two-dimensional contour plot of thetwo-dimensional fit (Eqn. 2) to the 180° arc, 1 cm modedata. The fit was limited to the 20 cm diameter circlesubtended by the DMLC and the standard deviation differ-ence between the fit and the measured data was 2%, whichwas typical of the measurements. The relationship betweenthe dose heterogeneity and they position is significant andexpected, with cold and hot spots found at negative andpositive values ofy, respectively. A dependence on thexposition also exists, with off-axis positions exhibiting 10%lower doses than alongx 5 0. Fig. 10(b–d) shows theeffects of random patient setup errors on intrinsic doseheterogeneities. The peak values are significantly reducedwhen the standard deviation reaches 3 mm. Daily position-ing variation of this magnitude would not likely be found in
Fig. 5. Index test abutment film obtained using the direct indexing device.
198 I. J. Radiation Oncology● Biology ● Physics Volume 45, Number 1, 1999
treatments of the head and neck or brain, but could be foundin treatments of other sites.
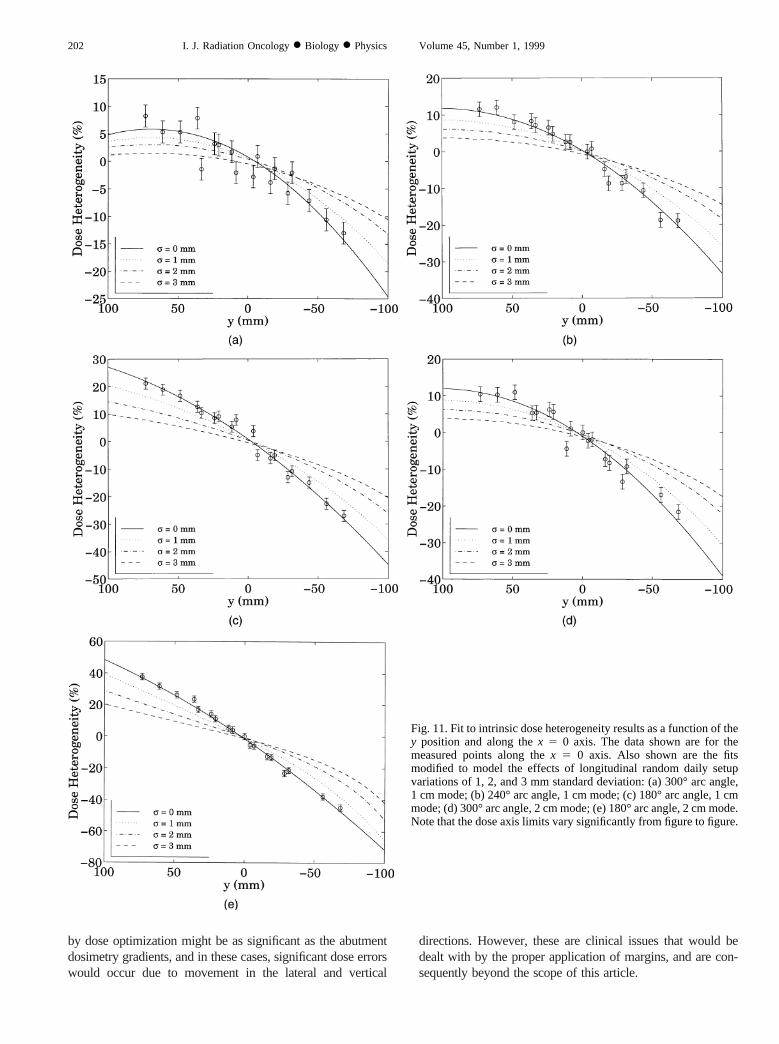
Because two-dimensional graphs are not conducive toquantitative evaluation and because the spatial dependenceof the abutment region heterogeneity lies principally alongthe y axis, the remaining results are presented using one-dimensional graphs taken along thex 5 0 axis. Figure11(a–c) shows the dose heterogeneity for the 300°, 240°,and 180° arc angles using the 1 cm mode. Fig. 11(d,e)shows the 300° and 180° arc angles for the 2 cm mode. Alsoshown are the results convolved with the random patientsetup errors of 1, 2, and 3 mm.
The effect of selecting an increased gantry angle rangecan be clearly seen by comparing the three 1 cm modeexperiments. At 10 cm below isocenter, the 300°, 240°, and180° gantry angle ranges yield 5%, 12%, and 27% hot spots,respectively, while at 10 cm above isocenter, the samemeasurements yield 24%, 33%, and 44% cold spots, respec-tively. When the 2 cm data are examined, at 10 cm belowisocenter, the results for the 300° and 180° gantry anglemeasurements yield 12% and 48% hot spots, respectively,while at 10 cm above isocenter, the same measurementsyield 38% and 71% cold spots, respectively. Even whenrandom patient setup errors are considered, the dose errorsfor the 180° arc and 2 cm mode are considerably greaterthan for the 300° arcs and the 1 cm mode.
To determine the clinical impact of these data, Table 1shows therange iny that provides a610% dose heterogeneityfor all tested modes and random setup errors. Entries thatcontain 10 cm indicate that the dose heterogeneities did notreach the 10% level for that case. The available space is clearlyreduced when shorter gantry angle ranges are used, as well asfor the 2 cm mode.
DISCUSSION
The difference between the index precision using theCRANE and miniCRANE was small, and the results mayhave been a strong function of the quality of the acceleratorcouch and the skills of the operator. Therefore, they werenot intended as a definitive statement of the general indexquality of these systems, but were representative of thevalues found in our clinic. Based on the measured doseheterogeneity as a function of incorrect indexing, the directindexing device would produce an error of 0.5%, theCRANE would yield an error of 2.5%, and the miniCRANEan error of 2.0%.
Fig. 6. Hot and cold spot doses as a function of intended indexingfor the profile obtained using the direct indexing device (squares),CRANE (circles), and miniCRANE (triangles). A third-order fit,determined with all measurements using the direct indexing de-vice, is also shown.
Fig. 7. (a) Dose profile for the index error test showing the over- and underdoses for the tested under- and overlaps,respectively. (b) Measured dose errors as a function of the indexing error with the line corresponding to a linear fit witha slope of 25% mm-1.
199Abutment dosimetry for serial tomotherapy● D. A. LOW et al.
The intrinsic abutment dosimetry showed considerabledose errors that were not completely removed even afterredistribution by relatively large random setup errors. Asexpected, the worst case occurred when using the 2 cmmode with the 180° gantry angle. In this case, the doseheterogeneity changed 6% cm-1 with respect to they axisand near the central axis, which is considerable for all butthe smallest lesions when aligned with the rotation axis.Even with a random longitudinal motion of 3 mm, theheterogeneity was 2% cm-1. The heterogeneity was roughlyone-half when using the 1 cm mode with the 180° gantryangle, but was still larger than with the 240° or 300° angles.
These results show that to limit the heterogeneities to610%, small leaf settings, large angle range, and properpositioning of the target relative to isocenter limits areneeded. Note that these data were obtained using homoge-neously irradiated cylindrical targets, and the abutment-region heterogeneity for other targets will be a function oftheir shape and neighboring critical structures.
The results compared well with those found by Low andMutic (7), who used a 290° arc and 1 cm mode. They found6% and 15% hot and cold spots at off-axis positions of 7 cmand27 cm, respectively, agreeing almost exactly with thefindings using a 300° gantry angle range.
The patient positioning variation model was conducted inonly the longitudinal direction. The setup errors in the verticaland lateral directions would not affect the dose heterogeneity inthe abutment region as significantly as movement in the lon-
Fig. 8. Beam-edge profile used to determine the cylindrical targetpenumbra edge. Also shown is the fit of the formula shown inEqn. 1.
Fig. 9. (a) Example of adose profile (arbitrarily normalized) taken through the 1 cm intrinsic abutment region measurementfilm at x 5 21.5 cm andy 5 7.3 cm. The penumbra for the 180° arc angle experiments is highlighted. (b) Enlarged viewof the abutment region highlighted in (a), also showing the fits using the mathematical form of Eqn. 1. The fits normalizedto asymptotic values of 1.0 are shown to illustrate the method used to determine the dose heterogeneity.
Table 1. Distance available to place target volume to ensure lessthan 10% dose heterogeneity for 0 through 3 mm standard
deviation longitudinal random patient setup error
mode
Setup error
s 5 0mm
s 5 1mm
s 5 2mm
s 5 3mm
1y 2y 1y 2y 1y 2y 1y 2y
1 cm300° 10 5 10 7 10 8 10 10240° 6 4 10 5 10 6 10 7180° 3 3 4 4 6 5 10 6
2 cm300° 6 3 10 4 10 5 10 7180° 2 1 3 2 4 3 5 3
Unless otherwise noted, distances are in centimeters.
200 I. J. Radiation Oncology● Biology ● Physics Volume 45, Number 1, 1999
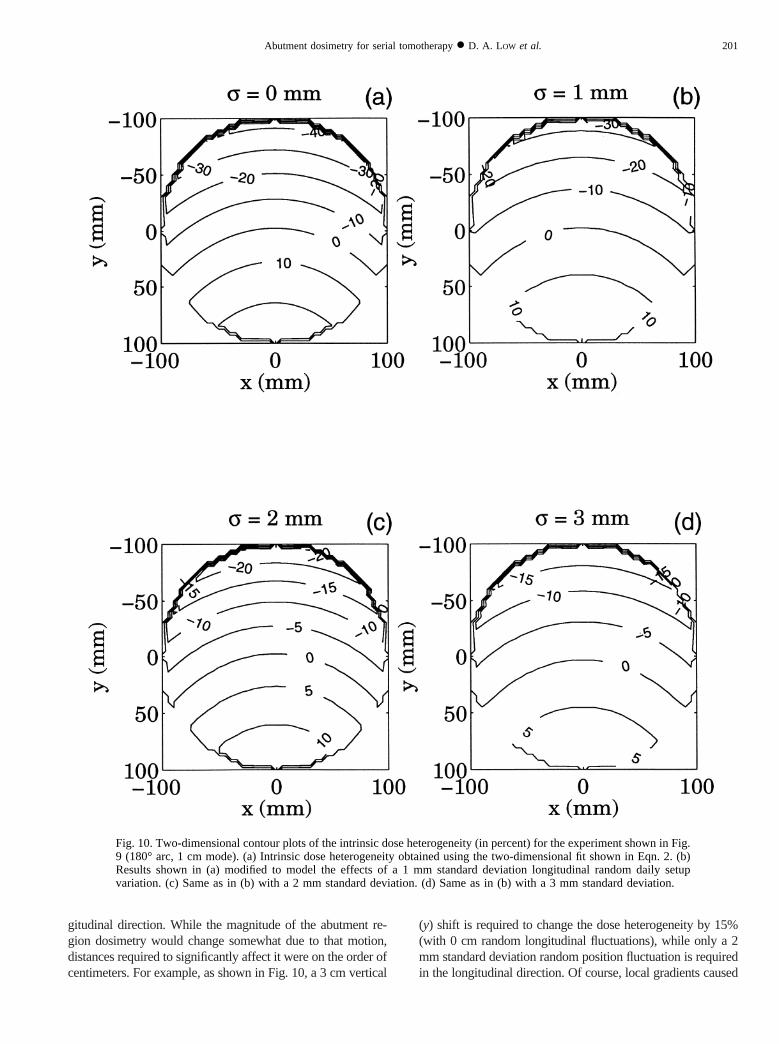
gitudinal direction. While the magnitude of the abutment re-gion dosimetry would change somewhat due to that motion,distances required to significantly affect it were on the order ofcentimeters. For example, as shown in Fig. 10, a 3 cmvertical
(y) shift is required to change the dose heterogeneity by 15%(with 0 cm random longitudinal fluctuations), while only a 2mm standard deviation random position fluctuation is requiredin the longitudinal direction. Of course, local gradients caused
Fig. 10. Two-dimensional contour plots of the intrinsic dose heterogeneity (in percent) for the experiment shown in Fig.9 (180° arc, 1 cm mode). (a) Intrinsic dose heterogeneity obtained using the two-dimensional fit shown in Eqn. 2. (b)Results shown in (a) modified to model the effects of a 1 mm standard deviation longitudinal random daily setupvariation. (c) Same as in (b) with a 2 mmstandard deviation. (d) Same as in (b) with a 3 mmstandard deviation.
201Abutment dosimetry for serial tomotherapy● D. A. LOW et al.
by dose optimization might be as significant as the abutmentdosimetry gradients, and in these cases, significant dose errorswould occur due to movement in the lateral and vertical
directions. However, these are clinical issues that would bedealt with by the proper application of margins, and are con-sequently beyond the scope of this article.
Fig. 11. Fit to intrinsic dose heterogeneity results as a function of they position and along thex 5 0 axis. The data shown are for themeasured points along thex 5 0 axis. Also shown are the fitsmodified to model the effects of longitudinal random daily setupvariations of 1, 2, and 3 mm standard deviation: (a) 300° arc angle,1 cm mode; (b) 240° arc angle, 1 cm mode; (c) 180° arc angle, 1 cmmode; (d) 300° arc angle, 2 cm mode; (e) 180° arc angle, 2 cm mode.Note that the dose axis limits vary significantly from figure to figure.
202 I. J. Radiation Oncology● Biology ● Physics Volume 45, Number 1, 1999
A simple remedy could be developed by the manufacturerto reduce the intrinsic heterogeneity by one-half. If the leaffluence distributions were delivered using alternate leafbanks, the heterogeneity would be redistributed throughoutthe patient. For example, on odd-numbered days, the treat-ment would be delivered as currently planned. On even-numbered days, rather than treat the first two leaf banksusing the first index, only the first leaf bank would be treatedusing an index offset by 0.84 cm. The other leaf bank wouldremain closed, as it intercepted the patient outside (gener-ally superior to) the treated volume. The patient would thenbe moved by the nominal index of 1.68 cm, and the fluencescorresponding to the second and third leaf banks would be
delivered. On odd-numbered days, the region between thesecond and third leaf banks would correspond to an abut-ment region, rather than lying along the beam central axis.The abutment region dosimetry would, therefore, be distrib-uted throughout the patient and reduced in magnitude. Thisremedy would ideally be implemented in conjunction with afully automated system for indexing the couch.
As an alternative, if the couch motion was remotelyautomated to high precision (60.1 mm), the couch could bemoved in concert with the gantry. This would enable thedelivery of spiral tomotherapy, distributing the abutmentdosimetry throughout the patient and correspondingly re-ducing its magnitude.
REFERENCES
1. Verellen D, Linthout N, Berge DVD,et al. Initial experiencewith intensity-modulated conformal radiation therapy fortreatment of the head and neck region.Int J Radiat Oncol BiolPhys1997;39:99–114.
2. Tsai J-S, Wazer DE, Ling MN,et al. Dosimetric verificationof the dynamic intensity-modulated radiation therapy of 92patients.Int J Radiat Oncol Biol Phys1998; 40:1213–1230.
3. Low DA, Chao KSC, Mutic S,et al. Quality assurance ofserial tomotherapy for head and neck patient treatments.Int JRadiat Oncol Biol Phys1998;42:681–692.
4. Carol M, Grant WH, Blier AR,et al. The field-matchingproblem as it applies to the Peacock three dimensional con-formal system for intensity modulation.Int J Radiat Oncol
Biol Phys1996;34:183–187.5. Wu A, Johnson M, Chen ASJ,et al. Evaluation of dose
calculation algorithm of the peacock system for multileafintensity modulation collimator.Int J Radiat Oncol Biol Phys1996; 36:1225–1231.
6. Low DA, Mutic S. A commercial IMRT treatment planningdose calculation algorithm.Int J Radiat Oncol Biol Phys1998;41:933–937.
7. Low DA, Mutic S. Abutment region dosimetry for sequentialarc IMRT delivery.Phys Med Biol1997;42:1465–1470.
8. Low DA, Gerber RL, Mutic S,et al.Phantoms for IMRT dosedistribution measurement and treatment verification.Int J Ra-diat Oncol Biol Phys1998;40:1465–1470.
203Abutment dosimetry for serial tomotherapy● D. A. LOW et al.