Sedimentological study of the Chernobyl NPP site to schematise radionuclide migration conditions

Paper
RETROSPECTIVE LUMINESCENCE DOSIMETRY:DEVELOPMENT OF APPROACHES TO APPLICATION IN
POPULATED AREAS DOWNWIND OF THE CHERNOBYL NPP
I. K. Bailiff,* V. F. Stepanenko,† H. Y. Goksu,‡ L. Bøtter-Jensen,§ V. Correcher,**A. Delgado,** H. Jungner,†† L. G. Khamidova,† T. V. Kolizshenkov,† R. Meckbach,‡
D. V. Petin,† M. Yu. Orlov,† and S. A. Petrov*
Abstract—The cumulative absorbed dose in fired-clay brickscollected from ten buildings in the populated contaminatedsettlement (137Cs, 1,470 kBq m�2) of Stary Vishkov, located 175km downwind of the Chernobyl Nuclear Power Plant (NPP) inthe Bryansk administrative region of Russia, was determinedusing luminescence techniques by five laboratories. At eachlocation, the cumulative dose, after subtraction of the naturalbackground dose, was translated to absorbed dose in air usingconversion factors derived from Monte Carlo simulations. Thesimulations employed source distributions inferred from con-temporary soil contamination data and also took into accountheterogeneity of fallout deposition. At four locations the cu-mulative dose at a reference location was calculated, enablingthe luminescence determinations to be compared directly withvalues of cumulative absorbed dose in air obtained usingdeterministic models. A “local” conversion factor was alsoderived from the Monte Carlo simulations for locations wherethe disturbance of soil was significant. Values of the “local”cumulative dose in air calculated using this factor werecompared with those predicted using the deterministic modelsat each sampled location, allowing location factors to becalculated. The methodology developed is generally applicableto populated areas contaminated by radioactive fallout inwhich brick buildings are found. The sensitivity of the lumi-nescence techniques for bricks from this region of Russia wassufficient to evaluate cumulative absorbed dose in brick due tofallout of less than 20 mGy.Health Phys. 89(3):233–246; 2005
Key words: Chernobyl; luminescence; dose, absorbed; fallout
INTRODUCTION
THE ACCIDENT at the Chernobyl Nuclear Power Plant(NPP) in April 1986 resulted in the dispersal of verysubstantial amounts of radioactive fallout within Europe,the highest depositional concentrations being withinBelarus, Russia, and Ukraine. The major sources ofpotential exposure (UNSCEAR 2000) to radiation forpeople living in such contaminated areas comprisedinternal sources due to ingested radionuclides (e.g., 131I,137Cs, and 134Cs) and external gamma-ray emittingsources (mainly 137Cs) dispersed within the environment.Due to the large scale of the contamination, the applica-tion of regular radiation monitoring was not feasible inmany populated settlements and the monitoring of 137Cscontamination in soils was sparse (see, for example, StateCommittee on Hydrometeorology of USSR 1990). Thequantity of interest in epidemiological studies is thecumulative dose since the onset of the delivery of fallout,and assumptions made concerning the nature and distri-bution of sources of radiation in such settlements, par-ticularly during the early post-accident period, are con-sequently of importance. Computational modeling, suchas that based on the application of deterministic models(Ministry of Public Health of Russian Federation 1996;Likhtarev et al. 2002), has played a central role in dosereconstruction because of its capability to take monitor-ing and survey data (e.g., radionuclide concentrations insoil) and calculate the absorbed dose for populationgroups on the basis of a specified radiation field and itsspatial and temporal variation. Hence the contributionsfrom short-lived radionuclides and radionuclide migra-tion in soil during the initial period following theaccident are factors that need to be taken into accountwhen using the models. Apart from a small number ofexceptions, previous studies have generally lacked anexplicit treatment of the early post accident stage (UN-SCEAR 2000). Moreover, contamination data obtainedat a later stage are not available in sufficient quantity for
* Luminescence Laboratory, Environmental Research Centre,University of Durham, South Road, Durham DH1 3LE, UK; † MedicalRadiological Research Center of RAMS, Korolev str. 4, Obninsk,249020 Russia; ‡ GSF-National Research Center for Environment andHealth, Institute of Radiation Protection, D-85764 Neuherberg, Ger-many; § Radiation Research Department, Risø National Laboratory,DK-4000 Roskilde, Denmark; ** CIEMAT, Dept. de Impacto Ambi-ental de la Energia, Avda. Complutense 22, 28040 Madrid, Spain;†† Dating Laboratory, University of Helsinki, 00014 Helsinki, Finland.
For correspondence or reprints contact: I. Bailiff, Luminescence Labo-ratory, Environmental Research Centre, University of Durham, South Road,Durham DH1 3LE, UK, or email at [email protected].
(Manuscript received 11 August 2004; revised manuscript re-ceived 4 February 2005, accepted 15 May 2005)
0017-9078/05/0Copyright © 2005 Health Physics Society
233
reliable interpretation and application to dose reconstruc-tion in many settlements (State Committee on Hydrome-teorology of USSR 1990). The general paucity of dataintroduces a potentially large source of uncertainty in thecalculation of cumulative dose. An additional source ofuncertainty that needs to be taken into account whenusing the models is the disturbance of soils duringclean-up operations, which usually caused significantchanges in the distribution of fallout.
In a previous work (Bailiff et al. 2004) that wasperformed in two heavily contaminated settlements(137Cs activity �1,300–7,000 kBq m�2 in 1986) we haveshown how retrospective luminescence dosimetry (RLD)can be used to provide determinations of cumulative dosein air due to gamma rays at a reference location since theonset of the delivery of fallout using ceramic environ-mental materials (brick). These values may be comparedwith calculated values obtained using computationalmodeling. In this study the methodology has been ap-plied to a settlement in the Bryansk Oblast,‡‡ Russia, thathas remained mostly or partially occupied since 1986.The levels of contamination are significantly lower (137Csactivity �900–2,100 kBq m�2 in 1986) in these settle-ments, and consequently the conditions are closer tothose in the numerous populated settlements downwindof the Chernobyl NPP where dose reconstruction studiesmay be required in the future.
METHODOLOGY
The experimental quantity determined using theluminescence method is the cumulative absorbed dose inbrick since its manufacture, DT. The quantity of interestin retrospective dosimetry is the cumulative absorbeddose since the onset of the delivery of fallout in thevicinity of a sampled building, DX (Bailiff 1997). Thelatter is obtained by calculating the difference betweenDT and the cumulative natural background dose, DBG,where
DX � DT � DBG . (1)
In this work DT was determined by applying establishedluminescence techniques with crystals of quartz ex-tracted from brick, and DBG was determined, in commonwith previous studies (e.g., Bailiff et al. 2004), bycalculating the product of the component dose rates dueto natural sources of radiation (radionuclides of litho-genic origin and cosmic rays) and the known age, Ayears, of the ceramic sample:
DBG � A�bD� � gD� � Dcos�. (2)
The terms bD� and gD� are the annual beta- andgamma-ray doses arising from natural sources of radia-tion for the quartz grains extracted from brick forluminescence measurements. The alpha dose can beneglected by selection of grains of sufficient size and theapplication of chemical etching treatments (ICRU 2002).The constants b and g are related to attenuation effectsand irradiation geometry respectively, and Dcos is theannual dose due to cosmic rays. Providing there is ameasurable difference between DT and DBG, the value ofDX is converted to absorbed dose in air at a referencelocation, RLDX, to allow comparisons with estimates ofcumulative dose arrived at by modeling calculations. Thereference location is defined as 1 m (in air) above anopen undisturbed grassed area (ICRU 2002). The expres-sion for RLDX is given by
RLDX � CRL � DX , (3)
where the conversion factor CRL, defined as the inverse ofthe ratio of the absorbed dose in brick to the air kerma atthe reference location, has been calculated for a range ofenergies and geometries on the basis of Monte Carlo(MC) simulations (Bailiff et al. 2004; ICRU 2002; Jacobet al. 2000).
When calculating RLDX using eqn (3), certain as-sumptions are made concerning the time-averaged sourceenergy and source configuration (Bailiff et al. 2004). Asdiscussed further below, the experimental evidence con-firms that the average energy of gamma rays emitted bythe artificial sources relevant to this study is in excess ofseveral hundred keV, and it has been established (Aitken1985) that less than 5% of the total energy emitted by theradionuclides of lithogenic origin is carried by photons ofenergy less than 100 keV. If this were not the case,special consideration would need to be given to thecalculation of CRL and also to the determination of DT.This is necessary because experimental determinations ofabsorbed dose by luminescence are performed using90Sr/90Y beta sources that are calibrated against a second-ary standard 137Cs photon source, and the mass energyabsorption coefficient for quartz (and other silicates)increases substantially for photon energies below 100keV (ICRU 1992).
The values of CRL are calculated for a particulardepth range in the brick wall assuming a homogeneousdistribution of radionuclides in the ground. As thedependence of CRL on the depth of penetration of falloutproducts in soil is weak (Jacob et al. 2000), no additionalcorrection related to the 137Cs profile was applied in thiswork. However, since the value of DX is affected byvariation in the spatial distribution of radionuclides in the
‡‡ Rayon and oblast are Russian terms used to describe adminis-trative and political units that are roughly equivalent to county andstate in the US, respectively.
234 Health Physics September 2005, Volume 89, Number 3

immediate vicinity of the building, a correction, Fh, wasmade for heterogeneity at each sampled location suchthat
RLDX � DX � CRL � Fh. (4)
The value of Fh was obtained for each sampled locationby performing MC simulations using a pattern of spatialvariation based on measurements of 137Cs concentrationin soil and/or in-situ radiation dose-rate measurementsperformed in the vicinity of the sampled brick wall(Bailiff et al. 2004). For the study discussed here it wasalso necessary to introduce an alternative conversionfactor, C25m, defined as the inverse of the ratio of theabsorbed dose in brick to the air kerma averaged to adistance of 25 m from the sample location. This factorwas applied where evidence of heterogeneity and/ordisturbance at greater distances from the building wasobtained to an extent that would make the calculation ofCRL unreliable. In these cases, eqn (4) becomes
25mDX � DX � C25m � Fh , (5)
and 25mDX represents the cumulative “local” dose.A further aspect of the methodology is the measure-
ment of a depth-dose profile in brick, the form of whichprovides a means of confirming the presence of externalartificial sources of radiation. Although the depth-doseprofile due to the latter may be difficult to resolve fromthat due to natural sources of radiation if DX is much lessthan DBG, the determination of DT at greater depths inbrick allows the reliability of the value of DBG calculatedusing eqn (2) to be checked. At depths of 120 mm and240 mm, which correspond to the rear layers of the bricksof the outer and inner walls in a typical domesticbuilding, the value of DX is expected to reduce by factorsof �5 and �10, respectively, assuming sources ofenergy 662 keV were deposited on the ground (ICRU2002). In this work, determinations of DT were obtainedfor a minimum of three depths, typically at 10, 60, and100 mm from the exposed surface. It should be noted that
RLDX is usually calculated (eqn 4) using determinationsof DX for the sub-surface brick (i.e., 5–15 mm) since theuncertainty in DX and CRL increases with depth.
Lastly, estimates of the cumulative gamma dose atthe reference location, RLDcal, were obtained for compar-ative purposes using deterministic models developed forRussian settlements (Bailiff et al. 2004). They werecalculated using the expression
RLDcal � D� � Aa , (6)
where Aa is the average 137Cs activity in the soil,expressed as an areal activity (kBq m�2), and D� is acoefficient (mGy per kBq m�2) that represents the
cumulative absorbed dose in air at the reference locationsince the onset of the arrival of the fallout, normalized tounit of areal activity due to 137Cs.
FIELDWORK
Study siteThe large settlement of Stary Vishkov, known to
contain brick buildings that had been continuously orpartially inhabited since the accident, was selected forstudy. It is 175 km from the Chernobyl NPP, located inNovozybkovskiy Rayon, Bryansk Oblast, Russia (Fig.1), where the town of Novozybkov is the administrativecenter of the rayon. During reconnaissance of the settle-ment detailed maps of the physical layout and falloutdistribution in the settlement were examined, and gammadose rates in air were checked. The survey included anexamination of the type and location of buildings, thegathering of photographic evidence, the examination ofarchived records of building construction, details ofinhabitants, and dates of construction (and margin ofuncertainty) of potentially suitable buildings. The docu-mented construction dates of sampled buildings rangedfrom 1961 to 1978, and investigation of local adminis-tration records and discussions with relevant officialsindicated that the time between manufacture and use ofbrick was relatively short.
Fig. 1. Map of the region showing the location of Stary Vishkovand its relationship to the Chernobyl NPP. The locations of thesettlements of Visnianoje and Zaborie that were the subject of aprevious study (Bailiff et al. 2004) are also shown.
235Retrospective luminescence dosimetry ● I. K. BAILIFF ET AL.

Stary Vishkov, RussiaThe settlement of Stary Vishkov (31°39�E
52°25�N), which in 1986 had a population of 801 (and757 in 1989), contains about 300 dwellings, and thepublished mean soil 137Cs ground deposition density forthe settlement in 1986 was 1,470 kBq m�2. The largerscale heterogeneity of fallout deposition within the set-tlement was assessed using gamma dose rate and soilactivity monitoring data obtained from May 1986 on-wards and performed periodically until 1990 (StateCommittee on Hydrometeorology of USSR 1990). Theinventory of fallout products, determined by gamma-rayspectrometry performed in air and with samples of soilduring the period following the onset of fallout delivery,was also examined (SPA “TYPHOON” database, Obn-insk, Russia). Dose-rate monitoring records enabledhouses and buildings where clean-up operations had beenperformed to be identified (and avoided). Ten buildingsjudged to be typical of living and working environmentsfor the inhabitants of Stary Vishkov were selected forsampling (Table 1), and their locations within the settle-ment are shown in Fig. 2.
Sample collection and ancillary measurements
Brick samples. In general, samples of brick weretaken at a standard height of 1 m above ground level, andthe samples were extracted using either a diamond corer(�50 mm diameter) or by removal of whole bricks,depending on the particular conditions. Care was taken toavoid excessive heating during drilling. The samples, onceextracted, were marked and immediately double wrapped inthick black polythene bags. Sample locations were photo-graphed and the overall dimensions of the building anddetails of the sampled area were recorded. Examples ofthree buildings sampled are shown in Fig. 3a–c.
Dose-rate monitoringThe gamma dose rate, measured with an Automess
meter 6150-AD-1 and a GM probe type 18 (AutomessGmbH, Daimlerstrasse 27, D-68526 Ladenburg, Ger-many), was recorded at the sampling location and also atintervals along one or more lines orthogonal to thesampled wall extending up to �40 m at heights of �20cm and �1 m above the ground surface. In the case ofabandoned buildings, monitoring of the interior of thebuilding was also performed to check for the presence ofconcentrated radioactive fallout in organic matter. Sam-pling locations having a preferably smooth and horizon-tal ground surface with the least variation in dose ratewithin the above area were sought. To establish thecharacteristics of the contemporary gamma-ray radiationfield in air within Stary Vishkov, the gamma-ray spec-trum was measured using a portable gamma-ray spec-trometer (Silena International Spa, Via Firenze, 3-20063Cernusco sul Naviglio, Italy) comprising a multi-channelanalyzer (type SNIP 204) coupled to a detector probewith 2-inch cylindrical NaI(Tl) scintillator at a height of�1 m above the ground surface at distances of �0.1 and10 m from the sampled wall.
Soil samplesSamples of soil were obtained to a depth of 20–25 cm
using a soil corer to determine 137Cs concentration and toinvestigate both spatial heterogeneity and variation of ac-tivity with depth. Additionally, a scintillometer (Russianmanufacture, type SRP 68-01) was placed in cored holes atdifferent depths to provide an approximate assessment ofthe radionuclide activity profile and to check for distur-bance. The soil cores were obtained at points within arectangular area contained between 1 m and 12 m from thewall and extending 5–10 m on either side of the brick
Table 1. Values of DT, DBG, DX and building age for sites in Stary Vishkov. Uncertainties are standard errors of theunweighted mean values (68% level of confidence; n corresponds to the number of determinations of DT). The averagevalues of DX are shown for the depth range in brick indicated. The uncertainty associated with DX is the overall errorbased on an assessment of random experimental errors and estimated systematic errors. PR indicates private residence.
Location Age (y)
DT
5−15 mm(mGy) n
DBG
5−15 mm(mGy)
DX
5−15 mm(mGy)
DX
40−60 mm(mGy)
DX
90−110 mm(mGy)
55; Poultry farm 27 � 1 208 � 5 4 72 � 5 136 � 15 61 � 11 19 � 910 � 8a
56; Club shop 34 � 1 177 � 5 5 124 � 7 53 � 15 14 � 20 11 � 1457; Pig farm 35.5 � 2.5 195 � 8 5 144 � 11 51 � 19 9 � 21 5 � 1858; Stable 28 � 1 306 � 25 5 127 � 11 179 � 33 63 � 24 39 � 2059; Bath house 30 � 1 214 � 11 5 82 � 6 132 � 18 85 � 23 57 � 1360; 6 Lenina Str. (PR) 37.5 � 1 248 � 5 5 142 � 5 106 � 18 81 � 19 57 � 2961; School, garage 20 � 1 218 � 6 5 75 � 4 143 � 15 81 � 15 69 � 1162; 81 Lenina Str. (PR) 20.5 � 1 194 � 14 5 86 � 5 108 � 19 25 � 12 5 � 1163; 41 Lenina Str. (PR) 23.5 � 1 195 � 13 4 89 � 5 106 � 19 20 � 11 4 � 965; 45 Mira Str. (PR) 23.5 � 1 165 � 3 5 64 � 5 101 � 12 36 � 9 14 � 8
a DX (160–170 mm), inner wall.
236 Health Physics September 2005, Volume 89, Number 3

sampling location. The standard sampling pattern com-prised 9 points, but this varied depending on the degree ofdisturbance in the vicinity of the sampled building. The soilcores were cut into slices of 2 cm thickness for cores up to�20 cm deep (or 5 cm where deeper cores were required)and then individually bagged for 137Cs activity profilemeasurements. Soil deeper than the base of the core wasalso collected to provide an uncontaminated sample forassessment of the concentration of radionuclides of litho-genic origin (238U, 232Th, and 40K).
EXPERIMENTAL PROCEDURES
Luminescence
Sample extraction. A common approach was em-ployed in cutting the brick samples, but luminescence
measurement laboratories applied their preferred extrac-tion procedures for sample preparation. The brick sam-ples were cut using a water-lubricated diamond blade toproduce slices with central depths located at 10, 60, and100 mm from the front surface of the brick. Finer depthresolution was used in some cases, depending on theyield of quartz grains from the ceramic. Clay andcrystalline mineral grains were extracted from the slicesusing mechanical crushing and sieving procedures; thequartz grains were then isolated using the quartz inclu-sion technique that originally had been developed forarchaeological dating applications (Aitken 1985, 1998).Following this approach, grains within the size range90–150 �m (or greater) were subjected to a hydrofluoricacid (40%) etching treatment that removed the outerlayer of the grains and also other silicate minerals; a
Fig. 2. Plan of Stary Vishkov showing the layout of the settlement, where the following shaded areas indicate: 1)dwellings; 2) a cattle farm; 3) a farm mechanical workshop and granary; 4) a cattle farm; and 5) a cemetery. Roads(thicker black line), streets (black line) and streams (thin black line) are also shown. The location of each sampledbuilding is indicated by a filled circle and location number (e.g., L59). The isolines (grey) represent the exposure-ratemeasured in 1989, as indicated (�R h�1), where the exposure rate is a historical unit; to convert to exposure rate in SIunits (C kg h�1) multiply the values shown by 2.58 � 10�10 (C kg h�1 per �R h�1).
237Retrospective luminescence dosimetry ● I. K. BAILIFF ET AL.

heavy liquid separation procedure was also applied topurify the quartz fraction where required. By removingthe outer layer of the grains, the absorbed dose contri-bution from alpha particles emitted by radionuclides inthe brick fabric (238U, 232Th, and progeny) is reduced to anegligible level (Aitken 1985).
Determination of DTDT was determined by applying three luminescence
techniques (Bailiff et al. 2000) to quartz extracted frombrick. The three techniques applied are based on differentluminescence mechanisms associated with quartz: 1) the210°C thermoluminescence (TL) peak (Bailiff and Petrov1999); 2) optically stimulated luminescence (OSL) where
the stimulation wavelength range �450–550 nm (Bøtter-Jensen et al. 2000); and 3) the pre-dose sensitization of the110°C TL peak (Haskell and Bailiff 1985; Bailiff 1991).The experimental work was undertaken by the following sixmeasurement groups using apparatus in five laboratories toevaluate the consistency of techniques based on differentluminescence mechanisms: Ciemat, Madrid (CIEMAT),Luminescence Dosimetry Laboratory, University ofDurham, UK (UDUR), Research Center for Environmentand Health, Germany (GSF), Dating Laboratory, Universityof Helsinki, Finland (UHEL), Medical and EcologicalDosimetry Laboratory of Medical Radiological ResearchCentre, Obninsk, Russia (MRRC), and National Labora-tory, Roskilde, Denmark (RISØ).
Fig. 3. Examples of sampled buildings in Stary Vishkov: a) The poultry farm (Loc. 55), where the sampled wall is on the rightas indicated (circle) and where the white (unfired) bricks forming the lower half of the gable end wall are fabricated fromcalcium silicate; b) The Club Shop (Loc. 56) that is located within several meters of cultivated land; c) An outbuildingbelonging to a private residence located at 45 Mira Street (Loc. 65). The insets in b) and c) show the location of the cores.
238 Health Physics September 2005, Volume 89, Number 3

The luminescence measurements were performedusing semi-automated readers of similar type manufac-tured by RISØ (Bøtter-Jensen 1997). Beta radiationsources that had been calibrated against a commonsecondary standard photon source (Goksu et al. 1995)were used to administer known doses to quartz samples.The MRRC laboratory performed their measurementsusing equipment located in the UHEL laboratory.
Determination of DBGA combination of direct and indirect methods was
applied to crushed brick and soil samples to determineDBG. Application of the indirect methods of high-resolution gamma-ray spectrometry (e.g., Murray et al.1987) and thick source alpha counting (TSAC, seeAitken 1998) provided concentrations of the radionu-clides of lithogenic origin 238U, 232Th, and 40K (notmeasured by TSAC) in brick and (uncontaminated) soilsamples; the gamma-ray spectra were also examined fordeparture from secular equilibrium between the progenyof 238U (234Th, 214Pb, and 214Bi) and 232Th (228Ac, 212Bi,212Pb, and 208Tl). The values of concentration and/orspecific activity were converted to point-absorberinfinite-medium dose rates in brick using publishedconversion data (e.g., Adamiec and Aitken 1998). Thedirect method of beta thermoluminescence dosimetry(�-TLD; Bailiff and Aitken 1980; Goksu et al. 1999) wasapplied to samples of crushed brick, yielding the point-absorber infinite-medium beta dose rate within the sam-ple measured.
Radionuclide content of contaminated soilsThe concentrations of 137Cs and radionuclides of
lithogenic origin (214Bi, 214Pb, 228Ac, 212Pb, 212Bi, 208Tl,and 40K) were determined by gamma-ray emission spec-trometry within their country of origin with air-dried soilsamples. The bulk activity was measured (MRRC) usinga spectrometer based on NaI(Tl) scintillation detectorsand detailed spectra were measured using a spectrometerwith a high purity Ge detector. Further details of theapparatus are given in Bailiff et al. (2004).
Conversion from dose in brick to dose in airMonte Carlo (MC) simulations of photon transport
(Lichtenstein et al. 1979) were performed to obtain theconversion factor, CRL, and the correction factor, Fh,following a procedure similar to that described previ-ously (Bailiff et al. 2004). On the basis of experimentalevidence obtained (see below), it was assumed that thedominant contribution to the absorbed dose from artifi-cial radionuclides was due to primary gamma rays oftime-averaged energy comparable to that of 137Cs (i.e.,662 keV). The main contributors to the absorbed dose
due to fallout were assumed to be radionuclides depos-ited on the ground and distributed within soil to depths ofbetween of 1 and 6 g cm�2, and that contributions fromsources located in clouds were not significant. The valuesof CRL were calculated for the outer depth-range sampledat each location (in most cases 5–15 mm from the outersurface) assuming the above source configuration andenergy. Since, with only four exceptions, the soils in thepopulated settlements were generally disturbed, it wasjudged inappropriate to extrapolate the measurements inbrick to the reference location by application of theconversion factor CRL. To avoid this problem the conver-sion factor C25m was calculated using MC simulationssimilar to those performed to obtain CRL (Jacob et al.2000).
The correction factor for heterogeneity, Fh, wascalculated for each sampled location by specifying in theMC simulations a pattern of variation in fallout distribu-tion that was derived from the results of measurements of137Cs concentration in soil and/or in-situ dose-rate mea-surements for the area adjacent to the sampled location.
RESULTS AND ANALYSIS
Determination of absorbed dose in brickThe mean values and associated uncertainties for the
cumulative dose determined using luminescence (DT),the cumulative natural background dose (DBG), and thecumulative dose due to fallout (DX) for samples fromeach location in Stary Vishkov are given in Table 1. Themean values of DT shown in the table were obtained forslices cut within the depth range 5–15 mm from theexposed surface of the brick. Some laboratories were notable to produce reliable results for all samples using theirpreferred technique (e.g., due to insufficient sensitivity)and some did not participate in the measurement of allsamples. Each value of DT given in the table correspondsto the average of the number of determinations indicatedin the adjacent column and the associated uncertainty isthe standard error of the mean value, given as a measureof precision. The calculation of a weighted average wasconsidered but rejected following a statistical analysis ofthe results for each location which indicated that, on thebasis of the precision values supplied each laboratory(some �2% or better), the determinations were nothomogeneous (Scott et al. 1992). The differences that layoutside the given limits of precision were attributed tounidentified sources of systematic error. The averagecoefficient of variation for all the locations is 9% (range,4–16%) and this is comparable with the level of inter-laboratory agreement that was obtained in a related studyusing similar TL and OSL procedures with quartz,
239Retrospective luminescence dosimetry ● I. K. BAILIFF ET AL.

although the levels of absorbed dose were significantlyhigher (Bailiff et al. 2004).
Determination of DBGThe values of DBG for the depth range 5–15 mm of
each sample (Table 1) were obtained by evaluating eqn(2) and using a procedure (Bailiff et al. 2004) thatassesses components of DBG due to 1) beta emitterswithin the brick, 2) gamma emitters within the wallstructure, 3) gamma emitters located in soil below thebuilding and adjacent to the wall, and 4) cosmic rays. Itwas assumed that gamma emitters located elsewherewithin the building and the underlying soil 3 m beyondthe sampled wall could be neglected to a first approxi-mation. The age, A, of each building, based on documen-tary records and interviews of residents, is also given inthe table. The beta dose rate, bD�, due to naturallyoccurring radionuclides in the brick was obtained bycalculating the average value of the results producedusing the direct and indirect techniques referred to above.The results of high-resolution gamma-ray spectrometryindicated that there was no significant departure fromsecular equilibrium associated with the uranium andthorium decay chains (in both brick and soil samples).An 8% reduction of the point-absorber beta dose-rateswas made to account for attenuation effects due to thefinite size of the quartz grains (Mejdahl 1979). Estimatesof the total gamma dose rate were obtained using eqn (8)given in Bailiff et al. (2004), into which the values of thevarious parameters, as discussed above, were inserted.The cosmic ray dose was estimated to be approximately0.15 mGy y�1 at a depth of 10–25 mm behind the surfaceof a brick wall using data presented by Prescott and Hutton(1988), and in the case of the oldest building (Loc. 60), forexample, it contributes less than 6 mGy to DBG.
Calculation of DXThe values of DX for each location (Table 1) were
calculated by substituting the relevant values of DT andDBG into eqn (1), where the value of DT in each case wasthe average of values determined for slices located withinthe three depth ranges indicated: 5–15, 40–60, and90–110 mm. For brevity, the values of DT and DBG forthe latter two depths are not given. The uncertaintyassociated with DX is the overall error (68% level ofconfidence) based on an assessment of random experi-mental errors and estimated systematic errors (Bailiff1997). Examples of experimental results that illustratethe variation of DT, DBG, and DX with depth at threeselected depths are shown for Locs. 55 and 56 in Fig. 4aand b. The form of the expected reduction of DX withdepth obtained by calculation for sources of energy 662keV distributed on the ground to a depth of 6 g cm�2 is
indicated (dotted line). Despite the relatively low spatialresolution of the profile, the experimental data aregenerally consistent with calculation within the limits ofexperimental error. At both locations it can be seen thatthe values of DX at the greatest depths tested areconsistent with expectation, and it is to be noted thatthese are at levels of dose below 20 mGy. As discussedpreviously (Bailiff et al. 2004), the shape of the depth-dose profile is dependent on both the source energy andconfiguration of the sources, and hence the information itprovides concerning the source energy is not definitive.
Conversion from dose in brick to dose in airThe values of the combined conversion factors,
C25m�Fh, and CRL�Fh, where appropriate, are given inTable 2, together with an indication of the main charac-teristics of the extent of the heterogeneity of fallout
Fig. 4. Depth-dose profiles in brick for Locations a) 55 and b) 56showing values of DT (filled diamonds), DBG (filled circles), andDX (filled triangles) at three or more depths from the surface of theexposed brick. The depth-dose profile (small open circles), calcu-lated by MC simulation for E 662 keV and assuming that thesources are distributed on the ground to a depth of 1–6 g cm�2,normalized to the value of DX for the outermost sample, is alsoshown for comparison. Where the depth is greater than �125 mm,the sample was extracted from an inner wall.
240 Health Physics September 2005, Volume 89, Number 3
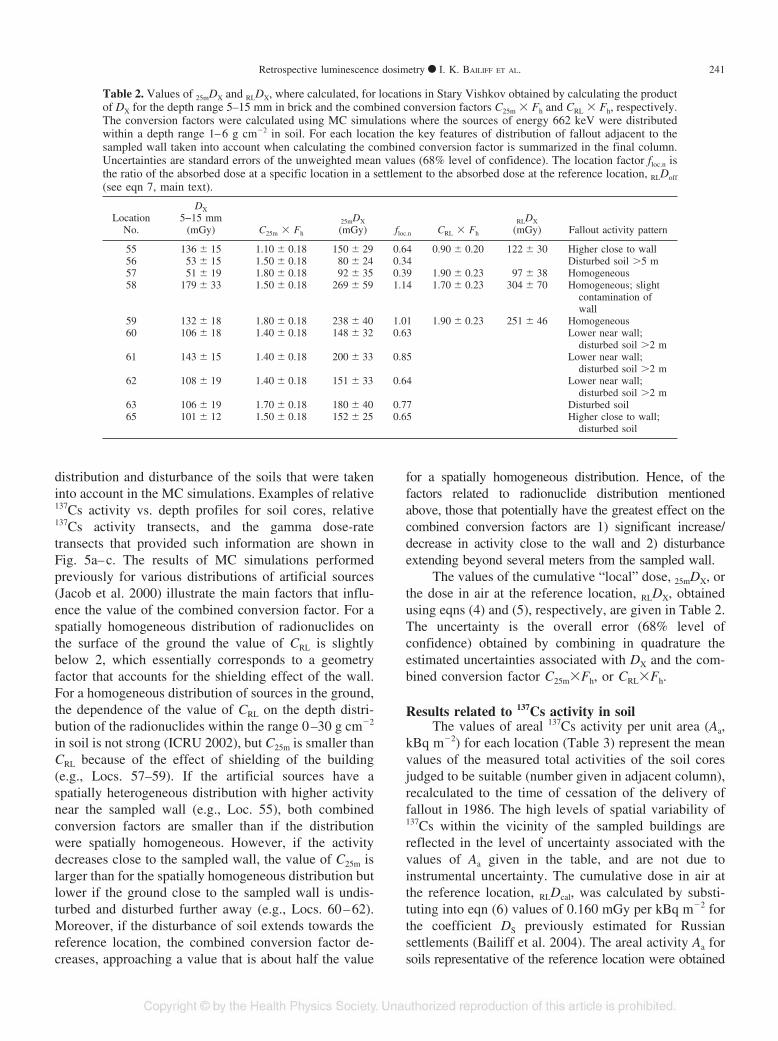
distribution and disturbance of the soils that were takeninto account in the MC simulations. Examples of relative137Cs activity vs. depth profiles for soil cores, relative137Cs activity transects, and the gamma dose-ratetransects that provided such information are shown inFig. 5a–c. The results of MC simulations performedpreviously for various distributions of artificial sources(Jacob et al. 2000) illustrate the main factors that influ-ence the value of the combined conversion factor. For aspatially homogeneous distribution of radionuclides onthe surface of the ground the value of CRL is slightlybelow 2, which essentially corresponds to a geometryfactor that accounts for the shielding effect of the wall.For a homogeneous distribution of sources in the ground,the dependence of the value of CRL on the depth distri-bution of the radionuclides within the range 0–30 g cm�2
in soil is not strong (ICRU 2002), but C25m is smaller thanCRL because of the effect of shielding of the building(e.g., Locs. 57–59). If the artificial sources have aspatially heterogeneous distribution with higher activitynear the sampled wall (e.g., Loc. 55), both combinedconversion factors are smaller than if the distributionwere spatially homogeneous. However, if the activitydecreases close to the sampled wall, the value of C25m islarger than for the spatially homogeneous distribution butlower if the ground close to the sampled wall is undis-turbed and disturbed further away (e.g., Locs. 60–62).Moreover, if the disturbance of soil extends towards thereference location, the combined conversion factor de-creases, approaching a value that is about half the value
for a spatially homogeneous distribution. Hence, of thefactors related to radionuclide distribution mentionedabove, those that potentially have the greatest effect on thecombined conversion factors are 1) significant increase/decrease in activity close to the wall and 2) disturbanceextending beyond several meters from the sampled wall.
The values of the cumulative “local” dose, 25mDX, orthe dose in air at the reference location, RLDX, obtainedusing eqns (4) and (5), respectively, are given in Table 2.The uncertainty is the overall error (68% level ofconfidence) obtained by combining in quadrature theestimated uncertainties associated with DX and the com-bined conversion factor C25m�Fh, or CRL�Fh.
Results related to 137Cs activity in soilThe values of areal 137Cs activity per unit area (Aa,
kBq m�2) for each location (Table 3) represent the meanvalues of the measured total activities of the soil coresjudged to be suitable (number given in adjacent column),recalculated to the time of cessation of the delivery offallout in 1986. The high levels of spatial variability of137Cs within the vicinity of the sampled buildings arereflected in the level of uncertainty associated with thevalues of Aa given in the table, and are not due toinstrumental uncertainty. The cumulative dose in air atthe reference location, RLDcal, was calculated by substi-tuting into eqn (6) values of 0.160 mGy per kBq m�2 forthe coefficient DS previously estimated for Russiansettlements (Bailiff et al. 2004). The areal activity Aa forsoils representative of the reference location were obtained
Table 2. Values of 25mDX and RLDX, where calculated, for locations in Stary Vishkov obtained by calculating the productof DX for the depth range 5–15 mm in brick and the combined conversion factors C25m � Fh and CRL � Fh, respectively.The conversion factors were calculated using MC simulations where the sources of energy 662 keV were distributedwithin a depth range 1–6 g cm�2 in soil. For each location the key features of distribution of fallout adjacent to thesampled wall taken into account when calculating the combined conversion factor is summarized in the final column.Uncertainties are standard errors of the unweighted mean values (68% level of confidence). The location factor floc.n isthe ratio of the absorbed dose at a specific location in a settlement to the absorbed dose at the reference location, RLDoff
(see eqn 7, main text).
LocationNo.
DX
5−15 mm(mGy) C25m � Fh
25mDX
(mGy) floc.n CRL � Fh
RLDX
(mGy) Fallout activity pattern
55 136 � 15 1.10 � 0.18 150 � 29 0.64 0.90 � 0.20 122 � 30 Higher close to wall56 53 � 15 1.50 � 0.18 80 � 24 0.34 Disturbed soil 5 m57 51 � 19 1.80 � 0.18 92 � 35 0.39 1.90 � 0.23 97 � 38 Homogeneous58 179 � 33 1.50 � 0.18 269 � 59 1.14 1.70 � 0.23 304 � 70 Homogeneous; slight
contamination ofwall
59 132 � 18 1.80 � 0.18 238 � 40 1.01 1.90 � 0.23 251 � 46 Homogeneous60 106 � 18 1.40 � 0.18 148 � 32 0.63 Lower near wall;
disturbed soil 2 m61 143 � 15 1.40 � 0.18 200 � 33 0.85 Lower near wall;
disturbed soil 2 m62 108 � 19 1.40 � 0.18 151 � 33 0.64 Lower near wall;
disturbed soil 2 m63 106 � 19 1.70 � 0.18 180 � 40 0.77 Disturbed soil65 101 � 12 1.50 � 0.18 152 � 25 0.65 Higher close to wall;
disturbed soil
241Retrospective luminescence dosimetry ● I. K. BAILIFF ET AL.

by calculating the average of the activities measured be-tween �6 m and �12 m from the sampling location wherethe degree of heterogeneity was generally lower.
As indicated in Fig. 5a–c (1), most of the locationsexhibited signs of disturbance, characterized by an ap-parent migration of radionuclides to deeper layers (e.g.,
Fig. 5. Characteristics of the deposition of 137Cs in soil in the areas adjacent to sampled buildings at Locations a) 55,b) 56, and c) 65 in Stary Vishkov, showing 1) the 137Cs activity profile at different distances from the sampled wall, 2)the activity transect and 3) the dose-rate transect.
242 Health Physics September 2005, Volume 89, Number 3

Loc. 56, 6 m), but undisturbed soils were also found (e.g.,Loc. 55, 6 m). Changes in the 137Cs activity profile atdifferent distances from a building can be detectedproviding the soil samples are not pooled (Fig. 5a,b (1)for Locs. 55 and 56, respectively) and in the case of Loc.55, for example, the change is progressive movingtowards the wall. The gamma dose-rate monitoring [Fig.5a–c (3)] extends these data by providing a qualitativeindication of whether the determinations of areal 137Csactivity for soil at 12 m are representative of the sector ofthe settlement in which the sampled building is located.As discussed above, both types of measurement providedata needed to assess whether the conversion of DX to thereference location is likely to be reliable.
DISCUSSION
Compared with our previous study (Bailiff et al.2004) where a similar luminescence methodology wasapplied to heavily contaminated settlements, DBG is amuch larger fraction of DT (�50%) in Stary Vishkov,and as a consequence the calculation of DX is moresensitive to uncertainty in DBG, particularly as DT ap-proaches the level of DBG (Bailiff 1997). At one location(Loc. 55) it was possible to check the value of DBG bycomparing its value with DX determined at heavilyshielded depths, and the agreement obtained (Table 1;Fig. 4a) suggests that the procedures used are reliable.Although the depth-dose profiles do not provide defini-tive confirmation of source energy and configurationthey are consistent with the calculated curves for external137Cs sources distributed in the sub-surface layers of soil,and support the use of the conversion factors based onMC simulations assuming this source energy and config-uration. The combined conversion factors that incorpo-rate corrections for heterogeneity have an estimated
uncertainty of between �10% and �16% for locations inStary Vishkov. We consider that this is reasonable giventhat they are based on measured values of soil activityand dose-rate monitoring adjacent to each sampled loca-tion.
The experimentally-derived values of RLDX (Table2), plotted against the corresponding values of areal 137Csactivity (Table 3) for each of the four locations in StaryVishkov, are shown in Fig. 6 and they are to be comparedwith the values predicted using the Russian deterministicmodels (dotted line). The overall agreement between theexperimental and computational estimates at the refer-ence location provides support for the integrity of thedeterministic modeling, and this is of importance giventhe general lack of explicit treatment of the early post-accident stage referred to above. In this respect theresults demonstrate the potential of luminescence toprovide benchmark values of cumulative dose.
The values of 25mDX (Table 2) are plotted againstareal 137Cs activity (Table 3) in Fig. 7, and the averagevalue of 25mDX for all locations in Stary Vishkov is 166 �59 mGy (standard deviation 10). The dotted line shownin the figure represents the value of cumulative dose(RLDcal) calculated using the appropriate value of D� toevaluate eqn (6). For a given quantity of areal 137Csactivity the values of 25mDX are expected to lie below thisline by an amount that is determined by the locationfactor, f, which is defined as the ratio of the absorbed
Table 3. Values of cumulative dose, RLDcal, at the referencelocation obtained by calculating the product of the areal activity(adjusted to 1986) due to 137Cs, Aa, and the coefficient, D�, derivedfrom the deterministic models, where the value of D� is 0.160 mGyper kBq m�2. Uncertainties are given at the 68% level ofconfidence; those associated with Aa are standard errors of un-weighted mean values for the number of cores indicated and anominal uncertainty of �15% was assigned to values of D�.
LocationNo.
137Cs activity (1986)Aa (kBq m�2)
No. soilcores RLDcal (mGy)
55 900 � 265 9 144 � 4856 1,300 � 280 9 208 � 5557 1,030 � 360 9 164 � 6258 1,900 � 1,210 9 304 � 19959 1,500 � 300 6 240 � 6060 1,060 � 250 3 170 � 4761 1,700 � 700 2 270 � 13162 1,460 � 670 3 234 � 11363 1,030 � 180 3 164 � 3765 2,090 � 500 2 335 � 94
Fig. 6. Relationship between estimates of cumulative dose in air atthe reference location obtained by luminescence, RLDX, and theaverage 137Cs areal activity (kBq m�2), Aa, adjusted to 1986, in thevicinity of the sampled building for selected locations in StaryVishkov. The dotted line represents the predicted values ofcumulative dose obtained using a value of 0.16 mGy per kBq m�2
for the coefficient D�. The location numbers are indicated withinthe plot symbols.
243Retrospective luminescence dosimetry ● I. K. BAILIFF ET AL.

dose at a specific location in a settlement to the absorbeddose at the reference location (Meckbach and Jacob1988). Golikov et al. (1999) calculated values of thelocation factor for outdoor locations in rural settlementsbefore (f 0.5) and after (f 0.4) the performance ofdecontamination measures. However, depending on therange of values of areal contamination about the centralofficial value adopted, the location factor as definedabove could have a value greater than 1 if the areal 137Csactivity adjacent to a building is significantly higher thanthe (central) official value adopted.
Using our experimentally-derived data, the locationfactor, floc.n, was calculated for each location n using thefollowing expression:
floc.n � 25mDX/RLDoff , (7)
where RLDoff is the cumulative dose at the referencelocation obtained by calculating the product of thepublished official areal 137Cs contamination for 1986 of1,470 kBq m�2 (State Committee on Hydrometeorologyof USSR 1990) with geometric standard deviation of 1.5(Stepanenko et al. 2004) and the coefficient D� (0.216mGy per kBq m�2) is derived from the Russian deter-ministic models, yielding a value of 235 mGy. The valueof floc.n for each location, calculated using eqn (7), isgiven in Table 2. These values are shown in Fig. 8,together with the values of f calculated by Golikov et al.discussed above, which we have taken to be the nearestequivalent to the 25 m average calculated for the lumi-nescence results. The wide range of the values of thelocation factor highlight the importance of the issue of
heterogeneity that must be taken into account whenattempting to perform dose reconstruction calculations inpopulated settlements. It is interesting, but appears coin-cidental, that the values calculated by Golikov et al. fallin the gap in our data (Fig. 8).
CONCLUSION
This work has demonstrated the feasibility of apply-ing retrospective luminescence dosimetry in a populatedRussian settlement downwind of Chernobyl to obtainestimates of cumulative absorbed dose in air at a com-mon point of reference for comparison with estimatesproduced by computational modeling. For the brickssampled in Bryansk, the sensitivity of the quartz used inthe luminescence measurements was sufficient to enablemeasurement of the cumulative dose due to naturalsources of radiation for bricks of age 20–30 y, and toevaluate absorbed dose in brick due to fallout of less than20 mGy. The methodology described takes into accountthe occurrence of heterogeneity in the distribution offallout in the vicinity of buildings when calculating theconversion factors required to obtain the absorbed dosein air at the reference location from absorbed dose inbrick. In cases where the disturbance and/or heterogene-ity of fallout in the soil is significant and prevents theapplication of conversion to the reference location, analternative “local” conversion factor was applied thatprovides the cumulative absorbed dose averaged to 25 mfrom the sampling location. The latter, when comparedwith the cumulative dose at the reference location,enabled location factors to be derived, and these may becompared with those produced by calculation for the
Fig. 7. Relationship between estimates of cumulative dose in airaveraged over 25 m adjacent to the sampled wall obtained byluminescence, 25mDX, and the average 137Cs areal activity (kBqm�2), Aa, adjusted to 1986, in the vicinity of the sampled buildings(the location numbers are indicated within the plot symbols). Thedotted line represents the predicted values of cumulative doseobtained using a value of 0.16 mGy per kBq m�2 for the coefficientD�.
Fig. 8. Schematic representation of location factors, calculated asthe ratio of 25mDX and RLDoff, for each of the tested locations inStary Vishkov (open circles), ordered by value (see Table 2). Thefilled circles correspond to the values of the location factorproposed by Golikov et al. (1999) for outdoor locations within“living areas,” where the higher and lower values correspond toundisturbed (0.5) and decontaminated ground (0.4), respectively.
244 Health Physics September 2005, Volume 89, Number 3

deterministic models. The combined conversion factorthat takes into account both shielding by the building andthe effects of heterogeneity provides a key step inapplying luminescence to dose-reconstruction studies. Itis essential that soil samples are gathered and analyzed inwork of this type to allow the degree and extent ofheterogeneity to be included in the MC simulations sinceit influences the overall uncertainty associated with thevalue of DX, converted either to the reference location orto a “local” area as performed here.
We consider that the methodology as described isdeveloped sufficiently for application to other settle-ments, including those with lower levels of contamina-tion. Although the application of luminescence is notroutine, the overall agreement in the values of DT
produced by several laboratories experienced in the useof quartz for dosimetry indicate that the method is likelyto be robust when applied elsewhere in settlementsdownwind of Chernobyl NPP. As the proportion ofabsorbed dose due to fallout progressively diminisheswith time due to an increase in the proportion of thebackground dose, the testing of highly shielded samplesand the selection of locations with plane wall geometrycontribute to making reliable determinations of DBG andmaximizing DX, respectively.
On the basis of the experience gained in StaryVishkov, we suggest that a two-fold approach to sam-pling is applied in settlements where luminescence test-ing has not previously been performed. First, severalbuildings should be sought that have a surroundingenvironment suitable to allow estimates of RLDX to beobtained and from which benchmark values can bederived. Although corrections for local heterogeneity canbe obtained by performing MC simulations, it is essentialthat the soil conditions farther away from the building areundisturbed. This enables the conversion factors to becalculated and hence allows luminescence and computa-tional estimates to be compared for the settlement.Second, buildings located in various environments thatare representative of the extent of heterogeneity of falloutin soil, including the effect of clean-up operations withinthe settlement, should be sought. Testing of this type islikely to provide an indication of the range of cumulativeabsorbed dose for different types of use of the land (e.g.,dwelling, agricultural, work areas, etc.) and consequentlydata that can be used to derive location factors.
Acknowledgments—The work described in this paper was partially sup-ported by the Commission of the European Communities under contractsIC15-CT96-0315 and F14P-CT 95-0011d, and the institutes of the authors.We are indebted to H. G. Menzel for scientific advice and support, and wealso thank P. Jacob, as Coordinator of Contract F14P-CT 95-0011d, for hiscontributions at various stages of the project. We acknowledge the
contribution made by the late G. Hutt to this project and also acknowledgethe support and skilled scientific assistance provided by A. Tsyb, A.Kondrashov, P. Vaichulis, and A. Tishkin, all of MRRC, Obninsk.
REFERENCES
Adamiec G, Aitken MJ. Dose-rate conversion factors: update.Ancient TL 16:37–50; 1998.
Aitken MJ. Thermoluminescence dating. London: AcademicPress; 1985.
Aitken MJ. An introduction to optical dating. Oxford: OxfordUniversity Press; 1998.
Bailiff IK. The pre-dose technique. In: Goeksu HY, OberhoferM, Regulla D, eds. Scientific dating techniques. EuroCourses, Advanced Scientific Techniques Vol. 1. Dordre-cht, The Netherlands: Kluwer Press; 1991: 155–173.
Bailiff IK. Retrospective dosimetry with ceramics. RadiatMeas 27:923–941; 1997.
Bailiff IK, Aitken MJ. The use of TL dosimetry for theevaluation of internal beta dose-rate in archaeological dat-ing. Nucl Inst Meth 173:423–429; 1980.
Bailiff IK, Petrov SA. The use of the 210°C TL peak in quartzfor retrospective dosimetry. Radiat Protect Dosim 84:551–554; 1999.
Bailiff IK, Boetter-Jensen L, Correcher V, Delgado A, GoeksuHY, Jungner H, Petrov SA. Absorbed dose evaluations inretrospective dosimetry: methodological developments us-ing quartz. Radiat Meas 32:609–613; 2000.
Bailiff IK, Stepanenko VF, Goeksu HY, Boetter-Jensen L,Brodsky L, Chumack V, Correcher V, Delgado A, GolikovV, Jungner H, Khamidova LG, Kolizshenkov TV, LikhtarevI, Meckbach R, Petrov SA, Sholom S. Comparison ofretrospective luminescence dosimetry with computationalmodeling in two highly contaminated settlements down-wind of the Chernobyl NPP. Health Phys 86:25–41; 2004.
Boetter-Jensen L. Luminescence techniques: instrumentationand methods. Radiat Meas 17:749–768; 1997.
Boetter-Jensen L, Solongo S, Murray AS, Banerjee D, JungnerH. Using the OSL single-aliquot regenerative-dose protocolwith quartz extracted from building materials in retrospec-tive dosimetry. Radiat Meas 32:841–845; 2000.
Goeksu HY, Bailiff IK, Boetter-Jensen L, Huett G, StonehamD. Inter-laboratory beta source calibration using TL andOSL with natural quartz. Radiat Meas 24:479–484; 1995.
Goeksu HY, Bulur E, Wahl W. Environmental beta dosimetryusing thin layer alpha-Al2O3:C TL detectors. Radiat ProtectDosim 84:451–455; 1999.
Golikov VYu, Balonov MI, Erkin V, Jacob P. Model validationfor external doses due to environmental contaminations bythe Chernobyl accident. Health Phys 77:654–661; 1999.
Haskell EH, Bailiff IK. Diagnostic and corrective proceduresfor TL analysis using the pre-dose technique. Nucl TracksRadiat Meas 10:503–508; 1985.
International Commission on Radiation Units and Measure-ments. Measurement of dose equivalents from externalphoton and electron radiations. Bethesda, MD: InternationalCommission on Radiation Units and Measurements; ICRUReport 47; 1992.
International Commission on Radiation Units and Measure-ments. Retrospective assessment of exposures to ionisingradiation. Bethesda, MD: International Commission onRadiation Units and Measurements; ICRU Report 68; 2002.
Jacob P, Aragno D, Bailiff IK, Bauchinger M, Boetter-JensenL, Braselmann H, Claessen S, Darroudi F, Delgado A,Fattibene P, Fayers C, Figgitt M, Goeksu HY, Griffin C,Knehr S, Meckbach R, Mobbs S, Mueck K, Natarajan AT,
245Retrospective luminescence dosimetry ● I. K. BAILIFF ET AL.

Onori S, Pantelias GE, Penfold J, Petrov SA, Pressello C,Proehl G, Santos S, Savage J, Simmonds JR, Terzoudi G,Tournette C, Wieser A. Dose reconstruction, EC-GSFAssociation Contract FI4P-CT-0011 Final Report. Neuher-berg, Germany: GSF-National Research Center for Envi-ronment and Health; Publication 03/00; 2000.
Lichtenstein H, Cohen M, Steinberg H, Troubetzkoy E, BeerM. The SAM-CE Monte Carlo system for radiation trans-port and criticality calculations in complex configurations(revision 7.0). In: A computer code manual. Elmsfort, NY:Mathematical Application Group Inc.; 1979: III, 1–187.
Likhtarev IA, Kovgan LN, Jacob P, Anspaugh LR. Chernobylaccident: Retrospective and prospective estimates of exter-nal dose of the population of Ukraine. Health Phys 82:290–303; 2002.
Meckbach R, Jacob P. Gamma exposures due to radionuclidesdeposited in urban environments. Part II: Location factorsfor different deposition factors. Radiat Protect Dosim25:181–190; 1988.
Mejdahl V. Thermoluminescence dating: beta-dose attenuationin quartz grains. Archaeometry 21:61–73; 1979.
Ministry of Public Health of Russian Federation. Reconstruc-tion of the mean effective dose accumulated in 1986–1995by inhabitants of settlements of the Russian Federationsubjected to radioactive contamination due to the Chernobylaccident in 1986. In: Balonov MI, Bruck GYa, GolikovVYu, Shutov VN, Savkin MN, Pitkevich VA, Stepanenko
VF, Vakulovskiy SM, Perminova GS, eds. Methodicalinstruction MU-2.6.1.579–96. Moscow: Ministry of PublicHealth of Russian Federation; 1996 (in Russian).
Murray AS, Marten R, Johnston A, Martin P. Analysis fornaturally occurring radionuclides at environmental concen-trations by gamma spectrometry. J Radioanalytical NuclChem 115:263–288; 1987.
Prescott JR, Hutton JT. Cosmic ray and gamma ray dosimetryfor TL and ESR. Nucl Tracks Radiat Meas 14:223–227;1988.
Scott EM, Cook GT, Harkness DD, Miller BF, Baxter MS.Further analysis of the international intercomparison study.Radiocarbon 34:520–527; 1992.
State Committee on Hydrometeorology of USSR. Date ofcontamination of the settlements of RSFSR by 137Cs and90Sr: March 1990. Obninsk, USSR; State Committee onHydrometeorology of USSR; 1990.
Stepanenko VF, Voileque PG, Gavrilin YuI, Khrouch VT,Shinkarev SM, Orlov MYu, Kondrashov AE, Petin DV,Laskova EK, Tsyb AF. Estimating individual thyroid dosesfor a case-control study of childhood thyroid cancer inBryansk Oblast, Russia. Radiat Protect Dosim 108:143–160; 2004.
UNSCEAR. Sources and effects of ionizing radiation. Reportto General Assembly with Scientific Annexes. New York:United Nations Publication E.00.IX.4; 2000.
f f
246 Health Physics September 2005, Volume 89, Number 3
Copyright © 2022 FDOKUMEN