Changes in ecosystem processes induced by land use: Human appropriation of aboveground NPP and its...
14
GLOBAL BIOGEOCHEMICAL CYCLES, VOL. 15, NO. 4, PAGES 929-942, DECEMBER 2001 Changes in ecosystem processes induced by land use' Human appropriation of aboveground NPP and its influence on standing crop in Austria Helmut Haberl, Karl-Heinz Erb, and Fridolin Krausmann Department of SocialEcology, Institute for Interdisciplinary Research of Austrian Universities, Schottenfeldgasse, Vienna, Austria WolfgangLoibl Austrian Research Centers Seibersdorf, Systems Research Division,Environmental Planning Department, Seibersdorf,Austria Niels Schulzand Helga Weisz Department of SocialEcology, Institute for Interdisciplinary Research of Austrian Universities, Schottenfeldgasse, Vienna, Austria Abstract. Human land use influences important properties of terrestrial ecosystems, such as energy flow, standing crop, and biomass turnover. Human interference with ecological energy flows may be studied by calculating the "humanappropriation of NPP" (HANPP), defined as the difference between the net primaryproduction (NPP) of potential vegetation and the actual NPP remaining in ecosystems after harvest. Comparing the standing crops of the potential vegetation and actually prevailing vegetation, we demonstrate the humanimpacton the amount of carbon stored in living vegetation. We discuss these concepts usingempirical results for aboveground vegetation in Austria calculated from statistical data and from land use and land covermodels derived from remote-sensing data.According to our calculations the humanappropriation of aboveground NPP in Austriatoday amounts to •50%. The aboveground standing crop (biomass stock)of the vegetation prevailing in Austriatoday is •64% lower than that of the potential vegetation. 1. Introduction Human activities influence ecosystems in at least two ways. First, global environmental change(e.g., climate change,rising CO2 levels) can affect productivity, carbon storage, nutrient cycles,etc. These issues are being analyzedin ongoing research programs [Walkerand Steffen, 1996] and will not be dealtwith in this paper. Second, the quickly growing human population is transforming terrestrial ecosystems around the globeat an increas- ing rate as a result of various socioeconomic activitiesencom- passed by the notion of "land use" [Meyer, 1996; Meyer and Turner,1994]. Changes in the patterns of human land useandthe resulting changes in land covercan alsohave profound effects on ecosystems. In an attempt to quantify the impact of human land use on ecosystems, this paper assesses the effectsof land use on three fundamental ecosystem properties: (1) net primaryproduction, (2) standing crop, and (3) biomassturnover.We compareactually observableecosystem patterns (i.e., properties of the current vegetation) with those one would expect to find in the absence of humanactivities (i.e., the ecosystem properties of the potential natural vegetation [Tiixen, 1956]). We propose that the difference between actual and potential conditions be used as a means of Copyright 2001 by the American Geophysical Union. Papernumber2000GB001280. 0886-6236/01/2000GB001280512.00 assessing the human impact on ecosystems or, in other words, "human domination"of ecosystems [ 14tousek et al., 1997]. Thus our objectiveis not to develop predictivemodels of ecosystem processes but ratherto analyze the impact of humanland use on ecosystems. Our modeling strategy was thereforenot aimed at appraising the effect of changes in climate or other geophysical parameters on ecosystem processes; a goal that canbest be met by using ecosystem models [Cramer et al., 1999; Schimel et al., 1997]. Instead of using a formal model, we used various approaches that allowed us to use all available data on human activities and their impacts, for example, agriculturalstatistics, forestrystatistics, forestinventories, land use statistics, remotely sensed data, and estimates on land use and land cover. We combined thesedata with the sameIBP data on productivity and standing crop that are also used to calibrateecosystem models [Cramer et al., 1999]. In orderto assess humanimpact. on ecological energyflows, we use a concept developed by IS'tousek et al. [1986] and Wright [1990], which has been called "human appropriation of net primary production" (HANPP) or "NPP appropriation." The notionof HANPP refers to the observation that by usingthe land, humans alterecological energy flows. For example, agriculture and forestry harness biomass energyfor socioeconomic purposes and thereby reduce the amountof NPP remaining in ecological food chains. Other types of land use, such as soil sealing, alter ecosystems and so have an impact on net primary productivity even if no biomass is harvested. Thus HANPP, defined as the aggregate effect of land use induced changes in productivity and 929
-
Upload
austrianinstituteoftechnology -
Category
Documents
-
view
1 -
download
0
Transcript of Changes in ecosystem processes induced by land use: Human appropriation of aboveground NPP and its...
GLOBAL BIOGEOCHEMICAL CYCLES, VOL. 15, NO. 4, PAGES 929-942, DECEMBER 2001
Changes in ecosystem processes induced by land use' Human appropriation of aboveground NPP and its influence on standing crop in Austria
Helmut Haberl, Karl-Heinz Erb, and Fridolin Krausmann Department of Social Ecology, Institute for Interdisciplinary Research of Austrian Universities, Schottenfeldgasse, Vienna, Austria
Wolfgang Loibl Austrian Research Centers Seibersdorf, Systems Research Division, Environmental Planning Department, Seibersdorf, Austria
Niels Schulz and Helga Weisz Department of Social Ecology, Institute for Interdisciplinary Research of Austrian Universities, Schottenfeldgasse, Vienna, Austria
Abstract. Human land use influences important properties of terrestrial ecosystems, such as energy flow, standing crop, and biomass turnover. Human interference with ecological energy flows may be studied by calculating the "human appropriation of NPP" (HANPP), defined as the difference between the net primary production (NPP) of potential vegetation and the actual NPP remaining in ecosystems after harvest. Comparing the standing crops of the potential vegetation and actually prevailing vegetation, we demonstrate the human impact on the amount of carbon stored in living vegetation. We discuss these concepts using empirical results for aboveground vegetation in Austria calculated from statistical data and from land use and land cover models derived from remote-sensing data. According to our calculations the human appropriation of aboveground NPP in Austria today amounts to •50%. The aboveground standing crop (biomass stock) of the vegetation prevailing in Austria today is •64% lower than that of the potential vegetation.
1. Introduction
Human activities influence ecosystems in at least two ways. First, global environmental change (e.g., climate change, rising CO2 levels) can affect productivity, carbon storage, nutrient cycles, etc. These issues are being analyzed in ongoing research programs [Walker and Steffen, 1996] and will not be dealt with in this paper. Second, the quickly growing human population is transforming terrestrial ecosystems around the globe at an increas- ing rate as a result of various socioeconomic activities encom- passed by the notion of "land use" [Meyer, 1996; Meyer and Turner, 1994]. Changes in the patterns of human land use and the resulting changes in land cover can also have profound effects on ecosystems.
In an attempt to quantify the impact of human land use on ecosystems, this paper assesses the effects of land use on three fundamental ecosystem properties: (1) net primary production, (2) standing crop, and (3) biomass turnover. We compare actually observable ecosystem patterns (i.e., properties of the current vegetation) with those one would expect to find in the absence of human activities (i.e., the ecosystem properties of the potential natural vegetation [Tiixen, 1956]). We propose that the difference between actual and potential conditions be used as a means of
Copyright 2001 by the American Geophysical Union.
Paper number 2000GB001280. 0886-6236/01/2000GB001280512.00
assessing the human impact on ecosystems or, in other words, "human domination" of ecosystems [ 14tousek et al., 1997]. Thus our objective is not to develop predictive models of ecosystem processes but rather to analyze the impact of human land use on ecosystems. Our modeling strategy was therefore not aimed at appraising the effect of changes in climate or other geophysical parameters on ecosystem processes; a goal that can best be met by using ecosystem models [Cramer et al., 1999; Schimel et al., 1997]. Instead of using a formal model, we used various approaches that allowed us to use all available data on human activities and their impacts, for example, agricultural statistics, forestry statistics, forest inventories, land use statistics, remotely sensed data, and estimates on land use and land cover. We combined these data with the same IBP data on productivity and standing crop that are also used to calibrate ecosystem models [Cramer et al., 1999].
In order to assess human impact. on ecological energy flows, we use a concept developed by IS'tousek et al. [1986] and Wright [1990], which has been called "human appropriation of net primary production" (HANPP) or "NPP appropriation." The notion of HANPP refers to the observation that by using the land, humans alter ecological energy flows. For example, agriculture and forestry harness biomass energy for socioeconomic purposes and thereby reduce the amount of NPP remaining in ecological food chains. Other types of land use, such as soil sealing, alter ecosystems and so have an impact on net primary productivity even if no biomass is harvested. Thus HANPP, defined as the aggregate effect of land use induced changes in productivity and
929
93O HABERL ET AL.: HUMAN APPROPRIATION OF NPP IN AUSTRIA
biomass harvest on the energy availability in ecosystems, can be used to assess the effect of land use on the availability of biomass energy in ecosystems [Haberl, 1997].
Land use has an influence on the standing crop (i.e., the biomass stock) of ecosystems [Houghton et al., 1983; Houghton, 1995; Schimel, 1995]. Converting forests to cultivated land reduces the amount of carbon stored in living vegetation and accelerates biomass turnover. Additionally, managed forests store less carbon than pristine forests, even if forest management techniques include regrowth after harvest [Harmon et al., 1990]. Standing crop reductions change the amount of carbon stored in vegetation and result in net carbon flows from vegetation into the atmosphere, contributing to increasing atmospheric CO2 levels.
We discuss here the ways in which a study of human impact on terrestrial ecosystems can contribute to the analysis of the inter- relations between land use patterns, industrial resource use, and their ecological consequences. For example, some authors have argued that a reduction of ecological energy flows may threaten biodiversity [Brown, 1991; Brown, 1995; Turner et al., 1988; Wright, 1983, 1987]. Moreover, our study has practical implica- tions in that it calls into question the biological sustainability of strategies to substitute biomass for fossil fuels in order to combat global warming.
The example used in this paper is Austria, a highly industrialized Central European country with medium population density (area 83,000 km 2, current population about 8 million). Forests cover more than 45% of Austria's land area, a rather high percentage for Central European standards (EU average: 40%), owing to the mountainous landscape.
2. Materials and Methods
As a result of the International Biological Programme (IBP), rather reliable data exist for the aboveground NPP of many vegetation units. However, data on belowground NPP and below- ground standing crop are still rather uncertain. Current studies show that belowground NPP of forest ecosystems was signifi- cantly underestimated in most IBP research in the 1970s, when it was usually estimated at 15-30% of aboveground NPP [Lieth and Whittaker, 1975]. More recent work revealed that belowground productivity may, in some cases, even exceed 100% of above- ground NPP [Melillo and Gosz, 1983; Vogt et al., 1982, 1986]. Similarly, data on belowground standing crop are uncertain. The belowground standing crop is highly seasonably variable and difficult to measure [Waring and Schlesinger, 1985; Vogt et al., 1986; Singh et al., 1984]. Owing to these uncertainties and the lack of reliable data compilations, we restrict ourselves to above- ground NPP (abbreviated as ANPP), aboveground standing crop and aboveground turnover. For units we use metric tons of dry matter biomass (1 Mt = 1 million metric tons, 1 Gt- 1 billion tons). In convening dry matter to carbon, we used a conversion factor of 0.45 [Schlesinger, 1997].
2.1. Definition of Human Appropriation of NPP
Human appropriation of NPP (HANPP) is defined as the differ- ence between the NPP of the potential natural vegetation [Tiixen, 1956] and the amount of NPP remaining in ecosystems. The former property is termed NPP0, i.e., the NPP of the vegetation
input to heterotrophic food chains. We denote the NPP of the actual vegetation as NPPact and harvest as NPPh. According to these conventions, HANPP can be defined as follows [Haberl, 1997]:
HANPP = NP P 0 - NPPt
with
NPPt = NPPact - NPPh.
While this definition is adequate for grasslands and cultivated land, there are some problems with the harvest of wood from forests, i.e., from long-accumulated biomass stocks. Harvesting timber means removing biomass which has been accumulating for many years and not only biomass that is part of current year's NPP, as is the case on cropland or grassland. Our definition treats the harvest of wood in a region as a percentage of the NPP of all forest ecosystems in a whole region, because we assume that as a result of forest management whole regions are never harvested and we assume that forests are allowed to regrow after harvest, this being common practice not only in Austria but also in Europe in general. However, the method should be refined for application in other studies of regions where logging is associated with deforestation. In this case, it could be necessary to distinguish between harvest in continually managed forests and destructive harvest [Wright, 1990].
2.2. Land Use and Land Cover Data
To assess NPP0, NPPact, and the potential and actual standing crop in Austria, we used the following sources of land use and land cover data.
1. We compiled the Statistical data set on the basis of land use and land cover data of the Austrian Central Statistical Office, based on agricultural statistics, forestry statistics, and land use statistics (real estate statistics);
2. We compiled the Corine data set on the basis of land cover data derived from visual interpretation of satellite imagery, aerial photography, and topographic maps by the Environmental Agency Austria (EEA) in the European "Corine land cover" program [Aubrecht, 1998; Liebel and Aubrecht, 1996];
3. "ARCS data," a land cover model developed by the Austrian Research Centre Seibersdorf (ARCS) using Landsat TM data and the algorithms described below. These data have a high-spatial resolution and were used to derive maps of productivity, NPP appropriation, and standing crop.
The statistical data refer to municipalities (n -- 2350) as the smallest spatial unit and allow us to discriminate •40 categories of land use. Agricultural areas and grasslands are finely differentiated, distinguishing 17 main crops and 8 types of grasslands. Further data consider built-up area, vineyards, gardens, etc. The minimum area recorded in land use statistics is 1 ha (104 m2). In real estate statistics, which we used to assess built-up land and other urban areas, there is no such lower limit. There is some spatial distortion owing to the fact that a parcel of land is allocated to the municipal- ity where the owner of the parcel resides, even if the parcel itself is located in another municipality [t)sterreichisches Statistisches Zentralamt (OSTAT), 1992; Schieler et al., 1996; GerhoM, 1992]. Statistical data are the only source available for time series calculations.
that would prevail in the absence of human interference. The NPP The Corine :data distingui• 44 different land-cover•lasses, • remaining in ecosystems is termed NPPt, i.e., the amount of of which apply to Austria. Data source are Landsat TM images biomass currently available in ecological cycles. collected in the summers of 1985 and 1986. The visual inter-
Two processes contribute to the appropriation of net primary pretation of satellite images was supported by topographic maps production: (1) land use changes the average productivity of (1:50,000), infrared aerial photography, and statistical data. ecosystems and (2) harvest extracts NPP from ecosystems. Objects had to have a minimum size of 25 ha to be recorded; Both processes reduce the amount of energy available as an longitudinal objects such as rivers had to have a width of at least
HABERL ET AL.: HUMAN APPROPRIATION OF NPP IN AUSTRIA 931
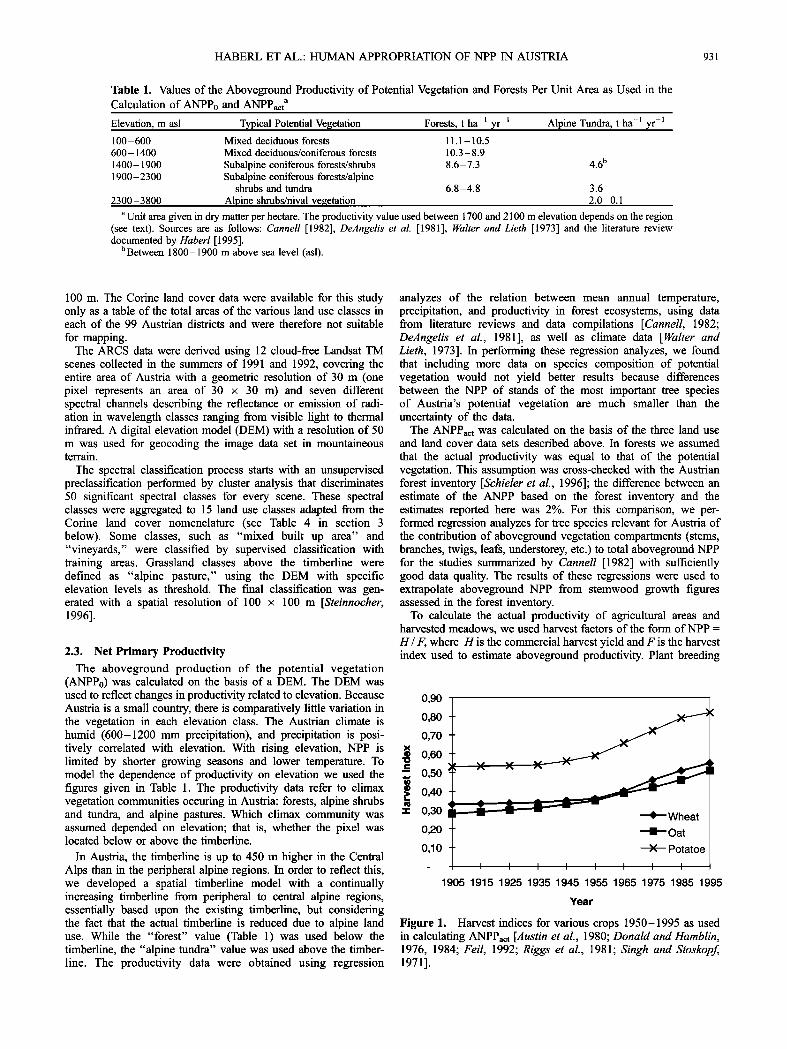
Table 1. Values of the Aboveground Productivity of Potential Vegetation and Forests Per Unit Area as Used in the Calculation of ANPP0 and ANPPact a
Elevation, m asl Typical Potential Vegetation Forests, t ha -• yr -• 100- 600 Mixed deciduous forests 11.1 - 10.5
600-1400 Mixed deciduous/coniferous forests 10.3 - 8.9
1400-1900 Subalpine coniferous forests/shrubs 8.6- 7.3 1900-2300 Subalpine coniferous forests/alpine
shrubs and tundra 6.8- 4.8 3.6
2300- 3800 Alpine shrubs/nival vegetation 2.0- 0.1
Alpine Tundra, t ha -• yr -•
4.6 b
a Unit area given in dry matter per hectare. The productivity value used between 1700 and 2100 m elevation depends on the region (see text). Sources are as follows: Cannell [1982], DeAngelis et al. [1981], Walter and Lieth [1973] and the literature review documented by Haberl [1995].
b Between 1800-1900 m above sea level (asl).
100 m. The Corine land cover data were available for this study only as a table of the total areas of the various land use classes in each of the 99 Austrian districts and were therefore not suitable
for mapping. The ARCS data were derived using 12 cloud-free Landsat TM
scenes collected in the summers of 1991 and 1992, covering the entire area of Austria with a geometric resolution of 30 m (one pixel represents an area of 30 x 30 m) and seven different spectral channels describing the reflectance or emission of radi- ation in wavelength classes ranging from visible light to thermal infrared. A digital elevation model (DEM) with a resolution of 50 m was used for geocoding the image data set in mountaineous terrain.
The spectral classification process starts with an unsupervised preclassification performed by cluster analysis that discriminates 50 significant spectral classes for every scene. These spectral classes were aggregated to 15 land use classes adapted from the Corine land cover nomenclature (see Table 4 in section 3 below). Some classes, such as "mixed built up area" and "vineyards," were classified by supervised classification with training areas. Grassland classes above the timberline were defined as "alpine pasture," using the DEM with specific elevation levels as threshold. The final classification was gen- erated with a spatial resolution of 100 x 100 m [Steinnocher, 1996].
2.3. Net Primary Productivity
The aboveground production of the potential vegetation (ANPP0) was calculated on the basis of a DEM. The DEM was used to reflect changes in productivity related to elevation. Because Austria is a small country, there is comparatively little variation in the vegetation in each elevation class. The Austrian climate is humid (600-1200 mm precipitation), and precipitation is posi- tively correlated with elevation. With rising elevation, NPP is limited by shorter growing seasons and lower temperature. To model the dependence of productivity on elevation we used the figures given in Table 1. The productivity data refer to climax vegetation communities occuring in Austria: forests, alpine shrubs and tundra, and alpine pastures. Which climax community was assumed depended on elevation; that is, whether the pixel was located below or above the timberline.
In Austria, the timberline is up to 450 m higher in the Central Alps than in the peripheral alpine regions. In order to reflect this, we developed a spatial timberline model with a continually increasing timberline from peripheral to central alpine regions, essentially based upon the existing timberline, but considering the fact that the actual timberline is reduced due to alpine land use. While the "forest" value (Table 1) was used below the timberline, the "alpine tundra" value was used above the timber- line. The productivity data were obtained using regression
analyzes of the relation between mean annual temperature, precipitation, and productivity in forest ecosystems, using data from literature reviews and data compilations [Cannell, 1982; DeAngelis et al., 1981], as well as climate data [Walter and Lieth, 1973]. In performing these regression analyzes, we found that including more data on species composition of potential vegetation would not yield better results because differences between the NPP of stands of the most important tree species of Austria's potential vegetation are much smaller than the uncertainty of the data.
The ANPPact was calculated on the basis of the three land use and land cover data sets described above. In forests we assumed
that the actual productivity was equal to that of the potential vegetation. This assumption was cross-checked with the Austrian forest inventory [Schieler et al., 1996]; the difference between an estimate of the ANPP based on the forest inventory and the estimates reported here was 2%. For this comparison, we per- formed regression analyzes for tree species relevant for Austria of the contribution of aboveground vegetation compartments (stems, branches, twigs, leafs, understorey, etc.) to total aboveground NPP for the studies summarized by Cannell [1982] with sufficiently good data quality. The results of these regressions were used to extrapolate aboveground NPP from stemwood growth figures assessed in the forest inventory.
To calculate the actual productivity of agricultural areas and harvested meadows, we used harvest factors of the form of NPP = H / F, where H is the commercial harvest yield and F is the harvest index used to estimate aboveground productivity. Plant breeding
0,90
0,80
0,70
• 0,60 .,., 0,50
g 0,40
-r 0,30
0,20
0,10
--e--Wheat
--•--Oat
-- Potatoe
1905 1915 1925 1935 1945 1955 1965 1975 1985 1995
Year
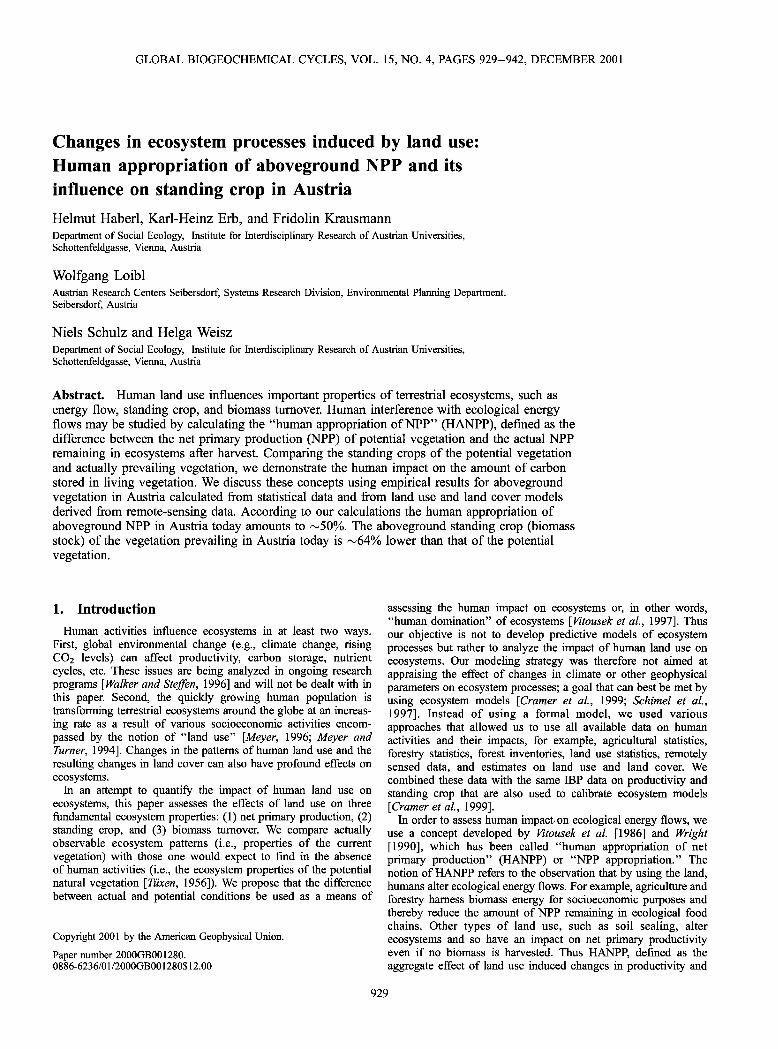
Figure 1. Harvest indices for various crops 1950-1995 as used in calculating ANPPact [Austin et al., 1980; DonaM and Hamblin, 1976, 1984; Feil, 1992; Riggs et al., 1981; Singh and Stoskopf, 1971].

932 HABERL ET AL.' HUMAN APPROPRIATION OF NPP IN AUSTRIA
a. Fagus sylvatica 5OO
400
.•. 300
• o•
l= 200 .o o
100
0 I
0 50
o
o
8o o ..•'-'o o
I
lOO
K= 303
b= 15.2
r= 0.050
R2= 0.67
I
150
Age [yr]
I
200
I
250
b. Quercus spp. 5OO
400
"• 300
l= 200 .9
100
o o
o
o
o o
o
• I
0 5o 100
I
150
Age [yr]
K= 290
b=7.4
r= 0.040
R 2= 0.543
I
2OO
I
250
c. Picea abies, temperate zone 500--
400--
200-
100-
0
0
o o
I
5o
I
lOO
I
15o
Age [yr]
K=285
b=9.7
r=0.071
R 2= 0.768
I
2OO
I
250
d. Picea abies, boreal zone 5O
•,40
01
0
o
o o
50
o • øo oo
o
I I
1 oo 150
Age [yr]
K= 184
b= 238.5
r= 0.12
R2= 0.582
I
200
I
250
e. Abies spp. 500-
400-
'•300-
E 200' o
100-
o
o ø
o t o
ø o o o o
8o I I
o
ø o o o
o •
o o
K= 438
b=8.4
r= 0.076
R2= 0.844
f. Pinus spp. 500-
400'
300-
200•
100-
o
0 0 000
K=218
b= 10.7
r= 0.064
R 2- 0.827
I I I 0 50 100 150 200 250 0 50 100 150 200 250
Age [yr] Age [yr]
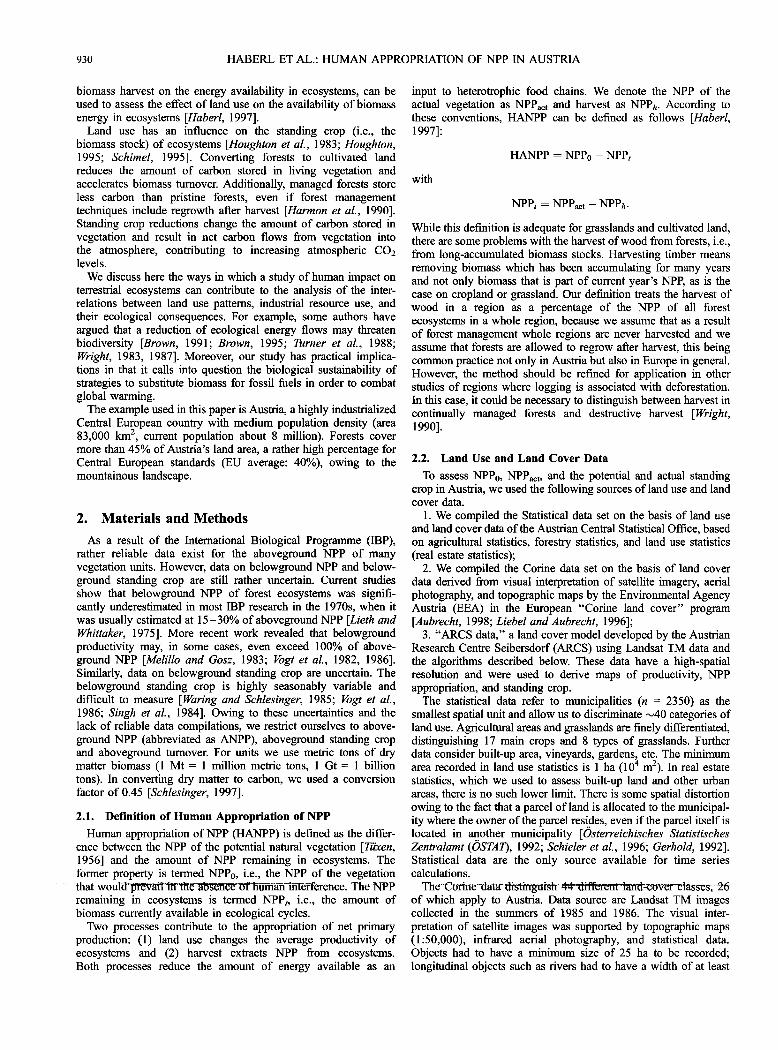
Figure 2. Logistic regressions for the standing crop of Austria's main forest species, depending on stand age. "Biomass" is the aboveground standing crop int ha -• We included. only those study sites• with a mean annual temperature between 4 ø and 14øC and a yearly mean precipitation of more than 450 mm. The regressions result in K 1 t 1 values of 290 t ha- for oak (Quercus spp), 303 t ha- for beech (Fagus sylvatica), 438 t ha- for fir (Abies spp), 285
1 1 t ha- for montane spruce (Picea abies, temperate zone), 184 t ha- for subalpine spruce (Picea abies, boreal zone), and 218 t ha -• for pine (Pinus spp). Sources: Cannell [1982], Walter and Lieth [1973] and others; for reference see Erb [1999].
HABERL ET AL.: HUMAN APPROPRIATION OF NPP 1N AUSTRIA 933
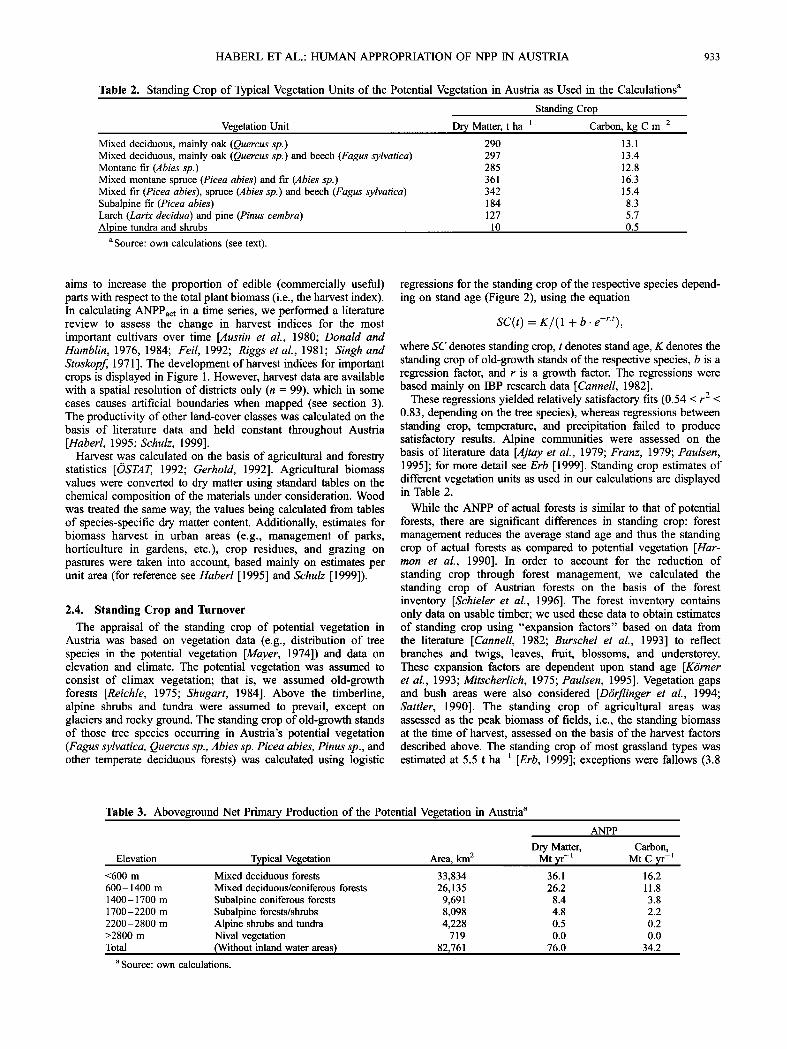
Table 2. Standing Crop of Typical Vegetation Units of the Potential Vegetation in Austria as Used in the Calculations a
Standing Crop
Vegetation Unit Dry Matter, t ha -• Carbon, kg C m -2 Mixed deciduous, mainly oak (Quercus sp.) Mixed deciduous, mainly oak (Quercus sp.) and beech (Fagus sylvatica) Montane fir (Abies sp.) Mixed montane spruce (Picea abies) and fir (Abies sp.) Mixed fir (Picea abies), spruce (Abies sp.) and beech (Fagus sylvatica) Subalpine fir (Picea abies) Larch (Larix decidua) and pine (Pinus cembra) Alpine tundra and shrubs
290 13.1
297 13.4
285 12.8
361 16.3
342 15.4
184 8.3
127 5.7
10 0.5
a Source: own calculations (see text).
aims to increase the proportion of edible (commercially useful) parts with respect to the total plant biomass (i.e., the harvest index). In calculating ANPPact in a time series, we performed a literature review to assess the change in harvest indices for the most important cultivars over time [Austin et al., 1980; Donald and Hamblin, 1976, 1984; Feil, 1992; Riggs et al., 1981; Singh and Stoskopf, 1971 ]. The development of harvest indices for important crops is displayed in Figure 1. However, harvest data are available with a spatial resolution of districts only (n: 99), which in some cases causes artificial boundaries when mapped (see section 3). The productivity of other land-cover classes was calculated on the basis of literature data and held constant throughout Austria [Haberl, 1995; Schulz, 1999].
Harvest was calculated on the basis of agricultural and forestry statistics [OSTAT, 1992; Gerhold, 1992]. Agricultural biomass values were converted to dry matter using standard tables on the chemical composition of the materials under consideration. Wood was treated the same way, the values being calculated from tables of species-specific dry matter content. Additionally, estimates for biomass harvest in urban areas (e.g., management of parks, horticulture in gardens, etc.), crop residues, and grazing on pastures were taken into account, based mainly on estimates per unit area (for reference see Haber! [1995] and Schulz [1999]).
2.4. Standing Crop and Turnover
The appraisal of the standing crop of potential vegetation in Austria was based on vegetation data (e.g., distribution of tree species in the potential vegetation [Mayer, 1974]) and data on elevation and climate. The potential vegetation was assumed to consist of climax vegetation; that is, we assumed old-growth forests [Reichle, 1975; Shugart, 1984]. Above the timberline, alpine shrubs and tundra were assumed to prevail, except on glaciers and rocky ground. The standing crop of old-growth stands of those tree species occurring in Austria's potential vegetation (Fagus sylvatica, Quercus sp., Abies sp. Picea abies, Pinus sp., and other temperate deciduous forests) was calculated using logistic
regressions for the standing crop of the respective species depend- ing on stand age (Figure 2), using the equation
SC(t) : K/(1 + b . e-r't),
where SC denotes standing crop, t denotes stand age, K denotes the standing crop of old-growth stands of the respective species, b is a regression factor, and r is a growth factor. The regressions were based mainly on IBP research data [Cannell, 1982].
These regressions yielded relatively satisfactory fits (0.54 < r 2 < 0.83, depending on the tree species), whereas regressions between standing crop, temperature, and precipitation failed to produce satisfactory results. Alpine communities were assessed on the basis of literature data [,4jtay et al., 1979; Franz, 1979; Paulsen, 1995]; for more detail see Erb [1999]. Standing crop estimates of different vegetation units as used in our calculations are displayed in Table 2.
While the ANPP of actual forests is similar to that of potential forests, there are significant differences in standing crop: forest management reduces the average stand age and thus the standing crop of actual forests as compared to potential vegetation [Har- mon et al., 1990]. In order to account for the reduction of standing crop through forest management, we calculated the standing crop of Austrian forests on the basis of the forest inventory [Schieler et al., 1996]. The forest inventory contains only data on usable timber; we used these data to obtain estimates of standing crop using "expansion factors" based on data from the literature [Cannell, 1982; Bursche! et al., 1993] to reflect branches and twigs, leaves, fruit, blossoms, and understorey. These expansion factors are dependent upon stand age [Kb'rner et al., 1993; Mitscherlich, 1975; Paulsen, 1995]. Vegetation gaps and bush areas were also considered [D6rfiinger et al., 1994; Sattler, 1990]. The standing crop of agricultural areas was assessed as the peak biomass of fields, i.e., the standing biomass at the time of harvest, assessed on the basis of the harvest factors described above. The standing crop of most grassland types was estimated at 5.5 t ha -• [Erb, 1999]; exceptions were fallows (3.8
Table 3. Aboveground Net Primary Production of the Potential Vegetation in Austria a
Elevation Typical Vegetation Area, km 2
ANPP
Dry Matter, Mt yr -•
Carbon, Mt C yr -•
<600 m Mixed deciduous forests 33,834 600-1400 m Mixed deciduous/coniferous forests 26,135 1400-1700 m Subalpine coniferous forests 9,691 1700-2200 m Subalpine forests/shrubs 8,098 2200-2800 m Alpine shrubs and tundra 4,228 >2800 m Nival vegetation 719 Total (Without inland water areas) 82,761
a Source: own calculations.
36.1
26.2
8.4
4.8
0.5
0.0
76.0
16.2
11.8
3.8
2.2
0.2
0.0
34.2

934 HABERL ET AL.: HUMAN APPROPRIATION OF NPP IN AUSTRIA
Table 4. Aboveground NPP (dry matter) of the Area of Vegetation Types in Austria Around 1990 According to Three Different Sets of Land-Cover Data a
ARCS Data Corine Data Statistical Data
Area, km 2 ANPP, Mt yr -1 Area, km 2 ANPP, Mt yr -1 Area, km 2 ANPP, Mt yr -1 I. 1 High density urban 75 0.00 71 0.00 942 0.00 1.2 Low density urban 1,513 0.97 1,232 0.79 2,314 1.48 1.3 Green urban 16 0.01 32 0.02 n.d. n.c.
1.4 Industr., comm., traffic 112 0.02 104 0.02 n.d b n.c. 1.5 Mining 38 0.00 62 0.00 n.d. n.c. Total I ("artificial surfaces") 1,753 1.00 1,500 0.83 3,256 1.48 II. 1 Arable land 11,500 11.63 11,421 11.74 12,532 12.58 11.2 Vineyards 696 0.50 586 0.42 582 0.42 11.3 Pastures 5,177 4.75 8,842 8.11 8,368 7.68 11.4 Heterog. agric. Areas 10,271 6.99 9,594 6.82 8,160 4.56 Total II ("agricultural areas") 27,644 23.88 30,444 27.09 29,642 25.25 III. 1 Forest 41,377 40.10 38,955 37.74 38,898 c 38.02 III. 2 "Natural veget." 7,490 1.70 5,590 1.27 4,584 1.04 111.3 Alpine / no vegetation 4,256 0.49 6,028 0.70 5,607 1.29 111.4 Glacier 464 0.00 566 0.00 719 0.00
Total III ("natural areas") 53,587 42.30 51,139 39.71 49,807 40.35 IV Wetlands 200 0.16 151 0.13 n.d. n.d.
V Inland water 667 n.c. 640 n.c. 1,153 n.c. Austria total 83•851 67.34 83•874 67.77 83•859 67.08
allere n.d., no data; n.c., not considered. Sources are as follows: ARCS land cover databased on Landsat TM images [Steinnocher, 1996], Corine land cover data [Aubrecht, 1996, 1998; Liebel and Aubrecht, 1996], statistical land cover data compiled by F. Krausmann, N. Schulz, and H. Habefi.
b Included in 1.1, high density urban. C Excluding forests above 1,700 m elevation (which were considered in productivity estimate of the class 111.2 "natural vegetation").
t ha -1) and alpine pastures above 1700 m elevation (4.2 t ha-l). We assumed that the standing crop of alpine shrubs was equal to that of the potential vegetation.
The biomass turnover is expressed as turnover time, which can be calculated by dividing the aboveground standing crop by the aboveground net primary production. The turnover time (i.e., the mean residence time of biomass in an ecosystem) has the year (yr) as its dimension. In calculating the turnover time of the actual vegetation, we divided the standing crop of the actual vegetation by the ANPPaot, both calculated on the basis of the same land cover data set (statistical data) and expressed as energy values.
3. Results
3.1. Appropriation of Aboveground NPP
According to our calculations, the aboveground NPP of the potential vegetation is 76 million tons (Mr) dry matter per year (Mr yr -•) which equals an average dry matter production of •9.2 t ha -2 yr -• (•0.41 kg C m -2 yr-•). Table 3 shows a breakdown of
the ANPP into six elevation classes, revealing that mixed decid- uous forests below 600 m elevation account for 47.5% of the
ANPP0. Most urban and agricultural land use is situated in this elevation class. A previous study [Haberl, 1997] showed that Lieth's "Miami" model [Lieth, 1975], based on mean annual precipitation and long-term temperature averages (corrected for belowground NPP), yielded only 3% lower values than the method used here but apparently overestimated productivity in high alpine regions.
The three different data sets on land use and land cover result
in similar estimates of the overall ANPPact (see Table 4). The statistical data yield the lowest ANPPact estimate (67.08 Mt yr-•). The two land use and land cover models based on satellite
imagery yield similar values: 67.34 and 67.77 Mt yr -•, respec- tively. All three models indicate that the ANPP of actual vegetation is lower than that of potential vegetation. The reduc- tion of ANPP induced by land use is •13% of the ANPP0. However, while total ANPPact estimates are similar, there are marked differences between the three data sets for the different
land-cover classes. The land-cover class I "artificial surfaces" has
its highest value in the statistical data and its lowest value in the
Table 5. Harvest of Biomass in Austria in 1990 a
Harvest
Land Use Class Dry Matter, Mt yr -• Carbon, Mt C yr -1 Distribution, % of total Urban areas 0.74 0.33 2
Arable land 11.90 5.35 40
Vineyards 0.39 0.17 1 Grasslands 5.12 2.30 17
Heterogeneous agriculturaI areas 2.04 v.92 7 Grazing on alpine pastures 0.17 0.08 1
Total a•riculture 19.62 8.82 66 Forests 9.65 4.34 32
Total Austria 30.00 13.50 100.0
aSources: Gerhold [1992], OSTAT [1992], and own calculations. bAverage of the years 1988-1992.

HABERL ET AL.: HUMAN APPROPRIATION OF NPP IN AUSTRIA 935
Table 6. Appropriation of Aboveground NPP in Austria Around 1990 (Biomass, Dry Matter): Aboveground Productivity of the Potential Vegetation (ANPPo), of the Actual Vegetation (ANPPact), Harvest of ANPP, ANPP Remaining in Ecosystems (ANPPt), and Human Appropriation of NPP (HANPP) a
ARCS Data Corine Data Statistical Data
ANPP0, Mt yr -• 76 76 76 ANPPact, Mt yr -• 67 68 67 Harvest, Mt yr- • 30 30 30 ANPPt, Mt yr- • 37 38 37 HANPP, Mt yr -• 39 38 39 HANPP, % of ANPP0 51 50 51
a Source: own calculations.
Corine data. Both sources that rely on remote-sensing (ARCS data and Corine data) give much lower estimates for 1.1 "high density urban" areas than do the statistical data. Statistical data for the classes 1.3-1.5 are not available. Corine data yield the highest estimate of class II "agricultural areas," resulting in the highest ANPP, whereas ARCS data are lowest for class II. The estimate of area (and ANPP) of land-cover class III "natural areas" is highest according to the ARCS data and lowest according to the Corine data.
For calculating harvest we used mainly agricultural and forestry statistics and did not consider different data sets (Table 5). Harvest in "urban areas" includes the mowing of lawns, gardening in parks, and harvest in private gardens. Agriculture (including urban areas) accounts for 66% of the harvested biomass (d.m.), including cropland (40%) and grasslands (17%). Forests contribute 32% of the harvested biomass.
Table 6 summarizes the results for the socioeconomic appropri- ation of ANPP in Austria. The three data sets result in estimates of
overall HANPP of •50% of ANPPo. Land cover data relying on satellite imagery tend to produce slightly lower estimates of NPP appropriation than do statistical data.
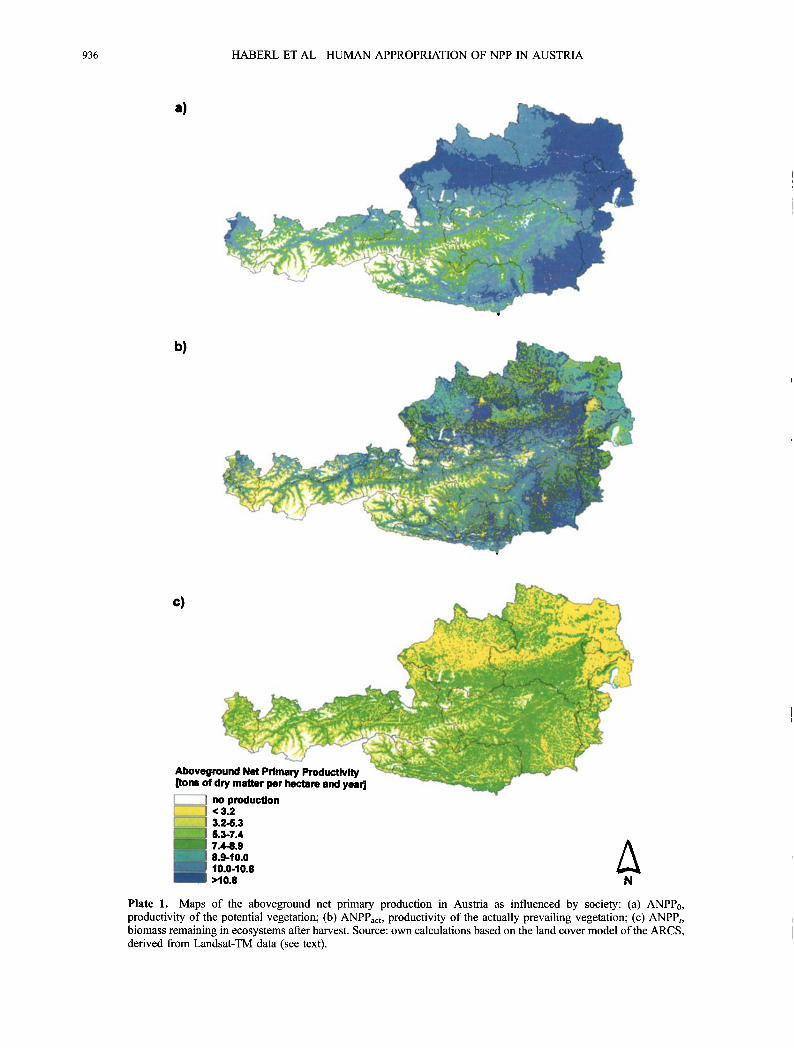
The ARCS data set was used to produce maps of primary production processes in Austria. Plate l a shows the spatial dis- tribution of the potential vegetation's ANPP. The potential vege- tation was assumed to consist of climax forests below the
timberline (which in Austria is at elevations between 1800 and 2250 m). Above the timberline, alpine shrubs and alpine pastures were assumed to prevail. Thus Plate l a reflects mainly elevation, with the highest productivity being found in the lowlands and the lowest in the high alpine regions.
Plate 1 b shows the spatial distribution of the ANPP of the actual vegetation. Yellow areas in the lowlands depict the larger Austrian cities. Dark blue indicates the areas where forests remain intact in
the lowlands. The fragmentation of forests is clearly visible. Green and light blue colored low-lying areas (see Plate l a for compar- ison) refer to different agricultural land-cover classes (cropland, grasslands, etc.). Their productivity was modelled on the basis of harvest data, which are available only for the spatial units of provinces (n = 99); that is, all grid cells of an agricultural land- cover class within one district were assumed to be equal in productivity. This can lead to artificial boundaries between adja- cent districts (see the northeast parts of the map in Plate lb).
Plate l c shows the spatial distribution of the proportion of ANPPact remaining in ecosystems, which is to say, the ANPPt. It shows that the amount of energy available in intensively harvested areas and in city centers is nearly as low as in high alpine areas, whereas the highest ANPPt values are encountered in forested areas. Essentially, Plate l c distinguishes between forests (green), urban and agricultural areas (yellow), and alpine areas (yellow or white, depending on elevation and land cover).
3.2. Time Series of HANPP 1950-1995
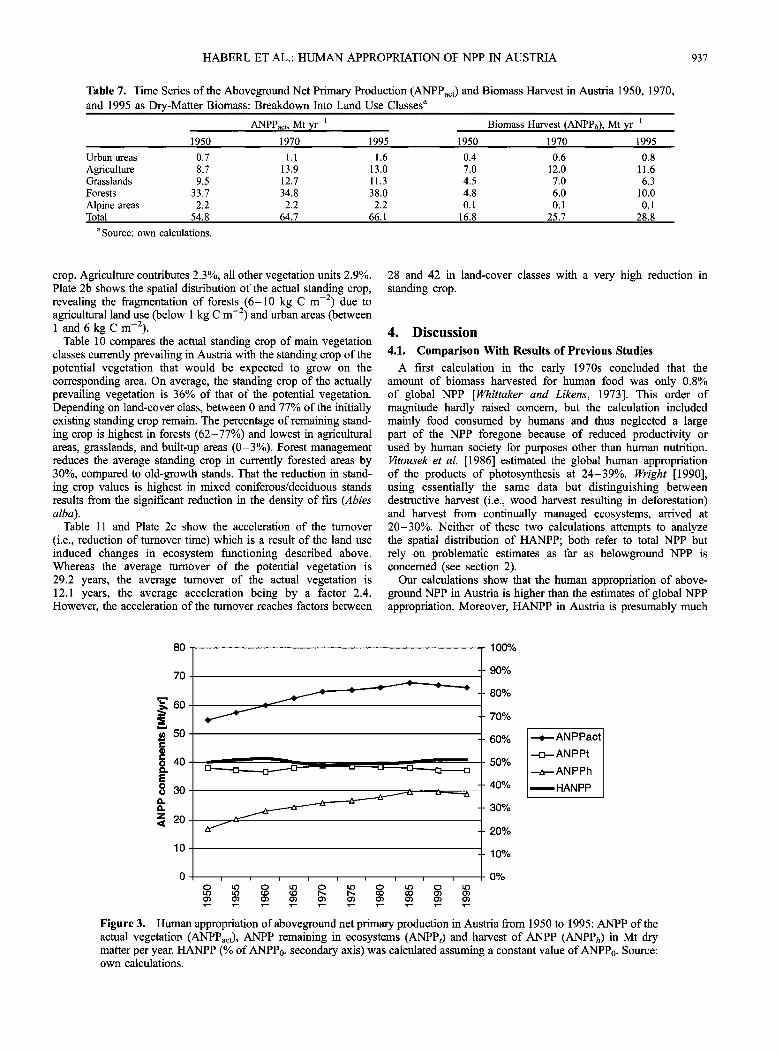
The calculations of ANPPact and biomass harvest for the period of 1950-1995 rely solely on statistical data. The produc- tivity of potential vegetation was assumed to be constant. In this period, the aboveground productivity of vegetation in Austria increased by 21%, while harvest values rose by 71% (Table 7). Two trends are responsible for the productivity increase: (1) Forested areas (which have the highest productivity per unit area) increased by 12%, at the expense of less productive agricultural and grassland areas. (2) The productivity of agricultural areas and grasslands grew considerably, owing to agricultural intensi- fication (e.g., fertilization and irrigation), which in turn allowed for greater harvests. As Figure 3 shows, both harvest and ANPPact grew in parallel until 1985 and remained more or less constant afterward. Increases in the ANPPact of agricultural areas appear to allow for increased harvests but leave the ANPPt more or less constant. The increase in forested areas more than offsets
the growth in urban areas. As a consequence, HANPP in Austria stays more or less constant at •50% from 1950 to 1995, despite significant changes in land use and land cover. For example, built-up area more than doubled and forest area grew signifi- cantly, both at the expense of cultivated land and grasslands. The growth in wood harvests 1950-1995 can be explained by an exceptionally low wood consumption in 1950 (shortly after the second World War), whereas wood consumption is currently growing quickly owing to industrial growth and as a result of policies that encourage the substitution of wood for fossil fuels as a means to reduce CO2 emissions [Haberl and Geissler, 2000; Krausmann, 2001 ].
Whereas the changes in HANPP relative to ANPPo from 1950 to 1995 we report in Figure 3 are certainly lower than the accuracy of our calculation, the agricultural and forestry data upon which our calculation is based are good enough to clearly discern the upward trend in ANPPact and harvest because we used comparable data and methods to calculate these trends. These trends have also been confirmed in an analysis of a longer time series (1830-1995) made by one of the authors [Krausmann, 2001].
3.3. Aboveground Standing Crop and Biomass Turnover
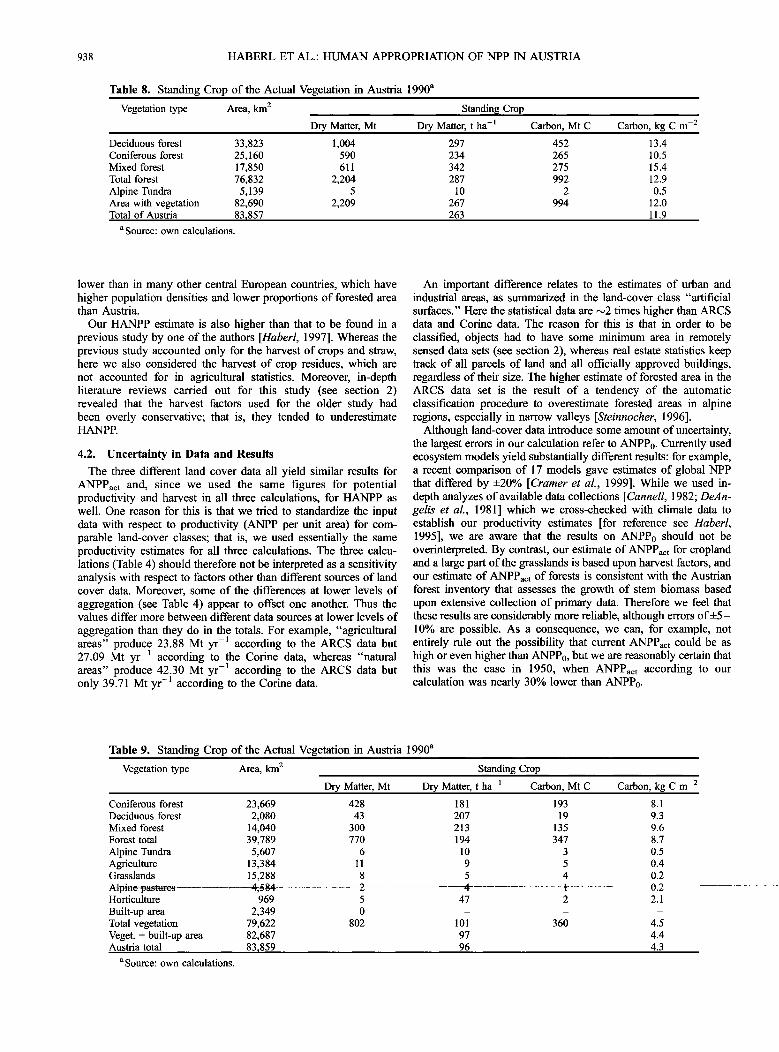
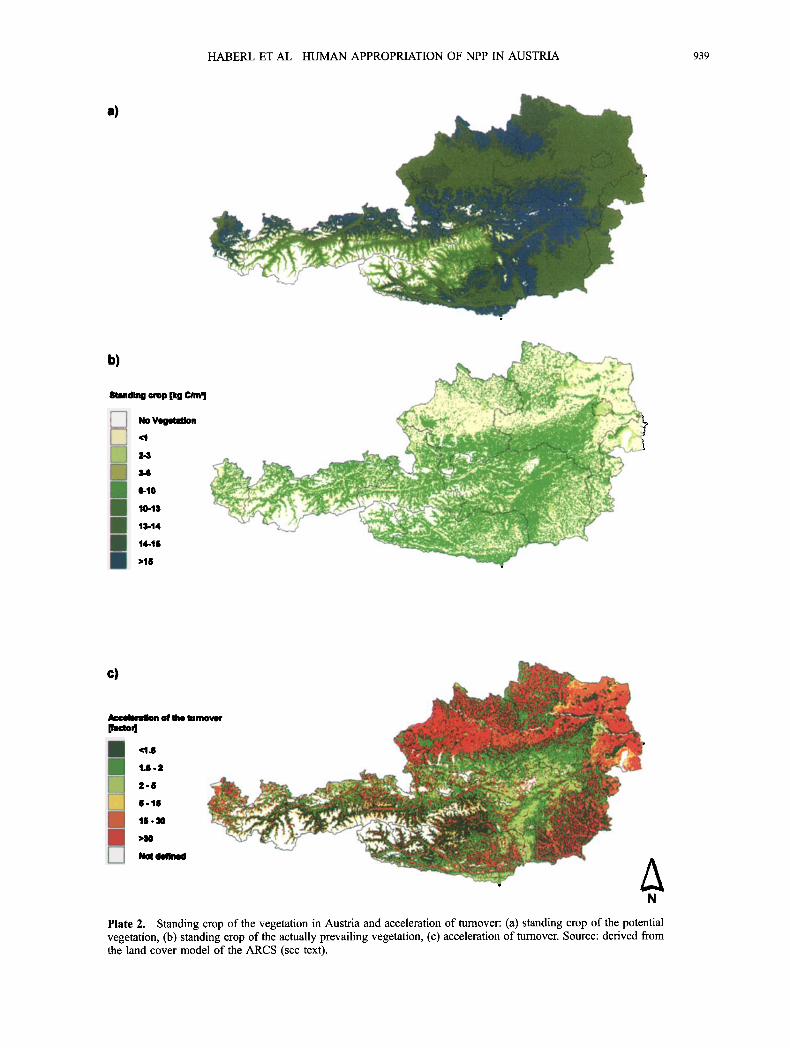
The calculation of the aboveground standing crop was based upon the statistical data. Table 8 displays the results for the standing crop of potential vegetation in Austria. The total standing crop is estimated at 2.2 billion tons (Gt) of dry matter (994 Mt C). Forests account for the bulk of this biomass (99.8%), the remainder being alpine tundra. Coniferous forests account for 26.7% of the biomass, deciduous forests for 45.5%, and mixed forests for 27.7%. We mapped the spatial distribution of the standing crop of potential vegetation in Austria (Plate 2a), based upon the ARCS land cover data. Whereas the ANPP gradient declines continuously from low to high altitudes, the aboveground standing crop is highest at medium altitudes. The deciduous tree species dominating at low elevations (e.g., Fagus sylvatica, Quercus spp.) reach considerably lower standing crop maxima than firs (Abies alba), which play an important role in the potential vegetation of alpine forest communities (see Figures 2a, 2b, and 2e). Thus, while lowlands generally fall between 13 and 14 kg C m -2, the aboveground standing crop exceeds 15 kg C m -2 in peripheral alpine regions. The values for standing crop are much lower in high alpine forests and especially in vegetation units above the timberline.
Table 9 reveals that the standing crop of actual vegetation in Austria is significantly smaller than that of the potential vegetation. The actual standing crop totals 802 Mt of dry matter, which is 64% less than the corresponding value for potential vegetation. Forests predominate, as they account for 94.8% of the total actual standing
936 HABERL ET AL.: HUMAN APPROPRIATION OF NPP IN AUSTRIA
a)
b)
c)
Aboveground Net Primary Productivity [tons of dry matter per hectare and year] • no production i ..... ] <3.2 t_• •} 3.2-5.3
5.3-7.4
7.4-8.9 8.9-10.0
, 10.0-10.8 >10.8
Plate 1. Maps of the aboveground net primary production in Austria as influenced by society: (a) ANPPo, productivity of the potential vegetation; (b) ANPPact, productivity of the actually prevailing vegetation; (c) ANPPt, biomass remaining in ecosystems after harvest. Source: own calculations based on the land cover model of the ARCS, derived from Landsat-TM data (see text).
HABERL ET AL.: HUMAN APPROPRIATION OF NPP 1N AUSTRIA 937
Table 7. Time Series of the Aboveground Net Primary Production (ANPPact) and Biomass Harvest in Austria 1950, 1970, and 1995 as Dry-Matter Biomass: Breakdown Into Land Use Classes a
ANPPact, Mt yr -1 Biomass Harvest (ANPPh), Mt yr -• 1950 1970 1995 1950 1970 1995
Urban areas 0.7 1.1 1.6 0.4 0.6 0.8
Agriculture 8.7 13.9 13.0 7.0 12.0 11.6 Grasslands 9.5 12.7 11.3 4.5 7.0 6.3
Forests 33.7 34.8 38.0 4.8 6.0 10.0
Alpine areas 2.2 2.2 2.2 0.1 0.1 0.1 Total 54.8 64.7 66.1 16.8 25.7 28.8
a Source: own calculations.
crop. Agriculture contributes 2.3%, all other vegetation units 2.9%. Plate 2b shows the spatial distribution of the actual standing crop,
revealing the fragmentation of forests 2(6-10 kg C m -2) due to agricultural land use (below 1 kg C m- ) and urban areas (between 1 and 6 kg C m-:).
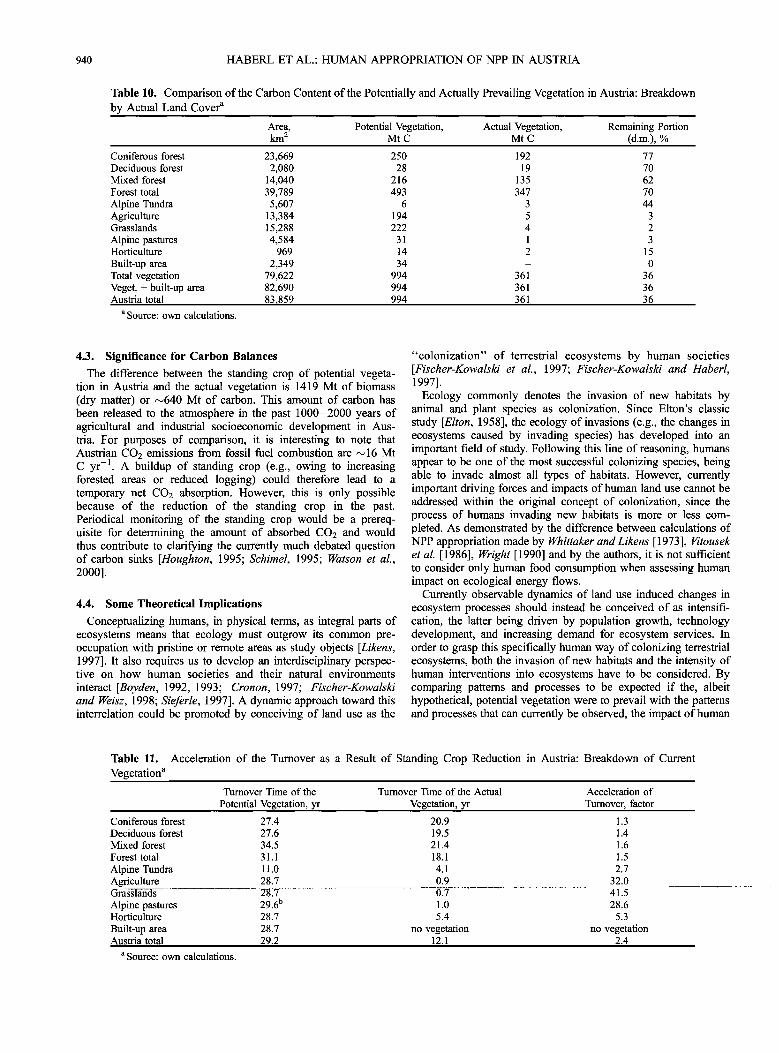
Table 10 compares the actual standing crop of main vegetation classes currently prevailing in Austria with the standing crop of the potential vegetation that would be expected to grow on the corresponding area. On average, the standing crop of the actually prevailing vegetation is 36% of that of the potential vegetation. Depending on land-cover class, between 0 and 77% of the initially existing standing crop remain. The percentage of remaining stand- ing crop is highest in forests (62-77%) and lowest in agricultural areas, grasslands, and built-up areas (0-3%). Forest management reduces the average standing crop in currently forested areas by 30%, compared to old-growth stands. That the reduction in stand- ing crop values is highest in mixed coniferous/deciduous stands results from the significant reduction in the density of firs (Abies alba).
Table 11 and Plate 2c show the acceleration of the turnover
(i.e., reduction of turnover time) which is a result of the land use induced changes in ecosystem functioning described above. Whereas the average turnover of the potential vegetation is 29.2 years, the average turnover of the actual vegetation is 12.1 years, the average acceleration being by a factor 2.4. However, the acceleration of the turnover reaches factors between
28 and 42 in land-cover classes with a very high reduction in standing crop.
4. Discussion
4.1. Comparison With Results of Previous Studies
A first calculation in the early 1970s concluded that the amount of biomass harvested for human food was only 0.8% of global NPP [Whittaker and Likens, 1973]. This order of magnitude hardly raised concern, but the calculation included mainly food consumed by humans and thus neglected a large part of the NPP foregone because of reduced productivity or used by human society for purposes other than human nutrition. l•tousek et aL [1986] estimated the global human appropriation of the products of photosynthesis at 24-39%. Wright [1990], using essentially the same data but distinguishing between destructive harvest (i.e., wood harvest resulting in deforestation) and harvest from continually managed ecosystems, arrived at 20-30%. Neither of these two calculations attempts to analyze the spatial distribution of HANPP; both refer to total NPP but rely on problematic estimates as far as belowground NPP is concerned (see section 2).
Our calculations show that the human appropriation of above- ground NPP in Austria is higher than the estimates of global NPP appropriation. Moreover, HANPP in Austria is presumably much
80 1 oo%
70
.• 60 • 50
o 40
o o 30
• 20
10
i i i i i i i i
0 t.O 0 t.O 0 t.O 0 t.O
9O%
8O%
70%
60%
50%
40%
30%
20%
lO%
0%
½ ANPPact
--u--ANPPt
---•--ANPPh
•HANPP
Figure 3. Human appropriation of aboveground net primary production in Austria from 1950 to 1995: ANPP of the actual vegetation (ANPPact), ANPP remaining in ecosystems (ANPPt) and harvest of ANPP (ANPPh) in Mt dry matter per year. HANPP (% of ANPPo, secondary axis) was calculated assuming a constant value of ANPPo. Source: own calculations.
938 HABERL ET AL.: HUMAN APPROPRIATION OF NPP IN AUSTRIA
Table 8. Standing Crop of the Actual Vegetation in Austria 1990 a
Vegetation type Area, km 2 Standing Crop Dry Matter, Mt Dry Matter, t ha-• Carbon, Mt C Carbon, kg C m -2
Deciduous forest 33,823 1,004 297 Coniferous forest 25,160 590 234 Mixed forest 17,850 611 342 Total forest 76,832 2,204 287 Alpine Tundra 5,139 5 10 Area with vegetation 82,690 2,209 267 Total of Austria 83•857 263
Source: own calculations.
452 13.4
265 10.5
275 15.4
992 12.9
2 0.5
994 12.0
11.9
lower than in many other central European countries, which have higher population densities and lower proportions of forested area than Austria.
Our HANPP estimate is also higher than that to be found in a previous study by one of the authors [Haberl, 1997]. Whereas the previous study accounted only for the harvest of crops and straw, here we also considered the harvest of crop residues, which are not accounted for in agricultural statistics. Moreover, in-depth literature reviews carried out for this study (see section 2) revealed that the harvest factors used for the older study had been overly conservative; that is, they tended to underestimate HANPP.
4.2. Uncertainty in Data and Results
The three different land cover data all yield similar results for ANPPact and, since we used the same figures for potential productivity and harvest in all three calculations, for HANPP as well. One reason for this is that we tried to standardize the input data with respect to productivity (ANPP per unit area) for com- parable land-cover classes; that is, we used essentially the same productivity estimates for all three calculations. The three calcu- lations (Table 4) should therefore not be interpreted as a sensitivity analysis with respect to factors other than different sources of land cover data. Moreover, some of the differences at lower levels of aggregation (see Table 4) appear to offset one another. Thus the values differ more between different data sources at lower levels of
aggregation than they do in the totals. For example, "agricultural areas" produce 23.88 Mt yr -• according to the ARCS data but 27.09 Mt yr -• according to the Corine data, whereas "natural areas" produce 42.30 Mt yr -• according to the ARCS data but only 39.71 Mt yr -• according to the Corine data.
An important difference relates to the estimates of urban and industrial areas, as summarized in the land-cover class "artificial surfaces." Here the statistical data are •2 times higher than ARCS data and Corine data. The reason for this is that in order to be
classified, objects had to have some minimum area in remotely sensed data sets (see section 2), whereas real estate statistics keep track of all parcels of land and all officially approved buildings, regardless of their size. The higher estimate of forested area in the ARCS data set is the result of a tendency of the automatic classification procedure to overestimate forested areas in alpine regions, especially in narrow valleys [Steinnocher, 1996].
Although land-cover data introduce some amount of uncertainty, the largest errors in our calculation refer to ANPPo. Currently used ecosystem models yield substantially different results: for example, a recent comparison of 17 models gave estimates of global NPP that differed by +20% [Cramer et al., 1999]. While we used in- depth analyzes of available data collections [Cannell, 1982; DeAn- gelis et al., 1981] which we cross-checked with climate data to establish our productivity estimates [for reference see Haberl, 1995], we are aware that the results on ANPPo should not be overinterpreted. By contrast, our estimate of ANPPact for cropland and a large part of the grasslands is based upon harvest factors, and our estimate of ANPPact of forests is consistent with the Austrian forest inventory that assesses the growth of stem biomass based upon extensive collection of primary data. Therefore we feel that these results are considerably more reliable, although errors of +5- 10% are possible. As a consequence, we can, for example, not entirely rule out the possibility that current ANPPact could be as high or even higher than ANPPo, but we are reasonably certain that this was the case in 1950, when ANPPact according to our calculation was nearly 30% lower than ANPPo.
Table 9. Standing Crop of the Actual Vegetation in Austria 1990 a
Vegetation type Area, km 2 Standing Crop
Dry Matter, Mt Dry Matter, t ha-• Carbon, Mt C Carbon, kg C m -2 23,669 428 181 193 8.1
2,080 43 207 19 9.3 14,040 300 213 135 9.6 39,789 770 194 347 8.7
5,607 6 10 3 0.5 13,384 11 9 5 0.4 15,288 8 5 4 0.2
Coniferous forest
Deciduous forest
Mixed forest
Forest total
Alpine Tundra Agriculture Grasslands
A!pi• pastures 4;5• 2 Horticulture 969 5
Built-up area 2,349 0 Total vegetation 79,622 802 Veget. + built-up area 82,687 Austria total 83 •859
a Source: own calculations.
4 ! 0.2
47 2 2.1
101 360 4.5
97 4.4
96 4.3
HABERL ET AL.: HUMAN APPROPRIATION OF NPP IN AUSTRIA 939
a)
b)
Standing crop [kg CIm
---] No Vegetation
•_• 2-3
6-10
10-13
13-14
14-15
>15
c)
Acceleration of the turnover
Plate 2. Standing crop of the vegetation in Austria and acceleration of ramover: (a) standing crop of the potential vegetation, (b) standing crop of the actually prevailing vegetation, (c) acceleration of ramover. Source: derived from the land cover model of the ARCS (see text).
940 HABERL ET AL.' HUMAN APPROPRIATION OF NPP IN AUSTRIA
Table 10. Comparison of the Carbon Content of the Potentially and Actually Prevailing Vegetation in Austria: Breakdown by Actual Land Cover a
Area, Potential Vegetation, Actual Vegetation, Remaining Portion km 2 Mt C Mt C (d.m.), %
Coniferous forest 23,669 250 192 77 Deciduous forest 2,080 28 19 70 Mixed forest 14,040 216 135 62 Forest total 39,789 493 347 70 Alpine Tundra 5,607 6 3 44 Agriculture 13,384 194 5 3 Grasslands 15,288 222 4 2 Alpine pastures 4,584 31 1 3 Horticulture 969 14 2 15
Built-up area 2,349 34 - 0 Total vegetation 79,622 994 361 36 Veget. + built-up area 82,690 994 361 36 Austria total 83,859 994 361 36
a Source: own calculations.
4.3. Significance for Carbon Balances
The difference between the standing crop of potential vegeta- tion in Austria and the actual vegetation is 1419 Mt of biomass (dry matter) or •640 Mt of carbon. This amount of carbon has been released to the atmosphere in the past 1000-2000 years of agricultural and industrial socioeconomic development in Aus- tria. For purposes of comparison, it is interesting to note that Austrian CO2 emissions from fossil fuel combustion are •16 Mt C yr -•. A buildup of standing crop (e.g., owing to increasing forested areas or reduced logging) could therefore lead to a temporary net CO2 absorption. However, this is only possible because of the reduction of the standing crop in the past. Periodical monitoring of the standing crop would be a prereq- uisite for determining the amount of absorbed CO2 and would thus contribute to clarifying the currently much debated question of carbon sinks [Houghton, 1995; Schimel, 1995; Watson et al., 2000].
4.4. Some Theoretical Implications
Conceptualizing humans, in physical terms, as integral parts of ecosystems means that ecology must outgrow its common pre- occupation with pristine or remote areas as study objects [Likens, 1997]. It also requires us to develop an interdisciplinary perspec- tive on how human societies and their natural environments
interact [Boyden, 1992, 1993; Cronon, 1997; Fischer-Kowalski and Weisz, 1998; Sieferle, 1997]. A dynamic approach toward this interrelation could be promoted by conceiving of land use as the
"colonization" of terrestrial ecosystems by human societies [Fischer-Kowalski et al., 1997; Fischer-Kowalski and Haberl, 1997].
Ecology commonly denotes the invasion of new habitats by animal and plant species as colonization. Since Elton's classic study [Elton, 1958], the ecology of invasions (e.g., the changes in ecosystems caused by invading species) has developed into an important field of study. Following this line of reasoning, humans appear to be one of the most successful colonizing species, being able to invade almost all types of habitats. However, currently important driving forces and impacts of human land use cannot be addressed within the original concept of colonization, since the process of humans invading new habitats is more or less com- pleted. As demonstrated by the difference between calculations of NPP appropriation made by Whittaker and Likens [1973], 14'tousek et al. [1986], Wright [1990] and by the authors, it is not sufficient to consider only human food consumption when assessing human impact on ecological energy flows.
Currently observable dynamics of land use induced changes in ecosystem processes should instead be conceived of as intensifi- cation, the latter being driven by population growth, technology development, and increasing demand for ecosystem services. In order to grasp this specifically human way of colonizing terrestrial ecosystems, both the invasion of new habitats and the intensity of human interventions into ecosystems have to be considered. By comparing patterns and processes to be expected if the, albeit hypothetical, potential vegetation were to prevail with the patterns and processes that can currently be observed, the impact of human
Table 11. Acceleration of the Turnover as a Result of Standing Crop Reduction in Austria: Breakdown of Current Vegetation a
Turnover Time of the
Potential Vegetation, yr Turnover Time of the Actual
Vegetation, yr Acceleration of
Turnover, factor
Coniferous forest 27.4 20.9 1.3
Deciduous forest 27.6 19.5 1.4
Mixed forest 34.5 21.4 1.6
Forest total 31.1 18.1 1.5
Alpine Tundra 11.0 4.1 2.7 Agriculture 28.7 0.9 32.0 Gr•sla•ds 281• 0.7 41.5
Alpine pastures 29.6 b 1.0 28.6 Horticulture 28.7 5.4 5.3
Built-up area 28.7 no vegetation no vegetation Austria total 29.2 12.1 2.4
Source: own calculations.
HABERL ET AL.: HUMAN APPROPRIATION OF NPP IN AUSTRIA 941
colonization on terrestrial ecosystems can be assessed. We believe that appraisals of human appropriation of NPP and human impact on standing crop and biomass turnover are useful in demonstrating the human colonization of ecosystem processes from a spatial as well as from a temporal perspective. These appraisals can be applied to assess the physical "scale" of human societies as compared to its natural environment [Daly, 1992] and can thus help us to understand human society as an ecosystem component, as proposed, for example, by McDonnell and Pickett [1997].
Acknowledgments. This research was funded by the Austrian Federal Ministry of Science and Transport in the research program "Cultural Landscapes." The authors are indebted to participants of this project: W. Bittermann, M. Fischer-Kowalski, W. Hfittler, H. Schandl, and V. Winiwar- ter. We thank B. Hammer for supporting literature work, A.H. Lewis for correcting the English, and two anonymous reviewers and the editor for useful comments and suggestions.
References
Ajtay, G. L., P. Ketner, and P. Duvigneaud, Terrrestrial primary production and phytomass, in The Global Carbon Cycle, edited by B. Bolin et al., pp. 129-182, J. Wiley, New York, 1979.
Aubrecht, P., Das europ.•iische Landnutzungsprojekt Corine Landcover und erste Ergebnisse ffir Osterreich, in Beitriige zum Symposium fiir Ange- wandte Geographische Informations-Technik, 3.-5. Juli 1996, Salzbur- get Geogr. Mater, rep. 24, edited by F. Dollinger, pp. 37-42, Inst. ftir Geogr. der Univ. Salzburg, Sa.!zburg, Austria, 1996.
Aubrecht, P., Corine landcover Osterreich - vom Satellitenbild zum digita- len Bodenbedeckungsdatensatz, rep., 61 pp., Fed. Minist. Environ., Youth and Family, Vienna, 1998.
Austin, R. B., J. Bingham, R. D. Blackwell, L. T. Evans, M. A. Ford, C. L. Morgan, and M. Taylor, Genetic improvements in winter wheat yields since 1900 and associated physiological changes, J. Agric. Sci., 94, 675- 685, 1980.
Boyden, S., Biohistory, The Interplay Between Human Society and the Biosphere, 265 pp., United Nations Educ., Sci., and Cult. Org., Paris, 1992.
Boyden, S., The human component of ecosystems, in Humans as Compo- nents of Ecosystems, The Ecology of Subtle Human Effects and Populated Areas, edited by M. J. McDonnell and S. T. A. Pickett, pp. 72-78, Springer-Verlag, New York, 1993.
Brown, J. H., Species diversity, in Analytical Biogeography, edited by A. A. Myers and P.S. Giller, pp. 57-89, Chapman and Hall, New York, 1991.
Brown, J. H., Macroecology, 269 pp., Chicago Univ. Press, Chicago, II1., 1995.
Burschel, P., E. Kfirsten, and B. C. Larson, Die Rolle von Wald- und For- stwirtschafi im Kohlenstoffhaushalt, Eine Betrachtung fiir die Bundesre- publik Deutschland, Forstliche Forschungsberichte Mh'nchen, 126, 135 pp., Forstwissenschaftliche Fakultfit der Univ. Mfinchen, Mfinchen, Ger- many, 1993.
Cannell, M. G. R., Worm Forest Biomass and Primary Production Data, 391 pp., Academic, San Diego, Calif., 1982.
Cramer, W., D. Kicklighter, A. Bondeau, B. Moore, III, G. Churkina, B. Nemry, A. Ruimy, A. Schloss, and The Participants of the Potsdam NPP Model Intercomparison, Comparing global models of terrestrial net pri- mary productivity (NPP): Overview and key results, Global Change Biol., 5, suppl. 1, 1-15, 1999.
Cronon, W. J., Foreword: The turn toward history, in Humans as Compo- nents of Ecosystems, The Ecology of Subtle Human Effects and Populated Areas, edited by M. J. McDonnell and S. T. A. Pickett, pp. vii-x, Springer-Verlag, New York, 1997.
Daly, H. E., Vom Wirtschaften in einer leeren Welt zum Wirtschaften in einer vollen Welt, in Nach dem Brundtlandbericht: Nachhaltige Wirtschafiliche Entwicklung, edited by R. Goodland et al., pp. 29-40, United Nations Educ., Sci., and Cult. Org., Paris, 1992.
DeAngelis, D. L., R. H. Gardner, and H. H. Shugart, Productivity of forest ecosystems studied during the IBP: the woodland data set, in Dynamics of Forest Ecosystems, edited by D. E. Reichle, pp. 567-672, Cambridge Univ. Press, New York, 1981.
Donald, C. M., and J. Hamblin, The biological yield and harvest index of cereals as agronomic and plant breeding criteria, Adv. Agron., 28, 361- 405, 1976.
Donald, C. M., and J. Hamblin, The convergent evolution of annual seed crops in agriculture, Adv. Agron., 36, 97-143, 1984.
D6rflinger, A., P. Hietz, R. Maier, W. Punz, and K. Fussenegger, •)kosys- tem Grol3stadt Wien, Quantifizierung des Energie-, Kohlenstoff- und Wasserhaushalts unter besonderer Bedicksichtigung der Vegetation, 117 pp., Inst. of Plant Physiology, Wien, Austria, 1994.
Elton, C. S., The Ecology of Invasions by Animals and Plants, 181 pp., Methuen, London, 1958.
Erb, K. H., Die Beeinflussung des oberirdischen Standing Crop und Tum- over in 6sterreich durch die menschliche Gesellschaft, 202 pp., Diplo- marbeit an der Univ. Wien, Inst. ftir Pflanzenphysiologie, Vienna, 1999.
Feil, B., Breeding progress in small grain cereals: A comparison of old and modem cultivars, Plant Breeding, 108, 1 - 11, 1992.
Fischer-Kowalski, M., and H. Haberl, Tons, joules, and money: Modes of production and their sustainability problems, Soc. Nat. Resour., 10, 61- 85, 1997.
Fischer-Kowalski, M., and H. Weisz, Gesellschaft als Verzahnung materi- eller und symbolischer Welten, in Soziologie und Natur, Theoretische Perspektiven, edited by K. W. Brand, pp. 145-172, Leske and Budrich, Opladen, Germany, 1998.
Fischer-Kowalski, M., H. Haberl, W. Hfittler, H. Payer, H. Schandl, V. Winiwarter, and H. Zangerl-Weisz, Gesellschafiliche.r. Stoffwechsel und Kolonisierung von Natur, Ein Vetsuch in Sozialer Okologie, 292 pp., Gordon and Breach Fakultas, Amsterdam, 1997.
Franz, H., Okologie der Hochgebirge, 495 pp., Ulmer, Stuttgart, Germany, 1979.
Gerhold, S., Stoffstromrechnung, Holzbilanz 1955 bis 1991, Stat. Nachr., 47, 651-656, 1992.
Haberl, H., Menschliche Eingriffe in den natfirlichen Energieflul3 von •)ko- systemen, Pap. 43, 169 pp., Inst. ffir Interdisziplinfire Forschung und Fortbildung (IFF)-Soc. Ecol., Vienna, 1995.
Haberl, H., Human appropriation of net primary production as an environ- mental indicator: implications for sustainable development, Ambio, 26, 143 - 146, 1997.
Haberl, H., and S. Geissler, Cascade utilization of biomass: How to cope with ecological limits to biomass use, Ecol. Eng., 16, S 111- S 121, 2000.
Harmon, M. E., W. K. Ferrell, and J. F. Franklin, Effects on carbon storage of conversion of old-growth forests to young forests, Science, 247, 699- 702, 1990.
Houghton, R. A., Land-use change and the carbon cycle, Global Change Biol., 1,275-287, 1995.
Houghton, R. A., J. E. Hobbie, J. M. Melillo, B. Moore, B. J. Peterson, G. R. Shaver, and G. M. Woodwell, Changes in the carbon content of terrestrial biota and soils between 1860 and 1980: A net release of
CO2 to the atmosphere, Ecol. Monogr., 53, 235-262, 1983. K6mer, C., B. Schilcher, and S. Pelaez-Riedl, Vegeta.t. ion und die Treib-
hausproblematik: eine Beurteilung der Situation in Osterreich unter be- sonderer Bedicksichtigung der Kohlenstoffbilanz, in Anthropogene Klimadnderung.'..Mdgliche Auswirkungen auf Osterreich - mdgliche Mafinahmen in Osterreich, Bestandsaufnahme und Dokumentation, edi- ted by Kommission zur Reinhaltung der Luft, •Ssterreichische Akade- mie der Wissenschaften, pp. 6.1-6.46, Austrian Acad. of Sci., Vienna, 1993.
Krausmann, F., Land use and industrial modemization: An empirical ana- lysis of human influence on the functioning of ecosystems in Austria 1830-1995, Land Use Policy, 18, 17-26, 2001.
Liebel, G., and P. Aubrecht, Das CORINE Landcover-Projekt der EU, Z. Vermessung Geoinformation, 84, 43-44, 1996.
Lieth, H., Modeling the primary productivity of the world, in Primary Productivity of the Biosphere, edited by H. Lieth and R. H. Whittaker, pp. 237-264, Springer-Verlag, New York, 1975.
Lieth, H., and R. H. Whittaker, Primary Productivity of the Biosphere, 339 pp., Springer-Verlag, New York, 1975.
Likens, G. E., Preface, in Humans as Components of Ecosystems: The Ecology of Subtle Human Effects and Populated Areas, edited by M. J. McDonnell and S. T. A. Pickett, p. xi, Springer-Verlag, New York, 1997.
Mayer, H., Wdlder des Ostalpenraumes, Standoft, AuJbau und waldbau- liche Bedeutung der wichtigsten Waldgesellschafien in den Ostalpen samt Vorland, 344 pp., Fischer, Stuttgart, Germany, 1974.
McDonnell, M. J., and S. T. A. Pickett, Humans as Components of Eco- systems, The Ecology of Subtle Human Effects and Populated Areas, 364 pp., Springer-Verlag, New York, 1997.
Melillo, J. M., and J. R. Gosz, Interactions of biogeochemical cycles in forest ecosystems, in The Major Biogeochemical Cycles and Their Inter- actions, edited by B. Bolin and R. B. Cook, pp. 177-222, John Wiley, New York, 1983.
Meyer, W. B., Human Impact on the Earth, 253 pp., Cambridge Univ. Press, New York, 1996.
Meyer, W. B., and B. L. Tumer, Changes in Land Use and Land Cover.' A Global Perspective, 537 pp., Cambridge Univ. Press, New York, 1994.
942 HABERL ET AL.: HUMAN APPROPRIATION OF NPP IN AUSTRIA
Mitscherlich, G., Form und Wachstum yon Baum und Bestand. Wald, Wach- stum und Umwelt, vol. 1, 142 pp., Sauerlfinder, Frankfurt, Germany, 1975.
(Ssterreichisches Statistisches Zentralamt ((SSTAT), Ergebnisse der land- wirtschaftlichen Statistik im Jahre 1991, 146 pp., Beitrdige zur land- wirtschafilichen Statistik 1062, Vienna, 1992.
Paulsen, J., Der biologische Kohlenstoffvorrat der Schweiz, 136 pp., Rfieg- ger, Zfirich, 1995.
Reichle, D. E., Analysis of Temperate Forest Ecosystems, 296 pp., Springer- Verlag, New York, 1975.
Riggs, T. J., P. R. Hanson, N. D. Start, D. M. Miles, C. L. Morgan, and M. A. Ford, Comparison of spring barley varieties grown in England and Wales between 1880 and 1980, J. Agric. Sci., 97, 599-610, 1981.
Sattler, P., Oberirdische Biomasse und Nfihrelemente von Kahlschlagvege- tation in •'eselburg, PiSggstall und Giittweig (N(5), 95 pp., Diplomarbeit an der Univ. fiir Bodenkultur, Vienna, 1990.
Schieler, K., Bfichsenmacher, R., and Schadaner, K., Osterreichische For- stinventur, Ergebnisse 1986/90, Forstliche Bundesversuchsanstalt, Wald- forschungszentmm, Bundesministerium fiir Land- und Forstwirtschaft, Vienna, 1996.
Schimel, D. S., Terrestrial ecosystems and the carbon cycle, Global Change Biol., 1, 77- 91, 1995.
Schimel, D. S., VEMAP-Participants, and B. H. Braswell, Continental scale variability in ecosystem processes: Models, data, and the role of distur- bance, Ecol. Monogr., 67, 251-271, 1997.
Schlesinger, W. H., Biogeochemistry, An Analysis of Global Change, 2rid ed., 588 pp., Academic, San Diego, Calif., 1997.
Schulz, N., Auswirkungen von Landnutzung auf (Skosyste..mprozesse: Die menschliche Aneignung von Nettoprimfirproduktion in Osterreich, ver- gleichende Berechnung arthand verschiedener Datenquellen, 149 pp., Masters thesis, Univ. of Vienna, Vienna, 1999.
Shugart, H. H., A Theory of Forest Dynamics, The Ecological Conse- quences of Forest Succession Models, 278 pp., Springer-Verlag, New York, 1984.
Sieferle, R. P., Kulturelle Evolution des Gesellschafts-Natur-Verhfiltnisses, in Gesellschafilic.h. er Stoffwechsel und Kolonisierung yon Natur, Ein Vet- such in Sozialer Okologie, edited by M. Fischer-Kowalski et al., pp. 37- 55, Gordon and Breach Fakultas, Amsterdam, 1997.
Singh, I.D., and N. C. Stoskopf, Harvest index in cereals, Agron. J., 63, 224-226, 1971.
Singh, J. S., W. K. Lauenroth, H. W. Hunt, and D. M. Sift, Bias and random errors in estimators of net root production: A simulation approach, Ecol- ogy, 65, 1760-1764, 1984.
Steinnocher, K., Integration of spectral and spatial classification methods for building a land-use model of Austria, Int. Archives of Photogramme- try and Remote Sensing, 31B4, 841-846, 1996.
Turner, J. R. G., J. J. Lennon, and J. A. Lawrenson, British bird species distribution and the energy theory, Nature, 335, 539-541, 1988.
Tfixen, R., Die heutige potentielle natfirliche Vegetation als Gegenstand der Vegetationskartierung, Angew. Pfianzensoziologie, 13, 5-42, 1956.
Vitousek, P.M., P. R. Ehrlich, A. H. Ehrlich, and P. A. Matson, Human appropriation of the products of photosynthesis, BioScience, 36, 368- 373, 1986.
Vitousek, P.M., H. A. Mooney, J. Lubchenko, and J. M. Melillo, Human domination of earth's ecosystems, Science, 277, 494-499, 1997.
Vogt, K. A., C. C. Grier, C. E. Meier, and R. L. Edmonds, Mycorrhizal role in net primary production and nutrient cycling in Abies amabilis ecosys- tems in Western Washington, Ecology, 63, 370-380, 1982.
Vogt, K. A., C. C. Grier, and D. J. Vogt, Production, turnover, and nutrient dynamics of above- and belowground detritus of world forests, Adv. in Ecol. Res., 15, 303-377, 1986.
Walker, B., and W. Steffen, Global Change and Terrestrial Ecosystems, 619 pp., Cambridge Univ. Press, New York, 1996.
Walter, H., and H. Lieth, Klimadiagramm-Weltatlas, VEB Fischer, Jena, Germany, 1973.
Waring, R. H., and W. H. Schlesinger, Forest Ecosystems, Concepts and Management, 340 pp., Academic Press, San Diego, Calif., 1985.
Watson, R.T., I. R. Noble, B. Bolin, N.H. Ravindranath, D. J. Verardo, and D. J. Dokken, Land Use, in Land-Use Change, and Forestry, A Special Report to the IPCC, 377 pp., Cambridge Univ. Press, New York, 2000.
Whittaker, R. H., and G. E. Likens, Primary production: The biosphere and man, Human Ecol., 1, 357-369, 1973.
Wright, D. H., Species-energy theory, an extension of species-area theory, Oikos, 41, 495-506, 1983.
Wright, D. H., Estimating human effects on global extinction, Int. •. Bio- meteorology, 31, 293-299, 1987.
Wright, D. H., Human impacts on the energy flow through natural ecosys- tems, and implications for species endangerment, Ambio, 19, 189-194, 1990.
K.-H. Erb, H. Haberl, F. Krausmann, N. Schulz, and H. Weisz, Department of Social Ecology Institute for Interdisciplinary Research of Austrian Universities, Schottenfeldgasse 29, A-1070 Vienna, Austria. (helmut'haberl@univie'ac'at)
W. Loibl, Austrian Research Centers Seibersdorf, Systems Research Division, Environmental Planning Department, A-2444 Seibersdorf, Austria.
(Received March 15, 2000; revised March 14, 2001; accepted March 27, 2001.)