Aboveground production and growth dynamics of vascular ...
108
ACTA PHYTOGEOGRAPHICA SUECICA 74 EDIDIT SVENSKA VAXTGEOGRAFISKA SALLSKAPET lngvar Backeus Aboveground production and growth dynamics of vascular bog plants in Central Sweden UPPSALA 1 985
-
Upload
khangminh22 -
Category
Documents
-
view
3 -
download
0
Transcript of Aboveground production and growth dynamics of vascular ...
ACTA PHYTOGEOGRAPHICA SUECICA 74 EDIDIT
SVENSKA V AXTGEOGRAFISKA SALLSKAPET
lngvar Backeus
Aboveground production and growth dynamics of vascular bog plants in
Central Sweden
UPPSALA 1 985

ACTA PHYTOGEOGRAPHICA SUECICA 74 EDIDIT
SVENSKA V AXTGEOGRAFISKA SALLSKAPET
lngvar Backeus
Aboveground production and growth dynamics of vascular bog plants in
Central Sweden
Almqvist & Wiksell International , Stockholm UPPSALA 1 985
Doctoral thesis at Uppsala University 1 985
ISBN 9 1 -72 10-074-5 (paperback) ISBN 9 1 -72 1 0-474-0 (cloth) ISSN 0084-5914
Backeus, I. 1985: A boveground production and growth dynamics of vascular bog plants i n Cen
tral Sweden. Acta Phytogeogr. Suec . 74, 98 pp. ISBN 9 1 -72 10-074-5; ISBN 9 1 -7210-740-0.
Aboveground primary production and biomass of the field layer plants were studied on an ombrotrophic mire in the central Swedish uplands. The study was made on the population level, and results on the population ecology of certain species were also obtained. The study included A ndromeda polifolia, Betula nana, Calluna vulgaris, Drosera anglica, D. rotundifolia, Empet
rum nigrum s . str . , Eriophorum vaginatum, Rhynchospora alba, Rubus chamaemorus,
Scheuchzeria palustris, Trichophorum caespitosum, Vaccinium microcarpum, V. oxycoccos
and V. uliginosum. Production and biomass per unit area of each species and of modules (leaves, inflorescences, etc . ) of certain species were determined from figures on mean individual weight and mean density. Aboveground biomass of vascular plants was estimated at 2700 kg· ha·1 on hummocks, 682 kg· ha·1 in 'lawns' and 3 10-390 kg· ha·1 in two kinds of 'carpets' (Cuspidatetum dusenietosum and C. tenelletosum Fransson, respectively). Total aboveground production of vascular plants was 830, 6 1 0, 360 and 340 kg · ha·1 • year·1, respectively.
Growth in some species was followed throughout the growing season through repeated harvesting . Seasonal variation in weight of individual leaves was similarly followed in evergreen species. Length growth of shoots of six species and length growth of leaves in two monocots were followed through direct measurements. Length growth rate of B. nana and Calluna shoots and of Scheuchzeria leaves was shown to be closely dependent on temperature, while growth of E. vaginatum leaves was not.
Two peaks in production were found: ( 1 ) during shoot formation in June and (2) in August when perennial leaves were becoming winter-hardened and wood increment in Calluna and A n
dromeda (remarkably late) took place. Seasonal changes in biomass were comparatively small because of evergreenness in the dominant species.
Survivorship of leaves of certain species was studied. Flowering was poor and seedlings absent in most species. Instead plants were propagated vegetatively, and different means for such propagation are discussed. The interactions between the field and bottom layer plants are also discussed, notably how the former avoid being overgrown by mosses .
Ingvar Backeus, Institute of Ecological Botany, Box 559, S-751 22 Uppsala, Sweden
© Ingvar Backeus 1 985
Svenska Vaxtgeografiska Sallskapet Box 559, 75 1 22 Uppsala
Editor : Erik Sjogren Technical editor : Gunnel Sjors
Phototypesetting: Textgruppen i Uppsala AB Printed in Sweden 1 985 by Borgstroms Tryckeri AB, Motala
Contents
The study area 7 Topography and geology 7 Climate and weather 7
Temperature 7, Precipitation 1 1 Vegetation 1 2 Description o f the sampling areas 1 5
Phenological development 1 7 Methods o f collecting and presenting the phenological data 1 7 Results and discussion 1 7
Production and dynamics of individual species 20 Methods 20 Andromeda polifolia 2 1 Betula nana 26 Calluna vulgaris 28 Carex limosa 33 Carex pauciflora 33 Drosera anglica 33 Drosera rotundifolia 34 Empetrum nigrum 35 Eriophorum vaginatum 39 Rhynchospora alba 48 Rubus chamaemorus 5 1 Scheuchzeria palustris 56 Trichophorum caespitosum 60 Vaccinium microcarpum 62 Vaccinium oxycoccos 63 Vaccinium uliginosum 64
Field layer density, biomass and production 68 Discussion on methods 68 Density 72 Mean total aboveground biomass and production 72 The seasonal course of the total aboveground production and changes in the total aboveground biomass 77
The seasonal course of production 77, Seasonal changes in biomass 77 Variations between years in production 80 The dependence on environmental variables of length growth in stems and leaves 8 1

4 lngvar Backeus
The bog environment and the behaviour of plants
Rate of production Flowering and reproduction Vegetative propagation Moss overgrowth Grime's C-, S- and R-selection Age structure of modules Interdependence of ramets Concluding remarks
References
84 84 85 86 87 88 89 90 9 1
92
Introduction
Works in production ecology, e .g . within the International Biological Programme, have often been ecosystem-oriented . Great efforts have been made to obtain figures on the total biomass and production in various ecosystems. The work input in this kind of investigation is considerable also when only moderate resolution is accepted and time-consuming harvesting, sorting and weighing are necessary.
It is also possible to make production ecological studies on the population level . By working out suitable techniques for all or the more important species , figures on total production can be obtained also by such an approach, which is attempted in this treatise .
The aim is somewhat different than in an ecosystem-oriented study, even though populations of organisms are often used as a basis also in the latter type of investigation. Other variables are measured and information on density, age structure, growth rhythm and growth rate is obtained .
In contrast to animals, higher plants do not have a definite size. The size instead varies with the environment , both the abiotic and the biotic. The individual ' modules' of the plant, leaves , flowers , etc . usually vary much less (cf. Harper 1 978) . The study of these metapopulations (White 1 979) refines the production ecological methodology and increases our knowledge of the survival potential of the individual .
Population ecologists usually work with only one or a few , similar or contrasting, species . Examples that will be discussed later are found in Fetcher & Shaver ( 1 983), Flower-Ellis ( 1 97 1 ) , Karlsson ( 1982) , Noble et al . ( 1 979) , Robertson & Woolhouse ( 1 984a,b), Sarukhan & Harper ( 1 973) and Schmid ( 1984) . The response of these species to environmental factors in different environments is studied . It has been less common to study the response to environmental factors of all the different populations in a community . Evidently the work on each species cannot be very intense in such a study and has to focus on the main points , but nevertheless it might be
possible to draw more general conclusions about the response of plants to the particular environment that was studied .
The aim of my investigation has been to find out the distribution of production in time and space (within a plant and within the site) of all field layer plants (including Betula nana) on an ombrotrophic mire . The amount of work and numerous methodological problems made it necessary to exclude the bottom layer and the rhizosphere as well as decomposition at this stage. This limitation of course has caused gaps in my results that will have to be filled before a reasonably good understanding of the production on the bog can be obtained .
The ombrotrophic mire is an extreme environment . There is no input of nutrients except through precipitation . There are several reasons for this choice of study object , besides the obvious fact that ombrotrophic mires constitute important ecosystems in Scandinavia and are interesting per se:
The vegetation is poor in species and all species are fairly well distributed within the community. Such a simple system makes it easier to work out methods , and the low number of species makes it possible to study all species .
Few environmental factors vary within one site. The water level varies in space in an obvious and easily understandable way and lack of water is rare for the field layer plants . The chemistry of the substrate is very uniform. In time, temperature is an important variable factor and in space (and time) the overgrowth by mosses .
The ombrotrophic bog is an unusually well-defined ecosystem and this was also a reason for my choice . Within a restricted area this ecosystem recurs from site to site with very little variation. In a larger area, e .g . Europe or Holarctis , the variation is certainly greater but still moderate and usually successive. Comparisons with investigations from other places are therefore easy to make.
As a mire ecologist I should also explain why I have chosen to study production . The mire plants
Acta Phytogeogr. Suec. 74
6 lngvar Backeus
form their substrate themselves through production and decomposition. Information on total production and decomposition must therefore be essential for a better understanding of the mechanisms behind the rise of the mire surface and its differentiation into hydromorphological structures , of the relations between these structures and of their sequence in time . Production and production processes are therefore central problems in mire ecology. Here it must again be emphasized that my investigation is still in its beginning . The aboveground parts of the vascular plants contribute very little to the peat formation . Peat is mainly formed by mosses and below ground parts of vascular plants and a lot of work therefore remains to be done .
Important constituents of mire ecology are also supply and transport of mineral nutrients (see e .g . Malmer & Nihlgard 1 980) and translocations of organic nutrients . Neither of these aspects are treated here .
A cta Phytogeogr. Suec. 74
I have had the opportunity to carry out the field work on a bog that was previously thoroughly investigated ecologically, the ' Special Area' of the Skattlosberg Stormosse (Sjors 1 948) . Sjors described in detail the vegetation and the distribution of plants and mineral elements in this area. This made it possible for me to concentrate from the beginning on production studies without lengthy data collections concerning the vegetation and environment.
The field work was carried out in 1 980, 1 98 1 and 1 982, thus giving figures from three successive growing periods .
Nomenclature for vascular plants follows Moore ( 1 982) , except for Empetrum nigrum v. hermaphro
ditum, which is here treated as a species (E. her
maphroditum Hagerup) and Scirpus cespitosus,
which is here called Trichophorum caespitosum (L.) Hartm. Nomenclature for bryophytes follows Corley et al . ( 1 98 1 ) and Grolle ( 1976) and for lichens Santesson ( 1 984) .
The study area
The bog Skattlosberg Stormosse is located in the southwestern part of the province of Dalarna (Kopparberg County) in central Sweden (Fig. 1 ) . The physical conditions of Bergslagen (i .e . S Dalarna, N Vastmanland and E Varmland) in general and especially of the Skattlosberg Stormosse were dealt with by Sjors ( 1 948: 1 6-32 and 68- 1 04 in Swedish; 277-278 and 282-284 in English) . Also the vegetation and flora of the Skattlosberg Stormosse were described in detail by Sjors (op . cit . : 105-1 7 1 in Swedish; 284-286 in English) . For further details, reference should be made to Sjors' s publication.
Topography and geology
The Skattlosberg Stormosse is situated at an elevation of 265 to 285 m a . s . l . The geology of the area was described by Magnusson & Lundqvist ( 1 933) . The mire rests on glacio-lacustrine sand and sandy ablation till .
The SkattlOsberg Stormosse is a large, 450 ha, mire complex (Sjors 1 948) . It consists of a number
Fig . 1 . Map of Central Sweden showing the location of the Skattlosberg Stormosse.
of excentric bogs separated by fen soaks . The soaks, except the southern ones , run towards a central big soak sloping east and partly consisting of large flarks . A map of the mire was presented by Sjors ( 1 948) .
Climate and weather
Temperature In June 1 98 1 I set up a temperature screen with a thermohygrograph in the middle of the Special Area (ea. 280 m a .s . l . ) . Data were collected during 198 1 and 1 982, but with several breaks . In some periods maximum and minimum temperatures were also recorded from thermometers.
The aim of these measurements was to achieve a picture of the temperature conditions during the years of data collecting and to determine the local temperature climate .
The data had to be completed through a series of adjustments and interpolations . First the minimum (n = 35) and maximum (n =52) temperatures read
\ \ ' '
I I
"',, ',-,�:1 \ Dalarna
(/
Viirmland
\ \ \
I ' \ \
'-,... )( �--, .... '
"'' ;'
' ' I '-' I
I
... � .... _, ',, I I ': \ ... ..'- I
: vastmanland I I,
/ I
/
; ........ ----
-- __ l-/5\ ,,_) -,' -'
I
Uppland
Acta Phytogeogr. Suec. 74
8 Ingvar Backeus
from the thermometers were compared to minimum and maximum temperatures read from the graph on the same day. The mean deviation was used to correct the minimum temperature values given by the graph on days when thermometer readings were not available.
Then minimum (n = 1 85) and maximum (n = 1 78) temperatures from the thermometers (when available) or from the graph and temperature values for 0700 (n = 1 80) , 1 300 (n = 1 82) and 1 900 (n = 1 83) hours read from the graph (corrected twice a week by means of a mercury thermometer) and daily mean temperatures (calculated according to SMHI 1 966) (n = 1 57) were compared with values from the meteorological station at SUilldalen, ea. 30 km SE of the Skattlosberg Stormosse (59° 57 ' N, 14 o 57 ' E ; 2 1 0 m a . s . l. ; SMHI, unpubl . ) . The mean differences were calculated (Table 1 a) . SUilldalen was chosen because it is the nearest station with a fairly long se-
Table la. Mean differences (X) with standard deviations of the samples (s) and standard errors of the means (S .E .) between temperature at Stalldalen and at the Skattlosberg Stormosse. (X is positive when the Stalldalen value is higher . )
n X S.E.
0700h 1 80 -0. 5 2 . 2 0 .2 1 300h 1 82 0 .3 1 . 3 0 . 1 1 900h 1 83 0 .3 1 . 5 0 . 1 max 1 78 0.3 1 . 3 0. 1 m in 1 85 1 . 1 1 . 8 0 . 1 daily mean 1 57 0 .2 0 . 8 0 . 1
Table l b . Distribution of deviations between recorded tempera-tures on the Skattlosberg Stormosse and temperature values from the same days using the mean difference between the bog and Stalldalen (Table la). Negative deviations mean that the recorded temperature was lower than the calculated.
deviation maximum minimum daily mean
-7 0 1 0 -6 1 2 0 -5 0 1 0 -4 3 3 0 -3 4 9 1 -2 1 0 1 8 4 - 1 27 35 38
0 72 55 73 + 1 48 3 1 35 + 2 1 0 1 7 4 + 3 2 8 2 + 4 0 4 0 + 5 0 2 0 + 6 0 0 0 + 7 0 1 0 + 8 0 0
A cta Phytogeogr. Suec. 74
ries of data . It is situated ea. 70 m lower than the screen on the bog . All hours are given as GMT + 1 h.
The difference in the daily means at the two stations is small , as are the differences in maximum temperatures and temperatures at 1 300 and 1 900 hours . The temperature at 0700 hours deviates and is-unlike all other temperatures-higher on the bog than at SUilldalen. The readings at the meteorological stations are often made up to 1 5 minutes before the full hour (E . Schmacke, in litt . ) . Temperature rises rapidly in the mornings and the deviations can be explained in this way.
There is also a notable difference in minimum temperatures between the stations . The minima on the bog are lower on average, certainly an effect of its situation in a depression. This effect depends largely on the weather and the deviations from the mean are therefore pronounced (Table 1 b) .
After thus having compared data from the Skattlosberg Stormosse and SUilldalen, missing data from the bog were calculated from the SUilldalen values by adding the mean differences between the stations . In that way a complete table for the bog was constructed which was used for estimating the number of frost nights (Table 2) , length of growing season (Table 3a) and the sum of effective temperatures (Fig . 4) in the years 1 980- 1 982.
Monthly mean temperatures (which differ from the monthly means of the daily mean temperatures) for the months April to October were then calculated for the years 1 980- 1 982. These temperatures were compared with the corresponding values from Stalldalen and were found to be 0.2°C lower .
The mean temperatures at Stalldalen can be considered normal for the area and elevation. Sjors ( 1 948) found (preliminarily) that the mean temperature in Bergslagen (the central Swedish uplands) decreases ea. 0 .65 ° C per 1 00 m elevation . The difference between Stalldalen and the bog is thus somewhat smaller than expected .
The means of the monthly mean temperatures at Stalldalen over the years 1 967- 1982 (the station was not in use before 1 967) were calculated from the yearbooks of the Swedish Meteorological and Hydrological Institute for the years 1 967- 198 1 (SMHI 1 968- 1 982) and from their unpublished lists for 1 982 (Fig . 2) . When the differences in monthly means between the stations are added to
Production and growth dynamics of vascular bog plants 9
STALLDALEN (210m) [16]
725mm mm
80
40
20
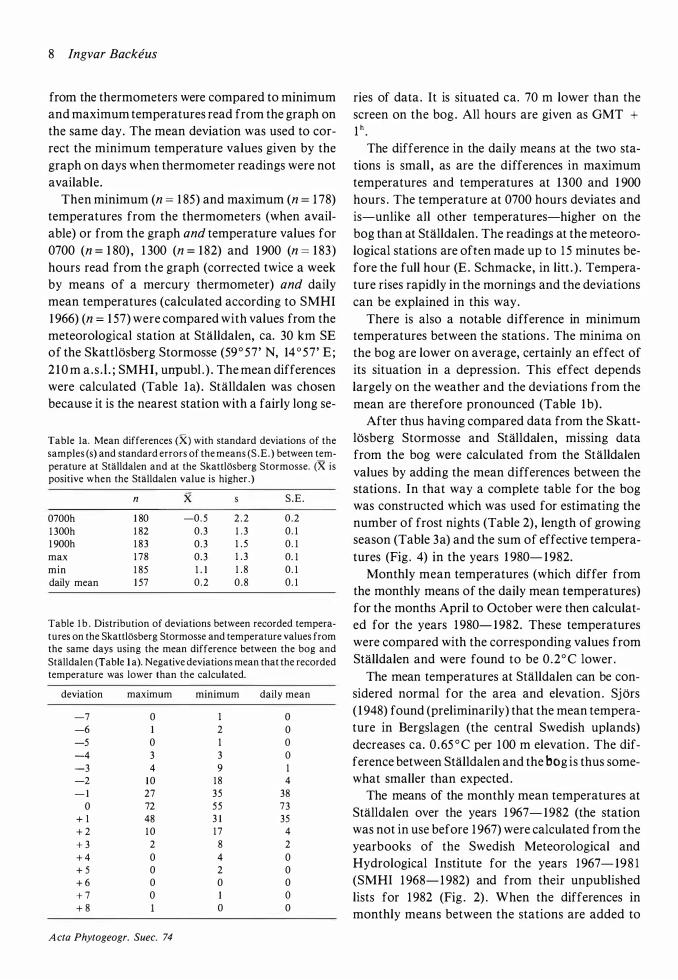
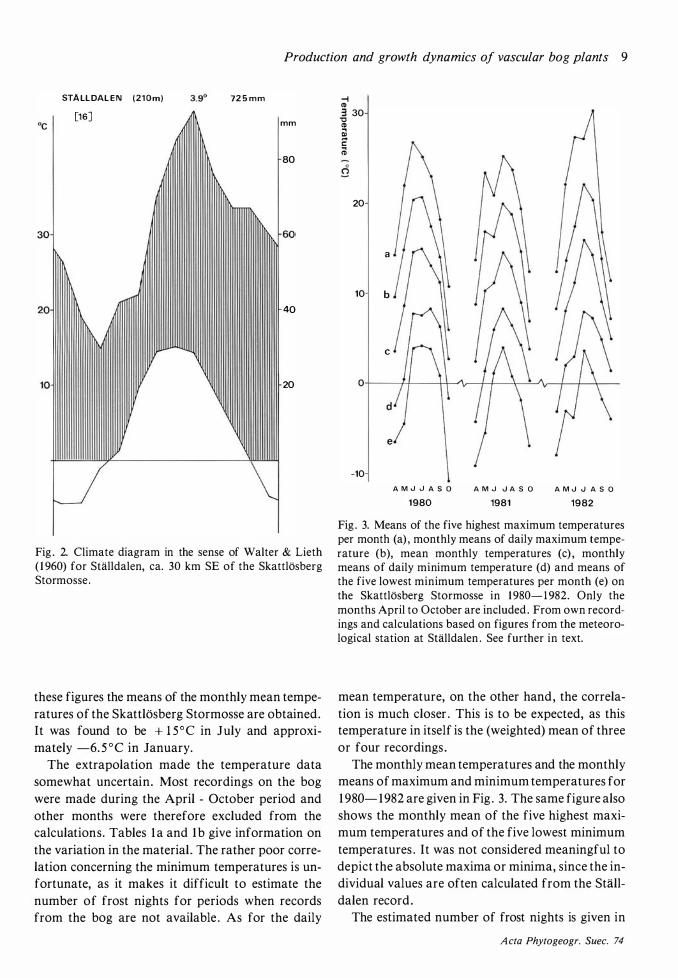
Fig . 2. Climate diagram in the sense of Waiter & Lieth ( 1 960) for SHilldalen, ea. 30 km SE of the Skattlosberg Stormosse .
these figures the means of the monthly mean temperatures of the Skattlosberg Stormosse are obtained. It was found to be + l5°C in July and approximately -6. 5°C in January.
The extrapolation made the temperature data somewhat uncertain. Most recordings on the bog were made during the April - October period and other months were therefore excluded from the calculations. Tables la and 1 b give information on the variation in the material . The rather poor correlation concerning the minimum temperatures is unfortunate, as it makes it difficult to estimate the number of frost nights for periods when records from the bog are not available . As for the daily
-i CD 3 30 "0 CD � c: ii)
20
a
10 b
c
d
e
-10 AM..JJASO
1980 AMJ ..JASO
1981 AM..JJASO
1982
Fig . 3. Means of the five highest maximum temperatures per month (a) , monthly means of daily maximum temperature (b), mean monthly temperatures (c) , monthly means of daily minimum temperature (d) and means of the five lowest minimum temperatures per month (e) on the Skattlosberg Stormosse in 1980- 1 982. Only the months April to October are included . From own recordings and calculations based on figures from the meteorological station at SUilldalen . See further in text.
mean temperature, on the other hand , the correlation is much closer . This is to be expected, as this temperature in itself is the (weighted) mean of three or four recordings .
The monthly mean temperatures and the monthly means of maximum and minimum temperatures for 1 980- 1 982 are given in Fig . 3. The same figure also shows the monthly mean of the five highest maximum temperatures and of the five lowest minimum temperatures . It was not considered meaningful to depict the absolute maxima or minima, since the individual values are often calculated from the Stalldalen record .
The estimated number of frost nights is given in
A cta Phytogeogr. Suec. 74
10 Ingvar Backeus
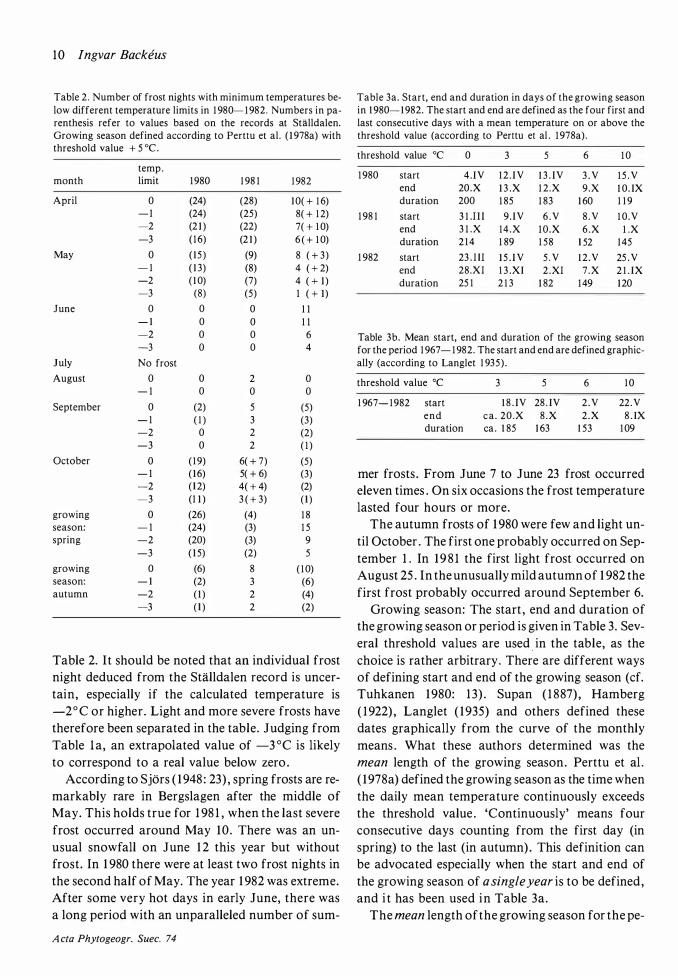
Table 2 . Number of frost nights with minimum temperatures be-low different temperature limits in I 980- I 982 . Numbers in pa-renthesis refer to values based on the records at Stalldalen. Growing season defined according to Perttu et al. ( I 978a) with threshold value + 5 ac.
temp. month limit I 980 I 98 I I 982
April 0 (24) (28) 1 0( + I 6) - I (24) (25) 8( + I 2) -2 (2 I ) (22) 7( + 1 0) -3 ( 1 6) (2 I ) 6 ( + 1 0)
May 0 ( I5 ) (9) 8 ( + 3) - I ( 1 3) (8) 4 ( + 2) -2 ( 1 0) (7) 4 ( + I ) -3 (8) (5) I ( + I)
June 0 0 0 I I - I 0 0 I I -2 0 0 6 -3 0 0 4
July No frost
August 0 0 2 0 - I 0 0 0
September 0 (2) 5 (5) - I ( I ) 3 (3) -2 0 2 (2) -3 0 2 ( I )
October 0 ( 1 9) 6( + 7) (5) - I ( 1 6) 5( + 6) (3) -2 ( I 2) 4( + 4) (2) -3 (I I ) 3 ( + 3) ( I )
growing 0 (26) (4) I 8 season: - I (24) (3) I 5 spring -2 (20) (3) 9
-3 ( 1 5) (2) 5
growing 0 (6) 8 ( 1 0) season: - 1 (2) 3 (6) autumn -2 ( 1 ) 2 (4)
-3 ( I ) 2 (2)
Table 2. It should be noted that an individual frost night deduced from the Stalldalen record is uncertain, especially if the calculated temperature is -2°C or higher. Light and more severe frosts have therefore been separated in the table. Judging from Table la, an extrapolated value of -3 °C is likely to correspond to a real value below zero .
According to Sjors ( 1 948 : 23) , spring frosts are remarkably rare in Bergslagen after the middle of May. This holds true for 1 98 1 , when the last severe frost occurred around May 10 . There was an unusual snowfall on June 1 2 this year but without frost. In 1 980 there were at least two frost nights in the second half of May. The year 1 982 was extreme. After some very hot days in early June, there was a long period with an unparalleled number of sum-
A cta Phytogeogr. Suec. 74
Table 3a. Start, end and duration in days of the growing season in 1 980- 1 982. The start and end are defined as the four first and last consecutive days with a mean temperature on or above the threshold value (according to Perttu et al . 1 978a) .
threshold value oc 0 3 5 6 1 0
1 980 start 4 . IV 1 2 . IV 1 3 . IV 3 . V 1 5 . V end 20.X I 3 .X I 2 .X 9.X 1 0 . IX duration 200 1 85 I 83 I 60 1 1 9
I 98 I start 3 1 .111 9 . IV 6 .V 8 .V 1 0 .V end 3 1 .X 14 .X I O .X 6 .X I . X duration 2 I 4 1 89 1 58 I 52 I 45
I 982 start 23 . I ll I 5 . I V 5 . V 1 2 .V 25 .V end 28.XI 1 3 .XI 2 .XI 7 .X 2 l . IX duration 25 I 2 1 3 I 82 I 49 1 20
Table 3b. Mean start, end and duration of the growing season for the period I 967- I 982. The start and end are defined graphically (according to Langlet I 935) .
threshold value ac 3 5 6 1 0
I 967- I 982 start 1 8 . IV 28 . IV 2 .V 22.V end ea. 20.X 8 .X 2 .X 8 . IX duration ea. 1 85 1 63 1 53 1 09
mer frosts . From June 7 to June 23 frost occurred eleven times . On six occasions the frost temperature lasted four hours or more.
The autumn frosts of 1 980 were few and light until October . The first one probably occurred on September 1 . In 1 9 8 1 the first light frost occurred on August 25 . In the unusually mild autumn of 1 982 the first frost probably occurred around September 6.
Growing season: The start , end and duration of the growing season or period is given in Table 3. Several threshold values are used. in the table, as the choice is rather arbitrary. There are different ways of defining start and end of the growing season (cf. Tuhkanen 1 980: 1 3) . Supan ( 1 887) , Hamberg ( 1 922) , Langlet ( 1 935) and others defined these dates graphically from the curve of the monthly means . What these authors determined was the mean length of the growing season. Perttu et al. ( 1 978a) defined the growing season as the time when the daily mean temperature continuously exceeds the threshold value . 'Continuously' means four consecutive days counting from the first day (in spring) to the last (in autumn) . This definition can be advocated especially when the start and end of the growing season of a single year is to be defined , and i t has been used in Table 3a.
The mean length of the growing season for the pe-
Production and growth dynamics of vascular bog plants 1 1
riod 1 967- 1 982 has been determined graphically
(Langlet 1 935) from the corrected data from SHilldalen. The results are shown in Table 3b . The
-1100 figures are normal for the area according to Angstrom ( 1 953) . Perttu et al . ( 1 978b), using their own method, obtained a mean length of the growing season at Stalldalen which is two weeks longer.
-1000
-900
-800
-700
� -eoo e
::I (I) Q) a Ill a; c.
-500 E Q) 1-
-400
-300
-200
-100
-0
I am aware that the growing season has a restricted ecological value (cf. e .g . Hytteborn 1 975 : 7). It is included here foremost as a means of comparing the temperature conditions of the Skattlosberg Stormosse with other sites from which corresponding data are available.
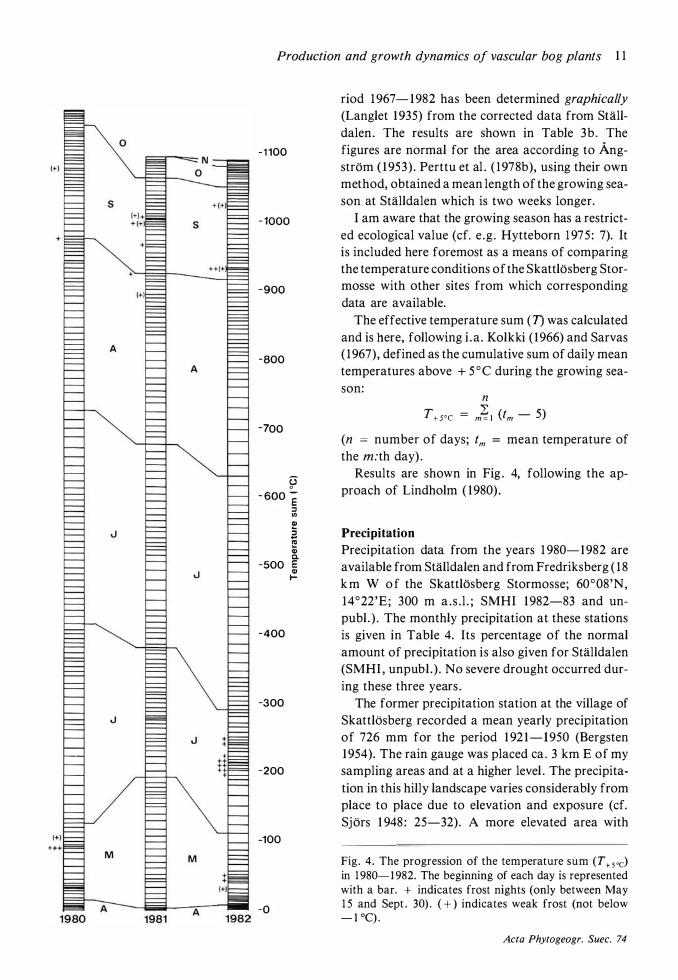
The effective temperature sum (T) was calculated and is here, following i .a. Kolkki ( 1966) and Sarvas ( 1 967), defined as the cumulative sum of daily mean temperatures above + 5 °C during the growing sea-son:
n
T+5°C = m�l Um- 5)
(n = number of days; tm = mean temperature of the m:th day) .
Results are shown in Fig . 4, following the approach of Lindholm ( 1980) .
Precipitation
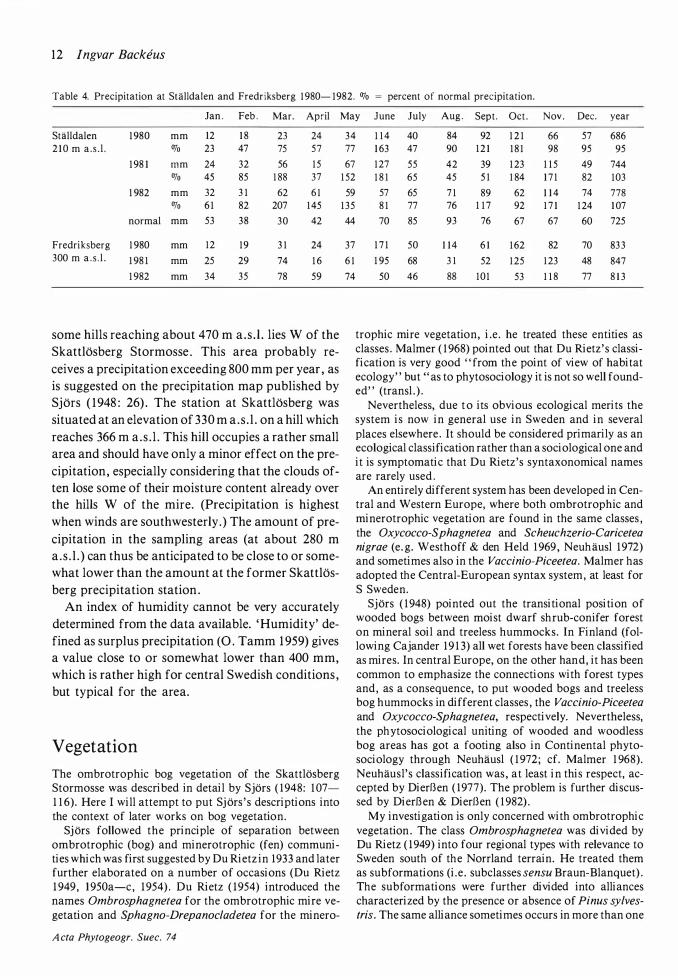
Precipitation data from the years 1 980- 1 982 are available from Stalldalen and from Fredriksberg ( 1 8 k m W o f the SkattlOsberg Stormosse; 60°08'N, 1 4°22'E ; 300 m a . s . l . ; SMHI 1 982-83 and unpubl . ) . The monthly precipitation at these stations is given in Table 4. Its percentage of the normal amount of precipitation is also given for Stalldalen (SMHI , unpubl . ) . No severe drought occurred during these three years .
The former precipitation station at the village of Skattlosberg recorded a mean yearly precipitation of 726 mm for the period 1 92 1 - 1950 (Bergsten 1 954). The rain gauge was placed ea . 3 km E of my sampling areas and at a higher level . The precipitation in this hilly landscape varies considerably from place to place due to elevation and exposure (cf. Sjors 1 948 : 25-32). A more elevated area with
Fig. 4. The progression of the temperature sum (T+5oc) in 1 980- 1 982. The beginning of each day is represented with a bar. + indicates frost nights (only between May 1 5 and Sept . 30) . ( +) indicates weak frost (not below - 1 °C) .
Acta Phytogeogr. Suec. 74
12 lngvar Backeus
Table 4. Precipitation at SUilldalen and Fredriksberg 1 980- 1982. OJo = percent of normal precipitation.
Jan . Feb . Mar. April
Stalldalen 1 980 mm 12 1 8 23 24 2 1 0 m a . s . l . OJo 23 47 75 57
1 98 1 mm 24 32 56 1 5 OJo 45 85 1 88 37
1 982 mm 32 3 1 62 6 1 OJo 6 1 82 207 1 45
normal mm 53 38 30 42
Fredriksberg 1 980 mm 12 19 3 1 24 300 m a . s . l . 1 98 1 mm 25 29 74 1 6
1 982 mm 34 35 78 59
some hills reaching about 470 m a .s . l . lies W of the Skattlosberg Stormosse. This area probably receives a precipitation exceeding 800 mm per year , as is suggested on the precipitation map published by Sjors ( 1 948 : 26) . The station at Skattlosberg was situated at an elevation of 330 m a . s . l . on a hill which reaches 366 m a . s . l . This hill occupies a rather small area and should have only a minor effect on the precipitation, especially considering that the clouds often lose some of their moisture content already over the hills W of the mire. (Precipitation is highest when winds are southwesterly.) The amount of precipitation in the sampling areas (at about 280 m a . s . l . ) can thus be anticipated to be close to or somewhat lower than the amount at the former Skattlosberg precipitation station .
An index of humidity cannot be very accurately determined from the data available. 'Humidity' defined as surplus precipitation (0. Tamm 1 959) gives a value close to or somewhat lower than 400 mm, which is rather high for central Swedish conditions , but typical for the area.
Vegetation
The ombrotrophic bog vegetation of the Skattlosberg Stormosse was described in detail by Sjors ( 1 948: 1 07-1 1 6) . Here I will attempt to put Sjors 's descriptions into the context of later works on bog vegetation.
Sjors followed the principle of separation between ombrotrophic (bog) and minerotrophic (fen) communities which was first suggested by Du Rietz in 1 933 and later further elaborated on a number of occasions (Du Rietz 1 949, 1 950a-c, 1 954) . Du Rietz ( 1 954) introduced the names Ombrosphagnetea for the ombrotrophic mire vegetation and Sphagno-Drepanocladetea for the minero-
A cta Phytogeogr. Suec. 74
May June July Aug . Sept. Oct . Nov . Dec. year
34 77
67 1 52
59 135
44
37
6 1
74
1 1 4 40 84 92 1 2 1 66 57 686 1 63 47 90 1 2 1 1 8 1 98 95 95
1 27 55 42 39 1 23 1 1 5 49 744 1 8 1 65 45 5 1 1 84 1 7 1 82 103
57 65 7 1 89 62 1 1 4 74 778 8 1 77 76 1 1 7 92 1 7 1 1 24 1 07
70 85 93 76 67 67 60 725
1 7 1 50 1 1 4 6 1 1 62 82 70 833
1 95 68 3 1 52 1 25 1 23 48 847
50 46 88 10 1 53 1 1 8 77 8 13
trophic mire vegetation, i .e . he treated these entities as classes . Malmer ( 1 968) pointed out that Du Rietz's classification is very good "from the point of view of habitat ecology' ' but ''as to phytosociology it is not so well founded" (transl . ) .
Nevertheless, due to its obvious ecological merits the system is now in general use in Sweden and in several places elsewhere . It should be considered primarily as an ecological classification rather than a sociological one and it is symptomatic that Du Rietz's syntaxonomical names are rarely used .
An entirely different system has been developed in Central and Western Europe, where both ombrotrophic and minerotrophic vegetation are found in the same classes , the Oxycocco-Sphagnetea and Scheuchzerio-Caricetea nigrae (e.g. Westhoff & den Held 1 969, Neuhausl 1 972) and sometimes also in the Vaccinio-Piceetea. Malmer has adopted the Central-European syntax system, at least for S Sweden.
Sjors ( 1 948) pointed out the transitional position of wooded bogs between moist dwarf shrub-conifer forest on mineral soil and treeless hummocks. In Finland (following Cajander 1 91 3) all wet forests have been classified as mires. In central Europe, on the other hand, it has been common to emphasize the connections with forest types and , as a consequence, to put wooded bogs and treeless bog hummocks in different classes , the Vaccinio-Piceetea and Oxycocco-Sphagnetea, respectively. Nevertheless, the phytosociological uniting of wooded and woodless bog areas has got a footing also in Continental phytosociology through Neuhausl ( 1 972; cf. Malmer 1 968). Neuhausl's classification was , at least in this respect, accepted by Dierl3en ( 1 977). The problem is further discussed by Dier13en & Dierl3en ( 1 982) .
My investigation is only concerned with ombrotrophic vegetation . The class Ombrosphagnetea was divided by Du Rietz ( 1 949) into four regional types with relevance to Sweden south of the Norrland terrain. He treated them as subformations (i.e . subclasses sensu Braun-Blanquet) . The subformations were further divided into alliances characterized by the presence or absence of Pin us sylvestris. The same alliance sometimes occurs in more than one
Production and growth dynamics of vascular bog plants 1 3
subformation . The following alliances are of interest in the present area:
( 1 ) The Parvifolion alliance (Du Rietz in Waldheim 1 944, Du Rietz 1 949; cf. Du Rietz 1 950a) of the pine bogs . A variant of this alliance without Ledum palustre characterizes the southwest Swedish pine bogs.
(2) The Eufuscion alliance (Du Rietz in Waldheim 1 944, Du Rietz 1 949; cf. Du Rietz & Nannfeldt 1 925 , Du Rietz 1 950c) of the open bog plains in eastern south Sweden with Sphagnum fuscum hummocks and S. balticum and S. cuspidatum in the upper and lower parts of the hollows, respectively.
{3) The Rubello-fuscion alliance {Du Rietz in Waldheim 1 944, Du Rietz 1 949; cf. von Post & Sernander 1 910 , Du Rietz 1 950b, Backeus 1 972) of the open bog plains in the central parts of south Sweden, where Sphagnum rubellum and, in some areas , S. magellanicum have superseded the species of the former alliance from the lower parts of the hummocks and the higher parts of the hollows .
The Skattlosberg Stormosse, being situated north of the border of the north Swedish uplands (the 'Norrland terrain') , does not conform fully to any of these vegetation types . The wooded bog areas belong to the Parvifolion. Ledum palustre is rare but is abundant in similar vegetation a short distance to the east . The bog further deviates from the typical Parvifolion in the presence of the northern species Betula nana. The community was called the Pinus - Vaccinium bog association by Sjors { 1 948 : 107- 109). Fransson ( 1 972: 35-36) put similar vegetation into the association Vaccinietum uliginosi.
In treeless bog vegetation there are gradual changes around the border of the north Swedish uplands as described by Sjors ( 1 948) , Fransson ( 1 972) and Backeus ( 1 984) . The Sphagnum rubellum zone of the hummocks of the Rubella-juscion vanishes towards the north and S. majus occurs together with S. cuspidatum in wet hollows . Cetraria delisei also occurs .
The treeless bog areas on the SkattlOsberg Stormosse are intermediate between the Eufuscion and the Rubellofuscion with the addition of the northern features j ust mentioned (cf. Sjors 1 948: 1 1 1 and Malmer 1 962: 148). Sphagnum rubellum here forms only a narrow zone along the border between hummocks and hollows . S. magellanicum occurs both on hummocks and in hollows but is never dominant. Trichophorum caespitosum is an important constituent here as in the Rubello-fuscion . (The species does not occur in the Eufuscion .)
The open bog areas on the SkattlOsberg Stormosse were divided by Sjors into one hummock and three hollow communities , corresponding to the lawns (upper parts) , carpets (lower parts) and mud-bottoms (without sphagna) .
Hummocks: The hummock vegetation was called by Sj ors ( 1 948) the Calluna - Cladonia - Sphagnum fuscum association . Similar vegetation was described by Du Rietz ( 1 950b ,c) as the association Calluneto-fuscetum , by Malmer ( 1 962) under the names Eriophorum vaginatum -
Sphagnum rubellum small association and Eriophorum vaginatum - Cladonia small association and by Fransson ( 1 972) under the name Calluno-fuscetum.
In the Special Area Calluna vulgaris practically always dominates the hummock community. Empetrum nigrum dominates locally, mostly on high hummocks . Otherwise the latter species usually occurs as a subordinate species and in places it is entirely lacking. A ndromeda polifolia, Eriophorum vaginatum and Rubus chamaemorus are present more or less everywhere. Vaccinium uliginosum has an uneven distribution and mainly occurs near the scattered pines . V. microcarpum, V. oxycoccos and plants intermediate between them occur frequently. Trichophorum caespitosum is mostly lacking on higher hummocks but is common in lower parts . Betula nana occurs sporadically and usually in patches. Drosera rotundifolia is common but absent from the lichen-dominated facies of the community. The bottom layer is usually dominated by Sphagnumfuscum (S. fuscum facies Fransson 1 972) but locally by Cladina spp . (Cladonia facies Fransson) or liverworts (esp . Mylia anomala; liverwort facies Fransson) .
Lawns and carpets: The lawn vegetation of the Skattlosberg Stormosse was described by Sjors ( 1 948) as the Eriophorum vagina tu m - Scirpus caespitosus ( = Trichophorum caespitosum) - Sphagnum rubellum - balticum -cuspidatum association. The lawn communities are delimited against hummock communities by the absence (except a few colonisers) of Calluna vulgaris (cf. Du Rietz 1 949) . In Malmer 's ( 1 962) scheme of comparison with other authors Sjors 's limit between lawns and hummocks is drawn higher than the Calluna limit , indicating that the Trichophorum caespitosum variant of the Eriophorum vaginatum - Sphagnum rubellum small association would be a lawn community sensu Sjors . The opinions of the exact position of the limit between hummocks and lawns are thus deviating, but the difference is probably somewhat exaggerated in Malmer' s scheme (Sjors, pers . comm .) .
The bog carpet vegetation constituted Sjors' s ( 1 948) Scheuchzeria - Rhynchospora alba - Carex limosa -Sphagnum cuspidatum - Dusenii { = majus) association . Sjors used characters from the field layer when delimiting the bog carpet communities from the bog lawn communities . His differential species occurring in the carpets were Scheuchzeria palustris, Rhynchospora alba, Carex limosa and Drosera anglica.
Du Rietz included all bog hollow vegetation in his association Cuspidate/urn (Du Rietz 1 949). He described a progressive upper hollow stage of the Rubello-fuscion as the subass . Magellanico-cuspidatetum (Du Rietz 1 949) and of the Eufuscion as the subass . Baltico-cuspidatetum {Du Rietz 1 950b) . He further described a regressive upper hollow stage as Tenello-cuspidatetum (Du Rietz 1 949, 1 950a) in both alliances. The bog carpets of all the alliances were his subass . Eucuspidatetum (Du Rietz 1 949, 1 950c; cf. Du Rietz 1 950b) . Contrary to Sj ors 's delimitations, the composition of the bottom layer determined the
A cta Phytogeogr. Suec. 74
1 4 Ingvar Backeus
boundaries between Du Rietz's subassociations of the Cuspidatetum (Du Rietz 1 949) .
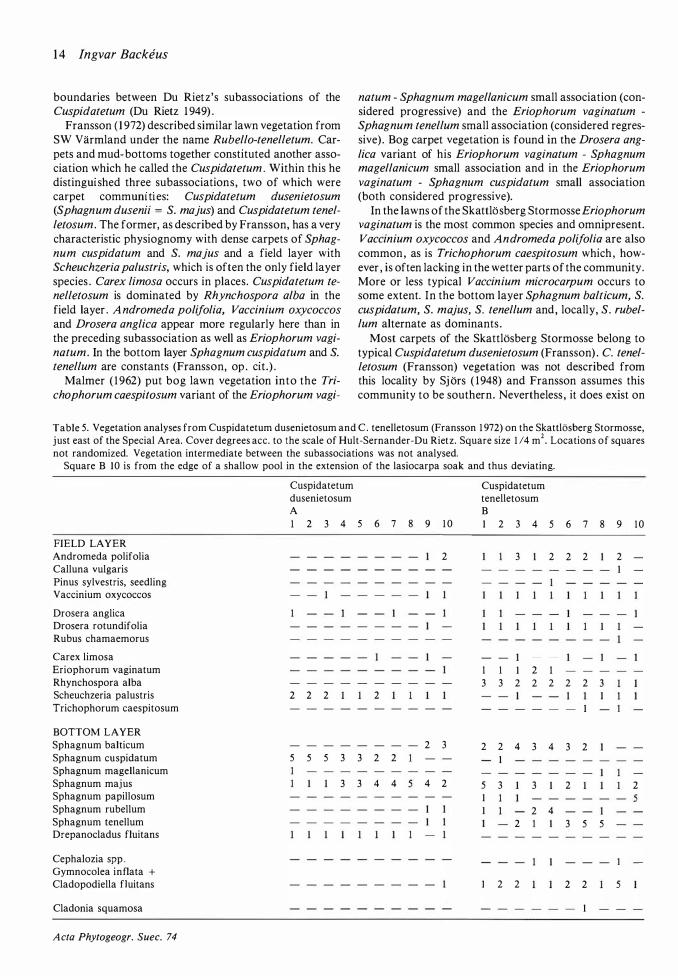
Fransson (1 972) described similar lawn vegetation from SW Varmland under the name Rubello-tenelletum. Carpets and mud-bottoms together constituted another association which he called the Cuspidatetum. Within this he distinguished three subassociations, two of which were carpet commumtles: Cuspidatetum dusenietosum (Sphagnum dusenii = S. majus) and Cuspidatetum tenelletosum. The former, as described by Fransson, has a very characteristic physiognomy with dense carpets of Sphagnum cuspidatum and S. majus and a field layer with Scheuchzeria palustris, which is often the only field layer species . Carex limosa occurs in places. Cuspidatetum tenelletosum is dominated by Rhynchospora alba in the field layer . A ndromeda polifolia, Vaccinium oxycoccos and Drosera anglica appear more regularly here than in the preceding subassociation as well as Eriophorum vaginatum. In the bottom layer Sphagnum cuspidatum and S. tenellum are constants (Fransson, op . cit.) .
Malmer ( 1 962) put bog lawn vegetation into the Trichophorum caespitosum variant of the Eriophorum vagi-
natum - Sphagnum mage/lanicum small association (considered progressive) and the Eriophorum vaginatum -Sphagnum tenellum small association (considered regressive) . Bog carpet vegetation is found in the Drosera anglica variant of his Eriophorum vaginatum - Sphagnum magellanicum small association and in the Eriophorum vaginatum - Sphagnum cuspidatum small association (both considered progressive).
In the lawns of the Skattlbsberg Stormosse Eriophorum vaginatum is the most common species and omnipresent. Vaccinium oxycoccos and Andromeda polifolia are also common, as is Trichophorum caespitosum which , however , is often lacking in the wetter parts of the community. More or less typical Vaccinium microcarpum occurs to some extent. In the bottom layer Sphagnum balticum, S. cuspidatum, S. majus, S. tenellum and, locally, S. rubellum alternate as dominants .
Most carpets of the SkattlOsberg Stormosse belong to typical Cuspidatetum dusenietosum (Fransson) . C. tenelletosum (Fransson) vegetation was not described from this locality by Sj ors ( 1 948) and Fransson assumes this community to be southern. Nevertheless , it does exist on
Table 5. Vegetation analyses from Cuspidatetum dusenietosum and C . tenelletosum (Fransson 1 972) on the Skattlosberg Stormosse, just east of the Special Area. Cover degrees ace. to the scale of Hult-Sernander-Du Rietz. Square size 1 /4 m2• Locations of squares not randomized. Vegetation intermediate between the subassociations was not analysed.
Square B 10 is from the edge of a shallow pool in the extension of the lasiocarpa soak and thus deviating.
FIELD LAYER Andromeda polifolia Calluna vulgaris Pinus sylvestris, seedling Vaccinium oxycoccos
Drosera anglica Drosera rotundifolia Rubus chamaemorus
Carex limosa Eriophorum vaginatum Rhynchospora alba Scheuchzeria palustris Trichophorum caespitosum
BOTTOM LAYER Sphagnum balticum Sphagnum cuspidatum Sphagnum magellanicum Sphagnum majus Sphagnum papillosum Sphagnum rubellum Sphagnum tenellum Drepanocladus fluitans
Cephalozia spp . Gymnocolea inflata + Cladopodiella fluitans
Cladonia squamosa
A cta Phytogeogr. Suec. 74
Cuspidatetum dusenietosum A
2 3 4 5 6 7 8 9 1 0
2
2 2 2 2
2 3 5 5 5 3 3 2 2
3 3 4 4 4 2
Cuspidatetum tenelletosum B 1 2 3 4 5 6 7
3 2 2 2
1 1 1 2 1 3 3 2 2 2 2 2
- - 1
2 2 4 3 4 3 2 1
5 3 3 2 1 1 2 4
2 3 5
2 2 2 2
- 1
8 9 1 0
2 1
3 1
2
5
5
Production and growth dynamics of vascular bog plants 1 5
hummocks I I lawns
I
Cusp. tenellet.
Cusp. duseniet.
a ;:j t: a Cl) ;:j o. .... �-2 I
a 2 § 0 ..... ...c Cl! O.c: 0 .... ·- 01) ..... Cl! r.I.l ;:..
I I
a 2 a 0 ;:j ...c Vl o.o 0 .-:::
...c 0. (.) Vl .... Cl) � �
I I I
I
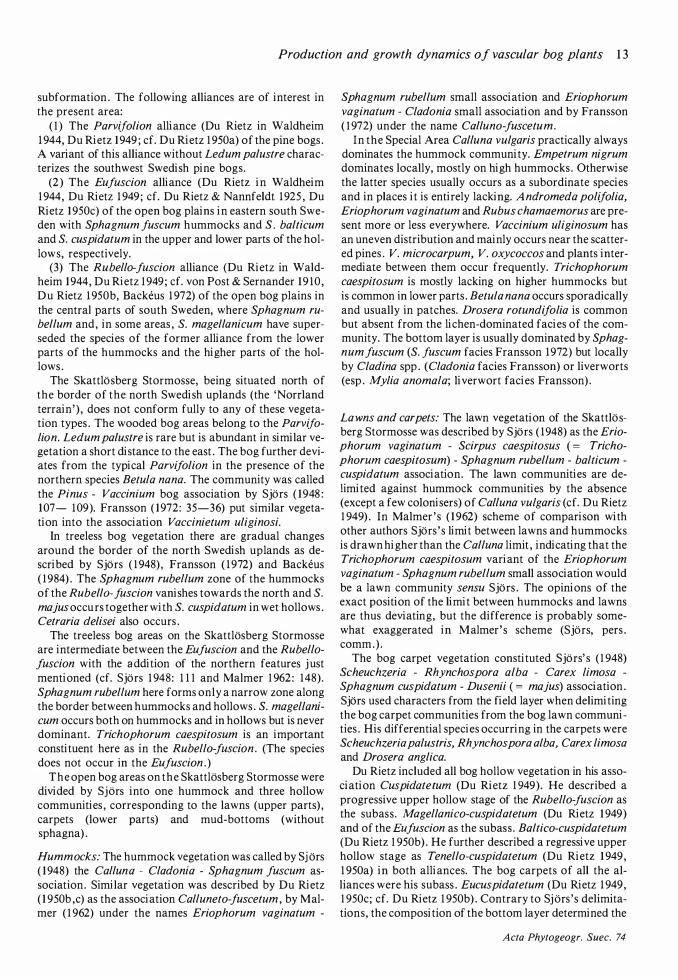
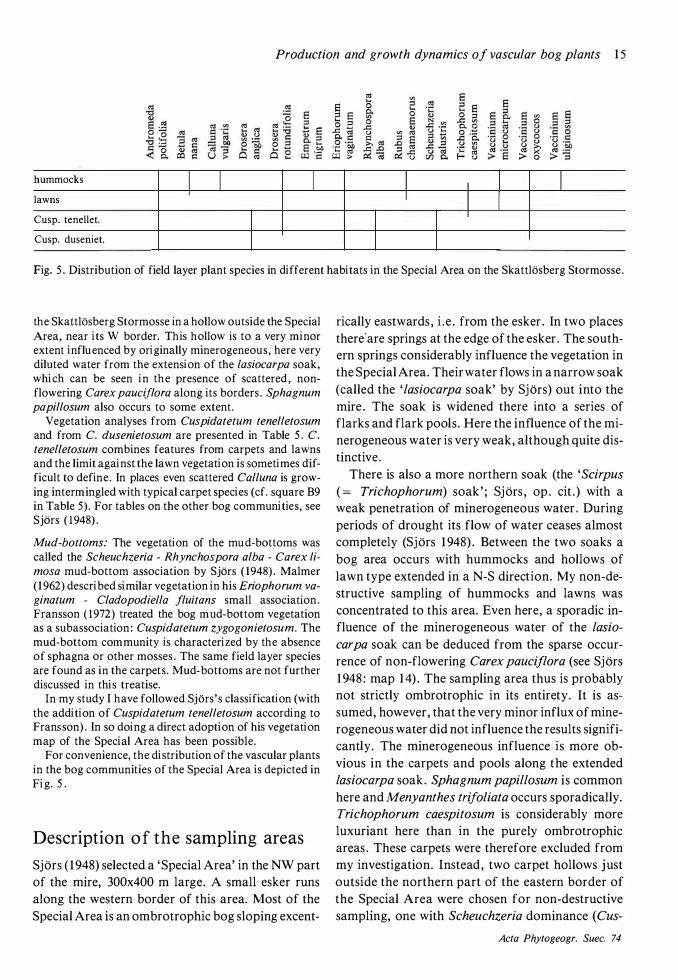
Fig. 5 . Distribution of field layer plant species in different habitats in the Special Area on the Skattlosberg Stormosse.
the SkattlOsberg Stormosse in a hollow outside the Special Area, near its W border. This hollow is to a very minor extent influenced by originally minerogeneous , here very diluted water from the extension of the lasiocarpa soak, which can be seen in the presence of scattered , nonflowering Carex pauciflora along its borders . Sphagnum papillosum also occurs to some extent.
Vegetation analyses from Cuspidatetum tenelletosum and from C. dusenietosum are presented in Table 5. C. tenelletosum combines features from carpets and lawns and the limit against the lawn vegetation is sometimes difficult to define. In places even scattered Calluna is growing intermingled with typical carpet species (cf. square B9 in Table 5) . For tables on the other bog communities, see Sjors ( 1 948) .
Mud-bottoms: The vegetation of the mud-bottoms was called the Scheuchzeria - Rhynchospora alba - Carex limosa mud-bottom association by Sjors ( 1 948). Malmer ( 1 962) described similar vegetation in his Eriophorum vaginatum - Cladopodiella fluitans small association . Fransson ( 1 972) treated the bog mud-bottom vegetation as a subassociation : Cuspidatetum zygogonietosum. The mud-bottom community is characterized by the absence of sphagna or other mosses . The same field layer species are found as in the carpets. Mud-bottoms are not further discussed in this treatise.
In my study I have followed Sjors 's classification (with the addition of Cuspidatetum tenelletosum according to Fransson) . In so doing a direct adoption of his vegetation map of the Special Area has been possible.
For convenience, the distribution of the vascular plants in the bog communities of the Special Area is depicted in Fig. 5.
Description of the sampling areas
Sjors ( 1 948) selected a ' Special Area' in the NW part of the mire, 300x400 m large. A small esker runs along the western border of this area. Most of the Special Area is an ombrotrophic bog sloping excent-
rically eastwards , i . e . from the esker . In two places there·are springs at the edge of the esker . The southern springs considerably influence the vegetation in the Special Area. Their water flows in a narrow soak (called the 'lasiocarpa soak' by Sjors) out into the mire . The soak is widened there into a series of flarks and flark pools . Here the influence of the minerogeneous water is very weak, although quite distinctive .
There is also a more northern soak (the 'Scirpus
( = Trichophorum) soak ' ; Sjors , op . cit . ) with a weak penetration of minerogeneous water . During periods of drought its flow of water ceases almost completely (Sjors 1 948) . Between the two soaks a bog area occurs with hummocks and hollows of lawn type extended in a N-S direction. My non-destructive sampling of hummocks and lawns was concentrated to this area. Even here, a sporadic influence of the minerogeneous water of the lasio
carpa soak can be deduced from the sparse occurrence of non-flowering Carex pauciflora (see Sjors 1 948: map 1 4) . The sampling area thus is probably not strictly ombrotrophic in its entirety. It is assumed, however , that the very minor influx of minerogeneous water did not influence the results significantly. The minerogeneous influence is more obvious in the carpets and pools along the extended lasiocarpa soak . Sphagnum papillosum is common here and Menyanthes trijoliata occurs sporadically. Trichophorum caespitosum is considerably more luxuriant here than in the purely ombrotrophic areas . These carpets were therefore excluded from my investigation. Instead , two carpet hollows just outside the northern part of the eastern border of the Special Area were chosen for non-destructive sampling, one with Scheuchzeria dominance ( Cus-
Acta Phytogeogr. Suec. 74

1 6 Ingvar Backeus
pidatetum dusenietosum Fransson) and the other with Rhynchospora dominance (C. tenelletosum
Fransson) . In the outer parts of the Scirpus soak the minero
geneous influence is also quite weak . Its presence is indicated by richer occurrence of Carex pauciflora
and the minerotrophic Sphagnum fa/lax. Also the Scirpus soak was excluded from the sampling .
For a more comprehensive description of the Special Area, see Sjors ( 1 948 : 77- 1 04) .
The vegetation of the Special Area is evidently stable . Sjors' s map of this area was established in 1 944-1 945 and my investigations were carried out in 1 980- 1982. Within this period hardly any detect-
A cta Phytogeogr. Suec. 74
able changes have occurred within the pools, mudbottoms, carpets and lawns . The wooded bog areas, on the other hand , have expanded somewhat over previously treeless hummock areas . This is evident from Sjors 's map and from several of his photos .
Destructive sampling in hummocks and lawns was made east of the Special Area, SE of Puukkolam ( = Brittas hal on the new topographic map) . It also slopes eastwards . Hummocks and lawn hollows dominate and are orientated in the contour direction . In the southern and eastern parts carpets are also common.
Destructive sampling in carpets was made close to the non-destructive sampling .
Phenological development
Phenological data were collected in order to make it easier to choose suitable times for harvesting (cf. Persson 1 975a) . As harvesting however had to start already during the first summer, the phenological results were only gradually incorporated into the harvesting schedule .
The phenological information is , of course , also of interest as such and is important in the discussion on the dynamics of production in the different species .
Methods of collecting and presenting the phenological data
Data on phenological development were collected through general visual inspections at intervals of 5-7 days during the summer and less frequently during the spring and autumn. No exact measurements were attempted.
The results are presented in qualitative phenological spectra (cf. Dierschke 1 972) . Each studied property is presented separately as I find such a presentation more easily interpretable than traditional diagrams. Similar diagrams were published i .a. by Perttula ( 1 949), Falinska ( 1 972) and Persson ( 1975a) .
A property often presented in phenological diagrams is flower colour . This has been omitted here, since it is not important in a production study. It could be noted , though, that all conspicuous flowers on bogs in south and central Sweden are white or mauve.
Separate diagrams for the years 1 98 1 and 1 982 are presented because ( 1 ) the 1 980 material is incomplete, (2) the period is too short for an average to be meaningful and (3) the average of years with early development and other years with late development will give the false impression of prolonged phases with an early and gradual beginning and a late and gradual termination . (I f averages are used the aver-
age yearly length in days of each phase should also be calculated .)
The kind of information that can be obtained from the spectra is evident from the key to the signs . Only a few comments are needed :
A shoot was considered to flower when the first flower bud had burst . In most species on the bog the great majority of shoots did not flower at all . This was the case in A ndromeda polifolia, Betula nana,
Drosera anglica, D. rotundifolia, Eriophorum vagi
natum, Rubus chamaemorus, Scheuchzeria palust
ris and Vaccinium spp . It is therefore important to note that the flowering and fruiting symbols are used when more than half of the fertile shoots had reached the stage in question . The proportion between flowering and non-flowering shoots will be discussed in later chapters . In 1 982 no fruits of R.
chamaemorus and V. myrtillus reached a mature stage, mainly due to severe night frosts , and Scheuchzeria did not flower at all .
Results and discussion
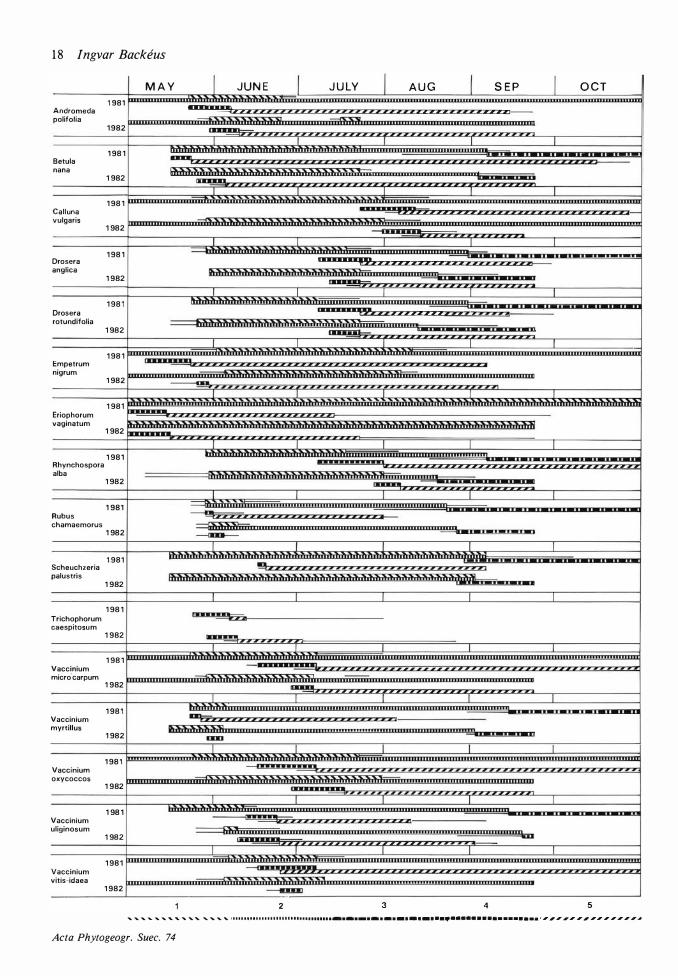
The results are presented in Fig. 6. They will be discussed together with other data in later chapters . Only a few points will be taken up here .
Although May was much colder in 1 982 than in 1 98 1 (Fig. 3) , the onset of growth seemed to be very little later in 1 982 . After the cold and frosty month of June in 1 982 the cessation of growth was hardly later than in 1 98 1 . A marked effect of the summer frosts was that Andromeda polifolia, Rubus
chamaemorus, Vaccinium microcarpum and V.
oxycoccos formed new vegetative shoots in July to replace damaged shoots .
Few species showed any activity before the end of May. The exceptions were Eriophorum vaginatum,
Scheuchzeria palustris, Betula nana and Trichopho
rum caespitosum . The two first-mentioned species have a long period of active growth and their leaves
Acta Phytogeogr. Suec. 74
1 8 I ngvar Backeus
1 981 Andromeda polifolia
1 982
1 98 1 Betula nana
1 982
1 98 1 Call una vulgaris
1 982
1 98 1 Drosera anglica
1 982
1 98 1 Drosera rotundifolia
1 982
1 98 1 Empetrum nigrum
1 982
1 98 1 Eriophorum vaginatum
1 982
1 98 1 Rhynchospora alba
1 982
1 981 Rubus chamaemorus
1 982
1 981 Scheuchzeria palustris
1 982
1 98 1 Trichophorum caespitosum
1 982
1 98 1 Vaccinium micro'carpum
1 982
1 98 1 Vaccinium myrtillus
1 982
1 98 1 Vaccinium oxycoccos
1 982
1 98 1 Vaccinium uliginosum
1 982
1 98 1 Vaccinium vitis-idaea
1 982
M A Y I J U N E I J U LY I A U G I S E P I O C T
•••••:!:!!j,,, ,,,,,,,,, ,,,,,,,,,, z,,,, ,, , , , , ,, , , ,, , ,,
I I r r I nmP,,,,,,,,,,,,,,,,,,,,,,,,,,,,,,,,,,,,,,,,,,,,,,,,,,,,,,,,,,,, r.l\�ll.}w�.t.�a >i11a 1 bilibbilol•?IJ}ii}j)\j'iii)� :o: l t
� I I I I I
M M M M •O!O!f l";lzzz I I I I z z ,,,,,,,,,,,,,,,,,,,,4
..........
I I
I I
I I
I I i!MMMMMMM,,Af#Z Ill llllllll 1111 Ill 11
I I ••••••••'yAP ,, ,,,, z z z z z zz z z ,,,,..,
r I I MM!
,,,,,,,,,,,,,,,,,,,,,,,,,,,,,,
I I I T
I I I I
IWiMIMIMIMIMIMI
I
I
I
I
I
I I I I I -m, � ..
,,,,,,,,,.__
!!!!!\-·-·-·-·-·-· I I I I I
�,,,,,,,,,,,,,,,,,,,,,,,,,,,,,,,,,
I I l I I
I I I I I
I T I I I nu,,,,,,,,,,,
lllllllllllllllllllllllihhiliiiiiil !f!"!w •••••••• il
I I I I I
I I I I --��,,,,,,,,,,,,,,,,,�
--=---=R''''""''''''""'''''""'''''""''''''"''''''"'''''''""''''''"'''''''""''''''""'''''Iu::: I I I I I
2 3 4 5 , , , ......_ , , , , "' " " , '- ' "' � • • • • n n • • • • • • • • • • • • u • u u u n n • - · - · - • - • • • • • • • • • • ••••••• • • • • • • • • • • • • • l l l l l l l l l l l l l l ,/1
Acta Phytogeogr. Suec. 74
Production and growth dynamics of vascular bog plants 1 9
successively senesce and die throughout the growing season. In these species it was therefore considered desirable to have an early harvest in May I June in addition to a late harvest in August .
Dwarf shrubs were harvested in the middle or later part of August . When the material had been processed it was found that an even later sampling
had been desirable in evergreen shrubs to include late-season weight increase in the leaves . In some cases also wood increment was found to take place very late in the season.
Herbs and Rhynchospora alba were sampled in late July or early August , before senescense became pronounced .
Fig . 6. Phenological spectra of field layer plants in the Special Area on the SkattlOsberg Stormosse. ( 1 ) Development of current shoots . (2) Green foliage present. (3) Foliage withering or withered (in autumn). (4) Flowering (at least one flower open in flowering shoots). (5) Fruits/seeds ripening or ripe (up to shedding or overripeness) . A species is considered to be in a certain phase when more than half of the individuals (in 4 and 5: More than half of the fertile individuals) are in this phase. The horizontal bars denote initial and final stages (i .e . when 1 0-50 OJo of the individuals are within the phase in question) . Data collecting ended on Sept. 24, 1 982.
Acta Phytogeogr. Suec. 74
Production and dynamics of individual species
Methods
The yearly aboveground production of each field layer species (except Pin us sylvestris, Carex limosa
and C. paucijlora) was determined . Other studies on certain species , including repeated sampling over the year and direct measurement of length growth will be presented under the species in question. For the assessment of the yearly aboveground production (called 'the main sampling' below) , the method put forward by T. Traczyk ( 1 967a and b) was used. The procedure is similar to the method commonly used for the estimation of tree and shrub layer production . It implies two steps : the determination of the density (D) of each species and of the average current year production (G) of an individual of each species . The total production (P) of all (n) species is then
n
p = � Gi Di i = 1
Newbould ( 1967) suggested the same method under the name the individual plant method . The same or similar methods for estimating biomass and production have been used in Poland by Aulak ( 1 970) , Plewczynska ( 1 970), Moszynska ( 1970, 1 973) , H .Traczyk ( 1 97 1 ) , Puszkar et al . ( 1 972) , T. Traczyk et al . ( 1973) and T. & H. Traczyk ( 1 977) , in Czechoslovakia by Brechtl & Kubicek ( 1 968) , Kubicek & Brechtl ( 1 970) and Kubicek & Jurko ( 1 975) , in Germany by Eber ( 1 97 1 ), in the Sovietic Far East by Andreev et al . ( 1 972) , on Greenland by Lewis & Callaghan ( 197 1 ) and in Canada by Reader & Stew art ( 1 972) and Stewart & Reader ( 1 972). A theoretical interest in the correlation between biomass and density has also arisen with the establishment of the '3/2 power law' (White & Harper 1 970 and several later authors) .
Density: Plants were counted in quadrats , the size of which varied, depending on the species , from -l 0x 1 0 cm to 200x200 cm (see Table 6) . The analyses
A cta Phytogeogr. Suec. 74
in hummock and lawn vegetation were made along straight lines , running more or less perpendicular to the contour lines , in the Special Area north of the extension of the lasiocarpa soak . There were five such lines traversing hummocks and lawns and in addition a few shorter lines in lawns. Points falling on the limit between a hummock and a lawn were disregarded . The quadrats of different sizes were nested and placed at every second metre. In the largest squares (200x200 cm) the vegetation was not everywhere homogeneous . The analysed area was in such cases extended perpendicularly to the baseline until approximately 4 m2 of hummock or lawn vegetation were included . The intention was to keep the ends of the lines at fixed points , but in order to avoid errors due to trampling, the lines had to be moved slightly before the harvest in 1 98 1 .
Carpet analyses were made in an area immediately to the east of the Special Area. Cuspidate turn du
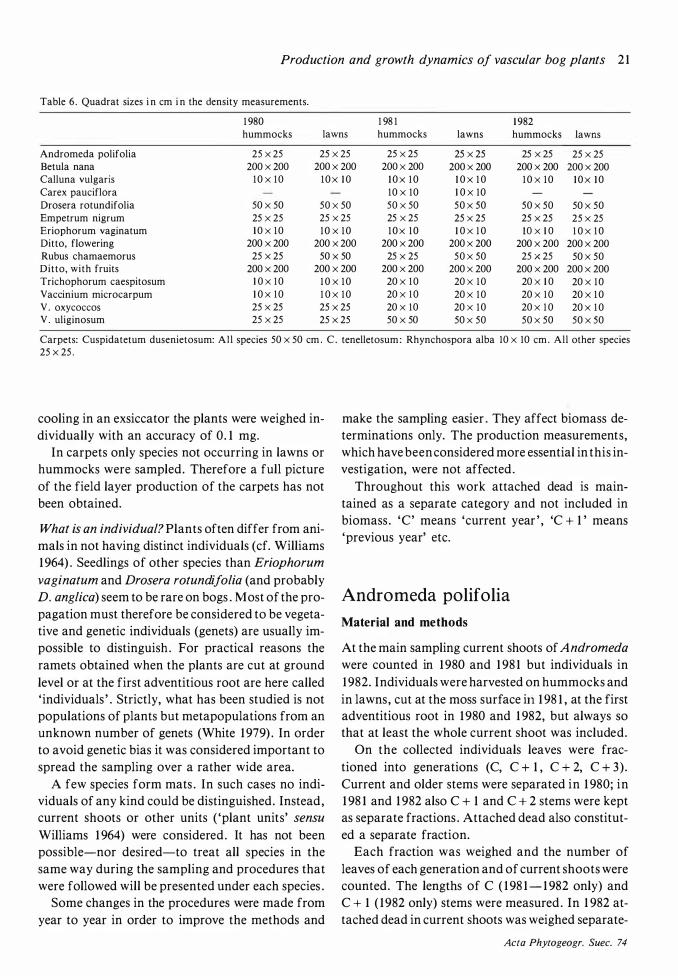
senietosum was analysed in a carpet with more or less pure stands of Scheuchzeria. Thirteen quadrats of 50x50 cm were analysed . In C. tenelletosum 30 squares were analysed, their size being 1 0x 10 cm for Rhynchospora alba and 25x25 cm for other species . It cannot be claimed that the carpet analyses give a true picture of the average density of the species in these communities . To obtain this an extensive and time-consuming sampling in the small carpets scattered over the bog would have been necessary. The objective has been restricted to give examples of the production in the two carpet communities .
Individual weight: Specimens of each species were sampled at regular intervals along straight lines on hummocks and in lawns east of the Special Area (eastern part of Slaktmossen) . The number of collected specimens varied between species from 25 to 100 according to degree of variation in plant size . The plants were taken to a refrigerator on the same day and moved to a freezer not later than the next day. They were later fractioned, dried at + 85 ° C for 48 hours (dwarf shrubs) or 24 hours (others) . After
Production and growth dynamics of vascular bog plants 2 1
Table 6 . Quadrat sizes i n cm i n the density measurements.
1 980 1 98 1 1 982 hummocks lawns hummocks lawns hummocks lawns
Andromeda polifolia 25 x 25 25 x 25 25 x 25 25 x 25 25 x 25 25 x 25 Betula nana 200 x 200 200 x 200 200 x 200 200 x 200 200 x 200 200 x 200 Calluna vulgaris 1 0 x 1 0 1 0 x 1 0 1 0 x 1 0 1 0 x 1 0 1 0 x 1 0 1 0 x 1 0 Carex pauciflora 10 x 10 1 0 X 10 Drosera rotundifolia 50 X 50 50 X 50 50 x 50 50 x 50 50 x 50 50 x 50 Empetrum nigrum 25 X 25 25 x 25 25 x 25 25 x 25 25 x 25 25 x 25 Eriophorum vaginatum 1 0 x 1 0 1 0 x 1 0 1 0 x 1 0 1 0 x 1 0 lO x 1 0 1 0 x 1 0 Ditto, flowering 200 x 200 200 x 200 200 x 200 200 x 200 200 X 200 200 x 200 Rubus chamaemorus 25 x 25 50 x 50 25 x 25 50 x 50 25 x 25 50 x 50 Ditto, with fruits 200 x 200 200 X 200 200 x 200 200 x 200 200 x 200 200 x 200 Trichophorum caespitosum 1 0 x 1 0 1 0 x 1 0 20 x 1 0 20 x 1 0 20 x 1 0 20 x 1 0 Vaccinium microcarpum 1 0 x 1 0 1 0 x 1 0 20 x 1 0 20 x 1 0 20 x 1 0 20 x 1 0 V. oxycoccos 25 x 25 25 x 25 20 x 10 20 x 1 0 20 x 1 0 20 x 1 0 V . uliginosum 25 x 25 25 x 25 50 x 50 50 x 50 50 x 50 50 x 50
Carpets: Cuspidatetum dusenietosum: All species 50 x 50 cm . C . tenelletosum : Rhynchospora alba 10 x 10 cm . All other species 25 X 25 .
cooling in an exsiccator the plants were weighed individually with an accuracy of 0. 1 mg.
In carpets only species not occurring in lawns or hummocks were sampled. Therefore a full picture of the field layer production of the carpets has not been obtained.
What is an individual? Plants often differ from animals in not havin� distinct individuals (cf. Williams 1 964) . Seedlings of other species than Eriophorum
vaginatum and Drosera rotundifolia (and probably D. anglica) seem to be rare on bogs . Most of the propagation must therefore be considered to be vegetative and genetic individuals (genets) are usually impossible to distinguish . For practical reasons the ramets obtained when the plants are cut at ground level or at the first adventitious root are here called ' individuals ' . Strictly, what has been studied is not populations of plants but metapopulations from an unknown number of genets (White 1 979) . In order to avoid genetic bias it was considered important to spread the sampling over a rather wide area.
A few species form mats . In such cases no individuals of any kind could be distinguished. Instead , current shoots or other units ( 'plant units' sensu
Williams 1 964) were considered . It has not been possible-nor desired-to treat all species in the same way during the sampling and procedures that were followed will be presented under each species .
Some changes in the procedures were made from year to year in order to improve the methods and
make the sampling easier . They affect biomass determinations only. The production measurements, which have been considered more essential in this investigation, were not affected.
Throughout this work attached dead is maintained as a separate category and not included in biomass . 'C' means 'current year ' , 'C + 1 ' means 'previous year' etc.
Andromeda polifolia
Material and methods
At the main sampling current shoots of Andromeda
were counted in 1 980 and 1 98 1 but individuals in 1 982. Individuals were harvested on hummocks and in lawns, cut at the moss surface irt 1 98 1 , at the first adventitious root in 1 980 and 1 982, but always so that at least the whole current shoot was included.
On the collected individuals leaves were fractioned into generations (C, C + 1 , C + 2, C + 3) . Current and older stems were separated in 1 980; in 1 98 1 and 1 982 also C + 1 and C + 2 stems were kept as separate fractions . Attached dead also constituted a separate fraction.
Each fraction was weighed and the number of leaves of each generation and of current shoots were counted. The lengths of C ( 1 98 1 - 1 982 only) and C + 1 ( 1982 only) stems were measured . In 1 982 attached dead in current shoots was weighed separate-
Acta Phytogeogr. Suec. 74
22 Ingvar Backeus
ly. Shoot generations are easily separated by means of the remaining bud scales .
The production per individual was calculated as the sum of the following:
(a) C stem weight
(b) weight increase in C + 1 stems :
(C + 1 stem weight · length- 1 -- C stem weight · length- 1 ) •
- C + 1 stem length
As estimates of shoot length were not available for all years, the existing estimates from 1 98 1 and 1 982 were used for calculations over all three years. Estimates for the weight increase in three-year-old stems and older are not available .
(c) weight of C leaves at the end of the season:
weight of one C + 1 leaf · number of C leaves
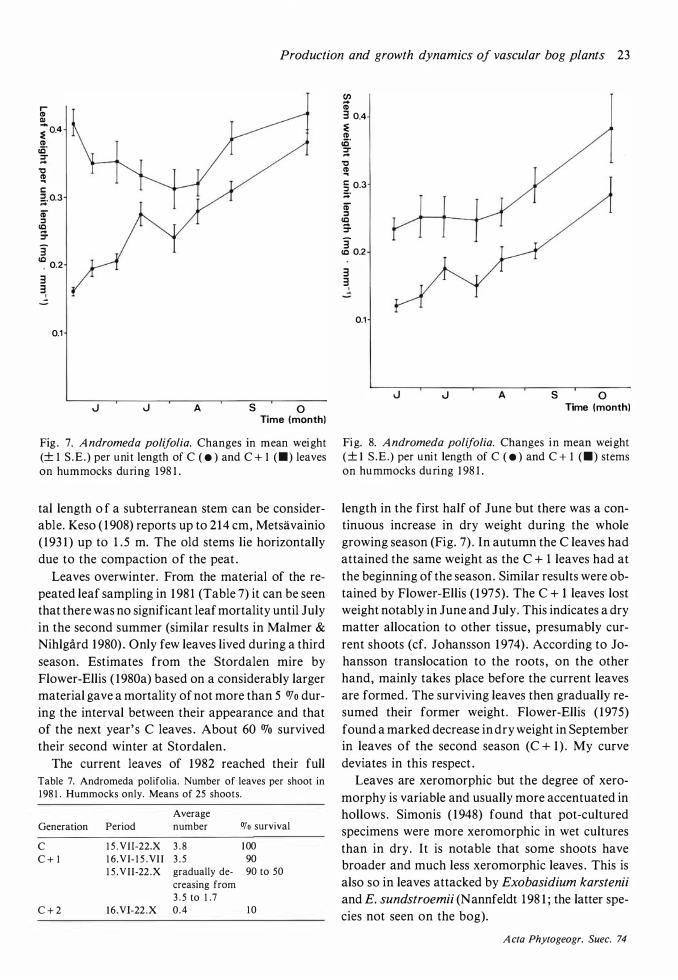
There was a considerable weight increase in C leaves after harvest . As is shown below, in autumn they attained the same weight as the C + 1 leaves . The C + 1 leaf weight times the number of C leaves therefore gives an estimate of current leaf production during the whole growing season.
The figures from the 1 980 and 1 98 1 countings were divided by the average number of current shoots per individual to obtain the number of individuals per unit area.
Besides the main sampling, 25 individuals from hummocks were harvested in 1 98 1 twice a month with the purpose of studying weight changes in leaves and stems. This material was transported to a freezer within three or four hours . Later the plants were fractioned and then immediately dried at 85°C for 36 hours . The plants were fractioned into C leaves , C + I leaves , C stems and C + 1 stems . Older leaves and stems were too few to give meaningful estimates . Stems and individual leaves were weighed and measured after drying with an accuracy of 0 .01 mg and 0. 1 mm respectively. To avoid errors due to chance fluctuations of leaf size in the samples, the weight to length ratio was used in the calculations (cf. Flower-Ellis 1 975). Leaf weight is linearly related to length according to Flower-Ellis ( 1973).
In 1 982 the length growth in current stems and leaves was followed by direct measurement with vernier calipers . This experiment was not very successful because of the summer frosts which substantially
A cta Phytogeogr. Suec. 74
damaged the shoots and therefore no results are presented .
Results and discussion
The length growth of current shoots in 1 98 1 and 1 982 commenced in the last week of May and ended in late June (Fig. 6) . Lindholm ( 1 982) reports a longer period , from early May to late June . No bark formation takes place in the upper parts of the shoots during their first summer (Segerstedt 1 894) . The limit between the two parts of the shoot were easily visible because of a sharp change in colour. Empetrum nigrum shows a similar situation, see further under that species .
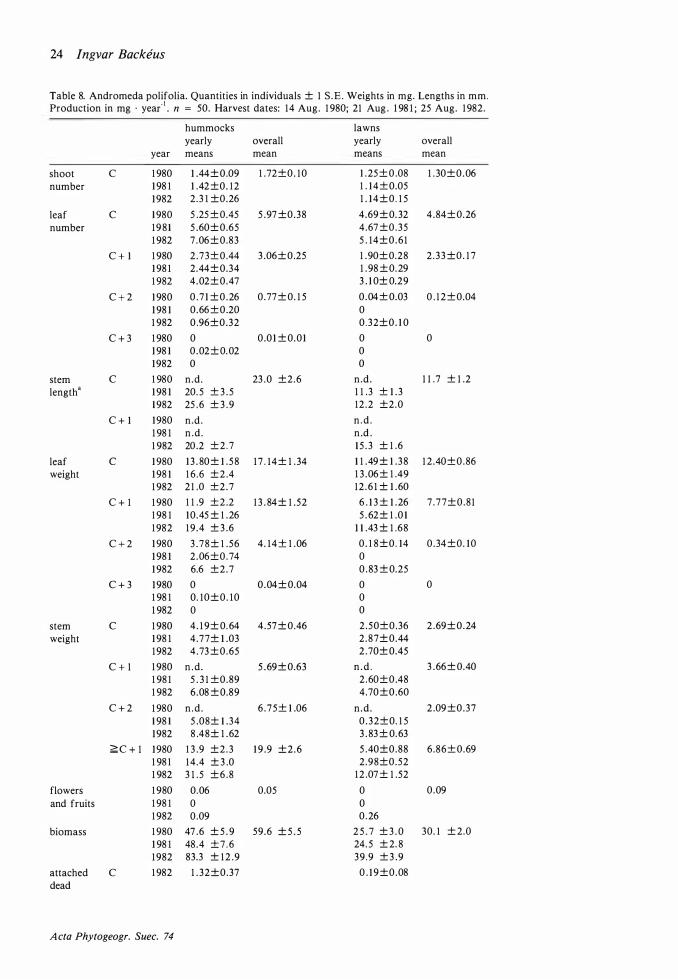
Weight increase in current stems continued during the whole growing season (Fig . 8) . No weight increase was found in the C + 1 stems in the earlier part of the growing season but a remarkable increase in the weight of these stems occurred in August and September, thus indicating that this was the time when wood increment took place.
The Andromeda shoots on the bog were usually short . 75 OJo of the shoots were shorter than 1 3 or 17 mm in lawns and on hummocks respectively. The plants therefore ran the risk of being overgrown by Sphagnum . It was not uncommon to see Andro
meda shoots with only the upper parts of a couple of leaves showing above the moss surface . Sometimes , however, considerably longer shoots (runners) are formed (cf. Warming 1 908) . They originate from a bud on a buried stem and grow obliquely upwards until they reach the surface, then gradually bend to a vertical position and form green leaves . The tallest measured runner from a lawn was 8 cm and from a hummock 1 5 cm. Subterranean runners that grew for more than one year before reaching the surface and forming leaves were very seldom seen (cf. Keso 1 908) . With these runners the plant is both propagated vegetatively and escapes the rise of the bog surface. The shoots of the next summer will again be of normal length . According to Keso ( 1 908) such shoots will live (in Hame, Finland) for 5 to 1 1 years before they die . Serebryakov ( 1962) reports (on Sphagnum bogs in the Moscow region) 6 to 8 years . Rosswall et al . ( 1 975) on the other hand, report up to 30-year-old shoots in some microhabitats on the Stordalen mire in north Sweden. Due to the repeated forming of runners the to-
Production and growth dynamics of vascular bog plants 23
r-(I) Ol ;o.4 (I) ce· ;?; '0 � s:::: 2. 0.3 ...
CD ::s cc ;. 3 � 0.2
3 3 �
0.1
J J A s 0 Time (month)
Fig . 7. A ndromeda polifolia. Changes in mean weight (± 1 S .E . ) per unit length of C ( • ) and C + 1 <•> leaves on hummocks during 1 98 1 .
tal length o f a subterranean stem can be considerable. Keso ( 1 908) reports up to 2 1 4 cm, Metsavainio ( 193 1 ) up to 1 . 5 m. The old stems lie horizontally due to the compaction of the peat .
Leaves overwinter. From the material of the repeated leaf sampling in 1 98 1 (Table 7) it can be seen that there was no significant leaf mortality until July in the second summer (similar results in Malmer & Nihlgard 1 980) . Only few leaves lived during a third season. Estimates from the Stordalen mire by Flower-Ellis ( 1980a) based on a considerably larger material gave a mortality of not more than 5 OJo during the interval between their appearance and that of the next year' s C leaves . About 60 % survived their second winter at Stordalen.
The current leaves of 1 982 reached their full Table 7. Andromeda polifolia. Number of leaves per shoot in 1 98 1 . Hummocks only. Means of 25 shoots.
Average Generation Period number OJo survival
c 1 5 . VII-22.X 3 . 8 1 00 C + 1 1 6 .VI- 1 5 .VI I 3 . 5 90
1 5 .VII-22 .X gradually de- 90 to 50 creasing from 3 . 5 to 1 .7
C + 2 1 6 .VI-22 .X 0 .4 1 0
(/) ... (I) 3 0.4 :E (I) <0' ::r ...
'0 � § 0.3 ;:;· CD ::s
cc ... ::r
3 cc 0.2
3 3�
0.1
J A s 0 Time (month)
Fig. 8. A ndromeda polifolia. Changes in mean weight ( ± 1 S .E .) per unit length of C ( • ) and C + 1 < • > stems on hummocks during 1 98 1 .
length in the first half of June but there was a continuous increase in dry weight during the whole growing season (Fig. 7) . In autumn the C leaves had attained the same weight as the C + 1 leaves had at the beginning of the season. Similar results were obtained by Flower-Ellis ( 1 975). The C + I leaves lost weight notably in June and July. This indicates a dry matter allocation to other tissue, presumably current shoots (cf. Johansson 1 974) . According to Johansson translocation to the roots , on the other hand, mainly takes place before the current leaves are formed . The surviving leaves then gradually resumed their former weight . Flower-Ellis ( 1 975) found a marked decrease in dry weight in September in leaves of the second season (C + 1 ) . My curve deviates in this respect .
Leaves are xeromorphic but the degree of xeromorphy is variable and usually more accentuated in hollows . Simonis ( 1 948) found that pot-cultured specimens were more xeromorphic in wet cultures than in dry . It is notable that some shoots have broader and much less xeromorphic leaves . This is also so in leaves attacked by Exobasidium karstenii
and E. sundstroemii (N annfeldt 1 98 1 ; the latter species not seen on the bog).
A cta Phytogeogr. Suec. 74
24 I ngvar Backeus
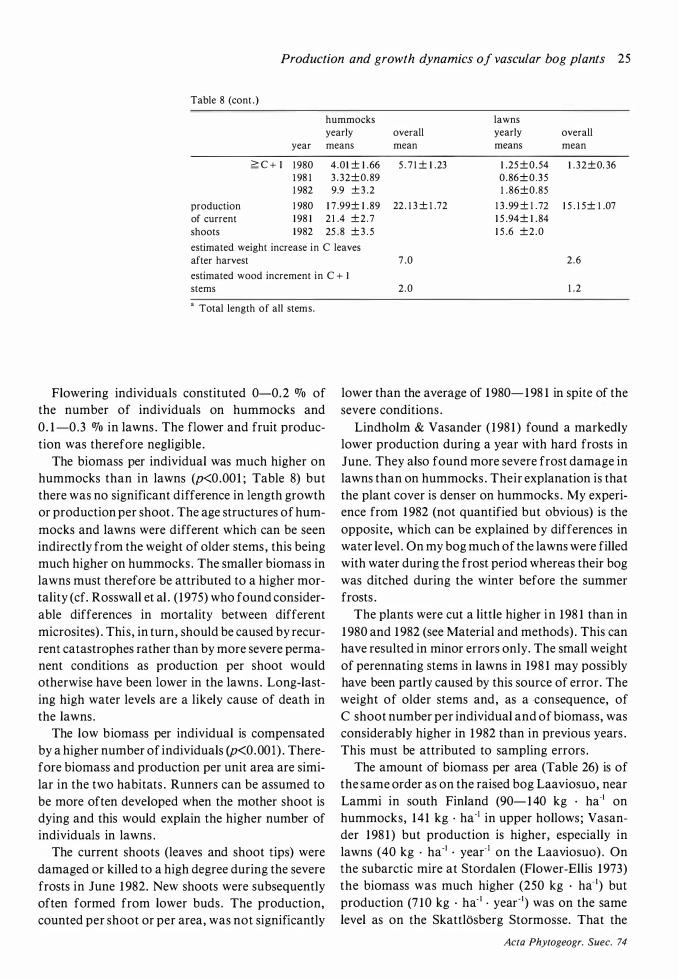
Table 8. Andromeda polifolia. Quantities in individuals ± 1 S .E. Weights in mg. Lengths in mm. Production in mg · yea(1 • n = 50. Harvest dates: 14 Aug. 1 980; 21 Aug . 1 98 1 ; 25 Aug. 1 982.
hummocks lawns yearly overall yearly overall
year means mean means mean
shoot c 1 980 1 .44± 0.09 1 .72 ±0. 1 0 1 . 25 ± 0 .08 1 . 30±0.06 number 1 98 1 1 .42 ±0. 1 2 1 . 1 4 ± 0.05
1 982 2 .3 1 ±0.26 1 . 1 4±0 . 1 5
leaf c 1 980 5 .25 ± 0.45 5 .97 ±0.38 4.69 ± 0. 32 4 .84± 0.26 number 1 9 8 1 5 .60± 0.65 4 .67 ±0.35
1 982 7 .06 ± 0.83 5 . 14±0.6 1
C + 1 1 980 2 .73± 0.44 3 .06± 0.25 1 .90± 0.28 2 . 33 ±0. 1 7 1 98 1 2.44± 0.34 1 .98 ± 0. 29 1 982 4 .02± 0.47 3 . 1 0± 0.29
C + 2 1 980 0 . 7 1 ±0 .26 0.77 ± 0. 1 5 0 .04 ± 0.03 0 . 1 2 ±0.04 1 98 1 0.66 ± 0.20 0 1 982 0 .96±0.32 0 .32±0. 1 0
C + 3 1 980 0 0 .0 1 ± 0.01 0 0 1 98 1 0 .02 ± 0. 02 0 1 982 0 0
stem c 1 980 n .d . 23 .0 ±2.6 n.d. 1 1 .7 ± 1 .2 length a 1 98 1 20. 5 ± 3 . 5 1 1 .3 ± 1 . 3
1 982 25 .6 ± 3 .9 12 .2 ±2.0
C + 1 1 980 n.d. n . d . 1 98 1 n .d . n .d . 1 982 20.2 ± 2 . 7 1 5 . 3 ± 1 .6
leaf c 1 980 1 3 . 80 ± 1 . 5 8 1 7 . 14± 1 . 34 1 1 .49 ± 1 .3 8 1 2 .40±0.86 weight 1 98 1 1 6 .6 ± 2 .4 1 3 .06 ± 1 .49
1 982 2 1 .0 ±2 .7 1 2 . 6 1 ± 1 .60
C + 1 1 980 1 1 .9 ± 2 .2 1 3 . 84 ± 1 .52 6 . 1 3 ± 1 .26 7 .77±0.8 1 1 98 1 1 0.45 ± 1 . 26 5 . 62 ± 1 .0 1 1 982 1 9 .4 ± 3 .6 1 1 .43 ± 1 .68
C + 2 1 980 3 .78± 1 .56 4 . 1 4 ± 1 .06 0 . 1 8 ±0 . 14 0 .34 ±0. 1 0 1 98 1 2 .06 ±0.74 0 1 982 6.6 ±2.7 0 . 83 ± 0.25
C + 3 1 980 0 0 .04 ± 0.04 0 0 1 98 1 0. 10±0. 10 0 1 982 0 0
stem c 1 980 4 . 1 9± 0. 64 4 .57 ± 0.46 2 .50±0.36 2 .69± 0.24 weight 1 98 1 4 .77± 1 .03 2 .87± 0.44
1 982 4 .73 ± 0.65 2 .70± 0.45
C + 1 1 980 n . d. 5 .69 ± 0.63 n . d . 3 .66 ± 0.40 1 98 1 5 . 3 1 ±0.89 2 .60±0.48 1 982 6.08 ± 0.89 4.70±0.60
C + 2 1 980 n .d . 6 . 75± 1 .06 n .d . 2 .09 ±0.37 1 98 1 5 .08± 1 .34 0 .32±0. 1 5 1 982 8 .48± 1 .62 3 . 83 ± 0. 63
;;;;:c + 1 1 980 1 3 .9 ±2.3 1 9 .9 ±2 .6 5 .40±0.88 6 .86± 0.69 1 98 1 1 4 .4 ± 3 .0 2 .98±0.52 1 982 3 1 . 5 ±6 .8 1 2 .07 ± 1 .52
flowers 1 980 0.06 0.05 0 0 .09 and fruits 1 98 1 0 0
1 982 0 .09 0 .26
biomass 1 980 47 .6 ± 5 . 9 59.6 ± 5 . 5 2 5 . 7 ± 3 . 0 30. 1 ± 2.0 1 98 1 48 .4 ± 7 . 6 24. 5 ± 2. 8 1 982 83.3 ± 1 2 .9 39 .9 ± 3 .9
attached c 1 982 1 . 32±0.37 0 . 1 9 ±0.08 dead
A cta Phytogeogr. Suec. 74
Production and growth dynamics of vascular bog plants 25
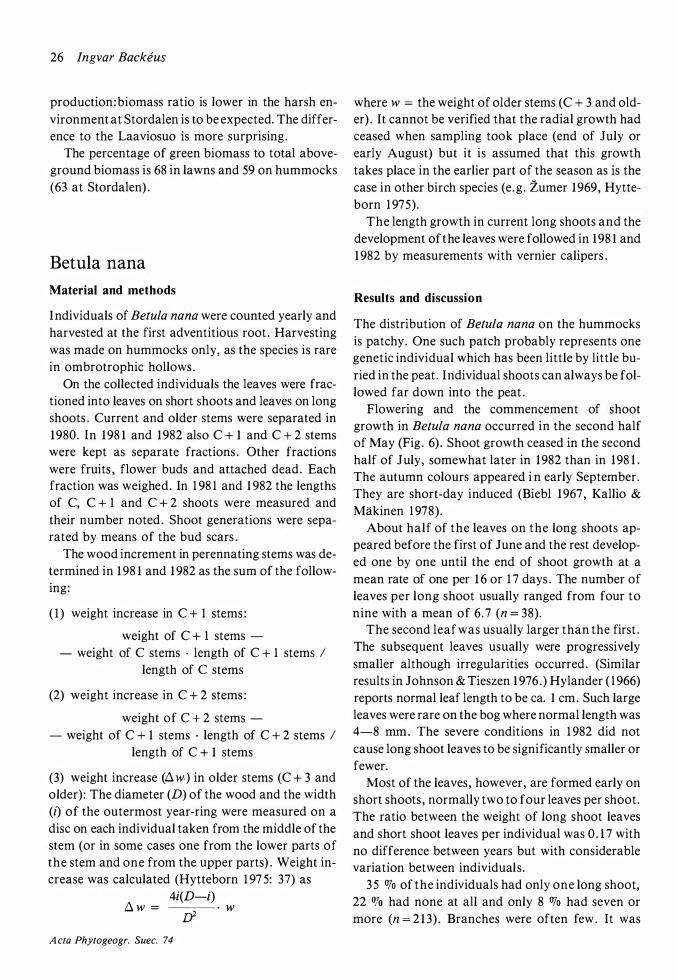
Table 8 (cont . )
hummocks lawns yearly overall yearly overall
year means mean means mean
� C + 1 1 980 4 .01 ± 1 .66 5 . 7 1 ± 1 .23 1 .25 ±0 .54 1 . 32±0. 36 1 98 1 3 . 32±0. 89 0 .86±0 .35 1 982 9.9 ± 3 .2 1 . 86±0.85
production 1 980 1 7 .99± 1 . 89 22 . 1 3 ± 1 .72 1 3 .99 ± 1 .71 1 5 . 1 5 ± 1 .07 of current 1 98 1 2 1 .4 ±2 .7 1 5 .94± 1 . 84 shoots 1 982 25 . 8 ± 3 . 5 1 5 .6 ±2.0
estimated weight increase in C leaves after harvest 7 .0 2 .6
estimated wood increment in C + I stems
a Total length of all stems.
Flowering individuals constituted 0-0. 2 OJo of the number of individuals on hummocks and 0. 1 -0.3 % in lawns . The flower and fruit production was therefore negligible .
The biomass per individual was much higher on hummocks than in lawns (p<0.001 ; Table 8) but there was no significant difference in length growth or production per shoot . The age structures of hummocks and lawns were different which can be seen indirectly from the weight of older stems , this being much higher on hummocks . The smaller biomass in lawns must therefore be attributed to a higher mortality (cf. Rosswall et al . ( 1 975) who found considerable differences in mortality between different microsites) . This , in turn, should be caused by recurrent catastrophes rather than by more severe permanent conditions as production per shoot would otherwise have been lower in the lawns . Long-lasting high water levels are a likely cause of death in the lawns .
The low biomass per individual is compensated by a higher number of individuals (p<O.OOl ) . Therefore biomass and production per unit area are similar in the two habitats . Runners can be assumed to be more often developed when the mother shoot is dying and this would explain the higher number of individuals in lawns .
The current shoots (leaves and shoot tips) were damaged or killed to a high degree during the severe frosts in June 1 982. New shoots were subsequently often formed from lower buds . The production, counted per shoot or per area, was not significantly
2 .0 1 .2
lower than the average of 1 980- 1 98 1 in spite of the severe conditions .
Lindholm & Vasander ( 1 98 1 ) found a markedly lower production during a year with hard frosts in June. They also found more severe frost damage in lawns than on hummocks . Their explanation is that the plant cover is denser on hummocks . My experience from 1 982 (not quantified but obvious) is the opposite, which can be explained by differences in water level . On my bog much of the lawns were filled with water during the frost period whereas their bog was ditched during the winter before the summer frosts .
The plants were cut a little higher in 1 98 1 than in 1 980 and 1 982 (see Material and methods) . This can have resulted in minor errors only. The small weight of perennating stems in lawns in 198 1 may possibly have been partly caused by this source of error. The weight of older stems and, as a ·consequence, of C shoot number per individual and of biomass, was considerably higher in 1 982 than in previous years . This must be attributed to sampling errors .
The amount of biomass per area (Table 26) is of the same order as on the raised bog Laaviosuo, near Lammi in south Finland (90- 1 40 kg · ha-1 on hummocks, 14 1 kg · ha-1 in upper hollows ; Vasander 1 98 1 ) but production is higher, especially in lawns (40 kg · ha-1 • year- 1 on the Laaviosuo) . On the subarctic mire at Stordalen (Flower-Ellis 1 973)
the biomass was much higher (250 kg · ha- 1) but production (7 10 kg · ha- 1 • year-1) was on the same level as on the Skattlosberg Stormosse. That the
Acta Phytogeogr. Suec. 74
26 Ingvar Backeus
production: biomass ratio is lower in the harsh environment at Stordalen is to be expected. The difference to the Laaviosuo is more surprising .
The percentage of green biomass to total aboveground biomass is 68 in lawns and 59 on hummocks (63 at Stordalen) .
Betula nana
Material and methods
Individuals of Betula nana were counted yearly and harvested at the first adventitious root . Harvesting was made on hummocks only, as the species is rare in ombrotrophic hollows .
On the collected individuals the leaves were fractioned into leaves on short shoots and leaves on long shoots . Current and older stems were separated in 1 980. In 1 98 1 and 1 982 also C + 1 and C + 2 stems were kept as separate fractions . Other fractions were fruits , flower buds and attached dead. Each fraction was weighed. In 1 98 1 and 1 982 the lengths of C, C + 1 and C + 2 shoots were measured and their number noted . Shoot generations were separated by means of the bud scars .
The wood increment in perennating stems was determined in 1 98 1 and 1 982 as the sum of the following:
( 1 ) weight increase in C + 1 stems :
weight of C + 1 stems -- weight of C stems · length of C + 1 stems I
length of C stems
(2) weight increase in C + 2 stems :
weight of C + 2 stems -- weight of C + 1 stems · length of C + 2 stems I
length of C + 1 stems
(3) weight increase (Ll w) in older stems (C + 3 and older): The diameter (D) of the wood and the width (l) of the outermost year-ring were measured on a disc on each individual taken from the middle of the stem (or in some cases one from the lower parts of the stem and one from the upper parts) . Weight increase was calculated (Hytteborn 1 97 5: 3 7) as
4i(D-l) Ll w = d · w
A cta Phytogeogr. Suec. 74
where w = the weight of older stems (C + 3 and older) . It cannot be verified that the radial growth had ceased when sampling took place (end of July or early August) but it is assumed that this growth takes place in the earlier part of the season as is the case in other birch species (e.g . Zumer 1 969, Hytteborn 1 975) .
The length growth in current long shoots and the development of the leaves were followed in 1 98 1 and 1 982 by measurements with vernier calipers .
Results and discussion
The distribution of Betula nana on the hummocks is patchy. One such patch probably represents one genetic individual which has been little by little buried in the peat. Individual shoots can always be followed far down into the peat .
Flowering and the commencement of shoot growth in Betula nana occurred in the second half of May (Fig . 6) . Shoot growth ceased in the second half of July, somewhat later in 1 982 than in 1 98 1 .
The autumn colours appeared i n early September . They are short-day induced (Biebl 1 967 , Kallio & Makinen 1 978) .
About half of the leaves on the long shoots appeared before the first of June and the rest developed one by one until the end of shoot growth at a mean rate of one per 1 6 or 1 7 days . The number of leaves per long shoot usually ranged from four to nine with a mean of 6. 7 (n = 38).
The second leaf was usually larger than the first . The subsequent leaves usually were progressively smaller although irregularities occurred. (Similar results in Johnson & Tieszen 1 976 .) Hylander ( 1 966)
reports normal leaf length to be ea. 1 cm. Such large leaves were rare on the bog where normal length was 4-8 mm. The severe conditions in 1 982 did not cause long shoot leaves to be significantly smaller or fewer.
Most of the leaves , however , are formed early on short shoots , normally two to four leaves per shoot. The ratio between the weight of long shoot leaves and short shoot leaves per individual was 0. 1 7 with no difference between years but with considerable variation between individuals .
3 5 OJo of the individuals had only one long shoot, 22 OJo had none at all and only 8 OJo had seven or more (n = 2 1 3) . Branches were often few . It was
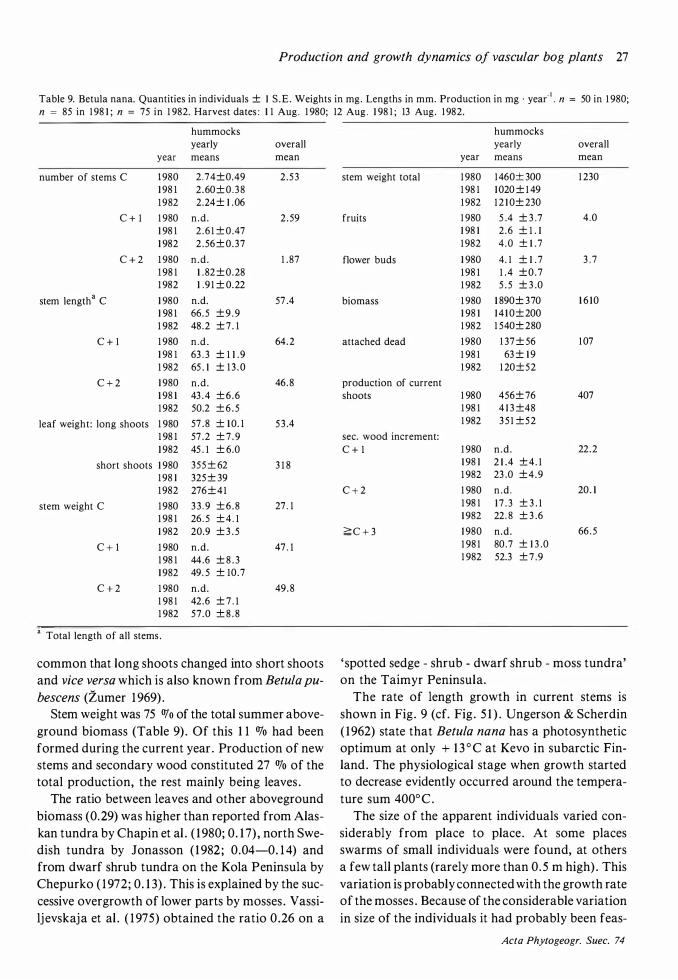
Production and growth dynamics of vascular bog plants 27
Table 9. Betula nana. Quantities in individuals ± 1 S .E . Weights in mg. Lengths in mm. Production in mg · year- 1 • n == 50 in 1 980; n == 85 in 1 98 1 ; n == 75 in 1 982. Harvest dates : 1 1 Aug . 1 980; 12 Aug . 1 98 1 ; 13 Aug. 1 982.
hummocks yearly overall
year means mean
number of stems C 1 980 2 .74±0.49 2 . 53 1 98 1 2 .60±0 .38 1 982 2.24± 1 .06
C + 1 1 980 n .d . 2 . 59 1 98 1 2 . 6 1 ± 0.47 1 982 2 . 56 ± 0.37
C + 2 1 980 n.d. 1 .87 1 98 1 1 .82 ±0 .28 1 982 1 .9 1 ± 0.22
stem length a C 1 980 n.d. 57 .4 1 98 1 66. 5 ±9 .9 1 982 48 .2 ± 7 . 1
C + 1 1 980 n .d . 64 . 2 1 98 1 63 . 3 ± 1 1 .9 1 982 65 . 1 ± 1 3 . 0
C + 2 1 980 n .d . 46 . 8 1 98 1 43 . 4 ± 6 . 6 1 982 50.2 ± 6 . 5
leaf weight: long shoots 1 980 57 .8 ± 1 0. 1 5 3 .4 1 98 1 57 .2 ± 7 . 9 1 982 45 . 1 ± 6.0
short shoots 1 980 355 ± 62 3 1 8 1 98 1 325 ± 39 1 982 276 ± 4 1
stem weight C 1 980 3 3 . 9 ± 6 . 8 27 . 1 1 98 1 26 . 5 ± 4 . 1 1 982 20.9 ± 3 . 5
C + 1 1 980 n .d . 47 . 1 1 98 1 44.6 ± 8 . 3 1 982 49 . 5 ± 10.7
C + 2 1 980 n .d . 49. 8 1 98 1 42.6 ± 7 . 1 1 982 57 .0 ± 8 . 8
a Total length of all stems .
common that long shoots changed into short shoots and vice versa which is also known from Betula pu
bescens (Zumer 1 969) . Stem weight was 75 OJo of the total summer above
ground biomass (Table 9) . Of this 1 1 % had been formed during the current year . Production of new stems and secondary wood constituted 27 % of the total production, the rest mainly being leaves .
The ratio between leaves and other aboveground biomass (0.29) was higher than reported from Alaskan tundra by Chapin et al . ( 1 980; 0. 1 7) , north Swedish tundra by Jonasson ( 1 982; 0.04-0. 1 4) and from dwarf shrub tundra on the Kola Peninsula by Chepurko ( 1 972; 0. 1 3) . This is explained by the successive over growth of lower parts by mosses . Vassilj evskaja et al . ( 1 975) obtained the ratio 0 .26 on a
hummocks yearly overall
year means mean
stem weight total 1 980 1460± 300 1 230 1 98 1 1 020 ± 1 49 1 982 1 2 1 0± 230
fruits 1 980 5 .4 ± 3 .7 4 .0 1 98 1 2 .6 ± 1 . 1 1 982 4 .0 ± 1 .7
flower buds 1 980 4. 1 ± 1 . 7 3 . 7 1 98 1 1 . 4 ±0.7 1 982 5 . 5 ± 3 .0
biomass 1 980 1 890± 370 1 6 10 1 98 1 1 4 1 0 ± 200 1 982 1 540± 280
attached dead 1 980 1 37 ± 56 1 07 1 98 1 63 ± 1 9 1 982 1 20±52
production of current shoots 1 980 456± 76 407
1 98 1 4 1 3 ±48 1 982 3 5 1 ±52
sec. wood increment: C + 1 1 980 n.d. 22.2
1 98 1 2 1 .4 ± 4 . 1 1 982 23 .0 ±4.9
C + 2 1 980 n .d . 20. 1 1 98 1 1 7 . 3 ± 3 . 1 1 982 22 . 8 ± 3 .6
;;;;c + 3 1 980 n .d . 66. 5 1 98 1 80 .7 ± 1 3 .0 1 982 52.3 ± 7 .9
' spotted sedge - shrub - dwarf shrub - moss tundra' on the Taimyr Peninsula.
The rate of length growth in current stems is shown in Fig . 9 (cf. Fig . 5 1 ) . Ungerson & Scherdin ( 1962) state that Betula nana has a photosynthetic optimum at only + 1 3 ° C at Kevo in subarctic Finland. The physiological stage when growth started to decrease evidently occurred around the temperature sum 400°C .
The size o f the apparent individuals varied considerably from place to place. At some places swarms of small individuals were found, at others a few tall plants (rarely more than 0. 5 m high) . This variation is probably connected with the growth rate of the mosses . Because of the considerable variation in size of the individuals it had probably been feas-
Acta Phytogeogr. Suec. 74
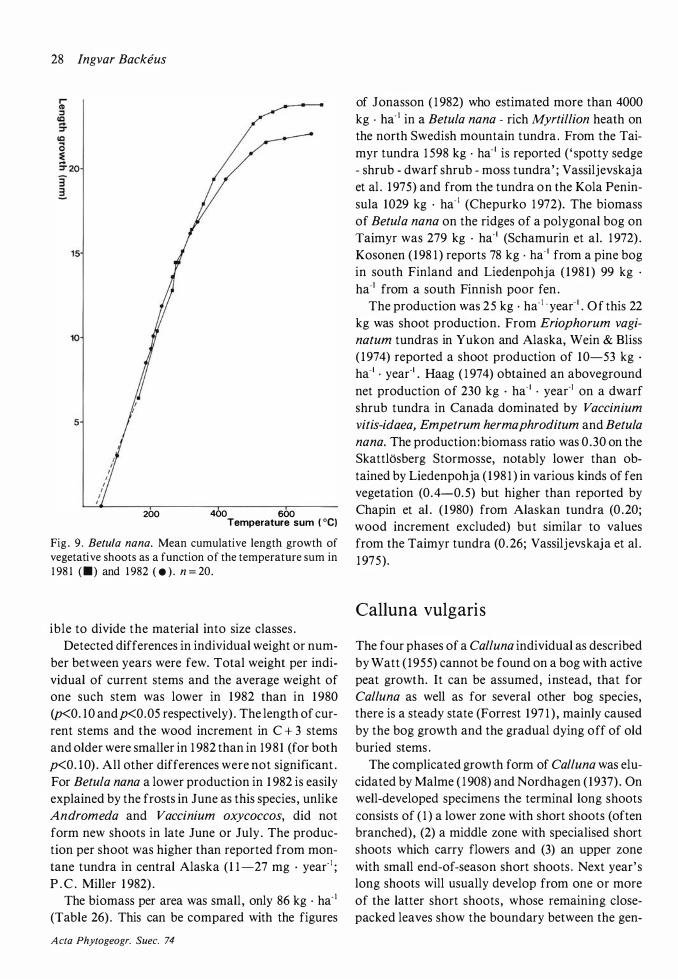
28 lngvar Backeus
200 400 600 Temperature sum ( °C)
Fig . 9. Betula nana. Mean cumulative length growth of vegetative shoots as a function of the temperature sum in 1 98 1 c•) and 1 982 ( e ) . n = 20.
ible to divide the material into size classes . Detected differences in individual weight or num
ber between years were few. Total weight per individual of current stems and the average weight of one such stem was lower in 1 982 than in 1 980 (p<0. 10 andp<0.05 respectively) . The length of current stems and the wood increment in C + 3 stems and older were smaller in 1 982 than in 198 1 (for both p<0. 1 0) . All other differences were not significant . For Betula nana a lower production in 1 982 is easily explained by the frosts in June as this species , unlike Andromeda and Vaccinium oxycoccos, did not form new shoots in late June or July . The production per shoot was higher than reported from montane tundra in central Alaska ( 1 1 -27 mg · year- 1 ; P . C . Miller 1 982) .
The biomass per area was small , only 86 kg · ha- 1 (Table 26) . This can be compared with the figures
A cta Phytogeogr. Suec. 74
of J onasson ( 1 982) who estimated more than 4000 kg · ha- 1 in a Betula nana - rich Myrtillion heath on the north Swedish mountain tundra . From the Taimyr tundra 1 598 kg · ha· • is reported ( ' spotty sedge - shrub - dwarf shrub - moss tundra' ; Vassiljevskaja et al . 1 975) and from the tundra on the Kola Peninsula 1029 kg · ha· • (Chepurko 1 972). The biomass of Betula nana on the ridges of a polygonal bog on Taimyr was 279 kg · ha· • (Schamurin et al. 1 972) . Kosonen ( 198 1 ) reports 78 kg · ha- • from a pine bog in south Finland and Liedenpohja ( 1 98 1 ) 99 kg · ha-• from a south Finnish poor fen .
The production was 25 kg · ha· • · year· • . Of this 22 kg was shoot production. From Eriophorum vagi
natum tundras in Yukon and Alaska, Wein & Bliss ( 1 974) reported a shoot production of 10-53 kg ·
ha· • . year·• . Haag ( 1 974) obtained an aboveground net production of 230 kg · ha· • · year·• on a dwarf shrub tundra in Canada dominated by Vaccinium
vitis-idaea, Empetrum hermaphroditum and Betula
nana. The production :biomass ratio was 0 .30 on the Skattlosberg Stormosse, notably lower than obtained by Liedenpohja ( 1 98 1 ) in various kinds of fen vegetation (0.4-0.5) but higher than reported by Chapin et al . ( 1 980) from Alaskan tundra (0 .20; wood increment excluded) but similar to values from the Taimyr tundra (0 .26; Vassilj evskaja et al . 1 975) .
Calluna vulgaris
The four phases of a Calluna individual as described by Watt ( 1955) cannot be found on a bog with active peat growth. It can be assumed, instead, that for Calluna as well as for several other bog species, there is a steady state (Forrest 1 97 1 ) , mainly caused by the bog growth and the gradual dying off of old buried stems .
The complicated growth form of Calluna was elucidated by Malme ( 1 908) and Nordhagen ( 1937) . On well-developed specimens the terminal long shoots consists of ( 1 ) a lower zone with short shoots (often branched) , (2) a middle zone with specialised short shoots which carry flowers and (3) an upper zone with small end-of-season short shoots . Next year' s long shoots will usually develop from one or more of the latter short shoots , whose remaining closepacked leaves show the boundary between the gen-
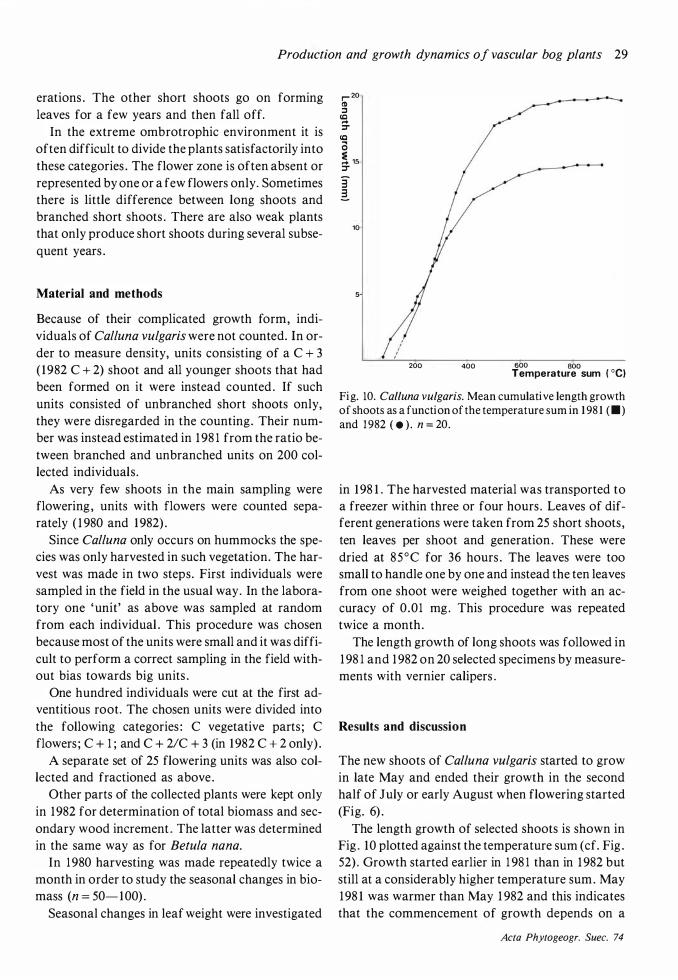
Production and growth dynamics of vascular bog plants 29
erations . The other short shoots go on forming leaves for a few years and then fall off.
In the extreme ombrotrophic environment it is often difficult to divide the plants satisfactorily into these categories . The flower zone is often absent or represented by one or a few flowers only. Sometimes there is little difference between long shoots and branched short shoots . There are also weak plants that only produce short shoots during several subsequent years .
Material and methods
Because of their complicated growth form, individuals of Calluna vulgaris were not counted. In order to measure density, units consisting of a C + 3 ( 1 982 C + 2) shoot and all younger shoots that had been formed on it were instead counted . If such units consisted of unbranched short shoots only, they were disregarded in the counting. Their number was instead estimated in 1 98 1 from the ratio between branched and unbranched units on 200 collected individuals .
As very few shoots in the main sampling were flowering , units with flowers were counted separately ( 1 980 and 1 982) .
Since Calluna only occurs on hummocks the species was only harvested in such vegetation. The harvest was made in two steps. First individuals were sampled in the field in the usual way. In the laboratory one 'unit' as above was sampled at random from each individual . This procedure was chosen because most of the units were small and it was difficult to perform a correct sampling in the field without bias towards big units .
One hundred individuals were cut at the first adventitious root. The chosen units were divided into the following categories : C vegetative parts ; C flowers ; C + 1 ; and C + 2/C + 3 (in 1 982 C + 2 only) .
A separate set of 25 flowering units was also collected and fractioned as above.
Other parts of the collected plants were kept only in 1 982 for determination of total biomass and secondary wood increment . The latter was determined in the same way as for Betula nana.
In 1 980 harvesting was made repeatedly twice a month in order to study the seasonal changes in biomass (n = 50- 100) .
Seasonal changes in leaf weight were investigated
r- 20 (1) :I
cc .... :r
cc a � 15 :r
3 2..
10
200 400 600 800 Temperature sum ( °C)
Fig. 10. Calluna vulgaris. Mean cumulative length growth of shoots as a function of the temperature sum in 1 98 1 c•) and 1 982 ( e ) . n = 20.
in 1 98 1 . The harvested material was transported to a freezer within three or four hours . Leaves of different generations were taken from 25 short shoots , ten leaves per shoot and generation . These were dried at 85°C for 36 hours . The leaves were too small to handle one by one and instead the ten leaves from one shoot were weighed together with an accuracy of 0.01 mg . This procedure was repeated twice a month.
The length growth of long shoots was followed in 1 98 1 and 1 982 on 20 selected specimens by measurements with vernier calipers .
Results and discussion
The new shoots of Calluna vulgaris started to grow in late May and ended their growth in the second half of July or early August when flowering started (Fig. 6) .
The length growth of selected shoots is shown in Fig . 10 plotted against the temperature sum (cf. Fig . 52) . Growth started earlier in 1 98 1 than in 1 982 but still at a considerably higher temperature sum. May 1 98 1 was warmer than May 1 982 and this indicates that the commencement of growth depends on a
Acta Phytogeogr. Suec. 74
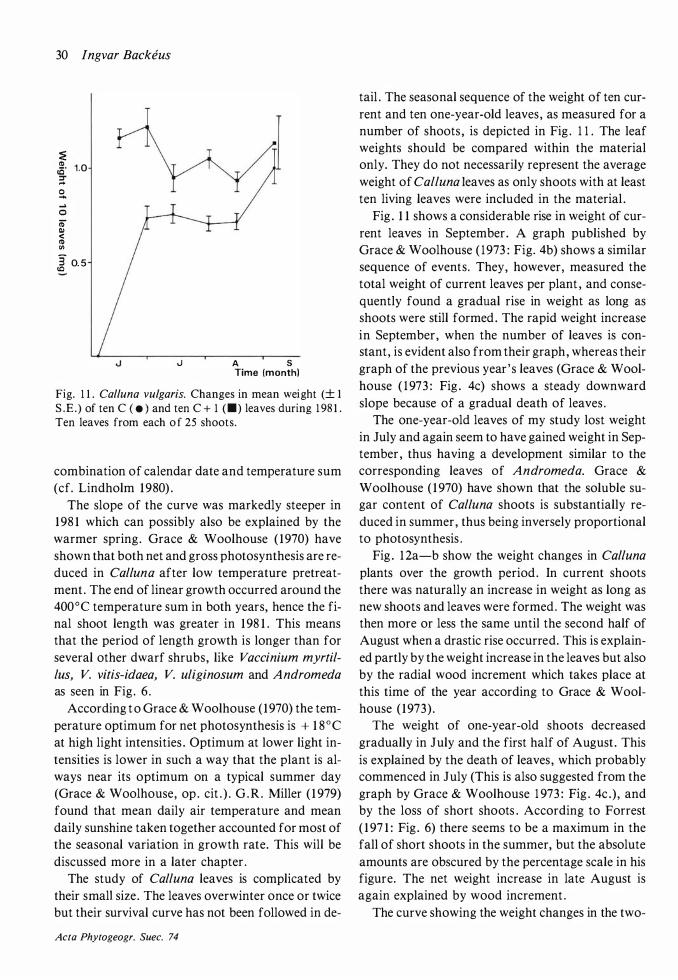
30 Ingvar Backeus
:E (t) 1 .0 10' � g, .... 0 Cb Ill < (t) t/1
� 0. 5
..J A S Time (month)
Fig. 1 1 . Calluna vulgaris. Changes in mean weight (± 1 S .E . ) of ten C ( • ) and ten C + 1 <•) leaves during 1 98 1 . Ten leaves from each o f 25 shoots.
combination of calendar date and temperature sum (cf. Lindholm 1 980) .
The slope of the curve was markedly steeper in 1 98 1 which can possibly also be explained by the warmer spring. Grace & Woolhouse ( 1970) have shown that both net and gross photosynthesis are reduced in Calluna after low temperature pretreatment . The end of linear growth occurred around the 400°C temperature sum in both years, hence the final shoot length was greater in 1 98 1 . This means that the period of length growth is longer than for several other dwarf shrubs , like Vaccinium myrtil
lus, V. vitis-idaea, V. uliginosum and Andromeda
as seen in Fig . 6 . According to Grace & W oolhouse ( 1 970) the tern
perature optimum for net photosynthesis is + 1 8 °C
at high light intensities . Optimum at lower light intensities is lower in such a way that the plant is always near its optimum on a typical summer day (Grace & Woolhouse, op . cit . ) . G . R . Miller ( 1 979)
found that mean daily air temperature and mean daily sunshine taken together accounted for most of the seasonal variation in growth rate. This will be discussed more in a later chapter .
The study of Calluna leaves is complicated by their small size . The leaves overwinter once or twice but their survival curve has not been followed in de-
Acta Phytogeogr. Suec. 74
tail . The seasonal sequence of the weight of ten current and ten one-year-old leaves , as measured for a number of shoots , is depicted in Fig . 1 1 . The leaf weights should be compared within the material only. They do not necessarily represent the average weight of Calluna leaves as only shoots with at least ten living leaves were included in the material .
Fig . 1 1 shows a considerable rise in weight of current leaves in September . A graph published by Grace & Woolhouse ( 1 973 : Fig. 4b) shows a similar sequence of events . They, however, measured the total weight of current leaves per plant , and consequently found a gradual rise in weight as long as shoots were still formed . The rapid weight increase in September, when the number of leaves is constant, is evident also from their graph , whereas their graph of the previous year's leaves (Grace & Woolhouse ( 1 973 : Fig . 4c) shows a steady downward slope because of a gradual death of leaves .
The one-year-old leaves of my study lost weight in July and again seem to have gained weight in September , thus having a development similar to the corresponding leaves of Andromeda. Grace & Woolhouse ( 1 970) have shown that the soluble sugar content of Calluna shoots is substantially reduced in summer, thus being inversely proportional to photosynthesis .
Fig . 1 2a-b show the weight changes in Calluna
plants over the growth period . In current shoots there was naturally an increase in weight as long as new shoots and leaves were formed . The weight was then more or less the same until the second half of August when a drastic rise occurred. This is explained partly by the weight increase in the leaves but also by the radial wood increment which takes place at this time of the year according to Grace & Woolhouse ( 1 973) .
The weight of one-year-old shoots decreased gradually in July and the first half of August . This is explained by the death of leaves , which probably commenced in July (This is also suggested from the graph by Grace & Woolhouse 1 973 : Fig . 4c .) , and by the loss of short shoots . According to Forrest ( 1 97 1 : Fig. 6) there seems to be a maximum in the fall of short shoots in the summer, but the absolute amounts are obscured by the percentage scale in his figure. The net weight increase in late August is again explained by wood increment .
The curve showing the weight changes in the two-
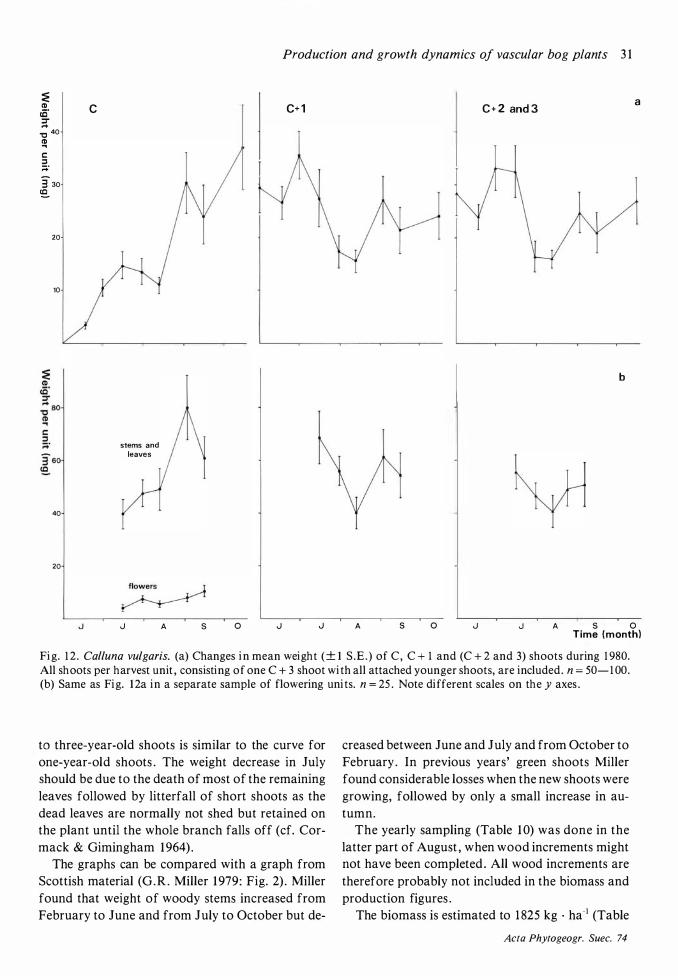
=E CD ce· :r '*
"C 40 � c � ;:;:
3 30 �
20
10
40
20
c
stems and leaves
Production and growth dynamics of vascular bog plants 3 1
C+ 1 C + 2 and 3
b
a
,J ,J A s 0 ,J ,J A s 0 ,J ,J A S 0
Time (month)
Fig. 1 2. Calluna vulgaris. (a) Changes in mean weight (± 1 S .E . ) of C, C + 1 and (C + 2 and 3) shoots during 1 980. All shoots per harvest unit , consisting of one C + 3 shoot with all attached younger shoots, are included . n = 50- 1 00. (b) Same as Fig. 1 2a in a separate sample of flowering units. n = 25 . Note different scales on the y axes .
to three-year-old shoots is similar to the curve for one-year-old shoots . The weight decrease in July should be due to the death of most of the remaining leaves followed by litterfall of short shoots as the dead leaves are normally not shed but retained on the plant until the whole branch falls off (cf. Cormack & Gimingham 1 964) .
The graphs can be compared with a graph from Scottish material (G .R . Miller 1 979: Fig. 2) . Miller found that weight of woody stems increased from February to June and from July to October but de-
creased between June and July and from October to February. In previous years' green shoots Miller found considerable losses when the new shoots were growing, followed by only a small increase in autumn.
The yearly sampling (Table 1 0) was done in the latter part of August , when wood increments might not have been completed . All wood increments are therefore probably not included in the biomass and production figures .
The biomass is estimated to 1 825 kg · ha-1 (Table
Acta Phytogeogr. Suec. 74
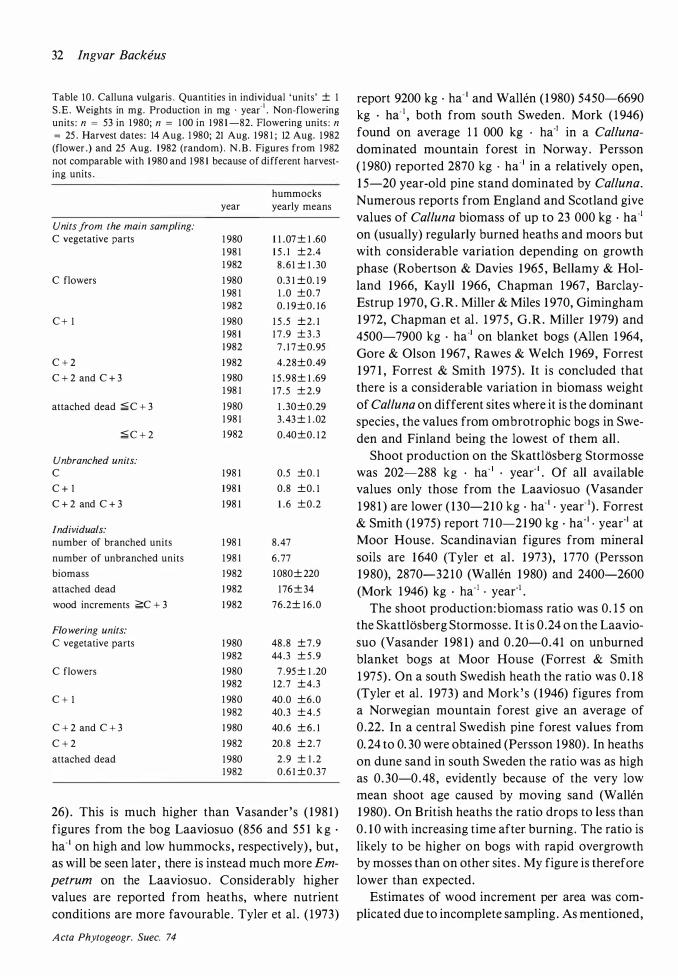
32 Ingvar Backeus
Table 10 . Calluna vulgaris . Quantities in individual 'units' ± 1 S .E. Weights in mg. Production in mg · yea(1 • Non-flowering units : n = 53 in 1 980; n = 1 00 in 1 98 1 -82. Flowering units : n
= 25 . Harvest dates : 14 Aug. 1 980; 21 Aug. 1 98 1 ; 12 Aug. 1 982 (flower .) and 25 Aug. 1 982 (random) . N . B . Figures from 1 982 not comparable with 1 980 and 1 98 1 because of different harvesting units .
hummocks year yearly means
Units from the main sampling:
C vegetative parts 1 980 1 1 .07 ± 1 .60 1 98 1 1 5 . 1 ±2 .4 1 982 8 . 6 1 ± 1 . 30
C flowers 1 980 0.3 1 ± 0. 1 9 1 98 1 1 .0 ±0.7 1 982 0. 1 9±0 . 1 6
C + I 1 980 1 5 .5 ±2 . 1 1 98 1 1 7 .9 ± 3 .3 1 982 7 . 1 7 ± 0.95
C + 2 1 982 4.28±0.49
C + 2 and C + 3 1 980 1 5 .98± 1 .69 1 98 1 1 7 . 5 ± 2.9
attached dead � C + 3 1 980 1 . 30±0.29 1 98 1 3 . 43 ± 1 .02
� C + 2 1 982 0.40±0. 1 2
Unbranched units:
c 1 98 1 0.5 ±0 . 1
C + l 1 98 1 0 .8 ±0. 1
C + 2 and C + 3 1 98 1 1 .6 ±0.2
Individuals:
number of branched units 1 98 1 8 .47
number of unbranched units 1 98 1 6 .77
biomass 1 982 1 080± 220
attached dead 1 982 176 ± 34
wood increments �C + 3 1 982 76.2± 1 6.0
Flo wering units:
C vegetative parts 1 980 48 .8 ±7 .9 1 982 44.3 ± 5 .9
C flowers 1 980 7 . 95 ± 1 .20 1 982 12 . 7 ±4.3
C + 1 1 980 40 .0 ±6.0 1 982 40.3 ±4 .5
C + 2 and C + 3 1 980 40 . 6 ± 6 . 1
C + 2 1 982 20 . 8 ± 2.7
attached dead 1 980 2 . 9 ± 1 . 2 1 982 0.6 1 ±0 .37
26) . This is much higher than Vasander 's ( 1 98 1 ) figures from the bog Laaviosuo (856 and 55 1 k g ·
ha· ' on high and low hummocks , respectively) , but , as will be seen later , there is instead much more Em
petrum on the Laaviosuo . Considerably higher values are reported from heaths, where nutrient conditions are more favourable . Tyler et al . ( 1 973)
A cta Phytogeogr. Suec. 74
report 9200 kg · ha· ' and Wallen ( 1 980) 5450-6690 kg · ha· ' , both from south Sweden . Mork ( 1 946) found on average 1 1 000 kg · ha·' in a Calluna
dominated mountain forest in Norway . Persson ( 1 980) reported 2870 kg · ha·' in a relatively open, 1 5-20 year-old pine stand dominated by Calluna.
Numerous reports from England and Scotland give values of Calluna biomass of up to 23 000 kg · ha·' on (usually) regularly burned heaths and moors but with considerable variation depending on growth phase (Robertson & Davies 1 965 , Bellamy & Holland 1 966, Kayll 1 966, Chapman 1 967 , BarclayEstrup 1 970, G . R . Miller & Miles 1 970, Gimingham 1 972, Chapman et al . 1 975 , G .R . Miller 1 979) and 4500-7900 kg · ha·' on blanket bogs (Allen 1 964, Gore & Olson 1 967 , Rawes & Welch 1 969, Forrest 1 97 1 , Forrest & Smith 1 975). It is concluded that there is a considerable variation in biomass weight of Calluna on different sites where it is the dominant species , the values from ombrotrophic bogs in Sweden and Finland being the lowest of them all .
Shoot production on the Skattlosberg Stormosse was 202-288 kg · ha· ' · year· ' . Of all available values only those from the Laaviosuo (Vasander 1 98 1 ) are lower ( 1 30-2 1 0 kg · ha· ' · year- ' ) . Forrest & Smith ( 1 975) report 7 1 0-2 1 90 kg · ha·' · year·' at Moor House . Scandinavian figures from mineral soils are 1 640 {Tyler et al . 1 973), 1 770 (Persson 1 980), 2870-32 1 0 (Wallen 1 980) and 2400-2600 (Mork 1 946) kg · ha- 1 • year· ' .
The shoot production:biomass ratio was 0. 1 5 on the Skattlosberg Stormosse. It is 0 .24 on the Laaviosuo (Vasander 1 98 1 ) and 0 .20-0.41 on unburned blanket bogs at Moor House (Forrest & Smith 1 975) . On a south Swedish heath the ratio was 0. 1 8 (Tyler et al . 1 973) and Mark ' s ( 1946) figures from a Norwegian mountain forest give an average of 0.22. In a central Swedish pine forest values from 0. 24 to 0. 30 were obtained (Persson 1 980) . In heaths on dune sand in south Sweden the ratio was as high as 0. 30-0.48 , evidently because of the very low mean shoot age caused by moving sand (Wall en 1 980) . On British heaths the ratio drops to less than 0 . 1 0 with increasing time after burning . The ratio is likely to be higher on bogs with rapid overgrowth by mosses than on other sites . My figure is therefore lower than expected.
Estimates of wood increment per area was complicated due to incomplete sampling . As mentioned,
Production and growth dynamics of vascular bog plants 33
the result ( 12 .9 kg · ha- ' · year- ' ) may be an underestimate because of too early sampling . About 5 OJo of the measured total production was wood increment . Data on wood increment in one- and twoyear-old stems are not available. Forrest & Smith ( 1 975) report wood production to be 3 % of total aboveground production (losses by burial taken into account) but with very considerable variation between sites .
Weight of current shoots per 'unit' was significantly higher in 1 98 1 than in 1 980 (p<0.001 ) . Possible significance in weight changes per 'unit' between 1 98 1 and 1 982 was not technically calculable.
The number of flowering shoots per area was considerably lower in 1 98 1 than in 1 980 (p<0.00 1 ) and also lower in 1 982 than in 1 98 1 (p<0.05) . Flowering was generally poor. The flowers constituted 1 3 %
of the shoot production in 1 980, only 2 OJo in 1 982. G . R . Miller ( 1 979) found that flowers amounted to 18 % of the total shoot production (range between years: 7-32 %) on a Scottish heath.
It has already been noted that the shoots were shorter in 1 982 than in 1 98 1 . It is therefore not surprising that shoot production per area was also lower in 1 982. The summer frosts that year caused only very limited damage to Calluna and new shoot formation after the frosts was not seen . Lindholm ( 1980) and Lindholm & Vasander ( 1 98 1 ) found severe damage and an increasing growth of short shoots following severe frosts in late spring, whereas Braid & Tervet ( 1 937) failed to induce frost damage to Calluna plants in a laboratory experiment . Lindholm & Vasander ( 1 98 1 ) obtained a production:biomass ratio of0. 1 7 in 1 978 , which was the year with frosts in June, but 0. 3 1 during 1 977, a more normal year . (Part of this difference may also be explained by differences in biomass per area in the samples from the two years , as there is probably not a linear correlation between production and biomass . )
Carex limosa
Carex limosa occurs in carpets and mud-bottoms . It is common in flarks but in the studied bog vegetation it is a sparse constituent . It occurred only in 4 out of 2 1 sample quadrats in Sjors 's ( 1 948) analyses of his Scheuchzeria - Rhynchospora alba - Carex li-
mosa - Sphagnum cuspidatum - Dusenii association . It did appear in a few squares during the counting of shoots in Cuspidatetum dusenietosum and C.
tenelletosum but not in sufficient quantities to make a meaningful sampling possible.
On the bog Laaviosuo C. limosa was one of the major plants in carpets and its aboveground biomass (and yearly production) was 1 27 kg · ha- ' (V asander 198 1 ) . Liedenpohja ( 1 98 1 ) arrived at 448 kg · ha-' in a poor fen and 298 and 322 kg · ha- 1 in two Scorpidium fens in south Finland.
Carex pauciflora
Carex pauciflora in Sweden is almost exclusively a fen plant but it can establish itself in areas where the influx of minerogeneous water is extremely small and irregular. As mentioned in the description of the sampling areas , C. pauciflora occurs in the area for non-destructive sampling, although sparsely. The specimens are small and without flowers . They occur mainly in lawns and on low hummocks, and the distribution of the species in the Special Area can be seen in detail on a map in Sjors ( 1 948 : map 14) .
The plants were counted in 1 98 1 and their number amounted to (0.65 ± 0. 1 7) · 1 06 per ha in lawns and (0 .39 ± 0. 1 5) · 106 per ha on hummocks . Their biomass can only slightly contribute to the total biomass of the bog and no sampling for biomass or production was made.
Liedenpohja ( 198 1 ) reports a biomass (and yearly production) amounting to 1 1 kg · ha-' in a poor fen and 29 kg · ha- 1 in a Sphagnum warnstorjii - rich fen in south Finland.
Drosera anglica
Material and methods
Drosera anglica by definition does not occur in hummock or lawn communities . Its occurrence in the sampled Cuspidatetum dusenietosum was also negligible and hardly quantifiable. It was collected in the C. tenelletosum only.
Flowering and non-flowering individuals were treated separately and 25 individuals of each category were collected . The non-flowering individuals
A cta Phytogeogr. Suec. 74
34 lngvar Backeus
were not fractioned but the flowering ones were fractioned into ( 1 ) flowers with stalk and (2) leaves , current rhizome and vegetative bud .
Overwintering , seemingly vegetative buds were also collected in the autumn of 1 980. They were all from individuals with fruit capsules, because only such individuals are detectable above the ground at that time of the year . It is possible that some of these buds were not purely vegetative but may also have contained initials for the next year 's inflorescence .
Results and discussion
The morphology and growth form of Drosera ang
lica are similar to those of D. rotundifolia, to which reference should be made for details .
Flowering was sparse. Only very few individuals were seen with flowers within the squares . The figures on their number per ha (Table 25) are therefore uncertain .
The flowering individuals were considerably heavier than those without flowers (p<0.00 1 ; Table 1 1 ) , thus indicating that the species develops flowers only under favourable conditions . Also the vegetative parts of the flowering individuals were heavier than those of the non-flowering ones .
Table 1 1 . Drosera anglica. Quantities in individuals ± 1 S .E . Weights in mg . Production in mg · year-1 • n = 25 . Harvest dates : 1 1 Aug. 1 980; 5 Aug . 1 98 1 ; 29 July 1 982 (non-flower . ) and 12 Aug . 1 982 (flower. ) .
Flo wering individuals:
leaves + C rhizome + vegetative bud
flowers + stalk
biomass = production
winter buds (September)
Non-flowering indi-
viduals:
biomass = production
Cusp. tenelletosum yearly overall
year means mean
1 980 26 .4 ± 2 . 2 3 1 .2 1 98 1 3 1 .0 ± 2.6 1 982 36.2 ± 2 . 6
1 980 1 2 . 83 ± 1 . 1 3 1 3 . 7 1 98 1 1 5 .7 ± 2.6 1 982 1 2 .48 ± 1 .44
1 980 39.2 ± 2 _ 8 44. 8 1 98 1 46.6 ± 3 . 6 1 982 48.6 ± 3 .2
1 980 1 1 .07 ± 1 .53
1 980 23.9 ± 2 . 1 20. 1 1 98 1 22. 8 1 ± 1 .78 1 982 1 3 . 57± 1 . 34
Acta Phytogeogr. Suec. 74
The weight of non-flowering individuals was much smaller in 1 982 than in previous years , which could be an effect of the cool summer . This result is, however, obscured by the fact that the flowering individuals did not show a corresponding decrease in weight .
The overwintering buds are formed during the latter part of the summer . They had already commenced their development at the harvest but were not separated as a special category. It is clear from the table that a considerable portion (ea . 25 OJo) of the leaf biomass is formed already during the previous year .
The figure on production ( = biomass) per ha (Table 26) clearly shows that D. anglica is only a minor contributor to the productivity of the bog. The figures are of the same magnitude as those given by Liedenpohja ( 1 98 1 ) from fens in south Finland.
Drosera rotundifolia
Material and methods
Drosera rotundifolia occurs on hummocks , in lawns and in the sampled Cuspidatetum tenelletosum. Individuals were collected on hummocks and in lawns .
As with D. anglica, flowering and non-flowering individuals were treated separately and 25 individuals of each category were collected . The nonflowering individuals were not fractioned , whereas the flowering individuals were fractioned into ( 1 ) flowers with stalk and (2) leaves, current rhizome ( = stem) and vegetative bud.
It is often difficult to separate the C and C + 1 generations on the rhizome, and this has caused some uncertainties in the clipping . The first leaves of the year die successively during the summer but have all been inc:luded in the biomass .
Results and discussion
The morphology of Drosera rotundifolia was described by Nitschke ( 1 860) . Its rhizome grows vertically upwards in the earlier part of the growing season, until it reaches the moss surface . Basal leaves are formed along the rhizome. At the surface its growth ceases and a rosette of normal leaves is formed . In late summer, when the withered plant is
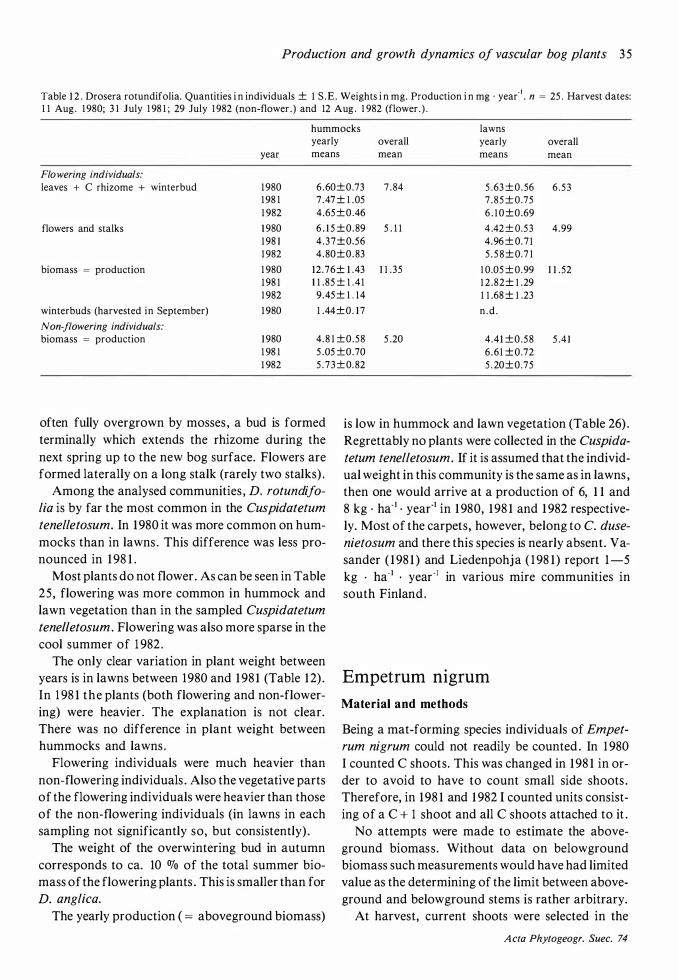
Production and growth dynamics of vascular bog plants 3 5
Table 1 2 . Drosera rotundifolia. Quantities i n individuals ± I S .E . Weights i n mg. Production i n mg · year· ' . n = 25 . Harvest dates: 1 1 Aug . 1 980; 3 1 July 1 98 1 ; 29 July 1 982 (non-flower . ) and 12 Aug . 1 982 (flower . ) .
hummocks lawns yearly overall yearly overall
year means mean means mean
Flo wering individuals:
leaves + C rhizome + winterbud 1 980 6 .60±0.73 7 .84 5 .63 ±0 .56 6 .53 1 98 1 7 .47 ± 1 .05 7 . 85 ± 0.75 1 982 4 .65±0 .46 6 . 1 0 ±0.69
flowers and stalks 1 980 6 . 1 5 ±0.89 5 . 1 1 4 .42 ± 0.53 4.99 1 98 1 4 .37±0.56 4.96 ± 0. 7 1 1 982 4 .80±0. 83 5 . 5 8 ± 0.7 1
biomass = production 1 980 12 .76± 1 .43 1 1 .35 1 0 .05 ± 0.99 1 1 . 52 1 98 1 1 1 .85 ± 1 .4 1 1 2 .82± 1 .29 1 982 9.45 ± 1 . 1 4 1 1 .68 ± 1 .23
winterbuds (harvested in September) 1 980 1 .44±0. 1 7 n . d .
Non-flowering individuals:
biomass = production 1 980 4. 8 1 ±0.58 5 .20 4 .41 ±0.58 5 .4 1 1 98 1 5 .05 ±0.70 6 .6 1 ± 0.72 1 982 5 . 7 3 ± 0. 82 5 . 20±0.75
often fully overgrown by mosses , a bud is formed terminally which extends the rhizome during the next spring up to the new bog surface. Flowers are formed laterally on a long stalk (rarely two stalks) .
Among the analysed communities , D. rotundijo
lia is by far the most common in the Cuspidatetum
tenelletosum. In 1 980 it was more common on hummocks than in lawns . This difference was less pronounced in 1 98 1 .
Most plants do not flower . As can be seen in Table 25 , flowering was more common in hummock and lawn vegetation than in the sampled Cuspidatetum
tenelletosum. Flowering was also more sparse in the cool summer of 1 982 .
The only clear variation in plant weight between years is in lawns between 1980 and 1 98 1 (Table 1 2) .
In 1 98 1 the plants (both flowering and non-flowering) were heavier . The explanation is not clear. There was no difference in plant weight between hummocks and lawns .
Flowering individuals were much heavier than non-flowering individuals . Also the vegetative parts of the flowering individuals were heavier than those of the non-flowering individuals (in lawns in each sampling not significantly so, but consistently) .
The weight of the overwintering bud in autumn corresponds to ea. 10 % of the total summer biomass of the flowering plants . This is smaller than for D. anglica.
The yearly production ( = aboveground biomass)
is low in hummock and lawn vegetation (Table 26) .
Regrettably no plants were collected in the Cuspida
tetum tenelletosum. If it is assumed that the individual weight in this community is the same as in lawns , then one would arrive at a production of 6, 1 1 and 8 kg · ha·1 • year·1 in 1 980, 1 98 1 and 1 982 respectively. Most of the carpets, however, belong to C. duse
nietosum and there this species is nearly absent. V asander ( 1 98 1 ) and Liedenpohja ( 1 98 1 ) report 1 -5
kg · ha· 1 • year· 1 in various mire communities in south Finland .
Empetrum nigrum
Material and methods
Being a mat-forming species individuals of Empet
rum nigrum could not readily be counted . In 1 980
I counted C shoots . This was changed in 1 98 1 in order to avoid to have to count small side shoots .
· Therefore, in 1 98 1 and 1 982 I counted units consisting of a C + 1 shoot and all C shoots attached to it .
No attempts were made to estimate the aboveground biomass . Without data on belowground biomass such measurements would have had limited value as the determining of the limit between aboveground and below ground stems is rather arbitrary.
At harvest, current shoots were selected in the
A cta Phytogeogr. Suec. 74
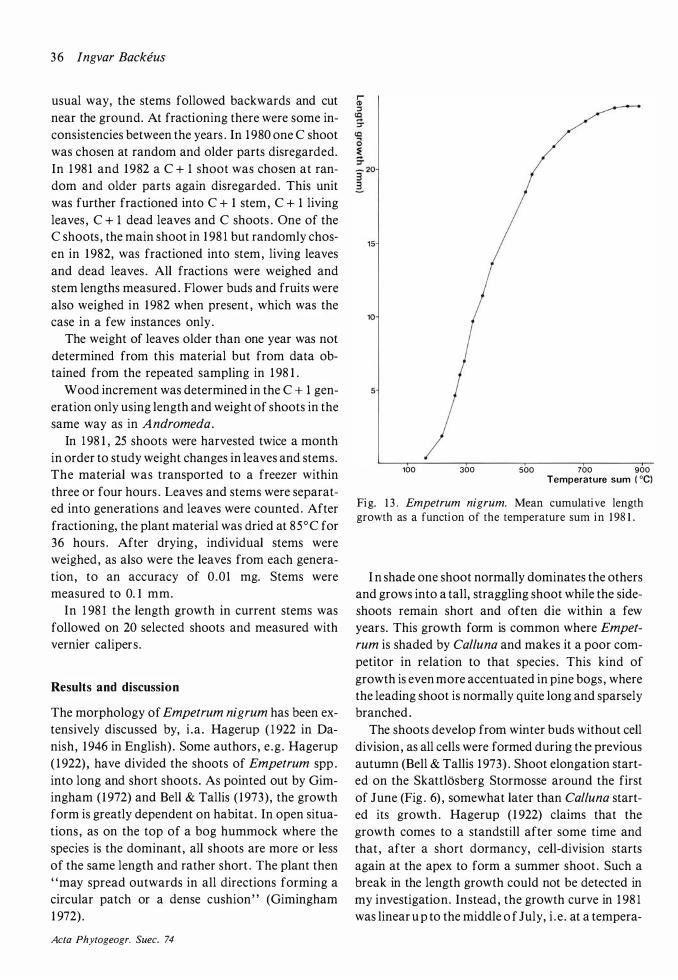
36 Ingvar Backeus
usual way, the stems followed backwards and cut near the ground. At fractioning there were some inconsistencies between the years . In 1 980 one C shoot was chosen at random and older parts disregarded. In 1 98 1 and 1 982 a C + 1 shoot was chosen at random and older parts again disregarded . This unit was further fractioned into C + 1 stem, C + 1 living leaves , C + 1 dead leaves and C shoots . One of the C shoots , the main shoot in 1 98 1 but randomly chosen in 1 982, was fractioned into stem, living leaves and dead leaves . All fractions were weighed and stem lengths measured . Flower buds and fruits were also weighed in 1 982 when present , which was the case in a few instances only .
The weight of leaves older than one year was not determined from this material but from data obtained from the repeated sampling in 1 98 1 .
Wood increment was determined in the C + 1 generation only using length and weight of shoots in the same way as in Andromeda.
In 1 98 1 , 25 shoots were harvested twice a month in order to study weight changes in leaves and stems. The material was transported to a freezer within three or four hours . Leaves and stems were separated into generations and leaves were counted . After fractioning, the plant material was dried at 85°C for 36 hours . After drying , individual stems were weighed, as also were the leaves from each generation, to an accuracy of 0 .01 mg. Stems were measured to 0. I mm.
In 1 98 1 the length growth in current stems was followed on 20 selected shoots and measured with vernier calipers .
Results and discussion
The morphology of Empetrum nigrum has been extensively discussed by, i .a . Hagerup ( 1 922 in Danish, 1 946 in English) . Some authors , e .g . Hagerup ( 1 922) , have divided the shoots of Empetrum spp . into long and short shoots. As pointed out by Gimingham ( 1 972) and Bell & Tallis ( 1 973) , the growth form is greatly dependent on habitat . In open situations , as on the top of a bog hummock where the species is the dominant , all shoots are more or less of the same length and rather short . The plant then "may spread outwards in all directions forming a circular patch or a dense cushion" (Gimingham 1 972) .
Acta Phytogeogr. Suec. 74
100 300 500 700 900 Temperature sum ( °C)
Fig. 1 3 . Empetrum nigrum. Mean cumulative length growth as a function of the temperature sum in 1 98 1 .
I n shade one shoot normally dominates the others and grows into a tall, straggling shoot while the sideshoots remain short and often die within a few years. This growth form is common where Empet
rum is shaded by Calluna and makes it a poor competitor in relation to that species . This kind of growth is even more accentuated in pine bogs , where the leading shoot is normally quite long and sparsely branched .
The shoots develop from winter buds without cell division , as all cells were formed during the previous autumn (Bell & Tallis 1 973) . Shoot elongation started on the Skattlosberg Stormosse around the first of June (Fig . 6) , somewhat later than Calluna started its growth . Hagerup ( 1 922) claims that the growth comes to a standstill after some time and that , after a short dormancy, cell-division starts again at the apex to form a summer shoot . Such a break in the length growth could not be detected in my investigation . Instead , the growth curve in 1 98 1 was linear u p to the middle o f July, i . e . at a tempera-
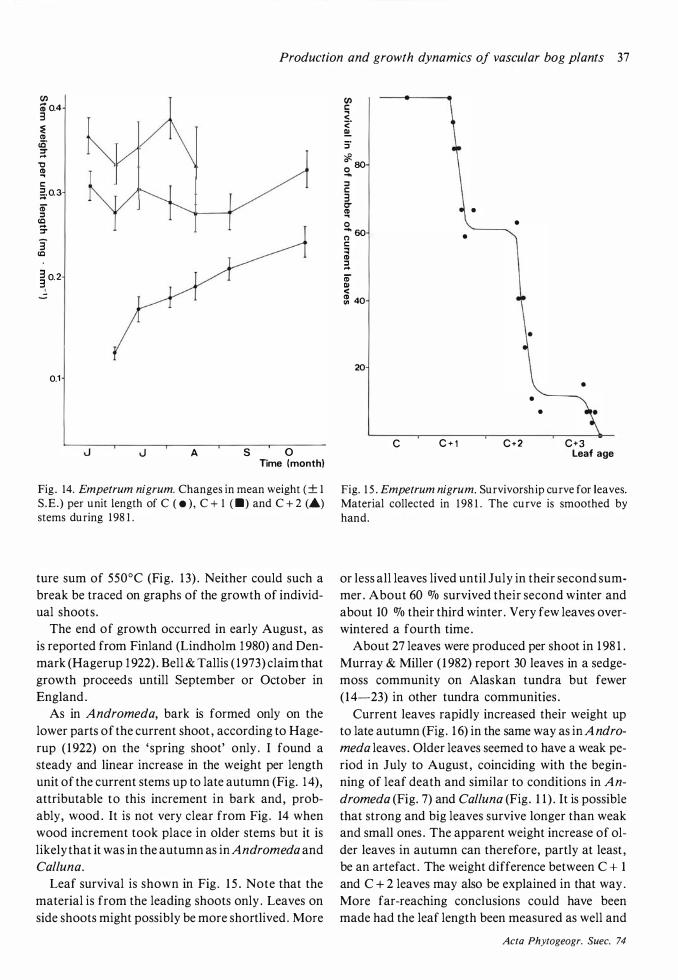
Production and growth dynamics of vascular bog plants 37
(J) � 0.4 3 � CD ce· ;:r
"0 � 1: �.0.3 CD" :I
cc ... :::r
3 cc
§� 0. 2
0.1
A s 0 Time (month)
Fig . 14. Empetrum nigrum. Changes in mean weight (± 1 S .E.) per unit length of C ( e ), C + 1 (.) and C + 2 (_.) stems during 1 98 1 .
ture sum of 550°C (Fig. 1 3) . Neither could such a break be traced on graphs of the growth of individual shoots .
The end of growth occurred in early August, as is reported from Finland (Lindholm 1 980) and Denmark (Hagerup 1 922) . Bell & Tallis ( 1 973) claim that growth proceeds untill September or October in England .
As in Andromeda, bark is formed only on the lower parts of the current shoot , according to Hagerup ( 1 922) on the ' spring shoot' only . I found a steady and linear increase in the weight per length unit of the current stems up to late autumn (Fig. 1 4) , attributable to this increment in bark and, probably, wood . It is not very clear from Fig . 14 when wood increment took place in older stems but it is likely that it was in the autumn as in Andromeda and Calluna.
Leaf survival is shown in Fig . 1 5 . Note that the material is from the leading shoots only . Leaves on side shoots might possibly be more shortlived . More
(J) c < c:· � :r � � 80 ....
:I c 3 CT � •
0 • � 60 •
� CD 3. iD Ill < g: 40
20 •
• •
c C + 1 C + 2 C + 3 Leaf age
Fig. 1 5 . Empetrum nigrum. Survivorship curve for leaves. Material collected in 1 98 1 . The curve is smoothed by hand.
or less all leaves lived until July in their second summer . About 60 OJo survived their second winter and about 10 OJo their third winter . Very few leaves overwintered a fourth time .
About 27 leaves were produced per shoot in 1 98 1 . Murray & Miller ( 1 982) report 30 leaves in a sedgemoss community on Alaskan tundra but fewer ( 1 4-23) in other tundra communities .
Current leaves rapidly increased their weight up to late autumn (Fig . 1 6) in the same way as in A ndro
meda leaves . Older leaves seemed to have a weak period in July to August , coinciding with the beginning of leaf death and similar to conditions in An
dromeda (Fig. 7) and Calluna (Fig . 1 1 ) . It is possible that strong and big leaves survive longer than weak and small ones . The apparent weight increase of older leaves in autumn can therefore, partly at least , be an artefact . The weight difference between C + 1 and C + 2 leaves may also be explained in that way . More far-reaching conclusions could have been made had the leaf length been measured as well and
Acta Phytogeogr. Suec. 74
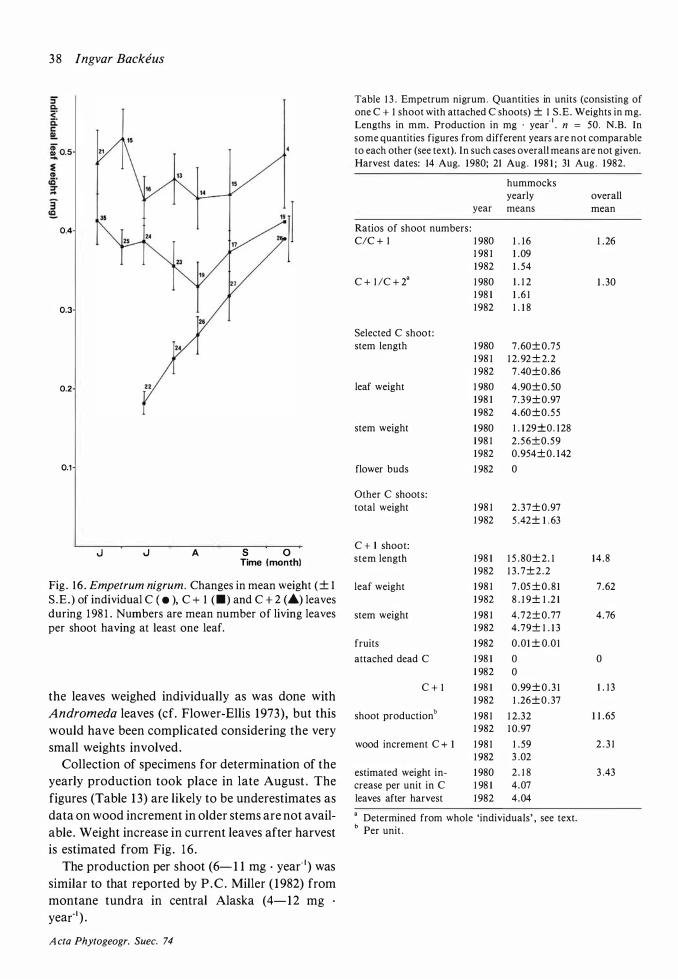
3 8 lngvar Backeus
0.4
0.3
0.2 22
0.1
J J A s 0 Time (month)
Fig . 16 . Empetrum nigrum. Changes in mean weight (± 1 S .E . ) of individual C ( • ), C + 1 <•> and C + 2 (A) leaves during 1 98 1 . Numbers are mean number of living leaves per shoot having at least one leaf.
the leaves weighed individually as was done with Andromeda leaves (cf. Flower-Ellis 1973), but this would have been complicated considering the very small weights involved.
Collection of specimens for determination of the yearly production took place in late August . The figures (Table 1 3) are likely to be underestimates as data on wood increment in older stems are not available . Weight increase in current leaves after harvest is estimated from Fig . 1 6 .
The production per shoot (6- 1 1 mg · year- ' ) was similar to that reported by P .C . Miller ( 1 982) from montane tundra in central Alaska (4-1 2 mg ·
year· ' ) .
A cta Phytogeogr. Suec. 74
Table 1 3 . Empetrum nigrum . Quantities in units (consisting of one C + 1 shoot with attached C shoots) ± 1 S .E . Weights in mg. Lengths in mm. Production in mg · year- 1 • n = 50. N.B. In some quantities figures from different years are not comparable to each other (see text). In such cases overall means are not given. Harvest dates: 14 Aug. 1 980; 21 Aug . 1 98 1 ; 31 Aug . 1 982.
hummocks yearly overall
year means mean
Ratios of shoot numbers : CIC + 1 1 980 1 . 1 6 1 .26
1 98 1 1 .09 1 982 1 . 54
C + 1 /C + 2a 1 980 1 . 1 2 1 . 30 1 98 1 1 .6 1 1 982 1 . 1 8
Selected C shoot: stem length 1 980 7 .60± 0.75
1 98 1 1 2. 92 ± 2.2 1 982 7 .40±0.86
leaf weight 1 980 4.90± 0.50 1 98 1 7 .39± 0.97 1 982 4.60 ±0.55
stem weight 1 980 1 . 1 29±0. 1 28 1 98 1 2 .56±0.59 1 982 0.954±0. 1 42
flower buds 1 982 0
Other C shoots: total weight 1 98 1 2 .37± 0.97
1 982 5 .42± 1 . 63
C + I shoot: stem length 1 98 1 1 5 . 80± 2. 1 14 .8
1 982 1 3 . 7±2 .2
leaf weight 1 98 1 7 .05 ± 0 . 8 1 7 .62 1 982 8 . 1 9± 1 .2 1
stem weight 1 98 1 4 .72± 0.77 4 .76 1 982 4.79± 1 . 1 3
fruits 1 982 0 .01 ± 0.0 1
attached dead C 1 98 1 0 0 1 982 0
C + 1 1 98 1 0.99 ± 0 . 3 1 1 . 1 3 1 982 1 .26± 0 . 37
shoot production b 1 98 1 1 2 .32 1 1 .65 1 982 1 0 .97
wood increment C + 1 1 98 1 1 . 59 2 . 3 1 1 982 3 .02
estimated weight in- 1 980 2 . 1 8 3 .43 crease per unit in C 1 98 1 4 .07 leaves after harvest 1 982 4 .04
a Determined from whole 'individuals' , see text. b Per unit .
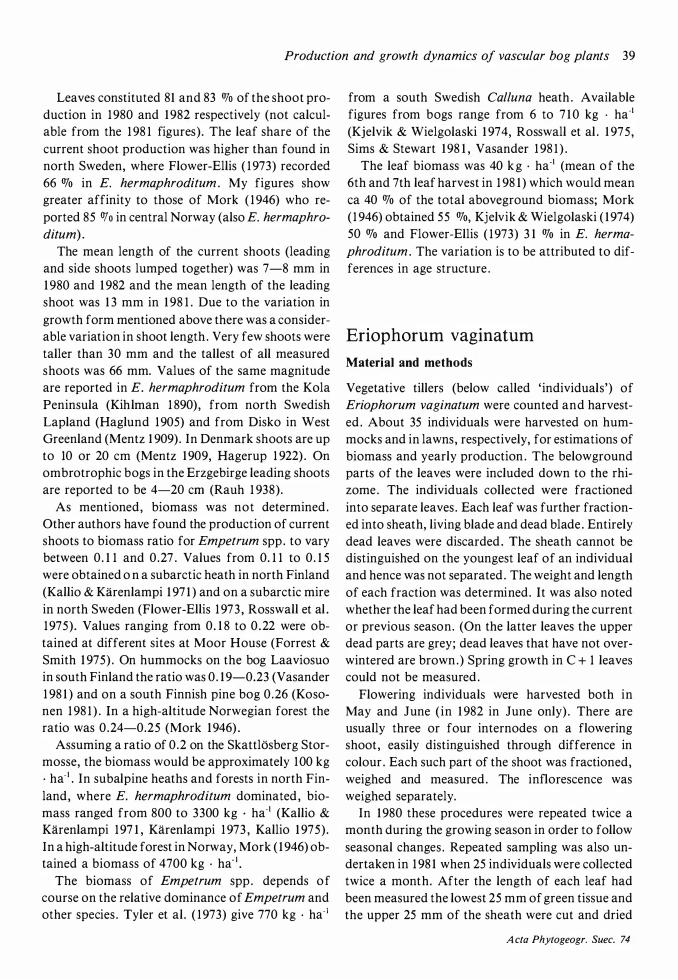
Production and growth dynamics of vascular bog plants 39
Leaves constituted 81 and 83 o/o of the shoot production in 1 980 and 1 982 respectively (not calculable from the 1 98 1 figures) . The leaf share of the current shoot production was higher than found in north Sweden, where Flower-Ellis ( 1 973) recorded 66 % in E. hermaphroditum . My figures show greater affinity to those of Mork ( 1 946) who reported 85 o/o in central Norway (also E. hermaphro
ditum) .
The mean length of the current shoots (leading and side shoots lumped together) was 7-8 mm in 1 980 and 1 982 and the mean length of the leading shoot was 1 3 mm in 1 98 1 . Due to the variation in growth form mentioned above there was a considerable variation in shoot length . Very few shoots were taller than 30 mm and the tallest of all measured shoots was 66 mm. Values of the same magnitude are reported in E. hermaphroditum from the Kola Peninsula (Kihlman 1 890) , from north Swedish Lapland (Haglund 1 905) and from Disko in West Greenland (Mentz 1 909) . In Denmark shoots are up to 10 or 20 cm (Mentz 1 909, Hagerup 1 922) . On ombrotrophic bogs in the Erzgebirge leading shoots are reported to be 4-20 cm (Rauh 1 938) .
As mentioned, biomass was not determined . Other authors have found the production of current shoots to biomass ratio for Empetrum spp . to vary between 0 . 1 1 and 0 .27 . Values from 0. 1 1 to 0 . 1 5 were obtained o n a subarctic heath in north Finland (Kallio & Karenlampi 1 97 1 ) and on a subarctic mire in north Sweden (Flower-Ellis 1 973 , Rosswall et al . 1 975) . Values ranging from 0. 1 8 to 0 .22 were obtained at different sites at Moor House (Forrest & Smith 1 975) . On hummocks on the bog Laaviosuo in south Finland the ratio was 0 . 1 9-0.23 (Vasander 1 98 1 ) and on a south Finnish pine bog 0 .26 (Kosonen 1 98 1 ) . In a high-altitude Norwegian forest the ratio was 0 .24-0.25 (Mork 1 946) .
Assuming a ratio of 0 .2 on the SkattlOsberg Stormosse, the biomass would be approximately 100 kg · ha-1 • In subalpine heaths and forests in north Finland, where E. hermaphroditum dominated , biomass ranged from 800 to 3300 kg · ha-1 (Kallio & Karenlampi 1 97 1 , Karenlampi 1 973 , Kallio 1 975) . In a high-altitude forest in Norway, Mork ( 1 946) obtained a biomass of 4700 kg · ha· 1 •
The biomass of Empetrum spp . depends of course on the relative dominance of Empetrum and other species . Tyler et al. ( 1 973) give 770 kg · ha· 1
from a south Swedish Calluna heath . Available figures from bogs range from 6 to 7 1 0 kg · ha·1 (Kjelvik & Wielgolaski 1 974, Rosswall et al . 1 975 , Sims & Stewart 1 98 1 , Vasander 1 98 1 ) .
The leaf biomass was 40 k g · ha·1 (mean o f the 6th and 7th leaf harvest in 1 98 1 ) which would mean ea 40 % of the total aboveground biomass; Mork (1 946) obtained 55 %, Kjelvik & Wielgolaski ( 1 974) 50 % and Flower-Ellis ( 1 973) 3 1 % in E. herma
phroditum . The variation is to be attributed to differences in age structure .
Eriophorum vaginatum
Material and methods
Vegetative tillers (below called ' individuals') of Eriophorum vaginatum were counted and harvested . About 35 individuals were harvested on hummocks and in lawns , respectively, for estimations of biomass and yearly production . The belowground parts of the leaves were included down to the rhizome . The individuals collected were fractioned into separate leaves . Each leaf was further fractioned into sheath, living blade and dead blade . Entirely dead leaves were discarded . The sheath cannot be distinguished on the youngest leaf of an individual and hence was not separated . The weight and length of each fraction was determined. It was also noted whether the leaf had been formed during the current or previous season. (On the latter leaves the upper dead parts are grey; dead leaves that have not overwintered are brown .) Spring growth in C + 1 leaves could not be measured .
Flowering individuals were harvested both in May and June ( in 1 982 in June only) . There are usually three or four internodes on a flowering shoot , easily distinguished through difference in colour . Each such part of the shoot was fractioned, weighed and measured . The inflorescence was weighed separately.
In 1 980 these procedures were repeated twice a month during the growing season in order to follow seasonal changes . Repeated sampling was also undertaken in 1 98 1 when 25 individuals were collected twice a month. After the length of each leaf had been measured the lowest 25 mm of green tissue and the upper 25 mm of the sheath were cut and dried
A cta Phytogeogr. Suec. 74
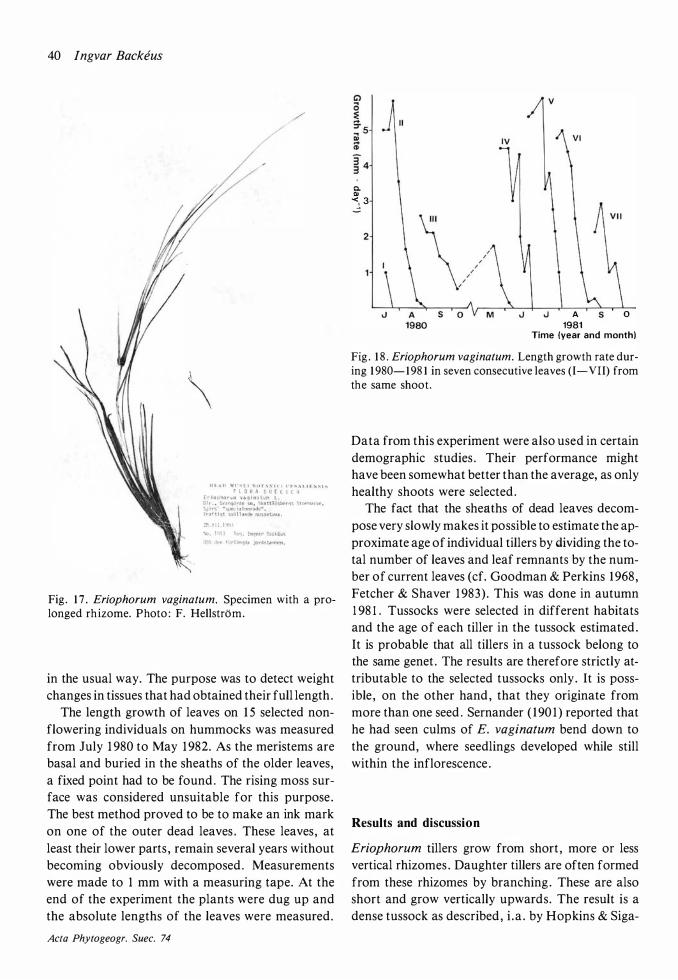
40 Ingvar Backeus
\
?B . \1 l l . l '�U
Fig . 1 7 . Eriophorum vaginatum. Specimen with a prolonged rhizome. Photo : F. Hellstrom.
in the usual way. The purpose was to detect weight changes in tissues that had obtained their full length .
The length growth of leaves on 1 5 selected nonflowering individuals on hummocks was measured from July 1 980 to May 1 982. As the meristems are basal and buried in the sheaths of the older leaves, a fixed point had to be found . The rising moss surface was considered unsuitable for this purpose . The best method proved to be to make an ink mark on one of the outer dead leaves . These leaves , at least their lower parts , remain several years without becoming obviously decomposed . Measurements were made to 1 mm with a measuring tape. At the end of the experiment the plants were dug up and the absolute lengths of the leaves were measured .
Acta Phytogeogr. Suec. 74
c. Ql <, 3
2
A 0 1981
Time (year and month)
Fig . 1 8 . Eriophorum vaginatum. Length growth rate during 1 980- 1 98 1 in seven consecutive leaves (I-VII) from the same shoot.
Data from this experiment were also used in certain demographic studies . Their performance might have been somewhat better than the average, as only healthy shoots were selected .
The fact that the sheaths of dead leaves decompose very slowly makes it possible to estimate the approximate age of individual tillers by dividing the total number of leaves and leaf remnants by the number of current leaves (cf. Goodman & Perkins 1 968 , Fetcher & Shaver 1 983) . This was done in autumn 1 98 1 . Tussocks were selected in different habitats and the age of each tiller in the tussock estimated . It is probable that all tillers in a tussock belong to the same genet . The results are therefore strictly attributable to the selected tussocks only . It is possible , on the other hand , that they originate from more than one seed . Sernander ( 1 90 1 ) reported that he had seen culms of E. vaginatum bend down to the ground, where seedlings developed while still within the inflorescence .
Results and discussion
Eriophorum tillers grow from short , more or less vertical rhizomes . Daughter tillers are often formed from these rhizomes by branching . These are also short and grow vertically upwards. The result is a dense tussock as described , i . a . by Hopkins & Siga-
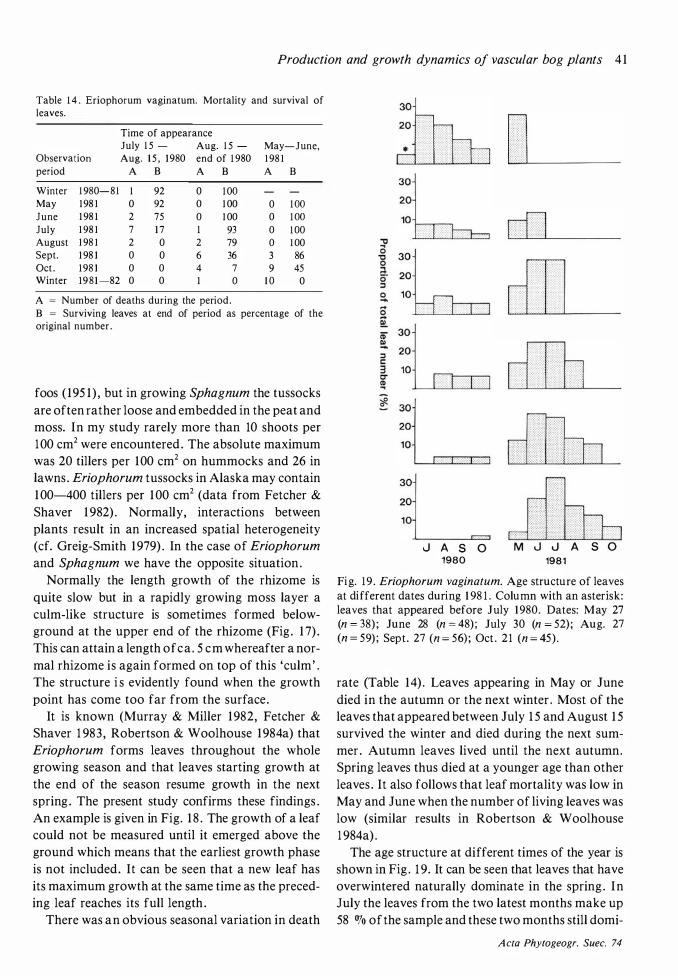
Production and growth dynamics of vascular bog plants 4 1
Table I 4 . Eriophorum vaginatum. Mortality and survival of leaves.
Time of appearance July I 5 - Aug. I 5 - May-June,
Observation Aug. 1 5 , 1 980 end of I 980 1 98 1 period A B A B A B
Winter I 980-8I I 92 0 l OO May 1 98 1 0 92 0 1 00 0 l OO June 1 98 1 2 75 0 1 00 0 l OO July 1 98 1 7 I 7 I 93 0 I OO August 1 98 1 2 0 2 79 0 1 00 Sept. 1 98 1 0 0 6 36 3 86 Oct . 1 98 1 0 0 4 7 9 45 Winter 198 1 -82 0 0 1 0 1 0 0
A = Number of deaths during the period. B = Surviving leaves at end of period as percentage of the original number .
foos ( 195 1 ) , but in growing Sphagnum the tussocks are often rather loose and embedded in the peat and moss. In my study rarely more than 10 shoots per 1 00 cm2 were encountered . The absolute maximum was 20 tillers per 100 cm2 on hummocks and 26 in lawns . Eriophorum tussocks in Alaska may contain 1 00-400 tillers per 1 00 cm2 (data from Fetcher & Shaver 1 982) . Normally, interactions between plants result in an increased spatial heterogeneity (cf. Greig-Smith 1 979) . In the case of Eriophorum
and Sphagnum we have the opposite situation . Normally the length growth of the rhizome is
quite slow but in a rapidly growing moss layer a culm-like structure is sometimes formed belowground at the upper end of the rhizome (Fig . 1 7) . This can attain a length of ea . 5 cm whereafter a normal rhizome is again formed on top of this 'culm' . The structure i s evidently found when the growth point has come too far from the surface .
It is known (Murray & Miller 1 982, Fetcher & Shaver 1 983 , Robertson & Woolhouse 1 984a) that Eriophorum forms leaves throughout the whole growing season and that leaves starting growth at the end of the season resume growth in the next spring . The present study confirms these findings . An example is given in Fig. 1 8 . The growth of a leaf could not be measured until it emerged above the ground which means that the earliest growth phase is not included. It can be seen that a new leaf has its maximum growth at the same time as the preceding leaf reaches its full length .
There was an obvious seasonal variation in death
30
J A S 0 M J u A S 0 1980 1981
Fig. 19 . Eriophorum vaginatum. Age structure of leaves at different dates during 1 98 1 . Column with an asterisk: leaves that appeared before J uly 1 980. Dates: May 27 (n = 38) ; June 28 (n = 48) ; July 30 (n = 52) ; Aug. 27 (n = 59) ; Sept. 27 (n = 56) ; Oct . 21 (n = 45) .
rate {Table 14) . Leaves appearing in May or June died in the autumn or the next winter . Most of the leaves that appeared between July 1 5 and August 1 5 survived the winter and died during the next summer . Autumn leaves lived until the next autumn. Spring leaves thus died at a younger age than other leaves . It also follows that leaf mortality was low in May and June when the number of living leaves was low (similar results in Robertson & Woolhouse 1 984a) .
The age structure at different times of the year is shown in Fig . 1 9. It can be seen that leaves that have overwintered naturally dominate in the spring. I n July the leaves from the two latest months make up 58 OJo of the sample and these two months still domi-
A cta Phytogeogr. Suec. 74
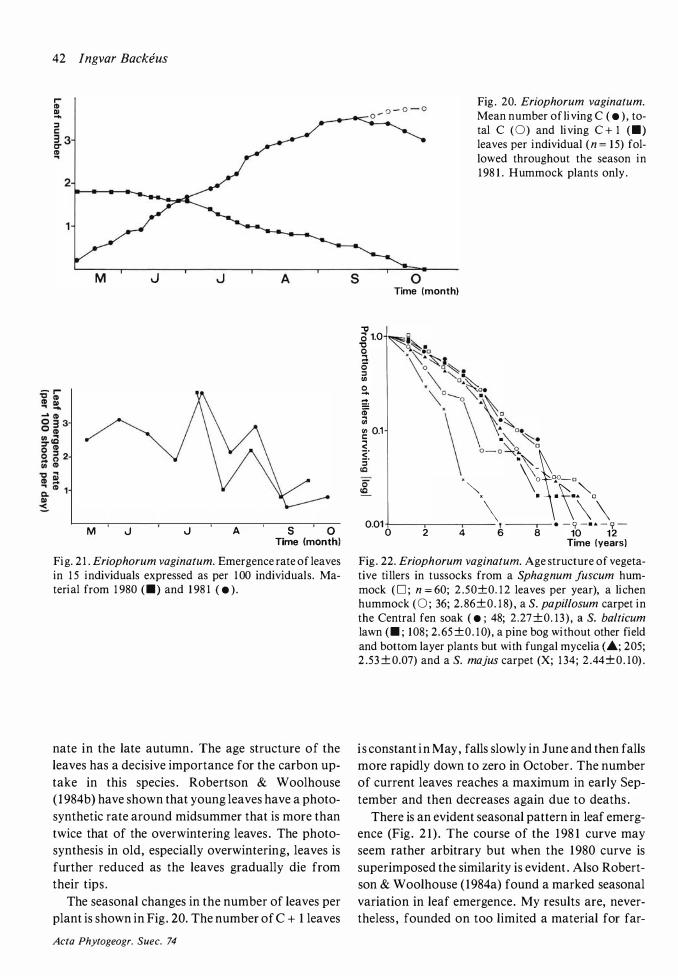
42 Ingvar Backf!us
M J
M J J A
A
s 0 Time (month)
Fig. 21 . Eriophorum vaginatum. Emergence rate of leaves in 1 5 individuals expressed as per 1 00 individuals. Material from 1 980 <•> and 1 98 1 ( • ) .
nate in the late autumn. The age structure of the leaves has a decisive importance for the carbon uptake in this species . Robertson & Woolhouse ( 1 984b) have shown that young leaves have a photosynthetic rate around midsummer that is more than twice that of the overwintering leaves . The photosynthesis in old, especially overwintering, leaves is further reduced as the leaves gradually die from their tips .
The seasonal changes in the number of leaves per plant is shown in Fig . 20. The number of C + 1 leaves
Acta Phytogeogr. Suec. 74
s
Fig . 20. Eriophorum vaginatum. Mean number of living C ( • ) , total c ( 0 ) and living c + 1 c•> leaves per individual ( n = 1 5) followed throughout the season in 1 98 1 . Hummock plants only .
0 Time (month)
"'tt a 1.o ��� "8 "'-.'o.:�_:o a. x\:'\'"�1 g 0\��-1./l 0� i ·\:<'\:�" � 0.1 \\ :�-�� ;c· o - o �.. � :;- �� ; x \� �0-0
c "\ • ·�\\ 0.01 f • - 9 -u - rr -0 2 4 6 8 10 1 2 Time (years)
Fig . 22. Eriophorum vagina turn. Age structure of vegetative tillers in tussocks from a Sphagnum fuscum hummock ( D ; n = 60; 2 .50±0. 1 2 leaves per year), a lichen hummock ( 0 ; 36; 2. 86±0. 1 8) , a S. papillosum carpet in the Central fen soak ( • ; 48; 2.27 ±0. 13 ) , a S. balticum lawn c• ; 108; 2. 65 ±0 . 1 0) , a pine bog without other field and bottom layer plants but with fungal mycelia c•; 205; 2.53 ± 0.07) and a S. majus carpet (X; 1 34 ; 2.44±0. 10) .
i s constant i n May, falls slowly in June and then falls more rapidly down to zero in October . The number of current leaves reaches a maximum in early September and then decreases again due to deaths .
There is an evident seasonal pattern in leaf emergence (Fig . 2 1 ) . The course of the 1 98 1 curve may seem rather arbitrary but when the 1 980 curve is superimposed the similarity is evident . Also Robertson & Woolhouse ( 1984a) found a marked seasonal variation in leaf emergence. My results are, nevertheless , founded on too limited a material for far-
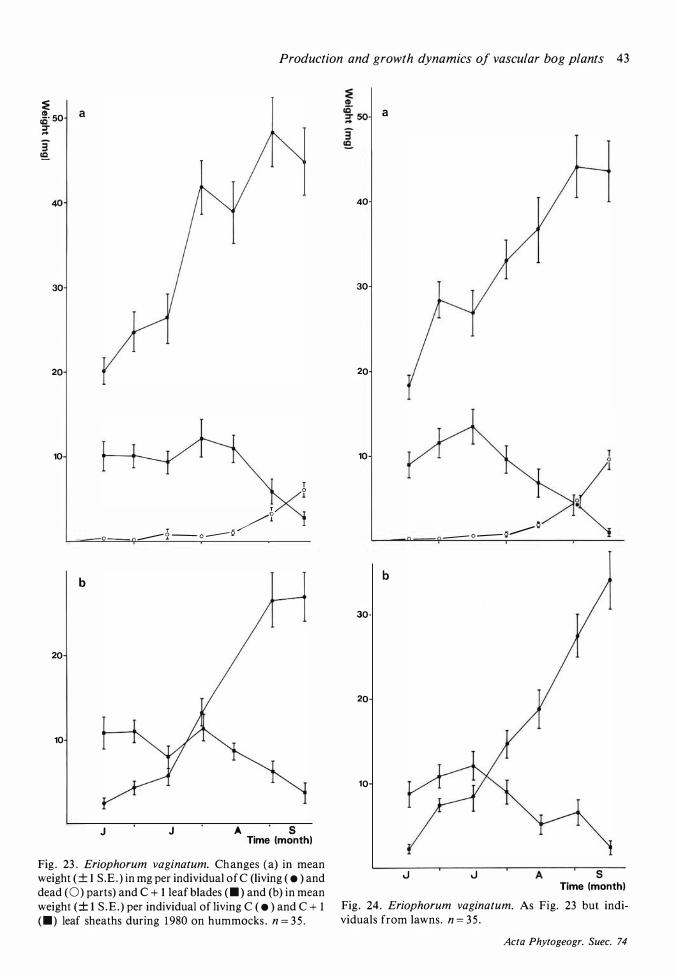
Production and growth dynamics of vascular bog plants 43
:\!! �· 50 :::r ...
40
30
20
10
20
10
a
b
J
-- 2 - o -Q /�
J A S Time (month)
Fig . 23 . Eriophorum vaginatum. Changes (a) in mean weight ( ± 1 S.E . ) in mg per individual of C (living ( • ) and dead (0) parts) and c + 1 leaf blades c • ) and (b) in mean weight (± 1 S .E . ) per individual of living C ( • ) and C + 1 c•) leaf sheaths during 1 980 on hummocks . n = 35 .
a
40
30
20
10
b
30
20
10
J
0 --- ---- 0 ---- �---- -
J A
<
s Time (month)
Fig. 24. Eriophorum vaginatum. As Fig. 23 but individuals from lawns. n = 35 .
Acta Phytogeogr. Suec. 74
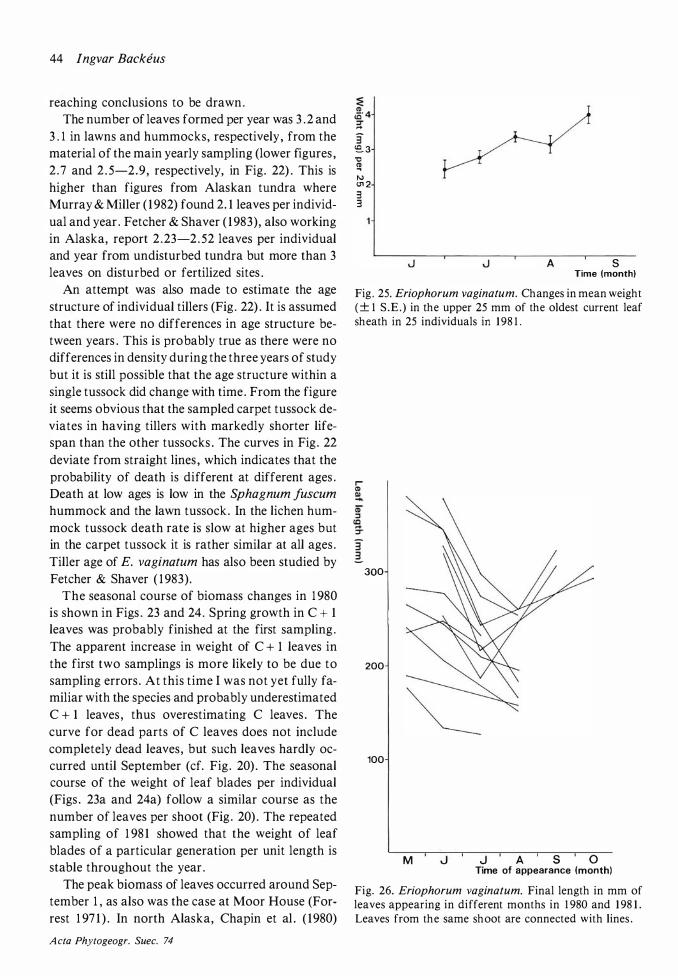
44 lngvar Backeus
reaching conclusions to be drawn . The number of leaves formed per year was 3 . 2 and
3 . 1 in lawns and hummocks, respectively , from the material of the main yearly sampling (lower figures , 2 . 7 and 2 . 5-2.9 , respectively, in Fig . 22) . This is higher than figures from Alaskan tundra where Murray & Miller ( 1 982) found 2. 1 leaves per individual and year . Fetcher & Shaver ( 1 983) , also working in Alaska, report 2 .23-2 . 52 leaves per individual and year from undisturbed tundra but more than 3 leaves on disturbed or fertilized sites .
An attempt was also made to estimate the age structure of individual tillers (Fig . 22) . It is assumed that there were no differences in age structure between years . This is probably true as there were no differences in density during the three years of study but it is still possible that the age structure within a single tussock did change with time . From the figure it seems obvious that the sampled carpet tussock deviates in having tillers with markedly shorter lifespan than the other tussocks . The curves in Fig . 22 deviate from straight lines , which indicates that the probability of death is different at different ages . Death at low ages is low in the Sphagnum fuscum
hummock and the lawn tussock . In the lichen hummock tussock death rate is slow at higher ages but in the carpet tussock it is rather similar at all ages . Tiller age of E. vaginatum has also been studied by Fetcher & Shaver ( 1 983) .
The seasonal course of biomass changes in 1 980 is shown in Figs . 23 and 24 . Spring growth in C + 1 leaves was probably finished at the first sampling . The apparent increase in weight of C + 1 leaves in the first two samplings is more likely to be due to sampling errors . At this time I was not yet fully familiar with the species and probably underestimated C + 1 leaves , thus overestimating C leaves . The curve for dead parts of C leaves does not include completely dead leaves , but such leaves hardly occurred until September (cf. Fig . 20) . The seasonal course of the weight of leaf blades per individual (Figs . 23a and 24a) follow a similar course as the number of leaves per shoot (Fig . 20) . The repeated sampling of 1 98 1 showed that the weight of leaf blades of a particular generation per unit length is stable throughout the year .
The peak biomass of leaves occurred around September 1 , as also was the case at Moor House (Forrest 1 97 1 ) . In north Alaska, Chapin et al . ( 1980)
A cta Phytogeogr. Suec. 74
3 <E- 3 "C � N <J1 2 3 3
A S Time (month)
Fig . 25. Eriophorum vaginatum. Changes in mean weight (± 1 S .E . ) in the upper 25 mm of the oldest current leaf sheath in 25 individuals in 1 98 1 .
3 3
300
200
100
M J A S 0 Time of appearance (month)
Fig. 26. Eriophorum vaginatum. Final length in mm of leaves appearing in different months in 1 980 and 1 98 1 . Leaves from the same shoot are connected with lines .
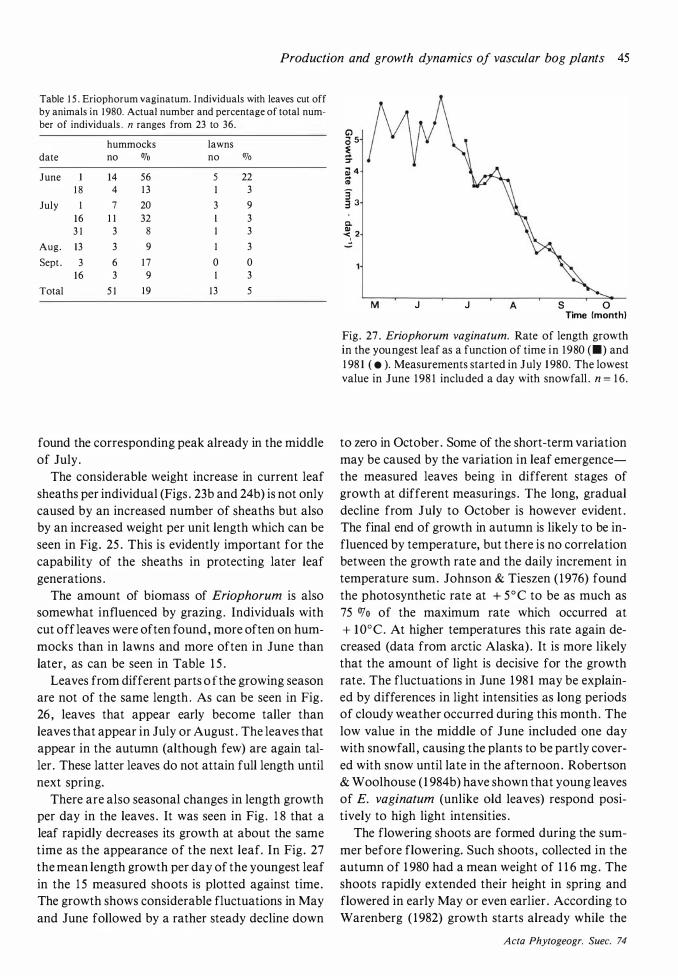
Production and growth dynamics of vascular bog plants 45
Table 1 5 . Eriophorum vaginatum. Individuals with leaves cut off by animals in 1 980. Actual number and percentage of total num-ber of individuals . n ranges from 23 to 36.
hummocks lawns date no OJo no OJo June I 14 56 5 22
1 8 4 1 3 1 3
July I 7 20 3 9 1 6 1 1 32 3 3 1 3 8 1 3
Aug. 13 3 9 1 3
Sept . 3 6 1 7 0 0 1 6 3 9 3
Total 5 1 19 13 5
found the corresponding peak already in the middle of July .
The considerable weight increase in current leaf sheaths per individual (Figs . 23b and 24b) is not only caused by an increased number of sheaths but also by an increased weight per unit length which can be seen in Fig . 25 . This is evidently important for the capability of the sheaths in protecting later leaf generations .
The amount of biomass of Eriophorum is also somewhat influenced by grazing . Individuals with cut off leaves were often found , more often on hummocks than in lawns and more often in June than later, as can be seen in Table 1 5 .
Leaves from different parts o f the growing season are not of the same length . As can be seen in Fig . 26 , leaves that appear early become taller than leaves that appear in July or August . The leaves that appear in the autumn (although few) are again taller . These latter leaves do not attain full length until next spring.
There are also seasonal changes in length growth per day in the leaves . It was seen in Fig . 1 8 that a leaf rapidly decreases its growth at about the same time as the appearance of the next leaf. In Fig . 27 the mean length growth per day of the youngest leaf in the 1 5 measured shoots is plotted against time. The growth shows considerable fluctuations in May and June followed by a rather steady decline down
G) a s ! J
� 4 CD
�3 c.. � 2
M J J A s 0 Time (month)
Fig. 27 . Eriophorum vaginatum. Rate of length growth in the youngest leaf as a function of time in 1980 c•) and 1 98 1 ( • ). Measurements started in July 1 980. The lowest value in June 1 98 1 included a day with snowfall . n = 1 6 .
to zero in October . Some of the short-term variation may be caused by the variation in leaf emergencethe measured leaves being in different stages of growth at different measurings . The long, gradual decline from July to October is however evident . The final end of growth in autumn is likely to be influenced by temperature, but there is no correlation between the growth rate and the daily increment in temperature sum. Johnson & Tieszen ( 1 976) found the photosynthetic rate at + 5 ° C to be as much as 75 OJo of the maximum rate which occurred at + 1 0°C . At higher temperatures this rate again decreased (data from arctic Alaska) . It is more likely that the amount of light is decisive for the growth rate. The fluctuations in June 1 98 1 may be explained by differences in light intensities as long periods of cloudy weather occurred during this month . The low value in the middle of June included one day with snowfall , causing the plants to be partly covered with snow until late in the afternoon . Robertson & Woolhouse ( 1 984b) have shown that young leaves of E. vaginatum (unlike old leaves) respond positively to high light intensities .
The flowering shoots are formed during the summer before flowering. Such shoots , collected in the autumn of 1 980 had a mean weight of 1 1 6 mg . The shoots rapidly extended their height in spring and flowered in early May or even earlier . According to Warenberg ( 1 982) growth starts already while the
A cta Phytogeogr. Suec. 74

46 lngvar Backeus
Table 1 6a . Eriophorum vaginatum, non-flowering individuals. Quantities in individuals ± 1 S .E . Weights in mg . Lengths in mm. Production in mg · yea{1 • n = 35. Harvest dates: 3 Sept . 1 980; 5 Sept . 1 98 1 : 8 Sept . 1 982.
hummocks lawns yearly overall yearly overall
year means mean means mean
leaf number: c 1 980 3 .03 ±0 . 1 5 3 .07 ±0.08 3 .28±0. 1 5 3 .23 ±0.08
1 98 1 2 . 89±0. 1 4 3 .27 ±0. 1 3 1 982 3 .23 ±0. 1 6 3 . 1 7 ± 0 . 1 6
C + 1 1 980 0.49±0. 1 0 0.49±0.06 0 . 5 3 ±0.09 0.4 1 ±0.05 1 98 1 0 .4 1 ±0 . 1 0 0. 1 9± 0.07 1 982 0 .54±0.09 0 . 5 1 ± 0. 1 0
leaf length: C blades, living parts 1 980 427 ± 25 4 1 0 .9± 1 5 .2 357 ± 2 1 344. 1 ± 1 1 . 1
1 98 1 370± 24 344± 1 7 1 982 437 ± 29 3 3 1 ± 20
C blades, dead parts 1 980 32. 1 ± 5 .5 42 .4 ± 3 . 8 5 0 . 9 ± 7 . 1 6 1 .2 ±4.6 1 98 1 59 .3 ± 7 . 3 8 1 .7 ± 8 . 3 1 982 3 5 .2 ± 5 .9 50. 1 ±7 .4
C + 1 blades, living parts 1 980 50 .5 ± 1 2 . 5 47 . 8 ± 7 .2 28.9 ± 7 . 6 22.4 ± 3 .6 1 98 1 44 .0 ± 1 1 . 8 1 0. 1 ± 3 .7 1 982 49 . 3 ± 1 3 .4 28.7 ± 6 . 5
leaf weight: C, living parts" 1 980 76.7 ± 7 . 3 75 . 1 ± 3 . 8 7 1 .6 ± 6 . 0 7 1 .8 ± 3 . 4
1 98 1 69. 5 ±6.2 72 .0 ± 5 . 6 1 982 79.3 ± 6 .2 7 1 .8 ±6. 1
C blades, living parts 1 980 49.6 ± 4.0 46 .7 ± 2 .2 44.2 ± 3 . 7 42.28± 1 .93 1 98 1 4 1 .2 ± 3 .4 41 .6 ± 3 . 1 1 982 49.4 ± 3 . 7 4 1 . 1 ± 3 . 3
C blades, dead partsb 1 980 3 .25 ± 0.67 4. 1 2 ± 0 .45 4 . 58± 0.70 6 . 1 4 ± 0.70 1 98 1 5 .32±0.90 7 .60± 1 .00 1 982 3 .76± 0.70 6 .20± 1 .72
C + 1 , living parts" 1 980 1 2. 0 ±2 .7 1 1 .43 ± 1 . 58 10 .8 ±2.6 7 .45 ± 1 . 1 5 1 98 1 8 . 9 ±2 .6 3 . 1 9 ± 1 . 1 8 1 982 1 3 . 5 ± 3 .0 8 .47± 1 .83
C + 1 blades, living parts 1 980 5 .88± 1 .54 5 . 32 ± 0. 82 4 . 1 9 ± 1 .2 1 2 .78±0.50 1 98 1 3 .74± 1 . 1 2 1 .04±0.40 1 982 6 .36± 1 .5 6 3 . 1 6 ±0.76
biomass 1 980 88 .7 ±9.0 86 . 5 ±4 .8 82 .4 ± 8 .4 79.3 ±4 .0 1 98 1 78.4 ±7 .6 75 .2 ±6 .4 1 982 92. 8 ±8 .4 80 . 3 ±6 .2
• Blades and sheaths. b Completely dead leaves not included.
plants are still covered with snow. After flowering the culms grew until early June when they had reached an average height of 295-375 mm and a weight of 1 52-2 1 7 mg per individual (Table 1 6b) .
The number of vegetative shoots (Table 25) is stable over the years and considerably higher in lawns than on hummocks .
of dead upper parts of living leaves were higher in lawns, both in C and C + 1 leaves . The weight and length of the living parts of the C + 1 leaves were lower in lawns . As there were no significant differences in number of leaves, this means that leaf tops , but not leaf bases , died at a younger age in lawns .
The biomass per individual of non-flowering Eriophorum is shown in Table 1 6a. There were certain differences between hummocks and lawns, although not in total biomass . The weight and length
Acta Phytogeogr. Suec. 74
The individual biomass on the Skattlosberg Stormosse was considerably higher than reported by Chapin et al . ( 1 980) . They obtained 20 mg per individual on an Alaskan tundra . Gore ( 1 96 1 ) reported 100 mg at Moor House .
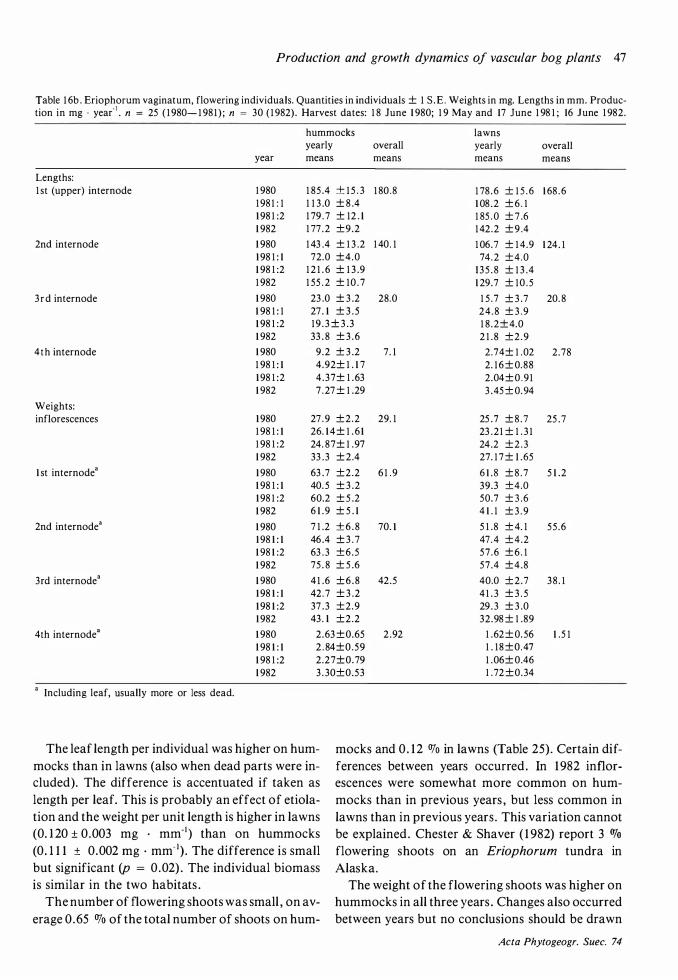
Production and growth dynamics of vascular bog plants 47
Table 1 6b . Eriophorum vaginatum, flowering individuals. Quantities in individuals ± 1 S . E . Weights in mg. Lengths in mm. Produc-tion in mg · year" 1 • n = 25 ( 1 980- 1 98 1 ) ; n = 30 ( 1 982) . Harvest dates: 1 8 June 1 980; 1 9 May and 17 June 1 98 1 ; 16 June 1 982.
hummocks lawns yearly overall yearly overall
year means means means means
Lengths: 1 st (upper) internode 1 980 1 85 .4 ± 1 5 . 3 1 80 .8 1 78 .6 ± 1 5 . 6 1 68 . 6
1 98 1 : 1 1 1 3 .0 ± 8 .4 1 08 .2 ± 6 . 1 1 98 1 :2 1 79 . 7 ± 12 . 1 1 85 . 0 ± 7 .6 1 982 1 77 .2 ±9.2 1 42.2 ± 9 .4
2nd internode 1 980 1 43 .4 ± 1 3 .2 1 40 . 1 1 06.7 ± 1 4 .9 1 24. 1 1 98 1 : 1 72.0 ±4.0 74. 2 ±4 .0 1 98 1 :2 1 2 1 . 6 ± 1 3 .9 1 3 5 . 8 ± 1 3 .4 1 982 1 55 . 2 ± 10 .7 1 29.7 ± 1 0 . 5
3 r d internode 1 980 23 .0 ± 3 .2 28.0 1 5 .7 ± 3 .7 20. 8 1 98 1 : 1 27 . 1 ± 3 .5 24 .8 ± 3 .9 1 98 1 :2 1 9 . 3 ± 3 .3 1 8 .2±4.0 1 982 33 . 8 ± 3 .6 2 1 . 8 ±2.9
4th internode 1 980 9 .2 ± 3 .2 7 . 1 2.74± 1 .02 2.78 1 98 1 : 1 4.92± 1 . 1 7 2. 1 6 ± 0.88 1 98 1 :2 4 .37± 1 .63 2.04±0 .9 1 1 982 7 . 27 ± 1 .29 3 .45 ± 0. 94
Weights: inflorescences 1 980 27 .9 ±2 .2 29. 1 25 .7 ± 8 . 7 25 .7
1 98 1 : 1 26. 1 4 ± 1 . 6 1 23 .2 1 ± 1 . 3 1 1 98 1 :2 24. 87± 1 .97 24.2 ±2 .3 1 982 33 .3 ± 2.4 27. 1 7 ± 1 .65
1 st internode a 1 980 63 .7 ±2.2 6 1 . 9 6 1 .8 ± 8 . 7 5 1 .2 1 98 1 : 1 40. 5 ± 3 .2 39.3 ±4.0 1 98 1 :2 60.2 ± 5 .2 50.7 ± 3 .6 1 982 6 1 .9 ± 5 . 1 4 1 . 1 ± 3 . 9
2nd internode3 1 980 7 1 .2 ± 6 . 8 70. 1 5 1 .8 ± 4. 1 55 .6 1 98 1 : 1 46 .4 ± 3 .7 47 . 4 ±4.2 1 98 1 :2 63 .3 ±6.5 57 .6 ±6 . 1 1 982 75 . 8 ± 5 .6 57.4 ±4.8
3rd internode3 1 980 4 1 .6 ±6 .8 42.5 40.0 ± 2 .7 38 . 1 1 98 1 : 1 42 . 7 ± 3 .2 4 1 . 3 ± 3 . 5 1 98 1 :2 37 .3 ±2.9 29. 3 ± 3 .0 1 982 43 . 1 ±2.2 32.98 ± 1 .89
4th internodea 1 980 2 .63 ±0.65 2 .92 1 .62 ± 0. 56 1 .5 1 1 98 1 : 1 2 . 84±0.59 1 . 1 8 ±0 .47 1 98 1 :2 2 .27±0.79 1 .06± 0.46 1 982 3 . 30±0.53 1 .72 ±0.34
a Including leaf, usually more or less dead.
The leaf length per individual was higher on hummocks than in lawns (also when dead parts were included). The difference is accentuated if taken as length per leaf. This is probably an effect of etiolation and the weight per unit length is higher in lawns (0. 1 20 ± 0.003 mg · mm·1) than on hummocks (0 . 1 1 1 ± 0.002 mg · mm-1) . The difference is small but significant (p = 0.02) . The individual biomass is similar in the two habitats .
mocks and 0 . 1 2 OJo in lawns (Table 25). Certain differences between years occurred . In 1 982 inflorescences were somewhat more common on hummocks than in previous years , but less common in lawns than in previous years . This variation cannot be explained . Chester & Shaver ( 1 982) report 3 OJo flowering shoots on an Eriophorum tundra in Alaska.
The number of flowering shoots was small , on average 0 .65 OJo of the total number of shoots on hum-
The weight of the flowering shoots was higher on hummocks in all three years . Changes also occurred between years but no conclusions should be drawn
Acta Phytogeogr. Suec. 74
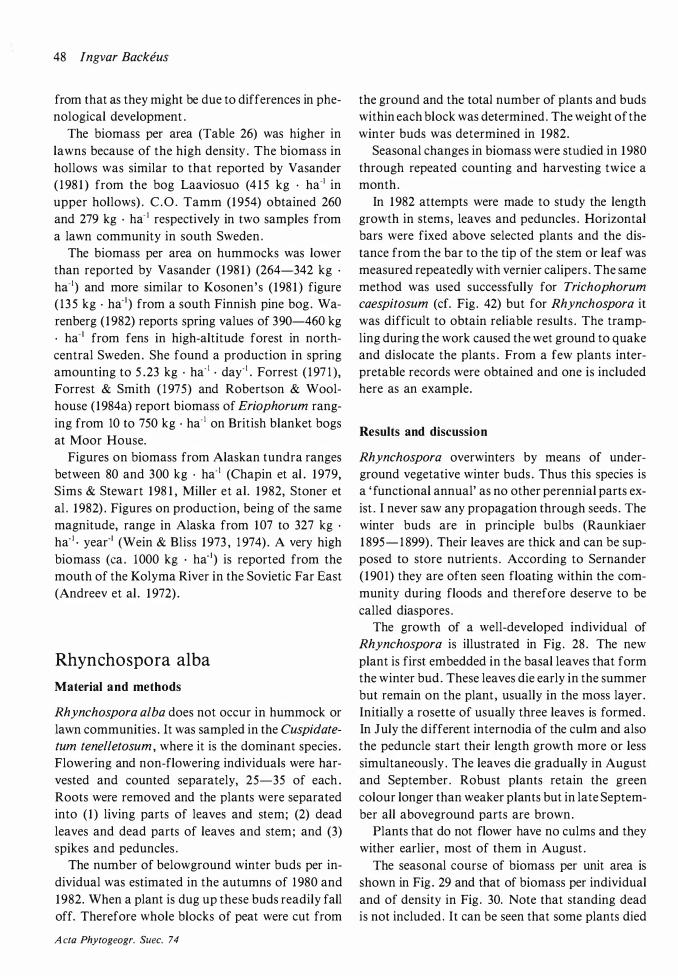
48 Ingvar Backeus
from that as they might be due to differences in phenological development .
The biomass per area (Table 26) was higher in lawns because of the high density . The biomass in hollows was similar to that reported by Vasander ( 1 98 1 ) from the bog Laaviosuo (4 1 5 kg · ha-1 in upper hollows) . C . O . Tamm ( 1 954) obtained 260
and 279 kg · ha- 1 respectively in two samples from a lawn community in south Sweden .
The biomass per area on hummocks was lower than reported by Vasander ( 1 98 1 ) (264-342 kg ·
ha- 1) and more similar to Kosonen's ( 198 1 ) figure ( 1 3 5 kg · ha- 1 ) from a south Finnish pine bog . Warenberg ( 1 982) reports spring values of 390-460 kg · ha-1 from fens in high-altitude forest in northcentral Sweden . She found a production in spring amounting to 5 .23 kg · ha- 1 • day- 1 • Forrest ( 1 97 1 ),
Forrest & Smith ( 1 975) and Robertson & Woolhouse ( 1984a) report biomass of Eriophorum ranging from 10 to 750 kg · ha- 1 on British blanket bogs at Moor House.
Figures on biomass from Alaskan tundra ranges between 80 and 300 kg · ha- 1 (Chapin et al . 1 979,
Sims & Stew art 1 98 1 , Miller et al. 1 982, Stoner et al . 1 982) . Figures on production, being of the same magnitude, range in Alaska from 107 to 327 kg ·
ha- 1 • year·1 (Wein & Bliss 1 973 , 1 974) . A very high biomass (ea . 1 000 kg · ha- 1) is reported from the mouth of the Kolyma River in the Sovietic Far East (Andreev et al . 1 972) .
Rhynchospora alba
Material and methods
Rhynchospora alba does not occur in hummock or lawn communities . It was sampled in the Cuspidate
turn tenel/etosum , where it is the dominant species . Flowering and non-flowering individuals were harvested and counted separately, 25-35 of each . Roots were removed and the plants were separated into ( 1 ) living parts of leaves and stem; (2) dead leaves and dead parts of leaves and stem; and (3)
spikes and peduncles . The number of belowground winter buds per in
dividual was estimated in the autumns of 1 980 and 1 982. When a plant is dug up these buds readily fall off. Therefore whole blocks of peat were cut from
A cta Phytogeogr. Suec. 74
the ground and the total number of plants and buds within each block was determined . The weight of the winter buds was determined in 1 982.
Seasonal changes in biomass were studied in 1 980
through repeated counting and harvesting twice a month .
In 1 982 attempts were made to study the length growth in stems, leaves and peduncles . Horizontal bars were fixed above selected plants and the distance from the bar to the tip of the stem or leaf was measured repeatedly with vernier calipers . The same method was used successfully for Trichophorum
caespitosum (cf. Fig . 42) but for Rhynchospora it was difficult to obtain reliable results . The trampling during the work caused the wet ground to quake and dislocate the plants . From a few plants interpretable records were obtained and one is included here as an example.
Results and discussion
Rhynchospora overwinters by means of underground vegetative winter buds . Thus this species is a ' functional annual' as no other perennial parts exist . I never saw any propagation through seeds . The winter buds are in principle bulbs (Raunkiaer 1 895- 1 899) . Their leaves are thick and can be supposed to store nutrients . According to Sernander ( 1 90 1 ) they are often seen floating within the community during floods and therefore deserve to be called diaspores .
The growth of a well-developed individual of Rhynchospora is illustrated in Fig . 28 . The new plant is first embedded in the basal leaves that form the winter bud . These leaves die early in the summer but remain on the plant , usually in the moss layer . Initially a rosette of usually three leaves is formed . In July the different internodia of the culm and also the peduncle start their length growth more or less simultaneously . The leaves die gradually in August and September . Robust plants retain the green colour longer than weaker plants but in late September all aboveground parts are brown .
Plants that do not flower have no culms and they wither earlier , most of them in August .
The seasonal course of biomass per unit area is shown in Fig . 29 and that of biomass per individual and of density in Fig . 30. Note that standing dead is not included . It can be seen that some plants died
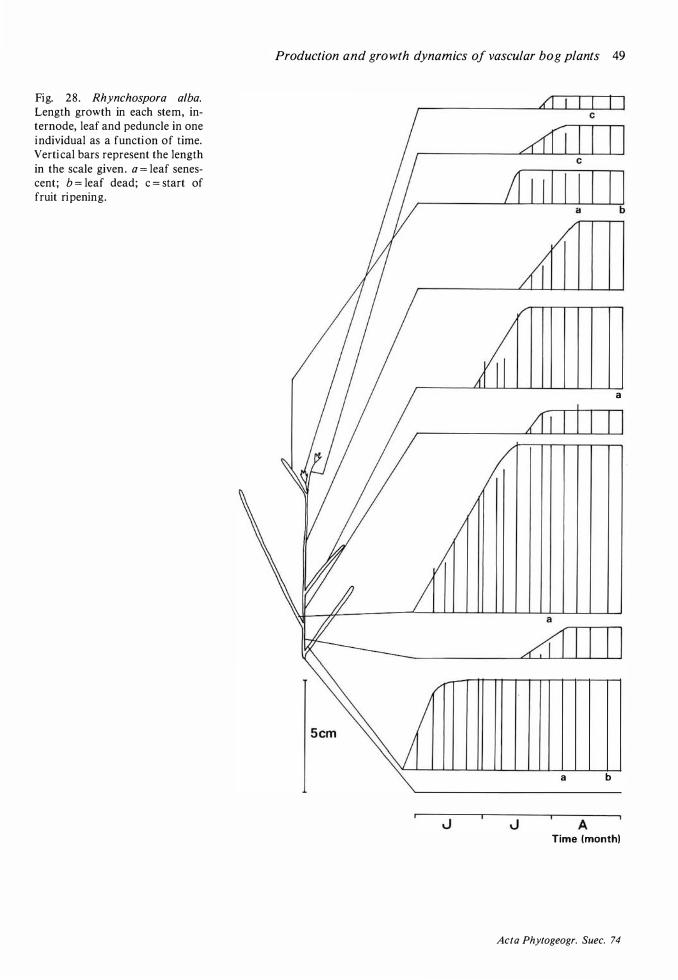
Fig. 28. Rhynchospora alba. Length growth in each stem, internode, leaf and peduncle in one individual as a function of time. Vertical bars represent the length in the scale given. a = leaf senescent; b = leaf dead; c = start of fruit ripening.
Production and growth dynamics of vascular bog plants 49
a b
A
a
Time (month)
Acta Phytogeogr. Suec. 74
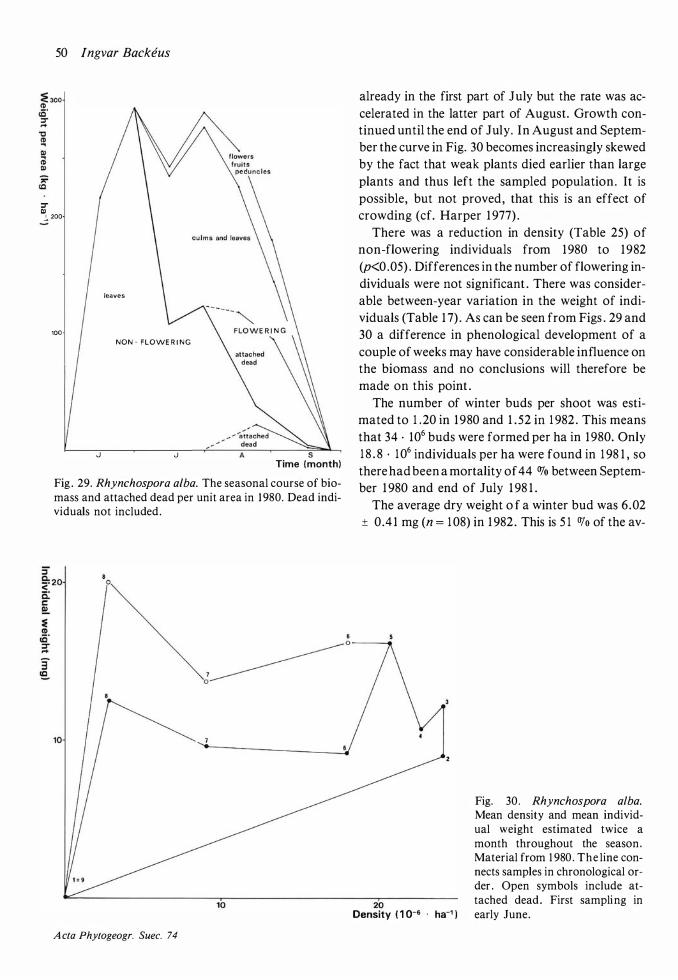
:::r Q)
50 lngvar Backeus
.!. 200
leaves
100 NON - FLOWE R I N G
J J s Time ( month)
Fig . 29. Rhynchospora alba. The seasonal course of biomass and attached dead per unit area in 1 980. Dead individuals not included .
10
A cta Phytogeogr. Suec. 74
already in the first part of July but the rate was accelerated in the latter part of August. Growth continued until the end of July. In August and September the curve in Fig. 30 becomes increasingly skewed by the fact that weak plants died earlier than large plants and thus left the sampled population . It is possible, but not proved, that this is an effect of crowding (cf. Harper 1 977) .
There was a reduction in density (Table 25) of non-flowering individuals from 1 980 to 1 982 (p<0.05) . Differences in the number of flowering individuals were not significant . There was considerable between-year variation in the weight of individuals (Table 1 7) . As can be seen from Figs . 29 and 30 a difference in phenological development of a couple of weeks may have considerable influence on the biomass and no conclusions will therefore be made on this point .
The number of winter buds per shoot was estimated to 1 . 20 in 1 980 and 1 . 52 in 1 982 . This means that 34 · 106 buds were formed per ha in 1 980. Only 1 8 . 8 · 1 06 individuals per ha were found in 1 98 1 , so there had been a mortality of 44 OJo between September 1 980 and end of July 1 98 1 .
The average dry weight o f a winter bud was 6 .02 ± 0.4 1 mg (n = 1 08) in 1 982 . This is 5 1 OJo of the av-
20 Density ( 1 o-s · ha-1 l
Fig. 30 . Rhynchospora alba. Mean density and mean individual weight estimated twice a month throughout the season. Material from 1 980 . The line connects samples in chronological order . Open symbols include attached dead. First sampling in early June.
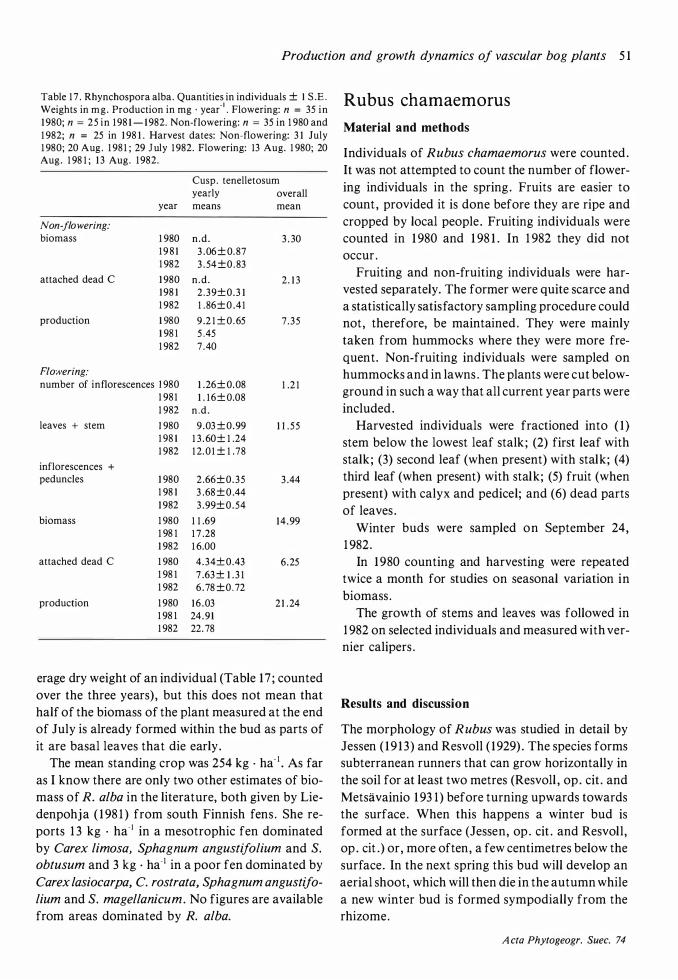
Production and growth dynamics of vascular bog plants 5 1
Table 1 7 . Rhynchospora alba . Quantities in individuals ± I S .E . Weights in mg. Production in mg · year-1 • Flowering: n = 35 in 1 980; n = 25 in 1 98 1 - 1 982. Non-flowering: n = 35 in 1 980 and 1 982; n = 25 in 1 98 1 . Harvest dates: Non-flowering: 3 1 July 1 980; 20 Aug . 1 98 1 ; 29 J uly 1 982. Flowering: 13 Aug. 1 980; 20 Aug. 1 98 1 ; 1 3 Aug. 1 982.
Cusp. tenelletosum yearly overall
year means mean
Non-flowering:
biomass 1 980 n .d . 3 . 30 1 9 8 1 3 .06 ± 0. 87 1 982 3 . 54 ±0.83
attached dead C 1 980 n.d . 2. 1 3 1 98 1 2 .39±0.3 1 1 982 1 .86±0.4 1
production 1 980 9 .2 1 ± 0.65 7 .35 1 98 1 5 .45 1 982 7 .40
Flowering:
number of inflorescences 1 980 1 .26± 0.08 1 .2 1 1 98 1 1 . 1 6± 0.08 1 982 n .d .
leaves + stem 1 980 9 .03 ± 0.99 1 1 . 55 1 98 1 1 3 . 60± 1 .24 1 982 1 2. 0 1 ± 1 .78
inflorescences +
peduncles 1 980 2 .66±0.35 3 .44 1 98 1 3 .68 ±0.44 1 982 3 .99±0 .54
biomass 1 980 1 1 .69 14 .99 1 98 1 1 7 .28 1 982 1 6.00
attached dead C 1 980 4.34± 0.43 6.25 1 98 1 7 .63 ± 1 . 3 1 1 982 6 .78 ±0 . 72
production 1 980 16 .03 2 1 .24 1 98 1 24.9 1 1 982 22. 78
erage dry weight of an individual (Table 1 7 ; counted over the three years) , but this does not mean that half of the biomass of the plant measured at the end of July is already formed within the bud as parts of it are basal leaves that die early .
The mean standing crop was 254 kg · ha- 1 • As far as I know there are only two other estimates of biomass of R. alba in the literature, both given by Liedenpohja ( 1 98 1 ) from south Finnish fens . She reports 1 3 kg · ha-1 in a mesotrophic fen dominated by Carex limosa, Sphagnum angustijolium and S.
obtusum and 3 kg · ha-1 in a poor fen dominated by Carex lasiocarpa, C. rostrata, Sphagnum angustifo
lium and S. magellanicum. No figures are available from areas dominated by R. alba.
Rubus chamaemorus
Material and methods
Individuals of Rubus chamaemorus were counted . It was not attempted to count the number of flowering individuals in the spring . Fruits are easier to count , provided it is done before they are ripe and cropped by local people . Fruiting individuals were counted in 1 980 and 1 98 1 . In 1 982 they did not occur .
Fruiting and non-fruiting individuals were harvested separately. The former were quite scarce and a statistically satisfactory sampling procedure could not, therefore, be maintained . They were mainly taken from hummocks where they were more frequent. Non-fruiting individuals were sampled on hummocks and in lawns . The plants were cut belowground in such a way that all current year parts were included .
Harvested individuals were fractioned into ( I ) stem below the lowest leaf stalk ; (2) first leaf with stalk ; (3) second leaf (when present) with stalk ; (4)
third leaf (when present) with stalk ; (5) fruit (when present) with calyx and pedicel; and (6) dead parts of leaves .
Winter buds were sampled on September 24,
1 982 .
In 1 980 counting and harvesting were repeated twice a month for studies on seasonal variation in biomass .
The growth of stems and leaves was followed in 1 982 on selected individuals and measured with vernier calipers .
Results and discussion
The morphology of Rubus was studied in detail by lessen ( 1 9 1 3) and Resvoll ( 1 929) . The species forms subterranean runners that can grow horizontally in the soil for at least two metres (Resvoll , op . cit . and Metsavainio 1 93 1 ) before turning upwards towards the surface . When this happens a winter bud is formed at the surface (lessen, op . cit . and Resvoll , op . cit .) or , more often, a few centimetres below the surface. In the next spring this bud will develop an aerial shoot, which will then die in the autumn while a new winter bud is formed sympodially from the rhizome.
A cta Phytogeogr. Suec. 74
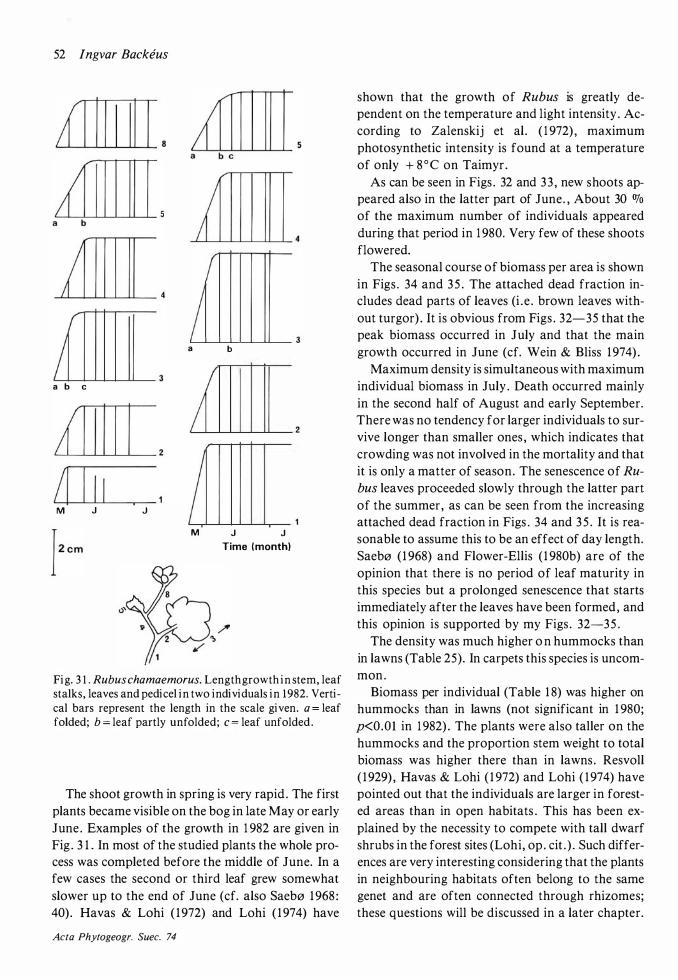
52 lngvar Backeus
I a b c
M J J
a
I I M
I b
J J Time (month)
Fig. 3 1 . Rubus chamaemorus. Length growth in stem, leaf stalks, leaves and pedicel in two individuals in 1982. Vertical bars represent the length in the scale given. a = leaf folded; b = leaf partly unfolded; c = leaf unfolded .
The shoot growth in spring is very rapid . The first plants became visible on the bog in late May or early June . Examples of the growth in 1 982 are given in Fig . 3 1 . In most of the studied plants the whole process was completed before the middle of June. In a few cases the second or third leaf grew somewhat slower up to the end of June (cf. also Saeb0 1 968 :
40) . Havas & Lohi ( 1 972) and Lohi ( 1 974) have
Acta Phytogeogr. Suec. 74
shown that the growth of Rubus is greatly dependent on the temperature and light intensity . According to Zalenskij et al . ( 1 972) , maximum photosynthetic intensity is found at a temperature of only + 8 ° C on Taimyr.
As can be seen in Figs . 32 and 3 3 , new shoots appeared also in the latter part of June. , About 30 o/o of the maximum number of individuals appeared during that period in 1 980. Very few of these shoots flowered.
The seasonal course of biomass per area is shown in Figs . 34 and 3 5 . The attached dead fraction includes dead parts of leaves (i . e . brown leaves without turgor) . It is obvious from Figs . 32-35 that the peak biomass occurred in July and that the main growth occurred in June (cf. Wein & Bliss 1 974) .
Maximum density is simultaneous with maximum individual biomass in July . Death occurred mainly in the second half of August and early September. There was no tendency for larger individuals to survive longer than smaller ones , which indicates that crowding was not involved in the mortality and that it is only a matter of season. The senescence of Ru
bus leaves proceeded slowly through the latter part of the summer, as can be seen from the increasing attached dead fraction in Figs . 34 and 3 5 . It is reasonable to assume this to be an effect of day length. Saeb0 ( 1 968) and Flower-Ellis ( 1 980b) are of the opinion that there is no period of leaf maturity in this species but a prolonged senescence that starts immediately after the leaves have been formed , and this opinion is supported by my Figs . 32-35 .
The density was much higher o n hummocks than in lawns (Table 25) . In carpets this species is uncommon .
Biomass per individual (Table 1 8) was higher on hummocks than in lawns (not significant in 1 980;
p<O.OI in 1 982) . The plants were also taller on the hummocks and the proportion stem weight to total biomass was higher there than in lawns . Resvoll ( 1 929) , Havas & Lohi ( 1 972) and Lohi ( 1 974) have pointed out that the individuals are larger in forested areas than in open habitats . This has been explained by the necessity to compete with tall dwarf shrubs in the forest sites (Lohi, op . cit . ) . Such differences are very interesting considering that the plants in neighbouring habitats often belong to the same genet and are often connected through rhizomes; these questions will be discussed in a later chapter.
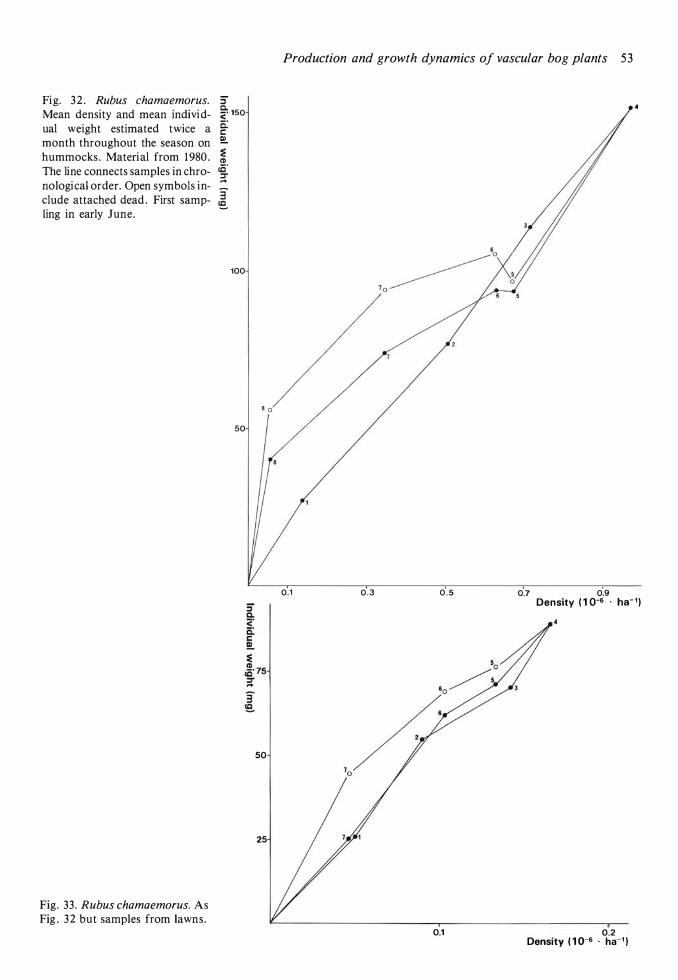
Fig. 3 2 . Rubus chamaemorus. Mean density and mean individ
:;� 150 0: ual weight estimated twice a
month throughout the season on hummocks . Material from 1980 . � The line connects samples in chro- �·
r:: e!..
;:r no logical order. Open symbols in- '3 elude attached dead . First samp- re_ ling in early June.
Fig. 33. Rubus chamaemorus. As Fig . 32 but samples from lawns.
100
50 8 0
50
25
Production and growth dynamics of vascular bog plants 53
0.1 0 .3 0 .5
0.1
0.7 0.9 Density ( 1 o-6 • ha-1 )
0.2 Density ( 1 Q-6 · ha-1 )
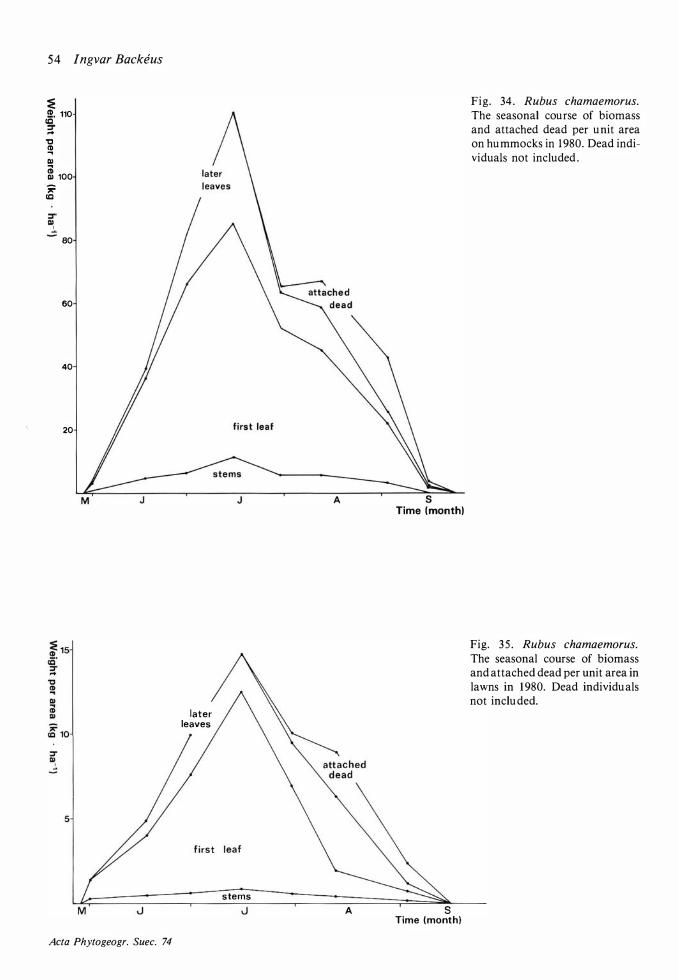
54
:E �. 110 cc :r ....
'0 � I» (;j I» 100 � cc
80
60
40
20
5
lngvar Backeus
M J
M
Acta Phytogeogr. Suec. 74
later leaves
J
stems
A
A
s Time (month)
s Time (month)
Fig. 34 . Rubus chamaemorus. The seasonal course of biomass and attached dead per unit area on hummocks in 1980. Dead individuals not included .
Fig. 3 5 . Rubus chamaemorus. The seasonal course of biomass and attached dead per unit area in lawns in 1 980. Dead individuals not included.
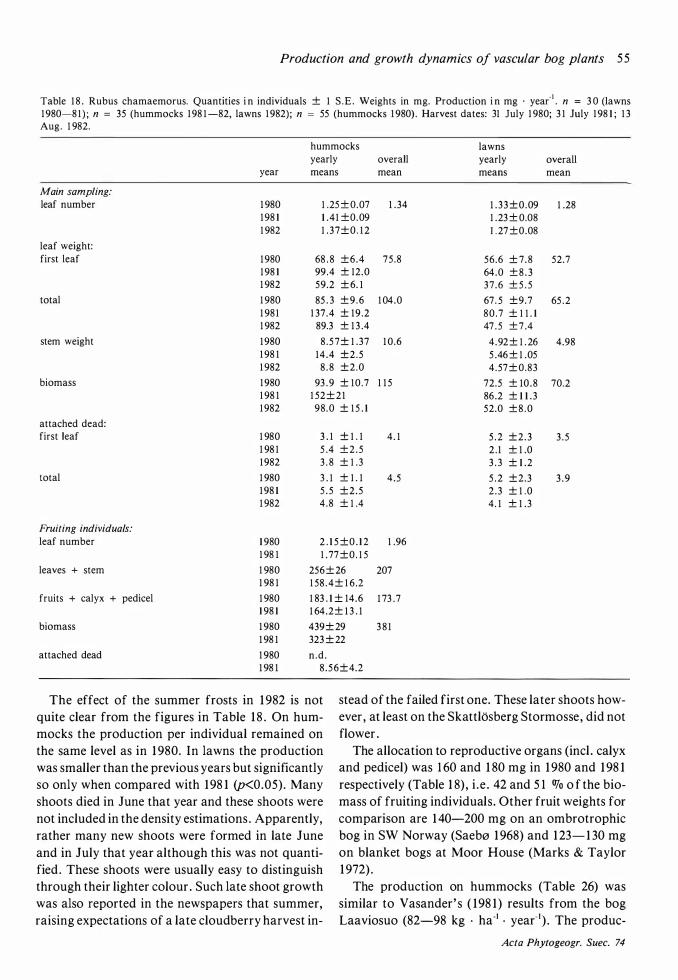
Production and growth dynamics of vascular bog plants 5 5
Table 1 8 . Rubus chamaemorus. Quantities i n individuals ± 1 S .E . Weights in mg. Production i n mg · year" ' . n = 3 0 (lawns 1 980-8 1 ) ; n = 35 (hummocks 1 98 1 -82, lawns 1 982) ; n = 55 (hummocks 1 980) . Harvest dates: 31 July 1 980; 3 1 July 1 98 1 ; 1 3 Aug. 1 982.
hummocks lawns yearly overall yearly overall
year means mean means mean
Main sampling:
leaf number 1 980 1 .25 ± 0.07 1 .34 1 . 33 ±0.09 1 .28 1 98 1 1 .4 1 ±0.09 1 .23 ± 0.08 1 982 1 . 37±0. 1 2 1 . 27 ±0.08
leaf weight: first leaf 1 980 68 . 8 ±6.4 75 .8 56.6 ± 7. 8 52.7
1 98 1 99 .4 ± 12.0 64.0 ± 8 . 3 1 982 59.2 ± 6. 1 37 .6 ± 5 . 5
total 1 980 85 . 3 ±9 .6 1 04.0 67 . 5 ±9.7 65 . 2 1 98 1 1 37 .4 ± 19 .2 80 .7 ± 1 1 . 1 1 982 89.3 ± 1 3 .4 47 .5 ± 7 .4
stem weight 1 980 8 . 57± 1 .37 1 0 .6 4 .92 ± 1 . 26 4.98 1 98 1 14 .4 ±2 .5 5 .46 ± 1 .05 1 982 8 . 8 ±2 .0 4 .57 ± 0.83
biomass 1 980 93 . 9 ± 1 0.7 1 1 5 72.5 ± 10 .8 70.2 1 98 1 1 52 ± 2 1 86.2 ± 1 1 .3 1 982 98 .0 ± 1 5 . 1 52.0 ± 8 . 0
attached dead: first leaf 1 980 3 . 1 ± 1 . 1 4 . 1 5 . 2 ±2 .3 3 . 5
1 98 1 5 .4 ± 2 . 5 2 . 1 ± 1 .0 1 982 3 . 8 ± 1 .3 3 . 3 ± 1 .2
total 1 980 3 . 1 ± 1 . 1 4 .5 5 . 2 ±2.3 3 .9 1 98 1 5 . 5 ±2 .5 2 . 3 ± 1 .0 1 982 4 .8 ± 1 .4 4 . 1 ± 1 .3
Fruiting individuals:
leaf number 1 980 2 . 1 5 ±0 . 1 2 1 .96 1 98 1 1 .77 ±0. 1 5
leaves + stem 1 980 256 ± 26 207 1 98 1 1 58 . 4 ± 1 6.2
fruits + calyx + pedicel 1 980 1 83 . 1 ± 14.6 1 73 .7 1 98 1 1 64.2± 1 3 . 1
biomass 1 980 439 ± 29 3 8 1 1 98 1 323 ± 22
attached dead 1 980 n .d . 1 98 1 8 .56±4.2
The effect of the summer frosts in 1 982 is not quite clear from the figures in Table 1 8 . On hummocks the production per individual remained on the same level as in 1 980. In lawns the production was smaller than the previous years but significantly so only when compared with 198 1 {p<0.05). Many shoots died in June that year and these shoots were not included in the density estimations . Apparently, rather many new shoots were formed in late June and in July that year although this was not quantified . These shoots were usually easy to distinguish through their lighter colour . Such late shoot growth was also reported in the newspapers that summer, raising expectations of a late cloud berry harvest in-
stead of the failed first one. These later shoots however , at least on the Skattlosberg Stormosse , did not flower .
The allocation to reproductive organs (incl . calyx and pedicel) was 1 60 and 1 80 mg in 1 980 and 1 98 1
respectively (Table 1 8) , i . e . 42 and 5 1 OJo o f the biomass of fruiting individuals. Other fruit weights for comparison are 1 40-200 mg on an ombrotrophic bog in SW Norway (Saeb0 1 968) and 1 23- 1 30 mg on blanket bogs at Moor House (Marks & Taylor 1 972) .
The production on hummocks (Table 26) was similar to Vasander' s ( 198 1 ) results from the bog Laaviosuo (82-98 kg · ha-1 • year- 1 ) . The produc-
Acta Phytogeogr. Suec. 74
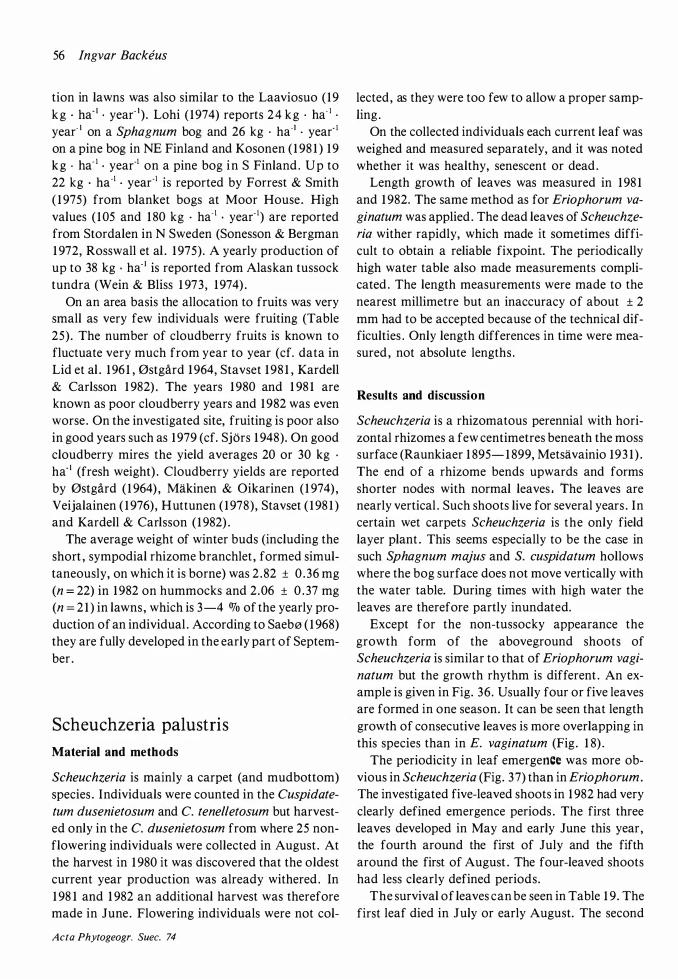
56 Ingvar Backeus
tion in lawns was also similar to the Laaviosuo ( 19
kg · ha- 1 • year- 1 ) . Lohi ( 1974) reports 24 kg · ha- 1 •
year· 1 on a Sphagnum bog and 26 kg · ha-1 • year· 1 on a pine bog in NE Finland and Kosonen ( 1 98 1 ) 1 9
k g · ha- 1 • year·1 on a pine bog i n S Finland . U p to 22 kg · ha-1 • year·1 is reported by Forrest & Smith ( 1 975) from blanket bogs at Moor House . High values ( 1 05 and 1 80 kg · ha-1 • year- 1) are reported from Stordalen in N Sweden (Sonesson & Bergman 1 972, Rosswall et al . 1 975) . A yearly production of up to 38 kg · ha-1 is reported from Alaskan tussock tundra (Wein & Bliss 1 973 , 1 974) .
On an area basis the allocation to fruits was very small as very few individuals were fruiting (Table 25). The number of cloudberry fruits is known to fluctuate very much from year to year (cf. data in Lid et al . 1 96 1 , 0stgard 1 964, Stavset 1 98 1 , Kardell & Carlsson 1 982) . The years 1 980 and 1 98 1 are known as poor cloud berry years and 1 982 was even worse . On the investigated site, fruiting is poor also in good years such as 1 979 (cf. Sjors 1 948). On good cloudberry mires the yield averages 20 or 30 kg · ha- 1 (fresh weight) . Cloudberry yields are reported by 0stgard ( 1 964) , Makinen & Oikarinen ( 1 974) ,
Veijalainen ( 1 976) , Huttunen ( 1 978) , Stavset ( 1 98 1 )
and Kardell & Carlsson ( 1 982) .
The average weight of winter buds (including the short , sympodial rhizome branchlet , formed simultaneously, on which it is borne) was 2 . 82 ± 0 .36 mg (n = 22) in 1 982 on hummocks and 2.06 ± 0 . 37 mg (n = 2 1 ) in lawns , which is 3-4 OJo of the yearly production of an individual . According to Saeb0 ( 1 968)
they are fully developed in the early part of September .
Scheuchzeria palustris
Material and methods
Scheuchzeria is mainly a carpet (and mudbottom) species . Individuals were counted in the Cuspidate
turn dusenietosum and C. tenelletosum but harvested only in the C. dusenietosum from where 25 nonflowering individuals were collected in August . At the harvest in 1 980 it was discovered that the oldest current year production was already withered . In 1 98 1 and 1 982 an additional harvest was therefore made in June. Flowering individuals were not col-
Acta Phytogeogr. Suec. 74
lected, as they were too few to allow a proper sampling .
On the collected individuals each current leaf was weighed and measured separately, and it was noted whether it was healthy, senescent or dead .
Length growth of leaves was measured in 1 98 1
and 1 982. The same method as for Eriophorum va
ginatum was applied . The dead leaves of Scheuchze
ria wither rapidly, which made it sometimes difficult to obtain a reliable fixpoint. The periodically high water table also made measurements complicated . The length measurements were made to the nearest millimetre but an inaccuracy of about ± 2
mm had to be accepted because of the technical difficulties . Only length differences in time were measured , not absolute lengths .
Results and discussion
Scheuchzeria is a rhizomatous perennial with horizontal rhizomes a few centimetres beneath the moss surface (Raunkiaer 1 895- 1 899, Metsavainio 193 1 ) .
The end of a rhizome bends upwards and forms shorter nodes with normal leaves . The leaves are nearly vertical . Such shoots live for several years . In certain wet carpets Scheuchzeria is the only field layer plant . This seems especially to be the case in such Sphagnum majus and S. cuspidatum hollows where the bog surface does not move vertically with the water table. During times with high water the leaves are therefore partly inundated.
Except for the non-tussocky appearance the growth form of the aboveground shoots of Scheuchzeria is similar to that of Eriophorum vagi
natum but the growth rhythm is different . An example is given in Fig. 36. Usually four or five leaves are formed in one season. It can be seen that length growth of consecutive leaves is more overlapping in this species than in E. vaginatum (Fig . 1 8) .
The periodicity in leaf emergence was more obvious in Scheuchzeria (Fig. 3 7) than in Eriophorum.
The investigated five-leaved shoots in 1 982 had very clearly defined emergence periods . The first three leaves developed in May and early June this year , the fourth around the first of July and the fifth around the first of August . The four-leaved shoots had less clearly defined periods.
The survival of leaves can be seen in Table 1 9. The first leaf died in July or early August. The second
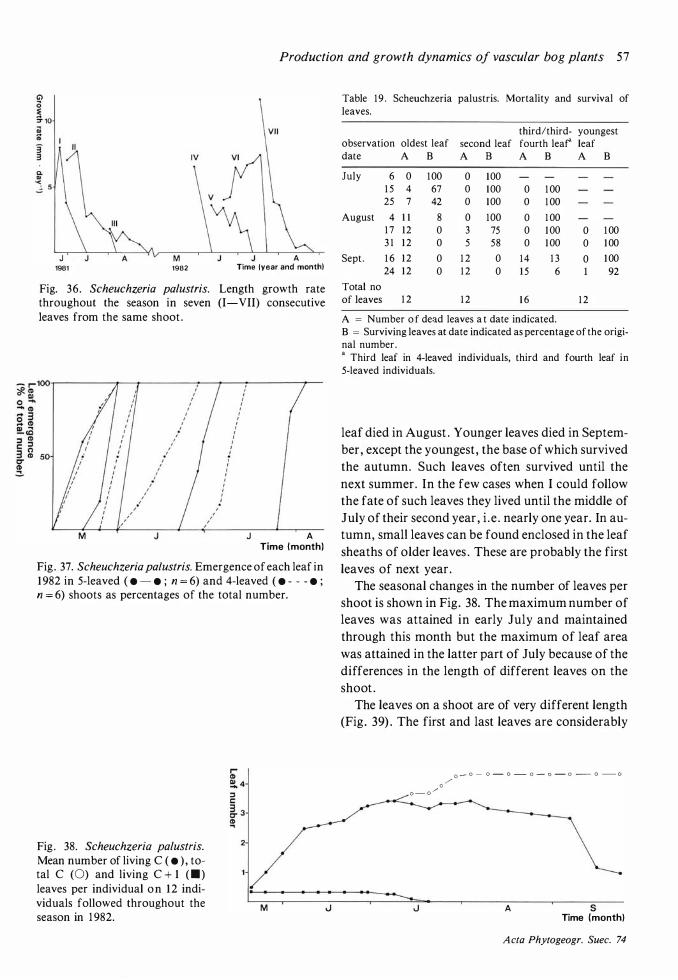
Production and growth dynamics of vascular bog plants 57
J A 1981 1982 Time (year and month}
Fig. 36. Scheuchzeria palustris. Length growth rate throughout the season in seven (I-VII) consecutive leaves from the same shoot .
M J J A Time ( month)
Fig . 37. Scheuchzeria pa/ustris. Emergence of each leaf in 1 982 in 5-leaved ( • - • ; n = 6) and 4-leaved ( • - - - • ; n = 6) shoots as percentages of the total number.
Fig . 38. Scheuchzeria palustris. Mean number of living C ( • ) , total C (0) and living C + 1 < • ) leaves per individual o n 1 2 individuals followed throughout the season in 1 982.
2
M
Table 1 9 . Scheuchzeria palustris. Mortality and survival of leaves.
observation oldest leaf date A B
July
August
Sept .
Total no of leaves
6 1 5 25
4 1 7 3 1
1 6 24
0 1 00 4 67 7 42
1 1 8 1 2 0 1 2 0
1 2 0 1 2 0
1 2
third/third- youngest second leaf fourth leaf" leaf A B A B A B
0 100 0 100 0 100
0 100 3 75 5 58
1 2 0 1 2 0
1 2
0 0
0 0 0
1 4 1 5
1 6
1 00 1 00
1 00 1 00 1 00
1 3 6
0 1 00 0 1 00
0 1 00 92
1 2
A = Number o f dead leaves a t date indicated. B = Surviving leaves at date indicated as percentage of the original number. a Third leaf in 4-leaved individuals, third and fourth leaf in 5-leaved individuals.
leaf died in August . Younger leaves died in September , except the youngest , the base of which survived the autumn. Such leaves often survived until the next summer . In the few cases when I could follow the fate of such leaves they lived until the middle of July of their second year , i . e . nearly one year. In autumn, small leaves can be found enclosed in the leaf sheaths of older leaves . These are probably the first leaves of next year .
The seasonal changes in the number of leaves per shoot is shown in Fig. 38. The maximum number of leaves was attained in early July and maintained through this month but the maximum of leaf area was attained in the latter part of July because of the differences in the length of different leaves on the shoot .
The leaves on a shoot are of very different length (Fig . 39) . The first and last leaves are considerably
0 - 0 /
0 - o - o - o - o - o - o - o - o
0 /
A s Time (month)
A cta Phytogeogr. Suec. 74
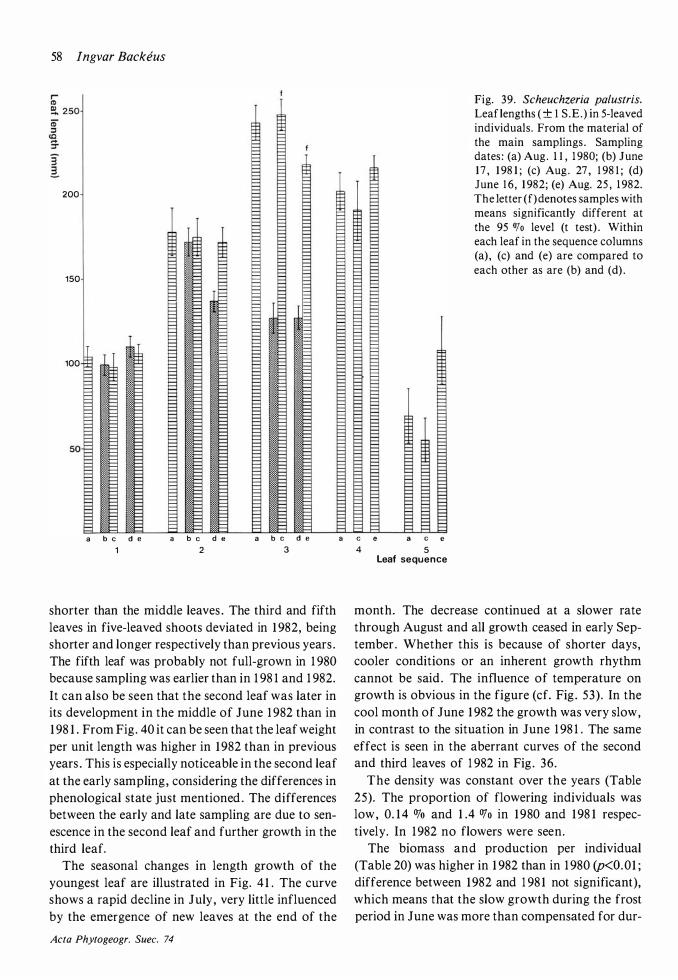
58 Ingvar Backeus
200
150
100
a b c d e
1 a b c d e
2 a b c d e
3
shorter than the middle leaves . The third and fifth leaves in five-leaved shoots deviated in 1 982, being shorter and longer respectively than previous years . The fifth leaf was probably not full-grown in 1 980
because sampling was earlier than in 1 98 1 and 1 982.
It can also be seen that the second leaf was later in its development in the middle of June 1 982 than in 1 98 1 . From Fig . 40 it can be seen that the leaf weight per unit length was higher in 1 982 than in previous years . This is especially noticeable in the second leaf at the early sampling , considering the differences in phenological state just mentioned . The differences between the early and late sampling are due to senescence in the second leaf and further growth in the third leaf.
The seasonal changes in length growth of the youngest leaf are illustrated in Fig. 4 1 . The curve shows a rapid decline in July , very little influenced by the emergence of new leaves at the end of the
Acta Phytogeogr. Suec. 74
a c e a c e 4 5
Leaf sequence
Fig. 39. Scheuchzeria palustris. Leaf lengths ( ± 1 S.E.) in 5-leaved individuals. From the material of the main samplings . Sampling dates : (a) Aug . 1 1 , 1 980; (b) June 17 , 1 98 1 ; (c) Aug . 27 , 1 98 1 ; (d) June 1 6 , 1 982; (e) Aug. 25 , 1 982. The letter (f) denotes samples with means significantly different at the 95 OJo level (t test) . Within each leaf in the sequence columns (a), (c) and (e) are compared to each other as are (b) and (d) .
month. The decrease continued at a slower rate through August and all growth ceased in early September . Whether this is because of shorter days, cooler conditions or an inherent growth rhythm cannot be said . The influence of temperature on growth is obvious in the figure (cf. Fig . 53) . In the cool month of June 1 982 the growth was very slow , in contrast to the situation in June 1 98 1 . The same effect is seen in the aberrant curves of the second and third leaves of 1 982 in Fig . 36 .
The density was constant over the years (Table 25) . The proportion of flowering individuals was low, 0. 1 4 OJo and 1 .4 OJo in 1 980 and 1 98 1 respectively. In 1 982 no flowers were seen.
The biomass and production per individual (Table 20) was higher in 1 982 than in 1 980 (p<O. 01 ;
difference between 1 982 and 1 98 1 not significant), which means that the slow growth during the frost period in June was more than compensated for dur-
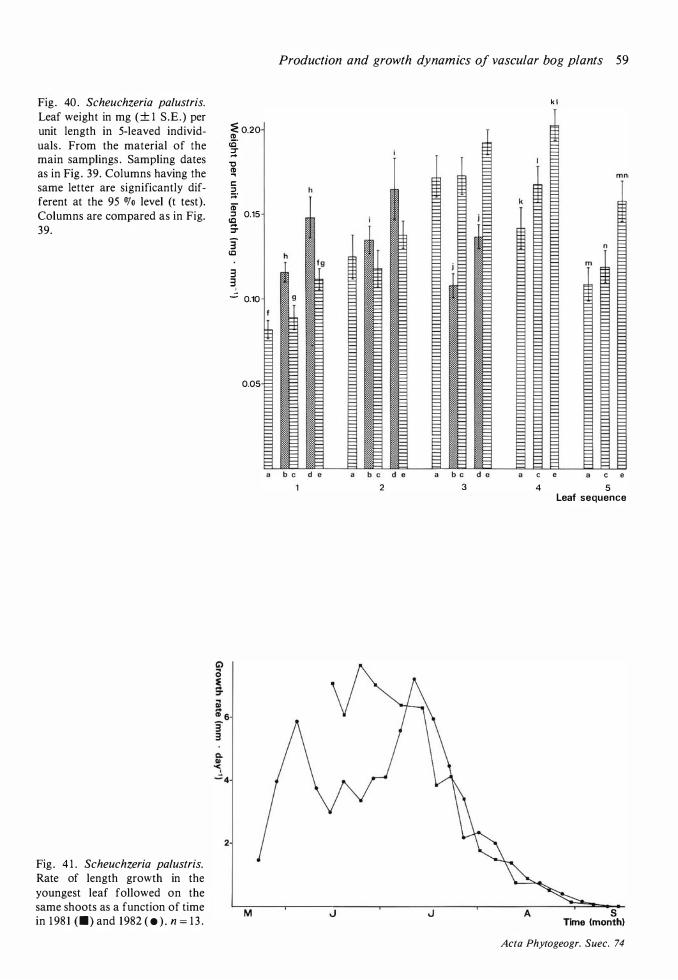
Fig . 40 . Scheuchzeria palustris. Leaf weight in mg ( ± 1 S .E . ) per unit length in 5-leaved individuals . From the material of the main samplings . Sampling dates as in Fig . 39. Columns having the same letter are significantly different at the 95 0,1o level (t test). Columns are compared as in Fig. 39.
Fig . 4 1 . Scheuchzeria palustris. Rate of length growth in the youngest leaf followed on the same shoots as a function of time in 1 98 1 <•) and 1982 ( • ) . n = 1 3 .
� 0.20 CD ce· ;:r
"0 � 1: :s ;::;: CD" :s 0.15
c.c ... ::r
3 c.c
3 3� - 0.10
0.05
2
M
Production and growth dynamics of vascular bog plants 59
2 3
J A
k l
c e c e 4 5
Leaf sequence
s Time (month)
Acta Phytogeogr. Suec. 74
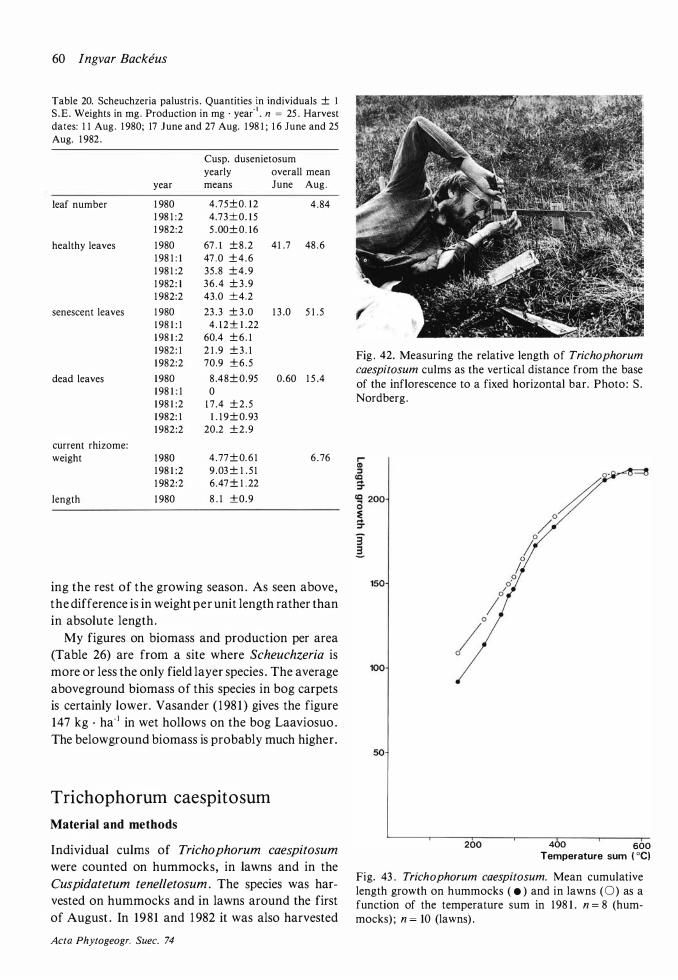
60 Ingvar Backeus
Table 20. Scheuchzeria palustris . Quantities in individuals ± I S .E . Weights in mg . Production in mg · year- 1 • n = 25 . Harvest dates: 1 1 Aug . 1 980; 17 June and 27 Aug. 1 98 1 ; 1 6 June and 25 Aug. 1 982 .
leaf number
healthy leaves
senescent leaves
dead leaves
current rhizome: weight
length
Cusp. dusenietosum yearly overall mean
year means June Aug .
1 980 1 98 1 : 2 1 982:2
1 980 1 98 1 : 1 1 98 1 :2 1 982 : 1 1 982:2
1 980 1 98 1 : 1 1 98 1 :2 1 982: 1 1 982:2
1 980 1 98 1 : 1 1 98 1 :2 1 982: 1 1 982:2
1 980 1 98 1 :2 1 982:2
1 980
4 .75±0. 1 2 4 .84 4.73±0. 1 5 5 .00± 0. 1 6
67 . 1 ±8 .2 4 1 .7 48 . 6 47 .0 ± 4 . 6 35 .8 ± 4 . 9 3 6 . 4 ± 3 .9 43.0 ±4.2
23 .3 ± 3 .0 1 3 .0 5 1 . 5 4 . 1 2 ± 1 .22
60.4 ± 6 . 1 2 1 .9 ± 3 . 1 70.9 ± 6 . 5
8 .48± 0.95 0.60 1 5 .4 0
1 7 .4 ± 2 . 5 1 . 1 9 ± 0. 93
20.2 ±2 .9
4 .77 ± 0. 6 1 6 .76 9 .03 ± 1 . 5 1 6.47 ± 1 . 22
8 . 1 ±0.9
ing the rest of the growing season . As seen above, the difference is in weight per unit length rather than in absolute length .
My figures on biomass and production per area (Table 26) are from a site where Scheuchzeria is more or less the only field layer species . The average above ground biomass of this species in bog carpets is certainly lower. Vasander ( 1 98 1 ) gives the figure 147 kg · ha- 1 in wet hollows on the bog Laaviosuo . The below ground biomass is probably much higher.
Trichophorum caespitosum
Material and methods
Individual culms of Trichophorum caespitosum
were counted on hummocks, in lawns and in the Cuspidatetum tenelletosum . The species was harvested on hummocks and in lawns around the first of August . In 198 1 and 1 982 it was also harvested
Acta Phytogeogr_ Suec. 74
Fig . 42. Measuring the relative length of Trichophorum caespitosum culms as the vertical distance from the base of the inflorescence to a fixed horizontal bar. Photo : S . Nordberg .
400 600 Temperature sum ( °C)
Fig. 43 . Trichophorum caespitosum. Mean cumulative length growth on hummocks ( • ) and in lawns (0) as a function of the temperature sum in 198 1 . n = 8 (hummocks) ; n = 10 (lawns) .
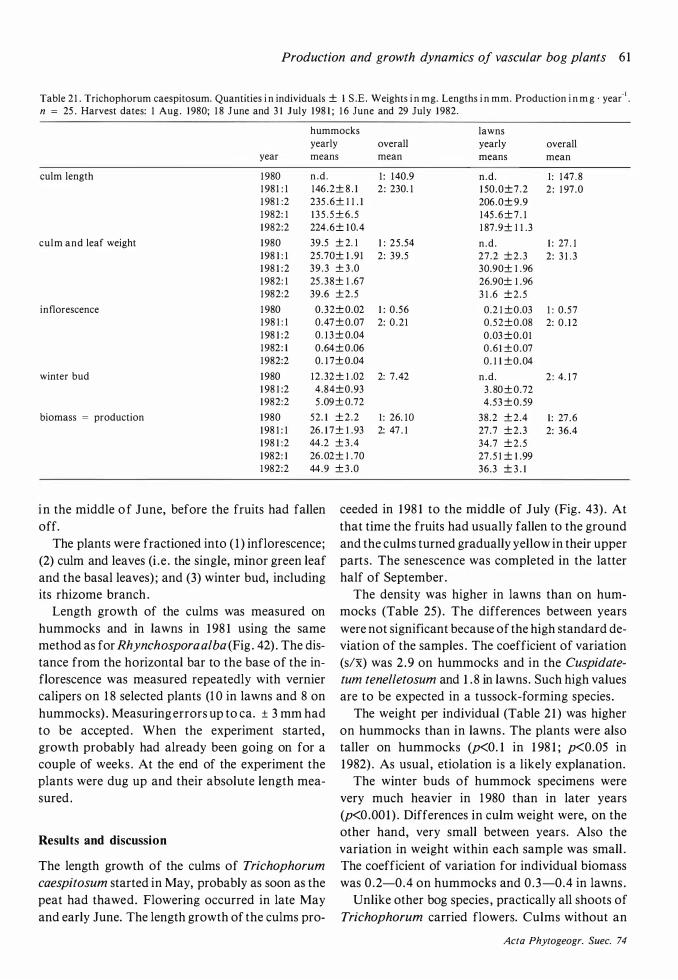
Production and growth dynamics of vascular bog plants 6 1
Table 2 I . Trichophorum caespitosum. Quantities i n individuals ± 1 S .E . Weights i n mg. Lengths i n mm. Production i n m g · year" 1 • n = 25 . Harvest dates: I Aug . I 980; I 8 J une and 3 1 July I 98 1 ; I 6 June and 29 July I 982.
hummocks lawns yearly overall yearly overall
year means mean means mean
culm length 1 980 n .d . 1 : I 40.9 n .d . 1 : I 47 . 8 I 98 I : I I46.2± 8 . I 2 : 230. I I 50 .0±7.2 2 : I 97 .0 1 98 I :2 235 .6± 1 l . I 206.0± 9.9 1 982: I 1 3 5 . 5 ± 6 . 5 I 45 . 6 ± 7 . I 1 982:2 224.6± 1 0. 4 I 87 .9± I l .3
culm and leaf weight I 980 39.5 ± 2. I I : 25 .54 n .d . 1 : 27 . I I 98 I : I 25.70± l .9 I 2: 39 .5 27.2 ±2 .3 2: 3 I . 3 I 98 I :2 39 .3 ± 3 .0 30.90± 1 .96 I 982: I 25 .38± 1 .67 26.90± 1 .96 I 982:2 39.6 ±2 .5 3 1 .6 ±2.5
inflorescence I 980 0.32± 0.02 I : 0.56 0.2 I ±0.03 I : 0 .57 I 98 I : I 0.47 ± 0.07 2: 0 .2I 0 .52±0.08 2: O . I 2 I 98 I :2 0 . 1 3 ± 0.04 0.03 ±0.0I I 982 : 1 0 .64±0.06 0 .6 I ±0.07 I 982:2 0. 1 7± 0.04 0 . 1 1 ±0.04
winter bud 1 980 12 . 32 ± 1 .02 2: 7 .42 n .d . 2 : 4. I 7 1 98 1 :2 4.84±0.93 3 . 80 ± 0.72 1 982:2 5 .09 ± 0.72 4.53 ± 0.59
biomass = production 1 980 52. 1 ± 2 .2 1 : 26. IO 38 .2 ± 2.4 1 : 27 .6 1 98 1 : I 26 . 1 7 ± 1 .93 2: 47 . 1 27 .7 ±2 .3 2: 36.4 1 98 1 :2 44.2 ± 3 .4 34.7 ±2 .5 1 982: I 26 .02 ± 1 .70 27.5 1 ± 1 .99 1 982:2 44.9 ± 3 .0 36.3 ± 3 . 1
i n the middle o f June, before the fruits had fallen off.
ceeded in 1 98 1 to the middle of July (Fig . 43) . At that time the fruits had usually fallen to the ground and the culms turned gradually yellow in their upper parts. The senescence was completed in the latter half of September .
The plants were fractioned into ( 1 ) inflorescence; (2) culm and leaves (i .e . the single, minor green leaf and the basal leaves) ; and (3) winter bud, including its rhizome branch .
Length growth of the culms was measured on hummocks and in lawns in 1 98 1 using the same method as for Rhynchospora alba (Fig . 42) . The distance from the horizontal bar to the base of the inflorescence was measured repeatedly with vernier calipers on 1 8 selected plants (1 0 in lawns and 8 on hummocks) . Measuring errors up to ea. ± 3 mm had to be accepted . When the experiment started, growth probably had already been going on for a couple of weeks . At the end of the experiment the plants were dug up and their absolute length measured .
Results and discussion
The length growth of the culms of Trichophorum
caespitosum started in May, probably as soon as the peat had thawed. Flowering occurred in late May and early June. The length growth of the culms pro-
The density was higher in lawns than on hummocks (Table 25) . The differences between years were not significant because of the high standard deviation of the samples . The coefficient of variation (s/x) was 2 .9 on hummocks and in the Cuspidate
turn tenel/etosum and 1 . 8 in lawns . Such high values are to be expected in a tussock-forming species .
The weight per individual (Table 2 1 ) was higher on hummocks than in lawns . The plants were also taller on hummocks (p<0. 1 in 1 98 1 ; p<0.05 in 1 982) . As usual , etiolation is a likely explanation.
The winter buds of hummock specimens were very much heavier in 1 980 than in later years (p<0.00 1 ) . Differences in culm weight were, on the other hand, very small between years . Also the variation in weight within each sample was small . The coefficient of variation for individual biomass was 0.2-0.4 on hummocks and 0 .3-0.4 in lawns .
Unlike other bog species , practically all shoots of Trichophorum carried flowers. Culms without an
Acta Phytogeogr. Suec. 74
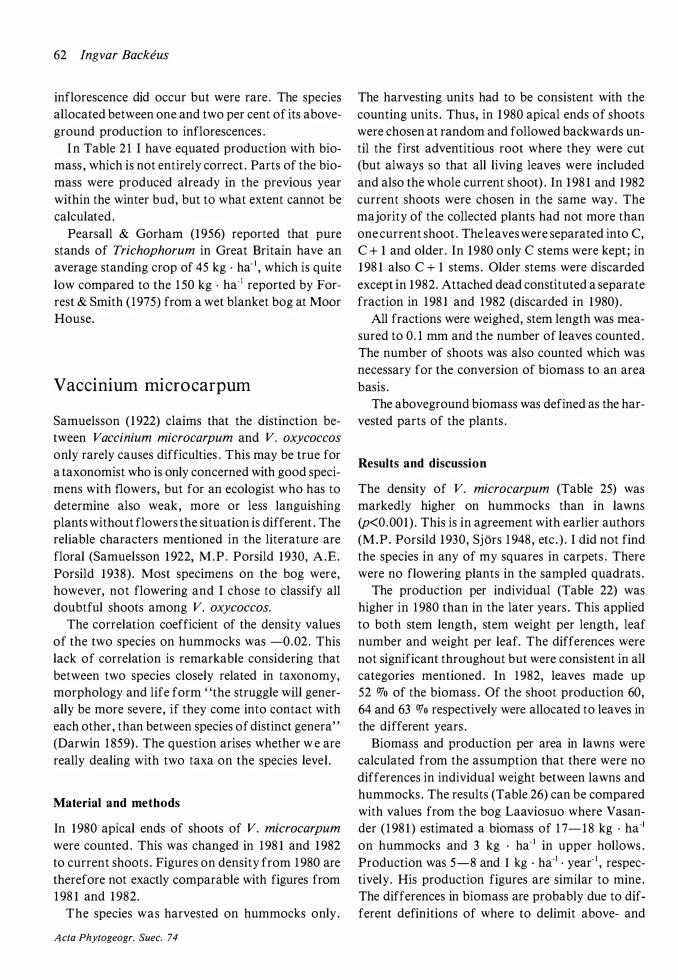
62 Ingvar Backeus
inflorescence did occur but were rare . The species allocated between one and two per cent of its aboveground production to inflorescences .
I n Table 2 1 I have equated production with biomass , which is not entirely correct . Parts of the biomass were produced already in the previous year within the winter bud, but to what extent cannot be calculated .
Pearsall & Gorham ( 1 956) reported that pure stands of Trichophorum in Great Britain have an average standing crop of 45 kg · ha- 1 , which is quite low compared to the 1 50 kg · ha- 1 reported by Forrest & Smith ( 1 975) from a wet blanket bog at Moor House.
Vaccinium microcarpum
Samuelsson ( 1 922) claims that the distinction between Vaccinium microcarpum and V. oxycoccos
only rarely causes difficulties . This may be true for a taxonomist who is only concerned with good specimens with flowers, but for an ecologist who has to determine also weak , more or less languishing plants without flowers the situation is different . The reliable characters mentioned in the literature are floral (Samuelsson 1 922, M.P. Porsild 1 930, A.E. Porsild 1 938) . Most specimens on the bog were, however, not flowering and I chose to classify all doubtful shoots among V. oxycoccos.
The correlation coefficient of the density values of the two species on hummocks was -0.02 . This lack of correlation is remarkable considering that between two species closely related in taxonomy, morphology and life form ' 'the struggle will generally be more severe, if they come into contact with each other , than between species of distinct genera' ' (Darwin 1 859) . The question arises whether w e are really dealing with two taxa on the species level .
Material and methods
In 1 980 apical ends of shoots of V. microcarpum
were counted. This was changed in 1 98 1 and 1 982
to current shoots . Figures on density from 1 980 are therefore not exactly comparable with figures from 1 98 1 and 1 982.
The species was harvested on hummocks only .
A cta Phytogeogr. Suec. 74
The harvesting units had to be consistent with the counting units . Thus, in 1 980 apical ends of shoots were chosen at random and followed backwards until the first adventitious root where they were cut (but always so that all living leaves were included and also the whole current shoot) . In 1 98 1 and 1 982
current shoots were chosen in the same way. The majority of the collected plants had not more than one current shoot . The leaves were separated into C, C + 1 and older . In 1 980 only C stems were kept ; in 1 98 1 also C + 1 stems . Older stems were discarded except in 1 982. Attached dead constituted a separate fraction in 1 98 1 and 1 982 (discarded in 1 980) .
All fractions were weighed, stem length was measured to 0. 1 mm and the number of leaves counted . The number of shoots was also counted which was necessary for the conversion of biomass to an area basis .
The aboveground biomass was defined as the harvested parts of the plants .
Results and discussion
The density of V. microcarpum (Table 25) was markedly higher on hummocks than in lawns {p<0.001 ) . This is in agreement with earlier authors (M.P. Porsild 1 930, Sjors 1 948 , etc . ) . I did not find the species in any of my squares in carpets . There were no flowering plants in the sampled quadrats .
The production per individual (Table 22) was higher in 1 980 than in the later years . This applied to both stem length, stem weight per length , leaf number and weight per leaf. The differences were not significant throughout but were consistent in all categories mentioned. In 1 982, leaves made up 52 OJo of the biomass . Of the shoot production 60,
64 and 63 OJo respectively were allocated to leaves in the different years .
Biomass and production per area in lawns were calculated from the assumption that there were no differences in individual weight between lawns and hummocks . The results (Table 26) can be compared with values from the bog Laaviosuo where Vasander ( 1 98 1 ) estimated a biomass of 1 7- 1 8 kg · ha-1 on hummocks and 3 kg · ha- 1 in upper hollows . Production was 5-8 and 1 kg · ha-1 • year- 1 , respectively. His production figures are similar to mine. The differences in biomass are probably due to different definitions of where to delimit above- and
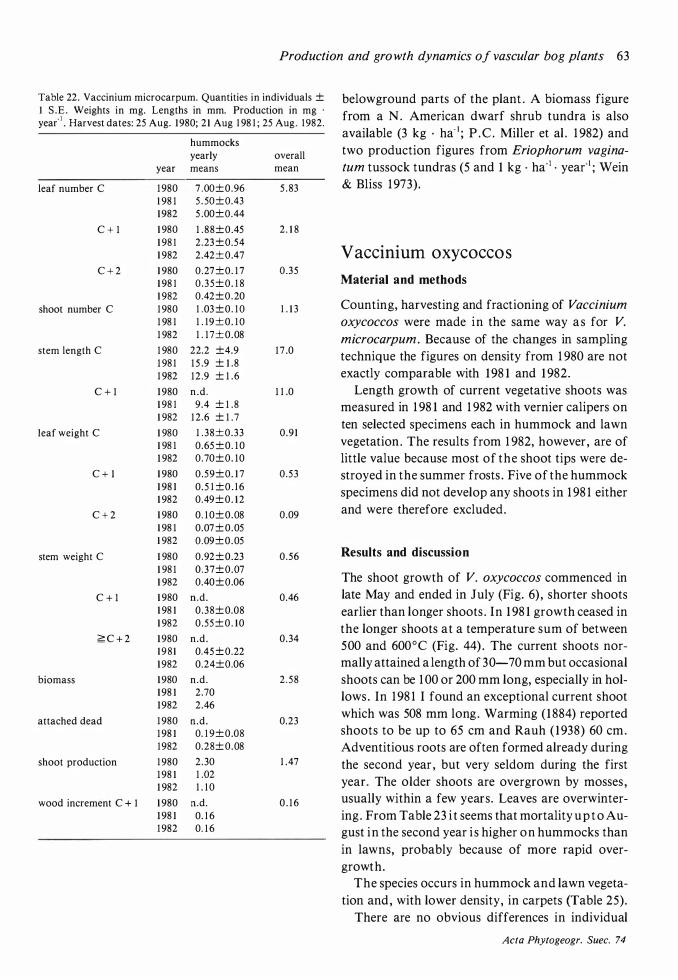
Production and growth dynamics of vascular bog plants 63
Table 22. Vaccinium microcarpum. Quantities in individuals ± belowground parts of the plant . A biomass figure I S .E. Weights in mg. Lengths in mm. Production in mg · from a N . American dwarf shrub tundra is also year- 1 • Harvest dates: 25 Aug. 1 980; 2 1 Aug 1 98 1 ; 25 Aug. 1 982.
available (3 kg · ha- 1 ; P . C . Miller et al . 1 982) and hummocks yearly overall two production figures from Eriophorum vagina-
year means mean tu m tussock tundras (5 and 1 kg · ha- 1 • year· 1 ; Wein
leaf number C 1 980 7 .00±0.96 5 . 83 & Bliss 1 973) .
1 98 1 5 . 50±0.43 1 982 5 .00±0.44
C + l 1 980 1 . 88±0.45 2 . 1 8 1 98 1 2 .23 ±0.54
Vaccinium oxycoccos 1 982 2 .42±0.47
C + 2 1 980 0.27 ±0. 1 7 0.35 1 98 1 0 .35±0. 1 8 Material and methods
1 982 0.42±0.20 Counting, harvesting and fractioning of Vaccinium shoot number C 1 980 1 .03 ±0. 1 0 1 . 1 3
1 98 1 1 . 19±0. 1 0 oxycoccos were made in the same way as for V. 1 982 1 . 1 7±0.08 microcarpum. Because of the changes in sampling
stem length C 1 980 22.2 ±4.9 1 7 .0 technique the figures on density from 1 980 are not 1 98 1 1 5 .9 ± 1 .8 1 982 12 .9 ± 1 .6 exactly comparable with 1 98 1 and 1 982.
C + l 1 980 n .d . 1 1 .0 Length growth of current vegetative shoots was 1 98 1 9 .4 ± 1 .8 measured in 1 98 1 and 1 982 with vernier calipers on 1 982 1 2 .6 ± 1 .7
ten selected specimens each in hummock and lawn leaf weight C 1 980 1 . 38±0.33 0 .91
1 98 1 0.65 ±0. 1 0 vegetation . The results from 1 982, however , are of 1 982 0.70±0. 1 0 little value because most of the shoot tips were de-
C + l 1 980 0.59±0. 1 7 0 .53 stroyed in the summer frosts . Five of the hummock 1 98 1 0. 5 1 ±0 . 1 6 specimens did not develop any shoots in 1 98 1 either 1 982 0.49±0. 12
C + 2 1 980 0 . 1 0±0.08 0 .09 and were therefore excluded. 1 98 1 0.07 ± 0.05 1 982 0 .09±0.05
stem weight C 1 980 0 .92±0.23 0 .56 Results and discussion
1 98 1 0 .37±0.07 The shoot growth of V. oxycoccos commenced in 1 982 0.40±0.06
C + l 1 980 n.d. 0.46 late May and ended in July (Fig. 6) , shorter shoots 1 98 1 0 .38± 0.08 earlier than longer shoots . In 1 98 1 growth ceased in 1 982 0 .55 ± 0 . 10 the longer shoots at a temperature sum of between
� C + 2 1 980 n.d. 0 .34 198 1 0.45 ±0.22 500 and 600°C (Fig. 44) . The current shoots nor-1 982 0.24±0.06 mally attained a length of 30-70 mm but occasional
biomass 1 980 n.d. 2 . 58 shoots can be 1 00 or 200 mm long, especially in hol-1 98 1 2 .70 lows . In 1 98 1 I found an exceptional current shoot 1 982 2 .46
which was 508 mm long . Warming ( 1 884) reported attached dead 1 980 n .d . 0.23
1 98 1 0. 1 9±0.08 shoots to be up to 65 cm and Rauh ( 1 938) 60 cm. 1 982 0.28± 0.08 Adventitious roots are often formed already during
shoot production 1 980 2 .30 1 .47 the second year , but very seldom during the first 1 98 1 1 .02
year. The older shoots are overgrown by mosses , 1 982 1 . 1 0
wood increment C + I 1 980 n.d. 0 . 1 6 usually within a few years. Leaves are overwinter-1 98 1 0. 1 6 ing . From Table 23 i t seems that mortality u p t o Au-1 982 0. 1 6 gust i n the second year i s higher o n hummocks than
in lawns, probably because of more rapid over-growth.
The species occurs in hummock and lawn vegeta-tion and , with lower density, in carpets (Table 25) .
There are no obvious differences in individual
Acta Phytogeogr. Suec. 74
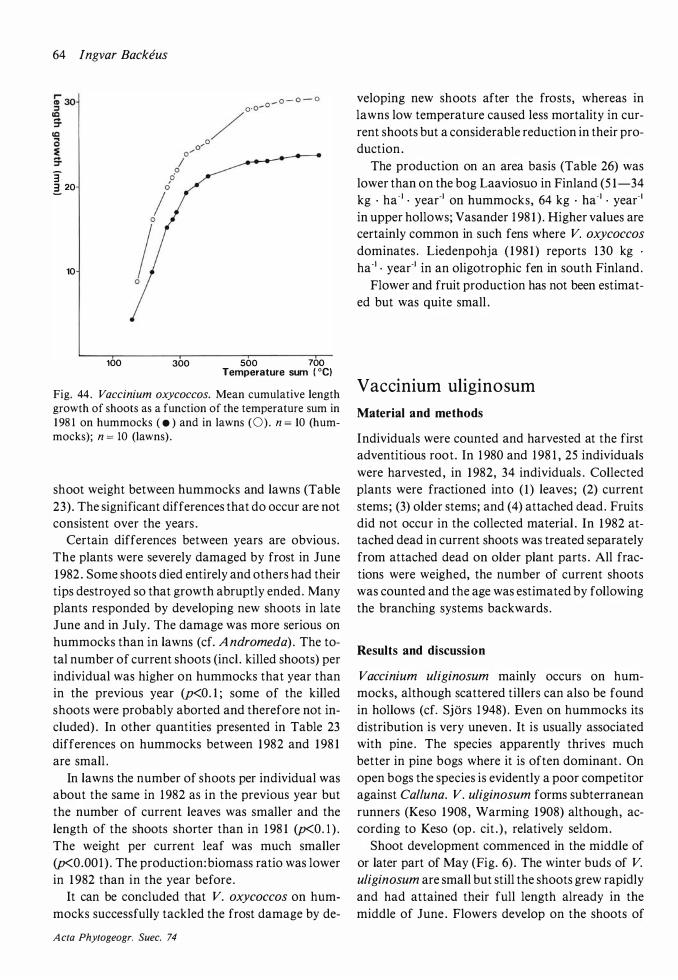
64 Ingvar Backeus
3 � 20
10
100 300 500 700 Temperature sum { °C)
Fig. 44 . Vaccinium oxycoccos. Mean cumulative length growth of shoots as a function of the temperature sum in 1 98 1 on hummocks ( • ) and in lawns (0) . n = 10 (hummocks) ; n = 10 (lawns) .
shoot weight between hummocks and lawns (Table 23). The significant differences that do occur are not consistent over the years .
Certain differences between years are obvious. The plants were severely damaged by frost in June 1 982 . Some shoots died entirely and others had their tips destroyed so that growth abruptly ended . Many plants responded by developing new shoots in late June and in July. The damage was more serious on hummocks than in lawns (cf. A ndromeda) . The total number of current shoots (incl . killed shoots) per individual was higher on hummocks that year than in the previous year (p<O. l ; some of the killed shoots were probably aborted and therefore not included) . In other quantities presented in Table 23
differences on hummocks between 1 982 and 1 98 1
are small . In lawns the number of shoots per individual was
about the same in 1 982 as in the previous year but the number of current leaves was smaller and the length of the shoots shorter than in 1 98 1 (p<O. l ) .
The weight per current leaf was much smaller (p<0.00 1 ) . The production:biomass ratio was lower in 1 982 than in the year before.
It can be concluded that V. oxycoccos on hummocks successfully tackled the frost damage by de-
A cta Phytogeogr. Suec. 74
veloping new shoots after the frosts, whereas in lawns low temperature caused less mortality in current shoots but a considerable reduction in their production .
The production on an area basis (Table 26) was lower than on the bog Laaviosuo in Finland (5 1 -34
kg · ha-' · year-' on hummocks, 64 kg · ha-' · year- ' in upper hollows; Vasander 1 98 1 ) . Higher values are certainly common in such fens where V. oxycoccos
dominates . Liedenpohja ( 1 98 1 ) reports 1 30 kg ·
ha-' · year-' in an oligotrophic fen in south Finland . Flower and fruit production has not been estimat
ed but was quite small .
Vaccinium uliginosum
Material and methods
Individuals were counted and harvested at the first adventitious root. In 1 980 and 1 98 1 , 25 individuals were harvested , in 1 982, 34 individuals . Collected plants were fractioned into ( I ) leaves ; (2) current stems ; (3) older stems; and (4) attached dead . Fruits did not occur in the collected material . In 1 982 attached dead in current shoots was treated separately from attached dead on older plant parts . All fractions were weighed, the number of current shoots was counted and the age was estimated by following the branching systems backwards .
Results and discussion
Vaccinium uliginosum mainly occurs on hummocks, although scattered tillers can also be found in hollows (cf. Sjors 1 948) . Even on hummocks its distribution is very uneven . It is usually associated with pine . The species apparently thrives much better in pine bogs where it is often dominant . On open bogs the species is evidently a poor competitor against Calluna. V. uliginosum forms subterranean runners (Keso 1 908 , Warming 1 908) although, according to Keso (op . cit . ) , relatively seldom.
Shoot development commenced in the middle of or later part of May (Fig. 6) . The winter buds of V.
uliginosum are small but still the shoots grew rapidly and had attained their full length already in the middle of June . Flowers develop on the shoots of
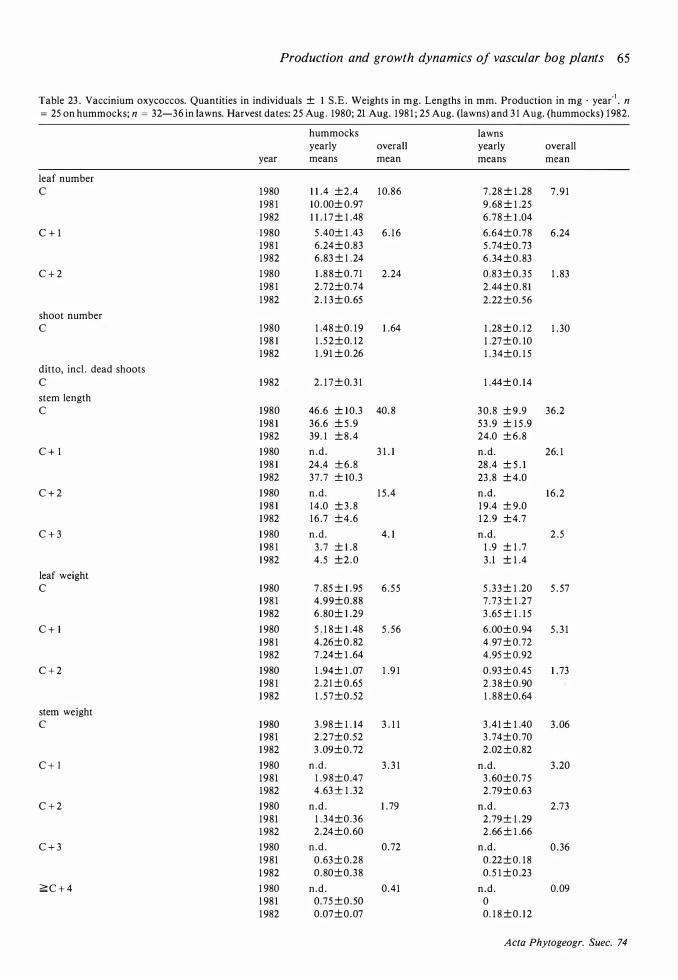
Production and growth dynamics of vascular bog plants 65
Table 23 . Vaccinium oxycoccos. Quantities in individuals ± 1 S .E . Weights in mg. Lengths in mm. Production in mg · year· 1 • n = 25 on hummocks; n = 32-36 in lawns. Harvest dates: 25 Aug . 1980; 21 Aug. 198 1 ; 25 Aug. (lawns) and 3 1 Aug. (hummocks) 1 982.
hummocks lawns yearly overall yearly overall
year means mean means mean
leaf number c 1 980 1 1 .4 ±2.4 1 0.86 7 .28 ± 1 .28 7 . 9 1
1 98 1 10 .00± 0.97 9 .68 ± 1 .25 1 982 1 1 . 1 7 ± 1 .48 6 .78 ± 1 .04
C + 1 1 980 5 .40± 1 .43 6 . 1 6 6 .64±0.78 6 .24 1 98 1 6.24± 0.83 5 .74±0.73 1 982 6 .83 ± 1 . 24 6 . 34 ±0.83
C + 2 1 980 1 .88±0 .7 1 2 .24 0 .83 ± 0.35 1 . 83 1 98 1 2 .72± 0.74 2 .44 ± 0 . 8 1 1 982 2 . 1 3 ± 0. 65 2.22 ±0.56
shoot number c 1 980 1 .48 ±0. 1 9 1 .64 1 .28 ± 0 . 1 2 1 . 30
1 98 1 1 .52±0. 1 2 1 .27 ±0. 10 1982 1 .9 1 ± 0.26 1 . 34±0. 1 5
ditto, incl . dead shoots c 1 982 2 . 1 7 ± 0. 3 1 1 .44± 0 . 1 4
stem length c 1 980 46.6 ± 1 0.3 40. 8 3 0 . 8 ± 9 .9 36.2
1 98 1 36.6 ± 5 .9 53 .9 ± 1 5 .9 1 982 39 . 1 ± 8 . 4 24.0 ± 6 .8
C + 1 1 980 n .d . 3 1 . 1 n .d . 26. 1 1 98 1 24.4 ±6.8 28 .4 ± 5 . 1 1 982 37.7 ± 10.3 23 .8 ± 4.0
C + 2 1 980 n .d . 1 5 .4 n .d . 1 6 .2 1 98 1 14 .0 ± 3 . 8 1 9 .4 ± 9.0 1 982 1 6 .7 ±4.6 1 2 .9 ±4.7
C + 3 1 980 n .d . 4 . 1 n .d . 2 . 5 1 98 1 3 .7 ± 1 .8 1 .9 ± 1 .7 1 982 4 .5 ±2.0 3 . 1 ± 1 .4
leaf weight c 1 980 7 . 85 ± 1 .95 6 . 55 5 .3 3 ± 1 .20 5 . 57
1 98 1 4 .99±0.88 7 .73 ± 1 .27 1 982 6 . 80± 1 .29 3 .65 ± 1 . 1 5
C + 1 1 980 5 . 1 8 ± 1 .48 5 . 56 6 .00±0 .94 5 . 3 1 1 98 1 4.26±0.82 4 .97 ± 0.72 1 982 7 .24± 1 .64 4 .95 ± 0.92
C + 2 1 980 1 .94± 1 .07 1 .9 1 0 .93 ± 0.45 1 . 73 1 98 1 2 .21 ± 0.65 2 . 38± 0.90 1 982 1 . 57±0.52 1 . 88±0. 64
stem weight c 1 980 3 .98 ± 1 . 14 3 . 1 1 3 .4 1 ± 1 .40 3 .06
1 98 1 2 .27±0.52 3 .74±0.70 1 982 3 .09±0.72 2.02 ±0.82
C + l 1 980 n .d . 3 . 3 1 n .d . 3 .20 1981 1 .98±0.47 3 .60±0.75 1982 4 .63 ± 1 .32 2 .79 ± 0 .63
C + 2 1 980 n .d . 1 .79 n .d . 2.73 1981 1 . 34±0.36 2 .79 ± 1 .29 1 982 2 .24 ±0.60 2 .66 ± 1 .66
C + 3 1 980 n .d . 0 .72 n .d . 0 .36 1981 0 .63 ± 0.28 0 .22 ± 0. 1 8 1 982 0 .80±0.38 0. 5 1 ±0 .23
� C + 4 1 980 n.d . 0 .41 n .d . 0 .09 1 98 1 0.75 ±0.50 0 1 982 0.07 ±0.07 0. 1 8 ±0 . 1 2
A cta Phytogeogr. Suec. 74
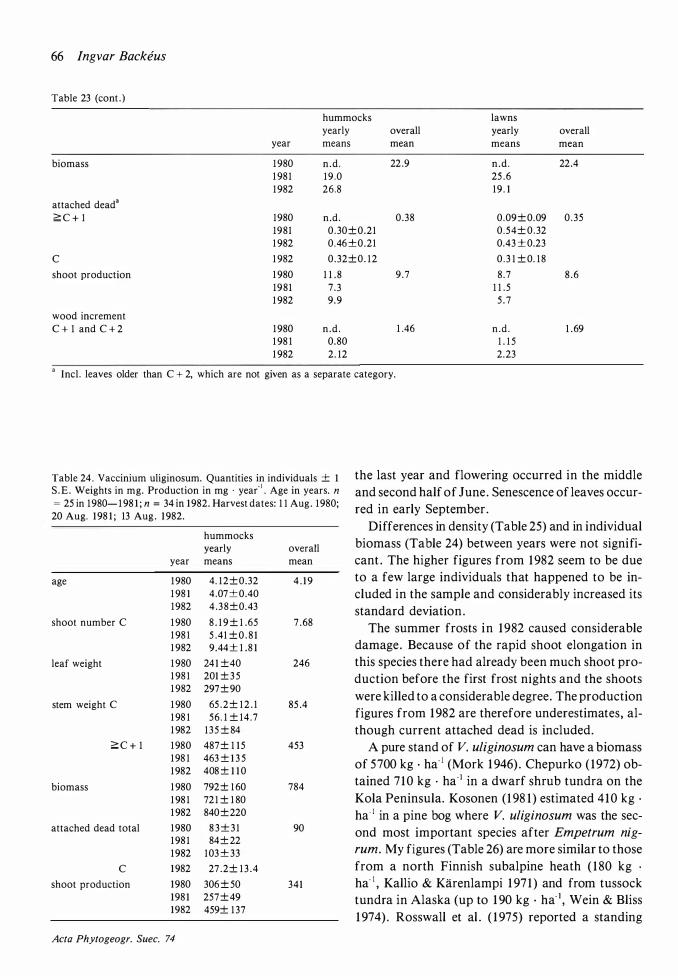
66 lngvar Backeus
Table 23 (cont . )
hummocks lawns yearly overall yearly overall
year means mean means mean
biomass 1 980 n.d . 22 .9 n.d . 22 .4
1 98 1 1 9 .0 25 . 6
1 982 26.8 1 9 . 1
attached dead" 2:: C + l 1 980 n.d. 0.38 0.09 ± 0. 09 0 . 3 5
1981 0 . 30 ± 0. 2 1 0 . 5 4 ± 0 . 32
1 982 0 .46 ± 0 . 2 1 0.43 ± 0.23
c 1 982 0 . 32 ± 0 . 1 2 0 . 3 1 ± 0. 1 8
shoot production 1 980 1 1 . 8 9 .7 8 .7 8 . 6
1 9 8 1 7 . 3 1 1 . 5
1 982 9.9 5 . 7
wood increment C + 1 and C + 2 1 980 n.d . 1 .46 n.d . 1 . 69
1 98 1 0.80 1 . 1 5
1 982 2. 1 2 2.23
" Incl. leaves older than C + 2, which are not given as a separate category.
Table 24 . Vaccinium uliginosum. Quantities in individuals ± 1
S .E . Weights in mg. Production in mg · yea{1 • Age in years. n = 25 in 1 980- 1 98 1 ; n = 34 in 1 982. Harvest dates: 1 1 Aug. 1 980;
20 Aug. 1 98 1 ; 13 Aug . 1 982.
hummocks yearly overall
year means mean
age 1 980 4. 1 2 ± 0 .32 4 . 1 9
1 98 1 4.07 ± 0.40
1 982 4 . 3 8 ± 0.43
shoot number C 1 980 8 . 1 9 ± 1 .65 7 . 68
1 98 1 5 . 41 ± 0 . 8 1
1 982 9.44 ± 1 . 8 1
leaf weight 1 980 24 1 ± 40 246
1 98 1 201 ± 3 5
1 982 297 ± 90
stem weight C 1 980 65 . 2 ± 1 2 . 1 85 .4
1 98 1 5 6 . 1 ± 1 4 . 7
1 982 1 3 5 ± 84
2:: C + 1 1 980 487 ± 1 1 5 453
1 98 1 463 ± 1 3 5
1 982 408 ± 1 1 0
biomass 1 980 792 ± 1 60 784
1 98 1 72 1 ± 1 80
1 982 840 ± 220
attached dead total 1 980 8 3 ± 3 1 90
1 98 1 84± 22
1 982 1 03 ± 3 3
c 1 982 27 . 2 ± 1 3 . 4
shoot production 1 980 306 ± 50 341
1 98 1 257 ± 49
1 982 459± 1 37
Acta Phytogeogr. Suec. 74
the last year and flowering occurred in the middle and second half of June . Senescence of leaves occurred in early September .
Differences in density (Table 25) and in individual biomass {Table 24) between years were not significant . The higher figures from 1 982 seem to be due to a few large individuals that happened to be included in the sample and considerably increased its standard deviation .
The summer frosts in 1 982 caused considerable damage. Because of the rapid shoot elongation in this species there had already been much shoot production before the first frost nights and the shoots were killed to a considerable degree. The production figures from 1 982 are therefore underestimates, although current attached dead is included.
A pure stand of V. uliginosum can have a biomass of 5700 kg · ha- 1 (Mork 1 946) . Chepurko ( 1972) obtained 7 1 0 kg · ha- 1 in a dwarf shrub tundra on the Kola Peninsula. Kosonen ( 1 98 1 ) estimated 410 kg ·
ha- 1 in a pine bog where V. uliginosum was the second most important species after Empetrum nig
rum. My figures {Table 26) are more similar to those from a north Finnish subalpine heath ( 1 80 kg ·
ha- 1 , Kallio & Karenlampi 1 97 1 ) and from tussock tundra in Alaska (up to 1 90 kg · ha- 1 , Wein & Bliss 1 974) . Rosswall et al . ( 1 975) reported a standing

Production and growth dynamics of vascular bog plants 67
crop of 1 30 kg · ha-1 on the subalpine Stordalen mire.
The yearly production constituted 40-50 OJo of the biomass on the SkattlOsberg Stormosse. Figures in the literature range from 21 to 36 % on mineral soil (Mork 1 946, Kallio & Karenlampi 1 97 1 , Kallio 1 975 , Karlsson 1 982) . In the Stordalen mire the percentage was 40. The reason for the higher per-
centage on peat is evidently the moss growth that successively rejuvenates the visible aboveground part of the population .
The green biomass was 30-50 % o f the total aboveground biomass. Figures from mineral soil are naturally lower (2 1 % , Kallio 1 97 5 ; 1 7 % , M or k 1 946; 1 2 % , Chepurko 1 972) .
Acta Phytogeogr. Suec. 74
Field layer density, biomass and production
Discussion on methods
One of the purposes of my investigation was to test the applicability of the individual plant method in a mire ecosystem . The method has been commonly used for estimates of biomass and production of the shrub and tree layer . Its applicability within the field layer has been discussed by T. Traczyk ( 1 967a, b) , Brechtl & Kubicek ( 1 968) , Kubicek & Brechtl ( 1 970) and Aulak ( 1970) . The method can hardly be applied in all kinds of vegetation. In species-rich communities the harvesting and processing of an adequate number of individuals would be very time consuming, unless a substantial number of them are so rare that they can be omitted . On the other hand , separation to species level in the harvest method is also very laborious .
Another problem is how to distinguish individuals . Genets , i . e. real genetic individuals , can seldom be distinguished in closed vegetation. The operational definition of an individual as the unit (ramet) obtained when a plant is cut at ground level or at the first adventitious root , is sometimes also difficult to apply. In prostrate species , where individuals may intermingle in mats , it is necessary to count and harvest other 'plant units' (Williams 1 964) than apparent individuals . In my case this was done without much difficulty. In other kinds of vegetation, e .g . in grasslands , where several similar species of prostrate grasses may predominate, it is perhaps impossible to apply the method .
In vegetation where it can be applied the individual plant method has several advantages :
Standard errors in figures for production and biomass from quadrat harvesting are often very large and it is often too laborious to harvest a sufficient number of quadrats in order to reduce the standard error . This problem has been discussed by, e .g . Sonesson & Bergman ( 1 972, 1 980) . The variation in biomass from one square to another , however , can be regarded as being composed of two main variables : the variation in density and the variation in
A cta Phytogeogr. Suec. 74
the individual weight of each single species . In the individual plant method only the latter kind of variation is investigated through harvesting . The variation in density is studied through counting , which is much less time-consuming . This means both less work and more detailed information about the study object .
Production estimated with the difference method does not account for the flux within the plant or the population . Very rapid growth may give zero net production if old parts are lost at the same speed (cf. Noble et al . 1 979) .
The individual plant method also enables the work to be adjusted in various ways to the different species involved :
1 . The number of squares for density determination and the number of harvested individuals may be chosen for each species so that the standard error is kept fairly low . In this way work input is further minimized .
2. The quadrat size may be chosen separately for each species depending on its size , frequency and pattern. In practise the quadrat size for a particular species was a compromise between the wish not to have a large number of units per square that were too difficult to grasp and the wish to avoid a large number of empty quadrats .
3 . The time for counting and harvesting can also be chosen separately for each species . It is therefore not necessary to make the compromises that are unavoidable when the peak biomass of the whole community is to be determined .
Repeated sampling is also made easier . The counting can be done repeatedly in the same quadrats , thus reducing random variation between samplings . When no differences in density are expected over time the renewed counting may be omitted and the field work is then reduced to collection of the required number of individuals .
The information obtained on density and individual weight is of course of interest per se. The greatly reduced amount of collected material also makes it easier to manage a more detailed fractioning . It is
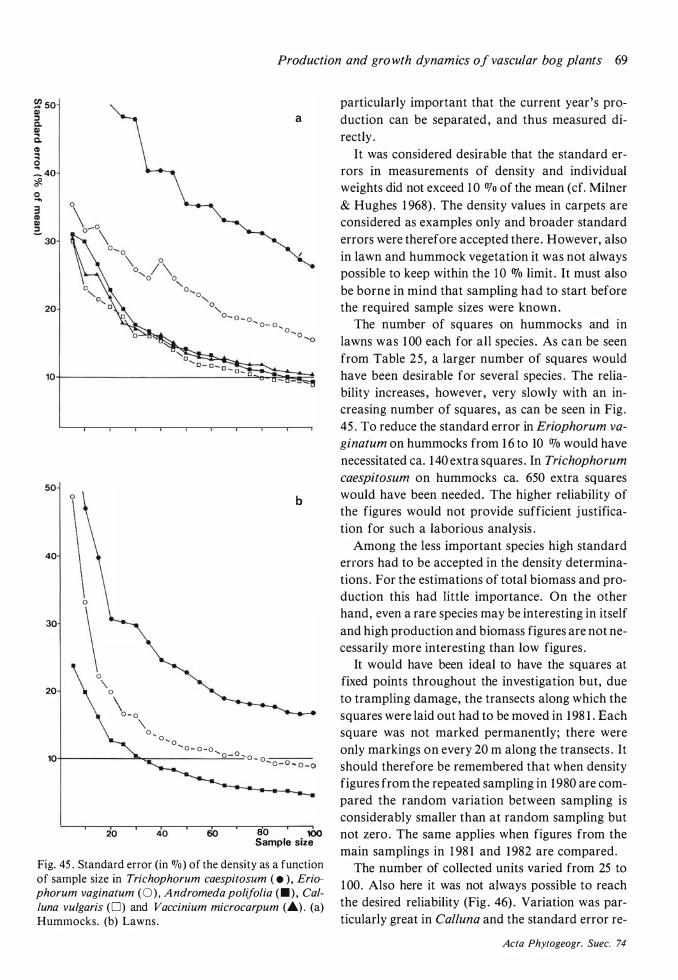
Production and growth dynamics of vascular bog plants 69
� 50 Q) ::I Q. Q) a. � a :. 4o cf. 0 ....
50
40
30
20
10
0 '\ 0
\ O - o
20
\ o , o
..... o ......
40
a
b
o - o - o ' o - O ' o - o --=--- o - 0 - o - o
60 80 100 Sample size
Fig. 45 . Standard error (in OJo) of the density as a function of sample size in Trichophorum caespitosum ( • ) , Eriophorum vaginatum (0) , A ndromeda polifolia (•). Calluna vulgaris ( D ) and Vaccinium microcarpum (£) . (a) Hummocks. (b) Lawns .
particularly important that the current year's production can be separated , and thus measured directly .
It was considered desirable that the standard errors in measurements of density and individual weights did not exceed 1 0 OJo of the mean (cf. Milner & Hughes 1 968) . The density values in carpets are considered as examples only and broader standard errors were therefore accepted there . However, also in lawn and hummock vegetation it was not always possible to keep within the 1 0 OJo limit . It must also be borne in mind that sampling had to start before the required sample sizes were known.
The number of squares on hummocks and in lawns was 1 00 each for all species . As can be seen from Table 25 , a larger number of squares would have been desirable for several species . The reliability increases , however , very slowly with an increasing number of squares , as can be seen in Fig . 45 . To reduce the standard error in Eriophorum va
ginatum on hummocks from 1 6 to 10 OJo would have necessitated ea. 1 40 extra squares . In Trichophorum
caespitosum on hummocks ea. 650 extra squares would have been needed. The higher reliab.ility of the figures would not provide sufficient justification for such a laborious analysis .
Among the less important species high standard errors had to be accepted in the density determinations . For the estimations of total biomass and production this had little importance. On the other hand, even a rare species may be interesting in itself and high production and biomass figures are not necessarily more interesting than low figures .
It would have been ideal to have the squares at fixed points throughout the investigation but, due to trampling damage, the transects along which the squares were laid out had to be moved in 1 98 1 . Each square was not marked permanently; there were only markings on every 20 m along the transects . It should therefore be remembered that when density figures from the repeated sampling in 1 980 are compared the random variation between sampling is considerably smaller than at random sampling but not zero . The same applies when figures from the main samplings in 1 98 1 and 1 982 are compared.
The number of collected units varied from 25 to 1 00 . Also here it was not always possible to reach the desired reliability (Fig . 46) . Variation was particularly great in Calluna and the standard error re-
Acta Phytogeogr. Suec. 74
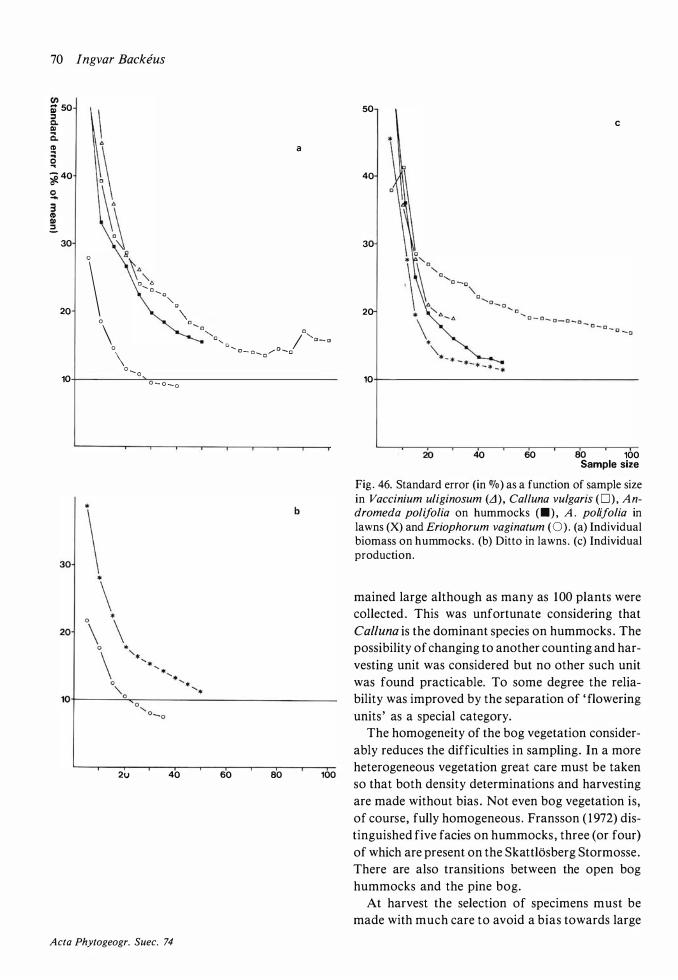
70 Ingvar Backeus
C/) ; 50 I :I Q. Cl a.
t.
� .\ � � 40
0 .... X 3 CD Cl � 2.
30
0 R
\ �t." " t.
..... " ..... "
" 20
" \ 0
\ 0
\ 10
0 ..._ 0 o - o - o
2u 40
A cta Phytogeogr. Suec. 74
a
" ..... "
;""' " - "
"' " ' u ......, D - o -. a / o -...o
60 80 100
50
40
30
20
10
20 40 60
c
80 100 Sample size
Fig . 46. Standard error (in 07o) as a function of sample size in Vaccinium uliginosum (LI ), Calluna vulgaris ( D ) , Andromeda polifolia on hummocks (•) . A . polifolia in lawns (X) and Eriophorum vaginatum (0) . (a) Individual biomass on hummocks . (b) Ditto in lawns . (c) Individual production.
mained large although as many as 100 plants were collected. This was unfortunate considering that Calluna is the dominant species on hummocks . The possibility of changing to another counting and harvesting unit was considered but no other such unit was found practicable. To some degree the reliability was improved by the separation of ' flowering units ' as a special category.
The homogeneity of the bog vegetation considerably reduces the difficulties in sampling. In a more heterogeneous vegetation great care must be taken so that both density determinations and harvesting are made without bias . Not even bog vegetation is , of course, fully homogeneous . Fransson ( 1 972) distinguished five fades on hummocks , three (or four) of which are present on the Skattlosberg Stormosse . There are also transitions between the open bog hummocks and the pine bog.
At harvest the selection of specimens must be made with much care to avoid a bias towards large
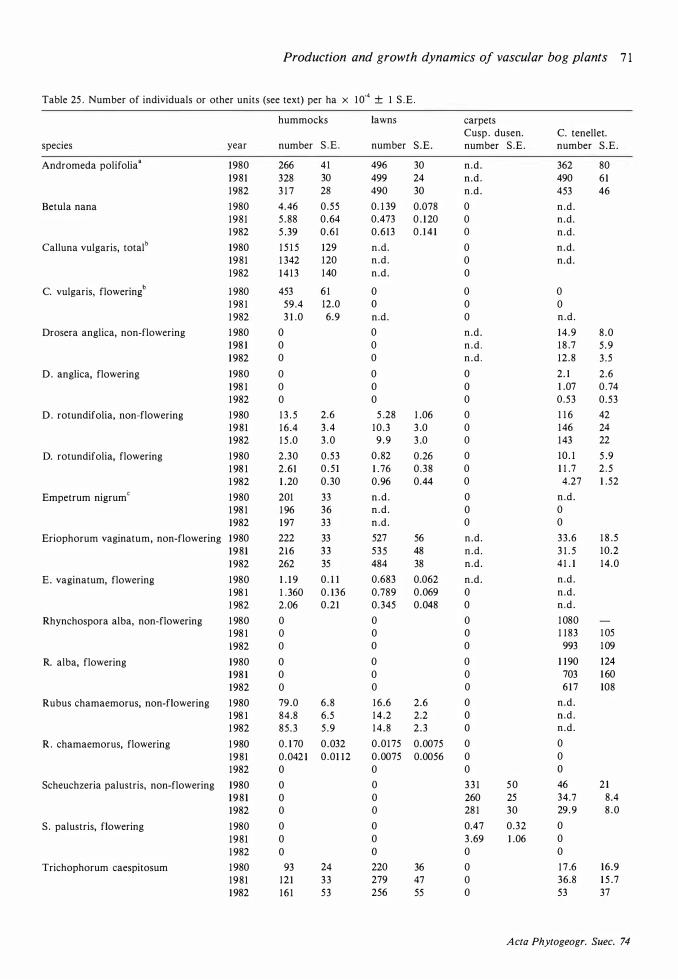
Production and growth dynamics of vascular bog plants 7 1
Table 25 . Number of individuals or other units (see text) per ha x 1 0-4 ± 1 S . E .
hummocks lawns carpets Cusp . dusen. C. tenellet.
species year number S . E . number S .E . number S .E . number S .E .
Andromeda polifolia" 1 980 266 4 1 496 30 n .d . 362 80
1 9 8 1 328 30 499 24 n .d . 490 6 1
1 982 3 1 7 28 490 30 n .d . 453 46
Betula nana 1 980 4. 46 0 . 5 5 0. 1 39 0.078 0 n.d . 1 9 8 1 5 . 88 0 . 64 0.473 0 . 1 20 0 n.d . 1 982 5 . 39 0 . 6 1 0 . 6 1 3 0 . 1 4 1 0 n.d .
Calluna vulgaris, totalb 1 980 1 5 1 5 1 29 n.d . 0 n.d . 1 9 8 1 1 342 1 20 n.d . 0 n.d. 1 982 1 4 1 3 1 40 n.d . 0
C. vulgaris, flowering b 1 980 453 6 1 0 0 0
1 98 1 59.4 12.0 0 0 0
1 982 3 1 . 0 6 .9 n.d. 0 n.d .
Drosera anglica, non-flowering 1 980 0 0 n.d . 1 4 . 9 8 . 0
1 98 1 0 0 n .d . 1 8 .7 5 . 9
1 982 0 0 n .d . 1 2 . 8 3 . 5
D . anglica, flowering 1 980 0 0 0 2 . 1 2.6
1 98 1 0 0 0 1 .07 0 . 74
1 982 0 0 0 0 .53 0 .53
D . rotundifolia, non-flowering 1 980 1 3 . 5 2.6 5 .28 1 .06 0 1 1 6 42
1 9 8 1 1 6 .4 3 . 4 1 0 . 3 3 .0 0 1 46 24
1 982 1 5 .0 3 . 0 9 . 9 3 .0 0 1 43 22
D. rotundifolia, flowering 1 980 2.30 0.53 0 . 82 0.26 0 1 0 . 1 5 .9
1 98 1 2 . 6 1 0 . 5 1 1 . 76 0 . 3 8 0 1 1 .7 2 . 5
1 982 1 . 20 0 . 30 0.96 0.44 0 4.27 1 . 52
Empetrum nigrum c 1 980 201 33 n .d . 0 n .d . 1 98 1 1 96 36 n.d . 0 0
1 982 1 97 33 n .d . 0 0
Eriophorum vaginatum, non-flowering 1 980 222 33 527 56 n.d . 3 3 . 6 1 8 . 5
1 9 8 1 2 1 6 3 3 5 3 5 48 n.d . 3 1 . 5 1 0 . 2
1 982 262 35 484 38 n .d . 4 1 . 1 1 4 . 0
E. vaginatum, flowering 1 980 1 . 1 9 0 . 1 1 0.683 0.062 n.d . n .d . 1 98 1 1 . 360 0 . 1 3 6 0.789 0.069 0 n .d . 1 982 2 . 06 0 . 2 1 0 . 345 0.048 0 n .d .
Rhynchospora alba, non-flowering 1 980 0 0 0 1 080
1 98 1 0 0 0 1 1 83 1 05
1 982 0 0 0 993 1 09
R. alba, flowering 1 980 0 0 0 1 1 90 1 24
1 98 1 0 0 0 703 1 60
1 982 0 0 0 6 1 7 108
Rubus chamaemorus, non-flowering 1 980 79 .0 6 . 8 1 6 .6 2.6 0 n .d . 1 98 1 84.8 6.5 1 4 . 2 2.2 0 n .d . 1 982 8 5 . 3 5 . 9 1 4 . 8 2 . 3 0 n.d .
R . chamaemorus, flowering 1 980 0 . 1 70 0 . 032 0 . 0 1 75 0 .0075 0 0
1 9 8 1 0 .042 1 0 .01 1 2 0 . 0075 0.0056 0 0
1 982 0 0 0 0
Scheuchzeria palustris, non-flowering 1 980 0 0 3 3 1 5 0 46 2 1
1 9 8 1 0 0 260 25 34.7 8.4
1 982 0 0 28 1 30 29 . 9 8 . 0
S . palustris, flowering 1 980 0 0 0.47 0 .32 0
1 9 8 1 0 0 3 .69 1 .06 0
1 982 0 0 0 0
Trichophorum caespitosum 1 980 93 24 220 36 0 1 7 .6 1 6 . 9
1 9 8 1 1 2 1 3 3 279 47 0 36.8 1 5 . 7
1 982 1 6 1 5 3 256 55 0 53 37
A cta Phytogeogr. Suec. 74

72 lngvar Backeus
Table 25 (cont . )
hummocks lawns carpets Cusp. dusen. C. tenellet.
species year number S .E. number S .E . number S .E . number S .E.
Vaccinium microcarpum d 1 980 353 59 2 1 .6 1 4 . 5 0 n.d . 1 98 1 326 34 1 27 34 0 n.d. 1 982 270 29 8 7 . 5 1 9 . 2 0 n.d .
V . oxycoccosd 1 980 1 43 . 4 1 9. 7 1 5 1 . 0 1 5 . 5 n.d . 60 30
1 98 1 309 35 24 1 23 n.d . 1 1 7 . 3 1 7 . 6
1 982 1 79 23 1 66 20 n .d . 84 20
V. uliginosum 1 980 2 8 . 2 9 . 5 0 0 0
1 98 1 1 5 . 0 4. 1 n.d . 0 0
1 982 1 5 . 0 3 . 5 n.d . 0 0
a c shoots in 1 980, individuals in 1 98 1 -8 2 .
b C + 3 with attached younger shoots in 1 980-8 1 . C + 2 shoots with attached younger shoots in 1 98 2 .
c C shoots in 1 980, C + I shoots with attached C shoots in 1 98 1 -82.
d Apical ends in 1 980, C shoots in 1 98 1 -8 2 .
n.d . Not determined but small.
plants . To choose the closest plants to regularly spaced points is not enough . A specified spot on the plant must be chosen, e .g . the closest stem base or the closest shoot tip .
When production is to be measured at short intervals random sampling is difficult to apply because the small weight increments may be overshadowed by the random variation . Instead , length growth offers itself as a rapid and accurate method. It is the only way to determine when growth starts and ends and also the growth rate and its dependence on daily temperature. Only a part of the total shoot production is measured in this way. Because of lignification and secondary cell wall formation and other processes, there is not likely to be a linear relationship between length growth and production . The radial growth in already existing stems is much more difficult to estimate . My estimates of wood increment in Betula nana and Calluna were based on the assumption that the increment is similar throughout the plant . This is not necessarily the case, and especially not in the profusely branched dwarf shrub Calluna.
Density
The density of ' individuals' or 'units ' of each species has been discussed previously . A compilation of all density data is given in Table 25 .
There are no trends in density variation over the
A cta Phytogeogr. Suec. 74
three investigated years . Cases of significant differences are quite few . A rapid increase in density of any species is not to be expected in a community where the whole surface is already occupied by plants and where nearly all propagation is vegetative. Sudden reductions in density would have been less surprising . The frost in June 1 982 killed many shoots of Andromeda, Vaccinium microcarpum, V.
oxycoccos and Rubus chamaemorus but either the killed shoots were fewer than seemed to be the case at a visual inspection or they were replaced by new shoots. As discussed under the respective species , the latter explanation seems more likely .
During the course of the work it soon became obvious that spatial patterns on various levels occurred in many species . The collected data are not suitable for discussions on this subject . A more thorough investigation in this field would probably be rewarding.
Mean total aboveground biomass and production
Results
Figures on aboveground biomass and production of all investigated species based on figures on density and individual biomass are summarised in Table 26.
' Shoot production' denotes production of current
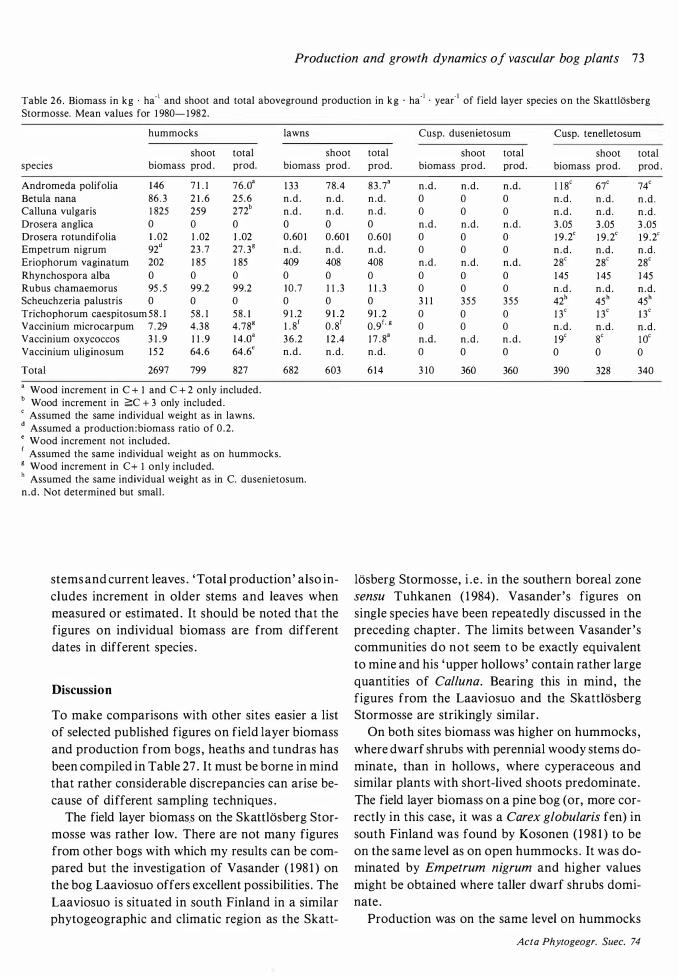
Production and growth dynamics of vascular bog plants 73
Table 2 6 . Biomass in kg · ha· ' and shoot and total aboveground production in kg · ha·' · year· ' of field layer species on the Skattlosberg Stormosse. Mean values for I 980- I 98 2 .
hummocks lawns
shoot total shoot species biomass prod . prod. biomass prod .
Andromeda polifolia 1 46 7 L I 76_o•
1 33 78 .4
Betula nana 86 . 3 2 1 .6 2 5 . 6 n.d . n .d . Calluna vulgaris I 825 259 272
b n .d . n .d . Drosera anglica 0 0 0 0 0
Drosera rotundifolia 1 . 02 1 . 02 1 .02 0.60 I 0.60 1
Empetrum nigrum 92d
23 . 7 27 . 3g n .d . n .d . Eriophorum vaginatum 202 I 85 I 85 409 408
Rhynchospora alba 0 0 0 0 0
Rubus chamaemorus 95 . 5 99.2 99.2 I 0 . 7 I l . 3
Scheuchzeria palustris 0 0 0 0 0
Trichophorum caespitosum 58 . 1 58 . 1 58 . 1 9 1 .2 9 1 . 2
Vaccinium microcarpum 7 . 29 4.38 4 .78g 1 . 8f
0 . 8f
Vaccinium oxycoccos 3 1 . 9 1 1 . 9 1 4 .o• 3 6 . 2 1 2 .4
Vaccinium uliginosum 1 5 2 64. 6 64 .6e n.d . n .d .
Total 2697 799 827 682 603
a Wood increment in C + I and C + 2 only included. b Wood increment in �C + 3 only included. c Assumed the same individual weight as in lawns. d Assumed a production:biomass ratio of 0 . 2 .
e Wood increment not included. r Assumed the same individual weight as on hummocks. 8 Wood increment in C+ I only included. h Assumed the same individual weight as in C. dusenietosum. n .d . Not determined but small .
stems and current leaves . 'Total production' also includes increment in older stems and leaves when measured or estimated . It should be noted that the figures on individual biomass are from different dates in different species .
Discussion
To make comparisons with other sites easier a list of selected published figures on field layer biomass and production from bogs , heaths and tundras has been compiled in Table 27 . It must be borne in mind that rather considerable discrepancies can arise because of different sampling techniques .
The field layer biomas.s on the SkattlOsberg Stormosse was rather low. There are not many figures from other bogs with which my results can be compared but the investigation of Vasander ( 1 98 1 ) on the bog Laaviosuo offers excellent possibilities . The Laaviosuo is situated in south Finland in a similar phytogeographic and climatic region as the Skatt-
Cusp. dusenietosum Cusp. tenelletosum
total shoot total shoot total prod. biomass prod. prod. biomass prod. prod .
8 3 . 73 n.d . n .d . n .d . l l t 67
c 74c
n.d . 0 0 0 n.d . n .d . n .d . n .d . 0 0 0 n.d . n .d . n .d . 0 n.d. n .d . n .d . 3 .05 3 .05 3 .05
0.60I 0 0 0 I 9 . 2c I 9 . 2c I 9 . 2c
n.d . 0 0 0 n.d . n .d . n .d . 408 n.d. n .d . n .d . 28"
28c
2t
0 0 0 0 1 45 I 45 I 45
1 1 . 3 0 0 0 n .d . n .d . n .d . 0 3 1 1 355 355 42
h 45
h 45
h
9 1 . 2 0 0 0 1 3c 1 3c 1 3c
0.9r. & 0 0 0 n.d . n .d . n .d .
1 7 . 83 n.d. n .d . n .d . 1 9c B
C l OC
n.d . 0 0 0 0 0 0
6 1 4 3 1 0 360 360 390 328 340
losberg Stormosse, i .e . in the southern boreal zone sensu Tuhkanen ( 1 984) . Vasander 's figures on single species have been repeatedly discussed in the preceding chapter . The limits between Vasander 's communities do not seem to be exactly equivalent to mine and his 'upper hollows' contain rather large quantities of Calluna. Bearing this in mind, the figures from the Laaviosuo and the Skattlosberg Stormosse are strikingly similar .
On both sites biomass was higher on hummocks , where dwarf shrubs with perennial woody stems dominate, than in hollows , where cyperaceous and similar plants with short-lived shoots predominate . The field layer biomass on a pine bog (or, more correctly in this case, it was a Carex globularis fen) in south Finland was found by Kosonen ( 198 1 ) to be on the same level as on open hummocks . It was dominated by Empetrum nigrum and higher values might be obtained where taller dwarf shrubs dominate .
Production was on the same level on hummocks
Acta Phytogeogr. Suec. 74
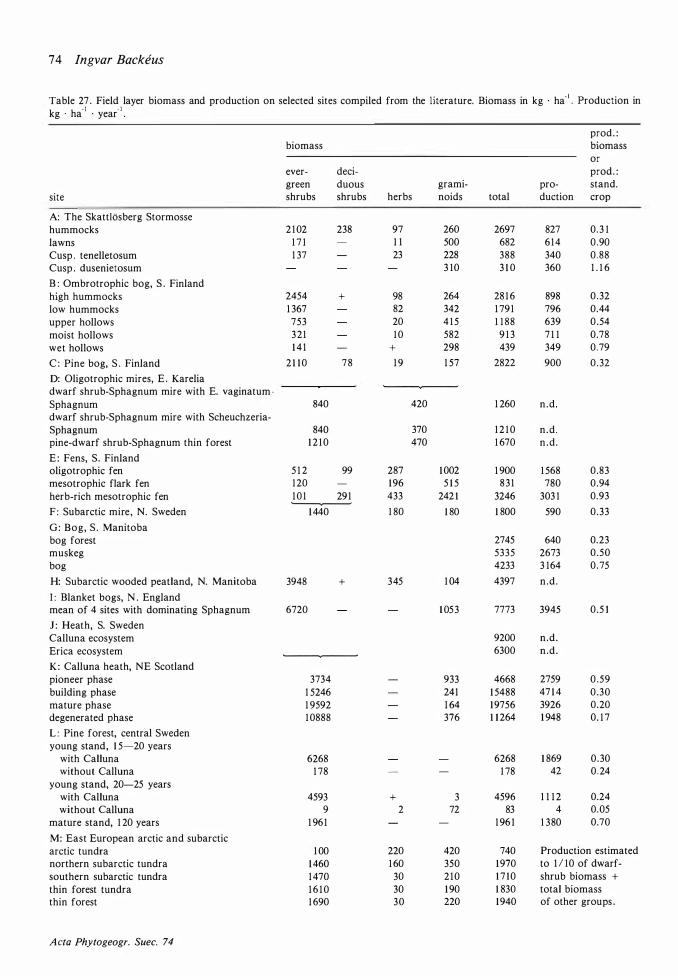
74 Ingvar Backeus
Table 27 . Field layer biomass and production on selected sites compiled from the literature. Biomass in kg · ha· ' . Production in kg · ha· ' · year" ' .
prod. : biomass biomass
or ever- deci- prod. : green duous grami- pro- stand.
site shrubs shrubs herbs noids total duction crop
A: The Skatt!Osberg Stormosse hummocks 2 1 02 238 97 260 2697 827 0 . 3 1
lawns 1 7 1 1 1 500 682 6 1 4 0 . 90
Cusp . tenelletosum 1 37 23 228 388 340 0.88
Cusp . dusenietosum 3 1 0 3 1 0 360 1 . 1 6
B : Ombrotrophic bog, S . Finland high hummocks 2454 + 98 264 28 1 6 898 0 . 32
low hummocks 1 367 82 342 1 79 1 796 0.44
upper hollows 7 5 3 20 4 1 5 1 1 8 8 639 0 . 54
moist hollows 3 2 1 1 0 582 9 1 3 7 1 1 0.78
wet hollows 1 4 1 + 298 439 349 0 . 79
C : Pine bog, S . Finland 2 1 1 0 7 8 1 9 1 57 2822 900 0 . 32
D: Oligotrophic mires, E . Karelia dwarf shrub-Sphagnum mire with E. vaginatum -Sphagnum 840 420 1 260 n.d . dwarf shrub-Sphagnum mire with Scheuchzeria-Sphagnum 840 370 1 2 1 0 n.d . pine-dwarf shrub-Sphagnum thin forest 1 2 1 0 470 1 670 n.d .
E : Fens, S . Finland oligotrophic fen 5 1 2 99 287 1 002 1 900 1 568 0 . 83
mesotrophic flark fen 1 20 1 96 5 1 5 8 3 1 780 0.94
herb-rich mesotrophic fen 1 0 1 29 1 433 242 1 3246 303 1 0.93
F : Subarctic mire, N. Sweden 1 440 1 80 1 80 1 800 590 0 . 3 3
G: Bog, S . Manitoba bog forest 2745 640 0.23
muskeg 5 3 3 5 2673 0.50
bog 4233 3 1 64 0 . 75
H: Subarctic wooded peatland, N. Manitoba 3948 + 3 45 1 04 4397 n.d .
1 : Blanket bogs, N . England mean of 4 sites with dominating Sphagnum 6720 1 05 3 7773 3945 0 . 5 1
J : Heath, S. Sweden Calluna ecosystem 9200 n.d . Erica ecosystem 6300 n.d .
K : Calluna heath, NE Scotland pioneer phase 3734 933 4668 2759 0 . 5 9
building phase 1 5246 24 1 1 5488 47 1 4 0.30
mature phase 1 9592 1 64 1 9756 3926 0.20
degenerated phase 1 0888 376 1 1 264 1 948 0. 1 7
L : Pine forest, central Sweden young stand, 1 5-20 years
with Calluna 6268 6268 1 869 0 . 30
without Calluna 1 78 1 78 42 0 . 24
young stand, 20-25 years with Calluna 4593 + 3 4596 1 1 1 2 0.24
without Calluna 9 2 72 83 4 0 . 05
mature stand, 1 20 years 1 96 1 1 96 1 1 3 80 0.70
M: East European arctic and subarctic arctic tundra 1 00 220 420 740 Production estimated northern subarctic tundra 1 460 1 60 350 1 970 to 1 / 10 of dwarf-southern subarctic tundra 1 470 30 2 1 0 1 7 10 shrub biomass + thin forest tundra 1 6 1 0 30 1 90 1 830 total biomass thin forest 1 690 3 0 220 1 940 of other groups .
A cta Phytogeogr. Suec. 74
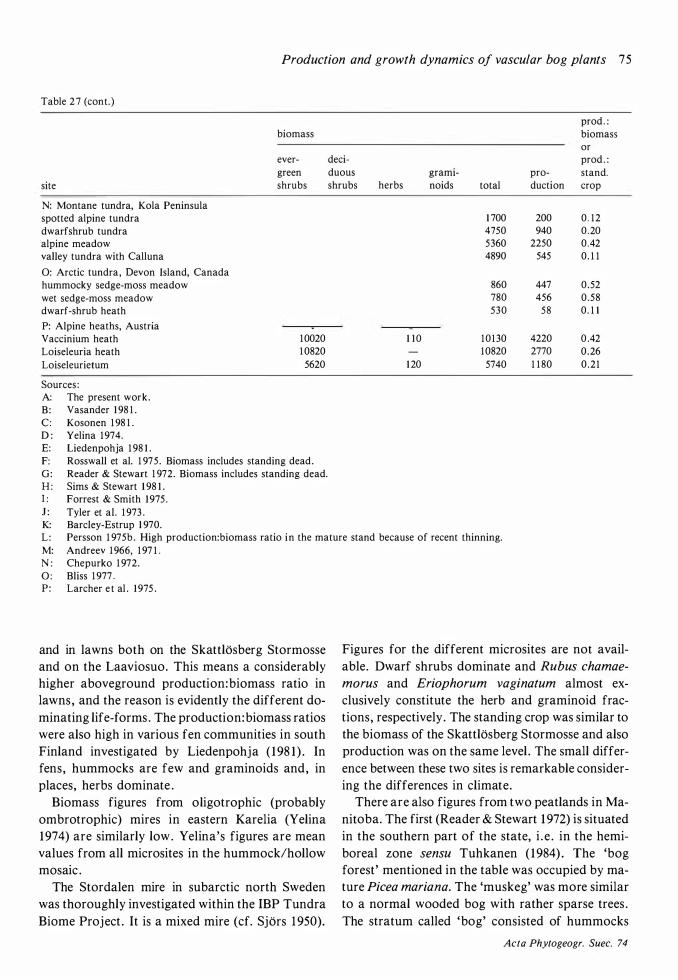
Production and growth dynamics of vascular bog plants 75
Table 2 7 (cont.)
site
N: Montane tundra, Kola Peninsula spotted alpine tundra dwarfshrub tundra alpine meadow valley tundra with Calluna
0: Arctic tundra, Devon Island, Canada hummocky sedge-moss meadow wet sedge-moss meadow dwarf-shrub heath P: Alpine heaths, Austria Vaccinium heath Loiseleuria heath Loiseleurietum
Sources : A: The present work . B : Vasander 1 98 1 . C : Kosonen 1 98 1 . D : Yelina 1 974. E: Liedenpohja 1 98 1 .
biomass
ever-green shrubs
1 0020 1 0820
5620
F: Rosswall et al. 1 975 . Biomass includes standing dead. G: Reader & Stewart 1 972. Biomass includes standing dead. H : Sims & Stewart 1 98 1 . 1 : Forrest & Smith 1 975 . J : Tyler et al. 1 973 . K: Barcley-Estrup 1 970.
deci-duous shrubs herbs
1 1 0
1 20
prod . : biomass or prod . :
grami- pro- stand. noids total ducti on crop
1 700 200 0 . 1 2 4750 940 0 .20 5360 2250 0 .42 4890 545 0 . 1 1
860 447 0 .52 780 456 0 .58 530 58 0 . 1 1
1 0 1 30 4220 0 .42 1 0820 2770 0 .26 5740 1 1 80 0 .2 1
L : Persson 1 975b . High production:biomass ratio in the mature stand because of recent thinning. M: Andreev 1 966, 1 97 1 . N : Chepurko 1 972. 0: Bliss 1 977 . P : Larcher e t al . 1 975 .
and in lawns both on the Skattlosberg Stormosse and on the Laaviosuo. This means a considerably higher aboveground production: biomass ratio in lawns , and the reason is evidently the different dominating life-forms . The production:biomass ratios were also high in various fen communities in south Finland investigated by Liedenpohja ( 1 98 1 ) . In fens , hummocks are few and graminoids and, in places, herbs dominate .
Biomass figures from oligotrophic (probably ombrotrophic) mires in eastern Karelia (Yelina 1 974) are similarly low . Yelina's figures are mean values from all microsites in the hummock/hollow mosaic .
The Stordalen mire in subarctic north Sweden was thoroughly investigated within the IBP Tundra Biome Project . It is a mixed mire (cf. Sjors 1 950).
Figures for the different microsites are not available. Dwarf shrubs dominate and Rubus chamae
morus and Eriophorum vaginatum almost exclusively constitute the herb and graminoid fractions , respectively. The standing crop was similar to the biomass of the Skattlosberg Stormosse and also production was on the same level . The small difference between these two sites is remarkable considering the differences in climate.
There are also figures from two peatlands in Manitoba. The first (Reader & Stew art 1 972) is situated in the southern part of the state, i . e . in the hemiboreal zone sensu Tuhkanen ( 1 984) . The 'bog forest' mentioned in the table was occupied by mature Picea mariana. The 'muskeg' was more similar to a normal wooded bog with rather sparse trees . The stratum called 'bog' consisted of hummocks
Acta Phytogeogr. Suec. 74
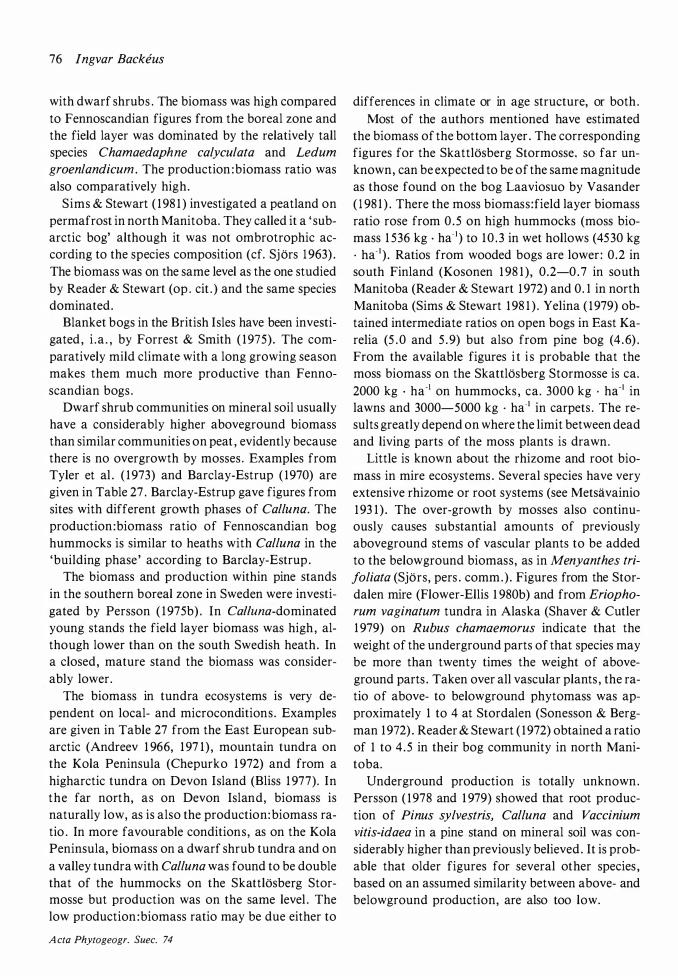
76 lngvar Backeus
with dwarf shrubs . The biomass was high compared to Fennoscandian figures from the boreal zone and the field layer was dominated by the relatively tall species Chamaedaphne calyculata and Ledum
groenlandicum . The production :biomass ratio was also comparatively high.
Sims & Stew art ( 1 98 1 ) investigated a peatland on permafrost in north Manitoba. They called it a ' subarctic bog' although it was not ombrotrophic according to the species composition (cf. Sjors 1 963) .
The biomass was on the same level as the one studied by Reader & Stew art ( op . cit . ) and the same species dominated.
Blanket bogs in the British Isles have been investigated , i . a . , by Forrest & Smith ( 1 975) . The comparatively mild climate with a long growing season makes them much more productive than Fennoscandian bogs .
Dwarf shrub communities on mineral soil usually have a considerably higher aboveground biomass than similar communities on peat , evidently because there is no overgrowth by mosses . Examples from Tyler et al . ( 1 973) and Barclay-Estrup ( 1970) are given in Table 27 . Barclay-Estrup gave figures from sites with different growth phases of Calluna. The production : biomass ratio of Fennoscandian bog hummocks is similar to heaths with Calluna in the 'building phase ' according to Barclay-Estrup .
The biomass and production within pine stands in the southern boreal zone in Sweden were investigated by Persson ( 1 97 5b) . In Calluna-dominated young stands the field layer biomass was high , although lower than on the south Swedish heath . In a closed, mature stand the biomass was considerably lower .
The biomass in tundra ecosystems is very dependent on local- and microconditions . Examples are given in Table 27 from the East European subarctic (Andreev 1 966, 1 97 1 ) , mountain tundra on the Kola Peninsula (Chepurko 1 972) and from a higharctic tundra on Devon Island (Bliss 1 977). In the far north, as on Devon Island, biomass is naturally low, as is also the production:biomass ratio . In more favourable conditions, as on the Kola Peninsula, biomass on a dwarf shrub tundra and on a valley tundra with Calluna was found to be double that of the hummocks on the Skattlosberg Stormosse but production was on the same level . The low production :biomass ratio may be due either to
A cta Phytogeogr. Suec. 74
differences in climate or in age structure, or both . Most of the authors mentioned have estimated
the biomass of the bottom layer . The corresponding figures for the Skattlosberg Stormosse. so far unknown, can be expected to be of the same magnitude as those found on the bog Laaviosuo by Vasander ( 1 98 1 ) . There the moss biomass: field layer biomass ratio rose from 0 . 5 on high hummocks (moss biomass 1 536 kg · ha- 1 ) to 1 0 . 3 in wet hollows (4530 kg · ha- 1 ) . Ratios from wooded bogs are lower : 0.2 in south Finland (Kosonen 1 98 1 ) , 0 .2-0.7 in south Manitoba (Reader & Stewart 1 972) and 0. 1 in north Manitoba (Sims & Stewart 1 98 1 ) . Yelina ( 1 979) obtained intermediate ratios on open bogs in East Karelia (5 .0 and 5 . 9) but also from pine bog (4 .6) .
From the available figures i t i s probable that the moss biomass on the Skattlosberg Stormosse is ea. 2000 kg · ha-1 on hummocks , ea. 3000 kg · ha-1 in lawns and 3000-5000 kg · ha-1 in carpets . The results greatly depend on where the limit between dead and living parts of the moss plants is drawn.
Little is known about the rhizome and root biomass in mire ecosystems . Several species have very extensive rhizome or root systems (see Metsavainio 1 93 1 ) . The over-growth by mosses also continuously causes substantial amounts of previously aboveground stems of vascular plants to be added to the belowground biomass, as in Menyanthes tri
foliata (Sjors, pers . comm.) . Figures from the Stordalen mire (Flower-Ellis 1 980b) and from Eriopho
rum vaginatum tundra in Alaska (Shaver & Cutler 1 979) on Rubus chamaemorus indicate that the weight of the underground parts of that species may be more than twenty times the weight of aboveground parts . Taken over all vascular plants , the ratio of above- to belowground phytomass was approximately 1 to 4 at Stordalen (Sonesson & Bergman 1 972) . Reader & Stewart ( 1 972) obtained a ratio of 1 to 4 .5 in their bog community in north Manitoba.
Underground production is totally unknown . Persson ( 1 978 and 1 979) showed that root production of Pinus sylvestris, Calluna and Vaccinium
vitis-idaea in a pine stand on mineral soil was considerably higher than previously believed . It is probable that older figures for several other species , based on an assumed similarity between above- and below ground production, are also too low.
Production and growth dynamics of vascular bog plants 77
The seasonal course of the total aboveground production and changes in the total above ground biomass
The seasonal course of production
Earlier I have presented results on the seasonal course of production in each of the treated species . In 1 980 I repeatedly harvested individuals of Cal
luna vulgaris (Fig. 1 2) , Eriophorum vaginatum
(Figs . 23-24), Rhynchospora alba (Figs . 29-30) and Rubus chamaemorus (Figs . 32-35) and also determined density as often as was considered necessary. These species were chosen as to represent different life-forms : a dwarf shrub , a perennial graminoid, a functional annual and a herb . In 1 98 1 I harvested leaves of Andromeda polifolia (Fig . 7) , Calluna (Fig . 1 1 ) , Empetrum nigrum (Fig. 1 6) and E. vaginatum (Fig . 25) in order to follow weight changes in perennial leaves . Material collected from Vaccinium oxycoccos was not processed because I found the sampling unsatisfactory. Length growth was followed on single shoots in 1 98 1 and/ or 1 982 inA ndromeda (not published), Betula nana (Fig . 9) , Calluna (Fig . 10) , Empetrum (Fig . 1 3) , Trichopho
rum caespitosum (Fig . 43) and V. oxycoccos (Fig. 44) . Length growth of leaves of E. vaginatum (Figs . 1 8 , 26-27) and Scheuchzeriapalustris (Figs . 36, 4 1 ) was similarly followed. Phenological notes were also made continuously (Fig. 6) .
All the mentioned data have been compiled in an attempt to follow the rate of total production in the hummock and lawn communities . Data from carpet communities were too incomplete to allow a similar treatment . The results are presented diagrammatically in Figs . 47 and 48 .
In lawns the total production was largely determined by E. vaginatum. This species represented two-thirds of the total production . There were two peaks in the production . The first was in June when the growth of E. vaginatum leaf blades was at its maximum, which also coincided with the shoot growth of all other lawn species . Later in the season the growth of E. vaginatum leaf blades gradually declined but in August there was a substantial weight increment in the leaf sheaths of this species . This, together with the late season weight increase in leaves and stems of A ndromeda, caused a second peak in the rate of total production .
O n hummocks E. vaginatum was less important but its continuous growth throughout the season still influenced the shape of the curve of the total production. The dwarf shrubs, especially Calluna,
were the most important constituents . Growth started simultaneously in late May in most species . B.
nana and Scheuchzeria were ea. 10 days earlier whereas the two graminoids E. vaginatum and T.
caespitosum started much earlier , seemingly as soon as the most superficial peat layer was free from frost .
As to new shoot formation all species , except E.
vaginatum, had their growth concentrated to June and , partly, July . This, together with the maximum of growth in leaf blades of E. vaginatum caused a sharp peak in the rate of production in June . In the latter part of August the winter-hardening of the leaves of the wintergreen dwarf shrubs and in the leaf sheaths of E. vaginatum caused another rise in production. At the same time the wood increment in Calluna and Andromeda stems commenced and it is here assumed that the other dwarf shrubs of Ericales also performed their wood increments at this time. These two simultaneous events caused a high late season peak in the rate of production .
The late season wood increment i n Calluna and Andromeda is a remarkable feature and is not , as far as I know, found in any trees . It ought to be investigated further. The autumn increase in leaf and stem weight is considerable . In Calluna my diagram (Fig . 47) shows a production in August twice as high as in June and July, although the real height of this peak is uncertain . Also the results of Grace & Woolhouse ( 1 973) show that more than half of the aboveground production in Calluna takes place after the middle of August .
Some of the measured weight increases might have been translocations from belowground tissues , but in this investigation it has not been possible to separate such translocations from real production.
Seasonal changes in biomass
The seasonal changes in aboveground biomass have not been followed systematically, since my main interest has been in production . For Eriophorum vagi
natum, Rhynchospora alba and Rubus chamaemo
rus the data from the repeated sampling in 1 980 provide information not only about production but
A cta Phytogeogr. Suec. 74
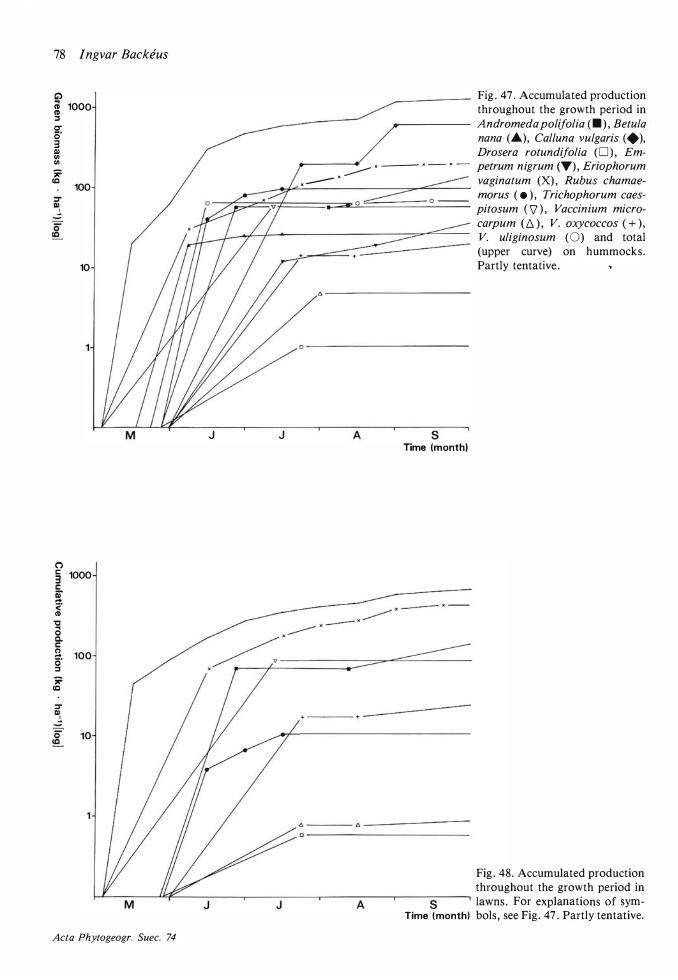
78 lngvar Backeus
Ci) � 1000 ;:, er s· 3 Q) VI VI ;? CQ
(")
100
10
3 1000 c: � c:· (I)
'tl a c. c: !l 100 c:r ;:, ;? CQ
M J J
Fig . 47 . Accumulated production throughout the growth period in Andromedapolifolia < • ) . Betula · nana (_.), Calluna vulgaris <+). Drosera rotundifolia (0) , Em-
------ • --- · - • - petrum nigrum (�) . Eriophorum
. --- • vaginatum (X) , Rubus chamae
A s Time (month)
------- + ---------------
morus ( • ) , Trichophorum caespitosum ( \7 ) , Vaccinium microcarpum (D. ) , V. oxycoccos ( + ) , V. uliginosum (0) and total (upper curve) on hummocks. Partly tentative .
Fig . 48. Accumulated production throughout the growth period in �---
M----��----J----�-----J----�------A----�-----5----� �wns . For exp�nations of �m-
Time (month) bols , see Fig. 47 . Partly tentative.
Acta Phytogeogr. Suec. 74
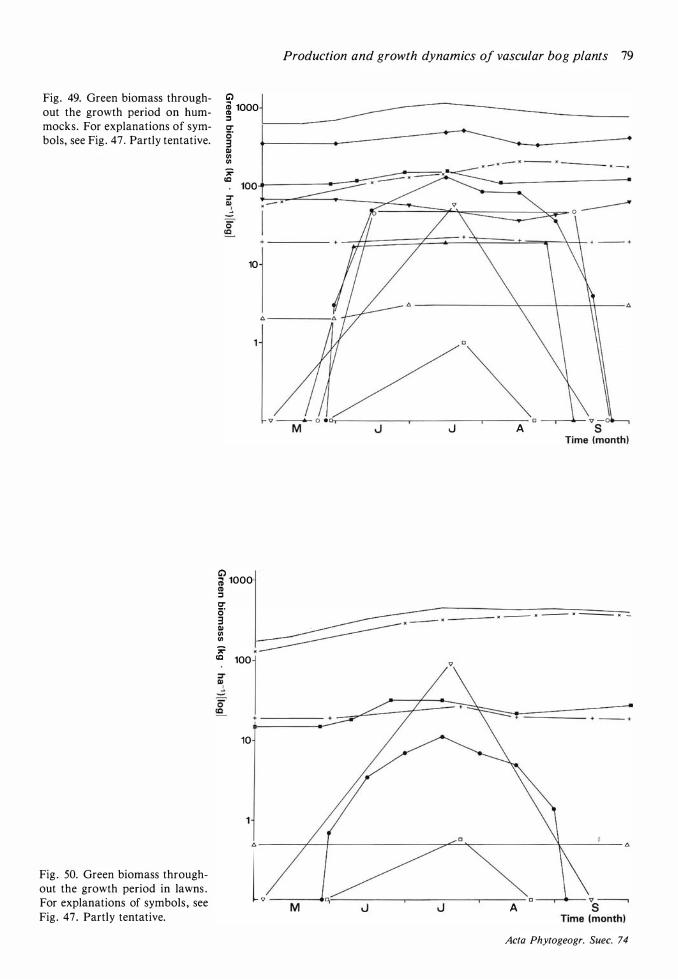
Fig. 49. Green biomass throughout the growth period on hummocks. For explanations of symbols, see Fig . 47. Partly tentative.
Fig . 50. Green biomass throughout the growth period in lawns . For explanations of symbols , see Fig . 47 . Partly tentative.
C) m 1000 :I C" s· 3 Ql (/) (/) ';? (Q
10
� 1000 CD :I C" s· 3 Ql (/) (/) ';? (Q 100
10
Production and growth dynamics of vascular bog plants 79
6 -----
J A
x -- x -- x --- x -
6-------+--4-----------------���------------+-----�-- 6
l . _____. ,::....______� A
Acta Phytogeogr. Suec. 74
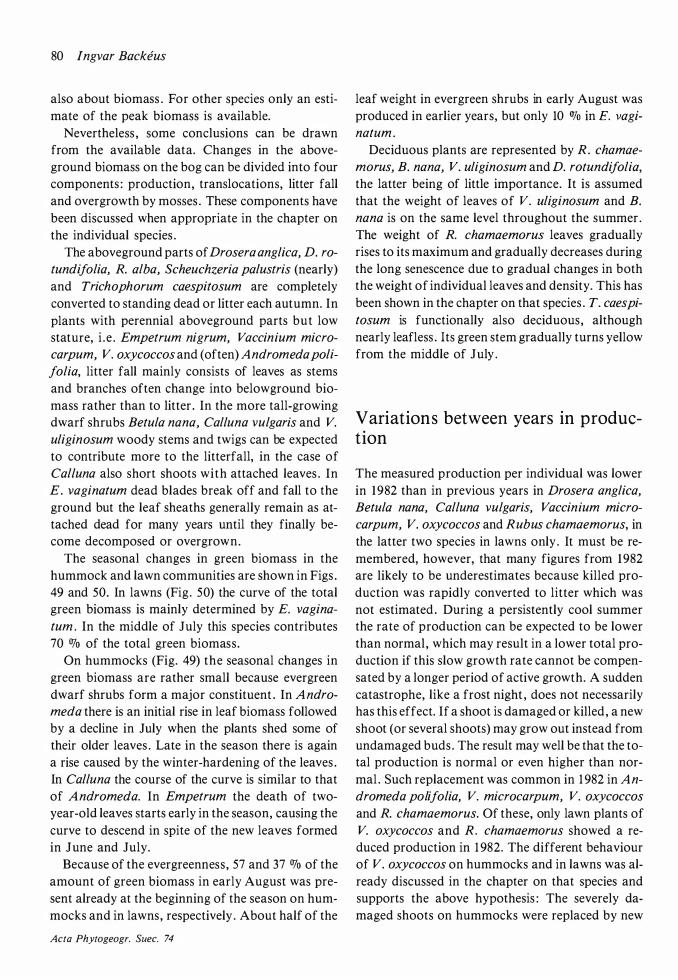
80 lngvar Backeus
also about biomass . For other species only an estimate of the peak biomass is available.
Nevertheless , some conclusions can be drawn from the available data. Changes in the aboveground biomass on the bog can be divided into four components : production, translocations, litter fall and overgrowth by mosses . These components have been discussed when appropriate in the chapter on the individual species .
The aboveground parts of Drosera anglica, D. ro
tundifolia, R. alba, Scheuchzeria palustris (nearly) and Trichophorum caespitosum are completely converted to standing dead or litter each autumn. In plants with perennial aboveground parts but low stature, i . e . Empetrum nigrum, Vaccinium micro
carpum, V. oxycoccos and (often) Andromeda poli
folia, litter fall mainly consists of leaves as stems and branches often change into belowground biomass rather than to litter . In the more tall-growing dwarf shrubs Betula nana, Calluna vulgaris and V.
uliginosum woody stems and twigs can be expected to contribute more to the litterfall, in the case of Calluna also short shoots with attached leaves . In E. vaginatum dead blades break off and fall to the ground but the leaf sheaths generally remain as attached dead for many years until they finally become decomposed or overgrown.
The seasonal changes in green biomass in the hummock and lawn communities are shown in Figs . 49 and 50. In lawns (Fig. 50) the curve of the total green biomass is mainly determined by E. vagina
turn . In the middle of July this species contributes 70 OJo of the total green biomass.
On hummocks (Fig. 49) the seasonal changes in green biomass are rather small because evergreen dwarf shrubs form a major constituent . In Andro
meda there is an initial rise in leaf biomass followed by a decline in July when the plants shed some of their older leaves . Late in the season there is again a rise caused by the winter-hardening of the leaves . In Calluna the course of the curve is similar to that of Andromeda. In Empetrum the death of twoyear-old leaves starts early in the season, causing the curve to descend in spite of the new leaves formed in June and July.
Because of the evergreenness , 57 and 37 OJo of the amount of green biomass in early August was present already at the beginning of the season on hummocks and in lawns, respectively . About half of the
Acta Phytogeogr. Suec. 74
leaf weight in evergreen shrubs in early August was produced in earlier years, but only 10 % in E. vagi
natum .
Deciduous plants are represented by R. chamae
morus, B. nana, V. uliginosum and D. rotundifolia,
the latter being of little importance. It is assumed that the weight of leaves of V. uliginosum and B.
nana is on the same level throughout the summer. The weight of R. chamaemorus leaves gradually rises to its maximum and gradually decreases during the long senescence due to gradual changes in both the weight of individual leaves and density. This has been shown in the chapter on that species . T. caespi
tosum is functionally also deciduous, although nearly leafless . Its green stem gradually turns yellow from the middle of July .
Variations between years in production
The measured production per individual was lower in 1 982 than in previous years in Drosera anglica,
Betula nana, Calluna vulgaris, Vaccinium micro
carpum, V. oxycoccos and Rubus chamaemorus, in the latter two species in lawns only . It must be remembered, however, that many figures from 1 982
are likely to be underestimates because killed production was rapidly converted to litter which was not estimated . During a persistently cool summer the rate of production can be expected to be lower than normal , which may result in a lower total production if this slow growth rate cannot be compensated by a longer period of active growth. A sudden catastrophe, like a frost night , does not necessarily has this effect. If a shoot is damaged or killed , a new shoot (or several shoots) may grow out instead from undamaged buds . The result may well be that the total production is normal or even higher than normal . Such replacement was common in 1 982 in An
dromeda polifolia, V. microcarpum, V. oxycoccos
and R. chamaemorus. Of these, only lawn plants of V. oxycoccos and R. chamaemorus showed a reduced production in 1 982. The different behaviour of V. oxycoccos on hummocks and in lawns was already discussed in the chapter on that species and supports the above hypothesis : The severely damaged shoots on hummocks were replaced by new
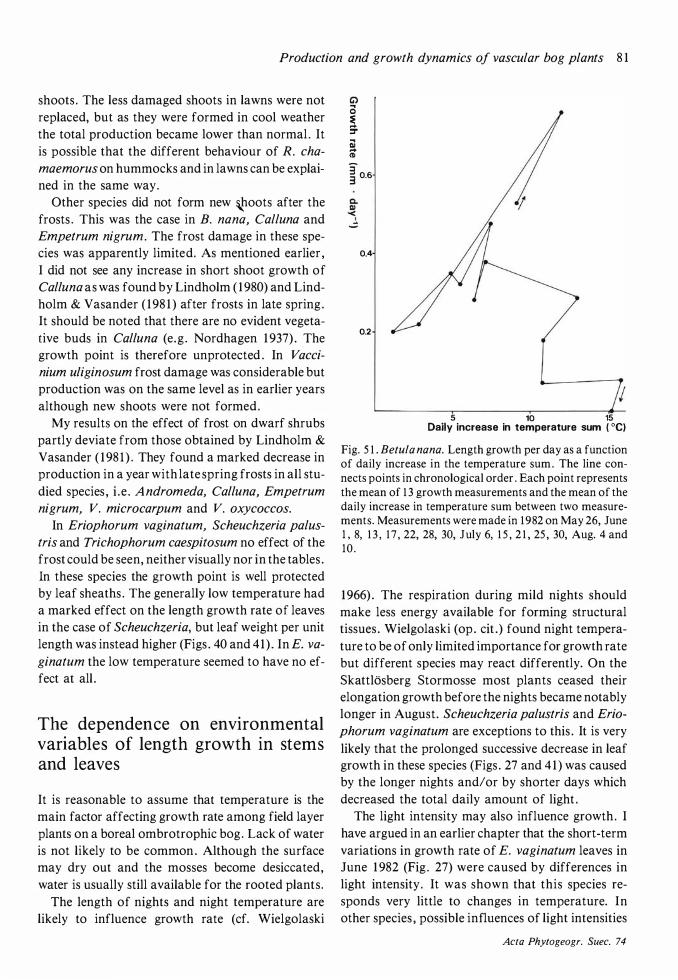
Production and growth dynamics of vascular bog plants 8 1
shoots . The less damaged shoots in lawns were not replaced, but as they were formed in cool weather the total production became lower than normal . It is possible that the different behaviour of R. cha
maemorus on hummocks and in lawns can be explained in the same way.
Other species did not form new \_hoots after the frosts . This was the case in B. nana, Calluna and Empetrum nigrum. The frost damage in these species was apparently limited. As mentioned earlier , I did not see any increase in short shoot growth of Calluna as was found by Lindholm ( 1 980) and Lindholm & Vasander ( 1 98 1 ) after frosts in late spring . It should be noted that there are no evident vegetative buds in Calluna (e.g . Nordhagen 1 937) . The growth point is therefore unprotected . In Vacci
nium uliginosum frost damage was considerable but production was on the same level as in earlier years although new shoots were not formed .
My results on the effect of frost on dwarf shrubs partly deviate from those obtained by Lindholm & Vasander ( 1 98 1 ) . They found a marked decrease in production in a year with late spring frosts in all studied species , i . e . Andromeda, Calluna, Empetrum
nigrum, V. microcarpum and V. oxycoccos.
In Eriophorum vaginatum, Scheuchzeria palus
tris and Trichophorum caespitosum no effect of the frost could be seen, neither visually nor in the tables . In these species the growth point is well protected by leaf sheaths . The generally low temperature had a marked effect on the length growth rate of leaves in the case of Scheuchzeria, but leaf weight per unit length was instead higher (Figs . 40 and 4 1 ) . In E. va
gina tu m the low temperature seemed to have no effect at all .
The dependence on environmental variables of length growth in stems and leaves
It is reasonable to assume that temperature is the main factor affecting growth rate among field layer plants on a boreal ombrotrophic bog . Lack of water is not likely to be common . Although the surface may dry out and the mosses become desiccated, water is usually still available for the rooted plants .
The length of nights and night temperature are likely to influence growth rate (cf. Wielgolaski
G) 0 � :r Cij ... CD
3 3 0.6
0.4
0.2
5 10 15 Daily increase in temperature sum ( °C)
Fig. 5 1 . Betula nana. Length growth per day as a function of daily increase in the temperature sum . The line connects points in chronological order . Each point represents the mean of 1 3 growth measurements and the mean of the daily increase in temperature sum between two measurements. Measurements were made in 1 982 on May 26, June 1 , 8, 1 3 , 1 7 , 22, 28, 30, July 6, 1 5 , 2 1 , 25 , 30, Aug. 4 and 10 .
1 966) . The respiration during mild nights should make less energy available for forming structural tissues . Wielgolaski (op . cit .) found night temperature to be of only limited importance for growth rate but different species may react differently. On the SkattlOsberg Stormosse most plants ceased their elongation growth before the nights became notably longer in August. Scheuchzeria palustris and Erio
phorum vaginatum are exceptions to this . It is very likely that the prolonged successive decrease in leaf growth in these species (Figs . 27 and 4 1 ) was caused by the longer nights and/ or by shorter days which decreased the total daily amount of light .
The light intensity may also influence growth . I have argued in an earlier chapter that the short-term variations in growth rate of E. vaginatum leaves in June 1 982 (Fig . 27) were caused by differences in light intensity . It was shown that this species responds very little to changes in temperature. In other species , possible influences of light intensities
Acta Phytogeogr. Suec. 74
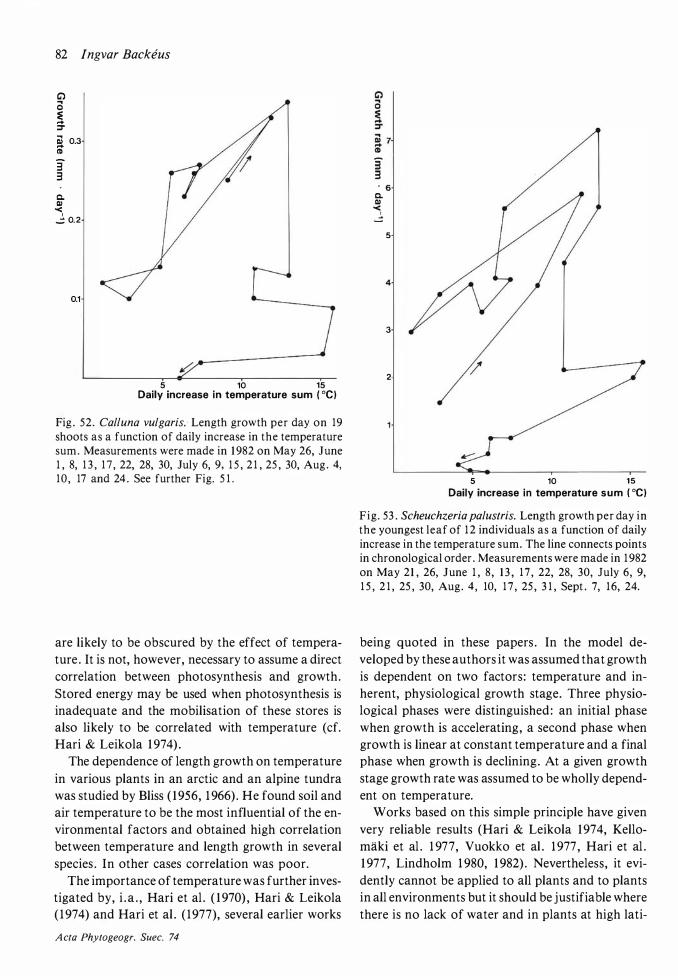
82 lngvar Backeus
G') 0 :E ... ::r ii) 0.3 ... �
3 3 c. D) < � 0.2
0.1
5 10 15 Daily increase in temperature sum ( °C)
Fig . 52. Calluna vulgaris. · Length growth per day on 19 shoots as a function of daily increase in the temperature sum . Measurements were made in 1 982 on May 26, June 1 , 8, 1 3 , 1 7 , 22, 28, 30, July 6, 9, 1 5 , 2 1 , 25 , 30, Aug. 4, 10 , 17 and 24 . See further Fig. 5 1 .
are likely to be obscured by the effect of temperature . It is not, however, necessary to assume a direct correlation between photosynthesis and growth. Stored energy may be used when photosynthesis is inadequate and the mobilisation of these stores is also likely to be correlated with temperature (cf. Hari & Leikola 1 974) .
The dependence of length growth on temperature in various plants in an arctic and an alpine tundra was studied by Bliss ( 1 956, 1 966) . He found soil and air temperature to be the most influential of the environmental factors and obtained high correlation between temperature and length growth in several species . In other cases correlation was poor.
The importance of temperature was further investigated by, i . a . , Hari et al . ( 1 970) , Hari & Leikola ( 1 974) and Hari et al . ( 1 977), several earlier works
A cta Phytogeogr. Suec. 74
3 3 . 6 c. D) < l
5
4
3
2 7
5 10 15 Daily increase in temperature sum ( °C)
Fig. 53 . Scheuchzeria palustris. Length growth per day in the youngest leaf of 1 2 individuals as a function of daily increase in the temperature sum. The line connects points in chronological order . Measurements were made in 1 982 on May 21 , 26, June 1 , 8 , 1 3 , 1 7 , 22, 28, 30, July 6, 9, 1 5 , 2 1 , 25 , 30, Aug . 4, 10, 1 7 , 25 , 3 1 , Sept . 7, 1 6, 24.
being quoted in these papers . In the model developed by these authors it was assumed that growth is dependent on two factors: temperature and inherent, physiological growth stage. Three physiological phases were distinguished : an initial phase when growth is accelerating, a second phase when growth is linear at constant temperature and a final phase when growth is declining. At a given growth stage growth rate was assumed to be wholly dependent on temperature.
Works based on this simple principle have given very reliable results (Hari & Leikola 1 974, Kellomaki et al . 1 977, Vuokko et al . 1 977 , Hari et al . 1 977, Lindholm 1 980, 1 982) . Nevertheless, it evidently cannot be applied to all plants and to plants in all environments but it should be justifiable where there is no lack of water and in plants at high lati-
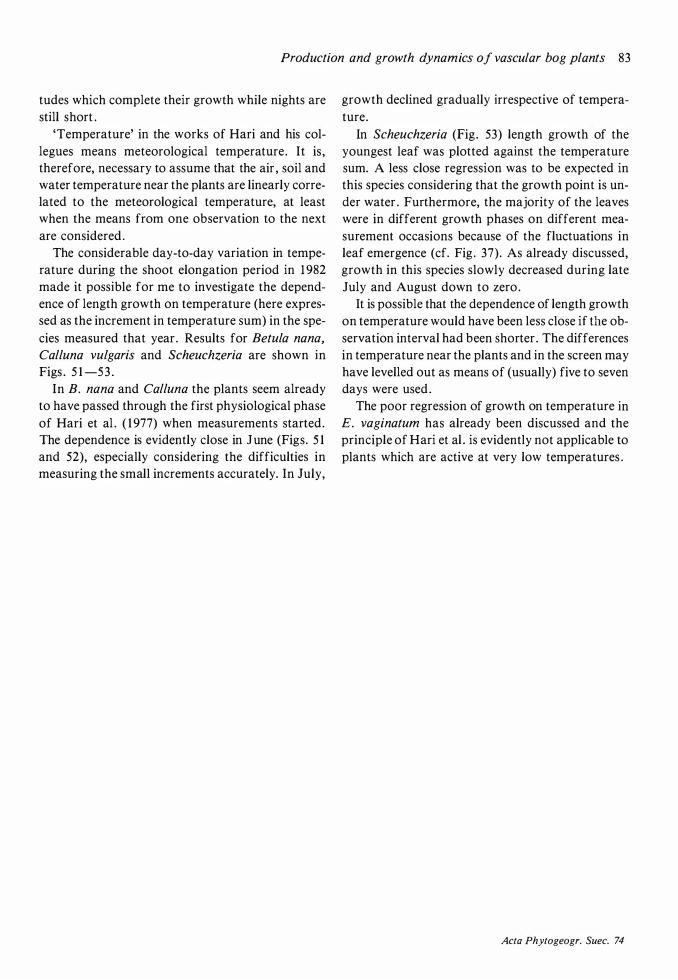
Production and growth dynamics of vascular bog plants 83
tudes which complete their growth while nights are still short .
'Temperature' in the works of Hari and his collegues means meteorological temperature . It is , therefore, necessary to assume that the air , soil and water temperature near the plants are linearly correlated to the meteorological temperature, at least when the means from one observation to the next are considered .
The considerable day-to-day variation in temperature during the shoot elongation period in 1 982 made it possible for me to investigate the dependence of length growth on temperature (here expressed as the increment in temperature sum) in the species measured that year . Results for Betula nana,
Calluna vulgaris and Scheuchzeria are shown in Figs . 5 1 -5 3 .
In B. nana and Calluna the plants seem already to have passed through the first physiological phase of Hari et al . ( 1 977) when measurements started . The dependence is evidently close in 1 une (Figs . 5 1 and 52), especially considering the difficulties in measuring the small increments accurately. In 1 uly,
growth declined gradually irrespective of temperature.
In Scheuchzeria (Fig . 53) length growth of the youngest leaf was plotted against the temperature sum. A less close regression was to be expected in this species considering that the growth point is under water . Furthermore, the majority of the leaves were in different growth phases on different measurement occasions because of the fluctuations in leaf emergence (cf. Fig . 37). As already discussed, growth in this species slowly decreased during late July and August down to zero .
It is possible that the dependence of length growth on temperature would have been less close if the observation interval had been shorter . The differences in temperature near the plants and in the screen may have levelled out as means of (usually) five to seven days were used .
The poor regression of growth on temperature in E. vaginatum has already been discussed and the principle of Hari et al . is evidently not applicable to plants which are active at very low temperatures .
Acta Phytogeogr. Suec. 74
The bog environment and the behaviour of plants
The ombrotrophic mire is generally considered to be an extreme environment with regard to low levels of available plant nutrients , acidity and, for deeper parts of the rhizosphere, oxygen deficiency . This is also apparent from the very low number of species . It is important to note that no single species is wholly confined to ombrotrophic vegetation, a point that has often been put forward by the Central European phytosociologists , who have refused to accept such vegetation as a high-ranked plant community of its own .
Calluna vulgaris, Empetrum nigrum and Vacci
nium uliginosum are common also in forests and , as are Betula nana and Rubus chamaemorus, on treeless heaths and tundra . Eriophorum vaginatum
is also an important tundra species , occurring in most kinds of minerotrophic mires as well. Andro
meda polifolia, Drosera anglica, D. rotundifolia,
Rhynchospora alba, Scheuchzeria palustris, Tri
chophorum caespitosum and V. oxycoccos occur commonly in various kinds of both ombrotrophic and minerotrophic mires . The only two field layer species that seem to have their main occurrence on bogs (chiefly hummocks) are V. microcarpum and Pinguicula villosa (the latter species not in the investigated area), but at higher elevation both become more ubiquitous as to type of mire (Sjors , pers . comm. ) .
With this background i t is hardly appropriate to talk about adaptations to ombrotrophy. It is more likely that even though the plants are not adapted to ombrotrophy through evolution they can still withstand it . Even in the case of Sphagnum cuspida
tum, which very rarely occurs in minerotrophic environments , it has been shown (Boatman 1 977) that the ombrotrophic mire is a suboptimal environment . I will return to this problem later in this chapter .
Acta Phytogeogr. Suec. 74
Rate of production
It is reasonable to assume (and often easy to observe) that a plant in the low-nutrient environment on a bog has a lower production than plants of the same species in other environments, although few data are available to prove this . It is also reasonable to assume that ability to survive with a moderate amount of production has a positive value in the ombrotrophic environment .
The plasticity is perhaps more striking in pine (Pi
n us sylvestris) than in other species . Arnborg ( 1 943 :
1 53) gave examples of this . Darwin ( 1 859 : 72) , when studying a British heath, noticed a pine that ' 'had during twenty-six years tried to raise its head above the stems of the heath, and had failed" . I myself came across a tiny pine on the bog, ea. 1 dm high, which had 48 visible scars from subsequent apical short shoots , was completely devoid of branches and possessed three unhealthy-looking needles at its top . On good soil a pine of this age would be 1 0-20
m high. This example is extreme; very small pines cannot maintain a long-term position on the bog without a permanent input of diaspores from the surroundings .
In the case of Calluna vulgaris it is easily seen in the field that shoots are much shorter than on plants from neighbouring mineral soil . Trichophorum
caespitosum culms are much taller in the lasiocarpa
soak than on the ombrotrophic bog . Leaves of Vac
cinium oxycoccos are often markedly larger in fens . In other species studied , exact measurements would be needed to detect differences in individual growth between ombrotrophic and minerotrophic sites . It is known (e .g . Grime & Hunt 1 975 , Grime 1 979) that the slow growth of species typical of sites with low nutrient levels is often inherent . The difference in individual production between sites might therefore
Production and growth dynamics of vascular bog plants 85
not always be considerable. There are also large differences in plant size between sites within the ombrotrophic vegetation, e .g . Betula nana and Vacci
nium uliginosum are larger in pine bogs than in open bogs ; Andromeda polijolia and Rhynchospora alba
are much larger at the edge of pools , etc . These differences (except in R. alba) are probably caused by differences in age structure rather than in production .
I sympathize with Grime's ( 1 979) theory that ' 'the ability to conserve the resources which have been captured and to resist the severe hazards to survival" are more important in low-productive habitats than the ability of high production. One way of reducing the need to produce more tissue and to maximise the use of photosynthates is evidently to retain photosynthetic tissues as long as possible. It is therefore not surprising-although much debated in the older ecological literature , see Firbas ( 1 93 1 )-to find a high degree of sclerophyllous evergreenness within the bog flora. Miiller-Stoll ( 1 947) and Simonis ( 1 948) showed that the xeromorphy of bog plants was accentuated in potcultures with low nitrogen levels . Loveless ( 196 1 , 1 962) suggested that a sclerophyllous leaf is an expression of a metabolism found in plants that can tolerate low phosphate levels . Monk ( 1 966) found higher degrees of evergreenness on non-productive sites in Florida than on more productive sites .
Evergreenness is most prominent on hummocks because of the dominance of Calluna and/ or Em
petrum nigrum. Most of the total populations of these species are found in forests or heaths with acidic soils . As far as I am aware, no studies have been made into whether there are genetic differences between the stunted heather shrubs of bogs and their more vigorously growing neighbours on mineral soils . On alpine tundra, where the mobilisation of nitrogen is hampered chiefly by low temperature, Calluna has a restricted distribution and the genus Empetrum is represented by E. hermaphroditum,
the tetraploid counterpart of E. nigrum s . str. The latter probably has experienced natural selection for such habitats but is obviously genetically different from E. nigrum .
High ability of retention of nutrients is also probably common among bog species . In Rubus
chamaemorus it has been shown (Saeb0 1 968) that phosphorus is transported from senescent leaves to
the rhizomes and winter buds . Goodman & Perkins ( 1 959) made similar observations in Eriophorum va
ginatum.
Bog plants often have very extensive belowground parts . R. chamaemorus is a striking example and it is difficult to understand how its few tiny leaves can support all rhizomes and roots . It is likely that one of the explanations of the low above ground production on bogs can be found in the existence of these very considerable root systems .
Flowering and reproduction
Flowering was generally poor . I have written earlier that flowering in Calluna vulgaris and Eriophorum
vaginatum was poorer than reported by others in populations on mineral soil . In other species no literature data on abundance of flowers seem to be available. Whether the species flower more readily in other habitats is therefore unknown . Because of the high density of most species , flowers were nevertheless readily seen . To give an example, 0 . 1 2 OJo flowering shoots of E. vaginatum in lawns still means one inflorescence in less than 2 m2• Only in one case did a species fail to flower entirely: Scheuchzeria palustris in 1 982.
The germination of seeds was not investigated. Seeds of Rubus chamaemorus germinate readily according to Lid et al . ( 1 96 1 ) , 0stgard ( 1964) and Taylor ( 1 97 1 ) . Calluna seeds also have a high viability and germination percentage (Gimingham 1 960 and several authors quoted therein) . Seedlings of Dro
sera spp . and E. vaginatum are often seen on bogs . Sernander ( 1 90 1 ) saw seedlings of Scheuchzeria.
Scarcity of seedlings on bogs is therefore probably not due to poor germination of seeds . Similar conditions in other closed vegetation have been reported by, e .g . Malmstrom ( 1 949; boreal forest), C .O. Tamm ( 1 956; boreal forest and meadows) and Ericson ( 1 977 ; boreal forest) but these authors suggest that reproduction may take place after disturbance that creates empty spaces on the ground. This also seems to be the case in mires , e .g . when the moss layer disintegrates after artificial draining (own unpubl . observations) .
Acta Phytogeogr. Suec. 74
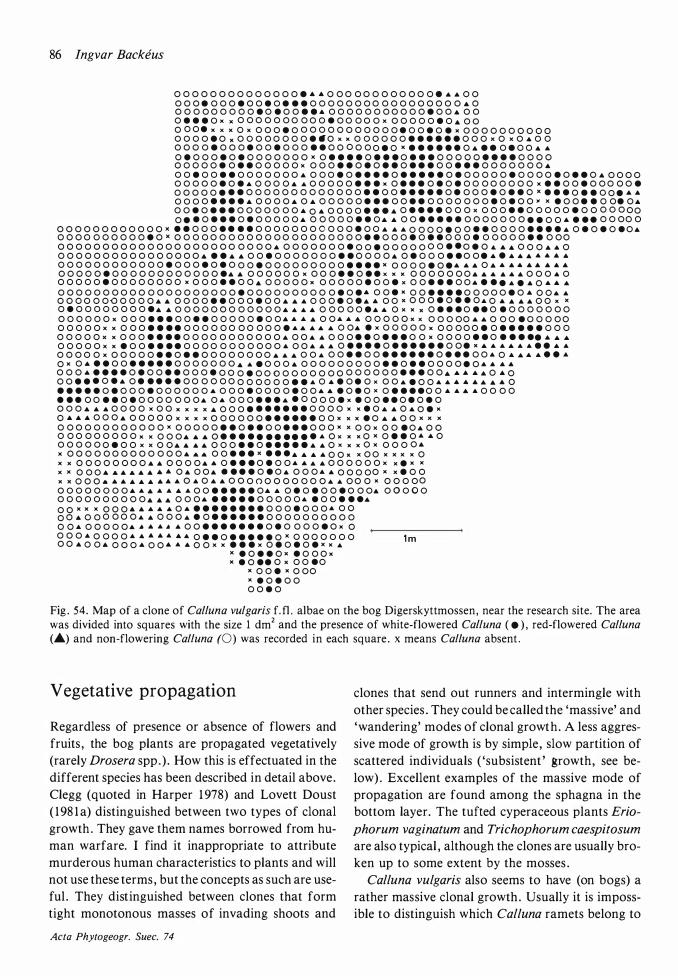
86 Jngvar Backeus
o o o o o o o o o o o o o o e A A O o o o o o o o o o o o e A A O O
o o o e o o o e o o e o e e e o o o o o o o o o o o o o o o o o A o o o o o o o o o o e o e o o e e A o o o o o o o o o o o e o o A o o o e e e o x x o o o o o o o o o o e o o o o o x o o o o o e o A o o o o o e x x x o x o o o e o o o o o o o o o o o o e o o e o e x o o o o o o o o o o O O O O e O x O O O O O O O O e . O x x O O O O O O e e e e e e O O O x O x O A O O o o o o e o o o e o o e o o o e e o o o o o o e o x e • • • • • o A e e o e o o A A
o e o o o e o e o o o o o o o x o e e e e o e e e o e e e o o o o o • • • • o o o o o o o o o e o e e o o o o o x o o o e e o e o e e o e e e o o e e e o o o o o o o A
o o e o o e e o o o o o o o A o o o e o • • • • o • • • • • o e o o o o o e o o o o e o e e o A o o o o o o o o o e o e A O O O O A & O o o o o e e e x o e e e o e o e o o o o o o o o x e e o o e o o o o o e
o o o o o e e e o o o o o o o o o o o o o e e o o • • • • • o e o o o e o e e o x e e e o e e o o e A A
o o o o • • • • A o o o o A O A o o o o o e e e o o e e o o o o o o o e o e o o x x e o o e e o o e o A
o o e o e e e o o o o o o o A o A o o o o • • • A o • • • • o o o x o o o e e o o o o o e o o o o o o o
o e e o e e e o e o o o o o A o o o o o e e O A A o o • • • • • o o o o o o o e e o o A • • • o o o o o
o o o o o o o o o o o o x e e o o o • • • • o o o o o o o o o o o e O O A A A O o o o e o o e e o o o o • • • • A o e o e o e o A o o o o o o o o o o e o x o o o o o o o o o o o o o o o o o o o o o e e o o o e o e e o o o e o o o o o e e o o o
0 0 0 0 0 0 0 0 0 0 0 0 0 0 0 0 0 0 0 0 0 0 0 0 A 0 0 0 0 0 0 0 e o o e o o O O O O O e e o e O & A A 0 0 0 A A 0 o o o o o o o o o o o o o o o o A • • A A o o e o o o o o o o e e o o o o A o e o o o e e o o • A • A A A A A A A
o o o o o o o o o o o o e o o o e o e o o o e o o o o o o o o o e e e e x o o o o e o e A A A O A A A A A A A A A
o o o o o e o o o o o o o o o o o o e A A O O o o o o x o o o e e o e e x x x o o o o o o o A A A A A A O O O A O o o o o o e o o o o o o o o x o o o e e o o A o o o o o x o o o o o e o o e x o o e e e o o A • • • • • A O & A A
o o o o o o o o o o o o o o o o o o o o e o o o o o o o o o o e o e A o o e x o o e e e e o o o o o e o A O O A • o o o o o o o o o o O A A O O o o e e o o o e o O A & A O o o e o • A • o o x o o o e o e e o • o • A A A O O x x
o e o o o o o o o o e A A O O o o o o o o o o O O A & & A o o o o o e A A O x x x o e e e o e e o e o o o o o o o
o o o o o o x o o o e e e o o e e o o o o o e o o A • • A O O • • • O o o o o x x o o o o o • • o o o e o o o o o o o o o o x x o o o e e e e o o o o o o o o o o o • • • • • • O O A e x o o o o o x o o o o o e o e e e e e o o o
O O O O O x x O O O e e e e 0 0 0 0 0 0 0 0 0 0 0 & 0 0 & & 0 0 0 e e o e e e O O x O O O O e e o e e e ee A A A o o o o o x x e o o e e e e o o o o o o o o o o o • O O • • • o • • • • o • • • • • • o o e x • • • • • • • • • •
o o o o o x o o o o o e e o e e o o o o o o o o • • • O O • o o e e o o • • • • • • o • • • o o • o • A • • • • •
o x o • • • o o • • • • • o o o o o o O A & . O O O & O O O O O O O O O e e o e e o o o o e o · · · · o o o • • • • • o e o o e e o o o e o o o e o o o o o o o o o o o o o o o o e e e o o • • A • • O • o o o • • • o • • o • • • • • o o o o o o o o o o o o e e • o A e o e o x o o . e o o • • A A A A & A O • • • • • o e o o o e o o o o o o • o o o e o o o o e o o • • • o e o x o e e e e o o • • • • o o o o
• • • o o e e o e o o o o o o O A O • o o o • • • • • o o o o e x e o o e e o e o e o O O O & & A O O O O x O O x x x x A O O O e e e e e e e o O O O x x e O & A O & O e x
0 A A A 0 0 0 A 0 0 0 0 0 x x x x 0 0 0 0 0 0 • • • • • • o o x x x e 0 & A 0 0 X X X
o o o o o o o o o o o o x o o o o o e e o e e o o e e e o o o x x o o x O O e O A 0 0 O O O O O O O O O x x O O O A & A O • • • • • • • • • • • • o x x x o x o e e o • A O O O O O O O e o o x x O O & A A & O O O e e o e e e e e A & O x x x O x O O O O &
x 0 0 0 0 0 0 0 0 0 0 0 0 0 & & & 0 0 e e e x e e e A & & A 0 0 x x O O x x x x O X X 0 0 0 0 0 0 0 0 A A 0 0 0 0 A 4 o • • • o • o o • • • & 0 0 0 0 0 0 x x e x X
X X O O O A A A A A A . A O A 0 0 & • • • • o • o A O O O • A 0 0 0 0 0 X x e o o
x x 0 0 0 & 4 4 A & A 4 A & 0 & 0 & & 0 0 0 0 0 0 0 0 0 0 0 & & 0 0 0 x 0 0 0 0 0
O O O O O O O O • • A • • • • O O e e e e e o • • o e o e o o e O O OA O O O O O o o o o o o o o o o A A & O O o • • • • • • o o o o o • e o o • • • A
o o x x x 0 0 0 A A A A A 0 4 • • • • • • • • o o o e o o o • o o
o o A o o o o o o • • o o o . e o • • • • • • o o o o o o o o o o
o o • o o o o o • � A - � A o o • • • • • • • o • o o o o e o x o o o o • o o o o • • A • • A • o e e o • • • • • o x o o o o o o o 1 m O O A O O • o o o • o o • • A o o x x e e e x o e o e o e x x •
X e o e e o x e 0 0 0 x x e o e e o x o o • o
x o o e x o o o
x e o e o o o o e o
Fig . 54. Map of a clone of Calluna vulgaris f. fl . albae on the bog Digerskyttmossen , near the research site. The area was divided into squares with the size 1 dm2 and the presence of white-flowered Ca/luna ( • ) , red-flowered Calluna (.6.) and non-flowering Calluna (0) was recorded in each square . x means Calluna absent .
Vegetative propagation
Regardless of presence or absence of flowers and fruits , the bog plants are propagated vegetatively (rarely Drosera spp.) . How this is effectuated in the different species has been described in detail above. Clegg (quoted in Harper 1 978) and Lovett Doust ( 1 98 1 a) distinguished between two types of clonal growth . They gave them names borrowed from human warfare. I find it inappropriate to attribute murderous human characteristics to plants and will not use these terms , but the concepts as such are useful . They distinguished between clones that form tight monotonous masses of invading shoots and
Acta Phytogeogr. Suec. 74
clones that send out runners and intermingle with other species . They could be called the 'massive' and 'wandering' modes of clonal growth. A less aggressive mode of growth is by simple , slow partition of scattered individuals ( 'subsistent ' growth, see below) . Excellent examples of the massive mode of propagation are found among the sphagna in the bottom layer. The tufted cyperaceous plants Erio
phorum vaginatum and Trichophorum caespitosum
are also typical , although the clones are usually broken up to some extent by the mosses .
Calluna vulgaris also seems to have (on bogs) a rather massive clonal growth . Usually it is impossible to distinguish which Calluna ramets belong to
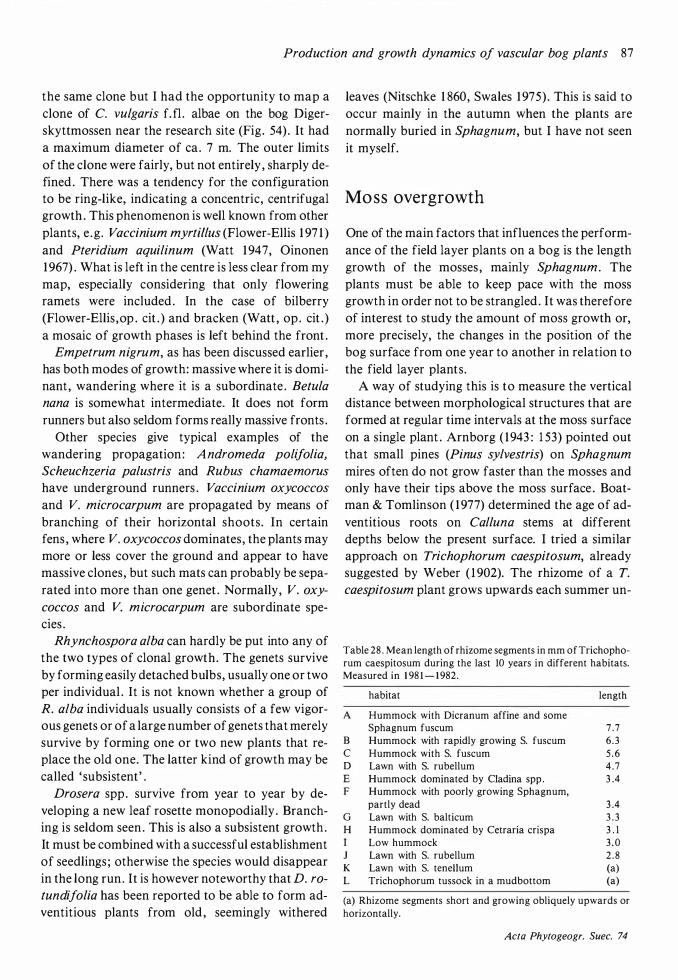
Production and growth dynamics of vascular bog plants 87
the same clone but I had the opportunity to map a clone of C. vulgaris f. fl . albae on the bog Digerskyttrnossen near the research site (Fig . 54) . It had a maximum diameter of ea . 7 m. The outer limits of the clone were fairly, but not entirely , sharply defined . There was a tendency for the configuration to be ring-like, indicating a concentric, centrifugal growth . This phenomenon is well known from other plants, e .g . Vaccinium myrtillus (Flower-Ellis 1 97 1 ) and Pteridium aquilinum (Watt 1 947, Oinonen 1 967) . What is left in the centre is less clear from my map, especially considering that only flowering rarnets were included . In the case of bilberry (Flower-Ellis ,op . cit . ) and bracken (Watt , op . cit . ) a mosaic of growth phases is left behind the front .
Empetrum nigrum, as has been discussed earlier , has both modes of growth: massive where it is dominant, wandering where it is a subordinate . Betula
nana is somewhat intermediate. It does not form runners but also seldom forms really massive fronts .
Other species give typical examples of the wandering propagation : Andromeda polifolia,
Scheuchzeria palustris and Rubus chamaemorus
have underground runners . Vaccinium oxycoccos
and V. microcarpum are propagated by means of branching of their horizontal shoots. In certain fens , where V. oxycoccos dominates , the plants may more or less cover the ground and appear to have massive clones , but such mats can probably be separated into more than one genet . Normally, V. oxy
coccos and V. microcarpum are subordinate species .
Rhynchospora alba can hardly be put into any of the two types of clonal growth. The genets survive by forming easily detached bulbs, usually one or two per individual . It is not known whether a group of R. alba individuals usually consists of a few vigorous genets or of a large number of genets that merely survive by forming one or two new plants that replace the old one. The latter kind of growth may be called ' subsistent ' .
Drosera spp. survive from year to year by developing a new leaf rosette rnonopodially . Branching is seldom seen . This is also a subsistent growth . It must be combined with a successful establishment of seedlings ; otherwise the species would disappear in the long run . It is however noteworthy that D. ro
tundifolia has been reported to be able to form adventitious plants from old , seemingly withered
leaves (Nitschke 1 860, Swales 1 975) . This is said to occur mainly in the autumn when the plants are normally buried in Sphagnum, but I have not seen it myself.
Moss overgrowth
One of the main factors that influences the performance of the field layer plants on a bog is the length growth of the mosses , mainly Sphagnum. The plants must be able to keep pace with the moss growth in order not to be strangled . It was therefore of interest to study the amount of moss growth or, more precisely, the changes in the position of the bog surface from one year to another in relation to the field layer plants .
A way of studying this is to measure the vertical distance between morphological structures that are formed at regular time intervals at the moss surface on a single plant . Arnborg ( 1943 : 1 53) pointed out that small pines (Pinus sylvestris) on Sphagnum
mires often do not grow faster than the mosses and only have their tips above the moss surface . Boatman & Tornlinson ( 1 977) determined the age of adventitious roots on Calluna sterns at different depths below the present surface. I tried a similar approach on Trichophorum caespitosum, already suggested by Weber ( 1 902). The rhizome of a T.
caespitosum plant grows upwards each summer un-
Table 28 . Mean length of rhizome segments in mm of Trichophorum caespitosum during the last 10 years in different habitats. Measured in 1 98 1 - 1 982.
habitat length
A Hummock with Dicranum affine and some Sphagnum fuscum 7 .7
B Hummock with rapidly growing S. fuscum 6 . 3
c Hummock with S. fuscum 5 . 6
D Lawn with S. rubellum 4 . 7
E Hummock dominated by Cladina spp . 3 .4
F Hummock with poorly growing Sphagnum, partly dead 3 .4
G Lawn with S. balticum 3 . 3
H Hummock dominated by Cetraria crispa 3 . 1
Low hummock 3 . 0
J Lawn with S. rubellum 2 . 8
K Lawn with S. tenellum (a) L Trichophorum tussock in a mudbottom (a)
(a) Rhizome segments short and growing obliquely upwards or horizontally.
Acta Phytogeogr. Suec. 74
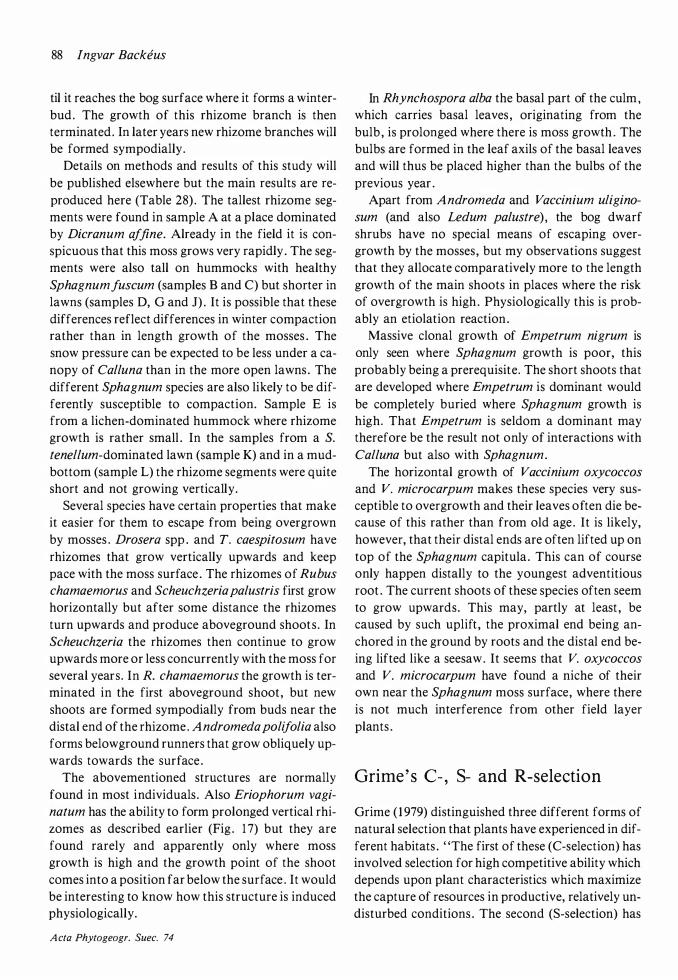
88 Ingvar Backeus
til it reaches the bog surface where it forms a winterbud . The growth of this rhizome branch is then terminated . In later years new rhizome branches will be formed sympodially.
Details on methods and results of this study will be published elsewhere but the main results are reproduced here (Table 28) . The tallest rhizome segments were found in sample A at a place dominated by Dicranum affine. Already in the field it is conspicuous that this moss grows very rapidly . The segments were also tall on hummocks with healthy Sphagnumfuscum (samples B and C) but shorter in lawns (samples D, G and J) . It is possible that these differences reflect differences in winter compaction rather than in length growth of the mosses . The snow pressure can be expected to be less under a canopy of Calluna than in the more open lawns . The different Sphagnum species are also likely to be differently susceptible to compaction. Sample E is from a lichen-dominated hummock where rhizome growth is rather small . In the samples from a S.
tenellum-dominated lawn (sample K) and in a mudbottom (sample L) the rhizome segments were quite short and not growing vertically.
Several species have certain properties that make it easier for them to escape from being overgrown by mosses . Drosera spp . and T. caespitosum have rhizomes that grow vertically upwards and keep pace with the moss surface . The rhizomes of Rubus
chamaemorus and Scheuchzeria palustris first grow horizontally but after some distance the rhizomes turn upwards and produce aboveground shoots . In Scheuchzeria the rhizomes then continue to grow upwards more or less concurrently with the moss for several years . In R. chamaemorus the growth is terminated in the first aboveground shoot , but new shoots are formed sympodially from buds near the distal end of the rhizome . Andromeda polifolia also forms belowground runners that grow obliquely upwards towards the surface .
The abovementioned structures are normally found in most individuals . Also Eriophorum vagi
natum has the ability to form prolonged vertical rhizomes as described earlier (Fig . 1 7) but they are found rarely and apparently only where moss growth is high and the growth point of the shoot comes into a position far below the surface . It would be interesting to know how this structure is induced physiologically.
A cta Phytogeogr. Suec. 74
In Rhynchospora alba the basal part of the culm, which carries basal leaves , originating from the bulb , is prolonged where there is moss growth . The bulbs are formed in the leaf axils of the basal leaves and will thus be placed higher than the bulbs of the previous year .
Apart from Andromeda and Vaccinium uligino
sum (and also Ledum palustre) , the bog dwarf shrubs have no special means of escaping overgrowth by the mosses , but my observations suggest that they allocate comparatively more to the length growth of the main shoots in places where the risk of overgrowth is high . Physiologically this is probably an etiolation reaction.
Massive clonal growth of Empetrum nigrum is only seen where Sphagnum growth is poor, this probably being a prerequisite. The short shoots that are developed where Empetrum is dominant would be completely buried where Sphagnum growth is high. That Empetrum is seldom a dominant may therefore be the result not only of interactions with Calluna but also with Sphagnum.
The horizontal growth of Vaccinium oxycoccos
and V. microcarpum makes these species very susceptible to overgrowth and their leaves often die because of this rather than from old age . It is likely, however, that their distal ends are often lifted up on top of the Sphagnum capitula . This can of course only happen distally to the youngest adventitious root . The current shoots of these species often seem to grow upwards. This may, partly at least , be caused by such uplift , the proximal end being anchored in the ground by roots and the distal end being lifted like a seesaw . It seems that V. oxycoccos
and V. microcarpum have found a niche of their own near the Sphagnum moss surface, where there is not much interference from other field layer plants .
Grime's C- , S- and R-selection
Grime ( 1 979) distinguished three different forms of natural selection that plants have experienced in different habitats . "The first of these (C-selection) has involved selection for high competitive ability which depends upon plant characteristics which maximize the capture of resources in productive, relatively undisturbed conditions . The second (S-selection) has
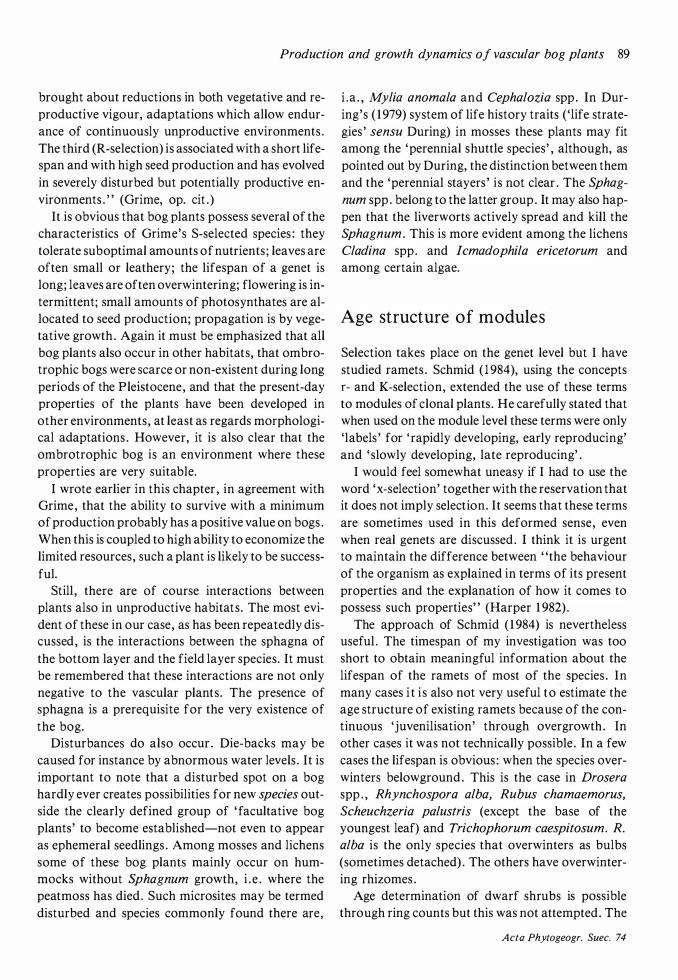
Production and growth dynamics of vascular bog plants 89
brought about reductions in both vegetative and reproductive vigour, adaptations which allow endurance of continuously unproductive environments . The third (R-selection) is associated with a short lifespan and with high seed production and has evolved in severely disturbed but potentially productive environments . " (Grime, op. cit . )
It is obvious that bog plants possess several of the characteristics of Grime's S-selected species : they tolerate suboptimal amounts of nutrients ; leaves are often small or leathery; the lifespan of a genet is long; leaves are often overwintering; flowering is intermittent; small amounts of photosynthates are allocated to seed production; propagation is by vegetative growth . Again it must be emphasized that all bog plants also occur in other habitats, that ombrotrophic bogs were scarce or non-existent during long periods of the Pleistocene, and that the present-day properties of the plants have been developed in other environments , at least as regards morphological adaptations . However, it is also clear that the ombrotrophic bog is an environment where these properties are very suitable.
I wrote earlier in this chapter , in agreement with Grime , that the ability to survive with a minimum of production probably has a positive value on bogs . When this is coupled to high ability to economize the limited resources , such a plant is likely to be successful.
Still , there are of course interactions between plants also in unproductive habitats. The most evident of these in our case , as has been repeatedly discussed , is the interactions between the sphagna of the bottom layer and the field layer species. It must be remembered that these interactions are not only negative to the vascular plants. The presence of sphagna is a prerequisite for the very existence of the bog.
Disturbances do also occur . Die-backs may be caused for instance by abnormous water levels . It is important to note that a disturbed spot on a bog hardly ever creates possibilities for new species outside the clearly defined group of ' facultative bog plants ' to become established-not even to appear as ephemeral seedlings . Among mosses and lichens some of these bog plants mainly occur on hummocks without Sphagnum growth, i . e . where the peatmoss has died . Such microsites may be termed disturbed and species commonly found there are,
i . a . , Mylia anomala and Cephalozia spp . In During's ( 1 979) system of life history traits ('life strategies ' sensu During) in mosses these plants may fit among the 'perennial shuttle species ' , although, as pointed out by During, the distinction between them and the 'perennial stayers ' is not clear . The Sphag
num spp . belong to the latter group . It may also happen that the liverworts actively spread and kill the Sphagnum. This is more evident among the lichens Cladina spp . and lcmadophila ericetorum and among certain algae.
Age structure of modules
Selection takes place on the genet level but I have studied ramets . Schmid ( 1 984), using the concepts r- and K-selection, extended the use of these terms to modules of clonal plants . He carefully stated that when used on the module level these terms were only 'labels ' for ' rapidly developing, early reproducing' and ' slowly developing, late reproducing' .
I would feel somewhat uneasy if I had to use the word 'x-selection' together with the reservation that it does not imply selection. It seems that these terms are sometimes used in this deformed sense , even when real genets are discussed. I think it is urgent to maintain the difference between ' 'the behaviour of the organism as explained in terms of its present properties and the explanation of how it comes to possess such properties" (Harper 1 982) .
The approach of Schmid ( 1 984) is nevertheless useful . The timespan of my investigation was too short to obtain meaningful information about the lifespan of the ramets of most of the species . In many cases i t i s also not very useful to estimate the age structure of existing ramets because of the continuous 'juvenilisation' through overgrowth. In other cases it was not technically possible . In a few cases the lifespan is obvious : when the species overwinters belowground . This is the case in Drosera
spp . , Rhynchospora alba, Rubus chamaemorus,
Scheuchzeria palustris (except the base of the youngest leaf) and Trichophorum caespitosum. R.
alba is the only species that overwinters as bulbs (sometimes detached) . The others have overwintering rhizomes .
Age determination of dwarf shrubs is possible through ring counts but this was not attempted. The
Acta Phytogeogr. Suec. 74
90 lngvar Backeus
age of Vaccinium uliginosum was , however , easily determined by following the shoot system backwards .
It may be possible to determine the age of Scheuchzeria shoots with the help of leaf remains but neither was this attempted . A similar approach to Eriophorum vaginatum shoots was presented under that species .
Pearl & Miner ( 1 93 5) distinguished three basic types of survivorship curves . These were adapted by Deevey ( 1 947) and are often called 'Deevey curves' of types I-III , although Deevey explicitly quoted the original authors . The first type implies that most individuals die at a high age . In type 11 there is equal risk of death at all ages and in type Ill the death risk is highest among young individuals .
Figure 22 which shows the age structure of E. va
ginatum shoots , also illustrates the survivorship curves , if it is assumed that the age structure is stable over the years . The curves are similar to curve type 11 with a tendency towards type I. Survivorship curves of individuals of other species would probably give similar results . This has been shown for ramets in other species (Bernard 1 976, Noble et al . 1 979) . Curves of type Ill are not likely to occur in this environment where seedlings do not play a significant role . The number of new ramets is limited and they must have a good chance to survive if the species is to keep its position within the society.
On the other hand, there are not many individuals that attain a high age . The interactions with the bottom layer plants mean a constant death risk that should cause a survivorship curve similar to those found in E. vaginatum.
The survivorship of leaves has been discussed above for the evergreen species (Tables 7 and 14 , Fig . 1 5) . In 'deciduous ' species where leaves are developed in spring and die in autumn, their survivorship curves are , of course, of type I . Also the leaves of the investigated evergreen species follow similar curves . The evergreen dwarf shrubs have a very low mortality during the winter, which contrasts with Karlsson's ( 1982) findings in Vaccinium vitis-idaea.
In E. vaginatum, Scheuchzeria and, to some degree, R. alba, the leaves both develop and die successively during the active growth period, but also in these species leaves of a certain generation have a survivorship curve of type I (Tables 1 4 and 1 9) .
Similar results have been obtained for leaves of
A cta Phytogeogr. Suec. 74
other species , i .a . Ranunculus repens (Lovett Doust 1 98 1 b). "This pattern of development is similar to that of animals with extended parental care . It is therefore not surprising that survival curves for ramets and leaves and for animals with extended parental care should have similar shapes" (Fetcher & Shaver 1 983) .
Evergreen shrubs were found to shed very few leaves in winter when conditions were harsh. All leaves were shed in summer . The reason may simply be that leaf shedding is an active process . In Andro
meda polifolia the shedding of one-year-old leaves started in July (Table 7) . In Empetrum nigrum it took place from June to August (Fig . 1 5) . These results can be compared to the seasonal changes in the death risk of ramets of Ranunculus spp . (Sarukhan & Harper 1 973), of Carex arenaria (Noble et al . 1 979) and several other species described in the literature , where the greatest death risk was shown to be more or less synchronous with the highest 'birth rate ' for ramets .
Interdependence of ramets
Throughout this treatise ramets have been termed ' individuals ' . The operational definition of an individual has been the unit obtained when a plant is cut at ground level or at the first adventitious root . A crucial question is , however , which is the functional individual: the ramet or a group of ramets or the genet (cf. Hartnett & Bazzaz 1 983) . If ramets are integrated it would mean that ' individuals ' can survive outside the normal range of the species . This especially applies to plants with a wandering propagation like Rubus chamaemorus. Ramets of Betula
nana in lawns usually grow near a hummock and usually seem to be connected with other ramets on this hummock . The same often applies to lawn colonists of Calluna vulgaris and Empetrum nigrum.
Some kind of integration therefore probably exists . This would mean that the performance of a ram et
of a clonal plant would be partly due to environmental conditions at some distance from this ramet itself. One consequence, especially evident in R. cha
maemorus, is that the same genet can develop interconnected shoots in two or more plant communities on the bog. When a genet crosses the limit between a hummock and a lawn the somewhat disturbing si-
Production and growth dynamics of vascular bog plants 9 1
tuation arises that the same genet occurs i n two communities which Central European phytosociologists even consider as different classes . Furthermore, Du Rietz ( 1 954) claimed that one and the same Eriopho
rum vaginatum tussock could survive all stages in the supposed 'regeneration' of bogs (von Post & Sernander 1 9 1 0) .
How ramets of a bog species depend on each other would be an interesting field for further studies .
Concluding remarks
The basis for this work, as described in the introduction, has been that synecological results can be obtained as the sum of the 'ecologies ' of all populations of species of the sites and their interactions (cf. Harper 1 978). It is, of course, the populations on the studied site only that are considered .
The study site was divided according to phytosociological units . When a species occurred in two or three of these units it was treated as two or three statistical populations . (Genetically different popu-
ACKNOWLEDGMENTS
lations were not considered . ) But variations in any of the studied properties of a species do not necessarily follow phytosociological limits . A proper study of the population ecology of a particular species should try to detect variation within the whole plant population of the site . Such variation might be caused by other factors than species composition, e .g . rate of moss overgrowth or degree of shading .
At the same time it was necessary in my investigation to divide the site in the same way for all species and in my case the phytosociological limits were not only the easiest to adopt but probably also the most appropriate ones . The floristic limit between hummocks and lawns corresponds to an abrupt environmental limit , the upper limit of inundation, and comparisons between hummocks and lawns have been useful throughout my work .
Ecological interrelations over the border are, however , conspicuous and the practise among phytosociologists to put the two communities into different classes certainly does not correspond to lack of ecological interdependence .
Prof. Hugo Sjors and Dr. Hakan Hytteborn have been my supervisors during my postgraduate studies and their help has been of a very great value, in particular their numerous valuable comments on the manuscript. The head of the Institute of Ecological Botany in Uppsala, Prof. Eddy van der Maarel, also has critically read the manuscript . I want to thank warmly these persons as well as all other collegues at our institute for their cooperation and interest in my work .
I am also extremely grateful to several other persons who have contributed in different ways: Mr. Villy Jungskar introduced me into the mysteries of computers, Mrs . Agneta Nordgren drew the figures, Mr. Folke Hellstrom did photographic work and Dr. Kuno Thomasson revised the reference list. Dr . Erik Sjogren and Mrs. Gunnel Sjors made a thorough editorial scrutiny of the manuscript and Mr. Nigel Rollison helped me with the linguistic revision . The staff of the university library helped in tracing numerous useful references in different libraries. Mrs . Rut Persson, Abborrberg in Grangarde was my host during the field work .
Financial support from C.F . Liljewalch 's foundation , Anna and Gunnar Vidfelt 's fund for biological research, Sernander' s research fund, K .O.E . Stenstrom's foundation and Uppsala University is gratefully acknowledged.
Institute of Ecological Botany, Uppsala University January 1 985 Ingvar Backeus
Acta Phytogeogr. Suec. 74
References
All en , S.E. 1964. Chemical aspects of heather burning . -1 . appl. Ecol . 1 : 347-367 .
Andreev , V .N . 1 966. AH.upeea, B .H . 1 966. Oco6eHHOCTH 30HaJihHOfO pacnpe.ueJieHH� Ha,ll3eMHOH ij>HTOMaCCbl Ha BOCTOliHOeaponeiicKoM ceaepe. (Summary: Specific features of the zonal distribution of the superterranean mass of vegetation in the northern regions of East Europe . ) - Eor . )1(. 5 1 : 1 40 1 - 1 4 1 1 .
- 1 97 1 . Methods of defining overground phytomass on vast territories of the Subarctic. - Rep . Kevo subarctic Res . Stat . 8: 3- 1 1 .
Andreev , V .N. , Galaktionova, T .F. , Zakharova, V . I . & Neustrueva, A. I . 1 972. Methods of estimation of seasonal changes in above-ground phytomass of herbs. -In: Wielgolaski, F .E. & Rosswall, T. (eds . ) : Tundra biome. Proc. IV. int. Meeting on the biological Productivity of Tundra, Leningrad, USSR, Oct . 1 97 1 , pp. 1 02- 1 10.
Angstrom, A. 1 953 . Maximi- och minimitemperaturer, arstider' vegetationsperioden, temp.-klimatets fOrandring . (Summary: Maximum and minimum temperatures , seasons , the vegetation period, variation of the temperature climate. ) - Atlas_over Sverige, sheet 27-28 .
Arnborg, T. 1 943 . Granberget. En vaxtbiologisk undersokning av ett sydlapplandskt granskogsomrade med sarskild hansyn till skogstyper och foryngring . (Zusammenfassung : Granberget. Eine pflanzenbiololgische Untersuchung eines siidlapplandischen Fichtenwaldgebietes unter besonderer Beriicksichtigung von Waldtypen und Verjiingung .) - Norrlandskt Handbib!. 14 : 1 -282.
Aulak, W. 1 970. Studies on herb layer production in the Circaeo-Alnetum Oberd. 1 953 association . - Ekol . pol . 1 8 : 4 1 1 -427 .
Backeus , I . 1 972. Bog vegetation re-mapped after sixty years . Studies on Skagershultamossen, Central Sweden . - Oikos 23 : 384-393.
- 1 984. Myrar i Orebro lan. (Summary : Mires in Orebro county, Central Sweden . ) - Svensk bot . Tidskr . 78 : 2 1 -44.
Barclay-Estrup, P. 1 970. The description and interpretation of cyclical processes in a heath community . I l . Changes in biomass and shoot production during the Cal/una cycle. - 1. Ecol . 58: 243-249.
Bell , 1 .N .B . & Tallis , 1 . H . 1973 . Biological Flora of the British Isles . Empetrum nigrum L. - Ibid . 6 1 : 289-305 .
Bellamy, D .1 . & Holland, P . 1 . 1 966. Determination of
Acta Phytogeogr. Suec. 74
the net annual aerial production of Calluna vulgaris (L . ) Hull, in northern England . - Oikos 1 7 : 272-275 .
Bergsten, F . 1 954. Nederborden i Sverige. Medelvarden 192 1 - 1 950. (English summary.) - Meddn SMHI , ser. C 5 : 1 -2 1 .
Bernard, 1 . M . 1 976. The life history and population dynamics of shoots of Carex rostra fa. - 1. Ecol . 64: 1 045- 1048 .
Biebl, R. 1967 . Kurztag-Einfliisse auf arktische Pflanzen wahrend der arktischen Langtage. - Planta 75 : 77-84.
Bliss , L .C . 1 956. A comparison of plant development in microenvironments of arctic and alpine tundras . -Ecol. Monogr. 26 : 303-337 .
- 1 966. Plant productivity in alpine microenvironments on Mt. Washington , New Hampshire. - Ibid . 36: 1 25- 1 55 .
- 1 977. General summary . Truelove Lowland ecosystem. - In: Bliss , L .C . (ed . ) : Truelove Lowland , Devon Island, Canada: A high arctic ecosystem, pp. 657-675 . Alberta .
Boatman, D. 1 . 1 977. Observations on the growth of Sphagnum cuspidatum in a bog pool on the Silver Flowe National Nature Reserve. - 1 . Ecol. 65 : 1 1 9- 1 26 .
Boatman , D .1 . & Tomlinson , R .W. 1 977 . The Silver Flowe. I I . Features of the vegetation and stratigraphy of Brishie Bog, and their bearing on pool formation. - Ibid . 65 : 53 1 -546.
Braid , K .W. & Tervet, I .W. 1 937 . Certain botanical aspects of the dying-out of heather. - Scott. 1 . Agric . 20: 365-372.
Brechtl , 1 . & Kubicek , F. 1 968 . Prispevok k meraniu primarnej produkcie bylinnej vrstvy lesnych spolocenstiev . (Zusammenfassung: Beitrag zur Messung der primaren Produktivitat der Krauterpflanzenschicht von W aldgesellschaften.) Biol6gia Bratisl . 23 : 305-3 16 .
Cajander, A.K. 19 13 . Studien iiber die Moore Finnlands. - Acta for . fenn . 2 (3): 1 -208 .
Chapin, F .S . , Cleve, K. van & Chapin, M.C. 1 979. Soil temperature and nutrient cycling in the tussock growth form of Eriophorum vaginatum . - 1. Ecol . 67: 1 69- 1 89.
Chapin , F. S . , 1ohnson, D.A. & McKendrick , 1 .D. 1 980. Seasonal movement of nutrients in plants of differing growth form in an Alaskan tundra ecosystem : implications for herb ivory . - Ibid. 68: 1 89-209.
Production and growth dynamics of vascular bog plants 93
Chapman, S .B . 1 967 . Nutrient budgets for a dry heath ecosystem in the south of England . - Ibid. 5 5 : 677-689.
Chapman, S . B . , Hibble, 1. & Rafarel, C .R . 1975 . Litter accumulation under Calluna vulgaris on a lowland heathland in Britain. - Ibid . 63 : 259-27 1 .
Chepurko , N.L . 1 972. The biological productivity and the cycle of nitrogen and ash elements in the dwarf shrub tundra ecosystems of the Khibini mountains (Kola Peninsula) . - In: Wielgolaski, F.E. & Rosswall, T . (eds . ) : Tundra biome Proc. IV. int . Meeting on the biological Productivity of Tundra, Leningrad, USSR, Oct. 1 97 1 , pp . 236-247 .
Chester, A .L . & Shaver, G.R. 1 982. Reproductive effort in cotton grass tussock tundra. - Holarct . Ecol. 5 : 200-206.
Corley, M .F .V . , Crundwell , A.C. , Diill, R . , Hill , M . O . & Smith, A . 1 .E . 1 98 1 . Mosses o f Europe and the Azores ; an annotated list of species , with synonyms from the recent literature. - 1. Bryol. 1 1 : 609-689.
Cormack, E. & Gimingham, C.H. 1 964. Litter production by Calluna vulgaris (L .) Hull . - 1. Ecol. 52: 285-297 .
Darwin, C. 1 859. On the origin of species by means of natural selection . - London .
Deevey, E .S . , 1 947 . Life tables for natural populations of animals. - Q. Rev . Bioi. 22: 283-3 14 .
Dierschke, H . 1972. Zur Aufnahme und Darstellung phanologischer Erscheinungen in Pflanzengesellschaften. - Ber. int . Symp . int . Verein. Veg-Kunde 1 970: 29 1 -304.
Dieri3en, K. 1 977 . Klasse Oxycocco-Sphagnetea Br.-Bl. et Tx. 43 . - In: Oberdorfer, E. (ed . ) : Siiddeutsche Pflanzengesellschaften 1: 273-292.
Dieri3en, K. & B . 1 982. Kiefernreiche Phytoconosen oligotropher Moore im mittleren und nordwestlichen Europa - iiberlegungen zur Problematik ihrer Zuordnung zu hoheren synsystematischen Einheiten . - Ber. int. Symp. int . Verein . Veg-Kunde 1 98 1 : 299-33 1 .
Du Rietz, G.E. 1 93 3 . De norrlandska myrarnas vaxtvarld. - Sver. Nat. Arsb . 193 3 : 56-68 .
- 1 949. Huvudenheter och huvudgranser i svensk myrvegetation. (Summary: Main units and main limits in Swedish mire vegetation. ) - Svensk bot. Tidskr.43 : 274-309.
- 1 950a. Phytogeographical mire excursion to the Billingen-Falbygden district in Vastergotland (southwestern Sweden) . - 7th int . Bot . Congr. Stockh . , Exc. guides , Sect . PHG, A I I b 1 : 1 -54.
- 1 950b. Phytogeographical mire excursion to northeastern Smaland and Ostergotland. - Ibid . A II b 2 : 1 -22.
- 1 950c. Phytogeographical excursion to the Ryggmossen mire near Uppsala. - Ibid . A II b 3: 1 -24.
- 1 954. Die Mineralbodenwasserzeigergrenze als Grundlage einer natiirlichen Zweigliederung der nordund mitteleuropaischen Moore . - Vegetatio 5-6: 57 1 -585 .
Du Rietz, G .E . & Nannfeldt , J .A . 1 925 . Ryggmossen und
Stigsbo Rodmosse, die letzten lebenden Hochmoore der Gegend von Upsala. - Svenska vaxtsoc. Sallsk . Handl . 3 : 1 -22.
During , H . 1 . 1979. Life strategies of bryophytes: a preliminary review . - Lindbergia 5: 2- 1 8 .
Eber, W . 1 97 1 . The primary production o f the ground vegetation of the Luzulo-Fagetum. - Ecol. Stud . 2: 53-56.
Ericson , L . 1 977 . The influence of voles and lemmings on the vegetation in a coniferous forest during a 4-year period in northern Sweden . - Wahlenbergia 4: 1 - 1 1 5 .
Falinska, K . 1972. Fenologiczna reakcja gatunk6w na zr6znicowanie fitosocjologiczno-ekologiczne gr:;1d6w (Tilio-carpinetum) w Bialowieskim Parku Narodowym. (Summary: The phenological reaction of species to phytosociological-ecological differences in the Tilio-carpineta of the Bialowieza National Park. ) -Phytocoenosis 1 : 5-3 5 .
Fetcher, N . & Shaver, G.R . 1 982. Growth and tillering patterns within tussocks of Eriophorum vaginatum. - Holarct . Ecol. 5: 1 80- 1 86 .
Fetcher, N . & Shaver, G . R . 1 983 . Life histories of tillers of Eriophorum vaginatum in relation to tundra disturbance. - 1. Ecol. 7 1 : 1 3 1 - 147.
Firbas , F . 1 93 1 . Untersuchungen iiber den Wasserhaushalt der Hochmoorpflanzen . - Jb. wiss. Bot . 74: 457-696.
Flower-Ellis, J . G . K. 197 1 . Age structure and dynamics in stands of bilberry ( Vaccinium myrtillus L. ) . - Res . Notes Dep . For . Ecol. and For. Soils Stockh. 9: 1 - 108 .
- 1 973 . Growth and morphology in the evergreen dwarf shrubs Empetrum hermaphroditum and A ndromeda polifolia at Stordalen. - In : Bliss, L .C . & Wielgolaski, F .E . (eds.) : Primary production and production processes , tundra biome. Proc . of the Conf. , Dublin , Ireland, April 1 973 , 1 23- 1 3 5 .
- 1 975 . Growth in populations o f A ndromeda polifolia on a subarctic mire. - Ecol. Stud. 16 : 1 29- 1 34 .
- 1 980a. Diurnal dry weight variation and dry matter allocation of some tundra plants. 1 . Andromeda polifolia L . - Ecol. Bul l . (Stockh .) 30: 1 39- 1 62.
- 1 980b. Diurnal dry weight variation and dry matter allocation of some tundra plants . 2. Rubus chamaemorus L. - Ibid. 30: 163- 179.
Forrest, G.I . 1 97 1 . Structure and production of North Pennine blanket bog vegetation. - J . Ecol . 59: 453-479.
Forrest, G . l . & Smith , R .A.H. 1 975 . The productivity of a range of blanket bog vegetation types in the northern Pennines. - Ibid . 63 : 1 73-202.
Fransson, S. 1 972. Myrvegetation i sydvastra Varmland . (Summary: Mire vegetation in south-western Varmland, Sweden.) - Acta phytogeogr. suec . 57 : 1 - 1 33 .
Gimingham , C . H . 1960. Biological flora o f the British Isles . Calluna vulgaris (L.) Hull. - J. Ecol. 48 : 455-483 . 1 972. Ecology of heathlands. - London.
A cta Phytogeogr. Suec. 74
94 Ingvar Backeus
Goodman, G.T. & Perkins , D.F . 1 959. Mineral uptake and retention in cotton-grass (Eriophorum vaginatum L.) . - Nature , Lond . 1 84 : 467-468 .
Goodman, G .T. & Perkins, D .F . 1968. The role of nutrients in Eriophorum communities . I l l . Growth response to added inorganic elements in two E. vaginaturn communities . - J . Ecol . 56: 667-683 .
Gore, A .J .P . 1 961 . Factors limiting plant growth on highlevel blanket peat . I. Calcium and phosphate . - Ibid . 49: 399-402.
Gore, A.J .P . & Olson , J . S . 1 967 . Preliminary models for accumulation of organic matter in an Eriophorum/Calluna ecosystem. - Aquilo, ser . Bot . 6: 297-3 1 3-
Grace, J. & Woolhouse, H . W . 1 970. A physiological and mathematical study of the growth and productivity of a Calluna-Sphagnum community. I. Net photosynthesis of Calluna vulgaris (L . ) Hull. - J. appl. Ecol . 7 : 363-38 1 .
Grace, J . & Woolhouse, H . W . 1 973 . A physiological and mathematical study of the growth and production of a Calluna-Sphagnum community. I l l . Distribution of photosynthate in Calluna vulgaris (L .) Hull . - Ibid. 10 : 77-91 .
Greig-Smith, P . 1 957 . Quantitative plant ecology. -London.
- 1 979. Pattern in vegetation . - J. Ecol. 67 : 755-779. Grime, J . P . 1 979 . Plant strategies and vegetation proces
ses . - Chichester. Grime, J . P . & Hunt, R. 1975 . Relative growth-rate: its
range and adaptive significance in a local flora. - J . Ecol . 63 : 393-422 .
Grolle, R. 1 976. Verzeichnis der Lebermoose Europas und benachbarter Gebiete. - Feddes Reprium 87 : 1 7 1 -279.
Haag, R . W . 1 974. Nutrient limitations to plant production in two tundra communities. - Can. J. Bot . 52: 103- 1 1 6.
Hagerup, 0 . 1 922 . Om Empetrum nigrum L . En naturhistorisk Studie . (Summary: On Empetrum nigrum .) Bot . Tidsskr . 37 : 253-304.
- 1 946. Studies on the Empetraceae. - Bioi. Meddr 20 (5): 1 -49.
Haglund, E.E. 1 905 . Ur de hognordiska vedvaxternas ekologi . - Diss . Uppsala.
Hamberg, H . E . 1 922. Termosynkroner och termoisokroner pa den skandinaviska halvon. (Resume: Thermosynchrones et thermoisochrones dans la peninsule scandinave . ) - Meteorol . iakttagelser i Sverige, Bih . 60 ( 1 9 1 8) : 1 -39.
Hari , P. , Kellomaki , S . & Vuokko, R . 1 977. A dynamic approach to the analysis of daily height growth of plants. - Oikos 28 : 234-24 1 .
Hari, P . & Leikola, M . 1 974. Further development of the dynamic growth model of plant height growth. -Flora, Jena 1 63 : 357-370.
Hari, P . , Leikola, M. & Rasanen, P. 1 970. A dynamic model of the daily height increment of plants . - Annls bot. fenn. 7 : 375-378.
A cta Phytogeogr. Suec. 74
Harper , J . L . 1 977 . Population biology of plants. - London .
- 1 978 . The demography of plants with clonal growth. - Verh. K. Akad . Wet . , Afd. Natuurk . , 2de Reeks 70: 27-48 .
- 1 982. After description. - Spec. pub I. Brit . Ecol. Soc. 1 : 1 1 -25 .
Hartnett, D . C. & Bazzaz, F .A. 1 983 . Physiological integration among intraclonal ramets in Solidago canadensis. - Ecology 64: 779-788.
Ha vas , P . & Lohi, K. 1 972. Hillan [Rubus chamaemorus] ekologiasta. (Summary: On the ecology of the cloudberry [Rubus chamaemorus] .) - Lapin Tutkimuss . Vuosik. 1 972: 1 5-20.
Hobbs , R . J . & Gimingham, C .H. 1 984. Studies on fire in Scottish heathland communities . I . Fire characteristics . - J . Ecol . 72: 223-240.
Hopkins, D .M. & Sigafoos, R . S . 1 95 1 . Frost action and vegetation patterns on Seward Peninsula, Alaska. A study of the geomorphic significance of vegetation patterns as related to frost action at high latitudes and in areas of perennially frozen ground. - Bull. U .S . Geol. Surv . 974-C: 5 1 - 101 .
Huttunen, A. 1978 . Hilla- ja karpalosadoista Siuruan alueella . (Summary : On the cloudberry and cranberry yields in Siurua district, N-Finland . ) - Suo 29: 1 7-21 .
Hylander, N . 1 966. Nordisk karlvaxtflora. 1 1 . - Stockholm .
Hytteborn, H . 1 975 . Deciduous woodland at Andersby, Eastern Sweden . Above-ground tree and shrub production . - Acta phytogeogr. suec. 6 1 : 1 -96.
Jessen , K . 1 9 1 3 . The structure and biology of arctic flowering plants . 1 1 . 8. Rosaceae. - Meddr Gmnland 37 : 1 - 1 26.
Johansson , L . -G. 1 974. The distribution and fate of 14C photoassimilated by plants on a subarctic mire at Stordalen. - Techn . Rep . of the Swed . Tundra Biome Proj . 16 : 1 65 - 1 72 .
Johnson, D.A. & Tieszen, L . L . 1 976. Aboveground biomass allocation, leaf growth, and photosynthesis patterns in tundra plant forms in arctic Alaska. - Oecologia 24: 1 59- 173 .
Jonasson , S . 1 982. Organic matter and phytomass on three north Swedish tundra sites, and some connections with adjacent tundra areas. - Holarct . Ecol. 5 : 367-375.
Kallio , P . 1 975 . Kevo, Finland. - Ecol. Bull . (Stockholm) 20: 1 93-223 .
Kallio, P . & Karenlampi , L. 1 97 1 . A review of the stage reached in the Kevo IBP in 1970. - In: Heal, O.W. (ed. ) : IBP, Tundra Biome. Working Meeting on analyses of ecosystems , Kevo, Finland, Sept . 1 970, pp. 79-9 1 .
Kallio, P . & Makinen, Y . 1 978 . Vascular flora o f Inari Lapland. 4. Betulaceae. - Rep. Kevo subarctic Res . Stat . 14: 3 8-63 .
Kardell, L. & Carlsson , E . 1 982. Hjortron, tranbar, lingon . Forekomst och barproduktion i Sverige

Production and growth dynamics of vascular bog plants 95
1 978-1 980. (Summary: Cloudberry , cranberry, lingonberry. Occurrence and production in Sweden 1 978-1 980. ) - Rep. Sect . environm . For . , Uppsala 25: 1 - 1 56.
Karenlampi , L . 1973 . Biomass and estimated yearly net production of the ground vegetation at Kevo . - In: Bliss, L .C . & Wielgolaski, F .E . (eds . ) : Primary production and production processes, tundra biome. Proc. of the Conf. , Dublin, Ireland, April 1 973 , pp . 1 1 1 - 1 14 .
Karlsson , S . 1 982. Ecology of a deciduous and an evergreen dwarfshrub : Vaccinium uliginosum and Vaccinium vitis-idaea in subarctic Fennoscandia. - Dept Plant Ecol. , Lund. Diss . (Mimeogr . )
Kayll , A . J . 1 966. Some characteristics of heath fires in North-East Scotland . - J . appl . Ecol . 3 : 29-40.
Kellomaki , S . , Hari , P . , Vuokko, R . , Vaisanen , E. & Kanninen, M . 1 977 . Above ground growth rate of a dwarf shrub community. - Oikos 29 : 143-149.
Keso , A. 1 908 . Ober Alter und Wachstumsverhaltnisse der Reiser in Tavastland. - Acta Soc. Fauna Flora fenn. 3 1 ( 1 ) : 1 -49.
Kihlman, A .O . 1 890. Pflanzenbiologische Studien aus Russisch Lappland . Ein Beitrag zur Kenntnis der regionalen Gliederung an der polaren Waldgrenze. Ibid. 6 (3): 1 -264.
Kjelvik , S . & Wielgolaski , F .E . 1 974. Biomass, nutrient content and energy of some dwarf shrubs in a Norwegian subalpine birch forest. - Rep . Kevo subarctic Res . Stat . 1 1 : 47-5 1 .
Kolkki, 0 . 1 966 . Taulukoita j a karttuja suomen lampooloista kaudelta 1 93 1 - 1 960. {Tables and maps of temperature in Finland during 1 93 1 - 1 960.) - Liite suomen meteorol. Vuosik . 65 , la ( 1 965) .
Kosonen, R . 1 98 1 . Isovarpuisen rameen kasvibiomassa ja tuotos. (Summary: Plant biomass and production in a dwarf-shrub pine bog. ) - Suo 32 : 95-97.
Kubicek, F. & Brechtl , J . 1 970. Production and phenology of the herb layer in an oak-hornbeam forest. -Biol6gia Bratisl . 25 : 65 1 -666.
Kubicek , F. & Jurko, A. 1 975 . Estimation of the aboveground biomass of the herb layer in forest communities. - Folia geobot . phytotax. 10: 1 1 3- 1 29.
Langlet, 0 . 1 935 . Till fragan om sambandet mellan temperatur och vaxtgranser. (Zusammenfassung: Ober den Zusammenhang zwischen Temperatur und Verbreitungsgrenzen von Pflanzen . ) - Meddn St . Skogsf-Anst 28 : 299-4 12 .
Larcher, W. , Cernusca, A. , Schmidt, L . , Grabherr, G. , Notzel , E . & Smeets , N . 1 975 . Mt. Patscherkofel, Austria. - Ecol . Bull . (Stockholm) 20: 1 25-139.
Lewis, M . C. & Callaghan, T.V. 1 97 1 . Bipolar botanical project . Primary production studies on Disko Island, West Greenland . - In: Heal, O.W. (ed . ) : Working meeting on analyses of ecosystems, Kevo , Finland, Sept . 1 970, pp. 34-50.
Lid , J . , Lie, 0 . & L0ddes0l , A . 196 1 . Orienterende fors0k med dyrking av molter . - Meddr norske Myrselsk . 59: 1 -26.
Liedenpohja, M. 198 1 . Avosuotyyppien kasvillisuus , kasvibiomassa ja tuotos Janakkalan Suurisuolla. (Summary: Vegetation , biomass and production of fens in Suurisuo mire , Janakkala, southern Finland.) - Suo 32: 100- 1 03 .
Lindholm, T. 1 980. Dynamics of the height growth of the hummock dwarf shrubs Empetrum nigrum L. and Calluna vulgaris (L.) Hull on a raised bog . - Annls bot. fenn. 1 7 : 343-356.
- 1982. Growth dynamics and the effect of frost in A ndromeda polifolia on a raised bog . - Ibid . 19 : 193-201 .
Lindholm, T. & Vasander, H . 1 98 1 . The effect of summer frost damage on the growth and production of some raised bog dwarf shrubs . - Ibid . 1 8 : 1 55-167 .
Lohi , K . 1974. Variation between cloudberries (Rubus chamaemorus L.) in different habitats. - Aquilo Ser . Bot. 1 3 : 1 -9 .
Loveless , A.R. 1 96 1 . A nutritional interpretation of sclerophylly based on differences in the chemical composition of sclerophyllous and mesophytic leaves . - Ann . Bot . 25 : 1 68- 1 84 .
- 1962. Further evidence to support a nutritional interpretation of sclerophylly. - Ibid . 26: 5 5 1 -561 .
Lovett Doust, L . 198 1 a . Population dynamics and local specialization in a clonal perennial (Ranunculus repens) . I . The dynamics of ramets in contrasting habitats . - J . Ecol. 69: 743-755 .
- 1981 b . Population dynamics and local specialization in a clonal perennial (Ranunculus repens). 11 . The dynamics of leaves, and a reciprocal transplant-replant experiment. - Ibid . 69: 757-768 .
Magnusson, N .H. & Lundqvist, G. 1 933 . Beskrivning till kartbladet Grangesberg. - Sver. geol. Unders . Ser . Aa 177 : 1 - 1 3 3 .
Makinen, Y. & Oikarinen, H . 1 974. Cultivation of cloudberry in Fennoscandia. - Rep . Kevo subarctic Res . Stat . 1 1 : 90- 102.
Malme, G.O. A:n 1 908 . Om forgrenade arsskott hos Calluna vulgaris (L . ) Salisb . (Zusammenfassung: Ober verzweigte Jahrestriebe bei Calluna vulgaris (L . ) Salisb.) - Svensk bot. Tidskr . 2: 85-94.
Malmer , N. 1 962. Studies on mire vegetation in the Archaean area of southwestern Gotaland (South Sweden) . I. Vegetation and habitat conditions on the Akhult mire. - Op . bot. Soc . bot . Lund 7 ( 1 ) : 1 -322.
- 1 968 . Ober die Gliederung der Oxycocco-Sphagnetea und Scheuchzerio-Caricetea fuscae. Einige Vorschlage mit besonderer Beri.icksichtigung der Verhaltnisse in S-Schweden . - Ber . int . Symp . int . Verein . Veg-Kunde 1 964: 293-305 .
Malmer, N. & Nihlgard, B. 1 980. Supply and transport of mineral nutrients in a subarctic mire. - Ecol . Bull . (Stockholm) 30: 63-95 .
Malmstrom, C. 1949. Studier over skogstyper och tradslagsfordelning inom Vasterbottens lan. (Zusammenfassung : Studien i.iber Waldtypen und Baumartenverteilung im Lan Vasterbotten . ) - Meddn St. Skogsflnst. 37 ( 1 1 ) : 1 -23 1 .
A cta Phytogeogr. Suec. 74
96 Ingvar Backeus
Marks, T .C. & Taylor, K. 1 972. The mineral nutrient status of Rubus chamaemorus L. in relation to burning and sheep grazing. - J . appl. Ecol . 9: 501 -5 1 1 .
Mentz , , A. 1 909 . The structure and biology of arctic flowering plants . I. 3. Empetraceae. Empetrum nigrum L . - Meddr Gmnland 36: 1 57- 1 67 .
Metsavainio, K . 1 93 1 . Untersuchungen i.iber das Wurzelsystem der Moorpflanzen . - Annls bot . Soc . zool .bot . fenn. Vanamo 1 ( 1 ) : 1 -422.
Miller, G.R. 1 979. Quantity and quality of the annual production of shoots and flowers by Calluna vulgaris in North-East Scotland. - J . Ecol. 67: 1 09- 1 29.
Miller, G .R . & Miles, J . 1 970. Regeneration of heather (Calluna vulgaris (L . ) Hull) at different ages and seasons in North-East Scotland . - J . appl. Ecol . 7 : 5 1 -60.
Miller , P .C . 1 982. Environmental and vegetational variation across a snow accumulation area in montane tundra in Central Alaska. - Holarct. Ecol . 5: 85-98 .
Miller, P . C . , Mangan, R. & Kummerow, J . 1 982. Vertical distribution of organic matter in eight vegetation types near Eagle Summit, Alaska. - Ibid . 5: 1 1 7- 1 24 .
Milner, C . & Hughes, R .E . 1 968 . Methods for the measurement of the primary production of grassland. -IBP Handbook 6: 1 -42.
Monk, C . D. 1 966. An ecological significance of evergreenness. - Ecology 47 : 504-505 .
Moore, D .M. 1 982. Flora Europaea check-list and chromosome index. - Cambridge.
Mork , E. 1 946. Om skogbunnens lyngvegetasjon . (Summary : On the dwarf shrub vegetation on forest ground.) - Meddr norske Skogfors0ksv . 33 : 269-356.
Moszynska, B . 1 970. Estimation of the green top production of the herb layer in a bog pinewood Vaccinia uliginosi-Pinetum. - Ekol . pol . 1 8 : 779-803 .
- 1 973 . Methods for assessing production of the upper parts of shrubs and certain perennial plants . - Ibid . 2 1 : 359-367 .
Mi.iller-Stoll, W . R . 1 947. Der Einfluss der Ernahrung auf die Xeromorphie der Hochmoorpflanzen. - Planta 3 5 : 225-25 1 .
Murray, C . & Miller, P .C . 1 982. Phenological observations of major growth forms and species in montane and Eriophorum vagina turn tussock tundra in Central Alaska. - Holarct. Ecol . 5: 1 09- 1 1 6.
Nannfeldt, J .A. 198 1 . Exobasidium, a taxonomic reassessment applied to the European species . - Symb . bot. upsal . 23 (2) : 1 -72.
Neuhausl , R. 1 972. Subkontinentale Hochmoore und ihre Vegetation. - Studie CSAV 1 3 : 1 - 1 2 1 .
Newbould, P . J . 1 967 . Methods for estimating the primary production of forests. - IBP Handbook 2 : 1 -62.
Nitschke, T. 1 860. Wachstumsverhaltnisse des rundblattrigen Sonnenthaues . - Bot . Ztg 18 (7) : 57-61 .
Noble, J . C . , Bell , A.D. & Harper , J . L . 1 979. The population biology of plants with clonal growth . I. The morphology and structural demography of Carex arenaria. - J . Ecol . 67 : 983-1008 .
Acta Phytogeogr. Suec. 74
Nordhagen, R . 1 937 . Studien i.iber die monotypische Gattung Calluna Salisb. I. Ein Beitrag zur Bicornes-Forschung. - Bergens Mus . Arb . , naturv. rekke 1 937 (4) : 1 -5 5 .
Oinonen , E. 1967 . Sporal regeneration o f bracken (Pteridium aquilinum (L.) Kuhn . ) in Finland in the light of the dimensions and the age of its clones. - Acta for. fenn . 83 ( 1 ) : 1 -96.
0stgard , 0. 1 964 . Molteunders0kelser i Nord-Norge. (Summary: Investigations on cloudberries (Rubus chamaemorus L.) in North-Norway . ) - Forskning og fors0k i Landbruket 1 964: 409-444.
Pearl, R. & Miner, J . R. 1 93 5 . Experimental studies on the duration of life. XIV . The comparative mortality of certain lower organisms . - Q. Rev . Bioi . 10 : 60-79.
Pearsall , W.H. & Gorham, E . 1 956. Production ecology. I . Standing crops of natural vegetation. - Oikos 7 : 1 93-20 1 .
Persson, H . 1 975a . Deciduous woodland at Andersby, eastern Sweden : field-layer and below-ground production. - Acta phytogeogr . suec. 62: 1 -7 1 .
- 1 975b. Dry matter production of dwarf shrubs, mosses and lichens in some sects pine stands at Ivantjarnsheden, Central Sweden . - Techn. Rep . Swed . coniferous Proj . 2: 1 -25 .
- 1 978 . Root dynamics in a young sects pine stand in Central Sweden . - Oikos 30: 508�5 1 9.
- 1 979. Fine-root production, mortality and decomposition in forest ecosystems. - Vegetatio 4 1 : 1 0 1 - 1 09.
- 1 980. Structural properties of the field and bottom layers at Ivantjarnsheden . - Ecol . Bull . (Stockholm) 32: 1 53 - 1 63 .
Perttu, K . , Odin, H . & Engsjo, T. 1 978a. Bearbetade klimatdata fran SMHI-stationerna i Sverige. 1 . Vegetationsperioder, temperatursummor och vaxtenheter for enstaka ar perioden 1 96 1 - 1 976. - Res . Notes Dept. Reforestation , Stockholm 1 00: 1 -344.
Perttu , K . , Odin, H. & Engsjo, T. 1 978b . Bearbetade klimatdata fran SMHI-stationerna i Sverige. 2. Vegetationsperioder , temperatursummor och vaxtenheter som medelvarden med standardavvikelser for perioden 1 961 - 1 976 . - Ibid. 1 0 1 : 1 - 1 1 5 .
Perttula, U . 1949 . Ober die Phanologie und Vermehrungsokologie einiger ostlichen Pflanzenarten in Juksowo si.idlich des Swir . I. - Oikos 1 : 83-1 1 3 .
Plewczynska, U . 1 970 . , Herb layer production and plant fall in the association Pino-Quercetum, Kozlowska 1 925 in the Pisz forest. - Ekol. pol . 1 8 : 757-778 .
Porsild , A.E. 1 938 . The cranberry in Canada. - Can. Fld . Nat . 52: 1 1 6- 1 1 7 .
Porsild, M . P . 1 930. Stray contributions t o the flora of Greenland 1-V. - Meddr Gmnland 77 : 1 -44.
Post , L. von & Sernander, R. 1 9 1 0. Pflanzenphysiognomische Studien auf Torfmooren in Narke . - Livretguide des exc . en Suede du Xle Congr . geol . int . 1 4: 1 -48.
Puszkar, L. , Traczyk, T. & W6jcik, Z . 1 972. Primary production of the herb layer and plant fall in the Vaccinia myrtilli-Pinetum forest association in the Pisz fo-
Production and growth dynamics of vascular bog plants 97
rest (North-East Poland) . - Ekol . pol. 20: 253-285 . Rauh, W . 1938 . Ober die Verzweigung auslauferbilden
der Straucher mit besonderer Berucksichtigung ihrer Beziehungen zu den Stauden. - Hercynia 1 : 1 87-23 1 .
Raunkiaer, C . 1 895-1 899. De danske Blomsterplanters Naturhistorie. 1 . Enkimbladede. - Kj0benhavn .
Rawes, M. & Welch , D . 1 969. Upland productivity of vegetation and sheep at Moor House National Nature Reserve, Westmorland, England. - Oikos , suppl. 1 1 : 1 -72.
Reader, R . J . & Stewart, J . M . 1 972. The relationship between net primary production and accumulation for a peatland in southeastern Manitoba. - Ecology 53 : 1 024- 1037.
Resvoll, T .R. 1 925 . Rubus chamaemorus L . Die geographische Verbreitung der Pflanze und ihre Verbreitungsmittel . - Veroff. geobot . Inst . Zurich 3 : 224-252.
- 1 929. Rubus chamaemorus L. A morphological - biological study. - Nyt Mag. Naturvid. 67: 55- 1 29.
Robertson , K .P . & Woolhouse, H.W. 1 984a. Studies of the seasonal course of carbon uptake of Eriophorum vagina tu m in a moorland habitat. I. Leaf production and senescence. -J. Ecol. 72: 423-435 .
Robertson, K.P. & Woolhouse, H . W . 1 984b . Studies of the seasonal course of carbon uptake of Eriophorum vaginatum in a moorland habitat. I I . The seasonal course of photosynthesis . - Ibid . 72: 686-700.
Robertson, R.A. & Davies, G .E . 1 965 . Quantities of plant nutrients in heather ecosystems. - J. appl . Ecol . 2 : 2 1 1 -2 1 9 .
Rosswall , T. , Flower-Ellis , J .G .K . , Johansson, L .G . , Jonsson , S . , Ryden, B .E . & Sonesson , M . 1 975 . Stordalen (Abisko), Sweden . - Ecol . Bull . (Stockholm) 20: 265-294.
Saeb0, S. 1 968 . The autecology of Rubus chamaemorus L. I. Phosphorus economy of Rubus chamaemorus in an ombrotrophic mire . - Meld. Norges Landbruksh0gsk . 47 ( 1 ) : 1 -67 .
Samuelsson, G. 1 922. Zur Kenntnis der Schweizer Flora. - Vjschr. naturf. Ges. Zurich 67 : 224-267 .
Santesson , R. 1984. The lichens of Sweden and Norway. - Stockholm & Uppsala.
Sarukhan, J. & Harper, J. L. 1 973 . Studies on plant demography: Ranunculus repens L . , R. bulbosus L. and R. acris L. I. Population flux and survivorship. - J . Ecol. 6 1 : 675-7 16 .
Sarvas , R. 1 967 . The annual period of development of forest trees. - Sber. finn. Akad . Wiss . 1 965 : 21 1 -23 1 .
Schamurin, V .F . , Polozova, T . G . & Khodachek, E .A. 1 972. Plant biomass of main plant communities at the Tareya station (Taimyr) . - In: Wielgolaski , F.E. & Rosswall, T. (eds . ) : Tundra biome. Proc. IV. int . meeting on the biological productivity of tundra, Leningrad, USSR, Oct. 1 97 1 , pp. 1 63- 1 8 1 .
Schmid, B . 1 984. Life histories i n clonal plants o f the Carex flava group. - J . Ecol . 72: 93- 1 1 4.
Segerstedt, P. 1 894. Studier ofver buskartade stammars
skyddsvafnader. - Bih. K. svenska Vetensk-Akad. Handl . 1 9 1II (4) : 1::-87 .
Serebryakov, I .G. 1 962. Cepe6pHKOB, M . r. 1 962: 3KonorHqecKaH Mop<l>onorHH pacTeHHH. - MocKBa.
Sernander, R. 1 90 1 . Den skandinaviska vegetationens spridningsbiololgi . (Resume: Zur Verbreitungsbiologie der skandinavischen Pflanzenwelt . ) - Uppsala.
Shaver , G .R . & Cutler, J .C . 1 979. The vertical distribution of live vascular phytomass in cottongrass tussock tundra. - Arct. alp. Res. 1 1 : 335-342 .
Simonis , W. 1 948. C02-Assimilation und Xeromorphie von Hochmoorpflanzen in Abhangigkeit vom Wasserund Stickstoffgehalt des Bodens . - Bioi . Zbl . 67: 77-83 .
Sims, R .A. & Stewart, J . M . 1 98 1 . Aerial biomass distribution in an undisturbed and disturbed subarctic bog . - Can. J . Bot. 59: 782-786.
Sjors, H. 1 948 . Myrvegetation i Bergslagen. (Summary: Mire vegetation in Bergslagen, Sweden.) - Acta phytogeogr. suec . 2 1 : 1 -299.
- 1950. Regional studies in North Swedish mire vegetation . - Bot . Notiser 1 950: 1 73-222.
- 1963 . Bogs and fens on Attawapiskat River, northern Ontario . - Bull. natn . Mus . Can. 1 86: 45- 1 3 3 .
SMHI (Swedish meteorological and hydrological Institute) 1 956- 1 983 . Nederborden i Sverige. (Precipitation in Sweden) . - Arsb . Sver. meteorol . hydrol. Inst . 37 ( 1 955)-63 ( 198 1 ) , 2 . 1 .
- 1 962- 1 982. Meteorologiska iakttagelser i Sverige. (Meteorological observations in Sweden . ) - Ibid. 37 ( 1 955)-63 ( 1 98 1 ) , 2 .2 .
Sonesson, M. & Bergman, H . 1 972. Phytomass changes between two samplings. Stordalen 1970. - Techn. Rep . Swed. Tundra Biome Proj . 2: 1 -23 .
Sonesson , M . & Bergman, H . 1 980. Area-harvesting as a method of estimating phytomass changes in a tundra mire. - Ecol. Bull. (Stockholm) 30: 1 27- 1 37 .
Stavset, K . 198 1 . Avlingskontroll av molter . Registreringer, ara 1 97 1 - 1 980 i And0y. - Jord og Myr 5 : 60-65 .
Stew art, J . M . & Reader, R. 1972. Some considerations of production: accumulation dynamics in organic terrain . - Proc. 4th int . peat congr. 1 : 247-258 .
Stoner, W.A. , Miller, P . & Miller, P .C . 1982. Seasonal dynamics and standing crops of biomass and nutrients in a subarctic tundra vegetation. - Holarct . Ecol . 5 : 1 72- 179.
Supan, A. 1 887. Die mittlere Dauer der HauptWarmeperioden in Europa. - Petermanns Mitt . 33 : 1 65 - 1 72.
Swales, D .E . 1 97 5 . An unusual habitat for Drosera rotundifolia L . , its over-wintering state, and vegetative reproduction. - Can. Fld Nat . 89: 143-147 .
Tamm, C . O . 1 954. Some observations o n the nutrient turn-over in a bog community dominated by Eriophorum vaginatum L. - Oikos 5: 1 89- 1 94.
- 1 956. Further observations on the survival and flowering of some perennial herbs . I . - Ibid. 7 :273-292.
Tamm, O.F .S . 1 959. Studier over klimatets humiditet i
Acta Phytogeogr. Suec. 74
98 lngvar Backeus
Sverige. (Studien iiber die HumidiHit des Klimas in Schweden .) - K. Skogshogsk . Skr . 32: 1 -48.
Taylor, K . 1 97 1 . Biological flora of the British Isles . Rubus chamaemorus L . - J . Ecol . 59 : 293-306 .
Traczyk, H . 197 1 . Relation between productivity and structure of the herb layer in associations on ' 'The Wild Apple-tree Island" (Masurian Lake District) . Ekol . pol . 1 9 : 333-363 .
Traczyk, T. 1 967a. Studies on herb layer production estimate and the size of plant fall. - Ibid. Ser . A 1 5 : 837-867 .
- 1 967b. Propozycja nowego sposobu oceny produkcji runa. (Summary: A proposed new way of estimating the production of the forest herb layer .) - Ibid. Ser. B 1 3 : 241 -247.
Traczyk, T. & Traczyk , H . 1 977 . Structural characteristics of herb layer and its production in more important forest communities of Poland . - Ibid. 25 : 3 59-378.
Traczyk , T . , Traczyk , H . & Moszynska, B . 1 973 . Herb layer production of two pinewood communities in the Kampinos national park . - Ibid . 2 1 : 37-55 .
Tuhkanen, S. 1 980. Climatic parameters and indices in plant geography. - Acta phytogeogr. suec . 67 : 1 - 1 05 .
- 1 984. A circumboreal system o f climatic-phytogeographical regions. - Acta bot . fenn. 1 27 : 1 -50.
Tyler, G., Gullstrand, C . , Holmquist , K.-A. & Kjellstrand, A.-M . 1 973 . Primary production and distribution of organic matter and metal elements in two heath ecosystems . - J. Ecol. 6 1 : 25 1 -268.
Ungerson , J . & Scherdin, G . 1 962. Untersuchungen iiber den Tagesverlauf der Photosynthese und der Atmung unter natiirlichen Bedingungen in der Subarktis (Finnisch-Lappland). - Annls bot. Soc. zool . bot . fenn. 'Vanamo' 32 (7) : 1 -22.
Vasander, H. 198 1 . Keidasrameen kasvibiomassa ja tuotos . (Summary: Plant biomass and production in an ombrotrophic raised bog . ) - Suo 32: 9 1 -94.
Vassiljevskaja, V . D . , lvanov , V . V . , Bogatyrev, L .G. , Pospelova, E . B . , Shalaeva, N.M. & Grishina, L .A. 1 975 . Agapa, USSR. - Ecol . Bull . (Stockholm) 20: 1 4 1 - 1 5 8 .
Veijalainen, H . 1 976. Effect of forestry o n the yields of wild berries and edible fungi . - Ibid . 21 : 63-65 .
Vuokko, R . , Kellomaki , S. & Hari , P . 1 977. The inherent growth rhythm and its effects on the daily height increment of plants. - Oikos 29: 1 37-142 .
Waldheim, S . 1 944. Die Torfmoosvegetation der Provinz Narke. - Lunds Univ. Arsskr . N.F . avd. 2 40 (6) : 1 �9 1 .
Wallen, B. 1 980. Structure and dymanics of Calluna vulgaris on sand dunes in South Sweden . - Oikos 3 5 : 20-30.
Waiter, H. & Lieth , H . 1 960. Klimadiagramm-Weltatlas. 1 . Lieferung. - Jena.
Acta Phytogeogr. Suec. 74
Warenberg, K. 1 982. Reindeer forage plants in the early grazing season. Growth and nutritional content in relation to climatic conditions . - Acta phytogeogr . suec . 70: 1 -7 1 .
Warming, E . 1 884. Om Skudbygning, Overvintring og Foryngelse. - Naturhist. For. Festskr. Kj 0benhavn .
- 1 908 . The structure and biology of arctic flowering plants. 1 . Ericineae (Ericaceae, Pirolaceae) . 1 . Morphology and biology. - Meddr Gmnland 36: 1 -7 1 .
Watt , A . S . 1 947 . Contributions to the ecology o f bracken (Pteridium aquilinum) . IV. The structure of the community. - New Phytol . 46 : 97- 1 2 1 .
- 1 95 5 . Bracken versus heather, a study in plant sociology. - J. Ecol . 43 : 490-506.
Weber, C.A. 1 902. Uber die Vegetation und Entstehung des Hochmoors von Augstumal im Memeldelta mit vergleichenden Ausblicken auf andere Hochmoore der Erde . - Berlin.
Wein, R.W. & Bliss , L.C. 1 973 . Changes in arctic Eriophorum tussock communities following fire. - Ecology 54: 845-852.
Wein, R.W. & Bliss , L.C. 1 974. Primary production in arctic cottongrass tussock tundra communities . -Arct. alp. Res . 6: 261 -274.
Westhoff, V. & den Held , A .J . 1 969. Plantengemeenschappen in Nederland . - Zutphen .
White, J . 1 979. The plant as a metapopulation . - A. Rev . Ecol. Syst . 10 : 1 09- 145 .
White, J . & Harper , J . L . 1 970. Correlated changes in plant size and number in plant populations. - J . Ecol. 58 : 467-485 .
Wielgolaski , F . E . 1966: The influence o f air temperature on plant growth and dev�lopment during the period of maximal stem elongation. - Oikos 1 7 : 1 21 - 141 .
Wielgolaski, F .E . & Kjelvik, S. 1 973 . Production of plants (vascular plants and cryptogams) in alpine tundra, Hardangervidda. - In: Bliss , L . C . & Wielgolaski , F .E. (eds . ) : Primary production and production processes, tundra biome . Proc. Conf. , Dublin , Ireland, April 1 973 , pp. 75-86.
Williams, C .B . 1 964. Patterns in the balance of nature. - London & New York.
Yelina, G.A. 1 974. Biological productivity of Karelian peatlands . - Proc. int. Symp. on forest drainage, Sept. 1974, Jyvaskyla - Oulu , Finland, pp . 7 1 -79.
Zalenskij , O . V . , Shvetsova, V . M . & Voznessenskij , V .L . 1 972. Photosynthesis in some plants of western Taimyr. - In : Wielgolaski , F .E . & Rosswall , T. (eds . ) : Proc. IV. int. Meeting of the biological Productivity of Tundra, Leningrad , USSR, Oct . 1 97 1 , pp . 1 82- 1 86 .
Zumer , M . 1 969 . Vekstrytme hos noen skogstraer i forskjellige h0ydelag. (Summary: Growth rhythm of some forest trees at different altitudes . ) - Meldr Norges Landbruksh0gsk . 48 (5) : 1 -3 1 .
99
S V E N S K A V AXTGEOGRAFI S K A S A LLSK APET
SOCIETAS PH YTOG EOGRAPHICA S U ECANA A dress: Vaxtbiologiska institutionen , B o x 559 , S-75 1 22 U ppsala, Sweden
Sallskapet har till andamal att vacka och underhalla intresse fOr vaxtgeografien i vidstracktaste mening, att framja utforskande av flora och vegetation i Sverige och andra lander och att havda geobotanikens praktiska och vetenskapl iga betydelse .
Sallskapet anordnar sammankomster och exkursioner samt utger tva publikationsserier. Medlemskap kan erhallas efter anmalan hos sekreteraren. Foreningar, bibliotek , laroanstalter och andra insti tutioner kan inga som abonnenter . Arsavgift 50 kr (35 for studerande) .
Sallskapet utger arligen A cta Phytogeographica Suecica .
Medlem mar och abonnenter erhaller arets Acta mot postforskott pa arsavgiften jamte porto och expedit ionskostnader.
V issa ar utges extraband av Acta, som erhalls mot en tilllaggsavgift .
Sallskapet utger ocksa d e n ickeperiodiska serien Viixteko
logiska studier. Den kan forvarvas efter bestall ning el ler genom staende abonnemaog hos Sallskapet .
Bada serierna kan ocksa erhallas i byte mot andra publikationer efter hanvandelse till Vaxtbiologiska institutionens bibl iotek .
The object o f the Society is t o promote investigation in flora and vegetat ion, their history and their ecological backgroun d . Through publication o f monograph s , a n d other activitie s , the Society tries to stimulate geobotanical research and its application to practical and scientific problem s . Membership is open to all who have a personal interest in the advancement of phytogeography.
I ndividual members and subscribers ( societie s , institutes, l ibraries , etc . ) receive the A cta Phytogeographica Suecica for annual dues of 50 Skr plus postage. There are additional fees in years when more than one volume are issued . For membership please apply to the Secretary.
The Society also issues V iixteko/ogiska studier, which appear irregularly and are available upon request or standing order.
Both series can be received by e xchange for other scientific publications . Please apply to the I nstitute Library (address as above) .
ACTA PH YTOG EOGRAPHICA S U ECICA
I . E. A lmquist , U pplands vegetation och flora. ( V egetation and flora of Uppland . ) 1 929. I S B N 9 1 -72 1 0-00 1 -X .
2 . S . Thunmark , Der See Fiolen und seine Vegetation . 1 93 1 . 46:-. ISBN 91 -72 1 0-002-8 .
3. G. E. Du Rietz, Life-forms of terrestrial flowering plants . I . 1 93 1 . 28:- ISBN 9 1 -72 1 0-003-6.
4 . B. Lindquist , Om den vildvaxande skogsalmens raser och deras utbredning i Nord vasteuropa . ( Su mmary : The races of spontaneous Ulmus glabra H u d s . and their distribution in N W . E u rope.) 1932. 23 :-. ISBN 9 1 -72 1 0-004-4.
5. H. Osvald, Vegetation of t he Pacific coast bogs of North America. 1 93 3 . 1 8 :-. I S B N 9 1 -72 1 0-005-2.
6. G. Samuelsson , Die Verbreitung der hoheren Wasserpflanzen in Nordeuropa. 1 934. 49:-. I SBN 9 1 -72 1 0-006-0.
7. G. Degelius. Das ozeanische Element der Strauch- und Laubflechtenflora von Skandinavien . 1 93 5 . 62:-. ISBN 9 1 -72 10-007-9.
8. R. Sernander, Granskar och Fiby urskog. En studie over stormluckornas och marbuskarnas betydelse i den svenska granskogens regeneration. (Summary : The pri mitive forests of Granskar and Fib y . A study of the part played by storm-gaps and dwarf trees in the regeneration of the Swedish spruce forest.) 1 936. 52:-. I S B N 9 1-72 1 0-008-7.
9 . R. Sierner, Flora der Insel Oland . Die Areale der Ge
fasspflanzen Glands nebst Bemerk ungen zu ihrer Oekologie und Soziologie . 1938 . I S BN 9 1 -72 1 0-009-5 .
I 0. B. Lindquist, Dalby Soderskog. En skansk lovskog i forntid och nutid . (Zusammenf. : Ein Laubwald in Schonen in der Vergangenheit und Gegenwart .) 1 938 . 56:-. ISBN 9 1 -72 1 0-0 1 0-9.
1 1 . N. Stalberg, Lake Vattern. Outlines of its natural history , especially i ts vegetation . 1 939 . 20:-. ISBN 9 1 -72 1 0-0 1 1 -7 .
1 2 . G. E. D u Rietz , A . G. Hannerz , G. Lohammar, R . San
tesson & M . Wtl'rn, Zur Kenntnis der Vegetation des Sees Takern . 1 939. 20:- . I S B N 91 -72 1 0-0 12-5.
13. Viixtgeografiska studier tilliignade Cart Skottsberg pa
sextioarsdagen 1 / 1 2 1 940. (Geobotanical studies dedicated to C . Skottsberg. ) 1 940. 62 :-. I S BN 91 -72 1 0-0 1 3-3 .
14 . N. Hylander, De svenska formerna av Mentha gentilis L . col i . (Zusammenf. : Die schwedischen Formen der Mentha genti l is L. sensu coli . ) 1 94 L 20:-. ISBN 9 1 -72 1 0-0 1 4- 1 .
1 5 . T. E. Hasselrot , Till kannedomen o m nagra nordiska umbilicariaceers utbredning. (Zusammenf. : Zur Kenntnis der Verbreitung einiger U mbilicariaceen i n Fennoscandia.) 1 94 1 . 26:-. ISBN 9 1 -72 10-0 1 5-X.
16 . G. Samuelsson, Die Verbreitung der Alchemilla-Arten aus der Vulgaris-Gruppe in Nordeuropa . 1 943 . 3 5 :-. ISBN 9 1 -72 1 0-0 1 6-8 .
1 7 . Th . A rwidsson , Studien iiber die Gefasspflanzen in den
Hochgebirgen der Pite Lappmark. 1943 . 60:-. ISBN 9 1 -72 1 0-0 1 7-6.
Acta Phytogeogr. Suec. 74

1 00
1 8 . N. Dahlbeck. Strandwiesen am sudostlichen bresund . ( Summary: Salt marshes on the S. E. coast of bresund . ) 1 945. 30:-. ISBN 9 1 -72 1 0- 0 1 8-4.
19. E. von Krusenstjerna, Bladmossvegetation och bladmossflora i U ppsalatrakten . ( S u m mary : Moss flora and moss vegetation in t he neighbourhood of U ppsala . ) 1 945 .
65:-. I SBN 9 1 -72 1 0-0 1 9-2.
20. N. A lbertson, bsterplana hed . E tt alvaromdide pa Kinnekul le . (Zusammenf. : bsterplana hed . Ein Alvargebiet auf dem K innekul le . ) 1 946. ISBN 9 1 -72 1 0-020-6.
2 1 . H. Sjors , M y rvegetation i Bergslagen . ( Su mmary : Mire vegetation in B ergslagen, Sweden.) 1 948. 62 :-. I S B N 9 1 -72 1 0-02 1 -4 .
22 . S. A hlner, U tbredningstyper bland nordiska barrtradslavar. ( Zusammenf. : Verbrei tungstypen u nter fe nnoskandischen Nadelbaumflechten. ) 1 948 . 56:-. ISBN 9 1 -72 1 0-
022-2 .
23 . E. Julin , Vessers udde , Mark och vegetation i en igenvaxande lovang vid Bjarka-Sab y . ( Zusammenf. : Vessers udde . Boden und Vegetation in einer verwachsenden Laubwiese bei Bjarka-Saby in bstergotland, Sudschweden . ) 1 948. 44:-. ISBN 9 1 -72 1 0-023-0.
24. M . Fries , Den nordiska utbredningen av Lactuca alpina, Aconitum septentrionale , Ranunculus platanifol ius och Pol ygonatum verticil lat u m . (Zusammenf. : Die nordische Verbreitung von Lactuca alpina . . . ) 1 949. 20:-. ISBN 9 1 -72 1 0-24-9.
25 . 0. GjtPrevo/1 , Sn�leievegetasjonen i Oviksfjellene . ( Summary : The snow-bed vegetat ion of Mts Oviksfjal len , Jamtland, Swede n . ) 1 949. 30:-. ISBN 9 1 -72 1 0-025-7 .
26. H. Osvald, Notes on the vegetation of B ritish and Irish mosses. 1 949. 20:-. ISBN 9 1 -72 1 0-026-5 .
27. S. Selander, Floristic phytogeography of South-Western Lule Lappmark (Swedish Lapland) . I. 1 950. 46 :-. I S B N 9 1 -72 1 0-027-3 .
2 8 . S . Selander. Floristic phytogeography o f South-Western Lule La pp mark ( Swedish Lapland ) . 1 1 . Karlvaxtfloran i sydvij.stra Lule Lappmark . (Summary : Vascular flora . ) 1 950. 38:-. I S B N 9 1 -72 1 0-028- 1 .
29. M . Fries , Pollenanal ytiska vittnesbord om se nkvartar vegetationsutveckling, sarskilt skogshistoria. i nordvastra Go tal and . ( Zusammenf. : Pollenanalytische Zeugnisse der spatquartaren Vegetationsentwicklung, hauptsachlich der Waldgeschichte , im nordwestlichen Gotaland , Si.idschweden.) 1 95 1 . 49:-. ISBN 9 1 -72 1 0-029-X .
30. M. W lPrn , Rocky-shore algae in the bregrund A rchipelago . 1 952. 62 :-. I S B N 9 1 -72 1 0-030-3 .
3 1 . 0. Rune, Plant l ife on serpentines and related rocks in the North of Sweden . 1 95 3 . 30:-. ISBN 9 1 -72 1 0-03 1 - 1 .
3 2 . P. Kaaret, Wasservegetation der Seen Orlangen und Trehorningen. 1 95 3 . 20:-. I S B N 9 1 -72 1 0-032-X.
33. T. E. Hasselrot, N ordliga lavar i Syd- och Mel lansverige . ( Nordl iche Flechten in Si.id- und Mittelschweden . ) 1 95 3 .
46:-. I S B N 9 1 -72 1 0-03 3-8 .
34. H. Sjors, Slatterangar i Grangarde finnmark . (Sum mary : Meadows in Grangarde Fin n mark, SW. Dalarna, Sweden.) 1 954. 36:-. ISBN 9 1 -72 1 0-034-6.
3 5 . S. Kilander, Karlvaxtemas ovre granser pa fjall i sydvastra Jamtland samt angransande delar av Harjedalen och
Acta Phytogeogr. Suec. 74
N orge . (Summary : U pper l i m its of vascular plants on mountains in Southwestern J amtland and adjacent parts of Harjedalen (Sweden) and Norway.) 1 95 5 . 40:-. ISBN 9 1 -72 1 0-035-4.
3 6 . N. Quenners!edt. Diatomeerna i Uingans sjovegetat ion. ( Summary : Diatoms in the lake vegetation of the Umgan d rainage area, Jamtland , Swede n . ) 1 95 5 . 40:-. I S B N 9 1 -72 1 0-036-2.
37. M.-B . Florin, Plankton of fresh and brackish waters in the Sodertalje area. 1 957. 30:-. I S B N 9 1 -72 1 0-037-0.
38 . M . - B . Florin , Insjostudier i Mellansverige . M ikrovegetation och pollenregn i vikar av bstersjobackenet och insjoar fran preboreal t id t i l l nutid . ( Su m mary : Lake studies in Central Sweden. M icrovegetat ion and pollen rai n in inlets of the Baltic basin and in lakes from Preboreal time to the present day . ) 1 95 7 . 1 6 :-. ISBN 9 1 -72 1 0-038-9.
39. M. Fries , Vegetationsutveckl ing och odlingshistoria i Varnhemstrakten. En pollenanal ytisk undersokning i Vastergotland . (Zusam men f. : Vegetationsent wicklung u nd Siedlungsgeschichte im Gebiet von Varnhe m . Eine pollenanalytisc he U ntersuchung aus Vastergotland ( Sudschweden) . ) 1 95 8 . 26:-. I S BN 9 1 -72 1 0-03 9-7 .
40. Benxt Pettersson , Dynamik och konstans i Gotlands flora och vegetation . ( Resume: Dynamik und Konstanz in der Flora und Vegetation von Gotland, Schweden .) 1 95 8 .
75:-. I S B N 9 1 -72 1 0-040-0.
4 1 . E. Uxxla. Skogsbrandfalt i M uddus nat ionalpark . ( Summary : Forest fire areas in M uddus National Park , Northern Swede n . ) 1 958. 33 :- . I S B N 9 1 -72 1 0-04 1 -9.
42 K. Thomasson , Nahuel H uapi . Plankton of some lakes in an Argentine National Park, with notes on terrestrial vegetation. 1 959. 30:-. I S B N 9 1 -72 1 0-042-7.
43 . V. Gillner. Vegetations- und Standortsuntersuchu ngen in den Strandwiesen der schwedischen Westkuste . 1 960.
48 :- . I S B N 9 1 -72 1 0-043-5 .
44 . E. Sjijgren , Epiphytische Moosvegetation in Laubwaldern der Insel bland . Schwede n . ( Summary : Epiphytic moss communities in deciduous woods on the island of bland, Sweden . ) 1 96 1 . 38 :-. I SBN 9 1 -72 1 0-044-3 (ISBN 9 1 -72 1 0-444-9).
45 . G. Wistrand, Studier i Pite Lappmarks karlvaxtflora . med sarskild hansyn till skogslandet och de isolerade fjalle n . ( Zusam menf. : Studien i.iber d i e Gefasspflanzenflora der Pite Lappmark mit besonderer Berucksichtigung des Waldlandes und der isolierten niederen Fjelde . ) 1 962 .
49 :-. I S B N 9 1 -72 1 0-045- 1 ( I S BN 9 1 -72 1 0-445-7 ) .
4 6 . R. lvarsson , Lovvegetation i Mollosunds soc ken . ( Zusamme nf. : Die Laubvegetation im K irchspiel Mollos u n d . Bohuslan , Schwede n . ) 1 962 . 40:-. ISBN 9 1 -72 1 0-046-X
( I S B N 9 1 -72 1 0-446-5) .
47 . K . Thomasson , Araucanian Lakes . Plankton studies in North Patagonia, with notes on terrestrial vegetation . 1 963. 45 :-. I S B N 9 1 -72 1 0-047-8.
48. E. S}oxren , Epilitische und epigaische Moosvegetation in Laubwaldern der Inset bland , Schwede n . ( Su m mary : Epi l i thic and epigeic moss vegetation in deciduous woods on the island of bland , Sweden . ) 1 964 . 60:-. I S B N 9 1 -72 1 0-048-6 ( I S BN 9 1 -72 1 0-448- 1 ) .
49. 0. Hedberg , Features o f afroalpine plant ecology . ( Re-
sume fram;ais . ) 1964. 60:-. ISBN 9 1 -72 1 0-049·4 ( I S B N 9 1 -72 1 0-449-X) .
50. The Planr Cmw of S weden . A study dedicated to G . Ei nar D u R ietz o n h i s 70th birthday b y h i s pupi l s . 1 965 . 1 1 0:-. ISBN 9 1 -72 1 0-050-8.
5 1 . T. Flensburg, Desmids and other benthic algae of Lake Kavsjon and Store M osse , S W Sweden . 1 967 . 50:-. I S B N 9 1 -72 10-05 1 -6 ( I S B N 9 1 -72 1 0-45 1 - 1 ) .
5 2 . E. Skye , Lichens and a i r pol lut ion . A study o f cry ptogamic epiph ytes and enviro n me nt i n the Stoc kholm region . 1 968 . 70:-. ISBN 9 1 -72 1 0-052-4 ( ISBN 9 1 -72 1 0-452-X) .
53 . Jim Lundqvist, Plant cover and env ironment of steep h i l l sides in Pi te Lappmark . ( Resume : La couverture vegetate et ! ' habitat des fl ancs escarpes des col l i nes de Pite Lappmark . ) 1 968 . 60 :- . I S B N 9 1 -7 2 1 0-053-2 ( I S B N 9 1 -72 1 0-453-8 ) .
5 4 . Conserva tion of VeRefation i n Africa South of rhe Saha
ra . Proc . of symp . at 6th plen . meeting of A ETFAT. Ed . by I nga and Olov Hed berg. 1 968 . 80:-. I S B N 9 1 -72 1 0-054-0 ( IS B N 9 1 -72 1 0-454-6) .
5 5 . L . - K . K()niRsson , The H olocene history of t he G reat A l v a r of b land . 1 968 . 75 :- . ISBN 9 1 -72 1 0-055-9 ( I SBN 9 1 -72 1 0-455-4).
56. H . P. HaflherR . Vegetation auf den Schalenablage ru ngen i n Bohusla n , Schwede n . ( Su m mary : Vegetation on shell deposits i n Bohuslan , Swed e n . ) 1 97 1 . 60 :-. I S B N 9 1 -72 1 0-056-7 ( I S B N 9 1 - 72 1 0-456- 2 ) .
5 7 . S . Fransso n . M y rvegetation i syd vastra Varm land . ( S u m mary : M i re vegetation in sout h-western Varmland , Swed en . ) 1 972 . 5 5 : - . I S B N 9 1 -72 1 0-057-5 ( I S B N 9 1 -72 1 0-457-0) .
5 8 . G. Wallin . Lovskogsvegetation i Sj uharad sbygde n . ( S u m mary : Deciduous woodlands i n Sj uharad sbygde n , Vastergotland , sou th-we stern Swede n . ) 1 973 . 55 : - . I S B N 9 1 - 72 1 0-058-3 ( I S B N 9 1 -72 1 0-458-9 ) .
5 9 . D . Johansson . Ecology of vascular epiph ytes i n West African rai n forest . ( Re s u me : Ecologie des epiph ytes vasculaires dans la foret dense hum ide d ' Afrique occidentale . ) 1 974. I S BN 9 1 -72 1 0-059- 1 ( I S B N 9 1 -72 1 0-459-7 ) .
60. H. 0/sson , Studies on South S wedish sand vegetation. 1 974. 80:-. ISBN 9 1 -72 1 0-060-5 ( I SBN 9 1 -7 2 1 0-460-0).
6 1 . H. Hyr reborn . Dec iduous woodland at A ndersby , Eastern Swede n . Above-ground t ree and shrub production . 1 975 . 5 5 : - . I S B N 9 1 -72 1 0-06 1 -3 ( I S B N 9 1 -72 1 0-46 1 -9) .
62 . H. Persson , Dec iduous woodland at A ndersby , Eastern Swed e n : Field-layer and below-ground producti o n . 1 97 5 . 5 0 : - . I S B N 9 1 -72 1 0-062- 1 ( I S B N 9 1 -72 1 0-462-7 ) .
1 0 1
63 . S . Br/ikenhielm , Vege tation d y namics of afforested farmland in a district of Sout h-eastern Sweden . 1 97 7 . 65 : - . I S B N 9 1 -72 1 0-063-X ( I S B N 9 1 -7 2 1 0-463-5 ) .
64 . M. A m mar, Vegetation and l o c a l environment on s hore ridges at V i ckleb y , bland , Swede n . An anal ys i s . 1 978 . 65 : - . I S B N 9 1 -72 1 0-064-8 ( I S B N 9 1 -72 1 0-464- 3 ) .
65 . L . Kuflman, Change and s tabil i t y i n the altitude of t h e birc h tree-l imit i n the sout hern Swedish Scandes 1 9 1 5-1 97 5 . 1 979. 65 :-. I S B N 9 1 -72 1 0-065-6 ( I S B N 9 1 -72 1 0-
465- 1 ) . 66 . £ . Waldemarson Jensen , Successions i n rel at ionship to
lagoon development in the Lai tau re delta, N orth S wede n . 1 979. 65:-. I S B N 9 1 -72 1 0-066-4 ( I S B N 9 1 -72 1 0-466- X ) .
67 . S . Tuhf..:anen, Cl imatic parame ters a n d indices i n plant geograp h y . 1 980. 65 : - . I S B N 9 1 -72 1 0-067-2 ( I S B N 9 1 -7 2 1 0-467-8 ) .
68 . Srudies i n piant ecoloRY dedicated t o H ugo Sjors . E d . E r i k Sjogren . 1 980. 9 5 : - . I S B N 9 1 -72 1 0-068-0 ( I S B N 9 1 -72 1 0-468-6) .
69. C. Nilsson , Dynamics of t he shore vegetat ion of a N orth Swedish hydro-electric re servoir during a 5-year period . 1 98 1 . 65 :- . I S B N 9 1 -72 1 0-069-9 ( I S B N 9 1 -72 1 0-469-4) .
70. K. Warenberg, Reindeer forage plants i n the early grazing season. Growth and nutritional content in relation to climatic conditions . 1 982. 75 :-. I S B N 9 1 -72 1 0-070-2 ( I SB N 9 1 -72 1 0-470-8) .
7 1 . C. Johansson , Attached algal vegetation in running waters of Jamtland , S weden . 1 982. 75 :- I S B N 9 1 -72 J e-07 1 -0 ( I SBN 9 1 -72 1 0-47 1 -6) .
72 . E. Rosen , Vegetation development a n d sheep grazing i n limestone grasslands of south bland, Sweden. 1 982. 95: - . ISBN 9 1 - 72 1 0 - 072-9 (ISBN 9 1 -72 1 0 - 472 - 4 ) .
73. L . Zhang, Vegetation ecology and population biology o f Fritillaria meleagris L . at the Kungsangen Nature Reserve , Eastern Sweden . 1 983 . 90 : - . ISBN 9 1 - 72 1 0 - 073 - 7 (ISBN 9 1 - 72 1 0 - 473 - 2) .
74. /. Backeus, Aboveground production and growth dynamics of vascular bog plants in central Sweden. 1985. 90 :-. I SBN 9 1 -721 0-074-5 (ISBN 9 1 -7 2 1 0-474-0).
Limited n umber of cloth-bound copies of Acta 44, 45 , 46, 48 49, 5 1 , 52, 53, 56, 57, 6 1 , 63 , 66, 67 , 68, 69, 70, 7 1 , 72 , 73 are available through the Society at an addition a l cost o f 15 : - per copy. ISBN nos. in brackets refer to cloth-bound copies. Nos. 1 , 9 , 20 , 59 are out o f prin t .
A cta Phytogeogr. Suec. 74
1 02
V A.XTE K OLOG I S K A STU D I E R
I . 5 . Brakenhielm & T . /nge/Og, Vegetationen i K u ngshamn- Morga naturreservat med forslag till s kotselplan . (Summary : Vegetation and proposed management in the Kungshamn-Morga Nature Reserve south of U ppsala. ) 1 972. 25 :-. I S B N 9 1 -72 1 0-80 1 -0.
2 . T. lngelog & M . Risling, Kronparken vid U ppsala, hi storik och best�mdsanalys av en 300-arig tallskog. (Su mmary : K ronparken, history and analysis of a 300-year-old pinewood near U ppsala, Sweden . ) 1 97 3 . 25 :-. ISBN 9 1 -72 1 0-802-9.
3. H. Sjors och medarb. , Skyddsvarda myrar i Kopparbergs Jan . (Summary : M ires considered for protection in Kopparberg County ( Prov . Dalarna, Central Sweden) . ) 1 973 .
25:-. I SBN 9 1 -72 1 0-803-7.
4 . L . Karlsson , Autecology of cliff and scree plants in Sarek National Park, northern S weden 1 973. 30:-. I S B N 9 1 -72 1 0-804- 5 .
5 . B . Klas vik , Computerized analysis o f stream algae . 1 974 .
25:-. I S BN 9 1 -72 1 0-805 - 3 .
6. Y. Dahlstrom-Ekbohm , Svensk miljovards- och omgivningshygienlitteratur 1 952- 1 972. B ibliografi och analy s . 1 975. 25 :-. I S B N 9 1 -72 1 0-806- 1 .
7 . L . Rodenborg , Bodennutzung, Pflanzenwelt und ihre Veranderungen in einem alten Veidegebiet auf M ittelOland , Schwede n . 1 976. 25 :-. I S B N 9 1 -72 1 0-807-X.
8 . H. Sjors & Ch . Nilsson , Vattenutbyggnadens effekter pa levande natur. En faktaredovisn ing overvagande fran
U mealve n . (Summary : B ioeffects of hydroelectric development . A case study based mainly on observations along the U me River, northern Swede n . ) 1 976. 3 5 :-.
I S B N 9 1 -72 1 0-808-8.
9 . 1. Lundqvist & G. Wistrand, Strandtlora inom ovre och mellersta Skelleftealvens vattensystem. Med en sammanfattning betraffande botaniska skyddsvarden. ( Summary : Riverside vascular flora in the upper and middle catchment area of the River Skel leftealven , northern Sweden . ) 1 976. 30:-. I S B N 9 1 -72 1 0-809-6.
10. A Miiller-Haeckel, M igrationsperiodik einzel liger Algen in Fliessgewassern. 1 976. 1 5 :- . I S B N 9 1 -72 1 0-8 1 0- X .
1 1 . A.. Sjodin , I n d e x to distribution maps o f bryophytes 1 887- 1 97 5 . I . M usci . 1 980. 60:- ( hard-bound). I S B N
9 1 -72 I 0-8 1 1 -8 . 1 2 . A . Sjddin , I ndex to distribution maps of bryophytes
1 887- 1 97 5 . 1 1 . Hepaticae . 1 980. 40 :- ( hard-bound). I S B N 9 1 -72 1 0-8 1 2-6.
1 3 . 0 . Erif.:.sson , T. Palo & L . Shderstrdm, Renbetning vi ntertid . Undersokningar rorande svensk tamrens naringsekologi under snoperiod e n . 1 98 1 . 25 :- I S B N 9 1 -72 1 0-8 1 3-4.
14. G. Wistrand , Bidrag till Pite lappmarks vaxtgeografi . 1 98 1 . 25:-. I S B N 9 1 -72 1 0-8 14-2.
1 5 . T. Karlsson , Euphrasia rostkoviana i Sverige . 1 982. 3 5 :-.
ISBN 9 1 -72 1 0-8 1 5-0.
Distributors: Svenska Vaxtgeografi ska Sallskapet , Box 559, S-75 1 22 Uppsala, Sweden Almqvist & Wiksell I nternational . Box 62 , S- 1 0 1 20 Stoc khol m , Sweden .
Acta Phytogeogr. Suec. 74


Distributor: Almqvist & Wiksell International , Stockholm, Sweden ISBN 9 1 -72 1 0-074-5
ISSN 0084-5914