Secondary vegetation in central Amazonia: Land-use history effects on aboveground biomass
21
The text that follows is a PREPRINT. O texto que segue é um PREPRINT. Please cite as: Favor citar como: Wandelli, E.V. & P.M. Fearnside. 2015. Secondary vegetation in central Amazonia: Land-use history effects on aboveground biomass. Forest
Transcript of Secondary vegetation in central Amazonia: Land-use history effects on aboveground biomass

The text that follows is a PREPRINT.
O texto que segue é um PREPRINT.
Please cite as:
Favor citar como:
Wandelli, E.V. & P.M.
Fearnside. 2015.
Secondary
vegetation in central
Amazonia: Land-use
history effects on
aboveground
biomass. Forest

Ecology and
Management 347:
140–148.
doi: 10.1016/j.foreco.2015.03.020
ISSN: 0378-1127
Copyright: Elsevier
The original publication is available at:
O trabalho original está disponível em:
http://www.elsevier.com.nl
https://dx.doi.org/10.1016/j.foreco.2015.03.020

1
Secondary Vegetation in Central Amazonia: Land-1
use History Effects on Aboveground Biomass 2
3
Elisa Vieira Wandelli; Philip Martin Fearnside 4
5 1Centro de Pesquisa Agroflorestal da Amazônia Ocidental-EMBRAPA (CPAA), Km 29, AM-6
010, C.P. 319, Manaus, Amazonas, CEP 69.010-970, Brazil, Tel: +55-92-3633-6032, Email: 7
9 2Instituto Nacional de Pesquisas da Amazônia (INPA), Avenida Andre Araujo, 2936, 10
Manaus, Amazonas CEP 69067-375, Brazil, Tel: +55-92-3643-1822, Email: 11
13
14
*corresponding author. Tel.: +55-92-3643-1822; fax +55-92-3642-1828 15
16 Email addresses: [email protected] (E.V. Wandelli); [email protected] (P.M. 17
Fearnside) 18
19
20

2
21
ABSTRACT 22
23
Secondary Vegetation in Central Amazonia: Land-Use History Effects on Aboveground 24
Biomass 25
26 Growth of secondary forest (capoeira) is an important factor in absorption of carbon from the 27
atmosphere. Estimates of this absorption vary greatly, in large part due to the effect of 28
different land-use histories on the estimates available in the literature. We relate land-use 29
history to aboveground biomass accumulation of secondary vegetation in plots on land that 30
had been used for agriculture (unmechanized manioc and maize) and for pasture in small 31
rural properties in the Tarumã-Mirim settlement near Manaus in central Amazonia, Brazil. 32
We evaluated influence of a) age of the second growth vegetation, b) time of use as 33
agriculture or pasture and c) number of times the area was burned. Biomass data were 34
obtained by destructive sampling of all plants with diameter at breast height > 1 cm in 24 35
parcels of secondary vegetation ranging from 1 to 15 years of age in abandoned pasture (n = 36
9) and agriculture (n = 15). As compared to secondary vegetation in abandoned agricultural 37
fields, vegetation in abandoned cattle pasture (the predominant use history for Amazonian 38
secondary vegetation) grows 38% more slowly to age 6 years. Number of burns also 39
negatively affects biomass recovery. Applying the growth rates we measured to the 40
secondary forests reported in Brazil’s Second National Communication to the United Nations 41
Framework Convention on Climate Change suggests that carbon uptake by this vegetation is 42
overestimated by a factor of four in the report. 43
44
KEYWORDS 45
46 Amazon, Biomass; Brazil; Global warming; Land use; Secondary vegetation 47
48
3
49
1. Introduction 50 51
The growth rates of secondary forest represent important inputs for calculating net 52
emissions of greenhouse gases from land-use change (e.g., Fearnside, 1996, 1997, 2000) and 53
for the productivity and sustainability of agriculture that depends on fallow periods between 54
periods of cultivation (e.g., Silva-Forsberg and Fearnside, 1997). Secondary vegetation 55
growth has a significant role in national accounts of greenhouse-gas emissions, but 56
uncertainty in these accounts is very high. Brazil`s first inventory under the United Nations 57
Framework Convention on Climate Change claimed that secondary vegetation in the 58
country’s Amazonia biome was absorbing 34.9 × 10⁶ Mg C year-1 over the 1988 - 1994 59
period (Brazil, MCT, 2004, p. 147). Information presented in the second inventory indicates 60
an absorption of 9.0 × 10⁶ Mg C year-1 for 1994 - 2002, the reduction being due to a smaller 61
estimated area of secondary vegetation (Brazil, MCT, 2010, p. 242). Despite the magnitude 62
of these numbers, the estimates are not based on any actual measurements of secondary-forest 63
growth (see: Fearnside, 2013). 64
65
Brazil’s Legal Amazon region, which occupies 5 × 10⁶ km2 or about 60% of the 66
country, has a wide variety of different land uses replacing natural forest, each with different 67
implications for secondary-forest growth. Mechanized agriculture, primarily for soybeans, is 68
almost all located along the southern edge of the region, especially in the state of Mato 69
Grosso (Fearnside, 2001). Cattle pasture is the predominant land use in the remainder of the 70
region, including the Manaus area in central Amazonia. Pasture is planted both by actors of 71
all sizes: large (defined in Brazil as > 1000 ha) and medium (101-1000 ha) ranchers and by 72
small (≤ 100 ha) farmers (Fearnside, 2005, 2008). Large and medium landholders have long 73
been the main agents of deforestation and pasture planting in Brazilian Amazonia (e.g., 74
Fearnside, 1994). However, a comparison of data from 2002 and 2009 indicates a marked 75
decrease in the average size of clearings (Rosa et al., 2012) and an increase in relative terms 76
in the role of small farmers. The large overall decrease in Brazil’s deforestation rate that 77
began in 2005 was disproportionately among larger actors, especially since 2008 (Godar et 78
al., 2014). The number of small farmers has steadily increased, as has the number of 79
government-sponsored settlement projects; by 2013 they totaled 3325 projects. Considering 80
the 2738 of these for which data are available, deforestation in the projects totaled 161,833 81
km2 through 2013, or 21% of the total by that year in Brazil’s Legal Amazon region (Yanai et 82
al., 2015). 83
84
Large ranchers almost always plant pasture directly after clearing the forest, while 85
small farmers often plant annual crops such as manioc and maize for several years before the 86
area is converted to pasture. These farms may have areas under fallow between use periods 87
under annual crops. This is similar to swidden or shifting cultivation, such as that practiced 88
by indigenous and other traditional peoples whose cultural traditions include use of fallows as 89
part of a cycle that can sustain production indefinitely (e.g., Nye and Greenland, 1960). In the 90
case of small farms in Amazonian settlement projects, no such long-term adjustment has 91
taken place, and cropping is most commonly supplanted by pasture after a few years, the 92
continued planting of annual crops depending on continued advancement of clearing into the 93
remaining forest (e.g., Fearnside, 1986). We refer to this form of agriculture as “slash-and-94
burn.” This paper only considers secondary vegetation derived from slash-and-burn 95
agriculture and from cattle pasture (in small-farmer lots in both cases). 96
97

4
In Amazonia, biomass accumulation rates of secondary vegetation (known as 98
“capoeira” in Brazil) can be limited by factors related to land-use history (Buschbacher et al., 99
1988; Fearnside and Guimarães, 1996; Finegan, 1996; Moran et al., 2000; Steininger, 2000; 100
Uhl, 1987; Uhl et al., 1988). Intensity of prior land use is reflected in natural regeneration and 101
is related to: 1 – type of previous land use at the site, such as slash-and-burn agriculture, 102
cattle pasture, tree planting or exploitation of charcoal; 2 – age of secondary vegetation (time 103
since abandonment); 3 – time that the area remained under agriculture and ranching activity 104
prior to abandonment; 4 – method used for removal of vegetation (preparation of the soil) 105
such as burning versus mechanical clearing and grinding; and 5 – frequency of occurrence of 106
disturbances such as burning and weeding. 107
108
Fearnside and Guimarães (1996) observed that secondary forests with a pasture use 109
history accumulate less biomass than do stands established in abandoned agricultural areas in 110
Altamira, Pará. Brazil. Pasture use also results in secondary vegetation with floristic 111
compositions that differ from those in areas without this history, as shown by studies in the 112
Manaus Free Trade Zone Agriculture and Ranching District (DAS) in Brazil’s state of 113
Amazonas (Longworth et al., 2014; Mesquita et al., 2001). Uhl et al. (1988) observed that 114
secondary vegetation developed from pasture with lighter use intensity accumulated 40% 115
more biomass than did stands of the same age, but with more intensive use history in 116
Paragominas, Pará. Moreira (2003) noted that the number of burns negatively influences 117
biomass inventory of natural regeneration in areas that had been used for pasture, agriculture 118
and rubber plantations north of Manaus. Annual rate of biomass accumulation decreases with 119
increase in age of secondary vegetation (e.g., Lucas et al., 1996). 120
121
Based on data from destructive measurements in the Venezuelan Amazon, Uhl (1987) 122
established a practical model to estimate biomass stock in secondary vegetation using time 123
since abandonment as the only independent variable, but did not include variables related to 124
land-use history. Zarin et al. (2005) developed models to estimate biomass with wide 125
applicability in Amazonia, including soils with a range of sand and clay contents. In addition 126
to the age of the secondary vegetation, these authors considered climatic data (such as 127
temperature and the duration of the dry season), but they did not include variables related to 128
land-use history. Silver et al. (2000) also developed model estimates for biomass in different 129
rainfall regimes in tropical regions and for different land-use types using age as the 130
independent variable, but not including the time the site was used and number of burns. 131
132
Stocks and accumulation rates of biomass need to be quantified in Amazonian 133
secondary vegetation in order to better understand successional processes so that appropriate 134
management can be proposed. Here we develop models based only on land-use history 135
factors, making these models more practical, although less precise, than either direct 136
measurement by destructive sampling or estimates requiring allometric data and species 137
identifications (e.g., Wandelli and Fearnside, manuscript). 138
139
Secondary-vegetation growth rates have major implications for the net emissions of 140
carbon from land use and land-use change in Amazonia. We examine the implications of our 141
results for the carbon uptake calculated in Brazil’s national inventory of greenhouse-gas 142
emissions reported in the country’s second national communication to the United Nations 143
Framework Convention on Climate Change. 144
145
2. Materials and methods 146 147

5
2.1. Study area 148
149
Our study was carried out in secondary vegetation in rural properties in the Turumã-150
Mirim agrarian reform project, located to the northwest of the city of Manaus, Amazonas, 151
Brazil (Figure 1). The original forest is classified as dense terra firme (unflooded upland) 152
forest (Braga, 1979) and the soil is predominantly allic yellow latosol (Oxisol) with high clay 153
content (Brazil, IPEAAOc, 1971). The climate is Ami in the Köppen system, with mean 154
annual rainfall around 2200 mm and a three-month dry season. 155
156
[Figure 1 here] 157
158
The Tarumã-Mirim Agrarian Reform Project was established in 1992 for 1042 159
families, each with a 40-ha lot. The area is described by de Matos et al. (2009) and Coelho et 160
al. (2012). Since the area is located approximately 35 km by road from the city of Manaus 161
(population ~2 million), it is influenced by urban markets for charcoal, manioc flour and 162
meat. 163
164
2.2. Direct destructive assessment of biomass 165
166
Aboveground biomass (AGB) of each of 24 secondary-vegetation stands between 1 167
and 15 years of age was measured directly by destructive sampling, and individual plant 168
measurements and weights were obtained with diameter at breast height (DBH) ≥ 1 cm (DBH 169
= diameter 1.3 m above the ground) for developing allometric equations. A total of 2268 170
plants in 146 species were weighed and height and diameter at breast height (1.3 m above the 171
ground) were measured. Water contents and dry weights were obtained for trunks, branches 172
and leaves of 3-5 individuals (if present) of each species in each 100-m2 plot. Each of 24 173
stands had a single plot laid out as a 10 × 10 m square randomly positioned within each stand 174
but located at least 10 m from the edge of the secondary-vegetation stand and at least 50 m 175
from the edge of the forest. 176
177
Information about land-use history of secondary vegetation in each lot was obtained 178
through interviews with various members of the family that owned the lot (Table 1). This 179
information was supplemented and validated through interviews with neighbors who could 180
remember when the vegetation was cut and burned because they had collaborated in 181
collective work exchanges (mutirões) in the lot or because they were concerned about 182
uncontrolled fire entering their own fields. Inventories and destructive measurements of 183
biomass were only made in secondary-vegetation stands where information about use history 184
was consistent with our observations of remains still present in the area and where this 185
coincided with the opinions of all informants. 186
187
[Table 1 here] 188
2.3. Data analysis 189
190
Data analysis used standard regression analyses (Zar, 1999). These were performed 191
using Systat software. 192
193
2.4. Use of biomass evaluated with direct methodology to assess allometric models 194
195
We used data from our destructive sampling to assess the adequacy of the main multi-196
specific allometric equations used in the literature to estimate biomasses of individual trees in 197

6
secondary vegetation in central Amazonia. The mean errors of the estimate (percentage error 198
between the weight obtained directly and that estimated using the equations) for total 199
accumulated biomass (Mg ha-1) were compared. Sums of the observed dry weights and those 200
obtained from allometric equations of all the trees in each plot were extrapolated to a one-201
hectare area to obtain total biomass (Mg ha-1) to allow comparison at the stand level. 202
203
3. Results 204 205
3.1. Models for estimation of accumulated biomass based on land-use history 206
207
Secondary-vegetation stands with a history of use as pasture (n = 15) and as 208
agriculture (n = 9) were analyzed separately because they showed different relations between 209
biomass and secondary-vegetation age (Figure 2), which was the land-use history variable 210
with greatest influence on biomass accumulation. In secondary-vegetation stands with ages 211
between 1 and 6 years that originated from agriculture, accumulated biomass (Mg ha-1) was 212
best explained by a log-linear model (r2 = 0.959; error of estimate = 13.5%) using age as the 213
only independent variable, while models that included time of use and number of burns 214
produced errors of up to 50% (Figure 3 and Table 2). 215
216
[Figures 2 & 3 + Table 2 here] 217
218
Biomass accumulated in secondary vegetation up to 15 years of age derived from 219
abandoned pastures was not sufficiently explained by the age variable (r2 = 0.797) and had an 220
error of the estimate of 36% (Table 2). Variation in biomass of secondary vegetation derived 221
from pasture was much better explained when, in addition to the age variable, regressions 222
included total time of land use and number of burns. These three variables are correlated 223
because, in areas of family farming, the longer the time since a given site was cleared of 224
primary forest the longer it is likely to have been used and the greater the number times it has 225
been burned. We therefore tested various combinations of these three factors linked to land-226
use history to build an index for fitting a simple regression model. 227
228
To assess the influence of time of use on biomass of secondary vegetation we isolated 229
the age variable by dividing stand age by land-use time so as to avoid needing to use rate of 230
accumulation per year as the dependent variable. Using this rate as the dependent variable 231
would mask the influence of the time the land remains in use because it is a function of age. 232
The exponential model whose independent variable was the quotient of age divided by the 233
time of use produced a good fit for biomass accumulated in pasture areas (r2 = 0.957; error of 234
the estimate = 19.9%) (Figure 4 and Table 2). The error of the estimate for biomass of 235
secondary-vegetation stands derived from pasture fell to 14.9% when number of burns was 236
added as an independent variable in the model. The index “age of the secondary 237
vegetation/time + number of burns” explained 97.5% of the variation in accumulated biomass 238
(Mg ha-1) in secondary-vegetation stands established in pasture areas (Figure 5 and Table 2). 239
240
[Figures 4 & 5 here] 241
242
3.2. Comparison of model results with biomass determined directly 243
244
Mean error of the estimate for accumulated biomass varied from 7.6% to 57.5% for 245
the eight sets of models selected from the literature and from this study, as compared to data 246
measured directly in the 24 destructive estimates (Figure 6 and Table 3). Strictly for 247

7
comparative purposes, we fit the linear model that Higuchi et al. (1998) derived for a set of 248
primary-forest species from the same central Amazon region at a site approximately 20 km 249
away. As expected, the model for primary-forest species did not fit the data for biomass of 250
secondary vegetation in this study (Table 3, Model 1). 251
252
[Fig. 6 & Table 3 here] 253
254
The set of equations in Model 3 derived by Uhl et al. (1988) from multispecies 255
regressions for leaves and wood in Amazonian secondary vegetation in the state of Pará, 256
using DBH as the independent variable, also generated a very high error of the estimate 257
(48.7%). This was similar to the error of the estimate of 48% obtained from Model 2, which 258
Uhl (1987) derived for the Venezuelan Amazon with age as the only independent variable. 259
Model 6 (this study), which used land-use history as an independent variable, had a mean 260
error of only 14%. In Model 6, age of the secondary-vegetation stand was the independent 261
variable of the regression for biomass of secondary-vegetation areas derived from agriculture, 262
and the index "age/time of use + number of burns" was the independent variable used to 263
estimate biomass of secondary vegetation derived from pasture. 264
265
The detailed multi-specific regression model developed by Nelson et al. (1999) 266
(Model 4), which was based on DBH of seven secondary-vegetation species in central 267
Amazonia at a site located approximately 30 km from our study area (but with the difference 268
of being a former rubber plantation that had been cleared mechanically), had a high error of 269
the estimate (41%) for accumulated biomass using the data measured in this study. This error 270
of the estimate for accumulated biomass was reduced to 19% when we used Model 5 (Nelson 271
et al., 1999) in which the authors added the height variable. 272
273
Model 7 (this study) which was applied to all species, including lianas with DBH ≥ 1 274
cm, resulted in the best fit for total biomass (Mg ha-1) of secondary vegetation. Mean error of 275
the estimate was 10.2%. 276
277
The lowest mean error of the estimate for total biomass (Mg ha-1) of the eight models 278
tested was 7.6% (Model 8). For estimating biomass of lianas we applied the equation 279
developed by Gehring et al. (2004) for lianas in both secondary vegetation and primary forest 280
in central Amazonia. For bushy species we used our multispecies regression and for 281
estimating biomass of all species in the genus Cecropia, which has low stature and a low 282
wood density of around 0.27 g cm-3, we applied our Cecropia ulei model (Wandelli and 283
Fearnside, manuscript). 284
285
The relative growth rates for secondary forest derived from slash-and-burn agriculture 286
and from pasture can be visualized from the equations in Table 2. If one considers the 287
equations that use only age, a 6-year-old secondary vegetation stand derived from slash-and-288
burn agriculture has an aboveground biomass of 50.3 Mg ha-1 (i.e., a growth rate of 8.4 Mg 289
ha-1 year-1), while a stand of the same age derived from pasture has aboveground biomass of 290
31.1 Mg ha-1 (i.e., a growth rate of 5.2 Mg ha-1 year-1). The secondary vegetation following 291
pasture grows 38% more slowly than that following use as slash-and-burn agriculture. 292
293
4. Discussion 294
295 Our analyses point to the importance of considering land-use history in models for 296
estimating accumulation of biomass in secondary-vegetation stands. Models that are more 297

8
practical but less precise (error of the estimate = 14%) than those derived from biometric 298
measurements of trees were developed to estimate total aboveground biomass (Mg ha-1) 299
indirectly using as independent variables the time since abandonment of agriculture or 300
ranching activity (age of secondary vegetation in years), total time of land use under 301
agriculture or pasture (years) and number of times that the vegetation of the area was burned. 302
Equations for natural regeneration were developed separately for abandoned pastures and for 303
areas of slash-and-burn agriculture because both the intercept on the ordinate and the slope of 304
the line for data on biomass versus stand age with each of the two land-use histories were 305
different, and areas of pastures have more negative impact on biomass accumulation in 306
natural regeneration than areas with histories of itinerant agriculture. Stand age explained 307
96% of variation in biomass of areas regenerating from agricultural activities, but biomass of 308
secondary vegetation derived from pastures was more certain (98%) when an index was used 309
that included time of land use and number of burn (in addition to stand age). Cattle pasture 310
produces a larger negative impact on natural regeneration than does agricultural activity 311
(Fearnside and Guimarães, 1996; Lucas et al., 1996; Steininger, 2000; Uhl et al., 1988), and 312
time of land use therefore becomes decisive for successional processes and accumulation of 313
biomass in natural regeneration of abandoned pastures. 314
315
Because livestock is generally an older activity than is agriculture in the settlement 316
project, stands derived from slash-and-burn agriculture evaluated in this study had narrower 317
ranges the explanatory variables as compared to stands derived from pasture. In addition, 318
influence on biomass stocks from time of use and from number of burns can be expected to 319
be smaller in secondary vegetation from agriculture than in abandoned pastures because soil 320
physical structure is damaged by cattle. 321
322
Note that in the present study the distance to a propagule source (remaining forest) 323
was similar for plots with the two land-use histories. Forest was present within few hundred 324
meters (but never < 50 m) in all of the 40-ha lots. For Brazilian Amazonia as a whole, the 325
contrast in secondary-vegetation growth rates between slash-and-burn agriculture and pasture 326
can be expected to be greater than our data show, since much of the pasture is in vast 327
clearings on large ranches far from propagule sources, while slash-and-burn agriculture is 328
typically done in smaller clearings near forest, similar to the plots we studied. 329
330
A number of studies have shown the damaging effects of pasture use. Using remote-331
sensing techniques, Moreira (2003) concluded that number of burns determined stocks and 332
accumulation rates of biomass in abandoned pastures in an area in central Amazonia close to 333
the location of the present study. Zarin et al. (2005), using data on biomass in nine 334
Amazonian ranches, concluded that five or more burns in the same area not only reduces the 335
accumulation of carbon by more than 50% but also slows closing of the canopy, a delay that 336
would make the secondary vegetation more susceptible to fire. An excessive number burns, 337
together with soil erosion, can damage the seed bank such that natural regeneration then 338
becomes wholly dependent on immigrant species (Janzen and Vásquez-Yanes, 1988). Slower 339
recovery of secondary vegetation in abandoned pastures as compared to agricultural fallows 340
is a general phenomenon throughout the tropics (see review by Chazdon, 2014). 341
342
Zarin et al. (2005) developed models for estimating biomass of secondary-vegetation 343
stands using the age of the secondary-forest stands as the independent variable. Zarin et al. 344
(2005) developed one equation for sandy soils and another for non-sandy soils based on data 345
on the biomasses at nine sites distributed over a large part of the Amazon region. They used 346
direct and indirect methods, but in spite of their having included aspects related to the 347

9
climate, the models did not include variables related to the history of land use, such as the 348
type of activity, time of use and number of burns. Silver et al. (2000) developed models to 349
estimate biomass based on a set of 143 measurements from the literature on secondary 350
vegetation in tropical countries. These authors also used the time of abandonment of the 351
capoeira as independent variable (including ages between 0.3 and 80 years), for each of the 352
three rainfall regimes (<1000 mm; 1000 - 2500 mm; >2500 mm) and for each of the three 353
uses (pasture; itinerant agriculture; and it drops and it burns of the forest without planting). 354
However, the models of Silver et al. (2000) did not include equations that include the 355
combination of precipitation and use history, and nor the time of use and number of times 356
that the vegetation was burned, which were decisive variables in the models developed in this 357
study for pastures 358
359
Biomass models based on land-use history may be useful for obtaining values that are 360
applicable to wide areas and that do not require high precision and, moreover, due to the ease 361
of implementation and low cost, may be used by rural communities to computed carbon 362
credits from their secondary-vegetation stands. The destructive methodology can cost an 363
average US$ 11 per tree for aboveground biomass or US$322 per tree if root biomass is also 364
measured (Silva, 2007). A factor limiting applicability of these models is difficulty of 365
obtaining precise information from farmers on the history of secondary vegetation stands and 366
the considerable effort needed to check information with family members, day laborers and 367
neighbors. While this interview information is the only field input needed, obtaining it is not 368
always successful, which restricts the number of secondary-vegetation stands to which this 369
methodology can be applied. 370
371
The growth rates of the secondary vegetation we studied indicate a substantial 372
overestimate of carbon uptake by this vegetation in Brazil’s national inventories of greenhouse-373
gas emissions. In Brazil’s second national communication to the United Nations Framework 374
Convention on Climate Change, the assumption was that in 2002 the biomass of secondary 375
vegetation stands on any land that changed status from another land use to secondary forest 376
between 1994 and 2002 would be 35% of the biomass of the “primary” vegetation characteristic 377
of the site (Brazil, MCT, 2010, p. 239). Assuming a constant rate of conversion to secondary 378
vegetation over the 8-year period from 1994 to 2002, the average age of this secondary 379
vegetation in 2002 would be 4 years. The inventory considers the carbon stock in the primary 380
vegetation at this site (forest type “Db”, RADAMRASIL volume 18) to be 158.01 Mg C ha-1, 381
including 27.1% (42.8 Mg C ha-1) in belowground biomass (Brazil, MCT, 2010, pp. 235-236). 382
The aboveground carbon stock of the “primary” forest is therefore 115.2 Mg C ha-1, and the 383
presumed aboveground stock in 4-year-old secondary vegetation is 40.3 Mg C ha-1, implying an 384
accumulation rate of 10.1 Mg C ha-1 year-1. Assuming a carbon content for secondary vegetation 385
of 45% (e.g., Fearnside, 2000), this corresponds to a growth rate of 22.4 Mg of dry aboveground 386
biomass per hectare per year. Calculating growth rates from our data for 4 years of growth (as 387
was done earlier for 6 years of growth), secondary vegetation following slash-and-burn 388
agriculture grows at 8.2 Mg ha-1 year-1 and following pasture at 5.1 Mg ha-1 year-1. The 389
inventory rate is therefore 2.7 times higher than our rate for regrowth after slash-and-burn 390
agriculture and 4.4 times higher than our rate for regrowth after pasture. For secondary forests 391
at this location that were already present in 1994 and remained so in 2002, the inventory 392
assumes an aboveground biomass carbon accumulation rate of 4.5 Mg C ha-1 year-1 (Brazil, 393
MCT, 2010, p. 238), equivalent to a growth rate of dry aboveground biomass of 10 Mg ha-1 394
year-1, or 1.2 times higher than our rate after agriculture and 2.0 times higher than our rate after 395
pasture. If one considers the land use transition and carbon uptake data from the inventory 396
(Brazil, MCT, 2010, p. 242), only 8.6% of the secondary forest is derived from agriculture, 397

10
versus 91.4% from pasture, assuming that the percentages that apply to the land that was under 398
these two land uses in 1994 (86.4% of the total area that transitioned to secondary forest) also 399
apply to the remaining 13.6%. Most (94.7%) of the inventory’s absorption by secondary forests 400
comes from transitions into this land use, the remaining 5.3% coming from secondary forests 401
that remain as secondary forests throughout the 1994-2002 period. Given the overestimates of 402
carbon absorption by the two types of land-use history and the two periods of origin (transitions 403
into secondary forest within the 1994-2002 period versus entering this period as pre-existing 404
secondary forest), the overall exaggeration of secondary vegetation carbon uptake in the 405
inventory is by a factor of 4.1. The absolute amount of the overestimate is 6.8 ×10⁶ Mg C year-1. 406
As an indication of the magnitude of this value, it represents 8.3% of all of Brazil’s CO2 407
emissions from fossil fuels in 2005 (Brazil, MCT, 2010, p. 270); for comparison, the São Paulo 408
metropolitan area represents almost exactly 10% of Brazil’s population and presumed emission. 409
410
5. Conclusions 411
412 1.) Secondary vegetation grows more slowly (by 38% to age 6 years) in abandoned cattle 413
pasture than in plots that had been used for slash-and-burn agriculture. 414
2.) Secondary vegetation biomass growth is negatively related to the number of times a site 415
has been burned. 416
3.) Biomass estimates that include information on land-use history (time under agriculture 417
or pasture use and number of burns) produce more reliable estimates than do regressions based 418
only on secondary-vegetation age. 419
4.) Applying our biomass accumulation rates to the carbon uptake calculated in Brazil’s 420
national inventory of greenhouse-gas emissions implies that uptake was overestimated by a 421
factor of four. 422
423
Acknowledgments 424
425 We thank Empresa Brasileira de Pesquisa Agropecuária (EMBRAPA), Conselho Nacional do 426
Desenvolvimento Científico e Tecnológico (CNPq: Proc. 305880/2007-1, 610042/2009-2). 427
Large-Scale Atmosphere-Biosphere Experiment in Amazonia (LBA) and Instituto Nacional 428
de Pesquisas da Amazônia (INPA: PRJ13.03) for financial support, and the farmers in the 429
Tarumã-Mirim settlement area for their patience and help during fieldwork. Reviewer 430
comments were helpful. 431
432
References 433
434 Braga, P.I.S., 1979. Subdivisão fitogeográfica, tipos de vegetação, conservação e inventário 435
florístico da floresta amazônica. Acta Amazonica 9, 53-80. 436
437
Brazil, IPEAAOc (Instituto de Pesquisa e Experimentação Agropecuária da Amazônia 438
Ocidental), 1971. Solos do Distrito Agropecuário da SUFRAMA. Convênio para 439
levantamento da área do Distrito Agropecuário da SUFRAMA, Instituto de Pesquisa e 440
Experimentação Agropecuária do Norte (IPEAN) and IPEAAOc, Manaus, Amazonas, 441
Brazil. 99 pp. 442
443
Brazil, MCT (Ministério de Ciência e Tecnologia), 2004. Brazil’s Initial National 444
Communication to the United Nations Framework Convention on Climate Change. 445
MCT, Brasília, DF, Brazil. 271 pp. Available at: 446
http://www.mct.gov.br/upd_blob/0005/5142.pdf 447
11
448
Brazil, MCT (Ministério da Ciência e Tecnologia), 2010. Second National Communication of 449
Brazil to the United Nations Framework Convention on Climate Change. MCT, 450
Brasília, DF, Brazil. 2 vols. 493 pp. Available at: 451
http://www.mct.gov.br/upd_blob/0214/214078.pdf and 452
http://www.mct.gov.br/upd_blob/0214/214079.pdf 453
454
Buschbacher, R., Uhl, C., Serrão, E.A.S., 1988. Abandoned pastures in eastern Amazonia. II. 455
Nutrient stocks in the soil and vegetation. J. Ecol. 76, 682-699. 456
457
Chazdon, R.L., 2014. Second Growth: The Promise of Tropical Forest Regeneration in an 458
Age of Deforestation. University of Chicago Press, Chicago, Illinois, USA. 472 pp. 459
doi: 10.7208/chicago/9780226118109.001.0001 460
461
Coelho, G.J.F., da Silva, M.B., Gonçalves, P.S., Billacrês, M.A.R. 2012. Assentamento 462
Tarumã-Mirim (AM): Uso do território e políticas públicas. XXI Encontro Nacional 463
de Geografia Agraria, Uberlândia, Minas Gerais. Universidade Federal de Uberlândia, 464
Uberlândia, MG, Brazil. 465
http://www.lagea.ig.ufu.br/xx1enga/anais_enga_2012/eixos/1432_1.pdf 466
467
de Matos, L.L., Peixoto, R.A., Costa, R.C. 2009. Os assentados e a cidade: O assentamento 468
Tarumã-Mirim e Manaus (AM). XIX Encontro Nacional de Geografia Agraria, São 469
Paulo, Universidade de São Paulo, São Paulo, SP, Brazil.. 470
http://www.geografia.fflch.usp.br/inferior/laboratorios/agraria/Anais%20XIXENGA/a471
rtigos/Matos_LL.pdf 472
473
Fearnside, P.M., 1986. Human Carrying Capacity of the Brazilian Rainforest. Columbia 474
University Press, New York, 293 pp. 475
476
Fearnside, P.M., 1996. Amazonian deforestation and global warming: Carbon stocks in 477
vegetation replacing Brazil's Amazon forest. Forest Ecol. Manage. 80, 21-34. doi: 478
10.1016/0378-1127(95)03647-4 479
480
Fearnside, P.M., 1997. Greenhouse gases from deforestation in Brazilian Amazonia: Net 481
committed emissions. Climatic Change 35, 321-360. 482
483
Fearnside, P.M., 2000. Global warming and tropical land-use change: Greenhouse gas 484
emissions from biomass burning, decomposition and soils in forest conversion, 485
shifting cultivation and secondary vegetation. Climatic Change 46, 115-158. 486
487
Fearnside, P.M., 2001. Soybean cultivation as a threat to the environment in Brazil. Environ. 488
Conserv. 28, 23-38. doi: 10.1017/S0376892901000030 489
490
Fearnside, P.M., 2005. Deforestation in Brazilian Amazonia: History, rates and 491
consequences. Conserv. Biol. 19, 680-688. doi: 10.1111/j.1523-1739.2005.00697.x 492
493
Fearnside, P.M., 2008. The roles and movements of actors in the deforestation of Brazilian 494
Amazonia. Ecology and Society 13(1), 23. [online] URL: 495
http://www.ecologyandsociety.org/vol13/iss1/art23/ 496
497
http://www.geografia.fflch.usp.br/inferior/laboratorios/agraria/Anais%20XIXENGA/artigos/Matos_LL.pdf

12
Fearnside, P.M., 2013. Serviços ambientais provenientes de florestas intactas, degradadas e 498
secundárias na Amazônia brasileira. in: Peres, C.A., Gardner, T.A., Barlow, J., Vieira, 499
I.C.G. (Eds.), Conservação da Biodiversidade em Paisagens Antropizadas do Brasil. 500
Editora da Universidade Federal do Paraná, Curitiba, Paraná, Brazil, pp. 26-57. 501
502
Fearnside, P.M., Guimarães, W.M., 1996. Carbon uptake by secondary forests in Brazilian 503
Amazonia. Forest Ecol. Manage. 80, 35-46. 504
505
Finegan, B., 1996. Pattern and process in neotropical secondary rain forests: The first 100 506
years of succession. Trends Ecol. Evol. 11, 119-124. 507
508
Gehring, C., Park, S., Denich, M., 2004. Liana allometric biomass equations for Amazonian 509
primary and secondary forest. Forest Ecol. Manage. 195, 69-83. 510
511
Godar, J., Gardnera, T.A., Tizado, E.J., Pacheco, P., 2014. Actor-specific contributions to the 512
deforestation slowdown in the Brazilian Amazon. Proceedings of the National 513
Academy of Science of the USA 111(43), 15,591-15,596. 514
doi/10.1073/pnas.1322825111 515
516
Higuchi, N., Santos, J.M, Ribeiro, R.J., Minette, L., Biot, Y., 1998. Biomassa da parte aérea 517
da vegetação da floresta tropical úmida de terra-firme da Amazônia brasileira. Acta 518
Amazonica 28, 153-166. 519
520
Janzen, D., Vásquez-Yanes, C., 1988. Tropical forest seed ecology. in: Hadley, M. (Ed.), 521
Rain Forest Regeneration and Management. The International Union of Biological 522
Sciences, UNESCO, Paris, France. pp. 28-33. 523
524
Longworth, J.B., Mesquita, R.C., Bentos, T.V., Moreira, M.P., Massoca, P.E., Williamson, 525
G.B., 2014. Shifts in dominance and species assemblages over two decades in 526
alternative successions in Central Amazonia. Biotropica 46, 529-537. doi: 527
10.111/btp.12143. 528
529
Lucas, R.M., Curran, P.J., Honzak, M., Foody, G.M., Amaral, I., Amaral, S., 1996. 530
Disturbance and recovery of tropical forests: Balancing the carbon account. in: Gash, 531
J.H.C., Nobre, C.A., Roberts, J.M., Victoria, R.L. (Eds.), Amazonian Deforestation 532
and Climate, John Wiley and Sons, Chichester, UK, pp. 383-398. 533
534
Mesquita, R.C.G., Ganade, G., Ickes, K., Williamson, B., 2001. Alternative successional 535
pathways in the Amazon Basin. Jour. Ecol. 89, 1-10. 536
537
Moran, E.F., Brondizio, E.S., Tucker, J.M., Silva-Forsberg, M.C., McCracken, S., Falesi, I., 538
2000. Effects of soil fertility and land-use on forest succession in Amazonia. Forest 539
Ecol. Manage. 139, 93-108. 540
541
Moreira, M.P., 2003. Uso de Sensoriamento Remoto para Avaliar a Dinâmica de Sucessão 542
Secundária na Amazônia Central. Masters dissertação in tropical forest science, 543
Instituto Nacional de Pesquisas da Amazônia & Fundação Universidade do 544
Amazonas, Manaus, Amazonas, Brazil. 103 pp. 545
546

13
Nelson, B.W., Mesquita, R., Pereira, J.L.G., Souza, S.G.A., Batista, G.T., Couto, L.B., 1999. 547
Allometric regressions for improved estimate of secondary forest biomass in the 548
central Amazon. Forest Ecol. Manage. 117, 149-167. 549
550
Nye, P.H., Greenland, D.J., 1960. The Soil Under Shifting Cultivation. Commonwealth 551
Agricultural Bureaux of Soils, Harpenden, UK, 156 pp. 552
553
Rosa, I.M.D., Souza Jr., C., Ewers, R.M., 2012. Changes in size of deforested patches in the 554
Brazilian Amazon. Conserv. Biol. 26, 932-937. doi: 10.1111/j.1523-555
1739.2012.01901.x. 556
557
Silva, R.P., 2007. Alometria, Estoque e Dinâmica da Biomassa de Florestas Primárias e 558
Secundárias na Região de Manaus (AM). PhD thesis in tropical forest science, 559
Instituto Nacional de Pesquisas da Amazônia & Fundação Universidade Federal do 560
Amazonas, Manaus, Amazonas, Brazil. 152 pp. 561
562
Silva-Forsberg, M.C., Fearnside, P.M., 1997. Brazilian Amazonian caboclo agriculture: 563
effect of fallow period on maize yield. Forest Ecol. Manage. 97, 283-291 564
565
Silver, W.L., Ostertag, R., Lugo, A.E., 2000. The potential for carbon sequestration through 566
reforestation of abandoned tropical agricultural and pasture lands. Restoration 567
Ecology 8, 394-407. 568
569
Steininger, M.K., 2000. Secondary forest structure and biomass following short and extended 570
land-use in central and southern Amazonia. J. Trop. Ecol. 16, 689-708. 571
572
Uhl, C., 1987. Factors controlling succession following slash-and-burn agriculture in 573
Amazonia. J. Ecol. 75, 377-407. 574
575
Uhl, C., Buschbacher, R., Serrão, E.A.S., 1988. Abandoned pastures in eastern Amazonia. I. 576
Patterns of plant succession. J. Ecol. 76, 663- 681. 577
578
Yanai, A.M., Nogueira, E.M., Fearnside, P.M., Graça, P.M.L.A., 2015. Desmatamento e 579
perda de carbono até 2013 em assentamentos rurais na Amazônia Legal. XVIII 580
Simpósio Brasileiro de Sensoriamento Remoto, Curitiba, Brasil 2015. Sociedade 581
Brasileira de Sensoriamento Remoto (SBSR), INPE, São José dos Campos, SP, 582
Brazil. http://www.dsr.inpe.br/sbsr2015 (in press). 583
584
Zar, Z.H., 1999. Biostatistical Analysis. Prentice Hall, Englewood Cliffs, New Jersey, U.S.A. 585
663 pp. 586
587
Zarin, D., Davidson, E.A., Brondizio, E., Vieira, I., Sá, T., Ducey, J.M., Salimon, C., Denich, 588
M., 2005. Legacy of fire slows carbon accumulation in Amazon forest regrowth. 589
Frontiers Ecol. Environ. 3, 365-369. 590
591
FIGURE LEGENDS 592
593 Figure 1 – Location of study area: the Tarumã-Mirim Agrarian Reform Project, Amazonas 594
state, Brazil. 595
596

14
Figure 2 – Relationship between aboveground biomass (Mg ha-1) and the age of nine 597
secondary-vegetation (capoeira) stands with a history of use in slash-and-burn 598
agriculture. 599
600
Figure 3 – Relationship between aboveground biomass (Mg ha-1) and the age of abandonment 601
of nine secondary-vegetation stands with a history of use in slash-and-burn 602
agriculture. The model that best fits the relationship is: ln (biomass) = 2.051 + 1.042 603
× ln (age); r2 = 0.959. 604
605
Figure 4 – Relationship between aboveground biomass (Mg ha-1) and an index related to 606
land-use history (age of abandonment/time of use) in 15 secondary-vegetation 607
(capoeira) stands in abandoned pasture. 608
609
Figure 5 – Relationship between aboveground biomass (Mg ha-1) and an index related to 610
land-use history (age of abandonment/(time of use + number of burns) in 15 611
secondary-vegetation (capoeira) stands in abandoned pasture. The equation that best 612
fits the relationship is: ln(biomass) = 0.8 TB + 0.9 × ln(age/(time of use + number of 613
burns)); r2 = 0.975. 614
615
Figure 6 - Mean percent error (absolute value) of the estimated total biomass (Mg ha-1) from 616
the eight models described in Table 3 (as compared to the biomass measured this 617
study through direct destructive methodology in 24 secondary-vegetation (capoeira) 618
stands 1 to 15 years of age). Solid circles (●) indicate multispecific allometric models 619
to estimate the biomass of trees derived from regressions with DBH and/or height as 620
independent variables and whose sum was extrapolated to Mg ha-1; Open circles (○) 621
indicate models with regressions for predicting biomass (Mg ha-1) with land-use 622
history as an independent variable; bars represent the standard errors; the independent 623
variables used by each author are shown in parentheses; details are given in Table 3. 624

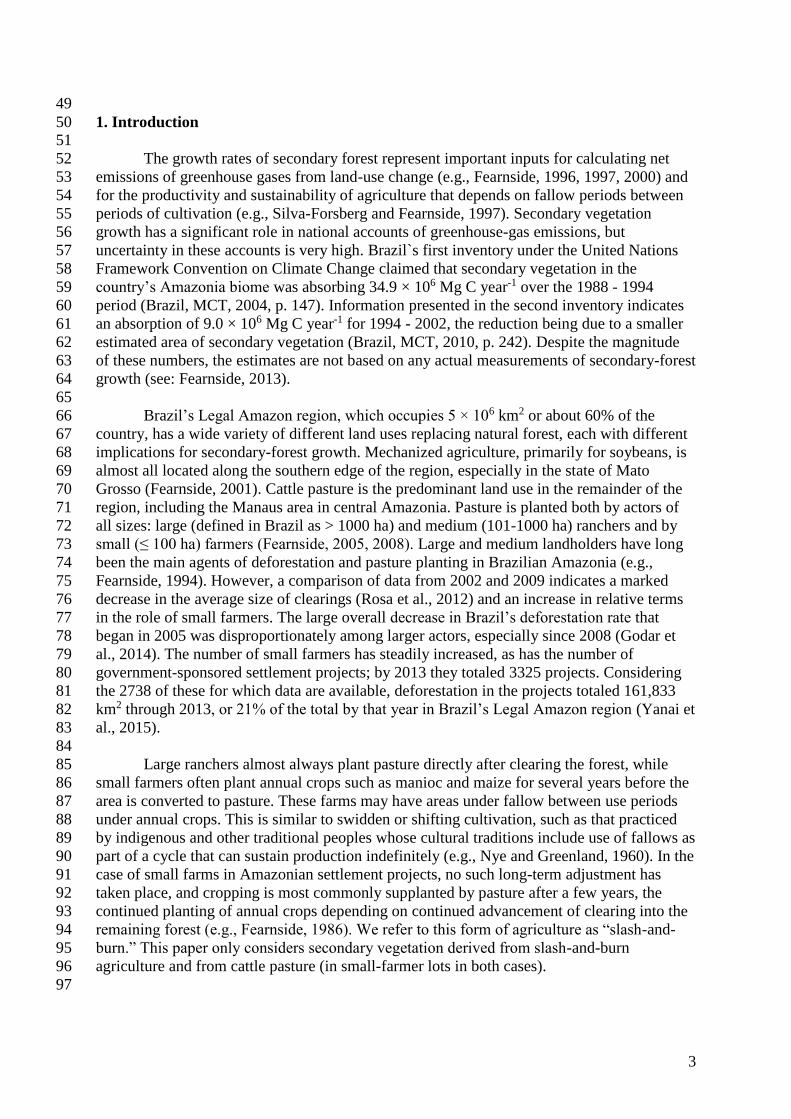
Table 1. Monospecific allometric models with their statistical tests to estimate aboveground biomass (AGB in
kg) of individuals of 13 species of secondary vegetation, with the independent variables diameter at breast
height (dbh in cm) and height ht in m). The average error of estimate (absolute values) is for the percentage
difference between the observed biomass per plant and that estimated by the model.
Species Std
(a)
dbh
range
Regression equation n r2 ME (b) Significance
(c)
SE
(d)
Aegiphila
integrifolia
In
1-16 cm ln(AGB) = -2.180 + 2.582 × ln(ht × dbh) 11 0.925 28.9% α P < 0.0001 0.100
β P < 0.0001 0.24
Bellucia
dichotomae &
B.
glossulariodes
together
In
1-23 cm ln(AGB) = -1.577 + 2.184 × ln(dbh) 35 0.942 27.8% α P < 0.0001 0.150
β P < 0.0001
0.095
Bellucia
dichotoma
In
1-9 ln(AGB) = -3.092 + 1.543 × ln(dbh × ht) 21 0.905 35.9% α P < 0.0001 0.291
β P < 0.0001 0.115
In
1-23 cm ln(AGB) = -1.538 + 2.185 × ln(dbh) 30 0.938 26.9% α P < 0.0001 0.168
β P < 0.0001 0.106
Bellucia
glossulariodes
In
1-15 cm ln(AGB) = -1.641 + 2.169 × ln(dbh) 11 0.968 24.0% α P = 0.001 0.224
β P < 0.0001 0.159
Cecropia ulei In 1-7 cm ln(AGB) = -4.173 + 1.477 × ln(dbh) 138 0.944 20.2% α P < 0.0001 0.057
β P < 0.0001 0.031
In and
Out 1-7 cm ln(AGB) = -4.163 + 1.489 × ln(dbh) 182 0.890 24.4% α P < 0.0001 0.069
β P < 0.0001 0.039
Couratari sp.
In
1-4 cm ln(AGB) = -1.362 + 1.916 × ln(dbh) 11 0.868 23.4% α P < 0.0001 0.187
β P < 0.0001 0.236
Goupia glabra
In
1-6 cm ln(AGB) = -1.523 + 1.926 × ln(dbh) 42 0.877 19.4% α P < 0.0001 0.092
β P < 0.0001 0.133
Lacistema
grandifolium
In and
Out 1-3 cm AGB = -0.890 + 0.946 × dbh 12 0.743 33.9 α P = 0,086 0.309
β P < 0.0001 0.176
Laetia procera In 1-8 cm ln(AGB) = -1.619 + 2.055 × ln(dbh) 21 0.962 21.1 % α P < 0.0001 0.133
β P < 0.0001 0.094
In
1-8 cm ln(AGB) = -2.765 + 1.263 × ln(dbh × ht) 21 0.961 19.7% α P < 0.0001 0.183
β P < 0.0001 0.981
In
1-15 cm ln(AGB) = -1.749 + 2.192 × ln(dbh) 50 0.982 12.7% α P < 0.0001 0.082
β P < 0.0001 0.991
Solanum
rugosum In 1-3 cm ln(AGB) = -2.489 + 2.166 × ln(dbh) 23 0.861 34% α P < 0.0001 0.177

β P < 0.0001 0.270
Solanum
rugosum
In and
Out 1-3 cm ln(AGB) = -2.224 + 1.908 × ln(dbh) 46 0.660 38.6% α P < 0.0001 0.127
β P < 0.0001 0.213
Trema
micrantha
In
1-6 cm ln(AGB) = -2.358 + 2.354 × ln(dbh) 33 0.962 13.8% α P < 0.0001 0.071
β P < 0.0001 0.084
Vismia
cayennensis
In
1-9 ln(AGB) = -2.219 + 2.526 × ln(dbh) 32 0.972 16.1% α P < 0.0001 0.108
β P < 0.0001 0.078
In
1-22 cm ln(AGB) = -2.124 +2.431 × ln(dbh) 49 0.987 17.5% α P < 0.0001 0.075
β P < 0.0001 0.040
In and
Out 1-9 ln(AGB) = -2.062 + 2.412 × ln(dbh) 40 0.959 19.2% α P < 0.0001 0.7105
β P < 0.0001 0.081
Vismia
guianensis
within
standar
d 1- 5 cm ln(AGB) = -1.6485 + 2.080 × ln(dbh) 150 0.908 21.7% α P < 0.0001 0.051
β P < 0.0001 0.7054
within
standar
d 5-15 cm ln(AGB) = -2.029 + 2.327 × ln(dbh) 43 0.974 7.4% α P < 0.0001 0.127
β P < 0.0001 0.059
within
standar
d 1-15 cm ln(AGB) = -1.706 + 2.160 × ln(dbh) 193 0.960 18.8% α P < 0.0001 0.036
β P < 0.0001 0.028
Vismia
japurensis
within
standar
d 1-5 cm ln(AGB) = -1.689 + 2.239 × ln(dbh) 21 0.954 19.0% α P < 0.0001 0.113
β P < 0.0001 0.113
Within
and
outside
of
standar
d 1-14 cm ln(AGB) = -1.641 + 2.126 × ln(dbh) 81 0.986 19.4% α P < 0.0001 0.052
β P < 0.0001 0.029
(a) Std. (Architectural and health standard): In = within standard; Out = outside of standard.
(b) ME = Mean error of the estimate.
(c) Significance = Significance level of t for the coefficient.
(d) SE = Standard error.

Table 2. Multispecific regression models to estimate aboveground biomass (AGB in kg) of secondary
vegetation individuals for a set of bushy species (excluding manioc), for a set of tree species (excluding the
genus Cecropia, palms, vines, bamboo and wild bananas) and dead individuals that remain standing. The
models were developed from biomass data measured with direct destructive methods in 24 secondary-
vegetation plots between 1 and 15 years of age and with a use history of pasture and agriculture. The mean error
of the estimate (absolute values) refers to the percentage difference between observed biomass per plant and
that estimated by the model.
Species
group
Std.
(a)
dbh
range
Regression equation n r2 ME
(b)
Significance (c) SE (d)
Trees
(excepting
Cecropia)
In and
Out 1-23 cm ln (AGB) = -1.878 + 2.2154 × ln(dbh) 1370 0.943 25.4% α P < 0.0001 0.013
β P < 0.0001 0.086
In
1-23 cm ln (AGB) = -1.869 + 2.231 × ln(dbh) 1128 0.963 20.3% α P < 0.0001 0.086
β P < 0.0001 0.013
Bushes
In and
Out 1-4 cm AGB = -0.253 + 0.3611 × dbh 74 0.703 40.3% Α P < 0.0001 0.048
β P < 0.0001 0.009
Standing
dead
plants
1-5 cm ln (AGB) = -2.172 + 1.803 × ln(dbh) 40 0.623 33.1% α P < 0.0001 0.185
β P < 0.0001 0.227
(a) Std. (Architectural and health standard): In = within standard; Out = outside of standard
(b) ME = Mean error of the estimate.
(c) Significance = Significance level of t for the coefficient.
(d) SE = Standard error.

Fig 1
0
2
4
6
8
10
- 0.2 0.4 0.6 0.8 1.0
C
0
10
20
30
40
50
60
1 3 5 7 9 11 13 15 Height (m)
Bio
mass (
kg
)
B
0
10
20
30
40
50
60
1 3 5 7 9 11 13 15
dbh (cm)
A
Bio
mass (
kg)
Bio
mass (
kg)
Wood density (g/cm3)

Fig 2
Vismia guianensis (n =193)
y = 2.7114 + 0.6699 × (dbh)
r 2 = 0.8362 P<0.001
0
3
6
9
12
15
18
- 3 6 9 12 15 dbh (cm)
Heig
ht (m
)