High frequency oscillatory ventilation in burned patient. Case review
Vegetation burning in the year 2000: Global burned area estimates
from SPOT VEGETATION data
Kevin Tansey,1 Jean-Marie Gregoire,2 Daniela Stroppiana,3 Adelia Sousa,4 Joao Silva,5
Jose M. C. Pereira,6,7 Luigi Boschetti,2 Marta Maggi,2 Pietro Alessandro Brivio,3
Robert Fraser,8 Stephane Flasse,9 Dmitry Ershov,10 Elisabetta Binaghi,11 Dean Graetz,12
and Pascal Peduzzi13
Received 14 March 2003; revised 20 October 2003; accepted 29 October 2004; published 8 June 2004.
[1] The scientific community interested in atmospheric chemistry, gas emissions fromvegetation fires, and carbon cycling is currently demanding information on the extent andtiming of biomass burning at the global scale. In fact, the area and type of vegetationthat is burned on a monthly or annual basis are two of the parameters that provide thegreatest uncertainty in the calculation of gas and aerosol emissions and burned biomass.To address this need, an inventory of burned areas at monthly time periods for the year2000 at a resolution of 1 km2 has been produced using satellite data and has been madefreely available to the scientific community. In this paper, estimates of burned area andnumber of burn scars for four broad vegetation classes and reported at the country level forthe year 2000 are presented using data taken from the inventory. Over 3.5 million km2 ofburned areas were detected in the year 2000, of which approximately 80% occurred inareas described as woodlands and shrublands. Approximately 17% of the burned areaoccurred in grasslands and croplands, the remaining 3% occurred in forests. Almost600,000 separate burn scars were detected. Descriptions of vegetation burning activity aregiven for ten regions. Finally, monthly burned area estimates are presented for the CentralAfrican Republic to illustrate the usefulness of these data for understanding, monitoringand managing vegetation burning activities. INDEX TERMS: 0305 Atmospheric Composition
and Structure: Aerosols and particles (0345, 4801); 0315 Atmospheric Composition and Structure: Biosphere/
atmosphere interactions; 1615 Global Change: Biogeochemical processes (4805); 1640 Global Change:
Remote sensing; KEYWORDS: atmospheric chemistry, biomass burning, remote sensing
Citation: Tansey, K., et al. (2004), Vegetation burning in the year 2000: Global burned area estimates from SPOT VEGETATION
data, J. Geophys. Res., 109, D14S03, doi:10.1029/2003JD003598.
1. Introduction
[2] Biomass burning is an annually occurring phenome-non affecting almost every vegetated ecosystem on Earth.
Biomass burning is an important driver for global changeowing to its effect on atmospheric composition and chem-istry, climate, biogeochemical cycling of nitrogen andcarbon, the hydrological cycle, the production of acid rain,the production of atmospheric black carbon that influencesthe absorption of sunlight, reflectivity and emissivity ofland, and stability of ecosystems [Levine, 1996; Levine etal., 1991; Kaufman et al., 2002; Govaerts et al., 2002]. Oneof the main uncertainties in the modeling of the climaticimpact of aerosols is our knowledge of gas and aerosolemissions. To fully understand the impact of vegetation fireson the emissions of trace gases and aerosols and ecosystemfunctioning and cycling, information on the temporal andspatial distribution of burning activity and the type ofvegetation burned is required at the global scale [VanAardenne et al., 2001; Malingreau and Gregoire, 1996;Mack et al., 1996; Andreae et al., 1996; Dwyer et al., 1999].In fact, the area consumed by fire at regional or globalscales is one of the parameters that provides the greatestuncertainty in calculating the amount of burned biomass andemitted gases at this scale [Scholes et al., 1996a; Barbosa etal., 1999; Andreae and Merlet, 2001; Levine, 1996; Isaev et
JOURNAL OF GEOPHYSICAL RESEARCH, VOL. 109, D14S03, doi:10.1029/2003JD003598, 2004
1Department of Geography, University of Leicester, Leicester, UK.2European Commission Joint Research Centre, Ispra, Italy.3Institute for Electromagnetic Sensing of the Environment, Milan, Italy.4Department of Rural Engineering, University of Evora, Evora,
Portugal.5Department of Forestry, Technical University of Lisbon, Lisbon,
Portugal.6Tropical Research Institute, Lisbon, Portugal.7Also at Department of Forestry, Technical University of Lisbon,
Lisbon, Portugal.8Natural Resources Canada, Canada Center for Remote Sensing,
Ottawa, Ontario, Canada.9Flasse Consulting, Maidstone, UK.10International Forest Institute, Moscow, Russia.11Universita dell’Insubria, Varese, Italy.12CSIRO Earth Observation Centre, Canberra, ACT, Australia.13United Nations Environment Programme, Geneva, Switzerland.
Copyright 2004 by the American Geophysical Union.0148-0227/04/2003JD003598$09.00
D14S03 1 of 22
al., 2002; Taylor and Zimmerman, 1991; Conard et al.,2002]. There are existing data gaps and large differencesin biomass burning and emission inventories, such as theEmission Database for Global Atmospheric Research(EDGAR) [Olivier and Berdowski, 2001] and the GlobalEmissions Inventory Activity (GEIA) [Liousse et al.,1996], used for atmospheric chemistry modeling purposes.Recent campaigns including the Southern Africa Fire-Atmosphere Research Initiative (SAFARI) experiment(http://safari.gecp.virginia.edu/), the Experiment forRegional Sources and Sinks of Oxidants (EXPRESSO)experiment (http://www.ncar.ucar.edu/info/GTCP/expresso.html), the Biomass Burning Experiment: Impact onthe Atmosphere and Biosphere (BIBEX) project (http://diotima.mpch-mainz.mpg.de/�bibex/Welcome.html) andthe Large-Scale Biosphere-Atmosphere Experiment in Ama-zonia (LBA) project (http://lba.cptec.inpe.br/lba/indexi.html) have improved the characterization of emissionfactors and combustion characteristics a considerableamount and have allowed the computation of emissionfactors for many gas species [Andreae and Merlet, 2001].However, much is unknown about the amount of biomassconsumed by fire at large scales on an annual basis.Previous estimations have been largely based on regionaldata and extrapolation. Other estimates have relied onnational statistics provided by countries without sufficientresources to derive accurate figures. The use of satellite datato derive information about the vegetation type and theburned area is one of many options available to thescientific community.[3] The amount of biomass consumed by fire is related to
the vegetation type, specifically the amount and composi-tion of the fuel, and also the efficiency of the burningprocess. Not all biomass is available for burning, and it isimportant to adequately characterize the biomass that isavailable for burning. Specifically, the following factorsinfluence the combustion of the vegetation: flammability(some plants contain oils), phenology (proportions of livingand dead material), vegetation structure and the location ofthe fuel within the vegetation, weather conditions (humidity,wind speed, temperature), and fuel moisture levels. All ofthese factors influence the fire duration and intensity andconsequently affect flaming and smoldering phases ofburning activity. A high combustion rate will have animpact on the injection of gases higher into the atmospherecaused by the intense release of heat and the types andamounts of gases released under different fire conditions isalso influenced by combustion. An overview of the tracegas emission estimations from biomass burning is given byPalacios et al. [2002]. While our knowledge is improvingon understanding some of the factors described above andsatellite-based studies are beginning to provide informationon fire intensity and vegetation distribution, it is still lackingin one of the first numbers required for the estimation ofburned biomass (BB) according to the equation by Seilerand Crutzen [1980]:
BB ¼ A� D� a� b; ð1Þ
where A is the area burned, D is the biomass density, ais the fraction of aboveground biomass, and b is theburning efficiency. In this paper, estimates for A are
provided for the global scale at the resolution of 1 km2.Recent estimates state that approximately 90% of thebiomass burned in Africa originates from savanna fires, incontrast to South America and southeast Asia, whereforest fires play a more significant role [Delmas et al.,1991], and at the global scale, burning of Africansavannas is believed to account for almost one third ofannual gross emissions from biomass burning [Andreae,1997]. However, these estimates still suffer fromsignificant levels of uncertainty, namely regarding theextent of area burned. In certain African countries, suchas Sudan, Namibia, Angola, Madagascar, and Ethiopia,annual estimates of burned area at the country level areunknown, and only suggestions have been made owing tothe difficulties in obtaining independent assessments ofburning activity (for more information, refer to http://www.fire.uni-freiburg.de/iffn/country/country.htm).[4] It is important to know the timing of burning activity
for a number of reasons. For example, in the Africansavanna, burning during the early part of the dry season,when the vegetation cover is still wet, reduces the com-bustion completeness and the combustion efficiency com-pared to burning toward the end of the dry season [Hoffaet al., 1999]. The emissions during the flaming andsmoldering phases may also be different, and from thepoint of view of the land managers, fire timing plays animportant role in controlling the characteristics of thesuccession vegetation.[5] Short-term cycling of carbon occurs in the tropical
savanna regions as the vegetation grows on an annual basis.For stand-replacing, forest fires where the burned biomassmay take from decades to centuries to regrow, or where fireis used to convert land cover types such as forest tocropland, the prefire carbon pool of the forest becomespermanently transferred to the atmosphere. Stand-replacingfires are occurring in tropical forests, and emissions fromthese fires are believed to be making a substantial contri-bution to global warming through land conversion in Brazil[Fearnside, 2000]. They are also occurring in boreal forestswhere fire is both a widespread and an important factor andunder current projections of climate warming will increasein frequency and severity and up to one quarter of thecarbon stored in boreal forests could be lost to the atmo-sphere under changing climate scenarios [Kasischke et al.,1995]. Isolated devastating fires such as those that occurredin Indonesia in 1997 released huge amounts of carbon intothe atmosphere because large reservoirs of carbon stored inpeat and natural forests were consumed with massiveimpacts on air quality, health, and atmospheric CO2 con-centrations [Page et al., 2002].[6] To address this need for better quantification of the
burned area extent and timing, and to provide the scientificcommunity with a reliable and well-documented data set, aninventory of burned areas at a resolution of 1 km for broadvegetation types including broadleaf forests, needleleaf andmixed forests, woodlands and shrublands and grasslands,and croplands has been produced. Broad vegetation typeshave been selected to present the findings in a clear andconsistent manner, without using regional vegetation typesor local names for vegetation. However, the full resolutiondata set is available to the scientific community to deriveestimates of burned area per regional vegetation types. The
D14S03 TANSEY ET AL.: GLOBAL VEGETATION BURNING IN THE YEAR 2000
2 of 22
D14S03
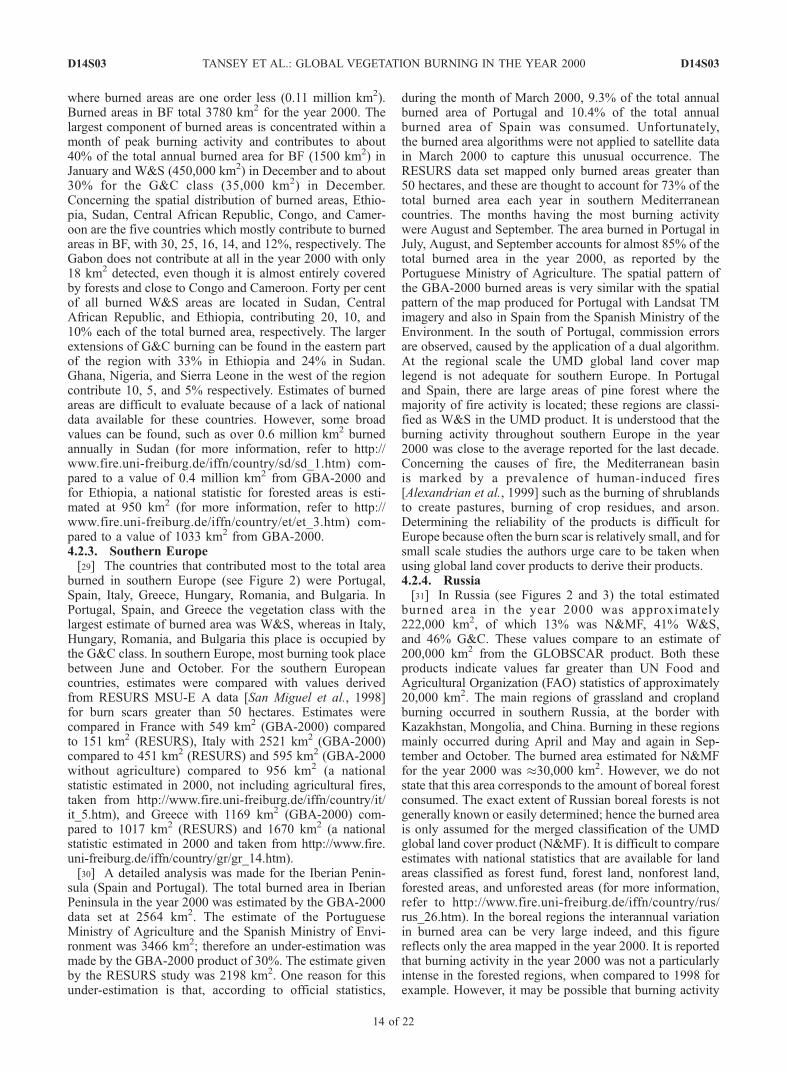
inventory, available in monthly time periods, was derivedfrom satellite data acquired on a daily basis during the year2000. Monthly burned area estimates for different vegeta-tion types are presented for the Central African Republic(CAR) in Africa to illustrate the usefulness of monthlyinformation contained in the inventory. Although data areavailable at the global scale, it is an exhaustive task topresent monthly burned area estimates for all countries inthis paper. The products described in this paper have beenproduced using fully documented methods under the GlobalBurned Area 2000 (GBA-2000) initiative [Tansey, 2002]and make a large contribution to the scientific understand-ing of the timing, extent, and location of burning activity atthe global scale.[7] The estimates of burned areas in this paper have
the distinct advantage in that they are produced from asingle source of information, namely satellite data from theVEGETATION (VGT) sensor aboard the European SPOT-4satellite. Previous estimates of burned areas at the globalscale have been derived from compilations of regional-scalestudies and a best guess made in remote regions or those notdirectly specified in the literature. In addition, estimatesoften come from many different sources, use complicatedmethods, or are badly documented. Large variations inpublished values make the user communities reluctant toutilize the data available to them. To highlight this point,five estimates from four published articles of the annualburned area (both from multiannual year averages or singleyear estimates) in Russian forests ranged between 1.2 and15 million hectares [Food and Agricultural Organization ofthe United Nations (FAO), 2001; Stocks, 1991; Lavoue etal., 2000; Shvidenko and Goldammer, 2001]. In India, thereare no comprehensive data on burned area, number of fires,and areas of regeneration for fear of accountability (formore information, refer to http://www.fire.uni-freiburg.de/iffn/country/in/in_5.htm). Two assessments made by theIndian authorities estimated forest loss at 1.45 millionhectares and 3.73 million hectares, quite a difference.Furthermore, evidence from active fire maps, derived fromthe AHVRR instrument show significant fire activity thatneeds to be confirmed with evidence of burned areas (formore information, refer to http://www.gvm.jrc.it/tem/wfw/wfw.htm). In Brazil, it is important to see if the methoddescribed in this paper is able to detect the well-documenteddeforestation fires that are occurring in the south of the legalAmazon. The same is true in other tropical forests, such ascentral Africa and southeast Asia, where for the latter regionit is important to be able to verify estimates derived fromother sources (for more information, refer to http://www.fire.uni-freiburg.de/iffn/country/id/id_35.htm). Burning ofagricultural land is often not presented in national statisticsthat mainly focus on forested areas and the financial impactof fires in forests. This data set indicates burning activity inall vegetated regions and therefore the opportunity to assessthe amount of residue burning and land clearance burningactivities is available to the scientific community. Countrieswhere it is believed agricultural residue burning occurs insome significance include Russia, Kazakhstan, Argentina,United States of America, Italy, and India. Finally, it isimportant for this study to highlight any limitations in thescience of detecting the signal from the burned area andhow this can be improved in the future. Therefore the data
set described in this paper, while not perfect, is nonethelesstimely and worthwhile.
2. Satellite Image Data Set
[8] Burned area mapping at a regional scale has beenperformed over different ecosystems using SPOT VGTimagery [Eastwood et al., 1998; Fraser and Li, 2002]. Atthe global scale the ERS Along-Track Scanning Radiometer2 (ATSR-2) has been used with some success to mapburned areas for the year 2000 [Kempeneers et al., 2002]through a project called GLOBSCAR initiated by theEuropean Space Agency (ESA). In this project, two algo-rithms were applied globally to derive burned area productswith the same resolution as the GBA-2000 products. Theseresults make a valuable data set for comparison, and valuesare reported in this paper where this is possible (informa-tion on GLOBSCAR products can be found at http://www.geosuccess.net). The GLOBSCAR values reported forvegetation classes are related to the InternationalGeosphere-Biosphere Program (IGBP) product [Lovelandet al., 2000]. In addition, reference is made to detectionsmade by the nighttime overpass of the ATSR-2 satellite andreported in the ATSR-2 World Fire Atlas (informationcan be found at http://odisseo.esrin.esa.it/ionia/FIRE/AF/ATSR/). A more detailed comparison study between theseproducts is presented in the paper by Simon et al. [2004].[9] The VGT sensor was launched on board the European
SPOT-4 platform inMarch 1998 (information on this satelliteand sensor can be found at http://www.spot-vegetation.com).The multispectral registration is reported to be better than0.2 km, the multitemporal registration better than 0.5 km,and the absolute geolocation better than 0.8 km. Theacross-track resolution is approximately 1.1 km at nadir.The data are projected and interpolated to a constant pixelresolution of approximately 1 km2. The sensor acquiresdata in four spectral bands covering visible (0.43–0.47 mmcorresponding to blue wavelengths; 0.61 –0.68 mmcorresponding to red wavelengths) and infrared (0.78–0.89 mm corresponding to near infrared; 1.58–1.75 mmcorresponding to short-wave infrared) wavelengths. The2200 km swath width allows imaging over large areas anda return frequency yielding global, daily coverage, apartfrom within the tropics where, owing to the satellite orbitcharacteristics and Earth’s curvature, images of the samearea are taken every 4 out of 5 days. The acquisition timeis 10:30 AM local solar time in the descending mode. Thespectral band in the visible blue region provides informa-tion on the state of the atmosphere (aerosol density) and isused to make atmospheric corrections to the data. Theshort-wave infrared band centered at 1.65 mm was found tobe useful for burned area mapping [Eastwood et al., 1998;Eva and Lambin, 1998]. Trigg and Flasse [2000, 2001]showed among others the relevance of VGT spectral bandsto detect burned areas. The VGT time series used in thiswork was the daily surface reflectance (S1) product start-ing from 1 December 1999 to 31 December 2000. Atmo-spheric corrections are performed by the Centre Nationald’Etudes Spatiales (CNES) using the Simplified Methodfor Atmospheric Corrections (SMAC) described in thework of Rahman and Dedieu [1994]. The expected im-provement of the GBA-2000 product is that a number of
D14S03 TANSEY ET AL.: GLOBAL VEGETATION BURNING IN THE YEAR 2000
3 of 22
D14S03
ecosystem specific regional algorithms have been devel-oped by a network of partners and applied at the globalscale at a resolution of 1 km and presented in a formateasily utilized by a number of scientific communities.
3. Algorithms and Methodology
[10] The approach taken utilized a network of partners forthe development and testing of a series of regional algo-rithms for processing the daily VGT-S1 imagery into burnedarea maps. This approach was adopted because the methodsrequired to detect a burned area differ from one ecosystemor climatic zone to another (e.g., boreal forest, tropicalforest, grasslands). The approach taken brought togetherdifferent research groups with regional expertise to producea global product. Furthermore, we wanted to avoid the useof a single or double algorithm for mapping the globalproduct, as this work was being undertaken elsewhere bythe European Space Agency (GLOBSCAR). Eleven regionalalgorithms in total were developed from temporal andspatial subsets of VGT S1 data. The main specificationsof the algorithms, including the geographical regions usedto develop the algorithms, are presented in Table 1. Thenaming convention of the algorithms was such that theinstitute, and in some cases also the developer, was associ-ated with the algorithm was used. Table 1 provides refer-ence information for each algorithm developed under theGBA-2000 initiative. Following a series of tests comprisingintercomparisons of products derived from different algo-rithms over the same area, implementation of algorithmsoutside their region of development, and the ability of thealgorithms to detect burned areas in different vegetationtypes, nine algorithms were selected for processing theentire year 2000 data set and integrated into a globalprocessing chain [Tansey, 2002]. Two algorithms were notselected because a single algorithm adequately mappedburned areas in both northern and southern Africa, and adecision was made to use only one algorithm to map theAfrican continent. It is shown that a number of the algo-rithms used daily VGT data to yield daily burned areaproducts, e.g., IFI and GVM (Boschetti), while others usedimage compositing techniques to reduce levels of signalnoise observed in the daily data, e.g., GVM (Stroppiana),UOE/UTL, and CCRS. The compositing methods are fullydescribed by Tansey [2002], Stroppiana et al. [2002], andCabral et al. [2003].[11] The removal of contaminated pixels prior to applying
the algorithms was an important stage in the image process-ing. A complete overview of the preprocessing steps,summarized in this paragraph, is given in the work ofTansey [2002]. Contaminated pixels having values charac-teristic of clouds, cloud shadow (that have similar spectralcharacteristics to burned areas), and fire smoke are re-moved. Those pixels located at the very edge of the imageswath are removed because often they have erroneousvalues caused by the resampling method and also thosethat appear to be saturated (or have very high values ofreflectance) in the short-wave infrared band caused byproblems with the sensor. In addition, those pixels locatedin regions of pronounced topographical variation at thescale of 1 km, such as the Himalayas and the Andes, wereremoved because they were indicated as being burned when
in fact they were areas of terrain shadow. A digital elevationmodel (DEM) called the Global Land One-km Base Eleva-tion (GLOBE) was used to determine those pixels, using amethod outlined by Colby [1991], whose spectral character-istics may have been contaminated with terrain shadow[Hastings and Dunbar, 1998].[12] A global land cover product was used, first as a mask
to remove nonvegetated surfaces (water, urban areas,deserts, and ice masses) and second to derive the estimatesof burned area according to vegetation type presented in thispaper. A vegetation mask was used because there wereuncertainties concerning the performance of the algorithmsin nonvegetated regions. These uncertainties were related toobservations of dark rocks (particularly in eastern Africa),flooded salt pans, and melting snow and ice. The followingregions were excluded from the analysis: extensive regionsof the Sahara Desert and central Saudi Arabia, the AtacamaDesert in South America, regions of Iran and southernPakistan, the Tibetan Plateau and small regions of centralAustralia and western United States. A number of globalland cover products are available to the scientific commu-nity, although unfortunately, each product has a differentnumber of classes, having been derived using differentmethods and having been developed with different userapplications in mind. The critical point to stress here is notdirectly the choice of land cover product, but to understandthe reasons for choosing the product and to state anymodifications that have been made to the land coverproduct. The global land cover product selected for thisstudy was the University of Maryland (UMD) global landcover product [DeFries et al., 1998; Hansen et al., 2000].The nonvegetation mask was applied to all regions of theglobe in a consistent manner.[13] The global data set was distributed into sections
depending on large-scale vegetation features, seasonal burn-ing activity, or to ensure problem-free computational pro-cessing. The selection of a suitable algorithm for operationalimplementation outside regions of algorithm calibrationdescribed in Table 1 was made after looking at three criteria.The first criterion was to look at the main types, distribu-tion, and patterns of vegetation in the region using a globalland cover map and to select an algorithm or number ofalgorithms that had been developed and successfully ap-plied over a region with similar characteristics. The secondcriterion was then to apply these algorithms to the areaunder consideration and to see how they compared betweenthemselves and also compared to other sources of burnedarea or active fire information. The third criterion dependedon certain characteristics of the region of interest such astopography, presence of agricultural areas, areas tending toflood, and urban areas that can all have an influence on thealgorithm’s results. All of the criteria above were consideredwhen finding a suitable algorithm for the detection ofburned areas outside regions of development. In someregions a single algorithm was assumed to adequately detectburned areas, mainly owing to the region having similarcharacteristics to the region of algorithm development. Inother regions it was necessary to use two algorithms to fullycapture all of the burning activity for a number of reasons.These include circumstances where burning activities occurin two or more distinct vegetation types, such as in northernNorth America, where one algorithm is used to detect scars
D14S03 TANSEY ET AL.: GLOBAL VEGETATION BURNING IN THE YEAR 2000
4 of 22
D14S03

in boreal forests and another is used to detect scars inshrublands and evidence of burning activity in dailyimages (smoke or active fires observed) or through usinghigher-resolution images such as from Landsat ThematicMapper (TM) (available from http://Glovis.usgs.gov/BrowseBrowser.shtml) to determine that burned areasare not adequately detected by one algorithm but by combin-ing the detections from two algorithms. Specific improve-ments are made by using two algorithms to improve thedetections made in the USA and Central America, central andeastern Asia, southern Europe, and northern Africa.
[14] After the tests described above had been carried out,the global data set was processed using the followingmethod. Please refer to Table 1 for a description of theacronyms used in this paragraph. Australia was processedwith an algorithm developed by GVM (Stroppiana). The IFIalgorithm was used solely to process the southern half ofSouth America (including Argentina and Chile), northernEurope, the majority of northern Asia (including most ofRussia), the Indian subcontinent, and continental and insularsoutheast Asia. The IFI algorithm was used together withthe GVM (Boschetti) algorithm (i.e., both products were
Table 1. Main Characteristics of the GBA-2000 Burned Area Algorithms
Algorithm Overview of Main Characteristics Region of Development Reference
CCRS Canada Centre forRemote Sensing, Canada
Ten-day composites are derived with a max.NDVIa criteria. A multiple logisticregression model based on ten-daychanges, an ecosystem mask and monthlysatellite-derived metrics is used. Theproducts are filtered and region grown.
one region of Canada:62.5�–57�N;112�–104.5�W(SPOT VGT S10b
data from the year 1998 werealso used)
Fraser et al.[2003]
CNR Institute for ElectromagneticSensing of the Environment,Italy (not usedg)
Contextual supervised classificationmethodology based on hierarchical useof the MultiLayer Perceptron (MLP)neural network which use the spatialand temporal information of daily imagesto produce daily maps of burned areas.
one region of Africa: Africa:18�N–0�S; 20�W–55�E
Brivio et al.[2002]
GVM (Boschetti) Global VegetationMonitoring Unit, JRC, Italy
Removal of contaminatedc pixels anda BRDFd model is inverted to yieldreflectance. A change detection methodd isused to compare values predicted from themodel and observed in the NIRa andSWIRa bands.
two regions of Central America:22�–7�N; 93�–77�W33�–15�N;117�–93�W
Tansey [2002]Boschetti[2003]
GVM (Stroppiana) Global VegetationMonitoring Unit, JRC, Italy
Removal of contaminatedc pixels andcomposited over a ten-day time periodusing the minimum NIRa value. Thealgorithm uses CARTe theory to derivedecision rules from training sets. Theresulting products are filtered and summedto create monthly products.
one region of Australia:11�–21�S;125�–135�E
Stroppiana andGregoire [2002]Stroppiana et al.[2002, 2003]
IFI International ForestInstitute, Russia
Removal of contaminatedc pixels, dailyvalues of the NIRa band are observed forabrupt changes when compared with anintermediate product and other tests aresatisfied.
two regions of Russia:68�–60�N;45�–60�E60�–48�N;118�–140�E
Ershov and Novik[2001]
NRI Natural Resources Institute,UK (not usedg)
A change detection algorithm using preburnand postburn data in the NIRa and SWIRa
bands. The preburn image is updated dailywith noncontaminated pixels. To reducethe variation of the spectral signal causedby viewing geometry the algorithm utilizesdaily data in five-day cycles.
one region of southeasternAfrica:17�–29�S; 11�–30�E
Boschetti et al.[2002]
UOE/UTL University of Evora,Portugal; Technical Universityof Lisbon, Portugal
Removal of contaminatedc pixels andcomposited over a month using the3rd min. NIRa value. The algorithm usesCARTe theory to derive decision rulesfrom training sets.
one region of Brazil:5�N–20�S;75�–45�W
Silva et al. [2002]
UTL – Africa 1UTL – Africa 2UTL – EuropeUTL – AsiaTechnical University ofLisbon, Portugal
Removal of contaminatedc pixels andcomposited over a monthly time periodusing the minimum NIRa value. Africa 2uses CARTe theory to derive decisionrules. The other algorithms use Fisher’slinear discriminant analysisf approachesbut use different thresholds.
four regions were provided:AfricaA: 10�–28�S; 22�–42�EAfricaB: 18�N–35�S; 20�W–55�EEurope: 44�–35.5�N; 10�W–0�Asia: 55�–40�N; 115�–135�E
Silva et al. [2002,2003]
aNIR refers to the near infrared band, SWIR refers to the short-wave infrared band. NDVI refers to the normalized difference vegetation index.bSPOT VGT S10 data refers to products that have been composited over a ten-day period following a maximum NDVI criteria.cContaminated pixels are those of cloud or smoke, cloud shadow, acquired at extreme angles, sensor saturation in the SWIR band, nonvegetated or in
topographic shadow.dBRDF refers to the bidirectional reflectance distribution function. The BRDF model is described by Roujean et al. [1992]. The method is adapted from
Roy et al. [2002].eCART is an acronym for Classification Trees and Regression Trees, described by Breiman et al. [1984].fFisher’s Linear Discriminant Analysis method is described in the work of Johnson and Wichern [1988].gNot used indicates that this algorithm was used to create the final GBA-2000 product.
D14S03 TANSEY ET AL.: GLOBAL VEGETATION BURNING IN THE YEAR 2000
5 of 22
D14S03
merged) for regions of the United States (US), south of30�N, and Central America, the UTL Europe algorithm insouthern Europe and northern Africa, the UTL Africa 2algorithm in Turkey, Iraq, and regions surrounding theBlack and Caspian Seas, and the UTL Asia algorithm (aderivative of UTL Africa 1) for a region from the TibetanPlateau, through Mongolia, and northern China to Japan.The CCRS algorithm was used to derive burned areaproducts for forested regions of Canada and the US, northof 30�N (according to a forest cover map provided byCCRS). The nonforested regions of the US, north of30�N, were processed using the first algorithm developedby the UTL group (UTL Africa 1). The UOE/UTL algo-rithm was used to process a window covering the northernhalf of the South American continent (including the Ama-zon Forest). The UTL Africa 2 algorithm was used to derivethe burned area products for sub-Saharan Africa. In certainregions, such as New Zealand, some Pacific Islands, north-ern England, Scotland, Eire, Northern Ireland, Hawaii,Iceland, and Greenland, the algorithms were not applied.This was due either to their isolated location or theirinsignificant contribution to global burning activity.[15] In certain locations, algorithms were not applied to
the VGT data set for the whole of the year 2000. Thisdepended on whether there was a distinct fire season,caused mainly by climatic variations (snow cover, heavyrainfall, etc.), or significant commission of burned areasoutside the main periods of fire activity such as that causedby flooding. To determine the main periods of burningactivity, information was used from published literaturesuch as Dwyer et al. [1999], Cahoon et al. [1992], Dwyeret al. [1998], Moreno-Ruiz et al. [1999], and that availablethrough the International Forest Fire News: Country NotesWeb site at http://www.fire.uni-freiburg.de/iffn/country/country.htm. The data processing started at least 1 monthbefore the indicated start of the fire season and one monthafter the end of the fire season. To summarize, data wereprocessed between April and October 2000 for regions lyingnorth of 30�N, January to May 2000, and September toDecember 2000 between 30�N and 8�N in Central America,30�N and 10�N in Africa, and 30�N and 6�N in India andsoutheast Asia and from April to December 2000 insouthern Africa, between approximately 10�S and the Capeof Good Hope in South Africa. The complete year 2000data set was processed for all other regions including SouthAmerica south of 10�N, equatorial Africa between 10�Nand 10�S, and insular southeast Asia and Australia south of6�N.[16] It is generally assumed that a vegetated area is
burned only once during a fire season. However, over theobservation period of this study, it was possible that thesame vegetated area burns twice. This can occur in regionsbetween 0� and 30�N in all continents. For example, avegetated area was burned toward the end of the 1999–2000 dry season and was detected in January 2000, andafter the wet season the vegetation was burned again earlierin the 2000–2001 dry season and was detected in December2000. In the data set presented, the year 2000 synthesisproduct provides an estimate of the area burned during theyear 2000. However, for this particular product, a value isassociated to each pixel indicating if it has been detected asburnt or not burnt, and not if the pixel has been detected as
being burnt twice. For those regions described previously inthis section, the actual annual burned area is calculated bysumming the monthly estimates. It is important for the userto be aware of this to ensure the correct data is used for theirapplication.[17] Throughout the implementation of the regional
burned area algorithms, care was taken to ensure that nolarge errors of commission or omission were made. Confir-mation of burning activity was made using quick-lookLandsat TM imagery or evidence of burning activity inthe VGT products such as smoke and fire fronts. In all butone case, there was no overlap area at the boundaries of theregionalized algorithms. In the single overlap region, locatedin northern Australia and southern Indonesia, correspon-dence between the two burned area maps, produced with theIFI and GVM (Stroppiana) algorithms, was good. No majorerrors were observed at the join between regions. Artificialedge effects, however, are observed in central southernRussia near to the Kazakhstan border, caused by theinherent properties of the IFI algorithm that uses datawindows 200 � 200 km in size to generate statistics ofburned areas. After an investigation, these errors werebelieved to be caused by contamination of the VGT S1image data owing to thin smoke or during the raw dataprocessing not masked out during the various data cleaningprocesses applied to the data. These errors are only ob-served in the region of southern Russia, and given that theIFI algorithm is used extensively elsewhere with no furtheroccurrences reported, it was decided to accept these errorsin the final product.[18] The UMD land cover product was used to present the
estimates of burned area according to vegetation type. Atthe time of the project’s execution, it was considered to bethe most current product that was freely available to theusers, actively being used by many different research groupsand not containing a large number of classes (the UMDproduct is available from http://glcf.umiacs.umd.edu/data).The UMD product has 14 classes, of which 11 indicate avegetation cover. The vegetation classes represented areevergreen needleleaf, evergreen broadleaf, deciduous nee-dleleaf, deciduous broadleaf and mixed forest, woodland,wooded grassland, closed shrubland, open shrubland, grass-land, and cropland. However, to estimate the biomassburned and gas emissions from 11 classes of vegetationrequires a considerable amount of information, such asbiomass loading, burning efficiencies, and emission factorsfor each class. Therefore we grouped the 11 vegetationclasses in the UMD product into four groups. We justifiedthe grouping of the vegetation classes presented in thispaper partly on the basis of evidence presented in theliterature. Studies describing continental and global esti-mates of burned biomass and emissions report parametervalues (e.g., burning efficiency, biomass loadings, emissionfactors, fuel moisture, fire intensity) that are averaged (orsimplified) for the purposes of modeling studies usingvegetation types such as wetlands, savanna, and borealecosystems in the work of Cofer et al. [1996], tropicalforest, tropical savanna, temperate and boreal forest, fuel-wood, and agricultural residues in the work of Hao andWard [1993] and Granier et al. [2000] (with the replace-ment of tropical savanna with savanna) or savanna andgrasslands, tropical forest, extratropical forest, biofuel burn-
D14S03 TANSEY ET AL.: GLOBAL VEGETATION BURNING IN THE YEAR 2000
6 of 22
D14S03

ing, and agricultural residues as presented in the work ofAndreae and Merlet [2001]. At this level of detail, Granieret al. [2000] used these classes to derive a 3-D chemicaltransport model to assess the significance of biomassburning on the ozone budget. Furthermore, the literatureoften reports burned biomass and gas emission values forvegetation types having regional naming conventions orthose that are not easily translated at larger scales, such asFynbos and infertile savanna given in the work of Scholes etal. [1996b]. The results presented in this paper are illustra-tive of the burning of broad vegetation classes at the globalscale. For biomass burning and emission studies requiring agreater level of detail with regard to burning in specificvegetation types, the GBA-2000 product can be used withmore precise land cover products, biomass, and emissionparameters. An example of the use of the GBA-2000product can be found in the paper by Hoelzemann et al.[2004]. As previously mentioned, the 11 UMD classes wereassigned to one of four broad vegetation groups. Evergreenneedleleaf, deciduous needleleaf, and mixed forests weregrouped into a class called needleleaf and mixed forests(N&MF); evergreen broadleaf and deciduous broadleafwere grouped into a class called broadleaf forests (BF);woodland, wooded grassland, closed shrubland, and openshrubland were grouped into a class called woodlands andshrublands (W&S); and grasslands and croplands (G&C)were merged to form the fourth class. To enable the users togain confidence in using the burned area estimates reportedfor each vegetation group, the variation of parameter valuesused to estimate burned biomass and emissions should bekept to a minimum. From a practical point of view, thisvariation is difficult to measure as there are potentiallynumerous sources of information to consider. Thereforeonly a brief overview is provided in this paper. For eachof the four vegetation groups, values of emission factors,combustion efficiencies, and average biomass loadings havebeen taken from literature for land cover classes havingsimilar labels and properties to the UMD classes. Maximumaboveground biomass loads (kg/m2) range between 27.5and 38.4 for N&MF, 22.0 and 27.5 for BF, 2.7 and 10 forW&S, and 1.6 and 3.8 for G&C taken from Zheng et al.[2003] and Palacios et al. [2002]. Estimates of combustionefficiency (used when calculating emissions using emissionratios) range between 0.87 and 0.88 for N&MF, 0.87 and0.89 for BF, 0.92 and 0.97 for W&S, and 0.9 and 0.96 forG&C taken from Hao and Ward [1993], Scholes et al.[1996b], and Kaufman et al. [1992]. Estimates of emissionfactors (grams/kg biomass) for CO2 range between 1569and 1640 for N&MF, 1569 to 0.89 for BF, 1530 to 1613 forW&S, and 1515 to 1613 for G&C taken from Andreae andMerlet [2001] and Ferek et al. [1998]. To aid the interpre-tation of the burned area maps, the grouped vegetationcover product was overlain with a political boundary map.
4. Analysis and Discussion of GlobalVegetation Burning
[19] Information on the spatial and temporal distributionof biomass burning is very much in demand by the climateand ecosystem modeling communities. Therefore the GBA-2000 product has been made available to users at no cost(available at http://www.gvm.jrc.it/fire/gba2000/index.htm).
Maps of the GBA-2000 products can be viewed interac-tively through the United Nation Environment Programme(UNEP) Internet Map Server site (available at http://www.grid.unep.ch/activities/earlywarning/preview/ims/gba/). Onthe UNEP site the user can overlay land cover maps,political boundaries, and protected regions with the softwaretool provided. The data set described in this paper consistsof annual burned area estimates for the four vegetationclasses outlined in the previous section differentiated bypolitical boundary. A description is given of the spatial andtemporal distribution of burned areas for each of broadvegetation zone in the year 2000. An example of the use ofthe monthly burned area products is presented for theCentral African Republic (CAR) and illustrates the useful-ness of the data set for the monitoring of burning activityand assessing the impact of burning on the vegetation. Theburned area estimates presented in this paper were derivedusing a dedicated software tool, developed by the EuropeanCommission Joint Research Centre (JRC) and the Univer-sity of Alcala, Spain, and called the Global Fire AnalysisGIS Module. The module, run using ESRI’s ArcViewsoftware, computes and tabulates burned area statistics forany region of interest or corresponding ancillary map (suchas land cover and political boundary). Estimates of burnedarea are given in square kilometers (km2). In the followingparagraphs the use of the phrase ‘‘burning activity’’ refers tothe detection of burn scars and not the detection of activefires or fire activity.
4.1. Spatial and Temporal Distribution ofVegetation Burning
[20] Estimates of burned area (in square kilometers) aregiven in Table 2 by grouped vegetation type and politicalboundary. In addition to the burned area values, figures arepresented on the number of burned scars (either single pixelor cluster of pixels) and the percentage of the total area ofthat vegetation type burned within the specified country.The values given in Table 2 are comma delimited and arepresented for the year 2000 product only. A zero (0) in thetable indicates that no burned areas were detected in thatparticular vegetation type, a dash indicates that the vegeta-tion group is not represented in that particular country.Monthly data are available for each country, but becauseof the magnitude of this data set, only the annual synthesisis shown. Only those countries with burned areas greaterthan 60 km2 in the year 2000 are presented; those countrieswith total burned areas less than 60 km2 contributed a verysmall percentage of the global burned area (�0.02%).Before a detailed interpretation of the distribution of burnedareas is given, it is worth extracting the main themes fromTable 2.[21] The estimated global burned area for the year 2000 is
just over 3.5 million km2, and nearly 600,000 separate burnscars were detected. Of the total area burned, 1.5% isclassified as N&MF, 1.2% as BF, and 16.6% as G&C.The most common type of vegetation burned is W&S at80.7%. However, this class only represents 61% of the totalnumber of burn scars. The percentage of the total number ofburn scars are 2.5% for N&MF, 2.9% for BF (a total ofapproximately 100,000 km2 for forests), and 33.9% forG&C. The GLOBSCAR product reported a global total ofapproximately 2 million km2, of which 307,000 km2 were
D14S03 TANSEY ET AL.: GLOBAL VEGETATION BURNING IN THE YEAR 2000
7 of 22
D14S03
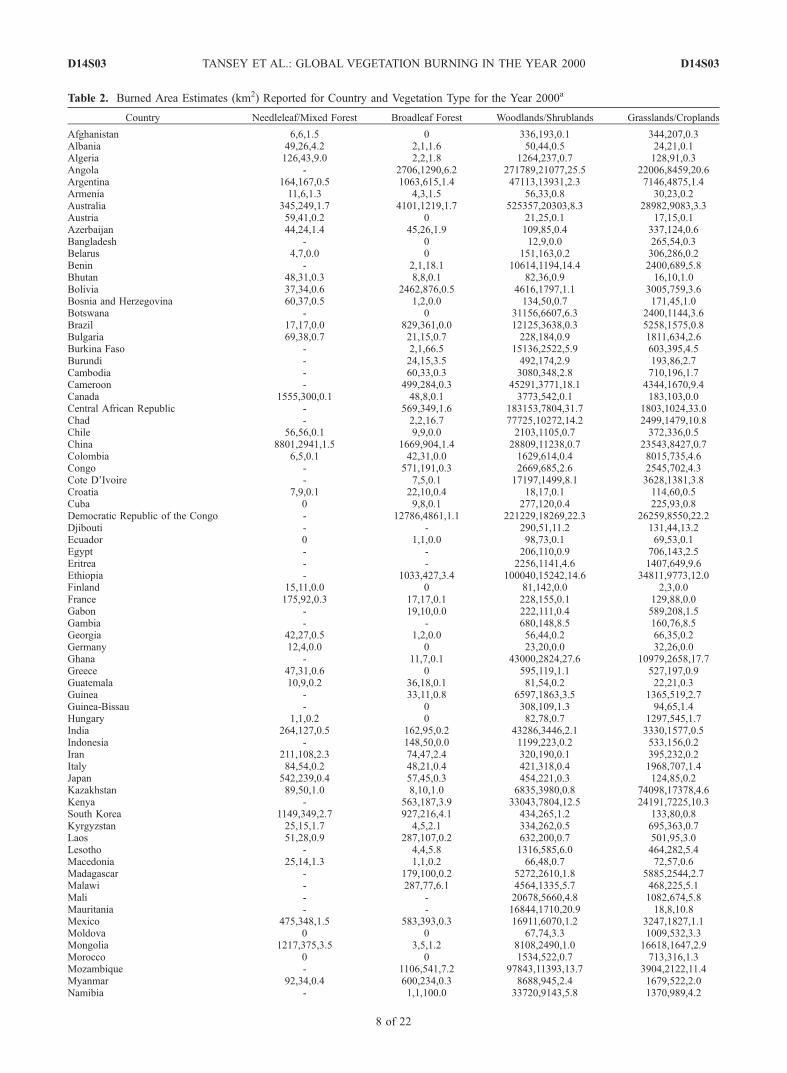
Table 2. Burned Area Estimates (km2) Reported for Country and Vegetation Type for the Year 2000a
Country Needleleaf/Mixed Forest Broadleaf Forest Woodlands/Shrublands Grasslands/Croplands
Afghanistan 6,6,1.5 0 336,193,0.1 344,207,0.3Albania 49,26,4.2 2,1,1.6 50,44,0.5 24,21,0.1Algeria 126,43,9.0 2,2,1.8 1264,237,0.7 128,91,0.3Angola - 2706,1290,6.2 271789,21077,25.5 22006,8459,20.6Argentina 164,167,0.5 1063,615,1.4 47113,13931,2.3 7146,4875,1.4Armenia 11,6,1.3 4,3,1.5 56,33,0.8 30,23,0.2Australia 345,249,1.7 4101,1219,1.7 525357,20303,8.3 28982,9083,3.3Austria 59,41,0.2 0 21,25,0.1 17,15,0.1Azerbaijan 44,24,1.4 45,26,1.9 109,85,0.4 337,124,0.6Bangladesh - 0 12,9,0.0 265,54,0.3Belarus 4,7,0.0 0 151,163,0.2 306,286,0.2Benin - 2,1,18.1 10614,1194,14.4 2400,689,5.8Bhutan 48,31,0.3 8,8,0.1 82,36,0.9 16,10,1.0Bolivia 37,34,0.6 2462,876,0.5 4616,1797,1.1 3005,759,3.6Bosnia and Herzegovina 60,37,0.5 1,2,0.0 134,50,0.7 171,45,1.0Botswana - 0 31156,6607,6.3 2400,1144,3.6Brazil 17,17,0.0 829,361,0.0 12125,3638,0.3 5258,1575,0.8Bulgaria 69,38,0.7 21,15,0.7 228,184,0.9 1811,634,2.6Burkina Faso - 2,1,66.5 15136,2522,5.9 603,395,4.5Burundi - 24,15,3.5 492,174,2.9 193,86,2.7Cambodia - 60,33,0.3 3080,348,2.8 710,196,1.7Cameroon - 499,284,0.3 45291,3771,18.1 4344,1670,9.4Canada 1555,300,0.1 48,8,0.1 3773,542,0.1 183,103,0.0Central African Republic - 569,349,1.6 183153,7804,31.7 1803,1024,33.0Chad - 2,2,16.7 77725,10272,14.2 2499,1479,10.8Chile 56,56,0.1 9,9,0.0 2103,1105,0.7 372,336,0.5China 8801,2941,1.5 1669,904,1.4 28809,11238,0.7 23543,8427,0.7Colombia 6,5,0.1 42,31,0.0 1629,614,0.4 8015,735,4.6Congo - 571,191,0.3 2669,685,2.6 2545,702,4.3Cote D’Ivoire - 7,5,0.1 17197,1499,8.1 3628,1381,3.8Croatia 7,9,0.1 22,10,0.4 18,17,0.1 114,60,0.5Cuba 0 9,8,0.1 277,120,0.4 225,93,0.8Democratic Republic of the Congo - 12786,4861,1.1 221229,18269,22.3 26259,8550,22.2Djibouti - - 290,51,11.2 131,44,13.2Ecuador 0 1,1,0.0 98,73,0.1 69,53,0.1Egypt - - 206,110,0.9 706,143,2.5Eritrea - - 2256,1141,4.6 1407,649,9.6Ethiopia - 1033,427,3.4 100040,15242,14.6 34811,9773,12.0Finland 15,11,0.0 0 81,142,0.0 2,3,0.0France 175,92,0.3 17,17,0.1 228,155,0.1 129,88,0.0Gabon - 19,10,0.0 222,111,0.4 589,208,1.5Gambia - - 680,148,8.5 160,76,8.5Georgia 42,27,0.5 1,2,0.0 56,44,0.2 66,35,0.2Germany 12,4,0.0 0 23,20,0.0 32,26,0.0Ghana - 11,7,0.1 43000,2824,27.6 10979,2658,17.7Greece 47,31,0.6 0 595,119,1.1 527,197,0.9Guatemala 10,9,0.2 36,18,0.1 81,54,0.2 22,21,0.3Guinea - 33,11,0.8 6597,1863,3.5 1365,519,2.7Guinea-Bissau - 0 308,109,1.3 94,65,1.4Hungary 1,1,0.2 0 82,78,0.7 1297,545,1.7India 264,127,0.5 162,95,0.2 43286,3446,2.1 3330,1577,0.5Indonesia - 148,50,0.0 1199,223,0.2 533,156,0.2Iran 211,108,2.3 74,47,2.4 320,190,0.1 395,232,0.2Italy 84,54,0.2 48,21,0.4 421,318,0.4 1968,707,1.4Japan 542,239,0.4 57,45,0.3 454,221,0.3 124,85,0.2Kazakhstan 89,50,1.0 8,10,1.0 6835,3980,0.8 74098,17378,4.6Kenya - 563,187,3.9 33043,7804,12.5 24191,7225,10.3South Korea 1149,349,2.7 927,216,4.1 434,265,1.2 133,80,0.8Kyrgyzstan 25,15,1.7 4,5,2.1 334,262,0.5 695,363,0.7Laos 51,28,0.9 287,107,0.2 632,200,0.7 501,95,3.0Lesotho - 4,4,5.8 1316,585,6.0 464,282,5.4Macedonia 25,14,1.3 1,1,0.2 66,48,0.7 72,57,0.6Madagascar - 179,100,0.2 5272,2610,1.8 5885,2544,2.7Malawi - 287,77,6.1 4564,1335,5.7 468,225,5.1Mali - - 20678,5660,4.8 1082,674,5.8Mauritania - - 16844,1710,20.9 18,8,10.8Mexico 475,348,1.5 583,393,0.3 16911,6070,1.2 3247,1827,1.1Moldova 0 0 67,74,3.3 1009,532,3.3Mongolia 1217,375,3.5 3,5,1.2 8108,2490,1.0 16618,1647,2.9Morocco 0 0 1534,522,0.7 713,316,1.3Mozambique - 1106,541,7.2 97843,11393,13.7 3904,2122,11.4Myanmar 92,34,0.4 600,234,0.3 8688,945,2.4 1679,522,2.0Namibia - 1,1,100.0 33720,9143,5.8 1370,989,4.2
D14S03 TANSEY ET AL.: GLOBAL VEGETATION BURNING IN THE YEAR 2000
8 of 22
D14S03

classified as forest (forest area derived from IGBP).Estimates given by Levine et al. [1999] are between 5–5.6 million km2 globally, 300,000–550,000 km2 in forests,and 5 million km2 in woodlands and savannas.[22] The country and vegetation class making the largest
contribution to the global burned areas is Australian W&S,with approximately 525,000 km2 that accounts for 8.3% ofthis class. This country and vegetation class alone accountsfor 15% of the global annual burned area. In N&MF,burning in Russia (�30,000 km2) makes up 55% of thetotal area burned in this grouped class. Canada contributes3% of the total burned area in this class. In BF, burning inDR Congo (�13,000 km2) contributes 30% of the totalburned area in this class. Rather surprisingly, Brazil con-tributes only 2% to the total burned area in the BF class.Reasons for the apparent low values estimated in Brazil andalso Canada are discussed later in this paper. In the G&Cclass, burning in Russia (�101,000 km2) contributes 17%of the total burned area in this class, Kazakhstan (13%) andEthiopia (6%) follow behind.[23] The country and vegetation class in which burning
has the greatest influence can be assessed in terms of thepercentage of the total area of the vegetation within thecountry that has been burned. After excluding those
classes without adequate representation of vegetated pixelsindicated as being burned (those less than 30 pixels in thisanalysis), the table is dominated by the African nations. Atthe top is Sudan with burning activity affecting 22% of theBF area, 29% of the W&S, and 35% of the G&C areas.Other countries where burning activity occurs widely invegetation classes W&S and G&C are Angola, the CentralAfrican Republic, Ghana, and the DR Congo. According tothe statistics of BF, 19% has burned in Togo, 22% in Sudan,and 7% in Togo. The percentage of BF affected by fire inBrazil is rounded to one significant figure to 0.0%. InN&MF, 9% is affected in Algeria. The percentage of forestaffected in Canada and Russia are estimated to be 0.1 and0.8%, respectively.[24] At the continental scale, in terms of area, Africa
contributes 64% of the global total, compared to 59%reported by the GLOBSCAR product. The GLOBSCARproduct estimates the total burned area to be a factor of twolower than that reported by the GBA-2000 product. Austral-asia (Australia and Papua New Guinea) contributes 16%,Asia (including Russia) 14%, South America 3%, NorthAmerica 2%, and Europe 1%. In terms of the number ofburn scars detected, Africa contributes 54%, Asia 27%,South America 6%, Australasia 5%, North America 4%, and
Table 2. (continued)
Country Needleleaf/Mixed Forest Broadleaf Forest Woodlands/Shrublands Grasslands/Croplands
Nepal 453,264,4.1 50,37,3.2 1682,600,2.2 796,431,1.7Niger - - 3201,990,1.1 214,143,12.0Nigeria - 21,17,0.2 26776,7152,4.2 5101,2548,2.1Norway 27,22,0.1 0 127,133,0.1 6,11,0.0Pakistan 50,36,1.3 6,3,3.6 241,168,0.1 110,72,0.1Papua New Guinea - 34,13,0.0 74,27,0.1 24,8,0.1Paraguay 0 248,102,0.3 1018,266,0.3 50,27,0.4Peru 38,36,0.3 78,64,0.0 3133,1943,1.2 3127,1435,1.5Poland 29,25,0.1 39,13,3.4 67,68,0.1 28,31,0.0Portugal 20,16,0.7 0 656,250,1.1 205,132,0.7Republic of Korea 288,42,1.4 125,25,0.8 60,40,0.2 38,25,0.2Romania 806,199,3.1 132,78,2.2 476,348,1.2 2192,887,1.4Russia 29846,6874,0.8 1162,618,1.0 90237,50348,0.9 101118,39687,4.0Rwanda - 51,31,2.4 276,88,1.7 208,81,3.7Senegal - - 10440,2130,6.5 886,489,6.3Serbia and Montenegro 86,46,1.2 23,14,0.5 80,61,0.3 439,202,0.8Slovakia 70,34,0.9 51,22,1.0 31,29,0.2 17,14,0.1Somalia - 0 13498,3758,5.8 4768,2086,3.4South Africa - 268,186,2.8 50514,18981,5.8 22669,9951,8.5Spain 113,44,0.4 4,4,0.1 1031,501,0.4 535,353,0.3Sudan - 1031,396,22.0 379901,19260,29.0 23414,8563,35.3Swaziland - 15,8,2.3 391,121,2.9 69,55,2.3Sweden 19,20,0.0 0 81,108,0.0 3,6,0.0Tajikistan 0 0 110,75,0.2 337,173,0.7Tanzania - 4378,1536,7.0 103679,14373,14.8 14115,6135,12.0Thailand - 0 929,253,0.4 1043,328,0.4Togo - 10,6,18.9 4517,888,14.6 1866,481,7.2Tunisia 6,5,2.7 0 44,13,0.1 24,16,0.1Turkey 22,23,0.2 7,5,0.1 819,492,0.3 1922,596,0.4Turkmenistan 0 - 63,30,0.0 178,32,0.4Uganda - 893,320,4.0 26096,2258,,17.5 4459,1660,13.8Ukraine 102,48,0.9 59,39,2.6 2940,2056,3.2 18809,6579,4.1United States of America 5867,1344,0.5 146,115,0.0 17302,6739,0.4 11648,5496,0.4Uruguay - 0 46,33,0.1 38,34,0.0Uzbekistan 0 - 157,123,0.1 361,204,0.3Venezuela 5,3,0.5 115,68,0.0 2791,841,0.9 3563,673,2.4Vietnam 13,8,0.1 12,11,0.0 266,72,0.2 92,46,0.1Zambia - 1,1,1.7 101967,13654,14.9 8385,3971,15.3Zimbabwe - - 15552,2936,5.0 2041,968,2.7
aBurned area (km2), number of scars and % of each vegetation type per country burned (comma delimited). A dash (-) indicates that the vegetation is notpresent in the country, a zero (0) indicates no burned area was detected in that vegetation.
D14S03 TANSEY ET AL.: GLOBAL VEGETATION BURNING IN THE YEAR 2000
9 of 22
D14S03
Europe 3%. After examining more closely the burning ofvegetation in Africa (a total of 2.3 million km2), we see that88% (�1.98 million km2) of the burned areas in Africa areclassed as W&S, 11% are G&C (�246,000 km2), and only1% are classed as BF (�27,000 km2). In fact, the burning ofW&S in Africa makes up over half of the global burnedareas in the year 2000 and nearly 40% of the total number ofindividual burn scars detected. Estimates reported from theGLOBSCAR product are 1.2 million km2 for continentalAfrica, 200,000 km2 for African forests, approximately1.7 million km2 from Scholes et al. [1996a], and approxi-mately 1.54 million km2 from Barbosa et al. [1999]. InEurope, three-quarters of the burned area are classed asG&C (�30,000 km2), 18% as W&S (7655 km2), and 6%as both forests classes (2302 km2), compared to theGLOBSCAR product that estimates a total burned area of57,500 km2, of which 21,000 km2 was estimated to beburning in forested regions. In Asia, burning of N&MFcontributes 9% of the total area (�43,000 km2), W&S 42%(�197,000 km2), and G&C 48% (�229,000 km2); theremaining 1% is BF. The total amount burned is estimatedat approximately 0.5 million km2 compared with 0.2 millionkm2 by the GLOBSCAR product. In South America, 4% ofthe total burned area is classed as BF (4847 km2), 68% isclassed as W&S (�75,000 km2), and 28% as G&C(�31,000 km2). In North America including Central Amer-ica, 13% of the total area burned was classed as N&MF(7907 km2), 62% as W&S (�38,000 km2), and 25% G&C(�15,000 km2). The total estimated burned area was ap-proximately 62,000 km2 compared to 111,000 km2 from theGLOBSCAR product. In Australasia the burning activity isdominated by Australia with only a very small amountdetected on Papua New Guinea. The Australia statistics canbe approximated to the continental scale, presented in a
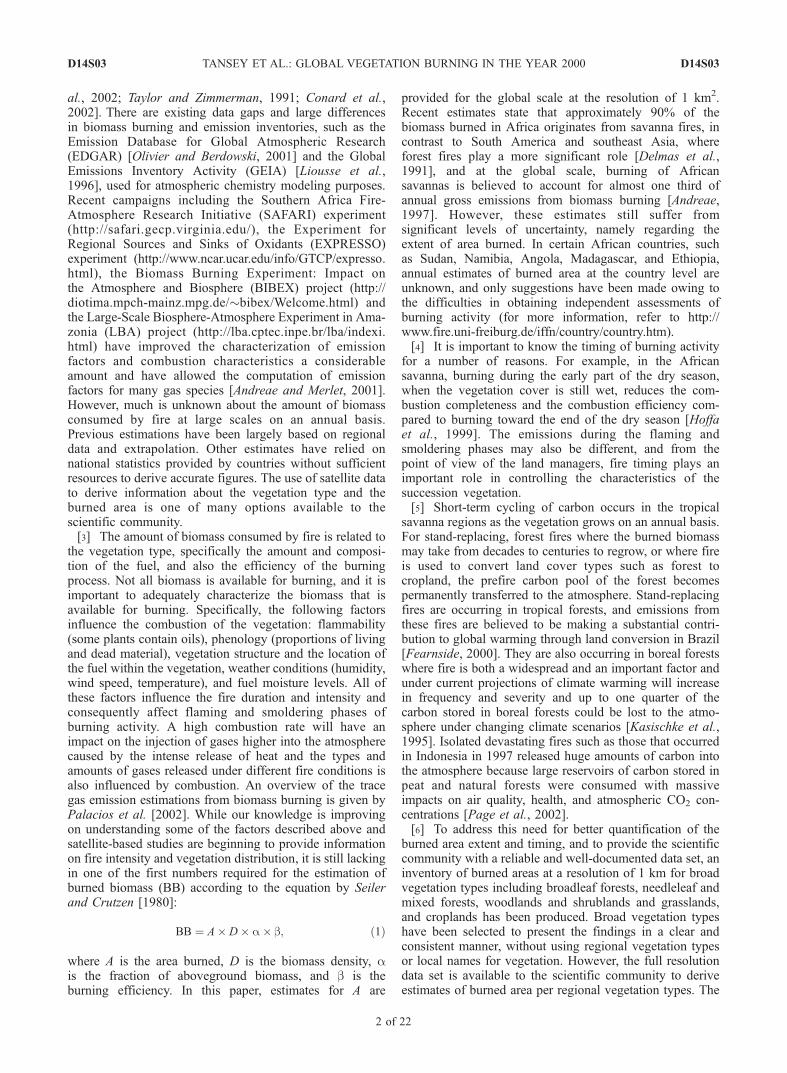
section later in this paper. A number of maps are presentedthat show the spatial distribution of burn scar detection in theyear 2000. In all of the figures presented, the groupedvegetation classes are shown as well as bare surfaces. Theburned areas are shown in red. Figure 1 shows sub-SaharanAfrica at a scale of 1:20,000,000. Figure 2 shows Europe andnorthern Africa at a scale of 1: 15,000,000. Figure 3 showsAsia at a scale of 1:27,000,000. Figure 4 shows insularsoutheast Asia and Australasia at a scale of 1:20,000,000.Figure 5 shows North America at a scale of 1:26,000,000.Figure 6 shows a section of South America at a scale of1:23,000,000. Reference is made to these maps in thefollowing sections.
4.2. A Regional Overview of Burning Activity inthe Year 2000
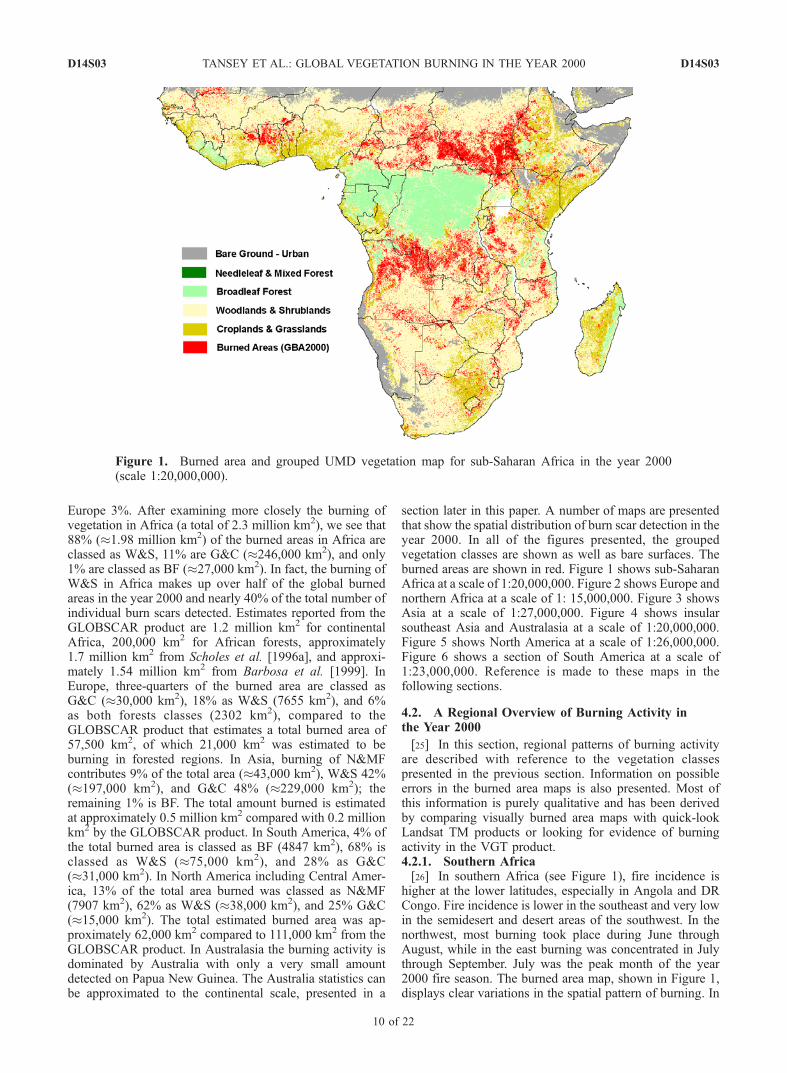
[25] In this section, regional patterns of burning activityare described with reference to the vegetation classespresented in the previous section. Information on possibleerrors in the burned area maps is also presented. Most ofthis information is purely qualitative and has been derivedby comparing visually burned area maps with quick-lookLandsat TM products or looking for evidence of burningactivity in the VGT product.4.2.1. Southern Africa[26] In southern Africa (see Figure 1), fire incidence is
higher at the lower latitudes, especially in Angola and DRCongo. Fire incidence is lower in the southeast and very lowin the semidesert and desert areas of the southwest. In thenorthwest, most burning took place during June throughAugust, while in the east burning was concentrated in Julythrough September. July was the peak month of the year2000 fire season. The burned area map, shown in Figure 1,displays clear variations in the spatial pattern of burning. In
Figure 1. Burned area and grouped UMD vegetation map for sub-Saharan Africa in the year 2000(scale 1:20,000,000).
D14S03 TANSEY ET AL.: GLOBAL VEGETATION BURNING IN THE YEAR 2000
10 of 22
D14S03
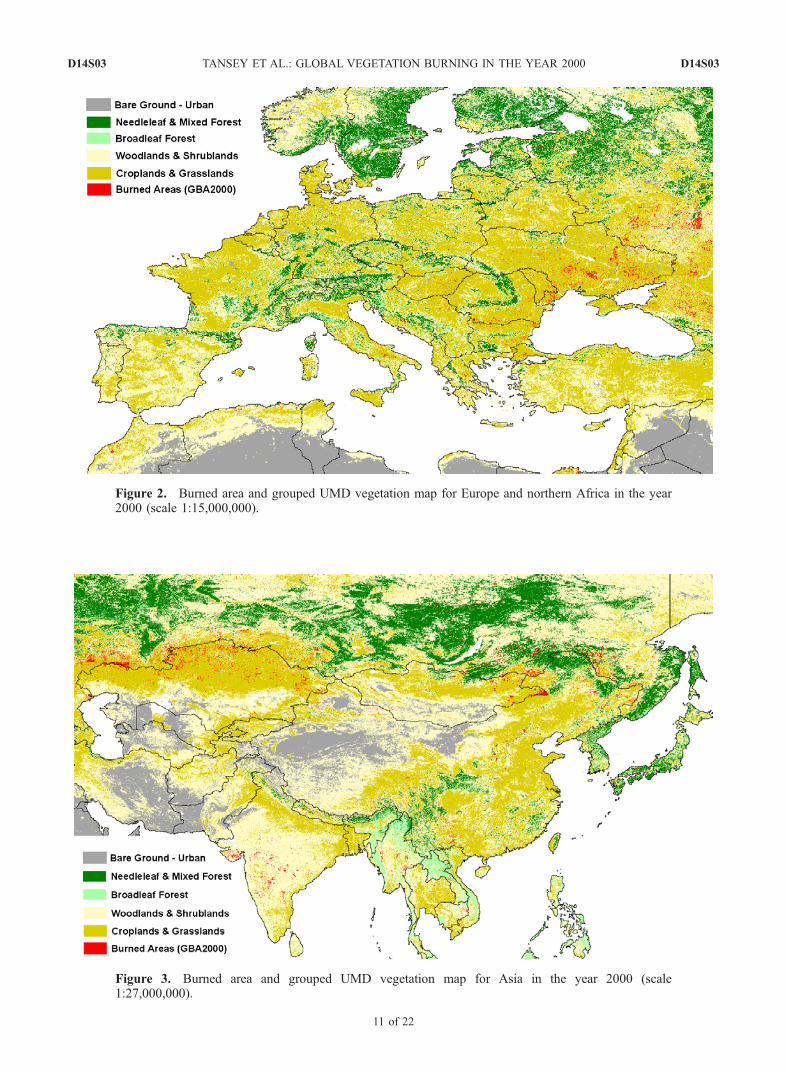
Figure 2. Burned area and grouped UMD vegetation map for Europe and northern Africa in the year2000 (scale 1:15,000,000).
Figure 3. Burned area and grouped UMD vegetation map for Asia in the year 2000 (scale1:27,000,000).
D14S03 TANSEY ET AL.: GLOBAL VEGETATION BURNING IN THE YEAR 2000
11 of 22
D14S03
the northern part of the region, especially in northeasternAngola and southern DR Congo, by the end of the fireseason, vast areas are continuously burned as a result of thecoalescence of numerous separate burning events. In the
drier south, fire scars are more likely to occur as largepatches in a predominantly unburned landscape matrix. Thispattern is evident in Namibia, Botswana, and along theborder between South Africa and Mozambique. The spatial
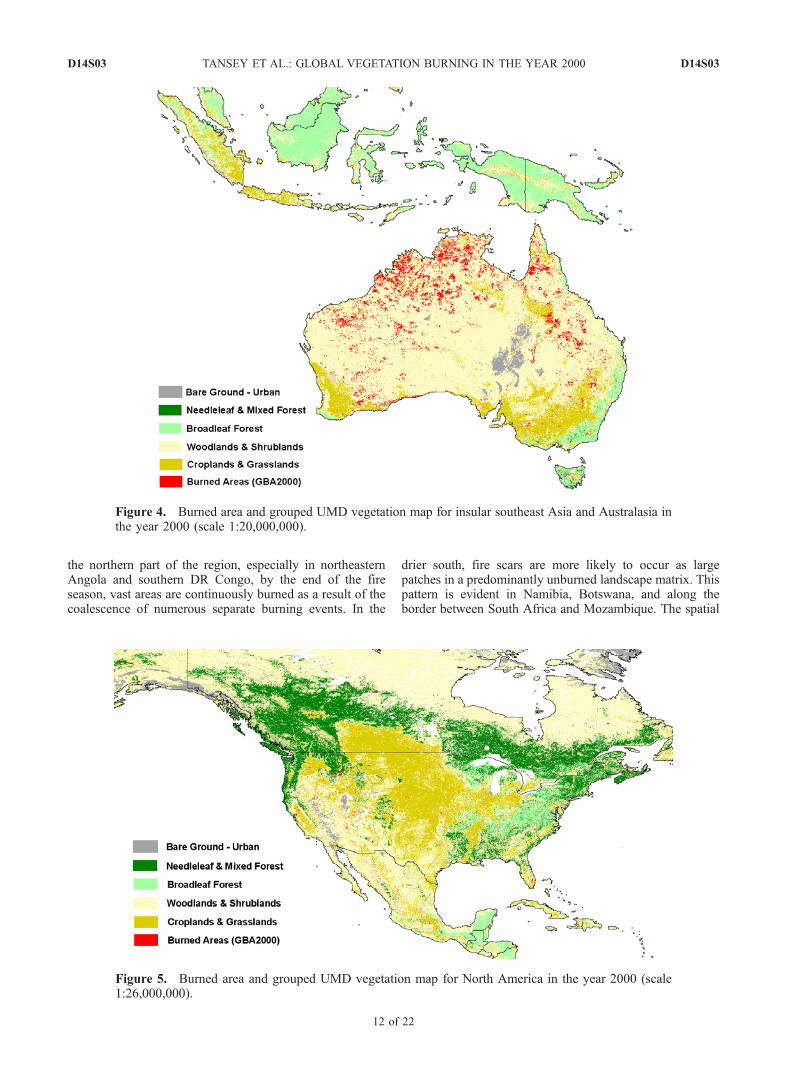
Figure 4. Burned area and grouped UMD vegetation map for insular southeast Asia and Australasia inthe year 2000 (scale 1:20,000,000).
Figure 5. Burned area and grouped UMD vegetation map for North America in the year 2000 (scale1:26,000,000).
D14S03 TANSEY ET AL.: GLOBAL VEGETATION BURNING IN THE YEAR 2000
12 of 22
D14S03
and temporal pattern of fire occurrence corresponds verywell to the findings of Dwyer et al. [2000], based on theanalysis of 1-year of active fires data from the AVHRR andBarbosa et al. [1999], and is similar with the pattern ofburning produced by Silva et al. [2003] for southern Africa.In DR Congo, Angola, Mozambique, Zambia, Tanzania, andSouth Africa, the vegetation class having the greatest burnedarea was the W&S class. The causes of burning in Africa arerelated to the clearing of natural vegetation for cultivation,the control of shrub encroachment on grazing lands, thepromoting of nutrients cycling in pastures and croplands,and the driving of game for hunting. For Africa as a whole,small errors are present in the burned area products; theseare mainly caused by flooding of nonpermanent waterfeatures and hot dark rocks in the east of Africa, but whencompared with the magnitude of burning in Africa, thesefalse detections are insignificant. In southern Africa, fireoccurrences at the start of the rainy season may have beenmissed due to cloud cover. When compared to the GLOBS-CAR product, the reported burned areas are always greater.For example, in Namibia the GLOBSCAR product onlydetects 7% of the area detected by GBA-2000, and in SouthAfrica the area detected is three times as large. In Africa it isquite difficult to determine if the findings indicate averageburning activity without producing similar products cover-ing several years. Statistics for burned areas can be found forregions of South Africa and Namibia, but comparison data
are not easily available for Mozambique, Madagascar,Zambia, Zimbabwe, Tanzania, and Angola (for more infor-mation, please refer to http://www.fire.uni-freiburg.de/iffn/country/country.htm).4.2.2. Sub-Saharan Africa[27] In the African continent (see Figure 1), from 18�
north to the equator and 18�west to 55� east, burning activityhas a significant presence in three broad types of vegetationdominating the region: BF, W&S, and G&C. The temporaldistribution of fires, or fire seasonality, is almost the same forthe three vegetation types. W&S and G&C mostly burnbetween November and February, coinciding with the North-ern Hemisphere dry season, with a peak in December. In thecase of BF the fire season starts in December and continuesuntil March 2000, with a peak in January 2000 and atemporal shift being generally located more toward the southwith respect to the other two vegetation classes. The exten-sion of burned area in BF is still high in March owing to thecontribution of dry forest burning in Ethiopia. An anomalywith respect to this general temporal trend is shown byforests situated in DR Congo, where fire activity is concen-trated between July and November 2000, as it typicallyoccurs in the Southern Hemisphere.[28] Large differences are observed for the extension of
burned areas in the different vegetation types. W&S is theclass responsible for the majority of burned areas in theregion with more than 1.1 million km2 compared to G&C
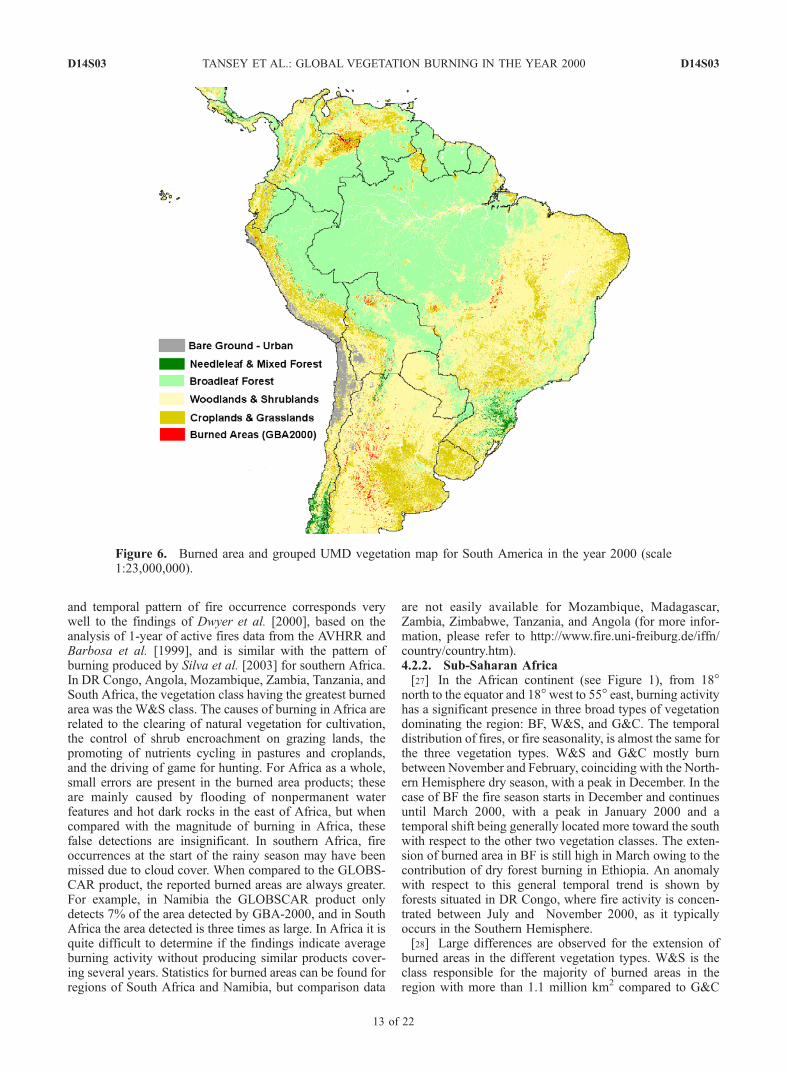
Figure 6. Burned area and grouped UMD vegetation map for South America in the year 2000 (scale1:23,000,000).
D14S03 TANSEY ET AL.: GLOBAL VEGETATION BURNING IN THE YEAR 2000
13 of 22
D14S03
where burned areas are one order less (0.11 million km2).Burned areas in BF total 3780 km2 for the year 2000. Thelargest component of burned areas is concentrated within amonth of peak burning activity and contributes to about40% of the total annual burned area for BF (1500 km2) inJanuary and W&S (450,000 km2) in December and to about30% for the G&C class (35,000 km2) in December.Concerning the spatial distribution of burned areas, Ethio-pia, Sudan, Central African Republic, Congo, and Camer-oon are the five countries which mostly contribute to burnedareas in BF, with 30, 25, 16, 14, and 12%, respectively. TheGabon does not contribute at all in the year 2000 with only18 km2 detected, even though it is almost entirely coveredby forests and close to Congo and Cameroon. Forty per centof all burned W&S areas are located in Sudan, CentralAfrican Republic, and Ethiopia, contributing 20, 10, and10% each of the total burned area, respectively. The largerextensions of G&C burning can be found in the eastern partof the region with 33% in Ethiopia and 24% in Sudan.Ghana, Nigeria, and Sierra Leone in the west of the regioncontribute 10, 5, and 5% respectively. Estimates of burnedareas are difficult to evaluate because of a lack of nationaldata available for these countries. However, some broadvalues can be found, such as over 0.6 million km2 burnedannually in Sudan (for more information, refer to http://www.fire.uni-freiburg.de/iffn/country/sd/sd_1.htm) com-pared to a value of 0.4 million km2 from GBA-2000 andfor Ethiopia, a national statistic for forested areas is esti-mated at 950 km2 (for more information, refer to http://www.fire.uni-freiburg.de/iffn/country/et/et_3.htm) com-pared to a value of 1033 km2 from GBA-2000.4.2.3. Southern Europe[29] The countries that contributed most to the total area
burned in southern Europe (see Figure 2) were Portugal,Spain, Italy, Greece, Hungary, Romania, and Bulgaria. InPortugal, Spain, and Greece the vegetation class with thelargest estimate of burned area was W&S, whereas in Italy,Hungary, Romania, and Bulgaria this place is occupied bythe G&C class. In southern Europe, most burning took placebetween June and October. For the southern Europeancountries, estimates were compared with values derivedfrom RESURS MSU-E A data [San Miguel et al., 1998]for burn scars greater than 50 hectares. Estimates werecompared in France with 549 km2 (GBA-2000) comparedto 151 km2 (RESURS), Italy with 2521 km2 (GBA-2000)compared to 451 km2 (RESURS) and 595 km2 (GBA-2000without agriculture) compared to 956 km2 (a nationalstatistic estimated in 2000, not including agricultural fires,taken from http://www.fire.uni-freiburg.de/iffn/country/it/it_5.htm), and Greece with 1169 km2 (GBA-2000) com-pared to 1017 km2 (RESURS) and 1670 km2 (a nationalstatistic estimated in 2000 and taken from http://www.fire.uni-freiburg.de/iffn/country/gr/gr_14.htm).[30] A detailed analysis was made for the Iberian Penin-
sula (Spain and Portugal). The total burned area in IberianPeninsula in the year 2000 was estimated by the GBA-2000data set at 2564 km2. The estimate of the PortugueseMinistry of Agriculture and the Spanish Ministry of Envi-ronment was 3466 km2; therefore an under-estimation wasmade by the GBA-2000 product of 30%. The estimate givenby the RESURS study was 2198 km2. One reason for thisunder-estimation is that, according to official statistics,
during the month of March 2000, 9.3% of the total annualburned area of Portugal and 10.4% of the total annualburned area of Spain was consumed. Unfortunately,the burned area algorithms were not applied to satellite datain March 2000 to capture this unusual occurrence. TheRESURS data set mapped only burned areas greater than50 hectares, and these are thought to account for 73% of thetotal burned area each year in southern Mediterraneancountries. The months having the most burning activitywere August and September. The area burned in Portugal inJuly, August, and September accounts for almost 85% of thetotal burned area in the year 2000, as reported by thePortuguese Ministry of Agriculture. The spatial pattern ofthe GBA-2000 burned areas is very similar with the spatialpattern of the map produced for Portugal with Landsat TMimagery and also in Spain from the Spanish Ministry of theEnvironment. In the south of Portugal, commission errorsare observed, caused by the application of a dual algorithm.At the regional scale the UMD global land cover maplegend is not adequate for southern Europe. In Portugaland Spain, there are large areas of pine forest where themajority of fire activity is located; these regions are classi-fied as W&S in the UMD product. It is understood that theburning activity throughout southern Europe in the year2000 was close to the average reported for the last decade.Concerning the causes of fire, the Mediterranean basinis marked by a prevalence of human-induced fires[Alexandrian et al., 1999] such as the burning of shrublandsto create pastures, burning of crop residues, and arson.Determining the reliability of the products is difficult forEurope because often the burn scar is relatively small, and forsmall scale studies the authors urge care to be taken whenusing global land cover products to derive their products.4.2.4. Russia[31] In Russia (see Figures 2 and 3) the total estimated
burned area in the year 2000 was approximately222,000 km2, of which 13% was N&MF, 41% W&S,and 46% G&C. These values compare to an estimate of200,000 km2 from the GLOBSCAR product. Both theseproducts indicate values far greater than UN Food andAgricultural Organization (FAO) statistics of approximately20,000 km2. The main regions of grassland and croplandburning occurred in southern Russia, at the border withKazakhstan, Mongolia, and China. Burning in these regionsmainly occurred during April and May and again in Sep-tember and October. The burned area estimated for N&MFfor the year 2000 was �30,000 km2. However, we do notstate that this area corresponds to the amount of boreal forestconsumed. The exact extent of Russian boreal forests is notgenerally known or easily determined; hence the burned areais only assumed for the merged classification of the UMDglobal land cover product (N&MF). It is difficult to compareestimates with national statistics that are available for landareas classified as forest fund, forest land, nonforest land,forested areas, and unforested areas (for more information,refer to http://www.fire.uni-freiburg.de/iffn/country/rus/rus_26.htm). In the boreal regions the interannual variationin burned area can be very large indeed, and this figurereflects only the area mapped in the year 2000. It is reportedthat burning activity in the year 2000 was not a particularlyintense in the forested regions, when compared to 1998 forexample. However, it may be possible that burning activity
D14S03 TANSEY ET AL.: GLOBAL VEGETATION BURNING IN THE YEAR 2000
14 of 22
D14S03
in agricultural regions may occur on an annual basis and thatestimates for this land cover type may not vary betweenyears with any significance. In central and eastern Russiaand northern Asia, it is understood that there are small areasof commissioned pixels in forested ecosystems and a smallamount of omitted pixels in grassland ecosystems.4.2.5. Mongolia and Northern China[32] In Mongolia (see Figure 3), large burn scars are
detected from April to June 2000, and in fact these firesoccur within a few days of a thin snow cover melting. Someof the individual burned areas detected were truly huge.The total burned area in the year 2000 was estimated at�26,000 km2, of which 64% lies within the G&C vegeta-tion class. According to the statistics, 31% of total burnedarea was W&S, and the remaining 5% was N&MF. Therewere 1,647 scars detected in this class. Historically, it isthought that an average of 17,400 km2 is burned every year,and more recently a value of 47,700 km2 was estimated fora 10 year period between 1990 and 1999 (for moreinformation, refer to http://www.fire.uni-freiburg.de/iffn/country/mn/mn_11.htm). Therefore it would appear thatthe year 2000 was more in keeping with average conditionsbased on historical information. The reason for burning inthe early part of the year is thought to be due to the clearingof land for the generation of fresh grass used for grazing.Biomass burning in northern China (see Figure 3) occursmostly between April and June. The percentage of the totalarea burned for each merged vegetation class is 46% forW&S, 37% for G&C, 14% for N&MF, and 3% for BF.Burning in the temperate forest of China mainly occurs inHeilongjiang Province and northern Inner Mongolia Prov-ince. The burned areas in this type of forest are small anddispersed. National statistics for a period between 1990 and1999 indicate an average burned area of 1220 km2 forforested areas (the comparable value for GBA-2000 is�10,500 km2). However, there is considerable interannualvariation in burned area (for more information, refer tohttp://www.fire.uni-freiburg.de/iffn/country/cn/cn_6.htm),but the evidence indicates that the burning activity in Chinawas greater than on average. Agricultural burning, forestry,general carelessness, and lightning are the major ignitionsources of wildfires after forest exploitation expanded bythe mid-1960s.4.2.6. India and Continental Southeast Asia[33] The fire season in the Indian subcontinent and in
continental southeast Asia (see Figure 3) is spread over thedry months of the Northern Hemisphere. The 1999–2000fire season ended in May, and the 2000–2001 season startedin October of that year. The peak of the activity is the periodbetween March and May for India, while it is slightlyearlier, February to April, in Myanmar, Cambodia, Laos,Vietnam, and Thailand. In India the fire activity is mainlyconcentrated in the W&S class; in the year 2000, more than43,000 km2 (about 90% of the total burned area) burned inthis vegetation class. Another 3300 km2 burned in the G&Cclass (7% of the total burned area), and about 400 km2
burned in the forest classes. Data from national statisticsvary by a considerable amount. Two sources of informationestimate that an annual average of forest loss is between14,500 km2 and 37,300 km2 each year (for more informa-tion, refer to http://www.fire.uni-freiburg.de/iffn/country/in/in_5.htm). Given that some of the area defined as forests is
included in the W&S class, it would indicate that theburning activity in India in the year 2000 was close toaverage conditions. The burning activity affects about 1.6%of the total surface of the country. It is interesting thatburning activity observed in India is significantly lower thanthat indicated by active fire products, e.g., the ATSR-2World Fire Atlas (http://odisseo.esrin.esa.it/ionia/FIRE/AF/ATSR/) and the Global Fire Product (http://www.fire.uni-freiburg.de/iffn/research/res_1.htm). Confirmation of thesefalse detections in the active fire products was confirmedthrough observations of Landsat TM quick-look data prod-ucts. In Myanmar, Cambodia, Laos, Vietnam, and Thailandthe predominant vegetation is W&S, followed by G&C. InMyanmar, Cambodia, Laos, and Vietnam the fire activity,like in India, affects mainly W&S areas, while in Thailandburning affects mainly G&C. Myanmar has more than11,000 km2 of burned area, and along with Cambodia with3900 km2, they make the largest contribution to the totalamount of land burned in the region. Thailand follows withabout 2000 km2 of burned area, then Laos with 1450 km2,and finally Vietnam with 350 km2. With the exception ofMyanmar, where fire affects 1.5% of the territory, onlyabout 0.5% of the whole region is affected by fire. InThailand the GLOBSCAR product estimates three timesthe area burned in the year 2000, a national statistic estimatefor forests burned in the year 2000 is 933 km2 (for moreinformation, refer to http://www.fire.uni-freiburg.de/iffn/country/th/th_2.htm), close to the GBA-2000 estimate forW&S at 929 km2.4.2.7. Insular Southeast Asia[34] The areas burned in each vegetation class in the three
main countries of insular southeast Asia (see Figures 3 and4), Indonesia, Malaysia, and Papua New Guinea (hereincluded in the reporting for southeast Asia) were 63%W&S, 28% G&C, and 8% BF for Indonesia; 44% G&C,28% W&S, and 26% BF for Sarawak province of Malaysia;and 56% W&S, 25% BF, and 18% G&C for Papua NewGuinea. The total area burned in these countries is verysmall, only 2043 km2, and therefore the correspondingburned areas in the tropical forest are also very small. Noclear spatial pattern of burning in this tropical forest isobserved, but this is typical of tropical forest burning in anypart of the world. The sources of the fire are mostlyanthropogenic and are largely influenced by climatic con-ditions triggered by El Nino and La Nina events andtherefore can vary significantly from year to year. Forexample, during the El Nino event of 1997–1998, nationalstatistics provided an estimate of the total burned area inIndonesia of approximately 97,000 km2 (for more informa-tion, refer to http://www.fire.uni-freiburg.de/iffn/country/id/id_35.htm). During the La Nina event of the year 2000, only1880 km2 were detected as being burned in the GBA-2000product. This would indicate that the year 2000 was onaverage a low fire activity year in Indonesia. This statementcan be assumed to represent the situation in insular south-east Asia (Malaysia and Papua New Guinea). Some of themajor reasons why fires are set are for the preparation ofland to establish agricultural plantations, shifting cultivationby indigenous peoples, camping and natural causes such aslightning. In a lot of cases, controlled fires set for theestablishment of agricultural plantations or for the clearingof land prior to planting are not well managed and quickly
D14S03 TANSEY ET AL.: GLOBAL VEGETATION BURNING IN THE YEAR 2000
15 of 22
D14S03

become out of control and spread into the surroundingvegetation. Owing to persistent cloud cover in insularsoutheast Asia and the relatively small size of burn scarsin tropical forests, it is likely that an under-estimation of thetrue burned area in this region has been made.4.2.8. Australia[35] In Australia (see Figure 4), 94% of the area mapped
as burned in 2000 occurred in the W&S class, 5% in theG&C class, and 1% in the remaining forest classes (N&MFand BF). These statistics confirm that fires in Australia aremainly savanna fires. The largest and most frequent fires inthe whole country occur in the tropical savanna ecosystemsin northern Australia, where Sorghum sp. grasses havebecome established during the wet season, support largefires. The area burned amounted to almost 8% of the totalarea of W&S in Australia. Fires are less frequent in southernAustralia, although they can be more intense and severebecause of their impact on human health and society. Severefires occurred in forests during the Southern Hemispheresummer months in 2001 and 2002 near Sydney. In theseecosystems the return period of fire is counted in tens ofyears and decomposition allow for surface as well as canopyfuel loads to build up, thus creating a potentially dangerousenvironment. High fuel loads often support intense crownfires that can spread with high speed through the canopy.Despite the area burned in forests being small, it stillrepresents 1.7% of the total area of N&MF and 1.7% ofBF in Australia.[36] The total area estimated by the GBA-2000 product
was approximately 0.56 million km2. It is thought that thereis an under-estimation of the true burned area in Australiawhen compared to an official national statistic of 0.7 millionkm2 from the Western Australia Department of LandAdministration (DOLA). The same national assessmentundertaken the year before estimated 0.31 million km2
burned (for more information, refer to http://www.fire.uni-freiburg.de/iffn/country/au/au_8.htm). The estimate fromthe GLOBSCAR product was 0.18 million km2. Theunder-estimation made by GBA-2000 is believed to bedue to burning activity occurring in sparse, Spinifex sp.grasses growing in bright, red sand soils (D. Graetz,CSIRO, personal communication, 2002). Fires in this typeof vegetation cause the surface to increase in reflectance, theopposite of what occurs in other vegetation types, and thismakes detection of these burned areas using the currentalgorithms very difficult. Burning activity is heavily con-trolled and managed in Australia, with many prescribedfires occurring in the early dry season that limits the buildupof biomass. However, very large fires occur toward the endof the dry season in the northern tropical savanna region.Lightning and fires set either accidentally or deliberately arealso common causes of fire in Australia. Given suchvariation in the burned area reported for Australia, it isdifficult to assess whether the year 2000 burned areaestimates were typical of average burned areas and theimpact of large-scale climatic events such as El Nino andLa Nina events have on burning activity in the country.4.2.9. United States of America and Canada[37] In the USA (see Figure 5) the burning activity was
concentrated in April through September with small occur-rences of activity through the Northern Hemisphere wintermonths in some southern States. Fire incidence was higher
in the western third of the country, mainly in Idaho,Washington, Oregon, Montana, Wyoming, and Alaska.The total burned area in the USA in the year 2000 wasestimated at �35,000 km2, which is only around 4%bigger than the value of 33,689 km2 given by the NationalInteragency Fire Center. The year 2000 was reported to beone of the worst wildfire years for over fifty years, inexcess of average estimates of burned area (for moreinformation, refer to http://www.fire.uni-freiburg.de/iffn/country/us/us_17.htm). Concerning the relationship be-tween vegetation and burning, 50% of the area burnedin the year 2000 occurred in the W&S class, 33% in theG&C class, and 17% in the N&MF class. Concerning thecauses of vegetation fires, debris burning, campfires,arson, use of equipment, and lightning are common. Infact, the forests fires that occurred in the western UnitedStates during the year 2000 were well documented as theywere particularly large and devastating. The reason for theincreased burning activity in the US forests in the year2000 may be attributable to large-scale climatic phenom-ena such as El Nino and La Nina, which describe thecondition of the ocean-atmosphere system in the tropicalPacific Ocean. This state of the climate cycle results inelevated temperatures and changes in humidity and canhave a large impact on the severity and distribution ofvegetation burning at a global scale, as was observed in1997 in Indonesia during an El Nino event [Siegert et al.,2001]. During the summer of 2000 it is understood thathotter dryer conditions existed over the western UnitedStates resulting in devastating fires. In North and CentralAmerica, there may be some false detections in thesemiarid regions of the US and Mexico, but this has notbeen confirmed. In parts of Mexico the detection ofburned areas from satellite data is hindered by cloud coverand the fact that burned areas in this region tend to besmall.[38] In Canada (see Figure 5) the estimated area burned
in the year 2000 was 5560 km2, of which 28% wasN&MF and 68% W&S. According to Fraser et al. [2003],the area falsely mapped in Canada was 3.5% and mostburn scars over 10 km2 were mapped with high confi-dence. A number of small burn scars were not detected bythe algorithm. However, burned areas less than 10 km2
were found to contribute only 2.4% of the total burnedarea in Canada during 1998. When compared to theburned area estimate from the Canadian InteragencyForest Fire Center (CIFFC), the estimate derived fromthe GBA-2000 project was 3% smaller. Compared to theCIFFC burned areas estimates for 1998 (47,108 km2) and1999 (17,056 km2), the burned area estimated in the year2000 was much smaller (12% of 1998 and 33% of 1999)and was one of the lowest years for fire activity recordedin the past few decades. A reason for this smaller thanaverage fire year may be the climate caused a forcing ofwetter weather further north in the year 2000. Canada alsoexperiences a large interannual variation as documentedby Amiro et al. [2001] and Stocks et al. [2002].4.2.10. Brazil[39] Brazil (see Figure 6) is characterized by different
types of vegetation such as tropical rain forest, evergreenforest in the northeast, savanna (called Cerrado locally) inthe central part of the country, and temperate rain forests
D14S03 TANSEY ET AL.: GLOBAL VEGETATION BURNING IN THE YEAR 2000
16 of 22
D14S03
along the coast in the east (Mata Atlantica). The regionsof Brazil with the greatest burning activity are MatoGrosso, Para, Tocantins, Maranhao, Piauı, Bahia, Goias,Minas Gerais, and Mato Grosso do Sul. The vegetationtype affected by fire in Brazil is mainly the Cerrado, asavanna of grassland, and woodland. Most burned areas inthis vegetation type were detected between June andAugust 2000, corresponding to the dry season and be-tween September and October 2000, corresponding to thearrival of the rains [Goldammer, 1990]. The vegetationclasses W&S and G&C contribute 67 and 29%, respec-tively, to the total area burned in the year 2000. The areaburned in the BF class is only 5% of the total burned areain Brazil. Compared to the GLOBSCAR product thatreported 4333 km2 of forest burned, the GBA-2000product reported only 846 km2, 80% less. However, it isdifficult to confirm if detections of flooded areas hascontributed to the GLOBSCAR estimate. For the wholeof Brazil, GLOBSCAR estimates were three times larger.There are even more detections reported from the ATSR-2World Fire Atlas products, but it cannot be assumed thatevery active fire contributes a burned area of 1 km2; hencethese values cannot be directly compared. Obtainingestimates for comparison from national statistics is quitedifficult because of the diverse nature of vegetation inBrazil, differences in statistical reporting, and reliability ofinformation (for more information, refer to http://www.fire.uni-freiburg.de/iffn/country/country.htm#BRAZIL). Thefires in the Cerrado are predominantly caused by farmers.They use fire during the dry season to promote the growthof fresh grass in pastures for their cattle and to clear fieldsto make them ready for cultivation in the wet season[Coutinho, 1990]. There are still some burning activitycaused by implementing pest control measures and care-lessness in areas of controlled burning, such as during thecutting and burning of vegetation while clearing the edgesof highways and railroads [Goldammer, 1990]. It is clearthat the GBA-2000 product does not clearly detect the‘‘arc of deforestation’’ in the southern Amazon region,between 200 and 600 km in width and approximately3000 km in length extending from the State of Maranhaoin the east through parts of Tocantins, Para, Mato Grosso,Amazonas, Rondonia, and Acre in the west. This is becausewe cannot easily distinguish whether the burned areasdetected are related directly to deforestation. Burned areasare detected within this broad arc but mainly outside of theforest as defined by the UMD product. Burn scars aredetected in central parts of eastern Brazil, but no majorpatterns of detections occur along this arc. There are anumber of explanations for not clearly detecting burn scarswithin this arc at the edges of the forest. The area ofdeforestation may be smaller than 1 km2 and thereforedifficult to detect with the sensor used in this study. Groundfires may not be detected at all, as the spectral characteristicsof the canopy will not be altered. Cloud cover obviouslyplays a significant role in obtaining a clear observation of theground surface in humid tropical regions. Hence it is clearthat there are limitations to the accurate determination ofburned area in this region. The year 2000 was a La Nina yearcharacterized by unusually cool temperatures in the equato-rial Pacific Ocean, and this may be the reason why weobserve a mild fire season, compared to annual statistics, in
Brazil and also in Indonesia. With reference to the paper byFearnside [2000], it is difficult to detect burning activity ofsecondary land cover mainly because of the fact that theproduct discussed in this paper is related to the year 2000only, and detection of the same area burned twice is notpossible within this timeframe.
4.3. Monthly Burned Area Estimates in the CentralAfrican Republic
[40] Information on annual burned area is not alwayssufficient to satisfy the data or modeling requirements of anumber of research fields, including emission modelingand aerosol transport. Burned area estimates are required ata greater temporal resolution, such as on a daily ormonthly basis. A daily product has not yet been realized,but the GBA-2000 data set provides monthly estimates.The Central African Republic (CAR) is a country of some622,000 km2 located approximately between 2� and 9�north and 15� and 27� east in sub-Saharan Africa. Burningin the CAR is undertaken for a number of reasons,including burning for land clearance for agriculture, hunt-ing, national park management, and use of wood for fuel.Information on the timing of fires in the different types ofvegetation in the CAR is important because emissions,biomass loading, fire severity, and combustion efficiencycan vary considerably within a woodland and shrublandenvironment. In addition, from a land manager’s point ofview, the implementation of controlled burning at thebeginning of the dry season is optimal because biomasslevels are relatively low and fires are more easily con-trolled. Furthermore, there is a strong gradient of landcover types within the CAR and also interesting physicallandforms such as the Bongo Massif, a high plateau in thesouth central part of the country.[41] The area of each grouped vegetation class in the
CAR is estimated to be approximately 35,000 km2 forBF, 578,000 km2 for W&S, and 5464 km2 for G&C.Compared to the GLOBSCAR estimate of 97,272 km2,the GBA-2000 detects more than twice the area burned,including pixels detected twice in the year 2000. TheGBA-2000 estimates were also compared with valuesderived from the 1996 Experiment for Regional Sourcesand Sinks of Oxidants (EXPRESSO) experiment reportedin the work of Pereira et al. [1999], 525,820 km2 forburn scars, and 112,578 km2 for active fire detections.However, the reader needs to be aware that only one-thirdof the dry season was studied, the area studied coveredthe CAR and parts of neighboring countries (Cameroon,Sudan, Chad, Nigeria, DR Congo) and the differencesbetween the physical parameter detected by the active fireand burn scar algorithms. The main burning season in theCAR corresponds with the Northern Hemisphere dryseason, normally commencing in late October or Novem-ber, progressing south, and finishing in March. Thereforethe year 2000 characterizes middle to late season burningin January to April 2000 and early season burning inOctober to November 2000. Figure 7 shows the spatialand temporal distribution of burning in the CAR in threetime stages: January and February 2000, March and April2000, and November and December 2000. Burning ac-tivity can clearly be seen progressing from north to southas the fire season develops between the months of
D14S03 TANSEY ET AL.: GLOBAL VEGETATION BURNING IN THE YEAR 2000
17 of 22
D14S03
November and April. It is clear that there is intenseburning activity around the Bongo Massif and lessintensive activity within the region. Of interest is thatsome activity is recorded in the late season (March andApril) on the plateau. In the CAR it is also possible thatareas can be burned twice, late in the 1999–2000 dryseason and early in the 2000–2001 dry season. Theburning of the same area twice in the year 2000 can beclearly seen in the estimates of monthly and annualburned areas for the CAR in Table 3. Table 3 showsmonthly burned area estimates, the sum of the monthlyburned areas, and the estimate of the actual area in theCAR burned in the year 2000. In the W&S class the sumof the monthly burned area estimates is approximately213,000 km2, of which just over 30,000 km2 has burnedtwice in the year 2000. This can be compared to a value,considered to be an average fire season estimate, pre-sented by Eva and Lambin [1998] of 277,000 km2 fortwo types of savannah. During January and December
2000 the middle of the dry season, 90% of the total areaburned. Toward the end of the dry season, in Februaryand March 2000, 8543 km2 and 1183 km2 of burnedareas, respectively, were detected in the W&S class. Inthe BF and G&C classes, 94 and 90%, respectively, ofthe total burned area occurred in January and December2000. For more information related to the fire situation inthe CAR, refer to http://www.fire.uni-freiburg.de/iffn/country/car/car_1.htm. In the example shown, a globalland cover map has been used to derive the statistics.However, the use of the GBA-2000 data set is encour-aged with regional land cover maps to provide a clearerunderstanding of the sensitivity of timing and location ofburning activity to the local requirements of controlledburning and the impact on the vegetation.
4.4. Validation Issues
[42] A global validation of the GBA-2000 product is notavailable at this time. Work is currently being undertaken
Figure 7. Burned area and grouped UMD vegetation map for the Central African Republic (CAR) inthe year 2000 (scale 1:5,000,000). Burned areas are shown for three time periods, January-February2000, March-April 2000 and November-December 2000.
Table 3. Monthly Burned Area Estimates (km2) for the Central African Republic for the Year 2000a
Vegetation Class Jan. Feb. March April May Oct. Nov. Dec. Sum 2000 Year 2000 Class Burned, %
Broadleaf forest 369 32 6 0 0 0 0 207 614 529 1.5Woodlands and shrublands 94479 8543 1183 196 27 70 11126 97305 212929 182832 31.6Grasslands and croplands 542 52 36 5 2 0 117 1267 2020 1813 33.2
aThe column labeled ‘‘Sum 2000’’ indicates the sum of the monthly area estimates in the year 2000. The column labeled ‘‘Year 2000’’ indicates theestimated physical area burned at least once in the year 2000. The difference between these two values is the area detected as being burned twice. June toSeptember are not shown as this corresponds to the wet season in this region. Small differences occur between these figures and those shown in Table 2because of resampling the global product to an equal area projection.
D14S03 TANSEY ET AL.: GLOBAL VEGETATION BURNING IN THE YEAR 2000
18 of 22
D14S03
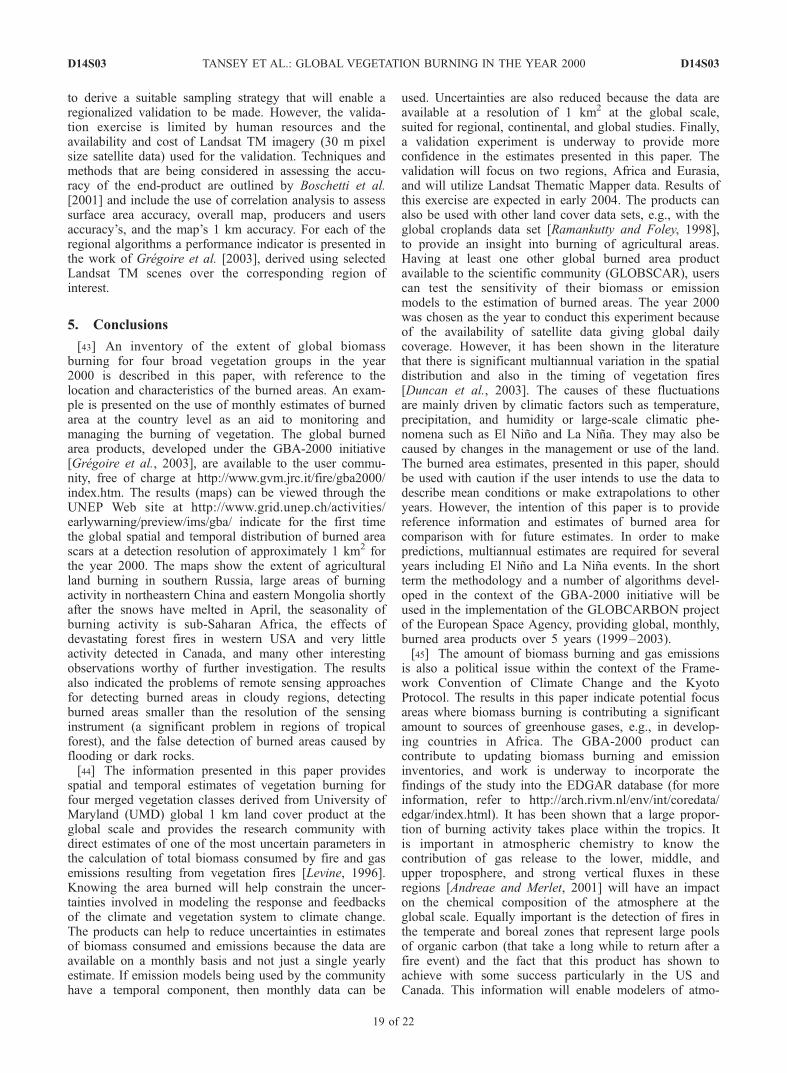
to derive a suitable sampling strategy that will enable aregionalized validation to be made. However, the valida-tion exercise is limited by human resources and theavailability and cost of Landsat TM imagery (30 m pixelsize satellite data) used for the validation. Techniques andmethods that are being considered in assessing the accu-racy of the end-product are outlined by Boschetti et al.[2001] and include the use of correlation analysis to assesssurface area accuracy, overall map, producers and usersaccuracy’s, and the map’s 1 km accuracy. For each of theregional algorithms a performance indicator is presented inthe work of Gregoire et al. [2003], derived using selectedLandsat TM scenes over the corresponding region ofinterest.
5. Conclusions
[43] An inventory of the extent of global biomassburning for four broad vegetation groups in the year2000 is described in this paper, with reference to thelocation and characteristics of the burned areas. An exam-ple is presented on the use of monthly estimates of burnedarea at the country level as an aid to monitoring andmanaging the burning of vegetation. The global burnedarea products, developed under the GBA-2000 initiative[Gregoire et al., 2003], are available to the user commu-nity, free of charge at http://www.gvm.jrc.it/fire/gba2000/index.htm. The results (maps) can be viewed through theUNEP Web site at http://www.grid.unep.ch/activities/earlywarning/preview/ims/gba/ indicate for the first timethe global spatial and temporal distribution of burned areascars at a detection resolution of approximately 1 km2 forthe year 2000. The maps show the extent of agriculturalland burning in southern Russia, large areas of burningactivity in northeastern China and eastern Mongolia shortlyafter the snows have melted in April, the seasonality ofburning activity is sub-Saharan Africa, the effects ofdevastating forest fires in western USA and very littleactivity detected in Canada, and many other interestingobservations worthy of further investigation. The resultsalso indicated the problems of remote sensing approachesfor detecting burned areas in cloudy regions, detectingburned areas smaller than the resolution of the sensinginstrument (a significant problem in regions of tropicalforest), and the false detection of burned areas caused byflooding or dark rocks.[44] The information presented in this paper provides
spatial and temporal estimates of vegetation burning forfour merged vegetation classes derived from University ofMaryland (UMD) global 1 km land cover product at theglobal scale and provides the research community withdirect estimates of one of the most uncertain parameters inthe calculation of total biomass consumed by fire and gasemissions resulting from vegetation fires [Levine, 1996].Knowing the area burned will help constrain the uncer-tainties involved in modeling the response and feedbacksof the climate and vegetation system to climate change.The products can help to reduce uncertainties in estimatesof biomass consumed and emissions because the data areavailable on a monthly basis and not just a single yearlyestimate. If emission models being used by the communityhave a temporal component, then monthly data can be
used. Uncertainties are also reduced because the data areavailable at a resolution of 1 km2 at the global scale,suited for regional, continental, and global studies. Finally,a validation experiment is underway to provide moreconfidence in the estimates presented in this paper. Thevalidation will focus on two regions, Africa and Eurasia,and will utilize Landsat Thematic Mapper data. Results ofthis exercise are expected in early 2004. The products canalso be used with other land cover data sets, e.g., with theglobal croplands data set [Ramankutty and Foley, 1998],to provide an insight into burning of agricultural areas.Having at least one other global burned area productavailable to the scientific community (GLOBSCAR), userscan test the sensitivity of their biomass or emissionmodels to the estimation of burned areas. The year 2000was chosen as the year to conduct this experiment becauseof the availability of satellite data giving global dailycoverage. However, it has been shown in the literaturethat there is significant multiannual variation in the spatialdistribution and also in the timing of vegetation fires[Duncan et al., 2003]. The causes of these fluctuationsare mainly driven by climatic factors such as temperature,precipitation, and humidity or large-scale climatic phe-nomena such as El Nino and La Nina. They may also becaused by changes in the management or use of the land.The burned area estimates, presented in this paper, shouldbe used with caution if the user intends to use the data todescribe mean conditions or make extrapolations to otheryears. However, the intention of this paper is to providereference information and estimates of burned area forcomparison with for future estimates. In order to makepredictions, multiannual estimates are required for severalyears including El Nino and La Nina events. In the shortterm the methodology and a number of algorithms devel-oped in the context of the GBA-2000 initiative will beused in the implementation of the GLOBCARBON projectof the European Space Agency, providing global, monthly,burned area products over 5 years (1999–2003).[45] The amount of biomass burning and gas emissions
is also a political issue within the context of the Frame-work Convention of Climate Change and the KyotoProtocol. The results in this paper indicate potential focusareas where biomass burning is contributing a significantamount to sources of greenhouse gases, e.g., in develop-ing countries in Africa. The GBA-2000 product cancontribute to updating biomass burning and emissioninventories, and work is underway to incorporate thefindings of the study into the EDGAR database (for moreinformation, refer to http://arch.rivm.nl/env/int/coredata/edgar/index.html). It has been shown that a large propor-tion of burning activity takes place within the tropics. Itis important in atmospheric chemistry to know thecontribution of gas release to the lower, middle, andupper troposphere, and strong vertical fluxes in theseregions [Andreae and Merlet, 2001] will have an impacton the chemical composition of the atmosphere at theglobal scale. Equally important is the detection of fires inthe temperate and boreal zones that represent large poolsof organic carbon (that take a long while to return after afire event) and the fact that this product has shown toachieve with some success particularly in the US andCanada. This information will enable modelers of atmo-
D14S03 TANSEY ET AL.: GLOBAL VEGETATION BURNING IN THE YEAR 2000
19 of 22
D14S03
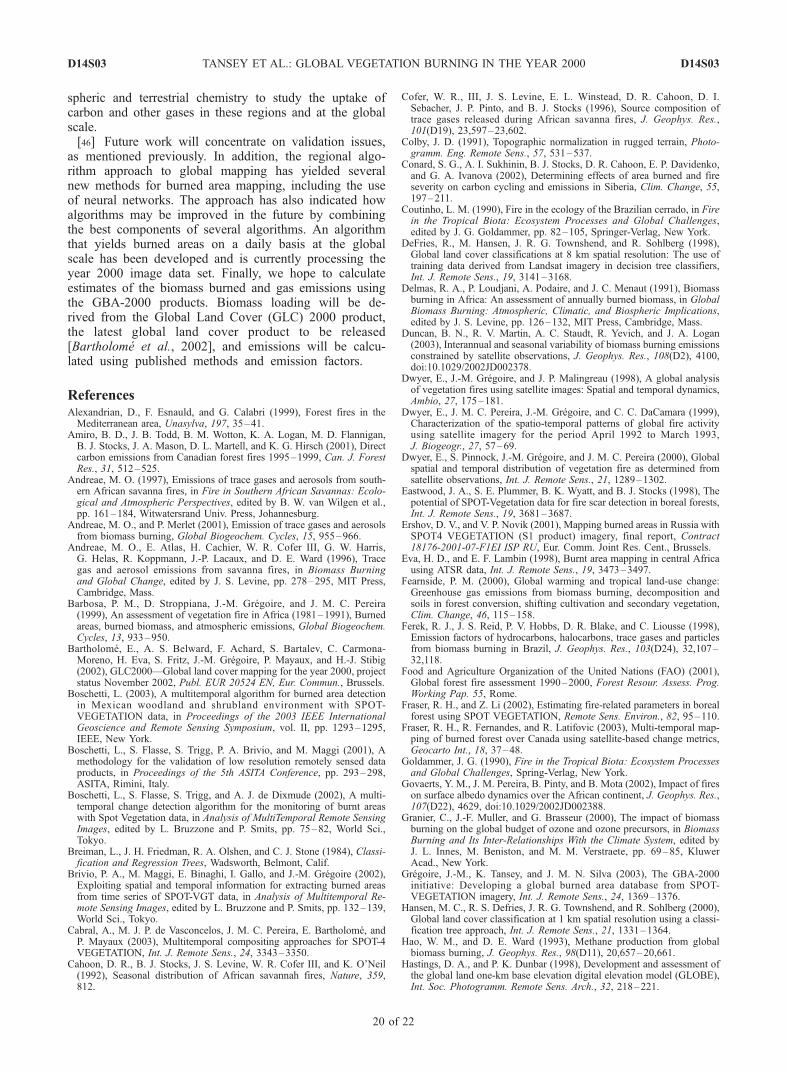
spheric and terrestrial chemistry to study the uptake ofcarbon and other gases in these regions and at the globalscale.[46] Future work will concentrate on validation issues,
as mentioned previously. In addition, the regional algo-rithm approach to global mapping has yielded severalnew methods for burned area mapping, including the useof neural networks. The approach has also indicated howalgorithms may be improved in the future by combiningthe best components of several algorithms. An algorithmthat yields burned areas on a daily basis at the globalscale has been developed and is currently processing theyear 2000 image data set. Finally, we hope to calculateestimates of the biomass burned and gas emissions usingthe GBA-2000 products. Biomass loading will be de-rived from the Global Land Cover (GLC) 2000 product,the latest global land cover product to be released[Bartholome et al., 2002], and emissions will be calcu-lated using published methods and emission factors.
ReferencesAlexandrian, D., F. Esnauld, and G. Calabri (1999), Forest fires in theMediterranean area, Unasylva, 197, 35–41.
Amiro, B. D., J. B. Todd, B. M. Wotton, K. A. Logan, M. D. Flannigan,B. J. Stocks, J. A. Mason, D. L. Martell, and K. G. Hirsch (2001), Directcarbon emissions from Canadian forest fires 1995–1999, Can. J. ForestRes., 31, 512–525.
Andreae, M. O. (1997), Emissions of trace gases and aerosols from south-ern African savanna fires, in Fire in Southern African Savannas: Ecolo-gical and Atmospheric Perspectives, edited by B. W. van Wilgen et al.,pp. 161–184, Witwatersrand Univ. Press, Johannesburg.
Andreae, M. O., and P. Merlet (2001), Emission of trace gases and aerosolsfrom biomass burning, Global Biogeochem. Cycles, 15, 955–966.
Andreae, M. O., E. Atlas, H. Cachier, W. R. Cofer III, G. W. Harris,G. Helas, R. Koppmann, J.-P. Lacaux, and D. E. Ward (1996), Tracegas and aerosol emissions from savanna fires, in Biomass Burningand Global Change, edited by J. S. Levine, pp. 278–295, MIT Press,Cambridge, Mass.
Barbosa, P. M., D. Stroppiana, J.-M. Gregoire, and J. M. C. Pereira(1999), An assessment of vegetation fire in Africa (1981–1991), Burnedareas, burned biomass, and atmospheric emissions, Global Biogeochem.Cycles, 13, 933–950.
Bartholome, E., A. S. Belward, F. Achard, S. Bartalev, C. Carmona-Moreno, H. Eva, S. Fritz, J.-M. Gregoire, P. Mayaux, and H.-J. Stibig(2002), GLC2000—Global land cover mapping for the year 2000, projectstatus November 2002, Publ. EUR 20524 EN, Eur. Commun., Brussels.
Boschetti, L. (2003), A multitemporal algorithm for burned area detectionin Mexican woodland and shrubland environment with SPOT-VEGETATION data, in Proceedings of the 2003 IEEE InternationalGeoscience and Remote Sensing Symposium, vol. II, pp. 1293–1295,IEEE, New York.
Boschetti, L., S. Flasse, S. Trigg, P. A. Brivio, and M. Maggi (2001), Amethodology for the validation of low resolution remotely sensed dataproducts, in Proceedings of the 5th ASITA Conference, pp. 293–298,ASITA, Rimini, Italy.
Boschetti, L., S. Flasse, S. Trigg, and A. J. de Dixmude (2002), A multi-temporal change detection algorithm for the monitoring of burnt areaswith Spot Vegetation data, in Analysis of MultiTemporal Remote SensingImages, edited by L. Bruzzone and P. Smits, pp. 75–82, World Sci.,Tokyo.
Breiman, L., J. H. Friedman, R. A. Olshen, and C. J. Stone (1984), Classi-fication and Regression Trees, Wadsworth, Belmont, Calif.
Brivio, P. A., M. Maggi, E. Binaghi, I. Gallo, and J.-M. Gregoire (2002),Exploiting spatial and temporal information for extracting burned areasfrom time series of SPOT-VGT data, in Analysis of Multitemporal Re-mote Sensing Images, edited by L. Bruzzone and P. Smits, pp. 132–139,World Sci., Tokyo.
Cabral, A., M. J. P. de Vasconcelos, J. M. C. Pereira, E. Bartholome, andP. Mayaux (2003), Multitemporal compositing approaches for SPOT-4VEGETATION, Int. J. Remote Sens., 24, 3343–3350.
Cahoon, D. R., B. J. Stocks, J. S. Levine, W. R. Cofer III, and K. O’Neil(1992), Seasonal distribution of African savannah fires, Nature, 359,812.
Cofer, W. R., III, J. S. Levine, E. L. Winstead, D. R. Cahoon, D. I.Sebacher, J. P. Pinto, and B. J. Stocks (1996), Source composition oftrace gases released during African savanna fires, J. Geophys. Res.,101(D19), 23,597–23,602.
Colby, J. D. (1991), Topographic normalization in rugged terrain, Photo-gramm. Eng. Remote Sens., 57, 531–537.
Conard, S. G., A. I. Sukhinin, B. J. Stocks, D. R. Cahoon, E. P. Davidenko,and G. A. Ivanova (2002), Determining effects of area burned and fireseverity on carbon cycling and emissions in Siberia, Clim. Change, 55,197–211.
Coutinho, L. M. (1990), Fire in the ecology of the Brazilian cerrado, in Firein the Tropical Biota: Ecosystem Processes and Global Challenges,edited by J. G. Goldammer, pp. 82–105, Springer-Verlag, New York.
DeFries, R., M. Hansen, J. R. G. Townshend, and R. Sohlberg (1998),Global land cover classifications at 8 km spatial resolution: The use oftraining data derived from Landsat imagery in decision tree classifiers,Int. J. Remote Sens., 19, 3141–3168.
Delmas, R. A., P. Loudjani, A. Podaire, and J. C. Menaut (1991), Biomassburning in Africa: An assessment of annually burned biomass, in GlobalBiomass Burning: Atmospheric, Climatic, and Biospheric Implications,edited by J. S. Levine, pp. 126–132, MIT Press, Cambridge, Mass.
Duncan, B. N., R. V. Martin, A. C. Staudt, R. Yevich, and J. A. Logan(2003), Interannual and seasonal variability of biomass burning emissionsconstrained by satellite observations, J. Geophys. Res., 108(D2), 4100,doi:10.1029/2002JD002378.
Dwyer, E., J.-M. Gregoire, and J. P. Malingreau (1998), A global analysisof vegetation fires using satellite images: Spatial and temporal dynamics,Ambio, 27, 175–181.
Dwyer, E., J. M. C. Pereira, J.-M. Gregoire, and C. C. DaCamara (1999),Characterization of the spatio-temporal patterns of global fire activityusing satellite imagery for the period April 1992 to March 1993,J. Biogeogr., 27, 57–69.
Dwyer, E., S. Pinnock, J.-M. Gregoire, and J. M. C. Pereira (2000), Globalspatial and temporal distribution of vegetation fire as determined fromsatellite observations, Int. J. Remote Sens., 21, 1289–1302.
Eastwood, J. A., S. E. Plummer, B. K. Wyatt, and B. J. Stocks (1998), Thepotential of SPOT-Vegetation data for fire scar detection in boreal forests,Int. J. Remote Sens., 19, 3681–3687.
Ershov, D. V., and V. P. Novik (2001), Mapping burned areas in Russia withSPOT4 VEGETATION (S1 product) imagery, final report, Contract18176-2001-07-F1EI ISP RU, Eur. Comm. Joint Res. Cent., Brussels.
Eva, H. D., and E. F. Lambin (1998), Burnt area mapping in central Africausing ATSR data, Int. J. Remote Sens., 19, 3473–3497.
Fearnside, P. M. (2000), Global warming and tropical land-use change:Greenhouse gas emissions from biomass burning, decomposition andsoils in forest conversion, shifting cultivation and secondary vegetation,Clim. Change, 46, 115–158.
Ferek, R. J., J. S. Reid, P. V. Hobbs, D. R. Blake, and C. Liousse (1998),Emission factors of hydrocarbons, halocarbons, trace gases and particlesfrom biomass burning in Brazil, J. Geophys. Res., 103(D24), 32,107–32,118.
Food and Agriculture Organization of the United Nations (FAO) (2001),Global forest fire assessment 1990–2000, Forest Resour. Assess. Prog.Working Pap. 55, Rome.
Fraser, R. H., and Z. Li (2002), Estimating fire-related parameters in borealforest using SPOT VEGETATION, Remote Sens. Environ., 82, 95–110.
Fraser, R. H., R. Fernandes, and R. Latifovic (2003), Multi-temporal map-ping of burned forest over Canada using satellite-based change metrics,Geocarto Int., 18, 37–48.
Goldammer, J. G. (1990), Fire in the Tropical Biota: Ecosystem Processesand Global Challenges, Spring-Verlag, New York.
Govaerts, Y. M., J. M. Pereira, B. Pinty, and B. Mota (2002), Impact of fireson surface albedo dynamics over the African continent, J. Geophys. Res.,107(D22), 4629, doi:10.1029/2002JD002388.
Granier, C., J.-F. Muller, and G. Brasseur (2000), The impact of biomassburning on the global budget of ozone and ozone precursors, in BiomassBurning and Its Inter-Relationships With the Climate System, edited byJ. L. Innes, M. Beniston, and M. M. Verstraete, pp. 69–85, KluwerAcad., New York.
Gregoire, J.-M., K. Tansey, and J. M. N. Silva (2003), The GBA-2000initiative: Developing a global burned area database from SPOT-VEGETATION imagery, Int. J. Remote Sens., 24, 1369–1376.
Hansen, M. C., R. S. Defries, J. R. G. Townshend, and R. Sohlberg (2000),Global land cover classification at 1 km spatial resolution using a classi-fication tree approach, Int. J. Remote Sens., 21, 1331–1364.
Hao, W. M., and D. E. Ward (1993), Methane production from globalbiomass burning, J. Geophys. Res., 98(D11), 20,657–20,661.
Hastings, D. A., and P. K. Dunbar (1998), Development and assessment ofthe global land one-km base elevation digital elevation model (GLOBE),Int. Soc. Photogramm. Remote Sens. Arch., 32, 218–221.
D14S03 TANSEY ET AL.: GLOBAL VEGETATION BURNING IN THE YEAR 2000
20 of 22
D14S03
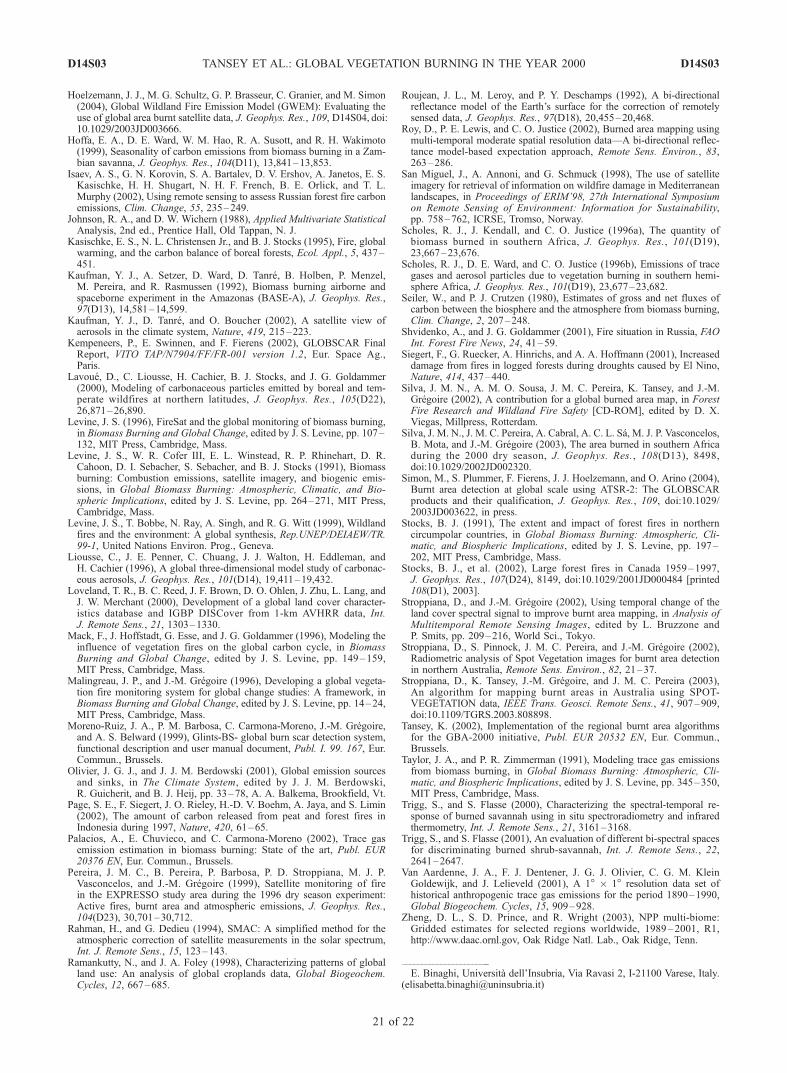
Hoelzemann, J. J., M. G. Schultz, G. P. Brasseur, C. Granier, and M. Simon(2004), Global Wildland Fire Emission Model (GWEM): Evaluating theuse of global area burnt satellite data, J. Geophys. Res. , 109, D14S04, doi:10.1029/2003JD003666.
Hoffa, E. A., D. E. Ward, W. M. Hao, R. A. Susott, and R. H. Wakimoto(1999), Seasonality of carbon emissions from biomass burning in a Zam-bian savanna, J. Geophys. Res., 104(D11), 13,841–13,853.
Isaev, A. S., G. N. Korovin, S. A. Bartalev, D. V. Ershov, A. Janetos, E. S.Kasischke, H. H. Shugart, N. H. F. French, B. E. Orlick, and T. L.Murphy (2002), Using remote sensing to assess Russian forest fire carbonemissions, Clim. Change, 55, 235–249.
Johnson, R. A., and D. W. Wichern (1988), Applied Multivariate StatisticalAnalysis, 2nd ed., Prentice Hall, Old Tappan, N. J.
Kasischke, E. S., N. L. Christensen Jr., and B. J. Stocks (1995), Fire, globalwarming, and the carbon balance of boreal forests, Ecol. Appl., 5, 437–451.
Kaufman, Y. J., A. Setzer, D. Ward, D. Tanre, B. Holben, P. Menzel,M. Pereira, and R. Rasmussen (1992), Biomass burning airborne andspaceborne experiment in the Amazonas (BASE-A), J. Geophys. Res.,97(D13), 14,581–14,599.
Kaufman, Y. J., D. Tanre, and O. Boucher (2002), A satellite view ofaerosols in the climate system, Nature, 419, 215–223.
Kempeneers, P., E. Swinnen, and F. Fierens (2002), GLOBSCAR FinalReport, VITO TAP/N7904/FF/FR-001 version 1.2, Eur. Space Ag.,Paris.
Lavoue, D., C. Liousse, H. Cachier, B. J. Stocks, and J. G. Goldammer(2000), Modeling of carbonaceous particles emitted by boreal and tem-perate wildfires at northern latitudes, J. Geophys. Res., 105(D22),26,871–26,890.
Levine, J. S. (1996), FireSat and the global monitoring of biomass burning,in Biomass Burning and Global Change, edited by J. S. Levine, pp. 107–132, MIT Press, Cambridge, Mass.
Levine, J. S., W. R. Cofer III, E. L. Winstead, R. P. Rhinehart, D. R.Cahoon, D. I. Sebacher, S. Sebacher, and B. J. Stocks (1991), Biomassburning: Combustion emissions, satellite imagery, and biogenic emis-sions, in Global Biomass Burning: Atmospheric, Climatic, and Bio-spheric Implications, edited by J. S. Levine, pp. 264–271, MIT Press,Cambridge, Mass.
Levine, J. S., T. Bobbe, N. Ray, A. Singh, and R. G. Witt (1999), Wildlandfires and the environment: A global synthesis, Rep.UNEP/DEIAEW/TR.99-1, United Nations Environ. Prog., Geneva.
Liousse, C., J. E. Penner, C. Chuang, J. J. Walton, H. Eddleman, andH. Cachier (1996), A global three-dimensional model study of carbonac-eous aerosols, J. Geophys. Res., 101(D14), 19,411–19,432.
Loveland, T. R., B. C. Reed, J. F. Brown, D. O. Ohlen, J. Zhu, L. Lang, andJ. W. Merchant (2000), Development of a global land cover character-istics database and IGBP DISCover from 1-km AVHRR data, Int.J. Remote Sens., 21, 1303–1330.
Mack, F., J. Hoffstadt, G. Esse, and J. G. Goldammer (1996), Modeling theinfluence of vegetation fires on the global carbon cycle, in BiomassBurning and Global Change, edited by J. S. Levine, pp. 149–159,MIT Press, Cambridge, Mass.
Malingreau, J. P., and J.-M. Gregoire (1996), Developing a global vegeta-tion fire monitoring system for global change studies: A framework, inBiomass Burning and Global Change, edited by J. S. Levine, pp. 14–24,MIT Press, Cambridge, Mass.
Moreno-Ruiz, J. A., P. M. Barbosa, C. Carmona-Moreno, J.-M. Gregoire,and A. S. Belward (1999), Glints-BS- global burn scar detection system,functional description and user manual document, Publ. I. 99. 167, Eur.Commun., Brussels.
Olivier, J. G. J., and J. J. M. Berdowski (2001), Global emission sourcesand sinks, in The Climate System, edited by J. J. M. Berdowski,R. Guicherit, and B. J. Heij, pp. 33–78, A. A. Balkema, Brookfield, Vt.
Page, S. E., F. Siegert, J. O. Rieley, H.-D. V. Boehm, A. Jaya, and S. Limin(2002), The amount of carbon released from peat and forest fires inIndonesia during 1997, Nature, 420, 61–65.
Palacios, A., E. Chuvieco, and C. Carmona-Moreno (2002), Trace gasemission estimation in biomass burning: State of the art, Publ. EUR20376 EN, Eur. Commun., Brussels.
Pereira, J. M. C., B. Pereira, P. Barbosa, P. D. Stroppiana, M. J. P.Vasconcelos, and J.-M. Gregoire (1999), Satellite monitoring of firein the EXPRESSO study area during the 1996 dry season experiment:Active fires, burnt area and atmospheric emissions, J. Geophys. Res.,104(D23), 30,701–30,712.
Rahman, H., and G. Dedieu (1994), SMAC: A simplified method for theatmospheric correction of satellite measurements in the solar spectrum,Int. J. Remote Sens., 15, 123–143.
Ramankutty, N., and J. A. Foley (1998), Characterizing patterns of globalland use: An analysis of global croplands data, Global Biogeochem.Cycles, 12, 667–685.
Roujean, J. L., M. Leroy, and P. Y. Deschamps (1992), A bi-directionalreflectance model of the Earth’s surface for the correction of remotelysensed data, J. Geophys. Res., 97(D18), 20,455–20,468.
Roy, D., P. E. Lewis, and C. O. Justice (2002), Burned area mapping usingmulti-temporal moderate spatial resolution data—A bi-directional reflec-tance model-based expectation approach, Remote Sens. Environ., 83,263–286.
San Miguel, J., A. Annoni, and G. Schmuck (1998), The use of satelliteimagery for retrieval of information on wildfire damage in Mediterraneanlandscapes, in Proceedings of ERIM’98, 27th International Symposiumon Remote Sensing of Environment: Information for Sustainability,pp. 758–762, ICRSE, Tromso, Norway.
Scholes, R. J., J. Kendall, and C. O. Justice (1996a), The quantity ofbiomass burned in southern Africa, J. Geophys. Res., 101(D19),23,667–23,676.
Scholes, R. J., D. E. Ward, and C. O. Justice (1996b), Emissions of tracegases and aerosol particles due to vegetation burning in southern hemi-sphere Africa, J. Geophys. Res., 101(D19), 23,677–23,682.
Seiler, W., and P. J. Crutzen (1980), Estimates of gross and net fluxes ofcarbon between the biosphere and the atmosphere from biomass burning,Clim. Change, 2, 207–248.
Shvidenko, A., and J. G. Goldammer (2001), Fire situation in Russia, FAOInt. Forest Fire News, 24, 41–59.
Siegert, F., G. Ruecker, A. Hinrichs, and A. A. Hoffmann (2001), Increaseddamage from fires in logged forests during droughts caused by El Nino,Nature, 414, 437–440.
Silva, J. M. N., A. M. O. Sousa, J. M. C. Pereira, K. Tansey, and J.-M.Gregoire (2002), A contribution for a global burned area map, in ForestFire Research and Wildland Fire Safety [CD-ROM], edited by D. X.Viegas, Millpress, Rotterdam.
Silva, J. M. N., J. M. C. Pereira, A. Cabral, A. C. L. Sa, M. J. P. Vasconcelos,B. Mota, and J.-M. Gregoire (2003), The area burned in southern Africaduring the 2000 dry season, J. Geophys. Res., 108(D13), 8498,doi:10.1029/2002JD002320.
Simon, M., S. Plummer, F. Fierens, J. J. Hoelzemann, and O. Arino (2004),Burnt area detection at global scale using ATSR-2: The GLOBSCARproducts and their qualification, J. Geophys. Res., 109, doi:10.1029/2003JD003622, in press.
Stocks, B. J. (1991), The extent and impact of forest fires in northerncircumpolar countries, in Global Biomass Burning: Atmospheric, Cli-matic, and Biospheric Implications, edited by J. S. Levine, pp. 197–202, MIT Press, Cambridge, Mass.
Stocks, B. J., et al. (2002), Large forest fires in Canada 1959–1997,J. Geophys. Res., 107(D24), 8149, doi:10.1029/2001JD000484 [printed108(D1), 2003].
Stroppiana, D., and J.-M. Gregoire (2002), Using temporal change of theland cover spectral signal to improve burnt area mapping, in Analysis ofMultitemporal Remote Sensing Images, edited by L. Bruzzone andP. Smits, pp. 209–216, World Sci., Tokyo.
Stroppiana, D., S. Pinnock, J. M. C. Pereira, and J.-M. Gregoire (2002),Radiometric analysis of Spot Vegetation images for burnt area detectionin northern Australia, Remote Sens. Environ., 82, 21–37.
Stroppiana, D., K. Tansey, J.-M. Gregoire, and J. M. C. Pereira (2003),An algorithm for mapping burnt areas in Australia using SPOT-VEGETATION data, IEEE Trans. Geosci. Remote Sens., 41, 907–909,doi:10.1109/TGRS.2003.808898.
Tansey, K. (2002), Implementation of the regional burnt area algorithmsfor the GBA-2000 initiative, Publ. EUR 20532 EN, Eur. Commun.,Brussels.
Taylor, J. A., and P. R. Zimmerman (1991), Modeling trace gas emissionsfrom biomass burning, in Global Biomass Burning: Atmospheric, Cli-matic, and Biospheric Implications, edited by J. S. Levine, pp. 345–350,MIT Press, Cambridge, Mass.
Trigg, S., and S. Flasse (2000), Characterizing the spectral-temporal re-sponse of burned savannah using in situ spectroradiometry and infraredthermometry, Int. J. Remote Sens., 21, 3161–3168.
Trigg, S., and S. Flasse (2001), An evaluation of different bi-spectral spacesfor discriminating burned shrub-savannah, Int. J. Remote Sens., 22,2641–2647.
Van Aardenne, J. A., F. J. Dentener, J. G. J. Olivier, C. G. M. KleinGoldewijk, and J. Lelieveld (2001), A 1� � 1� resolution data set ofhistorical anthropogenic trace gas emissions for the period 1890–1990,Global Biogeochem. Cycles, 15, 909–928.
Zheng, D. L., S. D. Prince, and R. Wright (2003), NPP multi-biome:Gridded estimates for selected regions worldwide, 1989–2001, R1,http://www.daac.ornl.gov, Oak Ridge Natl. Lab., Oak Ridge, Tenn.
�����������������������E. Binaghi, Universita dell’Insubria, Via Ravasi 2, I-21100 Varese, Italy.
D14S03 TANSEY ET AL.: GLOBAL VEGETATION BURNING IN THE YEAR 2000
21 of 22
D14S03
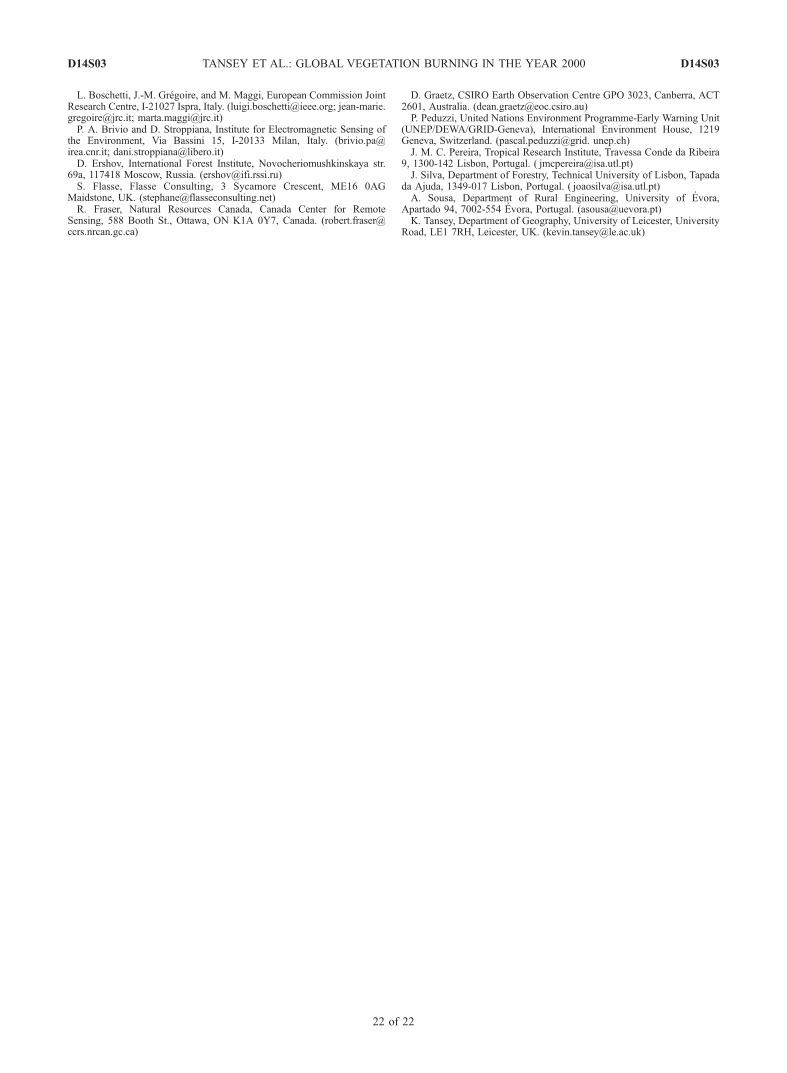
L. Boschetti, J.-M. Gregoire, and M. Maggi, European Commission JointResearch Centre, I-21027 Ispra, Italy. ([email protected]; [email protected]; [email protected])P. A. Brivio and D. Stroppiana, Institute for Electromagnetic Sensing of
the Environment, Via Bassini 15, I-20133 Milan, Italy. ([email protected]; [email protected])D. Ershov, International Forest Institute, Novocheriomushkinskaya str.
69a, 117418 Moscow, Russia. ([email protected])S. Flasse, Flasse Consulting, 3 Sycamore Crescent, ME16 0AG
Maidstone, UK. ([email protected])R. Fraser, Natural Resources Canada, Canada Center for Remote
Sensing, 588 Booth St., Ottawa, ON K1A 0Y7, Canada. ([email protected])
D. Graetz, CSIRO Earth Observation Centre GPO 3023, Canberra, ACT2601, Australia. ([email protected])P. Peduzzi, United Nations Environment Programme-Early Warning Unit
(UNEP/DEWA/GRID-Geneva), International Environment House, 1219Geneva, Switzerland. (pascal.peduzzi@grid. unep.ch)J. M. C. Pereira, Tropical Research Institute, Travessa Conde da Ribeira
9, 1300-142 Lisbon, Portugal. ( [email protected])J. Silva, Department of Forestry, Technical University of Lisbon, Tapada
da Ajuda, 1349-017 Lisbon, Portugal. ( [email protected])A. Sousa, Department of Rural Engineering, University of Evora,
Apartado 94, 7002-554 Evora, Portugal. ([email protected])K. Tansey, Department of Geography, University of Leicester, University
Road, LE1 7RH, Leicester, UK. ([email protected])
D14S03 TANSEY ET AL.: GLOBAL VEGETATION BURNING IN THE YEAR 2000
22 of 22
D14S03
Copyright © 2022 FDOKUMEN