Kyshtym, Windscale, Chernobyl – Volume 1 - Energy
621
-
Upload
khangminh22 -
Category
Documents
-
view
1 -
download
0
Transcript of Kyshtym, Windscale, Chernobyl – Volume 1 - Energy


Commission of the European Communities
Proceedings of
Seminar on Comparative Assessment of the Environmental
Impact of Radionuclides Released during Three Major Nuclear Accidents:
1991
Kyshtym, Windscale, Chernobyl Luxembourg, 1-5 October 1990
Volume I
Organized and edited by:
Commission of the European Communities Directorate-General XI
Environment Civil Protection and Nuclear Safety
The Russian contributions to this conference were translated into English by:
Charles COPELAND, Tony NICHOLS, Philip RHODES,
and Stephen WILKIE.
English Translation, Unit F, Commission of the European Communities
EUR 13574

LEGAL NOTICE
Neither the Commission of the European Communities nor any person acting on behalf of the Commission is responsible for the use which might be made of the following information or for any errors which may have occured in the translation of the texts supplied originally in Russian.
This document was reproduced on the basis of the best available copy
III
PROGRAMME COMMITIEE
In drawing up the detailed seminar programme, the secretariat has been able to call on the learned assistance of:
Messrs. A. AARKROG IUR Denmark
P.J. COUGHTREY A.N.S., UK
G. DESMET CEC, Bruxelles
P. GOVAERTS SCK, Belgium
A. GRAUBY CEA. Franca
A. JANSSENS CEC, Luxembourg
G.S. LINSLEY IAEA. Vienna
C. MYTTENAERE L.P.V., Belgium
H. PARETZKE GSE, F.R.G.
G.G. POLIKARPOV IBSS, USSR
We are happy to acknowledge this assistance and to record our appreciation of the help provided.
Messrs.
SCIENTIFIC SECRETARIES
R. KIRCHMANN
F. LUYKX
J. SINNAEVE
IUR Belgium
CEC, Luxembourg
CEC, Bruxelles

IV

v
CONTENTS
VOLUME l
Summary N.J. PATTENDEN
Welcoming Addresses
G.N. POLIKARPOV
F. LUYKX
A. AARKROG II
Accident Source Terms
The Kyshtym Accident: Cause, Scale and Radiation Characteristics
01
11
17
21
G.N. ROMANOV, B.V. NIKIPELOV, E.G. DROZHKO 25
One Western Perspective of the 1957 Soviet Nuclear Accident John R. TRABALKA, Stanley I. AUERBACH 41
The Chernobyl Source Term S.T. BELYAYEV, AA BOROVOY, V.F. DEMIN, AA RIMSKY-KORSAKOV, AN. KHERUVIMOV 71
Chernobyl Source Term Estimation Paul H. GUDIKSEN, Ted F. HARVEY, Rolf LANGE 93
A Review of Source Term and Dose Estimation for the TMl-2 Reactor Accident Paul H. GUDIKSEN, Marvin H. DICKERSON
Twenty Five Years Before Chernobyl G. KUZNETZOV
113
129

VI
Ill Atmospheric Dispersion, Resuspension,
Chemical and Physical forms of Contamination
Atmospheric Dispersion Models in Assessment of Accidental Releases (illustrated by the Windscale and Chernobyl Accidents) H.M. ApSIMON, J.J.N. WILSON, A GODDARD 135
Some Common Features of the Formation and Conduct of the Products of Chernobyl Accident in the Environment O.V. RUMIANTSEV, L.M. KHITROV 157
Forms of Occurrence and Migration of Radionuclides from the Chernobyl NPP Accident in Typical Landscapes of Byelorussia E.P. PETRYAEV, GA SOKOLIK, S.V. OVSYANNIKOVA, S.L. LEYNOVA, T.G. IVANOVA 185
Hot Particles in Sweden One Year After Chernobyl A KEREKES, R. FALK, J. SUOMELA 211
Biological Monitoring of the Deposition and Transport of Radioactive Aerosol Particles in the Chernobyl NPP Zone of Influence N.V. VIKTOROVA, E.K. GARGER 223
Deposition and Resuspension of Radiocaesium after Chernobyl J.A. GARLAND, K. PLAYFORD 237
Characteristics of Primary and Secondary Caesium-Radionuclide Contamination of the Countryside Following the Chernobyl NPP Accident E.D. STUKIN 255
IV Environmental Contamination and Transfer
Part 1
Deposition of Activity from the Windscale Accident AC. CHAMBERLAIN 303

VII
Landscape and Geochemical Approach to Drawing up a Soil Distribution Profile for Chernobyl Radionuclides in Distant Areas E.M. KOROBOVA, P.A. KOROVAYKOV 309
Radionuclides in the Soil and Vegetation in the 30 km Accident Zone Around the Chernobyl NPP N.V. KULIKOV, 1.V. MOLCHANOVA, AN. KARAVAYEVA 327
Content of Cs-134, Cs-137 and Sr-90 in Birch Crowns in Woods Within 30 km of the Chernobyl Power Plant During the Initial Years Following the Accident P.I. YUSHKOV, T.A. CHUYEVA N.V. KULIKOV 333
Forms of Radionuclide Occurence in Soil Y.P. DAVYDOV, N.I. VORONIK, N.N. SHATILO 341
Migration Peculiarities of Long-Lived Radionuclides in Soils in Areas Contaminated by the Chernobyl NPP Accident S.K. NOVIKOVA S.Y. SEVOSTYANOV 355
Comparative Analysis of Chemical Forms of Long-Lived Radionuclides and their Migration and Transformation in the Environment Following the Kyshtym and Chernobyl Accidents AV. KONOPLEV, T.I. BOBOVNIKOVA 371
Behaviour of Pu-239 and Pu-240 in Soils Following the Southern Urals and Chernobyl Accidents F.I. PAVLOTSKAYA T.A. GORYACHENKOVA V.V. YEMELYANOV, I.E. KAZINSKAYA E.M. KOROBOVA. B.F. MYASOYEDOV 397
Peculiarities of Sr-90 Migration in the Environment G.N. ROMANOV, D.A. STUKIN. R.M. ALEKSAKHIN 421
Plutonium Release to the Environment During Chernobyl Accident V.M. KULAKOV, Y.L. DOBRYNIN, V.N. KOSYAKOV, S.K. LISIN. Y.F. RODIONOV. I.K. SHVETOV 437
Agricultural Aspects of the Radiation Situation in the Areas Contaminated by the Southern Urals and Chernobyl Accidents Boris S. PRISTER 449

VIII
Processes Governing the Transfer of Radionuclides into Crops Following the Chernobyl Accident N.V. GREBENSHCHIKOVA, S.K. FIRSAKOVA, S.F. TIMOFEYEV, A.A NOVIK, G.I. PALEKSHANOVA 465
Environmental Distribution and Transport of Radionuclides in West Cumbria Following the Windscale and Chernobyl Accidents P.J. COUGHTREY, J.A KIRTON, N.G. MITCHELL 473
v Environmental Contamination and Transfer
Part 2
Analysis of Chernobyl Fuel PArticles and their Migration Characteristics in Water and Soil V.V. DEMCHUK, O.V. VOYTSEKHOVICH, V.A. KASHPAROV, N.V. VIKTOROVA, G.V. LAPTEV 493
Forms of Radioactive Fallout and Mobility of Radionuclides in Ukrainian Aqueous Landscapes E.V. SOBOTOVITCH, Y.A. OLKHOVIK, N.V. GOLOVKO, T.I. KOROMYSLICHENKO 515
Hydrological Aspects of Radionuclide Migration in Water Bodies Following the Chernobyl Accident G.V. VOYTSEKHOVICH, V.A. BORZILOV, V.A. KONOPLEV 527
Migration in the Pripyat and Dnieper River Basins of Caesium and Strontium Radionuclides Accidentally Released frorn the Chernobyl NPP E.V. SENIN 549
Direct Continuous Multichannel r -Spectrometric Measurements- One of the Main Methods for Control and Study of Radioactive Environmental Pollution L.M. KHITROV, O.V. RUMIANTSEV 559
Radioactive Contamination of the Dnieper River and Baltic Sea Basins after the Chernobyl NPP Accident Y.V. KUZNETSOV 577

IX
VOLUME II
Radioecological Monitoring of the Black Sea Basin Following the Chernobyl NPP Accident L.G. KULEBAKINA, G.G. POLIKARPOV 607
Modelling Large-scale Contamination of the Black Sea Caused by Long-lived Radionuclides of Cs-137 and Sr-90 Following the Chernobyl Accident V.N. YEGOROV, G.G. POLIKARPOV, L.G. KULEBAKINA, NA STOKOZOV, D.B. YEVTUSHENKO 649
Artificial Radionuclides in Aquatic Biota of Major European Rivers M.I. KUZMENKO, IV. PANKOV, E.N. VOLKOVA, Z.O. SHIROKAYA 665
The impact of the Chernobyl Accident on Continental Aquatic Ecosystems. A Literature Review L. FOULQUIER, Y. BAUDIN-JAULENT 679
Cs-137 Releases from Sellafield and Chernobyl: Lake Sediment Based Evidence from West Cumbria, UK P.J.P. BONNETT, N. RICHARDSON, P.G. APPLEBY 705
Mathematical Modelling of Radionuclide Dispersion in Surface Waters after the Chernobyl Accident to Evaluate the Effectiveness of Water Protection Measures M.I. ZHELEZNYAK, OV. VOYTSEKHOVICH 725
VI Radiological Implications for Man and his
Environment
Radiological Consequences of the Chernobyl NPP Accident in Comparison with those of the Kyshtym and Windscale Radiation Accidents M.I. BALONOV 749
Medical Consequences of the Kyshtym Radiation Accident of 29 September 1957 L.A. BULDAKOV, S.N. DEMIN, I.K. DIBOBES, M.M. KOSENKO, LI. PANTELEYEV, G.N. !,OMANOV, AM. SKRYABIN, Z.B. TOKARSKAYA, V.L. SHVEDOV, B.I. SHUKHOVTSEV 769

x
The Results of Medical Research in the 30km Zone of the Chernobyl NPP K. DUSHUTIN 787
The Radioiodine Problem Following the Chernobyl Accident: Ecology, Dosimetry and Medical Effects IA ZVONOVA 793
The Consequences of the Kyshtym Accident for Flora and Fauna DA SPIRIN, G.N. ROMANOV, FA TIKHOMIROV, E.G. SMIRNOV, LI. SUVOROVA, VA SHEVCHENKO 809
Genetic Consequences of the Action of Ionizing Radiations on Natural Populations after the Kyshtym Accident VA SHEVCHENKO 821
The Radioecological Consequences of the Kyshtym and Chernobyl Radiation Accidents for Forest Ecosystems FA TIKHOMIROV, Al. SHCHEGLOV 867
Non-classical Phenomena in Contemporary Radioecology Y. KUTLAKHMEDOV
Chromosome Mutagenesis in Populations of Aquatic Biota in the Black Sea, Aegean Sea, and Danube and Dnieper Rivers, 1986-1989
889
V.G. TSYTSUGINA 895
Doses of Irradiation to the Ukrainian Population as a Result of the Chernobyl Accident IA UCHTARJOV, L.N. KOVGAN 905
VII Countermeasures
The Experience of the Use of the Field and Stationary Methods of the Direct Control over Radioactive Contamination of the Environment by the Chernobyl Accident Products O.V. RUMIANTSEV, N.N. VASILYEV 927
XI
Comparative Analysis of the Effectiveness of Measures to Protect the Public from Radiation Following the Kyshtym Accident G.N. ROMANOV, L.A. BULDAKOV, V.L. SHVEDOV 957
Ways of Reducing the Build-up of Sr-90 in Crops in the Kyshtym Accident Zone 1.T. MOISEYEV, FA TIKHOMIROV 967
Measures (and their Effectiveness) to Improve the Radioecological Situation Given the Particular Features of the Contamination Caused by the Kyshtym and Chernobyl Accidents N.P. ARKHIPOV, G.S. MESHALKIN, AN. ARKHIPOV, N.I. BUROV, I.S. FEDOTOV, N.N. MISHENKOV 977
Obtaining 'Clean' Produce from Livestock Reared in Areas Contaminated by the Chernobyl Accident R.G. ILYAZOV, S.K. FIRSAKOVA AF. KARPENKO 993
Countermeasures at the Windscale Accident: The Origin of the Emergency Reference Level Concept and its Subsequent Evolution K.F. BAVERSTOCK 1001
Reappraisal of Environmental Countermeasures to Protect Members of the Public Following the Windscale Nuclear Reactor Accident 1957 D. JACKSON, S.R. JONES 1015
Windscale and Chernobyl: A Comparison of the Effectiveness of Countermeasures Taken in the UK CA ROBINSON 1041
Comparison of the Countermeasures Taken for the Recovery of Rural Areas Contaminated by Radioactivity G. ARAPIS, R. MILLAN, E. IRANZO 1057

XII
POSTER SESSIONS
Radioecological Studies and Modelling Part 1 - Forest Ecosystems
Study of the Radiocaesium Cycle in Forest Ecosystems (Evergreen and Deciduous Trees) L. SOMBRE, M. VANHOUCHE, C. RONNEAU, P. ANDRE, C. MYTTENAERE 1075
Study on the Bloavailability of Radiocaesium Following Contamination of the Forest Floor Y. THIRY, C. MYTTENAERE 1089
A Systems Approach to Transport of Radionuclides in Forest Ecosystems M.T. BERG, W.R. SCHELL, C. MYTTENAERE
Part II - other Ecosystems, Food Transfer
A Comparative Assessment of the Impact of the Windscale and Chernobyl Accidents on Cs-13 7 Levels of Uplands Lamb in West Cumbria Using the 'RUINS' Model N.M.J. CROUT, A.M. GALER, B.J. HOWARD,
1101
N.A. BERESFORD 1121
Concentration of Radiocaesium in Grain Following the Chernobyl Accident B. KANYAR, P. CZEGLEDI, A. KEREKES, L. KOVACS, J. SOHAR, L.B. SZTANYIK 1137
Cs-134 Transfer from Water or Food to the Ciprinid Tineo Tineo Linnaeus: Uptake and Loss Kinetics J.A. Gil CORISCO, M.C. VAZ CARREIRO 1145

XIII
II Impact Assessments, Remedial Action
Consequences of the Chernobyl Fallout for Wild Populations in South-Eastern Sweden D. MASCANZONI. M. CRISTALDI. L.A. IERADI 1165
Chernobyl Fallout in England and Wales: Countermeasures Research and Possible Remedial Measures by MAFF L. McDONOUGH, M.G. SEGAL 1177
Analysis of Post-Chernobyl Dose Estimate Based on Modeling and on Body Burden Measurement in CSFR Ivan BUCINA Irena MALATOVA Viktor KLIMENT. Dana DRABOVA
Rapporteur Summary of Poster Sessions W.R. SCHELL, C. VANDECASTEELE, V.F. DEMIN
List of Participants
1195
1210
1216


- l -
SUMMARY
Norman J. PATIENDEN
International Union of Radioecologists 738 Essex Street, Newbury, Berkshire RG 14 6RA, UK

- 2 -

- 3 -
This summary is based on the reports presented for the panel discussion chaired by G. Pol ikarpov. The chairmen of the previous sessions were asked to summarize the information presented and conclusions of their own sessions.
NOSSACH/GUDIKSEN (Session 2):
The environmental source terms for the Kyshtym (Romanov, Trabalka), W i ndsca I e ( Egg I eton), Chernoby I (Borovo i , Gud i ksen) and Three Mi I e Island (Gudiksen) accidents were discussed. The Kyshtym accident took place on 29 September 1957, in a factory which produced plutonium for mi I itary purposes. Liquid radioactive material was stored in cooled meta I storage tanks surrounded by concrete. A tank overheated, and there was a chemical explosion due to acetates and nitrates, of strength about 70-100 T of TNT equivalent. The downwind environment was heavily contaminated with about 2 MCi of radionucl ides (10% of the contents), principally Sr-90. The interpretation of the Kyshtym ace i dent by western scientists was described (Traba I ka). It was suggested that the environmental contamination is due to several accidents which may have occurred over a considerable period of time.
Concerning the Chernobyl accident source term, much more information has now become avai \able since the original reports in 1986. In addition to the dispersion of volatile material (such as caesium), particles of fuel containing transuranic elements were also emitted, which have deposited mainly within a 30 km radius. These are known as "hot" particles. They are considered to present a larger hazard than was original \y estimated. The col \aboration with scientists from other countries on the source term analysis was welcomed, and should be extended. The estimates of the Chernobyl source term from global environmental measurements was described.
For the Windscale accident, the fire started during a semi-routine operation to release stored (Wigner) energy in the graphite moderator. It was f i na I I y quenched by pumping wa tar into the reactor. Some fue I element cans were ruptured and radioactivity was emitted from the cooling air chimney stack. From subsequent environmental measurements it was estimated that this included 27 kCi of 1311, 1 kCi Cs-137 and Po-210. The Three Mi le Island accident was discussed; the environmental impact was neg\ igible.
LINSLEY/APSIMON/VICTOROVA (Session 3) : (This report was presented by G. Linsley, Mrs. Apsimon being unable to attend the panel session)
The atmospheric dispersion and deposition of material released from Chernobyl was described (Borzi lov, Rumiantsev, Petryaev, Kerekes, Victorova, Eggleton (for Garland, Stukin), together with a model comparison of the Windscale and Chernobyl dispersions (Apsimon). The Windscale dispersion pattern has been re-analysed {Apsimon) with present-day atmospheric dispersion models, which estimate a release of 30kCi of 1-131 with a dry deposition velocity of 0.3 cm/s. Wet deposition was important in both accidents, but it is more difficult to model. Hot particles from Chernobyl were observed in deposit in Byelorussia (Victorova) and in Sweden (Kerekes). They were observed on leaf surfaces by autoradiographic methods, which showed that some material could trans locate into the leaf. Some particles appeared to be from fuel elements containing fission products and alpha emitters,

- 4 -
whereas others contained no alpha emitters but mainly Ru-103 and Ru- 106. Little assessment of the risks from hot particles has been made so far.
The resuspension of Chernoby I rad i ocaes i um depos i tad over Europe was discussed (Garland, delivered by Eggleton). The concentration of resuspended material was related to the local deposition, which varied according to the local rain scavenging of the contaminated cloud. However, the calculated resuspension factor was lower at locations receiving higher deposits, suggesting that other effects were also involved, such as contributions from resuspension from distant high deposits, or perhaps from a stratospheric reservoir.
The resuspension around Chernoby I was a I so discussed by Stuk in. The fractions of radiocaesium released in the accident which was initially deposited in different regions was estimated. Between 1987 and 1989, further measurements were made to assess the possible redistribution of the deposited material. In this way, estimates of the resuspension were made. It was also noted that plough Ing the soi I and the occurrence of forest fires affected the amounts resuspended.
COUGHTREY/SENIN (Session 4)
The accumulated deposit of radionucl ides in soi Is and their uptake by plants were discussed, relating to Windscale (Chamberlain), Chernobyl (Korobova, Davydchuk, Kul ikov, Yushkov, Davidov, Novikova, Kulakov, Grebenshchikova), Kyshtym (Konoplyov, Pavlotskaya, Romanov, Prister), the comparative effects of Windscale and Chernobyl in Cumbria, UK (Coughtrey), and the global radiation dose from Chernobyl (Bennett). The soi I contamination from 137Cs around Windscale was discussed (Chamberlain), although at the time of the accident the main concern was with 131 I, and the effects of the Windscale and Chernobyl accidents in areas around Windscale were compared (Coughtrey); by chance, both accidents gave comparable radiocaesium deposits in some areas. The deposition of radiocaesium, Sr-90 and Ce-144, and Ru-106 on to the soi I and vegetation around Chernobyl, and its subsequent migration was discussed by sever a I authors (Korobova, Davydchuk, Ku I i kov, Yushkov, Davydov and Novikova).
These showed that much new information on migration through soi Is is now available. In some cases, penetration to more than 10 cm depth in months was observed. Uncertainties are sti I I concerned with the role of organic matter, the movement of discrete particles and ground water leaching. However, the distribution pattern around Chernobyl has not changed much since the accident, indicating that the mobi I ity Is not large. The cycling of radiocaesium and Sr-90 by trees tends to maintain the soi I surface retention in woodlands. The uptake into crops was also described (Grebenshchikova). Plutonium deposition around Chernobyl was described (Kulakov), by measurement of Ce-144 In hot particles and the use of a conversion factor. Of the 600 kg of Pu in the reactor, it is estimated that about 20 kg were released.
Comparative studies of the deposition and migration of radionucl ides at Kyshtym and Chernobyl were described (Konoplev, Pavlotskaya and Pr ister), which indicated that the plant uptake factors were fairly similar. For Pu, the m1gr:ation through soil depended on its form and on the soi I type.

- 5 -
The assessment of the world-wide radiation doses due to Chernobyl, made by UNSCEAR (1988), was described (Bennett).
It was clear that although much new data with application to biogeochemical theories had become avai !able, some quest ions remained to be answered.
FOULQUIER/SOBOTOVITCH (Session 5) :
In this session papers were presented on aquatic systems. New data on hydrographic networks including uptake by fish and other organisms around Chernoby I were des er i bed (Vo i tcekhov itch, R j abov, Sen in, Khitrov, Pugachevskiy and Kuzmenko), together with a model description of the Pripyat and Dnieper rivers system (Zheleznyak). A review of the impact of Chernobyl deposit on European fresh water environments (Scandinavia, Germany, Austria, northern Italy, northwest United Kingdom) was given ( Fou I qui er). The vector mechanism was wet deposition, with great variabi I lty in distribution. Cs-137 became the most significant long-term contaminant. The transfer through different trophic chains showed different rates, and Cs-137 biological residence times in fish were 200-500 days. Cs-137 depositions from Windscale and Chernobyl were compared in their effects on sediments of a lake near Windscale (Bennett) showing that the accumulation mechanisms were complex.
Marine environmental studies (Baltic and Black Seas) were also described (Kuznetsov, Kulebai<ina), together with a model of 137Cs in the Black Sea (Egorov). Because of recycling through the food chain, some Cs-137 concentrations in fish were higher in 1988 than in 1987.
The amount of aquatic data is now very large. The main requirements for the future are to assimilate the data, to bring them together in some cohesive way, and to produce interpretations and models, which can be validated.
The interactions of hot particles from Chernobyl with the aquatic environment was discussed (Vo i tcekhov itch, Sobotov i ch). Hot part i c I e leaching in different chemical systems and the transfer of 9DSr from hot particles were described. Radionucl ides are initially bound in hot particles with relatively insoluble material (eg. U02 ). In podsol and peaty soi Is this material wi I I be dissolved and radionuclide transfer to the water phase can occur. It is expected that this wi 11 peak between 1991 and 1995, providing a new hazard from Sr-90 and Pu. Such pollution wi 11 be very long-I ived.
KONOPLYA/PARETZKE (Session 6) :
The medical aspects of the three accidents were discussed and compared (Balonov, Buldakov, Dushutin, Konoplya). Many of the conclusions from Chernobyl are sti 11 preliminary, since deleterious effects to health can occur many years after the release. The general statement that if humans are protected then the environment is a I so protected must be regarded with caution. The relative scale of the collective doses from the Windscale, Kyshtym and Chernobyl accidents was estimated to be 1:5:600 respectively. At Chernobyl, increases in the incidence of diseases of the alimentary canal and the osteo-muscular system were noted among those who assisted in clean-up operations.

- 6 -
The effects of the accidents on the terrestrial environment were discussed (Romanov, Rjabtsev, Shevchenko, Yushkov, Tihomirov, Kutlahmedov), and on aquatic organisms in rivers and seas (Tsytsugina).
In general, the session demonstrated that many new data had been obtained, but these must be made more cohesive and I inked with models for better evaluation. In studying the effects on human health, it is difficult to discriminate between the effects of the accidents and the base I ines, which can be further confused by the effects of chemical pollutants. There is a lack of epidemiological data. More attention should be also paid to the estimates of risks.
TIKHOMIROV/AARKROG (Session 7) :
The effectiveness of countermeasures used in the Kyshtym and Chernobyl ace i dents was discussed (Rum i antsev, Romanov, Ti khom i rov, Arl<h i pov, llyazov), and in the Windscale accident (Baverstock, Jackson). Countermeasures taken in the UK were discussed (Robinson), and a comparison of countermeasures for rural areas (Mi I Ian).
Countermeasures can be divided between short-term and long-term. Under short-term comes evacuation of the population, which, in the case of Chernobyl, reduced the doses received by a factor of 10. It also includes decontamination of skin and fur, control of foodstuffs and efforts to reduce environmental migration. Long-term countermeasures include removal of top soi I, ploughing, erection of barriers to prevent migration to rivers, stopping agricultural production in contaminated areas. Many methods developed at Kyshtym were subsequently used at Chernobyl, including deep ploughing, using chemical additives to soi I inc I ud i ng P and K, rep I a cement of one crop by a not her. The agrotechno I og i ca I methods used at Kyshtym were estimated to have reduced the overal I dose by a factor of 100.
SCHELL (Poster sessions)
Three poster sessions were arranged, including forest ecosystems (presentations by Berg, Sombre, Thiry, Schei I), other ecosystems food transfer (presentations by Crout, Kanyar, Gi I Corisco, Sandal Is), and impact assessments, remedial action (presentations by Mascanzoni, Baeza, McDonough, Erlandsson, Pearce, Bucina) ..
Rapporteurs of the poster sessions were respectively W.R. Schei I, C. Van De Casteele and V.F. Demin.
The field covered was very diverse, and thus not easy to summarize. The effects on forest ecosystems were considered by models. Soi I-to-plant transfer was discussed for winter wheat, and for pastures, fol lowed by uptake in smal I mammals. In aquatic systems, the Cs-137 transfer to organisms by water was shown to be more important than the transfer via the food chain. Counter-measures taken in contaminated zones were described. Man should be considered as part of the environment, but with the abi I ity to control and modify the environment. The need for more and better predictive models, which also include cost and benefit components, was stressed.
A more extended rapporteur summary is given at the end of volume I I.

- 7 -
GENERAL DISCUSSION.
Many speakers made points in the ensuing general discussion, some of which are mentioned below:
Khitrov: Soviet estimates of the Chernobyl cs-137 source term now agree with those of Livermore. More comparisons between Chernobyl and nuclear bomb measurements should be made. The Chernobyl explosive power is estimated as 10 MT of TNT equivalent, ie. 500 Hiroshimas. Very I ittle migration of the deposited Cs-137 has been observed in the USSR. Most of the activity is with the hot particles; these could be the subject of another conference. The political aspects of the Chernobyl accident have a strong influence on practical scientific solutions. The USSR presentations at the meeting were the work of individuals, and did not represent the views of a single delegation.
Foulquier: It is important solely on field observations. included in interpretation understood.
not to base radioecological Laboratory research must also
if fundamental mechanism
conclusions be done and are to be
Sandal Is: A great deal of radioecological information on Cs-137 can be obtained from the study of the disposal of radioactive waste. This should be included in assessment in addition to the effects of accidents.
Eggleton: This meeting has been unique in that western scientists have been able to have free discussions with their Soviet col leagues, who have attended in large numbers and have given their results and opinions without having to fol low any imposed rules. Perhaps the Chernobyl accident must be given a I ittle credit for this situation. We leave the meeting with a desire to learn more of the Russian language.
Sinnaeve: There should be future meetings to consolidate and fol low up the information presented at this one. We understand that international research centres at Chernobyl and Obninsk are proposed, where scientists from many countries can collaborate in their work on radioecological problems.

- 8 -

- 9 -
Session I
OPENING SESSION

- 10 -

- 11 -
Opening Address
G.G. POLIKARPOV
Institute of Biology of South Seas, Department of Radiation 2, prospekt Nakhimova, Sevastopol 335000 USSR

- 12 -
Mr Chairman, col leagues of the International Union of Radioecologists,
officials of the Commission of the European Communities, our Luxembourg
hosts,
on behalf of the soviet branch of the International Union of
Radioecologists, I warmly welcome al I participants in the Seminar, the
first of its kind to deal with comparative radioecology of the most
serious and yet dissimilar nuclear accidents (Kyshtym, Windscale and
Chernobyl), and would I ike to congratulate the organizers of the
seminar for the considerable pains they have taken in preparing and
organizing this meeting, which brings together the world's most eminent
scientists in this field.
It would have been difficult to find a better and more significant
place for the Seminar than Luxembourg. Luxembourg is situated between
the first and second major nuclear accidents (Kyshtym, Windscale) and
between the second and third such accidents (Windscale, Chernobyl).
Luxembourg is also a seat of the Commission of the European
Communities. The Grand Duchy of Luxembourg has one of the highest
standards of I iving in the world, and has long been active in
international cooperation and the solving of comp I icated wor Id
problems. Luxembourg is the first country to host such a large group
of Soviet scientists from three sovereign Republics: Russia, which
suffered from the Kyshtym accident in the Urals in September 1957 and
whose western reg ions were hit by the after-effects of the Chernoby I
accident in Apri I and May 1986; and the Ukraine and Byelorussia, which
were ecologically contaminated more or less in their entirety fol lowing
the Chernobyl accident.
Irrespective of radioecologists themselves, two approaches to
information on nuclear accidents have been used in the past: firstly,
complete openness about the radioecologicai situation, together with
ful I compensation for the population which has been, or may be,
affected by the nuclear accident in question and, secondly, complete
secrecy with only partial compensation.

- 13 -
It is now clear to everyone, not only to radioecologists but also to
politicians, that the main enemy is secrecy, lack of glasnost and
bureaucratic attempts to shroud in secrecy events and their
consequences which by their very nature cannot be kept secret. There
is a Russi an proverb to the effect that there are some prob I ems you
cannot sweep under the carpet, particularly if the problem is a major
nuclear one affecting places up to 100 km away (in the case of Kyshtym
and Windscale) or on a global scale (in the case of Chernobyl). In the
case of the Windscale accident, however, soon although not
immediately afterwards the population was provided with ful I
information, costly measures were taken and the permissible radiation
exposure level for the population was considerably reduced (0.07 sv
over 70 years instead of 0.35 Sv). This healed the relationship
between the population and the nuclear energy industry in the United
Kingdom. The experience fol lowing the Kyshtym accident was precisely
the reverse, because such matters were treated unnecessarily and
spuriously as "top secret• in the Soviet Union unti I 1989, including
after the Chernobyl accident to a considerable extent. The reaction of
the pub I ic was not long in coming: operating nuclear power plants are
being closed down, and bui !ding work on a number of new nuclear power
p I ants in the Soviet Union has been stopped. Glasnost is developing
and it is to be hoped that it wi I I eventually become a part of everyday
I ife. This is important so that no attempts are made to sweep even
just one nuclear accident under the national "carpet". In this way it
wi I I be possible to establish a healthy relationship between the
general pub I ic and the nuclear energy industry.
Although various specialized Ministries exist, there is no reason why
individuals should not become members of national and international
non-governmental organizations, in which al I the specialists are equal
and the only thing that matters is their competence in their field of
radioecology.
For a long time I suffered from "isolation" in that up to 1989 I was
the only Soviet member of the International Union of Radioecologists.
On 8 November 1989, an initial orientation meeting of the International
Union of Radioecologists (IUR) was held in Sevastopol with the
participation of Prof. Rene Kirchmann (its Secretary), Felix Luykx (a
member of its Board of Council), and radioecologists from the Urals

- 14 -
(Sverdlovsk), Kiev (Institute of Cytology and Genetic Engineering) and
Sevastopol (Institute of Biology of the southern Seas).
The meeting decided to set up a Soviet Branch of the IUR with its
headquarters in Sevastopol on the shore of the international Black Sea,
at the seat of the "A. o. Kovalevsky" Institute of Biology of the
Southern Seas under the Academy of Sciences of the Ukraine. This
Institute has been conducting broad international research on the World
Ocean since late last century (1871). The formation of the Soviet
Branch of the IUR was supported by the Scientific Committee of the
Academy of Sciences of the Soviet Union with responsibi I ity for
Radiobiology, the Radiobiological Society of the USSR, the Academy of
Sciences of the USSR, the Academy of Sciences of the Ukraine and other
organizations. Soon afterwards people began applying to be active
members of the Soviet Branch of the IUR, and so far 73 people have been
accepted as active members; we congratulate them on this.
It is clear that the very size of the Soviet Union lends itself to the
creation of regional sub-branches of the Soviet Branch of the IUR. The
fol lowing have been set up so far: one for the European part of the
Russian Federation (Chairman: Prof. F. A. Tikhomirov, Moscow), one for
the Asian part of the USSR (Chairman: Prof. N. V. Kul ikov, Sverdlovsk)
and one for the European Republics of the USSR other than Russia
(Chairman: Prof. Yu. A. Kutlakhmedov, Kiev). Naturally, it wi 11 be
important to subdivide further by Republics to create branches for
Byelorussia (a proposal to this effect is expected from E. F. Konoplya
of the Byelorussian Academy of Sciences, Minsk), the Ukraine and
possibly other sovereign Republics of the USSR.
The Soviet Branch of the IUR has undertaken a number of initiatives,
the most important being its participation in organizing this Seminar.
A General Assembly of the Soviet Branch of the IUR is planned for Apri I
1991 to deal with routine matters of organization and to discuss
scientific problems (it may be held in Kiev and possibly partly in
Sevastopol - this is a matter which wi 11 need to be discussed). The
IUR leadership wi 11 participate in this General Assembly, which wi I I
provide a good opportunity to discuss the results of joint projects
with scientists from various countries, as wel I as ways of training
young researchers in the field of radioecology.

- 15 -
would I ike to express my admiration for the results of the work
carried out over the past four years by the International Union of
Radioecologists, and to thank the entire IUR leadership team for their
splendid contribution - especially the President (Dr Asker Aarkrog),
the Secretary (Prof. Rene Kirchmann), the Vice-Presidents and the
members of the Board of Counci I. If it had not been for their
helpfulness and concern for mutually beneficial cooperation to the
common good in the field of radioecology, our achievements would not
have been as positive and substantial.
I wish the participants in the Seminar success in their work. I also
wish the newly elected President of the !UR, Prof. C. Myttenaere, every
success in his work over the next four years.
Thank you.
1 October 1990 G. G. Pol ikarpov
Welcoming address at the Seminar
on behalf of the Soviet Branch of the IUR,
Luxembourg.

- 16 -

- 17 -
Opening Address
F. LUYKX
Commission of the European Communities DG XI-A-1, Wagner Building C-354, L-2920 LUXEMBOURG

- 18 -
When on the 2nd December 1942 at 3.48 p.m., on a squash court of the University of Chicago Enrico Fermi announced to his team that "The pi le had gone critical", it was the first time in human history that man had control led the release of energy from the atomic nucleus.
Now, 48 years later control led release of nuclear energy has become part of our daily I ife, since over the world more than 400 nuclear power plants are operating and in the European Community 36% of the electricity is of nuclear origin.
But, as for al I human activities, also nuclear energy production is linked with risks. Since the beginning of the nuclear age, several accidents have occurred in nuclear installations. Most of these were I imited to in-plant consequences and had no impact on the external wor Id.
However three accidents have occurred which had severe consequences for the environment.
The first of these happened on 29 September 1957 in Kyshtym, in the Southern Urals in a nuclear fuel reprocessing plant, where a tank containing highly radioactive waste exploded. In the Western world this ace i dent was unknown unt i I 1976 when Dr. Zhores Medvedev, who is present at this meeting, pub I ished his first article on this accident in "The New Scientist".
The second accident occurred about two weeks 11th October 1957 at Windscale, now cal led Sellafield, producing air-cooled graphite reactor. During a Wigner graphite there was an uncontrolled temperature increase that the graphite caught fire.
later on the in a plutonium re I ease of the to such a level
The third accident, 26th Apr i I 1986 i n a result of a nuclear graphite caught fire.
known to a I I of nuclear power plant at excursion reactor-unit
you, happened on the Chernoby I, where as a
no. 4 exploded and the
These three accidents have one fact re I ease of I arge quantities of environment causing contamination hemisphere.
in common: they al I resulted in the radioactive substances into the of large areas in the Northern
Many studies, especially over the last years, have investigated the nature and the consequences of these accidents.
The Seminar of this week wi I I provide an opportunity to present and to compare the nature of these accidental releases, their atmospheric di spars ion and deposition and espec i a I I y the subsequent transfer of contamination through terrestrial and aquatic ecosystems and the resulting implications for man and his environment.
The specific conditions of each accident being quite different, the seminar wi 11 give us the opportunity to put the enormous amount of radioecological data gathered after the Chernobyl accident in perspective with the results obtained after the earlier accidents.

- 19 -
This Seminar, which is organized by the Commission of the European Communities, Directorate-General XI and XI I, together with the International Union of Radioecologists and with the cooperation of SCOPE-RADPATH wi I I be of particular interest in that it wi I I provide a considerable amount of information from the USSR, information which previously was either not available or only accessible with great difficulty outside of that country.
About 50 Soviet scientists, involved or concerned by the 2 at this meeting to present the
coming from the different Republics accidents in the USSR, are participating latest information available.
On behalf of the Commission of the European Communities and on behalf of the organizers of this seminar it is a honour and a real pleasure for me to welcome our Soviet col leagues here today. I think it is the first time that at a scientific meeting in the E.C. ·so many Soviet experts are participating. We are convinced that the world-wide exchange of information on the subject, covered at this seminar, wi 11 contribute considerably to a better knowledge and understanding of the impact on men of nuclear accidents and, therefore, to a safer and healthier environment.
The importance of the Seminar from over 20 countries are organizers wish you al I convinced that we wi I I have a
is reflected by the fact present here today. On hearty welcome to this fruitful Seminar.
that scientists behalf of the meet i ng . I am

- 20 -

- 21 -
Opening Address
A. AARKROG
International Union of Radioecologists Ris0 National Laboratory, Roskilde4000, Denmark

- 22 -
M.A. AARKROG, President of the IUR
Ladies and Gentlemen, on behalf of the International Union of Radioecologists, I wish you al I a hearty welcome to this CEC-IUR seminar on major nuclear accidents. Nobody I ikes accidents to happen, those human and economic costs can be very serious indeed. But when nuclear accidents happen, it is the obi igation of radioecologists to extract as much information as possible from such an event. This seminar should be seen in this context. If we look at the three accidents mentioned to us by F. LUYKX, we will notice that from a pedagogical point of view they are very useful. The first accident wi I I learn us a lot about the behaviour of Strontium-90 in the environment, that was the Kyshtym accident in the Urals. The Windscale accident told us about iodine-131. The behaviour of this radionuclide in the environment and the Chernobyl accident .has first of al I learned us about the behaviour of caesium-137 in the environment. IUR is in particular happy to see the 46 soviet scientists attending this meeting because international cooper at ion within radioecology is one of our major aims. I hope that we shal I spent 5 fruitful days together here in Luxembourg.

- 23 -
Session II
ACCIDENT SOURCE TERMS

- 24 -


- 26 -
ABSTRACT
The Kyshtym accident took place on 29 September 1957 at a plutonium separation plant. The accident was caused by the explosion of dry nitrate and acetate salts in a tank containing highly radioactive wastes as a result of a failure in the cooling system and the consequent self-heating of the wastes. The explosion dispersed approximately 2 mi I I Ion curies of nuclear fission products, of which 144ce and 95zr accounted for 91%. Long-I ived 90sr accounted for only 2.7% of the dispersed mixture but was responsible for the longterm radiological hazard within what became known as the Eastern Urals radioactive trai I. An area of 300 x 50 km received a m,n,mum contamination level of 0.1 Ci of 90sr/km,, and an area 105 x 9 km a minimum level of 2 Ci 90sr/km,. The spatial distribution of the contamination was fairly typical of models of single-point discharge and dry atmospheric deposition of contaminants; the result was a sharply defined trai I axis and a steady fal I ing-off of contamination level both along and across the axis. The maximum contamination was 4 000 Ci of 90sr/km,. The initial exposure dose rate reached 150 µR/h per 1 Ci of 90sr/km, and was mainly due to 95zr and 95Nb. The exposure dose over 30 years was 0.5 R/(Ci 90sr/km,), of which 0.42 R/(Ci 90sr/km,) was formed during the first year. As a result of radioactive decay, contamination by all radionuclides decreased over 30 years by more than 30 times, and fel I by half in the case of 90sr, while the exposure dose rate decreased by 2 800 times and radionuclide concentration in the various parts of the environment by 103-104 times.
Al I the short-I ived radionucl ides decayed within the first five years, after which time 90sr was practically the only factor determining the radiation and radiological characteristics of the Eastern Urals radioactive trai I. The processes governing 90sr migration in the environment and in human food chains determine the radiological consequences of the accident for human beings.

- 27 -
Causes and scale of the accident
In 1957, almost at the same time as the Windscale accident in Great Britain, there was a major radiation accident in the Southern Urals resulting in the radioactive contamination of a vast area and leading to the implementation of a series of urgent and long-term measures for the radiological protection of the population. The accident occurred at the first Soviet nuclear installation, located near the town of Kyshtym in Chelyabinsk oblast (region), dedicated to the production of plutonium for military purposes; the installation contained a radiochemical plant for separating the plutonium.
As always, the new technology required the solution of a series of difficult problems. Even today, the processing and storage ofradioactive waste has not been satisfactorily resolved, but in the early history of plutonium production one practical and acceptable method of dealing with radioactive waste was to store it on a long-term basis in water-cooled metal tanks encased in concrete. The heat generated by the decay of radionucl ides in the waste was dissipated by a water cooling system.
Corrosion and the failure of monitoring equipment led to a breakdown in the cooling system of a 300 m3 tank; insufficient monitoring al lowed the 70-80 tonnes of highly radioactive wastes stored there, mainly in the form of nitrate and acetate compounds, to heat up. The water evaporated, the sediments dried out and heated up to a temperature of 330 - 350"C, leading on 29 September 1957 at 16.20 local time to the contents of the tank exploding .with a force estimated at between 70 and 100 tonnes of TNT.
Of the 20 MCi of radioactive material contained in the tank, approximately 2 MCi was ejected into the air to a height of approximately 1 ooo m, forming a radioactive cloud. Fallout from this cloud, blown in a north-easterly direction from the plant by the wind, caused radioactive contamination of areas along the path of the cloud in the Chelyabinsk, Sverdlovsk and Tyumen oblasts. This area was later referred to as the Eastern Urals radioactive trai I.
Prior to 1957 there had been no similar instances of radioactive contamination of large areas of the Soviet Union; and this dramatic situation, which demanded rapid action to deal with the consequences of the accident and protect the population, was aggravated not only by the lack of practical ski I ls for coping with accidents of this type, but also a lack of understanding by scientists of the behaviour of radioactive nuc I ides in the environment, the methods and conditions governing the irradation of people, flora and fauna, and the degree of radiation hazard. Scientific know I edge of env i ronmenta I radioactive contamination and of irradiation pathways and levels among the population was sti 11 basic, and the isolated initial results obtained by Soviet and foreign researchers were classified and unavai I able for practical use.

- 28 -
Nevertheless, under these difficult circumstances the first real steps were taken towards evaluating radiation hazards and methods for protecting the population, and these soon became closely I inked with measures to restore normal productive and everyday activities in a significant proportion of the contaminated area. In addition, as fate would have it, soviet researchers were presented with a unique opportunity for field experiments; it was this that brought about the development of radioecology in the Soviet Union.
2. Radiation Characteristics
The radioactive material dispersed by the explosion primarily comprised short-lived radionuclides (Table 1). For a long time following the accident, however, the main radiation hazard was the presence in the mixture of long-I ived 90sr (2.7% of total activity) together with its daughter product 90y, The composition of the radionuclide mixture was similar to that of the fission products formed in a nuclear reactorafter approximately one year, when al I the shortest-I ived nucl ides have decayed, but with one difference. The method used in the waste reprocessing plant involved concentrating these wastes by means of precipitation with NaOH. With this method, the sediment put into storage after dissolution contained practically al I the radionucl ides with the exception of caesium which, as a soluble Group 1 element, remained in the alkaline solution and was later concentrated separately.
There was therefore almost no caesium in the radionuclide mixture. This was not taken into account, however, by foreign researchers and subsequently led to incorrect conclusions both in the analysis and, above al I, in the assessment of the extent of the consequences.
Table 1
Radionuclide content of released material
Rad i onuc I i de Half-I ife Type of radiation Contribution to activity of mixture
89sr 51 days beta, gamma tr aces 90sr + 90y 28.6 years beta 5.4 (2.7x2) 95zr + 95Nb 65 days beta, gamma 24.9 106Ru + 106Rh 1 year beta, gamma 3.7 137cs 30 years beta, gamma 0.036 144ce +144pr 284 days beta, gamma 66 147pm 2.6 years beta, gamma traces 155Eu 5 years alpha, beta traces
Pu gamma traces

- 29 -
At the moment the trai I was formed the fallout mixture emitted gamma radiation with a total energy of 7.63 MeV per 90sr disintegration (adopted as the "benchmark" radionuclide on account of its significant half-life), and beta radiation with an initial energy total approximately three times greater. The gamma radiation of the mixture decreased markedly as a result of the subsequent radioactive decay of short-I ived gamma-emitting nuct ides (Fig. 1) and now beta radiation atone, almost exclusively from 90sr and 90y, is the significant factor in the contamination.
The Eastern Urals radioactive trai I was basicat ty formed by the fat tout of radioactive material from the passing cloud.
The time at which radioactive substances began to settle on any given point depended on distance from the source and the average speed of the cloud.
The duration of fat tout ranged from several minutes at the beginning of the trai I to 30-60 minutes at its furthest extent.
Due to the lack of atmospheric precipitation during the formation of the trai I, and also the occurrence of periods of dry weather and strong winds unti I the constant autumn rains began and settled snow cover was established, some redistribution of radioactive material by wind was observed in places during the first four to six weeks; this led to changes in the radioactive contamination in those parts of the trai I close to the accident site, where levels of contamination were highest. Thus the trai I is wider at the beginning than towards the end, where it "peters out" in an easterly direction.
t:e10,,,1 ttf;...,.,.-----.-----~-----,----,-----a 7
5 5 4
5
!l
2
thi=, 1·i_r,;;;r

- 30 -
The area within the contamination contour of 0.1 Ci/km, of strontium-90 (the m,n,mum level detected, equal to twice the level of overal I radioactive contamination by strontium-90 for the given region in 1957) had a maximum length of 300 km, extending close to the town of Tyumen, and was 30-50 km wide (Fig. 2); the 2 Ci/km, contour for strontium-90 was 105 km long and 8-9 km wide. A strontium-90 contamination level of 2 Ci/km, was considered the maximum safe I imit for habitation and was adopted as the official boundary of the Eastern Urals radioactive trai I. The total area exposed to that level of radioactive contamination covered approximately 1 000 km,, while the area within the 0.1 Ci/km, contour was some 20 000 km,.
The Eastern Urals radioactive trai I displays quite natural territorial distribution characteristics, namely a pronounced axis along which the contamination level steadily diminishes (from 4 000 Ci/km, of strontium-90 at the start to 0.1 Ci/km, at its furthest extent). Transverse distribution of contamination is characterized by sharply pronounced maxima along the axis of the trai I, exceeding the peripheral density values by 1-4 orders of magnitude. Table 2 shows the territorial distribution of strontium-90 contamination by level.

d0.,,..,
,,., i•
vi
7.._~_(
. ,;
~
:'"G
J".v
.k
Q
{ ~J
t":t~
kL•
~b
O
~
Fig
. 2
. T
he
East
ern
U
rals
ra
dio
acti
ve tr
ail
.
0 0 '\)
a(} 0
()
I,-
0 10
2.
IJ
!tO /!
.M
k'.v
l1.6
'A <>
I
w
I-'

- 32 -
Table 2
Contamination levels and areas affected
Strontium-90 contamination, Ci/km, Area affected in km,
Note:
0. 1-2 15 x 10, 2-20 600
20-100 280 100-1 000 100
1 000-4 000 17
Boundaries of area contaminated with 0.1 Ci/km, of strontium-90 are not completely certain.
The radioactive fallout was not initial IY immobi I ized in the environment, and its presence was noted in absolutely everything, including I iving or(;anisms and foodstuffs. Depending c~ its location relative to the source, initial levels of radioactive contamination (based on total beta activity) compared with the period prior to the accident increased by 10, - 2 x 10⁵ times in natural grassland, 1.5 -3 x 10⁴ times in open bodies of water, 25 - 1 000 times in wheat grain and 10 2 000 times in cow's milk. The main pathway of radioactivity uptake into crop produce was direct surface contamination.
In the initial stages, the exposure dose rate for gamma radiation in the open at a height of 1 metre was 150 µR/h calculated on the basis of 1 Ci/km, of strontium-90; of this amount approximately 90% came from 95zr and 95Nb. At maximum contamination of approximately 4 000 Ci/km, of strontium-90, the initial gamma exposure dose rate was 0.6 R/h (Tab le 3).
Subsequently, the situation in the contaminated area underwent considerable changes. The basic factors which influenced and continue to influence the situation are as fol lows:
the radioactive decay of gamma-emitting nucl ides; the redistribution of radioactive substances in natural systems, including working down into soi I and bed sediments; biogeochemical migration of radionucl ides; human economic activity, including measures for the radiological protection of the population.
The general dynamics of the radiological situation in the area of the Eastern Urals radioactive trai I are i I lustrated in Table 3.

- 33 -
Table 3
Dynamics of radiological conditions within the Eastern Urals radioactive trai I
Radiological situation indicator
Cont am i nation level (relative uni ts)
As regards total beta activity
As regards 90sr
Gamma radiation exposure dose rate at a height of 1 m,
gR/h Ci 90sr/km,
Gamma radiation exposure dose at a height of 1 m,
R - 90sr/km, Ci
Total concentration of radionucl ides (relative uni ts)
Grass
Grain
Milk
Water (in lakes)
0
1
1
150
0
1
1
1
1
Number of years fol lowing accident
1 5 10 25 75 ( forecast)
0.34 0.057 0.043 0.030 0.0088
0.96 0.89 0.78 0.52 0. 16
8.7 0.33 0.15 0.053 0.017
0.42 0.49 0.49 0.50 0.50
o. 1 0.01 0.004 0.001 0. 0001
0.2 0.01 0.008 0.002 0. 001
o. 1 0.01 0.008 0.005 0.001
0.03 0.01 0.0075 0.003 0.0005
----------------------------------------------------------------------

- 34 -
Due to radioactive decay, the contamination level of the radionuclide mixture was over 30 times less after 30 years; levels of strontium-90 had reduced by half. For that reason, gamma-radiation energy fel I from 7.6 to 0.004 meV per 90sr disintegration; this led to a 2 800-fold reduction in the exposure dose rate for gamma radiation at a height of 1 m (allowing for migration down into the soil). The gamma radiation exposure dose, amounting over 30 years to 0.5 R calculated on the basis of 1 Ci/km, of strontium-90 and almost al I formed within the first year fol lowing the accident, has up unti I now increased by only 16%. This means that gamma irradiation of people and flora and fauna in the contaminated area was prevalent throughout the first 12-18 months. The concentration of al I radionucl ides in various parts of the environment, including agricultural produce, declined during this period by hundreds or thousands of times, with the maximum decrease taking place during the first 5 years. Since then, 90sr has been the only factor governing the radioactive contamination of al I flora and fauna and inanimate organic matter, and the subsequent dee! ine in levels of radioactive contamination was conditional on the underlying mechanisms governing the behaviour of 90sr in the environment.
3. Population irradiation doses
There were several pathways involved in irradiation of the population in the contaminated area (total I ing some 270 000 people).
External irradiation of the whole body and of internal organs was governed by:
1) gamma irradiation from the passing cloud of released material;
2) gamma irradiation from contaminated soi I and dwel I ings;
3) beta and gamma irradiation from contaminated skin and clothing.
Internal irradiation stemmed from intake of radioactive substances into the organism with inhaled air or in food and water, and the resulting short- or long-term ( in the case of 90sr) presence of radionucl ides in human tissue and organs.
In the initial stages, external irradiation was the predominant factor in the contaminated area; later, internal irradiation came to dominate, due to 90sr intake via food and its deposition in human bones. The Jong-term (over 30 years) formation of radiation doses may be divided into two periods: the "acute" or initial 12-18 month period of mainly external irradiation and the later one, with predominantly internal irradiation. At the time the cloud passed, external irradiation was estimated at 0.13 mrem/(Ci 90sr/km,). Internal irradiation of the lungs, caused by the inhalation of radioactive substances, was estimated at 5-300 mrem/(Ci 90sr/km,) throughout the subsequent period of activity in the lungs, depending on the degree of solubi I ity of the radioactive substance in pulmonary fluid.

- 35 -
Most of the external irradiation dose to the public was received in the "acute" period (Table 4). Of the overall dose over 30 years - 260 mrem/(Ci 90sr/km,) - more than half (160 mrem) was absorbed during the first 120 days, and approximately 90% during the first two years. The most critical organs were in the gastro-intestinal tract; these received the largest doses of internal irradiation during the "acute" period. Of the 30-year irradiation dose for the gastro-intestinal tract - 2 rem/(Ci 90sr/km,J - 12% was absorbed during the first ten days, and 80% during the first year. During the "acute" period radioactivity also accumulated in the bone tissue and red marrow due to deposition of 90sr in the bones; the dose absorbed in these tissues increased from 9 and 3 mrem respectively after the first month to 720 and 220 mrem/(Ci 90sr/km,) at the end of the first year.

Irra
dia
tio
n
path
way
10
da
ys
30 d
ays
Irra
dia
ted
org
ans
and
tiss
ues
Dos
e eq
uiv
alen
t
Ex
tern
al
irra
dia
tio
n
33
67
i In
tern
al
irra
dia
tio
n:
Cast
ro-i
nte
stin
al
tr a
ct
250
480
Bon
e 3
.1
9.4
Red
m
arro
w
0.9
7
2.9
I Eff
ecti
ve
dose
eg
uiv
alen
t 93
18
0
Mea
n p
op
ula
tio
n
irra
dia
tio
n d
ose
s si
nce
th
e fo
rmat
ion
of
th
e E
aste
rn U
rals
ra
dio
acti
ve tr
ait
, in
m
rem
/(C
i 90
sr/k
m2
)
120
days
1
year
2
yea
rs
5 y
ears
10
y
ears
160
220
230
250
260
1 20
0 1
600
1 80
0 1
900
2 00
0
46
720
1 50
0 3
300
5 40
0
14
220
490
1 00
0 1
700
450
700
78
0
920
1 10
0
Tab
le
4
15
yea
rs
20
yea
rs
>
260
260
2 00
0 2
000
6 60
0 7
300
2 00
0 2
300
1 10
0 1
200
30
yea
rs
260
2 00
0
8 00
0
2 50
0
1 20
0
w
en

- 37 -
The leading role of 90sr in the internal irradiation dose among the population and, to a significant extent, in the effective dose equivalent stemming from this irradiation, began to become apparent in the second year after the accident. Most of the foodstuffs consumed by the rural population were produced locally, chiefly on private plots, and 90sr intake derived mainly from consumption of local IY produced milk, meat, potatoes and vegetables. Some 50-70% of 90sr intake came from milk, 5-25% from meat and 15-45% from potatoes and vegetables. There were no great changes in this intake ratio during the later period, although the radiological measures taken to protect the population, together with natural processes influencing 90sr avai labi I ity for plants, led to a systematic fal I in produce contamination levels and, finally, to a constant decline in the annual intake of 90sr in human beings via foodstuffs (Fig. 3). The 90sr content in foodstuffs halves every 5.5 years. For these reasons, the intensity of 90sr intake into the organism and its deposition in the bones have declined over the course of time, leading to lower increases in the dose rates for bones and red marrow over the last 15-20 years. over 30 years the dose to bone tissue, within the 1 Ci/km, c90sr) contour, was 8 rem, and to red marrow 2.5 rem; in each case, half of the dose accumulated during the first 6-7 years. over the course of 30 years the effective dose equivalent amounted to 1.2 rem/ (Ci 90sr/km,); external irradiation accounts for 22% of this dose, internal irradiation of bone tissue for 21% and internal irradiation of red marrow 28%.
'~-~---o-----~------~----~------,---------,/0-S 10
' ,
' 1 · -
~J '~ <,;
' v
!( 0. ~
1 • , ' ' ' ' J
2
q,JU--~-,---l----1 :I. J 4 5 "
Fig. 3: Dose burdens in the non-evacuated population.
.. " .,
-11 .l '

- 38 -
Despite the lack of experience with radiation accidents, especially those involving intense radioactive contamination of large areas, the strategy and tactics adopted for the urgent (and then the systematic) measures taken for the radiological protection of the population within the Eastern Urals radioactive trai I appeared to be correct and even, from a present-day point of view, unnecessarily very much on the safe side.
The main urgent measures taken immediately after contamination of the area included the fol lowing:
1. Evacuation of nearby population centres where the potential external irradiation dose might have exceeded 100 rem during the first month.
2. Medical treatment for evacuees, replacement of clothing, introduction of a ban on the removal of personal effects and stocks of food by people in this category.
3. Introduction of radiation and dosimetric checks in the most contaminated area, accompanied by restrictions on access to that area.
Urgent evacuation (which in effect meant resettlement) was carried out within the first ten days from the four vi I !ages closest to the plant and housing some 1 100 people. The evacuees were accommodated in uncontaminated towns and vi I I ages and given housing and work. Irradiation doses for evacuees are given in Table 5.
The subsequent systematic measures to reduce popu I at ion i r radiation levels during the "acute" period included the fol lowing:
1. Monitoring radioactive contamination levels in foodstuffs and agricultural produce, destruction of produce containing levels higher than permitted and a guaranteed supply of uncontaminated foodstuffs to replace them.
2. Further evacuation of the population.
3. lntroduct ion of restrict ions on pub I ic access to - and economic activity in - part of the contaminated area.
4. Decontamination of populated areas and agricultural land.
The monitoring of contamination levels in produce, and the destruction of that produce, were dictated by the need to ensure an immediate reduct ion in human intake of radioactivity via food. The alternative solution to this problem - the systematic and long-term guaranteed supply of uncontaminated foodstuffs from other regions was unrealistic: if people were forbidden to grow and consume agricultural produce there would be no point in their staying on in the countryside. On the basis of the provisional standard worked out - a permitted annua I 90sr intake of 1. 4 µCi /year the need for continuous radiation monitoring and, if need be, destruction of produce, was recognized. The monitoring covered territory with a minimum contamination level of 0.5-1 Ci/km, of 90sr, an area of approximately 1 000 km, (50 population centres). During the first two years, more than 10 000 tonnes of various types of produce were destroyed.

- 39 -
Given the impossibi I ity of completely replacing contaminated foodstuffs with "clean" foodstuffs in towns and vi I !ages where 90sr intake via food exceeded the provisional permitted annual level, the decision was taken to carry out a further systematic evacuation of the population from areas where contamination exceeded 4 Ci/km, of 90sr.
Resettlement priorities were established on the basis of the local contamination level and the degree of economic exploitation of the surrounding land. The resettlement was begun 8 months (and completed 18 months) after the !nit ial contamination. In al I, together with the urgent resettlement, more than 10 000 people from 23 rural towns and vi I !ages were moved (Table 5).
Table 5
Resettlement measures and their role in reducing irradiation levels in the population
Population groups
Index l II 11 l IV v Total
Urgent Syst emat Jc reset t I ement reset t-lement
Number of towns and vii loges 4 1 5 7 6 23
Number of people (x 1 000) 1 . 1 0.3 2.0 4.2 3.1 10.7
Mean castaminotion level in Ci Sr/km2 500 65 18 8.9 3.3
Duration of post-contomination residence prior to resettlement in days 10 250 250 330 670
Mean irradiation doses received prior to resettlement, in rem
Dose equivalent
External irradiation 17 14 3.9 1.9 0.68
Internal I rradiotion
Gostro-intestinal t roct 150 98 27 13 5.4
Bone 1.6 10 2.8 5.8 4.4
Mean effective dose equivalent 52 14 12 5.6 2.3

- 40 -
Table 5 shows that the maximum mean dose received by evacuees over a period of 30 years amounted to an effective dose equivalent of 52 rem, and 150 rem to the gastro-intestinal tract. The corresponding minimum mean doses were 2.3 and 4.4 rem, which is close to the level of irradiation doses in the non-evacuated population.
BIBLIOGRAPHY
1 . B. v. Nikipelov, Yu. B. Kho I ina, Southern Urals in pp. 74-80.
G. N. E. I. 1957;
Romanov, Miker in:
"Atomnaya
L. A. Bu I dakov, N. s. Babayev, The radiation accident in the Energiya", 1989, vol. 67, No. 2,
2. B. V. Nikipelov, E. G. Drozhko: The Southern Urals explosion; "Pr i roda", 1990, No. 5 (897), pp. 48-49.
3. G. N. Romanov, A. s. Voronov: The post-accident radiation situation; "Priroda", 1990, No. 5 (897), pp. 50-52.
4. G. N. Romanov, L. A. Buldakov, V. L. Shvedov: Population irradiation and post-accident medical consequences; "Priroda", 1990, No. 5 (897), pp. 63-67.

- 41 -
One Western Perspective of the 1957 Soviet Nuclear Accident
John R. TRABALKA, Stanley I. AUERBACH
Environmental Sciences Division, Oak Ridge National Laboratory, P.O. Box 2008,
Oak Ridge, Tennessee 37831-6036

- 42 -
ABSTRACT
Much information about a 1957 chemical explosion of high-level radioactive waste at the Chelyabinsk-40 (Ch-40) plutonium-production center in the Urals is available, but seeming inconsistencies and the complex history of Ch-40 limit its interpretation.
The total radioactivity released was 20 MCi and the combined activity of 90sr and 137cs released was l MCi, comparable to releases from the 1986 Chernobyl reactor accident. In contrast to the latter, however, only about 10% of the 1957 release was more widely dispersed and deposited over an area of about 20,000 km2 along a ~300-km-long track. Further, l37cs comprised about 80% of the combined activity of 90sr and 137cs from Chernobyl, but only a small fraction of that from the 1957 accident.
Nearly 11,000 persons were relocated from 23 populated places in a 90-km-long (700-km2) area containing ~2-4 Ci/km2 90sr; 24% of this area is still uninhabitable--now dedicated for radioecological research. Over 1100 people were evacuated within 7-10 d from an "extreme evacuation zone", and the rest were relocated in stages over 250-670 d. Acute radiation effects were observed in farm animals and natural ecosystems in and near the "extreme evacuation zone" but not, reportedly, in humans. Temporary agricultural restrictions were also applied to the 700-km2 area (~2-4 Ci/km2 90sr), but, in the remainder (<2 Ci/km2 90sr), restrictions were not applied and impacts appear to have been slight.
Releases from Ch-40 contaminated the Techa River drainage and required evacuation of ~7500 persons prior to 1957. A small reservoir (Lake Karachay), containing 120 MCi of radioactivity from early intermediatelevel waste disposal practices, was the source of additional releases. There are also a number of unconfirmed reports of reactor accidents at Ch-40. The extent to which other releases contributed to reports of casualties attributed to the 1957 accident and/or to the need for a massive hydrologic isolation system at Ch-40 is not yet clear.

- 43 -
INTRODUCTION Much information about a 1957 explosion of high-level radioactive
wastes (HLW) and other happenings at the Chelyabinsk-40 plutoniumproduction complex (Ch-40; also called the Kyshtym nuclear complex) in the eastern Urals has been released by the Soviet Union prior to the seminar in Luxembourg [1-18]. However, this information has not been reported in a clear and consistent manner. Among other things, this may indicate that the enumeration of events, including accidents, is not yet complete. A 1974 Soviet report, which was given a wide distribution in 1990 [7],
provides information not currently available elsewhere, but also contains serious errors and inconsistencies that limit its usefulness.
BACKGROUND In our analysis of the 1957 accident [19], we identitied an area near
Ch-40 in which over 30 communities had disappeared (Fig. l) and identified a major hydrologic isolation system, consisting of several cascaded reservoirs and canals (Fig. 2), apparently designed to limit the spread of radioactive contami 11at ion down tile Tech a River. We hypothesized that the narrow, southwest-northeast arm of this area had been contaminated by an aerosol resulting from the accident, but that the southwest-southeast arm containing the hydrologic isolation system had been contaminated primarily by a liquid release(s), possibly including earlier chronic releases. The situation is even more complex than we imagined in 1979.
Most of the communities from which the human population was relocated were very small (villages and collectives <2000 persons), but five had populations ~2000. Locations of the larger communities are indicated by symbols within the fully enclosed dashed area in Fig. 1. Proceeding from the northeast to the southeast end of the dashed area, these were: Boyevka, Yugo-Konevo, Russkaya Karabolka, Metlino, and Asanovo. The villages of Metlino and Asanovo each were located near dams of reservoirs in the hydrologic isolation system downstream from Lake Kyzyltash, a large natural water body in the Techa River system north of Ch-40 (Fig. 2). Lake Kyzyltash was itself contaminated through its use as a cooling water source for the reactors at Ch-40 [lB, 19, 21].
Releases originating in 1948 from Ch-40 resulted in contamination of the Techa River that required relocation of ~7,500 persons, including the inhabitants of Metlino and Asanovo, prior to 1957, and initiation of the hydrologic isolation system [4, 17, 18, 20]. All persons in communities

- 44 -
from Metlino downstream to Muslyumovo (see Fig. 3) were relocated. These releases, amounting to 3 MCi (110 PBq) in 1949-1952 (25% 90sr + 137cs), appear to have resulted in large part from a lack of early waste treatment capability and the storage of radioactive wastes in open, unlined earthen reservoirs [17-20; G. N. Romanov, pers. comm., October 19, 1990].
The villages of Russkaya Karabolka, Yugo-Konevo, and Boyevka were part of a group of 23 populated points (10,730 inhabitants [6, 8, 14, 18]) that were evacuated in 1957-1959, following the HLW explosion that took place on September 29, 1957. These villages were located within a 700-km2 "sanitary-protective zone" (Fig. 1) in which the 90sr aerosol deposition was ~4 Ci/km2 (0.15 TBq/km2) [7, 14]. The most heavily contaminated part of this zone was designated as the "extreme evacuation" zone (Fig. 2), from which the residents were removed within 7-10 d [7]. A much larger area (est. 15,000-23,000 km2) was contaminated at levels of 0.1-2 Ci/km2 90sr (Fig. 3). Its boundary was the level of 90sr deposition from the 1957 accident equal to the background level (about 0.1 Ci/km2) produced by global fallout from nuclear weapons testing [7, 11].
A small reservoir at Ch-40 (L. Karachay; note the small unnamed water body south of L. Kyzyltash in Fig. 2), containing 120 MCi (4400 PBq) of radioactivity from early intermediate-level radioactive waste disposal practices (10, 21), was the source of additional releases--both liquid and aerosol--and is the focus of intensive remedial actions [17]. In 1967, about 600 Ci (22 TBq) of radioactivity (primarily 137cs and 90sr; 137cs:90sr ratio 3:1) in dry contaminated soils or sediments from its shoreline were reportedly dispersed by the wind (during a tornado?) over an area of 1,800 km2 [17]. The resulting contamination (maximum 90sr level 10 Ci/km2) was reportedly superimposed on the area contaminated by the 1957 accident. We think that this may have expanded the overall area of contamination, producing the bulge at its southeastern extremity (see Fig. 3), because this feature is not shown on maps in [7].
This area of the Urals reportedly received elevated nuclear weapons fallout in May 1958 from an underground test on Novaya Zemlya [3]. The resulting contamination was apparently insignificant compared to the levels produced by the 1957 accident and other releases from Ch-40.
Contrary to information available previously in the West (22-25), early Soviet reports indicated that none of the releases, including the 1957 HLW explosion, had produced casualties or had involved reactor accidents. However, there were deleterious health effects among those people exposed

- 45 -
to contamination of the Techa river before 1957. A population ~12,800 persons living along a 230-km stretch of the Techa River received significant radiation doses: Mean effective radiation dose equivalents in exposed communities 3.6-140 rem (0.036-1.4 Sv). An excess incidence of leukemia amounting to 14-23 cases was reported [18].
Earlier indications that Ch-40 was operated "under extremely difficult conditions" ... which had a deleterious effect on the health of the staff" [l] have now been confirmed. A significant fraction of the work force received annual radiation doses of 100 to >400 rem (1 to >4 Svl during its early history (1949-1951), and the consequences have been described [9].
There are a number of reports--all unconfirmed and strongly denied by our Soviet colleagues--of accidents associated with reactor operations at Ch-40 (e.g., 22-25), some from seemingly authoritative sources such as Igor Kurchatov (R. Wilson, Harvard Univ., Cambridge, Mass., pers. comm., June 8, 1981) and Andre Sakharov (24). These reports include two contemporary newspaper articles (25) which detailed evacuations and casualties resulting from a February 1958 release produced by the breakdown of a filter system.
There are too many reports of casualties (22-25) and/or other accidents associated with Ch-40 to dismiss these entirely on the basis of current information. The question of whether casualties resulted from the 1957 HLW explosion or its aftermath may also be open.
CHARACTERISTICS OF THE AFFECTED REGION The total area contaminated by the 1957 HLW explosion covered
15,000-23,000 km2 (parts of the Chelyabinsk, Sverdlovsk, and Tyumen' provinces) (Fig. 3), contained 217 communities, and included a 1957 population of about 270,000 persons [7, 8, 11]. The nationality of the inhabitants was primarily Russian (about 75%); most of the remainder had Tartar or Bashkir roots [7]. Only one major city (Kamensk-Ural'skiy; 1959 population 141,000) was inside the 1957 deposition zone (Fig. 3). Fig. l in [7] places part of Kamensk-Ural 'skiy in the "sanitary-protective zone," but appears to be in error (see Fig. 23 in [7] and Fig. l in [11]).
The contaminated areas identified in Figs. 1-3 were largely rural in character: Cropland, pastures, and hay fields reportedly covered 60% of the area [7], but also see [12]. The remaining area was approximately divided between forests and natural aquatic ecosystems (lakes, bogs, and rivers). The primary natural terrestrial ecosystems in the deposition zone are forest-steppe over the initial 100 km (i.e, nearest to the accident site)
- 46 -
and southern taiga in the remainder [26]. Principal canopy species in the forest-steppe were birch (.IL. verrucosa), pine (.!:.. silvestris), or admixtures. There were significant stands of pine over the first 30 km of the deposition zone resulting from the 1957 HLW explosion (7]. See, e.g., [7, 12, 14, 26, 27] for more on the environmental setting (climate, soils, characteristics of aquatic ecosystems, etc.) and socioeconomic factors.
THE CAUSE OF THE 1957 ACCIDENT The Soviet commission which investigated the 1957 accident concluded
that the most likely cause was a chemical explosion of stored HLW. The measuring and control system for the tanks failed, its design and high radiation fields prevented repair, and the stored HLW wastes overheated and began to evaporate. Since the tanks were cooled externally and were entirely immersed in water, they gradually floated as liquids evaporated. Resulting leaks in several tanks led to contamination of the cooling water, forcing adoption of an ineffective regime of periodic cooling [10]. Conditions deteriorated, leading to the explosion, which demolished the tank, blew off a 2.5-m-thick concrete plate ([29]; said to be 25-m-thick in [10]) covering the cell [10], and left a "crater" [17]. The energy for the explosion and resulting dispersal of radioactive materials was thought to have been about 75 t of trinitrotoluene (TNT)-equivalent, provided by an acetate-nitrate reaction in the drying, concentrated wastes (Table 1).
The tank in which the explosion took place was one of 20 stainlesssteel tanks, each isolated in a concrete-walled compartment ("canyoncell"), located in a large, rectangular, reinforced-concrete structure. (Other information indicates that the explosion took place in a 300-m3
concrete tank [2, 3, 8] located in a 16-tank HLW storage complex [28].) Discharges of HLW to this storage complex and of intermediate-level radioactive wastes to L. Karachay both began in 1953 [10].
The accident scenario was also described by Y. !. Mikerin, manager of the Ch-40 reprocessing plant. He said that the cooling system, reportedly internal, in one of the tanks began to leak and was shut off in 1956. More than a year lapsed before a spark from a control device detonated the salts and "obliterated the tank" [30]. Some of the details provided by Mikerin are inconsistent with [10], but it is his timing of events leading to the explosion that provokes the most serious questions (discussed below).

- 47 -
THE RADIOACTIVITY RELEASED The total radioactivity released by the 1957
MCi (740 PBq) (Table l}, and the combined 137cs released was 1 MC1 (37 PBq) [2, 3, comparable to the releases from the Chernobyl MCi (1850 and 74 PBq), respectively [32].
HLW explosion was about 20 activity of 90sr-90y plus 8, 10]. These amounts are reactor accident, 50 and 2 Whereas 137cs represented
about 80% of the activity of long-lived materials from Chernobyl, however, it reportedly comprised a small fraction of the 1957 release.
The reported composition of the radionuclide mixture is also shown in Table 1. The major constituents were 144ce-144Pr (half-life 284 d), which was the principal source of the radiation dose to biological surfaces (i.e, from beta particles) during the first year after the accident ("acute" phase of irradiation). Next in importance were 95zr_95Nb (half-lives 65 and 35 d, respectively), which delivered most of the external gamma-radiation dose during this same period. The principal source of long-term exposures to humans as well as ecosystems was 90sr (half-life 28.6 y). Consequently, the areal extent of contamination is referenced to this radionuclide [l, 5-8, 11-18]. Notably reduced in its contribution relative to typical HLW is 137cs (Table 1). However, there are also large differences in the 90sr-90v: 137cs activity ratios given in Soviet reports, i.e., values of 150:l or 7:1 (Table 1)--as opposed to a ratio of about 1:1 in unseparated HLW [19].
Information provided in earlier Soviet radioecology publications [19] is more consistent with the higher ratio of 90sr-90v:137cs (150:1) given in Table 1. Although we have been assured that the lower value of 7:1, obtained from [7], is in error (G. N. Romanov, pers. comm., October 19, 1990), we do not yet have an explanation for the discrepancy. It is clearly the 137cs data that are the source of the error because the differences in reported percentages of 90sr-90y are slight (Table 1).
We cannot attribute the discrepancies between values for 137cs in Table 1 to differences in analytical methods because gamma spectrometry was reportedly utilized for 144ce-144Pr, 137cs, 106Ru, and 125sb (?)
[33]. The discrepancies between [7] and other sources need explanation. The 95zr- 95Nb content shown in Table 1 (20-25%) is reasonably
consistent among references. However, the 95zr-95Nb content is highly atypical of materials that had been cooled (~100 d), reprocessed, and then stored for >l y--as suggested by Mikerin [30]--(see, e.g., Table 1 in [19]). Because of very short half-lives, these two isotopes do not usually
- 48 -
exceed 20% of the radioactivity in plutonium-production wastes at ~l y. With the exception of a slightly lower l06Ru- 106Rh content than
expected, the reported composition is reasonably close to that of 1-y-old reprocessed wastes from which 137cs had been chemically separated [19]. The latter appears to have occurred [3; also G. N. Romanov, pers. comm., October 19, 1990], but details of the separation process and of the chemical composition of the resulting HLW have not been reported. The radiochemical composition also agrees more closely with that in an earlier Soviet study designed to determine criteria for evacuation of areas accidentally contaminated by 200-350-d-old fission products released from radiochemical separations plants [31]. This study was rather obviously based on operational experience following the 1957 accident and was cited by Soviet radioecologists [19]. The waste characteristics in [31] are also in agreement with the external dose rates reported in [11], but not with Mikerin's accident scenario. Thus, this discrepancy needs to be resolved.
THE CONSEQUENCES OF THE 1957 HLW EXPLOSION
Effects at Chelyabinsk-40
Most (90%) of the 20 MCi released by the 1957 accident reportedly "fell out" near the explosion site and very high contamination levels resulted. External exposure rates were initially >400, 20, and 3 R/h at distances of 0.1, 1, and 3 km, respectively, from the explosion "crater" [17]. Based on data in [11], these exposure rates could correlate with 90sr-90y levels of roughly 40 mCi/m2 to >5 Ci/m2--assuming little variation in fallout composition as a function of distance; total concentrations would have been about 20 times higher (Table 1). Yet decontamination and rehabilitation of the waste storage site, as well as the remainder of the Ch-40 site, was accomplished largely during late 1957 and early 1958 [10].
Although the external dose rate fell significantly (est. factor ~7) during the six months following the explosion because of radioactive decay and environmental migration, radiation levels close to the explosion site would still have been so high that we surmise that the rehabilitation effort was carried out at great individual cost. This effort brings to mind the dedication and heroism of those who controlled the fires at the Chernobyl reactor. Much more information about the remedial actions undertaken under such extreme conditions would be extremely beneficial.
Given the magnitude of the explosion and leaks from several HLW tanks

- 49 -
before the explosion [10], it seems plausible that other tanks contributed to radioactive releases from the site [e.g., [28]), if only in liquid form. The location of the explosion site and its current condition, e.g., an accounting for the 0.9 MCi of 90sr-90y plus 137cs that "fell out" nearby, have not been reported. Perhaps the greatest concern, however, is whether casualties occurred among those who rehabilitated the HLW storage complex after the accident. This is at least one plausible explanation for the many unconfirmed reports of casualties associated with Ch-40 (22-25).
Environmental Impacts Away from Chelyabinsk-40 A plume of finer particulates containing about 2 MCi (74 PBq) was
initially estimated to have been lofted about 1-2 km [7]; reconstructions now indicate a maximum height of l km [2, 3, 10]. Virtually all of this was deposited within 11 h along a ~300-km-long track to the north-northeast and over an area of 15,000-23,000 km2 [l, 2, 5-8, 10]. Details of the aerosol dispersal characteristics and approximate ground deposition patterns are presented in Table 2. These data include some expansion of the original depositional areas by wind dispersal, principally during 1957 and 1958. Tabulations of gamma-radiation exposure rates as a function of time and surface contamination levels are also provided in [7] but appear to be erroneous (see later discussion).
There are significant inconsistencies in Soviet data for (1) the areal extent of contamination, (2) habitation of contaminated areas, (3) the dynamics of evacuations (Table 3). The data in Table 3 are given as a function of 90sr concentration (reference), but it should be emphasized that the total initial activity deposited was 37 times greater (Table 1).
Maximum 90sr concentrations in the far-field deposition zone (i.e, LS
km from the explosion site) reportedly were either 4000 or 10,000 Ci/km2; the latter concentration probably includes the 90y daughter activity. Inclusion of 9oy daughter activity by a number of authors (e.g., [7, 17]) appears to explain some, but not all, of the inconsistencies in Table 3. Estimates of the total area contaminated range from 15,000 to 23,000 km2, in part because of uncertainties in the 0.1 Ci/km2 90sr isopleth [11].
Isopleths of 90sr concentration (90y daughter activity not included) in [11] appear to be the most comprehensive available, although the level of resolution is still very coarse and 90sr concentrations are not matched with human populations (Table 3).
Despite the uncertainties implied in Table 3, the population was

- 50 -
apparently 90sr (~2 intermediate
evacuated from Ci/km2 near part of the
23 villages contaminated with ~2-4 Ci/km2 the "extreme evacuation zone" and in the "sanitary-protective zone", and ~4 Ci/km2 90sr
at the far end of the "sanitary-protective zone"; G. N. Romanov, pers. comm., October 19, 1990). Four villages were mistakenly evacuated from areas with contamination levels 2-4 Ci/km2 90sr (G. N. Romanov, pers. comm., October 6, 1990). This explains in part why [7] indicates that only 19 villages were evacuated and (e.g., 10,180 vs 10,730) exist.
why differences in the total evacuated One of these villages, inhabited by 554
persons, was evacuated at 7-10 dafter the 1957 explosion: The apparent source of the difference between the reported figures of 1154 and 600.
Estimates of the number of people evacuated in the second wave at 250 d (~100 Ci/km2 along main axis; mean 90sr level reportedly 65 Ci/km2) appear to range from 280 to 1500, based on information in [l, 5-8, 14], but the correct number appears to be 280. Other groups, successively lower levels of 90sr contamination relocated from 250-670 d following the accident.
inhabiting areas with (~18 Ci/km2), were
A third group of 2000 persons was relocated at 250 d; a fourth group, numbering 4200, at 330 d; and, finally, a fifth group of 3100 at 670 d, according to [l, 6, 8, 14].
Data in [18] indicate that an additional 220 persons were relocated between 250-330 d (6700 vs 6480), resulting in a total evacuation of 10,854. However, we have been assured that these figures are in error (G. N. Romanov, pers. comm., October 19, 1990).
Such inconsistencies are puzzling and raise needless concerns about the quality of the information. Based on current information, it appears that a total of 10,730 persons were relocated from 23 populated places, 19 of which were inside the ~4 Ci/km2 90sr concentration isopleth of the 700-km2 "sanitary-protective zone." Of this total, 1154 people were evacuated within 7-10 d from four villages, three of which were inside the "extreme evacuation zone" shown in Fig. 2. The remaining 9580 persons, inhabiting areas with progressively lower levels of radioactivity, were moved out in stages over 250-670 d [l, 6, 8, 14]. For comparison, lllS,000 persons were rapidly evacuated from a 3600-km2 area (and from other areas of isolated heavy contamination) after the 1986 Chernobyl accident [!, 32].
Conditions in the Extreme Evacuation Zone The maximum areal 90sr concentrations in four villages (50-80
homesteads each [7]), from which 1154 inhabitants were evacuated in 7-10 d,

- 51 -
were reportedly 1000 Ci/km2 (total activity about 40,000 Ci/km2) (G. N. Romanov, pers. comm., October 19, 1990). References (1, 6, 14] place these four communities within a 20-km2 area in which the 90sr concentrations along the main axis of the deposition zone were ~1000 Ci/km2 (up to 4000 Ci/km2 according to (11]) and the mean level was 500 Ci/km2. Because only three vi 11 ages were actually inside the "extreme evacuation zone" (Fig. 2), the mean concentration of 90sr for these three sites was significantly >500 Ci/km2, probably close to 1000 Ci/km2--consistent with information from [7] and from radioecology studies [7, 35].
The reconstructed external exposure rate, 0.15 R/h at 1000 Ci/km2 90sr (11]--significantly lower than the values measured at the three villages the "extreme evacuation zone" in 1957, 0.61-1.44 R/h [7]--agrees with our independent calculations. If the instrumentation used to measure external exposure rates in 1957 was not shielded to exclude beta radiation, this could have resulted in significant errors, perhaps providing the explanation for differences between measured and calculated values.
In Berdenish, the community closest to the accident site, cattle reportedly accumulated body burdens on the order of 1-5 Ci (37-190 GBq) on the first day. By day 11, cattle and sheep had concentrations of 1-4 mCi/kg (0.037-0.15 GBq/kg) in hides or wool. Concentrations in forage grasses from all three villages averaged about 9-10 mCi/kg at 9-12 dafter the accident. The cumulative doses through day 12 from gamma radiation were 135-290 rad (1.35-2.9 Gy), but these values appear to be too high by factors of 4-10. The maximum estimated doses from beta radiation to the small intestine were 150-760 rad (1.5-7.6 Gy) by the 12th day, but are also in question (G. N. Romanov, pers. comm., October 19, 1990). Data for other livestock (goats, poultry), also provided in [7], are similarly questionable. Loss of farm animals, exhibiting symptoms of acute radiation sickness, reportedly began within 9-12 d at all three sites [7].
In a community located farther from the accident site (Russkaya Karabolka; populated point No. 4) and contaminated at a level of 4500 Ci/km2 (total activity; 0.76 mCi/kg in forage grasses), no mortality was experienced in farm an,imals over a period of 6 mo. After removal from the contaminated area, no differences from control animals were observed [7].
Despite concerns about the dosimetry and radionuclide concentration measurements in [7], one point is clear: Some farm animals within the "extreme evacuation zone" received effective whole-body or intestinal radiation doses on the order of 1000 rad (10 Gy) or more in 9-12 dafter

- 52 -
the 1957 accident, as demonstrated by the the onset of the acute gastrointestinal syndrome [32]. Thus, doses from beta radiation to intestines or other organs or tissues reported in [7] are significant underestimates. Unfortunately, we currently have no information on Soviet dosimetric methodology in any of the reports released thus far.
Radiation Effects on the Human Population The 1154 persons evacuated after the 1957 accident after 7-10 d
reportedly received average effective-radiation-dose equivalents (ERDEs) of 52 rem {0.52 Sv; 150 rem (1.5 Sv) to the digestive tract} by the time they left the area. About one-ihird of this total, 17 rem (0.17 Sv), was derived from external exposure. It should be clearly recognized that these figures contain significant uncertainties and in fact are based on dose reconstructions, not on original measurements--for obvious reasons.
Further, 554 of the 1154 individuals inhabited a village contaminated to a level 2-3 orders of magnitude lower and should have received relatively low doses (est. <l rem). The reported average values of 52 and 17 rem, respectively, thus do not necessarily provide meaningful estimates of doses for the inhabitants of the three remaining villages contaminated at about 1000 Ci/km2 90sr (40,000 Ci/km2 total activity). Recall that some farm animals in these three villages had begun to die from acute radiation sickness at about the time the human population was evacuated.
Two hundred eighty of the 2280 (or possibly 2500 [18]) individuals evacuated in the second wave (around 250 d) from the area north of Lake Uruskul' had received average ERDEs of 44 rem (14 rem from external exposure) by the time they were moved, while the remainder received ERDEs of 12 rem (3.9 rem from external exposure). These dose estimates also may not be representative for the reasons given above; doses to the inhabitants of villages evacuated from areas contaminated at <4 Ci/km2 90sr have also been included in these averages. The remaining population was relocated at intervals of 330 d (4,200 persons, but see [18]) and 670 d (3,100 persons), respectively. Individuals from these latter groups had accumulated ERDEs i5.6 rem by the time they left [l, 6, 8, 14].
Three reports stated that all of these dose estimates should be doubled because of uncertainties created by non-uniform ground deposition (see [7]) and/or exposure conditions [5, 6, 8]. What were the maximum and mean doses to the 600 persons who lived in the "extreme evacuation zone" if the average ERDEs for 1154 persons evacuated at 7-10 d were actually 100 rem (1

- 53 -
Sv) based on doses !l rem to 554 persons? Could some doses to individuals have exceeded 400 rem (4 Sv)?
The highest doses (about 100 rem or 1 Sv [7]) were supposedly delivered to soldiers who were on guard in the area after the accident, but there are significant uncertainties in these dose estimates. Medical examinations of 153 soldiers in the first month after the accident reportedly revealed no signs of acute radiation sickness; details are provided in [7].
Studies of both evacuated and resident exposed populations conducted over the past 30 years have revealed no significant radiation effects (1, 6-8, 14). However, these results should perhaps be regarded as tentative, subject to further review, because major questions exist about dosimetry (see above), methodology, and--in some cases--the suitability of control populations (see, e.g., [6, 8]).
For example, a relatively small fraction of the population evacuated during the first year was subjected to medical examinations (none before 9 months) and only qualitative conclusions about negative findings related to radiation sickness are available [7]. Reportedly, there were no skin burns [l, 5-8, 14], contrary to other reports [22, 25]. However, certain acute radiation effects would not necessarily have been evident at the time of evacuation (latent period for radiation burns) or after 9 months (healing, recovery of blood parameters; see e.g. [36]). Lymphopenia might have persisted, but this index was not measured. Although there are reasons why acute effects might not have occurred (e.g., shelter and confinement, restricted contact with contaminated surfaces, hygienic measures), we do not have enough information at this point to make such a determination.
Long-term follow-up studies likewise appear to have included only 10-25% of the 10,730 persons evacuated following the accident [l, 6-8, 14], although 1054 persons from the group evacuated at 7-10 d were included in a 25-y leukemia study [18]. Although the leukemia incidence was elevated relative to controls--in fact comparable to that in the population most highly exposed to releases via the Techa River--the result was not statistically significant owing to the small population size. A large fraction of the sampled population received very low doses (est. <l rem (<0.01 Sv); see earlier discussion}, possibly compromising the outcome.
Beyond the perimeter of the area that was evacuated (700 km2; ~2-4 Ci/km2), effects appear to have been relatively slight. For example, there was a 4-y restriction on agriculture over a 300-km2 area (contaminated at 2-4 Ci/km2), primarily in Sverdlovsk Province [l, 5].

- 54 -
Persons living in the area with measurable contamination, but outside the most highly contaminated zone (105-km long, 1000-km2 area, l2 Ci/km2 90sr; Fig. 3), for 30 y following the accident reportedly received ERDEs on the order of 1-10% above the dose from natural background radiation (1, 6, 37), well within the variability of the background dose (37).
Ecological Effects The radioactive release from the 1957 accident was the first from a
nuclear installation to produce major changes in the exposed ecosystem. Damage to pine trees was observed over the initial 30 km [7] of the deposition zone at 90sr concentrations >40 Ci/km2 [13]. In places where 90sr levels were >40 Ci/km2 and doses to tree crowns were >0.5 krad (5 Gy) during the first year of exposure, radiation damage to pines was expressed to varying degrees over the two-year period following the explosion. These effects included incomplete loss of needles, developmental defects, lowered growth, a variety of morphological and physiological aberrations, decreased viability of pollen and seeds, and phenological shifts (delays in opening of buds and flowers, etc.) [7, 13].
According to [13], all pines perished by autumn 1959 in areas with a level of contamination llBO Ci/km2 90sr, in which needles received doses of l3-4 krad (l30-40 Gy; affected area about 20 km2J. However, according to [7], pines were killed in areas contaminated with ll750 Ci/km2 90sr (3500-4000 Ci/km2 90sr-90y) in which they received doses l5 krad (l50 Gy) during fall-winter 1957-1958. This appears to be yet another example of the errors in [7] (G. N. Romanov, pers. comm., October 19, 1990). Thus, the data in [13] appear to be the best summary of ecological effects published prior to the Luxembourg seminar.
Birches were killed completely on plots with a contamination level of about 4000 Ci/km2 90sr (covering about 5 km2), where meristem buds received doses above 20 krad (200 Gy) after the accident. At lower doses, parts of the crowns were withered, underdeveloped leaves appeared, and phenological shifts were observed over a period of 4 years. Radiation damage was observed to birches over an area of 17 km2 [13].
The herbaceous vegetation was killed in its entirety at concentrations comparable to those that were required to kill birches, but the lethal doses accumulated at or near the soil surface at such concentrations were much greater (150-200 krad (1500-2000 Gy); area about 5 km2}. Partial destruction of the herbaceous cover occurred at 90sr concentrations ll500

- 55 -
Ci/km2 (area about 15 km2; absorbed doses to renewal buds of perennials located near the soil surface ~20 krad (~200 Gy)). At 90sr levels below 1000 Ci/km2, mature plants did not die, but seeds experienced losses in germination and morphological changes were observed over a period of 2-3 years. Secondary ecological effects also occurred [13].
Mixed pine-birch stands in which pines received absorbed doses to the crowns in excess of 4 krad (40 Gy) were transformed to pure birch stands [7, 13]. In these altered stands, the herbaceous cover expanded greatly and "Il'enko (39] established that deposition of 90sr under the forest canopy in concentrations of [600 to 3400 Ci/km2 90sr-90y] did not produce noticeable effects on the life spans of small rodents" [38].
These effects on life spans of small rodents clearly do not apply to the fall-winter period following the accident, during which all birds and mammals could have received lethal doses from continuous residence in areas with 90sr levels ~1000 Ci/km2. Significant early effects on populations of certain invertebrates inhabiting the upper soil or forest litter layers (e.g., earthworms, myriapods, and mites) were observed in areas contaminated above 100 Ci/km2. These effects persisted for many years in areas with concentrations llOOO Ci/km2 where areas were large enough (several km2 or more) that recolonization from less-contaminated areas could not overcome the effects of radiation exposure [13].
The results reported by Il'enko illustrate that most effects were temporary because of the potential for migration of animals from areas of lower or no contamination to replenish those lost during the "acute" exposure phase following the accident. This was especially true for larger mammals (roe deer, elk, wolves, lynx, hares). In the case of the latter, however, other factors included the elimination of hunting in a part of the contaminated area, but, more importantly, the increase in available habitat associated with removal of land from agriculture and other disturbances (habitation, fishing, tree cutting, foraging for wild foods) [7, 13].
Some sublethal effects were noted (e.g., increased radioresistance in small rodents from areas of 90sr concentrations ~100 Ci/km2 [40], increased frequency of mutations in plants living in areas with 90sr levels 1-10 Ci/km2 and in field mice from areas with 90sr levels 10-100 Ci/km2 [13]), but these effects would not have been expected to play a major role in determining the survival and fitness of exposed populations.
At least 13 of the 30 lakes within the deposition zone from the 1957 accident were studied, although one (L. Uruskul': Lake B in [7]; Lake

- 56 -
Number 2 in [34]) seems to have been a focal point (19]. Three of four communities (points 1, 2, and 3 in [7]) evacuated within 7-10 dafter the 1957 accident were located on the shores of the two lakes (Berdenish and Uruskul'; Fig. 2) that received the highest levels of aerosol deposition (about 800 Ci/km2 90sr) [7, 35]. The remaining lakes within the deposition zone were contaminated at levels ~100 times lower [7]. The principal focus of these radioecological studies was environmental transport, partitioning, and food-chain behavior of radionuclides (particularly 90sr; see references in [19]). Major findings on the environmental behavior of radionuclides in aquatic and terrestrial systems contaminated by the 1957 accident are summarized in [2, 7, 12].
Fish in the most heavily contaminated lakes received doses of 4 krad (40 Gy) from exposure to radioactivity in the water column during the fall-winter period following the accident. However, peak radionuclide concentrations (and dose rates) were rapidly reduced by incorporation of radioactive materials into the bottom sediments. The most vulnerable species were herbivorous fishes such as carp and goldfish, which spend much of their existence near the sediment-water interface. Doses to eggs of these species exceeded lethal levels (~l krad (~10 Gy)} during the winter period of 1957-58 and within 2-3 y resulted in diminished reproduction. However, by 1960, no ecological effects on carp or goldfish were observable. One study conducted about 15 y after the accident detected no effects on growth rate of pike (Esox lucius) in one of the lakes at a dose rate of 0.45 rad/d (4.5 mGy/d) [41]. Effects on plankton, invertebrates, or aquatic plants were reportedly not detected [13].
Remedial Measures Protective measures implemented on the contaminated area may be divided
into three basic groups: (1) extreme protective measures (evacuation of the population from the
most highly contaminated part of a "sanitary-protective zone"); (2) measures to ensure the long-term safety of the resident population
of the contaminated area (evacuations from the remainder of and restrictions on access to the sanitary-protective zone, extensive monitoring system for food products, controls on consumption of foods produced in areas of contamination); and
(3) measures to ensure the safety of agricultural products from the contaminated area (controlled agricultural production through special

- 57 -
state-run farm system; limits on production of foods and forest products as a function of type, areal contamination level, and time; controls on exports to other areas) [7, 15, 16].
Initially, restrictions on use of contaminated water bodies (harvesting fish, use of aquatic plants as feed for domestic livestock) were imposed in areas with 90sr levels 12 Ci/km2, but, by 1970, the incorporation of 90sr by bottom sediments was sufficient to permit normal fish-culture practices in lakes on the periphery of this area [15].
Decontamination of agricultural and industrial areas, as well as populated points, was largely accomplished between 1-1.5 y after the accident by a mechanized detachment created for this purpose [14, 16]. Plowing, using special soil-working equipment and plows, was practiced in agricultural areas (20,000 ha in 1958-1959; deep plowing to >50 cm-over 6200 ha in 1960-1961 [l, 8]) to reduce the level of contamination in the surface layer (root zone). Removal and disposal of the contaminated surface layer was also carried out, principally in industrial areas and populated locations, utilizing special soil removal mechanisms and vehicles (e.g., road-scrapers [42]). Chemical treatments of the soil were explored, in combination with tillage practices, but relatively little was known about their efficacy and usage [42, 43] prior to the Luxembourg seminar. Information on in situ remedial measures, particularly for environmental decontamination or contamination control, is still incomplete.
At the Chelyabinsk-40 complex itself, the principal methods employed in terrestrial areas included: (1) covering contaminated soil with clean soil and (2) removal and burial of the contaminated layer of soil. Altogether 3.5 x 10⁵ m3 of contaminated soil were removed and 4.0 X 10⁵ m3 of clean soil used to cover contaminated areas. Decontamination solutions were used for washing asphalt roads and some areas were decontaminated using road-building equipment (e.g., scrapers) with special shielding. However, significant areas of contamination still remain [17].
The most highly contaminated (170-km2) portion of the 1957 deposition zone is still unsuitable for human habitation, agriculture, or forestry. It is now a radioecological reserve (with accompanying research station), set aside for long-term studies of the cycling and effects of radionuclides (1, 44). A major work entitled "Guide to the Planning and Implementation of Measures Designed to Reduce the Negative Radiological and Radioecological Consequences of Accidents Going Beyond the Design Basis Accident and Involving Releases of Radioactivity to the Environment" is

- 58 -
reportedly nearing completion by the staff of the environmental research station [44; G. N. Romanov, pers. comm., October 19, 1990].
The most massive remedial action effort in evidence at the Ch-40 site is a major hydrologic diversion system consisting of bypass canals and a cascade of 4 reservoirs (total surface area 65 km2 [17]) (Fig. 2). The first reservoir was completed in 1951 and the fourth in 1964, well after the 1957 accident and the initiation of waste disposal into L. Karachay.
The bypass canal through L. Berdenish (Fig. 2) does not appear on the Soviet map of the hydrologic isolation complex provided in [17] and the dams on the first two reservoirs downstream from L. Kyzyltash (Fig. 2) are not shown on our 1973 map of this area. This suggests that significant changes were made in the design and operation of this system over time, even though hydrologic isolation of early waste discharges to the Techa River was the principal driving force. Further, there is a hydrologic connection between L. Karachay and the third reservoir in the cascade through another small water body (see (19, 45] for potential background on the latter) (Fig. 2). Given the existence of this hydrologic connection, the potential for additional liquid releases from L. Karachay and/or this smaller water body during 1953-1964 seems plausible on the basis of current information. Thus, it appears that the hydrologic isolation system may have been designed or modified to serve multiple purposes--including remediation of contamination from the 1957 accident. More information on its purposes and efficacy could be very useful.
Observations of artificially elevated calcium concentrations (110-226 mg/L [46, 47]) in two of the reservoirs from radioecology studies (19) raise the question whether these are related to contamination control and/or remediation [43]. In situ decontamination of the isolated systems (i.e., remobilization of sorbed 90sr by increasing the concentration of its chemical analogue calcium in the water column) is one possibility, seemingly supported by the very low sediment-water concentration ratios for 90sr in the third and fourth reservoirs in the cascade (17). Further, the reservoir cascade only accounts for about 50% of the 90sr and 137cs reportedly intercepted through 1952 (about 0.75 MCi [17, 18]; 38-y decay), and there may have been later additions, as described above. More information on Soviet experience in this area could be extremely valuable.
CONCLUSIONS AND RECOMMENDATIONS
A complete assessment of the environmental impact of the radionuclides

- 59 -
released by the 1957 accident at Ch-40 must await (1) elimination of seeming inconsistencies in information, (2) more detailed information in several key areas, and (3) better understanding of the nature of and interactions among all significant radioactive releases from Ch-40. Thus, we need answers to the following questions:
(1) How and when will we get an authoritative, internally consistent set of complete information on the 1957 accident, sufficient to address the specific concerns and questions raised by our review? Why was material from reference [7] so widely circulated, given its obvious errors and inconsistencies? When will we have a map of the contamination zone showing appropriate details on radioactivity and population centers, including evacuation dates, radioecological, and topographic features?
(2) If there were no casualties among evacuees after the 1957 accident, why are particularly burns, effects on workers
there so many reports of accident-related casualties, associated with Ch-40? Were there serious radiation who rehabilitated the HLW explosion site? Were there
other causes, including reactor accidents--as yet unreported? Was medical treatment for Ch-40 radiation workers significant enough to have been misinterpreted as the result of an accident(s)?
(3) What was the history of all significant radioactive waste operations and accidents at Ch-40 leading to environmental contamination? To what extent did accidental releases contribute to the need for the massive hydrologic isolation system? ls this system being decontaminated?
(4) What is the status of the comprehensive Soviet report on reducing the consequences of radiation accidents? Will this report also cover releases to the Techa River and from the Karachay reservoir?
We expect that the continuing declassification of Soviet information could in time result in important new revelations about releases of radioactivity from Ch-40 and their consequences. The task at hand is to obtain timely answers to the questions we have posed. We do not think that this task can be accomplished without access to Ch-40 for scientists both knowledgable and free enough to explore its many aspects in order to lay to rest major concerns about the events of 30-odd years ago, as well as their consequences. As scientists involved in evaluating hazards associated with radioactive releases to the biosphere, we continue to urge that all pertinent information on Ch-40 be shared with others concerned with achieving such objectives.

- 60 -
ACKNOWLEDGEMENTS We thank Alexander Shlyakhter, Richard Wilson, Zhores Medvedev,
Gennadiy Polikarpov, and Frank Parker for providing important information and/or reference materials. We also thank Zhores Medvedev for sharing some of his insights on reference [7] with us. We are also indebted to B. Gordon Blaylock, F. Owen Hoffman, and Brian Spalding of the Environmental Sciences Division, Oak Ridge National Laboratory (ORNL), for technical reviews and discussions of the manuscript and presentation materials. We particularly thank G. N. Romanov, director of the Chelyabinsk-65 scientific research station located near Ch-40, for reviewing the manuscript and for useful scientific discussions during the Luxembourg seminar. The ORNL is operated by Martin Marietta Energy Systems, Inc., under contract DE-AC05-840R21400 with the U.S. Department of Energy. Publication No. 3592, Environmental Sciences Division, ORNL.
REFERENCES
l. Report on a Radiological Accident in the Southern Urals on 29 September 1987, INFCIRC/368 [ Intern at i ona l Atomic Energy Agency (IAEA), Vienna, 28 July 1989].
2. I. A. Ternovskiy, G. N. Romanov, E. A. Federov, E. N. Teverovskiy, Yu. B. Kholina, IAEA-SM-316/55.3 (89-12473, Engl. transl.), preprint from International Symposium on Recovery Operations in the Event of a Nuclear Accident or Radiological Emergency, 6-10 November, 1989, IAEA, Vienna.
3. Hearing on 1957 Nuclear Accident Reported, Moscow Domestic Service, 1200 GMT, 25 July 1989 [Engl. transl., Foreign Broadcast Information Service (FBIS)-SOV-89-142, National Affairs, 40, 26 July 1989); partial coverage in J. Perera, R. Milne, New Sci. 123 (1676), 21 (1989).
4. A. lllesh, Izvestia, Moscow, First Ed., 13 July 1989, p. 6, (Engl. transl., FBIS-SOV-89-152, National Affairs, 9 August 1989, 75); Tass, Moscow, 1101 GMT, 17 July 1989 (FBIS-SOV-B9-136, National Affairs, 101, 18 July 1989).
5. B. V. Nikipelov, !AEA-SM-316/55 (89-12472, Engl. transl.), preprint from International Symposium on Recovery Operations in the Event of a Nuclear Accident or Radiological Emergency, 6-10 November, 1989, IAEA, Vienna.

- 61 -
6. L. A. Buldakov et .1!.l.., IAEA-SM-316/55.2 (89-12474, Engl. transl.),
ibid. 7. A. I. Burnazyan (ed.), Results of Studies and Experience in
Elimination of the Consequences of Accidental Contamination of a Territory with the Products of Uranium Fission (Energoatomizdat, Moscow, 1990) (in Russian); reprinting of a previously classified 1974 Soviet report. Excerpts have been published in Energiya, starting with the January 1990 issue [No. 1, 14; No. 2, 51]. Its 145 pages contain much detailed information currently unavailable elsewhere, but also also many serious errors and inconsistencies (see text).
8. B. V. Nikipelov et al., Sov. At. Energy, 67, 569, 1990. 9. B. V. Nikipelov, A. F. Lizlov, and N. A. Koshurnikova, Priroda, No. 2,
30, 1990 (English translation). 10. B. V. Nikipelov and E. G. Drozhko, Priroda, ~. 48, 1990 (in
Russian). · 11. G. N. Romanov and A. C. Voronov, Priroda, No. 5, 50, 1990 (in
Russian). 12. G. N. Romanov, D. A. Spirin, and R. M. Aleksakhin, Priroda, No. 5, 53,
1990 (in Russian). 13. D. A. Spirin, E. G. Smtrnov, L. I. Suvorova, and F. A. Tikhomirov,
Priroda, No. 5, 58, 1990 (in Russian). 14. G. N. Romanov, L.A. Buldakov, and V. L. Shvedov, Priroda, No. 5, 63,
1990 (in Russian). 15. G. N. Romanov, I. G. Teplyakov, and B. V. Shlov, Priroda, No. 5, 67,
1990 (in Russian). 16. G. N. Romanov, E. G. Drozhko, and B. V. Nikipelov, Priroda, No. 5, 73,
1990 (in Russian). 17. B. V. Nikipelov, A. S. Nikiforov, 0. L. Kedrovsky, M. V. Strakhov, and
E. G. Drozhko, Practical rehabilitation of territories contaminated as a result of implementation of nuclear material production defense programs (draft chapter for book to be published by VNIPipromtechnologii, Moscow, in press).
18. M. M. Kosenko, M. 0. Degteva, and N. A. Petrushova, Evaluation of the risk of radiation-induced leukemias based on analysis of the consequences of irradiation of a population in the South Urals, Institute of Biophysics of the Ministry of Health of the U.S.S.R., 1990 (in Russian); also see L. R. Anspaugh, Foreign Trip Report (Lawrence Livermore National Laboratory, 9 July 1990), p. 7.

- 62 -
19. J. R. Trabalka, L. D. Eyman, S. !. Auerbach, Science 209, ·345 (1980); for additional details on some topics, also see J. R. Trabalka, L. D. Eyman, S. I. Auerbach, Analysis of the 1957-58 Soviet Nuclear Accident (ORNL-5613, Oak Ridge National Laboratory, Oak Ridge, Tenn., 1979).
20. F. L. Parker, Search of the Russian Medical Literature for the Descriptions of the Medical Consequences of the Kyshtym "Accident (ONWI-424, NTIS, Springfield, Virginia, 1983), p. 18; J. E. Oberg, Uncovering Soviet Disasters (Random House, New York, 1988).
21. Fact Sheet: Kyshtym Complex and Soviet Nuclear Materials Production (Natural Resources Defense Council, Washington, DC, August 1989), pp. 1-3; C. Paine, New Sci. lZ1 (1674), 22 (1989).
22. Z. A. Medvedev, Nuclear Disaster in the Urals (Norton, New York, 1979).
23. J. R. Trabalka, L. D. Eyman, S. I. Auerbach, Science 217, 198 (1982); also see D. M. Soran and D. B. Stillman, An Analysis of the Alleged Kyshtym Disaster (LA-9217-MS, Los Alamos National Laboratory, Los Alamos, New Mexico, 1982), p. 25.
24. T. Provance, Visit to Moscow, U.S.S.R .• Sept. 18-23, 1978 (American Friends Service Committee, Philadelphia, Pennsylvania, 23 October 1978), p. 7.
25. Boletin - Comision Naciona) De Energia Atomica Reoublica Argentina, No. 8, 10 (August 1958)--report on based on article in Argentinisches Tageblatt, 29 July 1958; Die Presse, Vienna, 17 March 1959, p. 1.
26. Rossiyskaya Federatzia, Ural (Komar, Moscow, 1969) (in Russian). 27. F. Ya. Rovinskiy, Soy. At. Energy l!l, 480 (1965); ibid., ~
Radiochem. 11, 310 (1967); Z. M. Balabanova, Izy. Vses. Nauchno Issled. Inst. Ozern. Rechn. Rybn. Khoz. 39, 93 (1957).
28. Nucl. News, January 1990, p.74. 29. Ibid., p.18.
30. R. J. Smith, Washington Post, 10 July 1989, p. 18. 31. Yu. D. Korsakov, I. Ya. Poplyko, and I. A. Ternovskiy, in Handling of
Radiation Accidents (IAEA, Vienna, 1969), pp. 281-285 (in Russian). 32. United Nations Scientific Committee on the Effects of Atomic
Radiation, Sources, Effects and Risks of Ionizing Radiation (United Nations, New York, 1988).
33. F. Ya. Rovinskiy, in Global Contamination of the Environment (Gidrometeoizdat, Moscow, 1967), pp. 58-63; F. Ya. Rovinskiy, ibid., pp. 64-68).

- 63 -
34. D. !. Semenov, in Metabolism of Radjonuclides in the Animal Organism (AEC-tr-7169, NTIS, Springfield, Va., 1970) [English translation of Tr. Inst. Biol. Akad. Nauk SSSR Ural Fil. No. 46 (1966)), pp. 15-32.
35. F. Ya. Rovinskiy, Sov. At. Energy .li!., 480 (1965). 36. Operation Castle-Final Report Project 4.1, Study of Human Beings
Accidentally Exposed to Significant Fallout Radiation (WT-923, AEC Technical Information Service, Oak Ridge, Tenn., 1954).
37. Exposure of the Population in the United States and Canada from Natural Background Radiation, Report No. 94 (National Council on Radiation Protection and Measurements, Bethesda, MD, 1987).
38. F. A. Tikhomirov, R. M. Aleksakhin, and Ye. A. Fedorov, in Proceedings of the 4th International Conference on the Peaceful Uses of Atomic Energy (United Nations, Geneva, and IAEA, Vienna, 1972), vol. 11., pp. 675-688.
39. A. I. Il'enko, Zool. Zh. 47, 1695 (1968). 40. A. I. I1 'enko, S. I. Isaev, and I. A. Ryabtsev, Radiobiology (USSR)
l!, 126 (1974). 41. G. B. Pitkyanen, 1/. l. Shvedov, and N. G. Safronova, in
Radioecological Problems of Atomjc Power Plant Cooling-Reservoirs (Urals Scientific Center, Academy of Sciences of the USSR, Sverdlovsk, 1978), pp. 56-60 (in Russian).
42. Y. A. Polyakov, RadioecoloQV and Decontamination of Soils (Atomizdat, Moscow, 1970) (In Russian).
43. J. R. Traba1ka, Russian experience, in Environmental Decontamination, (CONF-791234, N.T.I.S., Springfield, Virginia, 1981), pp. 3-8.
44. V. Chertkov, Pravda, Moscow, Second Ed., 17 July 1989, p. l (Engl. transl., FBIS-SOl/-89-136, National Affairs, 102, 18 July 1989).
45. D. !. Il'in, A. I. Petrova, and N. Ya. Chepkasova, Sov. At. Energy~. 890 (1958).
46. A. I. Il'enko and I. A. Ryabtsev, in Radioecological Problems of Atomic Power Plant Cooling-Reservoirs (Urals Scientific Center, Academy of Sciences of the USSR, Sverdlovsk, 1978), pp. 81-85 and 86-94 {in Russian).
47. S. P. Peshkov, I. A. Shekhanova, G. N. Romanov, B. S. Prister, and G. P. Sheyin, in Radioecologica] Problems of Atomic Power Plant Cooling-Reservoirs (Urals Scientific Center, Academy of Sciences of the USSR, Sverdlovsk, 1978), pp. 47-55 (in Russian).

- 64 -
61°
so•
Iii. ARGAYASH @
KARABASH
ORNL-DWG 90M-11632
62° MILES
0
0
10
I
= HIGHWAY .,.._RAILROAD
20
I I
25 km
30
I I
50
-· PROVINCE BOUNDARY $ ~ CITIES (<10,000 POP.) 1111 w CITIES (10,000-100,000 POP.) A- CITIES (100,000-750,000 POP.) !l!ll. CITIES (>750,000 POP.) C!I LAKES
Figure 1. Map based on pre-accident geographic features (redrawn from (18]) of geographic region in which a Soviet catastrophe involving high-level nuclear wastes occurred in 1957. Area fully enclosed by heavy dashed line indicates zones which exhibited extensive changes (in population centers and surface hydrologic features) on later maps. Finer dashed lines 2epresent the re2orted extent 2f ;ae "sanitary-protective zone" {700-km ·area; ~4 Ci/km (0.15 TBq/km ) Sr} which was established by Soviet authorities after this accident and from which the population was relocated (taken from Fig. 23 in [7]).

10 km
- 65 -
II CITY OR MAN-MADE INSTALLATION
~ LAKE OR RESERVOIR
I l)AM
--i.:.t:: CANAL
~ RIVER OF! STREAM
,,... .,~1"· ··''· MARSH
;C:';;'J:.°t,JJi WET SANOS .:.:,::_i:;iai;~·
Figure 2. Reservoir-canal system constructed to reduce the hydrologic transport of radioactive materials down the Techa River system. Heavy dashed contour line repr2sents the r2po95ed extent of the "extreme evacuation zone" {~l,000 Ci/km ·· (37 TBq/km ) Sr} within the "sanitary-protective zone" which was established by Soviet authorities after the 1957 nuclear waste explosion, and from which the.· civilian population was evacuated within 7-10 d (from fig. 23 in [7]).

t I .,svE
RD
LOV
SK
BO
GD
AN
OV
ICH
@
~
A
"j) £. ~
MA
MIN
SK
OY
E C
l .
SIN
AR
A@
'
EIA
RG
AY
AS
H
@'M
US
L Y
UM
OV
O
~@
BR
OD
OK
AL
MA
K
0 25
50
I I
I km
OR
NL
DW
G 9
0M
134
51
TY
UM
EN
'
•
Fig
ure
3.
Isop
leth
s o
l 00S
r con
cent
ratio
n {C
i/km
2 (0
.037
TB
q/km
2 )} r
esul
ting
from
hig
h-le
vel n
ucle
ar w
aste
exp
losi
on
in J
957
(15,
000-
23,0
00 k
m2
at ~
0.1
Cl/k
m2 )
an
d a
noth
er r
elea
se i
n 19
67 t
hat
cont
amin
ated
an
addi
tiona
l 18
00 k
m2
(nol
e la
rge
bu
lge
at
the
sout
hern
end
ol l
he
con
tam
inat
ion
zone
).
• .
I
°' °'

- 67 -
Table 1. Characteristics of the 1957 high-level waste explosion and the materials releaseda
Source
250 m3 of high-level liquid w1stes in 300-m stainless-b steel tank
Radionuclide
89sr
90sr + 90y
95zr + 95Nb
106Ru + 106Rh
137cs
144ce + 144pr
Remainder
90sr-90y:137cs Activity ratio
Release mechanism
Chemical explosion following failure of tank cooling system: Ignition of acetate-nitrate concentrate
Energy of explosion
Equal to about 75 t of TNT; soluble nitrates: 70-80 t
Radioactivity releasedc
Time of occurrence
16:20 local time,b 29 September 1957
2 x 10⁷ Ci (740 PBq) of mixed fission products; 10% was more widely dispersed in aerosol form
Contribution to total activity of the release (%)
References [l, 5, 8, 10] Table 18 in [7]
Traces 2.6
5.4 7.0
24.9 22
3.7 3.5
0.036 1
66 64
Traces <12
150:1 7: l
asource: Reference [7], except where noted.
bsource: Reference [10], but also see references [2, 8].
csources: References [2, 3, 7, 8, 10]).

- 68 -
Table 2. Characteristics of the atmospheric release and its dispersala
Winds
Atmospheric conditions Direction Altitude (m) Velocity (m/s)
Relatively stable; no precipitation
Plume Dispersal Characteristics
Effective conditions
Southwesterly, 10 changing to easterly at higher levels
Initial
Height Diameter
2 km?
to 12
500
Velocity
35 km/h
5
10
Direction
Northnortheast
90sr concentrationc (Ci/km2 (0.037 TBq/km2)}
Ground deposition-population patternsd >1000 >100 10-100 1-10 0.1-1.0
Area (km2) 20 200 200 1000 21,600
Number of population centers 3 3 10 58 146
1957 population 1100 1500 3500 12,000 253,000
asource: Reference [7], except where noted.
bsased on recalculations [2, 3, 8, 9]; given as 1.9 km in [7].
cApparently 90sr + 90y,
dMaxima along north-northeast axis, perpendicular to axis approximating a contaminated zone southeast of axis 2 to 3
but with assymetric distribution skewed Gaussian curve (area of times that northwest of axis).

- 69 -
Table 3. Reported areas and populations of the contaminated region
90sr concentrationa {Ci/km2 (0.037 TBq/km2)}
1957 population
International Atomic Energy Agency reports and others
~.100
~1000
15,000
1000
120
20
270,000
10,180-10,854 (Evacuated zone-23 communities)
280-2100
600-1154
Declassified 1974 Soviet report by Burnazyan et al.
~0.1
?.l
~4
~10
~100
~1000
~10,000
23,000
1400
700
400
200
20
0.5-2
May 1990 articles in Soviet journal Priroda
0.1-2
2-20
20-100
100-1000
1000-4000
15,000-23,000
700
600
280
100
17
270,000
17 ,000
10,000 (Evacuated zone-19 communities)
5000
1500
1100
?
10,730 (Evacuated zone-23 communities)
aconcentrations reported in [7] appear to be 90sr + 90y_
References
[l, 5, 6, 8]
[l, 5, 6, 8, 18]
[l, 5, 6, BJ
[I, 5, 6, BJ
[7]
[11)
[ 14]
[11]
[11)
[11)
[11]

- 70 -

- 71 -
The Chernobyl Source Term
S.T. BELYAYEV, A.A. BOROVOY, V.F. DEMIN, A.A. RIMSKY-KORSAKOV, A.N. KHERUVIMOV
I.V. Kurchatov Institute of Atomic Energy, Complex Expedition, USSR

- 72 -
ABSTRACT
The report contains the results of recent estimates of the quantity and composition of the radionucl ides contained in Chernobyl Reactor No 4 prior to the accident. Different approaches to determining the release of radioactivity from the reactor are discussed, with particular reference to the release of fine fuel particles and of caesium-137. Data on the release of radioactivity after completion of the containment structure ("sarcophagus") are included.
The report also examines typical radioactive release effects and discusses the effectiveness of methods for investigating contaminated areas.

- 73 -
1. Data on the amount and composition of the radioactivity released during the Chernobyl accident were summarized for the first time in the report presented to the IAEA post-accident review meeting in August 1986. 1 Discussion and refinement of the data have continued since that time (see 2, 3, 4 etc.).
This paper also sets out to discuss this question and to make a more precise estimate of the amount of radioactive products released. For this the authors used the fol lowing new information:
improved calculations of the radionuclide content of the fuel in Reactor No 4 prior to the accident (1989-1990) 5; analyses of soi I contamination (1986); data on the condition of the nuclear fuel left in the destroyed reactor (1988-1990) 6, 7; data on the escape of radioactivity from the containment structure ("sarcophagus") around Reactor No 4 (1987-1990) 8.
2. The No 4 reactor at Chernobyl began operating in December 1983 and by 26 Apri I 1986 had operated for 865 calendar days (715 effective days). The fue I - enriched uranium dioxide - was contained in 1 659 fuel elements, giving a total charge of 190.2 tonnes of uranium. Average core burn-up was 11 MWd/kg U.
Calculation of the radionuclide inventory in the core was done on an element-by-element basis. Firstly the relationship of a specific quantity of particular isotopes to burn-up was calculated for a single fuel element. Then, on the basis of burn-up data, the quantity of isotopes produced in each fuel element was calculated.
Table 1 contains data on the core's inventory of the most important, long-I ived and biologically significant radionucl ides.
Table 1
Radionuclide Half-I ife Mass (kg) Activity Bq
Strontium-90 29 .12 years 4.3 ( +1) 2.2 ( 1 )
Ruthenium-106 368.2 days 6.9 8.6 ( 17)
Antimony-125 2.77 years 5. 1 (-1) 1 .9 ( 16)
Caesium-134 2.07 years 3.2 1.5 C 17)
Caeslum-137 30.17 years 8.1 (+1) 2.6 (17)
Cerium-144 284.3 days 3.3 ( +1) 3.9 ( 18)
Plutonium-238 86.4 years 1 .5 9.4 ( 14)
Plutonium-239 24 110 years 4. 12 (+2) 9.5 (15)
Plutonium-240 6 553 years 1 . 76 C +2) 1.5 ( 15)
Plutonium-241 14.7 years 4.9 ( +1) 1 .8 C 17)
Plutonium-242 3.76 (5) years 1. 4 (+1) 2. 1 (12)
Americium-241 433 years 1 . 1 1. 4 ( 14)
Americium-243 7.38 (3) years 7.3 (-1) 5.4 ( 1 2)
Curium-242 162.8 days 2.6 (-1) 3. 1 C 16)
Curi um-244 18. 11 years 6.0 (-2) 1 . 8 ( 1 4)
Figures in brackets to be understood as fol lows: 3.76 (5) years
MCi
5.9 2.3 ( +1) 5.2 (-1) 4. 1 7.0 1. 1 (2)
2.5 (-2) 2.6 (-2) 4.0 (-2) 5.0 5.6 (-5)
3.7 (-3) 1 . 5 (-4) 8.3 (-1)
4.8 (-3)
3.76 x 10⁵

- 74 -
The alpha emitters in this table are the isotopes of plutonium (238, 239,
240), americium (241, 243) and curium (242, 244).
Immediately after the accident cur ium-242 was the determining factor
for alpha activity in the nuclear fuel, whereas plutonium isotopes are
now predominant. However, as a result of the beta decay of 241pu
(half-I ife 14.7 years), 241Am (half-I ife 433 years) is beginning to
accumulate, and
approximately 50%
after ten years its
of total alpha activity
activity
(Fig. 1).
The beta and gamma emitters (apart from 241pu)
emitter only), 134cs, 137cs and 144ce.
strontium have a half-I ife of approximately 30 years
decreases by an order of magnitude every 100 years.
wi 11 account for
were 90sr (beta
Caesium-137 and
and their activity
3. Three approaches were used for determining the amount and composition
of radioactive releases. The first used data on release dynamics,
gathered during the active phase of the accident (26 Apri I - 6 June
1986) and afterwards. It has already been stated several times that,
for many objective reasons, using this method to assess releases was
very inaccurate. This is clear from the wel I-known diagram (Fig. 2)
presenting the results contained in 1. Attempts are currently being
made to reconstruct and reanalyse the data, but the work is not yet
complete. One of the most important conclusions from these
measurements is that at al I stages of the accident the release of
radioactivity was in the form of finely dispersed fuel particles, with
the exception of inert gases and a number of highly volatile substances
(iodine, caesium, tellurium and ruthenium). Initial results from the
analysis of air samples taken around the damaged reactor had already
shown this.
4. It was precisely this conclusion which led to relatively rapid success
with the second method - assessing releases by investigating soi I
contamination.
Wide-scale measurements of soi I, water and air contamination began
during the first days fol lowing the accident. It must be pointed out
that the task of detecting and quantifying radionuclide contamination
over an area of tens of thousands of square kilometres was extremely
laborious. For example, quantifying the fallout of plutonium or
stront ium-90 isotopes was done by taking soi I samples and conducting
comp I icated and time-consuming radiochemical analyses.
The stable relationship between the quantity of radionucl ides in the
fuel released from the No 4 reactor and between alpha and gamma
activity made for a simple solution to the problem of quantifying
environmental contamination by various biologically significant
radionucl ides.

- 75 -
For example, plutonium alpha activity was determined correlation with cerium gamma activity using the formula:
through
where A(Pu) total activity of 238pu, 239pu and 240pu; Kc u correlation coefficient, and A(144ce) u 144ce activity.
On 26 Apri I 1986 the Kc value was approximately 9 x 10⁻⁴.
Since the Kc value depended to a relatively smal I extent on the scale of fuel burn-up, and fuel element burn-up differed only slightly from the average, the correlation coefficient for al I the reactor fuel may be considered constant (see Fig. 3).
The methods used to assess fuel contamination in the various areas were as fol lows:
firstly, measurement of the gamma dose over the areas affected using aerial gamma surveying (a first, rough approximation using the relationship of the dose rate to the amount of fuel);
secondly, analysis of soil samples using semiconductor gamma spectrometers (more precise measurements using the correlation coefficient for cerium-144);
finally, painstaking radiochemical analyses (verification of the Kc coefficient for a given area).
The report in 1 gave information on the amount of radioactive substances released from Reactor No 4.
The basic conclusions of the report were as fol lows:
almost all radioactive inert gases and a significant amount of iodine were released from the reactor;
13 (±7)% of the caesium was released, as was
3 (±1.5)% of the fuel containing fission products and transuranic elements.
The I. V. Kurchatov Institute of Atomic Energy compiled the pre I iminary estimates of fuel distribution given in Fig. 4.
Between August and November 1986 a series of thermal measurements was taken on the surface of (and around) the ruined reactor. of the actual amount of heat escaping with estimates conclusion that no less than 90% of the fuel was st i 11
containment structure.
Comparisons led to the inside the

- 76 -
The amount of fuel released has been calculated more exactly over the past few years, and the debate on this issue can be considered closed. Results calculated on the basis of a data bank, containing information on tens of thousands of soi I samples, now give the amount of fuel released as 3.5 (±0.5)%.
Again it must be stressed that what is being discussed here is not the fuel released from the active zone or the reactor cavity (and which is sti 11 located within the No 4 reactor unit), but only that proportion outside the containment structure. Incorrect interpretation of what was meant by "re I ease" has a I ready I ed on more than one occasion to unfounded rumours and statements.
6. A third method of assessing the releases is to study the amount and composition of the fuel remaining within the containment structure enclosing Reactor No 4. This became possible only after a great deal of work by the Kurchatov lnstitute's Complex Expedition, which enabled the main fuel masses to be assessed 9. Most investigative work to date has been done on the fuel-containing masses situated beneath the reactor. Most of this is a kind of lava - consisting of melted and resolidified Si02 (60-80%), traces of Mg, Fe and Al, and up to 20% nuclear fuel (Fig. 5). The fuel released into the central reactor hal I and buried under the cascade wal I of the containment structure has received less attention (Fig. 6).
As things stand at the moment the proportions of released and remaining fue I can be assessed to within a few percentage points on I y. It is possible, however, to make some assessments concerning the release of such a biologically significant radionuclide as caesium-137.
7. Estimates of caesium-137 release differ significantly. The report in 1, for example, gives a figure of 13 ±7%.
The experts concluded 10 that total 137cs release amounted to 1 .9 MCI, i.e. 27% of the total amount.
An article in "Pravda", based on detailed gives a figure of 15% 11 while 5 between 1.5 and 2 MCI or 21-28%.
maps of caesium-137 fallout, 4 and 12 give figures of
Table 2 shows the caesium content in the fuel-containing masses on the lower levels of Reactor No 4, where some 75% of the fuel is located.
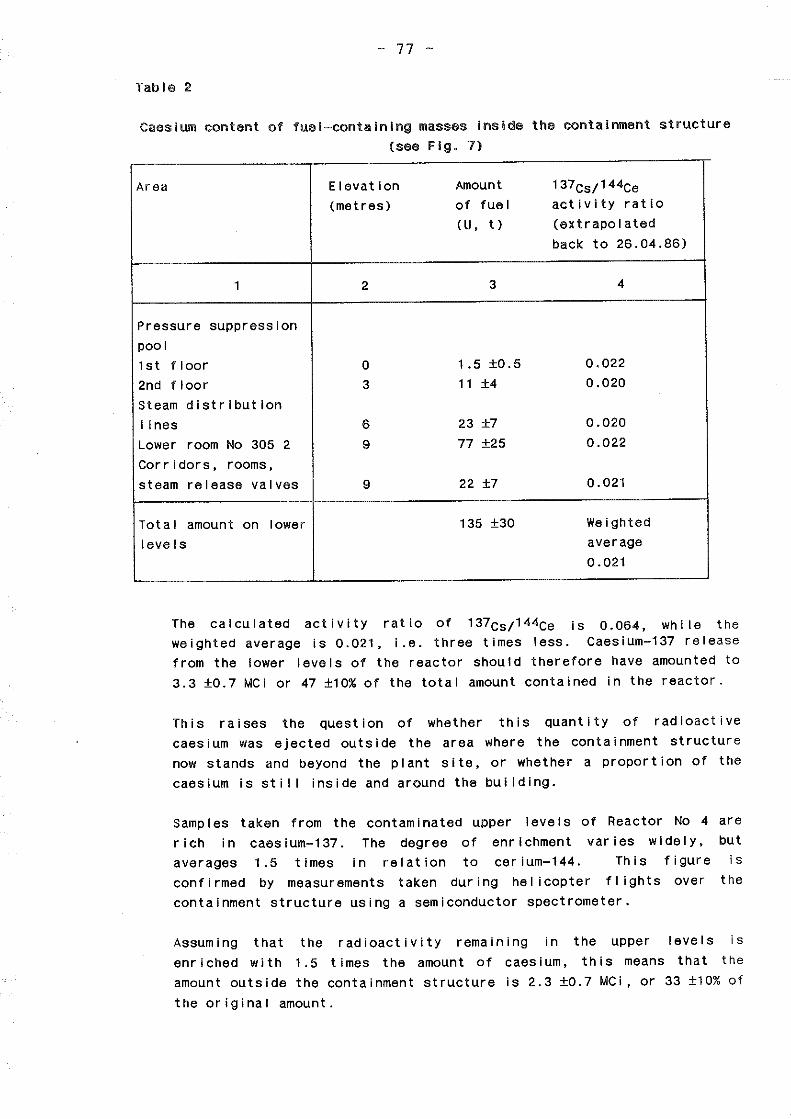
- 77 -
Table 2
Caesium content of fuel-containing masses inside the containment structure (see Fig. 7)
Area Elevation Amount 137c8 ;144ce (metres) of fuel activity ratio
(U, t) (extrapolated back to 26.04.86)
1 2 3 4
Pressure suppression pool 1st floor 0 1.5 ±0.5 0.022
2nd floor 3 11 ±4 0.020
Steam distribution I ines 6 23 ±7 0.020
Lower room No 305 2 9 77 ±25 0.022
Corridors, rooms,
steam release valves 9 22 ±7 0.021
Total amount on lower 135 ±30 Weighted
levels average 0.021
The calculated activity ratio of 137cs;144ce is o.064, while the weighted average is 0.021, i.e. three times less. Caesium-137 release from the lower levels of the reactor should therefore have amounted to 3.3 ±0.7 MCi or 47 ±10% of the total amount contained in the reactor.
This raises the question of whether this quantity of radioactive caesium was ejected outside the area where the containment structure now stands and beyond the plant site, or whether a proportion of the caesium is sti I I inside and around the bui I ding.
Samples taken from the contaminated upper levels rich in caesium-137. The degree of enrichment
of Reactor No 4 are
averages 1.5 times in relation to cerium-144. varies widely,
This figure f Ii ghts over confirmed by measurements taken during he I i copter
containment structure using a semiconductor spectrometer.
but is
the
Assuming that the radioactivity remaining in the upper levels is enriched with 1.5 times the amount of caesium, this means that the amount outside the containment structure is 2.3 ±0.7 MCi, or 33 ±10% of the original amount.

- 78 -
Further work centring on the containment structure wi I I no doubt result in a more precise estimate.
With regard to caesium fallout on and around the plant, the answer I ies in measuring soi I samples taken at different distances from the reactor (data are for May 1986, as the area around the reactor was later covered with a layer of hardcore and concrete, and the area around the plant was also decontaminated). Samples were taken in three main directions (north, west and south), and the averaged data are given in Table 3.
Table 3 Ratio between caesium-137 and cerium-144 in soi I samples
(extrapolated to 26 Apri I 1986; calculated ratio is 0.064)
Distance from reactor (km) Caesium-137/cerium-144 ratio 1 2
0.05 0.068 0.6 0.078 3 0.068
30 0.19 60 7.5
Thus the ratio increases with distance, and at a distance of 3 km it corresponds to the calculated fuel ratio. It fol lows that there were no significant "caesium hot-spots" near Reactor No 4.
8. One of the main reasons for bui I ding the containment structure was to prevent radioactive contamination of the environment by any type of dust fallout.
Four years' experience has shown this approach to be generally successfu I .
However, the difficult conditions under was bu i I t made it i mposs i b I e to sea I
which the containment structure the structure completely. In
particular, there are many gaps in the upper part of the structure and in its roof. In addition, hatchways are bui It into the roof so that measuring apparatus can be inserted into the central reactor hal I above the debris. Finally, there is natural ventilation through the stack shared by Reactors No 3 and 4.
Al I the above-mentioned openings dust and gas can escape from environment.
are routes through which radioactive the containment structure into the

- 79 -
Such escapes were observed fairly frequently in 1987 and 1988, and were I inked to work being carried out on the ruined reactor or to specific meteorological conditions. one typical example is the sharp increases (by hundreds of times), in the ruthenium-106 concentration in air (within the containment structure and on the plant site) recorded sever a I times during the hot summer of 1987, a I though over a 11 aeroso I activity did not exceed the permissible concentration I imits for personne I. These increases correlated with heavy showers and high air temperatures. The mechanism responsible for this effect is not known in detai I, but the most I ikely explanation is that ruthenium-106 and
103 (possibly in the form Ruo4) adsorbed into the porous materials of the debris were released into the air through the evaporation of rainwater.
Contamination of the air masses from the containment structure now appears to be the result of a series of processes, as fol lows:
dust rising from the surface of the debris in the central reactor hall, the reactor space and other areas within the containment structure; dust formed by dri I I ing and construction activities; dust formation and release due to the col lapse of structural elements within the containment structure.
A series of measures has been developed and part I y imp I emented to reduce dust formation and release: strengthening of structural elements, dust suppression, wet dri I I ing, etc.
One important task is to organise the careful monitoring of radioactive aerosol releases into the environment.
With the experimental data available to date, only estimates of these can be made. Plans are in hand, however, which wi 11 lead to a significant increase in accuracy and speed of response when monitoring radioactive aerosol escape.
The fol lowing experimental data can be used to assess the total amount of radioactivity released:
measurements of radioactivity released through the stack shared by Reactors Nos 3 and 4; measurements of the concentration and radionuclide composition of aerosols contaminating the air on the site and within the containment structure; measurement of the radioactive aerosols escaping through openings in the containment structure.

- 80 -
A brief examination of each method fol lows.
Airflow through the stack is by natural ventilation, and varies between 10 and 40 000 m,/h. Aerosol concentration is measured by filtration in a special sampling I ine.
After a specified exposure time, gamma spectrometry analysis is used to measure aerosol contamination in the filters.
Table 4 gives the results of the total activity measurements for four
identified isotopes (137cs, 134cs, 144cs and 106Ru) averaged over a month.
Table 4
IAonth
Year 1988 1989 1990
Month
Year 1988 1989
1
0.38 0.26 0.05
7
0.22 0. 14
Activity (10-3 Ci/day)
2
0.20 0.22
0.03
8
0. 10 0.92
3
0.20 0.21 0.04
9
0.053 0.20
4
0.22 0. 14 0.03
10
0.93 0.054
5
0.23 0. 14
11
0.34 0.07
6
0.197 0.26
12
0.69 0.07
The total activity escaping from the containment structure through the ventilation stack amounted to 0.08 Ci in 1989.
The next source of information is measurement of the concentration and radionuclide composition of aerosols in the air on the site of Reactor No 4.

- 81 -
As an example, average concentrations of radionucl ides in the air at the site in the first half of 1990 were as fol lows:
Ruthenium-106 1 .4 x 10-16 Ci/I Cerium-144 3.6 x 10⁻¹⁶ Ci/I Caesium-137 3.2 x 10⁻¹⁶ Ci/I Caesium-134 0.7 x 10⁻¹⁶ Ci/I
It is difficult to relate these data to the radioactivity escaping from the containment structure, since the contribution from dust rising from the ground surface has not been determined. It should be pointed out, however, that the amount escaping is not higher than the above and does not represent a danger to human beings near the containment structure.
O i rect measurement of containment structure roof
radioactive aerosols escaping hatches began at the end of 1989.
from the
Two vertical and two horizontal screens were fitted over each of four hatchways in the roof of the containment structure, each measuring 60x60 cm.
The average activity accumulation rate on the horizontal screens (lower side) does not exceed 0.3 Ci/km, per day. Assuming that the radioaerosol escape rate from al I gaps in the containment structure is the same, and taking into account the fact that the total surface area of al I openings is currently estimated at approximately 1 200 m2 this gives a total of not more than 0.2 Ci/year for the release of radioactivity from the containment structure.
summarizing the data shows that in static conditions the release of radioactivity from the containment structure is neg I igible, not exceeding 0.3 Ci per year (with plutonium accounting for 0.6-0.8% of total activity).

- 82 -
BIBLIOGRAPHY
1. USSR State Committee on the Ut i I izat ion of Atomic Energy: "The Accident
at the Chernobyl NPP and its consequences"; IAEA Post-Accident Review
Meeting, Vienna, 25-29 August 1986.
2. V. G. Asmolov, A. A. Borovoy, v. F. Demin, et al.: "The Chernobyl NPP
accident: a year after"; IAEA International Conference on Nuclear
Power Performance and Safety, Vienna, Austria, 28 September - 2 October
1987.
3. S. N. Begichev, A. A. Borovoy, E. V. Burlakov, et al.: "Radioactive
Releases due to the Chernobyl Accident"; Proc. Int. Seminar "Fission
Product Transport Processes in Reactor Ace i dents", 22-26 May,
Dubrovnik, Yugoslavia, 1989.
4. A. A. Borovoy: "Fission Product and Transuranic Element Release during
the Chernobyl Accident"; (preprint) I. V. Kurchatov Institute of
Atomic Energy. Complex Expedition, Chernobyl, 1990.
5. S. N. Beg i chev, A. A. Borovoy, E. V. Bur I akov, et a I :
Chernobyl's fourth reactor" (brief reference book);
I. V. Kurchatov Institute of Atomic Energy, Complex
Chernobyl, 1990 (in press).
"The fue I of
(preprint)
Expedition,
6. A. A. Borovoy, G.D. lbraimov, s. s. Ogorodnik, et al.: "The condition
of Chernobyl's fourth reactor and of its nuclear fuel" (from results of
1988-89 investigations); (preprint) I. v. Kurchatov Institute of Atomic
Energy, Complex Expedition, Chernobyl, 1990.
7. A. A. Borovoy: "Inside and outside the Sarcophagus"; (preprint)
I. V. Kurchatov Institute of Atomic Energy, Comp I ex Expedition,
Chernobyl, 1990.
8. A. A. Borovoy, R. F. Ulumbekov, A. N. Kheruvimov: 11 Assessment of
radioactive aerosols escaping from the Sarcophagus (1989-1990)";
(preprint) I. v. Kurchatov Institute of Atomic Energy, Complex
Expedition, Chernoby I, 1990 (in press).
9. S. S. Abal in, s. T. Belyayev, A. A. Borovoy, et al.: "Diagnostic
studies of the destroyed Chernobyl reactor"; Atomnaya Energiya, vol.
68, No 5, 1990, pp. 355-359.
10. Sources, Effects and Risks of Ionizing Radiation; UNSCEAR 1988, Report
to the General Assembly, UN, New York, 1988.

- 83 -
11 . Yu. A. I zr ae I : Chernoby 1-90; "Pravda" newspaper, 17 Apr i I , 1990, No.
107.
12. R. M. A I eksakh in, N .· N. Kryshev, s. V. Fesenko, et a I . :
"Radioecological problems of nuclear power"; Atomnaya Energiya, vol.
68, No 5, 1990, pp. 320-328.

- 84 -
CAPTIONS
Fig. 1: Time dependence of alpha-activity of fuel in Reactor No 4 fol lowing the accident.
Fig. 2: Release of radioactivity beyond the confines of reactor No 4 during the active phase of the accident (measurement error indicated by shaded area).
Fig. 3: Amounts of fuel rods with different Pu/144ce activity ratios, showing the stabi I ity of the correlation coefficient.
Fig. 4: Amount of fuel released (initial assessments) as% of the total load
> 96% - reactor building; < 1.5% - adjacent 80 km zone; < 1 .5% - rest of USSR; < 0.3% - Chernobyl NPP site; << 1% - outside USSR.
Fig. 5: Solidified lava flow from steam release valve.
Fig. 6: Central reactor hal I.
Fig. 7: Distribution of fuel-containing masses in the lower levels of Reactor No 4.

-:-°'\
(;
~ ~ l
0.5
Fig
. 1:
T
ime
depe
nden
ce o
f alp
ha-a
cti
vit
y o
f fu
el
in
Rea
cto
r N
o 4
fol
low
ing
the
acci
den
t.
a.)
0 ,4
// J
uel
® P
luto
nium
~
(; t el 0.
15
0.,1
0
I)
2
'--~
~-'-
-~
~~
-"--~
~---'-
~~
~-'-
-°-0
51
---~
~---l.
~~
~-L
-~
~~
'--~
~-'-
~~
~'-
-~
~--,L
,---~
~~
~--
o i
2 4
6 8
10
12
!~
!6
Tim
e cr
/ter
crcc
idea
t(ye
arsJ
7i
.mf'
O'/T
er (
yRt7
rS)
00
u
,

...._
~
~ ~ ~ ~ ~ ~
~
1:1::
Fig
. 2:
R
elea
se o
f ra
dio
acti
vit
y b
eyon
d th
e co
nfi
nes
of
reac
tor
No
4 d
uri
ng
th
e ac
tiv
e ph
ase
of
the
acci
den
t (m
easu
rem
ent
err
or
ind
icat
ed b
y sh
aded
are
a).
25
,-------------
20
~ ~ 1
5
~
~ <:::.
I
w~
1
0
~ <::::,.•
5 0 2
~6
,--~
~~
--=
~~
~~
~~
~-3
~0
-=--
~~
~~
27
""""~
~~
---4
-':-
~~
~~
-6"7
"""~
~
AP
RIL
, M
AY
00
"'

Fig
. 3:
A
mou
nts
of
fuel
ro
ds
wit
h d
iffe
ren
t P
u;1
44
ce acti
vit
y ra
tio
s,
show
ing
the
stab
i I i
ty o
f th
e co
rrela
tio
n c
oeff
icie
nt.
No o
f .fu
el r
oJs,
"lo
75r'""~~~~~~~~~~~~~~~~~~~
50
25
I 6
....
...,
~
I
.I.
.1.
I o
l ·1 ·
· ·
7 s
g 2
.3
4 5
Pv/
CR
-144
, to
-+
00
..
J

- 88 -
Fig. 4: Amount of fuel released (initial assessments) as% of the total load
~ 96% - reactor building; ~ 1.5% - adjacent 80 km zone; ~ 1.5% - rest of USSR; , 0.3% - Chernobyl NPP site; << 1% - outside USSR.

Q)
>
"' > Q) (/)
"' Q)
Q) ... E
"' Q) ... (/)
5 .... ....
....
"' > "' ·o Q)
....
0 If)
I()

() (I) :::, ~
""' 0,
:T 0,
-90-

- 91 -
Fig. 7: Distribution of fuel-containing masses in the lower levels of Reactor No 4.
9,l)(J
o.o C). l.oo , ,. Oo -'f. Oo -
T
~ = (i35 ±30)r I --·-······---· . --·· _____ ..
prt.sr.11.rt. - s .. ppr, ssi"' pa,< .
st~ ..... J,°l .;. ~ .. t.-,.. /, .. e., lo we.,- roo...._ fl/ 0 loS" /a.
O flie.r roow.J
ff. 5)r
)
}'·,
r
(77.:J:.25)r
23±7)r

- 92 -

- 93 -
Chernobyl Source Term Estimation
Paul H. GUDIKSEN, Ted F. HARVEY, Rolf LANGE
Lawrence Livermore National Laboratory Livermore, California 94550, USA

- 94 -
ABSTRACT
The Chernobyl source term available for long-range transport was estimated by
integration of radiological measurements with atmospheric dispersion modeling and by
reactor core radionuclide inventory estimation in conjunction with WASH-1400 release
fractions associated with specific chemical groups. The model simulations revealed that
the radioactive cloud became segmented during the first day, with the lower section
heading toward Scandinavia and the upper part heading in a southeasterly direction
with subsequent transport across Asia to Japan, the North Pacific, and the west coast
of North America. By optimizing th~ agreement between the observed cloud arrival
times and duration of peak concentrations measured over Europe, Japan, Kuwait, and
the U.S. with the model predicted concentrations, it was possible to derive source term
estimates for those radionuclides measured in airborne radioactivity. This was extended
to radionuclides that were largely unmeasured in the environment by performing a
reactor core radionuclide inventory analysis to obtain release fractions for the various
chemical transport groups.
These analyses indicated that essentially all of the noble gases, 60% of the ra
dioiodines, 40% of the radiocesium, 10% of the tellurium and about 1 % or less of the
more refractory elements were released. These estimates are in excellent agreement with
those obtained on the basis of worldwide deposition measurements.
The Chernobyl source term was several orders of magnitude greater than those
associated with the Windscale and TMI reactor accidents. However, the 137Cs from
the Chernobyl event is about 6% of that released by the U.S. and U.S.S.R. atmospheric
nuclear weapon tests, while the 131! and 90Sr released by the Chernobyl accident was
only about 0.1 % of that released by the weapon tests.

- 95 -
INTRODUCTION
The radioactivity released into the atmosphere by the Chernobyl-4 nuclear reactor
accident on April 26, 1986 was detected at numerous locations throughout the Northern
Hemisphere. The release may be thought of as consisting of two components. One, was
the activity released during the initial explosion on the first day of the accident, and
the second component involving the material released during the subsequent fire which
released radioactivity into the atmosphere until May 6, 1986. The radioactive material
contained a wide spectrum of fission and activation products. The most important
radionuclides of interest were 131 I, 137 Cs, and 134Cs due to their abundance as well as
their radiological and chemical characteristics. Atmospheric dispersion modeling was
used to determine the evolution of the spatial distributions of the airborne radioactivity
as it was transported over Europe and subsequently over the Northern Hemisphere.[!]
Integration of these calculated distributions with the measurements of radioactivity
yielded estimation of the source term for those radionuclides that were available for
long-range transport and were measured in the airborne debris collected outside the
Soviet Union. The release rates for radionuclides that were not generally measured in
environmental samples were derived by .first estimating the core's radionuclide inventory
with a nuclear physics model, and then using the measured radionuclides as tracers of
chemical transport groups, groups of radionuclides with similar chemical and physical
behavior, to acquire the release fractions.
This paper discusses the hemispheric dispersion of the material, our estimates of
the source term available for long-range atmospheric transport, and a comparison of
the activity released by the Chernobyl accident with those for previous nuclear events.
SOURCE TERM ESTIMATION FOR ENVIRONMENTALLY
MEASURED RADIONUCLIDES
The source term for 137 Cs and 131 I were acquired by means of optimizing the agree
ment between the spatial and temporal distributions of the radionuclides predicted by
hemispheric-scale atmospheric dispersion modeling with measured air concentrations
throughout Europe, Kuwait, Japan, and the U.S. A three-dimensional particle-in-cell

- 96 -
transport and diffusion model, driven by Northern Hemispheric wind fields supplied
by the U.S. Air Force Global Weather Central, was used to perform the analysis. The
model is based on the concept of generating a large number of marker particles to repre
sent the radioactivity.[2] The particles are injected at the source point and subsequently
transported within the three-dimensional Eulerian grid mesh by means of a transport
velocity applied to each particle. This transport velocity consists of a wind velocity
provided at each grid point and a diffusion velocity. In addition, gravitational settling
and dry deposition velocity vectors as well as radioactive decay may be applied to the
particles, as appropriate. Wet deposition, however, is not included in the model due to
the unavailability of accurate precipitation fields over the Northern Hemisphere.
Air concentration measurements of radioactivity throughout the Northern Hemi
sphere revealed the presence of fresh fission products up to heights of about 7 km
within a few days of the initial explosion. This suggests that some of the radioactivity
released by the explosion and the subsequent fire within the reactor core must have been
transported to heights well within the middle troposphere. This high altitude presence
of the radioactivity may have been due to a variety of factors such as the thermal energy
associated with the releases, rapid atmospheric mixing due to the presence of thunder
storms in the vicinity of the Chernobyl area during the first day of the accident, or the
possible uplifting of the radioactive debris over a warm front situated between Cher
nobyl and the Baltic Sea. Consequently, the source term used in the model calculations
included an upper-level cloud simulating the initial explosion and a lower-level cloud for
the ensuing fire.
By integrating the model calculated cloud arrival times and duration of peak con
centrations over Europe, Japan, Kuwait, and the U.S. with the measured air concen
trations of specific radionuclides, it was possible by an iterative process to derive the
most accurate temporal and spatial evolution of the radioactive cloud over the North
ern Hemisphere. This evolution is illustrated in Fig. 1 by the model generated particle
distribution patterns depicted over the Northern Hemisphere 2, 4, 6, and 10 days after
the initial release. Note that initially the activity near the surface traveled in a north
westerly direction toward Scandinavia, passing over the northeastern corner of Poland

- 97 -
en route. The activity distribution continued its expansion into Scandinavia, while at
the same time moving southwesterly through Poland toward central Europe. The upper
part of the cloud headed in a southeasterly direction with subsequent transport across
Asia to Japan, the North Pacific, and the west coast of North America. This integration
of observed air concentrations with those calculated permitted the derivation of the total
amounts of 137 Cs and 131 I released, as shown in Table 1. This approach indicates that
89 PBq of 137 Cs and 1300 PBq of 131 I ( decay-corrected to 29 April 1986) were released.
The release rates of other radionuclides that were measured in airborne radioactivity,
also given in Table 1, were acquired by calculating their ratios relative to 137Cs from
measurements of airborne radioactivity within Scandinavia.
These estimates are consistent with those obtained by other investigators on the
basis of worldwide deposition or atmospheric dispersion modelingJ3 - 9] This is illustrated
by utilizing data reported by UNSCEAR.[10] Since some investigators accounted only
for the 137 Cs reported over Europe or the Soviet Union, it was necessary to normalize
their estimates to worldwide deposition. Using the UNSCEAR assumption that 43%
of the 137 Cs was deposited within the Soviet Union, 38% over Northern Europe, 8% in
the oceans, and the remainder within .other parts of the Northern Hemisphere, one may
translate the various estimates to the total amount of 137 Cs released into the atmosphere
by the Chernobyl accident. A comparison of these estimates is given in Table 2. Note
that most estimates are within about 20% of our estimate of 89 PBq and the USSR
estimate of 86 PBq is almost identical.
SOURCE ESTIMATION FOR RADIONUCLIDES NOT
GENERALLY MEASURED ENVIRONMENTALLY
The source term estimation process for radionuclides that were largely unmeasured
m environmental samples collected outside the Soviet Union involved (1) estimating
the core inventories of all radionuclides of interest, (2) using the radionuclides listed in
Table 1 as tracers of various chemical transport groups, and (3) calculating the fractional
release rate associated with each chemical transport group.
The inventory of specific radionuclides in the RBMK-1000 Soviet reactor core at
the time of the accident was estimated by utilizing a modified version of a reactor core

- 98 -
model that solves a large number of rate equations to simulate fission, radioactive decay,
nuclear transformations, and neutron reactions in order to calculate build-up and decay
of the numerous radionuclides residing in the core.[11] Input to the model included data
on the reactor's operating history obtained from the Soviet report presented at the
IAEA Experts' Meeting in Vienna.[4]
The Chernobyl-4 reactor is thought to have started operation during December
1983 and operated continuously for about 875 days until 26 April 1986. At the time
of the accident, the core-averaged fuel burn-up was 10.3 MW d/kg. The reactor is
capable of being refueled during operation and utilizes 2% enriched fuel. To reconstruct
its operating history, we assumed (1) an average load factor of 80%, (2) an 8 month
start-up period for reaching full power, (3) a continuous refueling schedule of 3% fuel
replacement per month commencing in August 1985 to give a core loading at the time
of the accident of 75% original fuel, and ( 4) a core-averaged neutron energy spectrum
similar to that in a commercial PWR, but at a lower power density. On the basis of
these assumptions, one obtains the fuel burn-up rate given in Fig. 2. To ascertain that
these assumptions are reasonable, it is useful to compare the calculated activity ratios of
certain radionuclides residing in the core at the time of the accident with those measured
in air samples collected in Scandinavia. This comparison is illustrated in Table 3 for
isotope ratios of the same chemical elements to minimize atmospheric fractionation
effects. The agreement between the measured and calculated values appears to be
reasonable in view of the roughly 20% uncertainty associated with the measured ratios.
In view of this agreement, it is possible to estimate with reasonable confidence the core's
inventory of a large suite of radionuclides at the time of the accident. The inventory
of the radionuclides of primary interest from an environmental impact point of view is
given in Table 4. A review of the data in the table reveals that we estimate the core to
have contained 2300 PBq of 131!, 210 PBq of 137Cs, and 140 PBq of 134Cs. These values
have been decay-corrected to 3 days after the accident.
From the releases given in Table 1 and the core inventories listed in Table 4, we
obtained the fraction released and available for long-range transport for those radionu
clides that were measured in the airborne radioactivity sampled outside the Soviet

- 99 -
Union. These release fractions may be extended to a host of unmeasured radionuclides
by using those listed in Table 1 as tracers of their corresponding chemical transport
groups as defined by the USAEC reactor safety study.l12l This is illustrated in Table
5 which depicts the Chernobyl release fractions. These reveal that essentially all of
the noble gases, 60% of radioiodine, and about 40% of the cesium radionuclides were
released. This was followed by the release of about 10% of the tellurium and 1% or less
of the more refractory elements. These release fractions agree well with those reported
by the Soviet Union when considering their estimates of the reactor core inventory of
radionuclides at the time of the accident and the activity that was transported out
side the Soviet Union. The release fractions are approximately 70% of the most likely
estimates derived from the WASH-1400 study for a major meltdown of a light- water
reactor, but are well within the ranges of potential release fractions associated with such
a meltdown. A comparison with the release fractions derived for the 1957 Windscale
reactor accident in the U .K. reveals that considerably higher fractions of iodine and
cesium radionuclides were associated with the Chernobyl accident.l13l
On the basis of the release fractions given in Table 5 and the core inventories listed in
Table 4, we obtained estimates of the total activity released for radionuclides of interest
that were not generally measured. These are given in Table 6. Most notable is 90Sr
whose release rate is estimated from Table 6 to be only about 1 % of that for 137 Cs due
to its low volatility. This seems in reasonable agreement with a few measurements in
western Europe.
COMPARISON OF CHERNOBYL WITH
OTHER NUCLEAR EVENTS
In order to place the radioactivity released from the Chernobyl reactor in perspec
tive with radioactivity releases from previous nuclear events, it is useful to compare the
Chernobyl release with the radioactivity estimated to have been produced by the U.S.
and the U.S.S.R. atmospheric nuclear weapons testing programs, as well as with the
releases associated with the TMI and the Windscale reactor accidents. However, one
should be aware that a complete comparison of the radiological impact of the atmo
spheric weapon testing programs with that produced by the Chernobyl reactor accident
- 100 -
is very difficult. This is because the weapon tests produce different mixtures of ra
dionuclides, have different injection heights in the atmosphere, and were conducted at
isolated sites far from population centers. Nevertheless, it is still useful to compare the
data in Table 7, which shows for the most notable radionuclides of interest the amounts
released by the weapon tests as well as the TMI and Windscale reactor accidents. A
comparison of the data shows that with the exception of 134Cs, the activity released by
the Chernobyl accident is minor relative to the weapon test releases, which are based
on 225 MT (megatons of TNT equivalent) of fission. The 89 PBq of 137 Cs released
by the Chernobyl event is only 6% of that produced by the weapon tests, while the
remaining radionuclide releases represent less than 1 % of the corresponding weapon
test releases. However, since 134Cs is is not significantly produced in weapon tests, the
Chernobyl contribution is at least 30 times greater than that produced by the weapon
testing programs. One may also note that the Chernobyl releases were greater by at
least several orders of magnitude than those associated with the Windscale and TMI
reactor accidents.
SUMMARY
We utilized Northern Hemispheric scale atmospheric dispersion modeling in con
junction with radiological mesurements to estimate the source term for the radionuclides
measured in the airborne radioactivity. By using a nuclear physics model to calculate
the expected core radionuclide inventory at the time of the accident and WASH-1400
chemical transport groups, it was possible to estimate the source term available for long
range transport for radionuclides that were largely unmeasured. Thus, we estimated
that essentially all of the noble gases, 60% of the radioiodines, 40% of the radiocesium,
and 10% of the tellurium, and about 1 % or less of the more refractory elements were
released.
The source term for the Chernobyl accident was several orders of magnitude greater
than those associated with the Windscale and TMI reactor accidents, while our estimates
of the 137 Cs released by the Chernobyl event is about 6% of that released by the U.S.
and U.S.S.R. atmospheric nuclear weapon tests.

- 101 -
REFERENCES
1. Lange, R., Dickerson, M.H., and Gudiksen, P.H., "Dose estimates from the Cher
nobyl accident," Nucl. Tech.,82, 311-322; 1988.
2. Lange, R., PATRIC, "A three-dimensional particle-in-cell sequential puff code for
modeling the transport and diffusion of atmospheric pollutants," Livermore,· CA;
Lawrence Livermore National Laboratory, UCID-17701; 1978a.
3. Anspaugh, L.R., Catlin, R.J., and Goldman, M., "The global impact of the Cher
nobyl reactor accident," Science, 242, 1513-1519.
4. U.S.S.R. State Committee on the Utilization of Atomic Energy. "The accident at the
Chernobyl Nuclear Power Plant and its consequences-Part I." General material,
information compiled for the IAEA Experts' Meeting in Vienna, Austria; Vienna,
IAEA; Safety Series No. 75-INSAG-l; 1986.
5. ApSimon, H.M., Gudiksen, P., Khitrov, L. Rodhe, H., and Yoshikawa, T., "Lessons
from Chernobyl-modeling the dispersal and deposition of radionuclides;" Environ.,
30 (5), 17-20, 1988.
6. Van Egmond, N.D., and Seuss, M·.J., "Assessment of radiation dose commitment in
Europe due to the Chernobyl accident," Nueherberg, Federal Republic of Germany;
Institut Fur Strahlen Hygiene; Rep. !SH-HEFT 108; 1987.
7. Cambray, R.S., Cawse, P.A., Garland, J.A., Gibson, J.A.B., Johnson, P., Lewis,
G.N.J., Newton, D., Salmon, L., and Wade, B.O., "Observations on radioactivity
from the Chernobyl accident," Nucl. Energy, 26, 77-101, 1987.
8. Sorenson, B., "Chernobyl accident: Assessing the data," Nucl. Safety, 38, 443-447,
1987.
9. Aarkrog, A., "The radiological impact of the Chernobyl debris compared with that
from nuclear weapons fallout," J. Environ. Radioactivity, 6, 151-162, 1988.
10 .. United Nations Scientific Committee on the Effects of Atomic Radiation. Sources,
effects, and risks of ionizing radiation. 1988 Report to the General Assembly (draft),
Annex D; New York; United Nations; 1988.

- 102 -
11. Croff, A.G., "A user's manual for the ORIGIN2 computer code", Oak Ridge, TN;
Oak Ridge National Laboratory, ORNL/TM-7175; 1980.
12. Ritzman, R.L., "Release of radioactivity in reactor accidents," Appendix VII to reac
tor safety study. Washington, D.C.; U.S. Nuclear Regulatory Commission; WASH-
1400, NUREG 75/014; 1975.
13. Clarke, R.H., "An analysis of the 1957 Windscale accident using the WEERIE code,"
Ann. Nucl. Science Eng.,1, 73-83, 1974.

- 103 -
FIGURE CAPTIONS
Fig. 1. The calculated spatial distributions of the radioactive cloud over the Northern
Hemisphere on selected days after the explosion on 26 April 1986.
Fig. 2. The estimated fuel burn-up rate of the Chernobyl-4 reactor core.

(a) l)a~ 2
\ .,, \ '
(c) Day 6
,f
'!
\ .,, \ '
,.
.,
/
- ".'0:: ·i'..., -~~ •• ,--·J '"'.'\"~'-~-- ,-_ -,.
i '
.,
104
' ,.
_:.:.,
·.,
(hi Day~
r,
'. ..,r,.. --,.,
(d) Day IO
"':;.--;,-' ~
/
.,,.;
--·-"/_.-- _;
Fig. 1. The calculated spatial distributions of the radioactive cloud over the Northern
Hemisphere on selected days after the explosion on 26 April 1986.

- 105 -
10
~ 8 I Cl
"" "' ;;:: 6 ~ 0. :::, c: 4 ~
:::, .0 Approx. <ii :::, 2 refuel u..
startup
0 200 400 600 800 1000
Startup Time (days) Accident Dec. 1983 April 1986
Fig. 2. The estimated fuel burn-up rate of the Chernobyl-4 reactor core.

- 106 -
Table 1. Estimated releases of radionuclides from the Chernobyl event. The activities
are decay-corrected to 3 days after the accident; 1 PBq = 1015 Bq. The uncertainties
associated with these releases are about 30%.
Activity Released
Radionuclide PBq
95zr 8.5
1D3Ru 27
106Ru 6.3
1311 1300
133I 300
132Te 200
134Cs 48
1J6Cs 20
137Cs 89
14DBa 37
141ce 8.5
144Ce 5.2
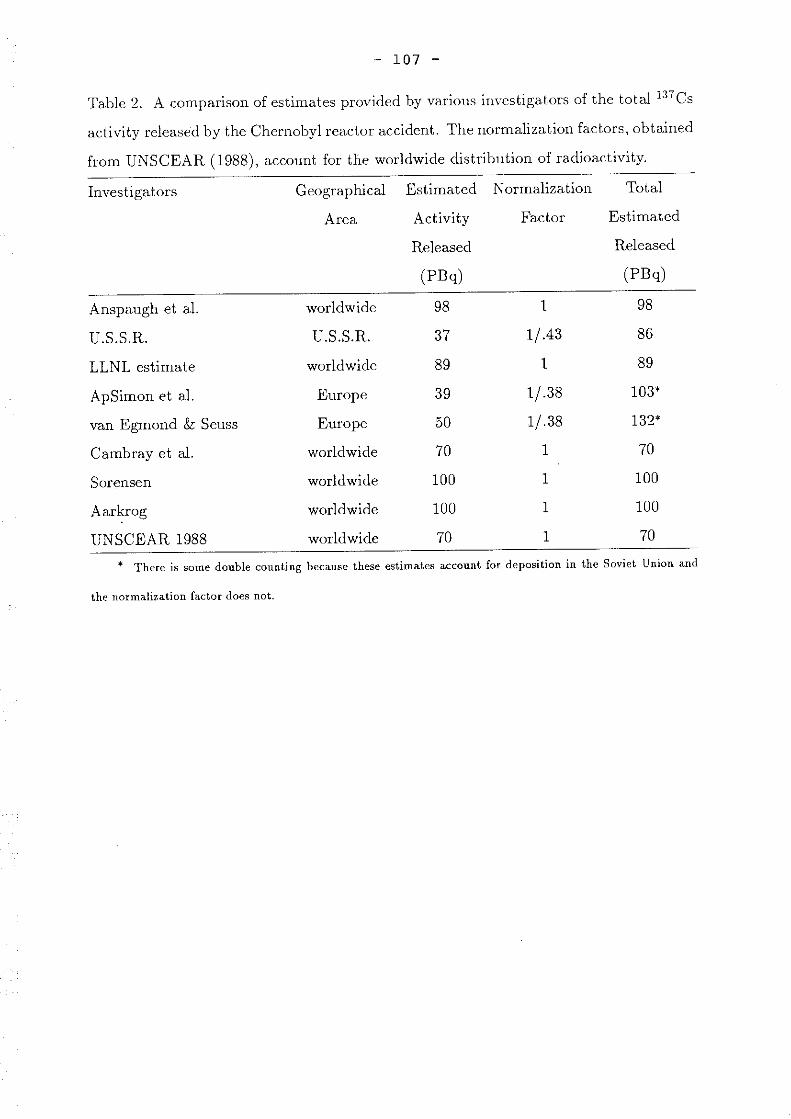
- 107 -
Table 2. A comparison of estimates provided by various investigators of the total 137 Cs
activity released by the Chernobyl reactor accident. The normalization factors, obtained
from UNSCEAR (1988), account for the worldwide distribution of radioactivity.
Investigators Geographical Estimated Normalization Total
Anspaugh et al.
U.S.S.R.
LLNL estimate
ApSimon et al.
van Egmond & Seuss
Cambray et al.
Sorensen
Aarkrog
UNSCEAR 1988
Area
worldwide
U.S.S.R.
worldwide
Europe
Europe
worldwide
worldwide
worldwide
worldwide
Activity
Released
(PBq)
98
37
89
39
50
70
100
100
70
Factor
1
1/ .43
1
1/.38
1/.38
1
1
1
1
Estimated
Released
(PBq)
98
86
89
103*
132*
70
100
100
70
* There is some double counting because these estimates account for deposition in the Soviet Union and
the normalization factor does not.

- 108 -
Table 3. Fission product activity ratios ( decay-corrected to 26 April 1988) measured in
environmental samples collected within Scandinavia and predicted by the core inventory
model. The latter are core-averaged values.
Activity Ratio Measured Model Estimates
103Ru/1D6Ru 4.2 4.0
134Csj137 Cs 0.54 0.65
136Csj137 Cs 0.27 0.40
131Csj136Cs 2.4 1.7
1311;133! 0.56 0.62
141 Ce/144Ce 1.6 1.6

- 109 -
Table 4. Model-derived estimates of the core inventory of selected radionuclides. The
activities are decay-corrected to 3 days after the accident. The uncertainties associated
with these inventories are about 30%.
Inventory
Radionuclide PBq
ssKr 20 sgsr 2800 gosr 160 9ly 3600 95zr 4600
99JvI0 2400 103Ru 3900 106Ru 1000 121sb 180
J27mTe 37 129mTe 130
1311 2300 13lmTe 67 132Te 2100
1331 440 133Xe 4700
133mxe 96 134Cs 140 136Cs 70 131cs 210 140Ba 4500 1401a 5000 141Ce 4600 144Ce 3000 147pm 460

- 110 -
Table 5. Estimated percentage releases of radionuclides available for long-range trans-
port from Chernobyl compared with the USAEC reactor safety study (WASH-1400) and
the Windscale reactor accident. The uncertainties of the Chernobyl percentage releases
are about 40%.
Chernobyl WASH-1400 (%) Windscale Best
Chemical Group Tracers (%) Range Estimate (%)
Noble Gases(a) 133Xe >90 50-100 90 100
Halogens(b) 131 I 133J , 60 50-100 90 20
Alkali Metals( c) 134Cs 136Cs 137 Cs , , 40 40-90 80 20
Tellurium Group(d) 132Te 10 5-25 15 2o(i)
Alkaline Earths( e) 140Ba 0.8 2-20 10 0.2
Noble Metals(/) 1D3Ru 1D6Ru , 0.7 1-10 3 2(i)
Rare Earths(Y) 141Ce 144Ce , 0.2 0.01-1 0.3 0.2
Refractory Oxides(h) 95zr 0.2 0.01-1 0.3 0.2
(a) Xe, Kr
(b) I, Br
(c) Cs, Rb
( d) Te, Se, Sb
(e) Ba, Sr
(!) Ru, Rh, Pd, Mo, Tc
(g) Y, La, Ce, Pr, Nd, Pm, Sm, Eu, Np, Pu, Cm
(h) Zr, Nb
(i) Sb was estimated at 0.2%[13]
(j) Rh and Pd were estimated at 0.2%[13]

- 111 -
Table 6. Estimated releases of radionuclides that were largely unmeasured in airborne
radioactivity collected outside the Soviet Union. The activities are decay-corrected to
3 days after the accident.
Radionuclide
9Iy
121sb
I33Xe
133mxe
Activity Released (PBq)
2: 18
22
1.3
7.2
17
18
3.7
13
6.7
;,:4200
;,:86
10
0.9

- 112 -
Table 7. Comparison of Chernobyl with other nuclear events. Except for TMI, the
activities are decay-corrected to 3 days after the events.
Radioactivity Released (PBq)
Nuclide Chernobyl Weapon Tests Windscale TMI 131cs 89 1500 0.04 ND+
134Cs 48 <1.5 0.001 ND
gosr 1.3 1300 2.2 x 10⁻⁴ ND
133Xe :C:4200 2 x 10⁶ 14 370
131 I 1300 7.8 x 10⁵ 0.6 0.001
+ not detected

- 113 -
A Review of Source Term and Dose Estimation for the TMl-2 Reactor Accident
Paul H. GUDIKSEN, Marvin H. DICKERSON
Lawrence Livermore National Laboratory Livermore, California 94550, USA

- 114 -
ABSTRACT
The TMI-2 nuclear reactor accident, which occurred on March 28, 1979 in Harris
burg, Pennsylvania, produced environmental releases of noble gases and small quantities
of radioiodine. The releases occurred over a roughly two week period with almost 90% of
the noble gases being released during the first three days after the initiation of the acci
dent. Meteorological conditions during the prolonged release period varied from strong
synoptic driven flows that rapidly transported the radioactive gases out of the Harris
burg area to calm situations that allowed the radioactivity to accumulate within the low
lying river area and to subsequently slowly disperse within the immediate vicinity of
the reactor. Meteorological and radiological data, collected throughout the Harrisburg
area by numerous organizations, were used in conjunction with atmospheric dispersion
modeling to define the time and spatial evolution of the radioactive plume structure for
assessing the environmental impact of the release.
The results reported by various analysts, revealed that approximately 2.4-10 mil
lion curies of noble gases (mainly Xe-133), and about 14 curies of I-131 were released.
During the first two days, when most of the noble gas release occurred, the plume
was transported in a northerly direction causing the most exposed area to lie within a
northwesterly to northeasterly direction from TMI. Changing surface winds caused the
plume to be subsequently transported in a southerly direction, followed by an easterly
direction. Thus, the total dose pattern was governed by the complexities inherent in
the temporal evolution of the source term, the changing meteorology and the terrain.
The calculated maximum whole body dose due to plume passage exceeded 100
mrem over an area extending several kilometers north of the plant, although the highest
measured dose was 75 mrem. The collective dose equivalent (within a radius of 80 km)
due to the noble gas exposure ranged over several orders of magnitude with a central
estimate of 3300 person-rem. The small I-131 release produced barely detectable levels
of activity in air and milk samples. This may have produced thyroid doses of a few
milirem to a small segment of the population.
- 115 -
INTRODUCTION
On March 28, 1979 the Three-Mile-Island Unit 2 nuclear power reactor experienced
a severe fuel damage accident that resulted in the release of fission products from the
core into the containment atmosphere. Some of the fission products escaped from the
primary containment by means of the Makeup and Purification System that transported
primary coolant into the auxiliary building. Outgassing of the primary cooling water
into the auxiliary building atmosphere permitted volatile fission products to enter the
building ventilation system leading to environmental releases of noble gases and small
amounts of radioiodine.
The amounts of specific radionuclides released into the atmosphere and the asso
ciated environmental consequences were extensively investigated by numerous organi
zations. The primary studies of interest here were conducted by the plant operator,
General Public Utilities (GPU); the Department of Energy (DOE), the AD HOC Inter
agency Study Group that included participation by the Nuclear Regulatory Commission
(NRC), the Department of Health, Education and Welfare (HEW) and the Environmen
tal Protection Agency (EPA); and, the task forces supporting the President's Commis
sion on the Accident at Three Mile Island.
These studies were based on extensive data gathered during the accident and our
knowledge of the physical processes governing the behavior of radionuclides in the en
vironment whenever data were lacking. The data were acquired by radiation mea
surements within the plant, thermoluminescent detectors (TLD) placed in the environs
surrounding the facility, environmental radiation measurements made by both surface
and airborne detection systems, radionuclide analysis of numerous environmental sam
ples, and meteorological data from the site and the surrounding area. These data were
used either independently or in conjunction with atmospheric dispersion modeling to
estimate the time evolution of the source term from the auxiliary building vent, and
the spatial and temporal evolution of the integrated dose pattern over the Harrisburg
region.
This review, which summarizes the major findings of these studies, reveals that the
environmental and health impact to the surrounding population was minimal. However,

- 116 -
the details of the source term, the population and individual dose estimates may differ
by factors of three or four from one study to another. This paper presents the authors
views of the most likely consequences of the accident and a credible range of uncertainty
associated with these estimates.
NOBLE GAS SOURCE TERM ESTIMATION
Several independent attempts were made to estimate the magnitude of the noble
gas releases from the auxiliary building vent where essentially all of the atmospheric
releases occurred. Unfortunately, the normal vent monitor, which was designed to
measure routine operational releases, exceeded its saturation limit early in the accident
with attendant loss of valuable source term information. Thus, it was necessary to utilize
various indirect approaches to estimate the release magnitudes. The GPU derived noble
gas source term estimate was based on a combination of numerical modeling techniques
and in-plant and environmental radiation measurements.[!] This involved a multistep
approach that included ( 1) reactor core radionuclide inventory modeling and analysis
of air samples collected from the building vent system to define the isotopic mix of
the noble gases, (2) analysis of temporal variations of the output from area monitors
situated within the auxiliary building to indicate the relative release rate as a function
of time since the vent monitoring system became saturated during the high release
period, (3) atmospheric dispersion modeling based on a relative source rate and on-site
meteorological measurements to calculate the gamma dose to ground level receptors, and
( 4) optimizing the agreement between the calculated dose rates with the environmental
TLD measurements by source term scaling. This process produced the estimated total
noble gas release rates shown in Fig. 1. Combining these release rates with the time
dependent isotopic composition, and integrating with time produced the estimated noble
gas radionuclide specific total activity releases shown in Table 1. The results indicate
that about 10 million curies of noble gases were released during the period from March
28 through April 30. Approximately 80% of the noble gas activity released was due
to Xe-133. A review of the temporal variation of the release revealed that about 66%
of the total activity was released during the first day and a half of the accident, while

- 117 -
another 22% of the total activity was released during the following two days; from 1700
on March 29 to 1600 on March 31. Essentially all of the release had occurred by April 6.
A different approach for source term estimation was taken by the Task Group of
Health Physics and Dosimetry of the President's Commission on the Three Mile Island
Accidend2l Their approach focused on a careful analysis of the response of a building
area radiation monitor, situated near the ventilation ducts that led to the stack vent
where the radiation levels were sufficiently low to avoid detector saturation. Intercom
parison of this detector's response with that of the vent monitor at various radiation
levels below the vent monitor's saturation limit, permitted extrapolation of vent radia
tion levels above the vent monitor's saturation level. This analysis led to a total noble
gas release of 2.4 million curies.
The uncertainty associated with the noble gas release estimates are within a factor
of 4. The 10 million curie estimate, which represents about 8-10% of the noble gas
core inventory at the time of the accident, seems to be in reasonable agreement with
more recent information on the post accident inventory and distribution of radionuclides
within the TMI-2 reactor system. This study revealed that 91 % of the Kr-85 could be
accounted for within the containment atmosphere, the previously melted fuel, and the
in-tact fuel-rods; thus, inferring a 9% loss to the atmosphere.[3]
EXTERNAL DOSE ESTIMATION
Several approaches were taken to estimate the radiation dose received by the af
fected population due to the release of noble gases. This included several independent
studies based on atmospheric dispersion modeling in conjunction with the environmen
tal radiation measurements as well as spatial interpolation of the TLD measurements
at a limited number of locations surrounding the site. The various dispersion modeling
efforts used a variety of models that ranged from Gaussian to complex three-dimensional
models.
Meteorological data were available from the on-site tower as well as from several local
sources. The meteorological conditions during the first five days of the accident, when
the highest release rates occurred, consisted mainly of up and down-river flows. From

- 118 -
the morning on March 28, when the release was initiated, until mid-afternoon on March
29, the winds were primarily from the southeast- southwest direction at approximately 3
m/s. Subsequently the winds rotated to a northeast-northwest direction with an average
speed of 1-2 m/s. Calm and highly variable conditions were observed during the night
of March 29-30. These calm and variable conditions continued until the evening of
March 30 when strong and steady southerly winds of about 3 m/s returned. On April
1 the winds rotated into the westerly to northwesterly directions with speeds generally
ranging between 1-3 m/s.
Atmospheric dispersion modeling, based on these meteological conditions, permit
ted elucidation of the temporal evolution of the time-integrated dose pattern. This is
illustrated in Fig. 2 which shows the evolving integrated dose pattern.l4l These results
were generated by means of a three-dimensional mass-consistent wind field model cou
pled with a particle-in-cell transport and diffusion model using a normalized one million
curie release that varied in time according to that shown in Fig. 1. The figure shows how
the dose pattern was quickly and predominantly established by the generally south-to
north flow during the initial release period. Thereafter, the low levels of release resulted
in only relatively minor but discernible changes in the initial dose pattern. Note partic
ularly the southward extension of the pattern from March 29 to March 30, the east and
southeast spread from March 30 to March 31, and finally the "diffusion-like" effect of
nine days of synoptic and diurnal meteorological variations with a small source term.
Integration of atmospheric dispersion patterns with the environmental radiation
measurements permitted the estimation of the total integrated dose to the exposed
populations. Using the DOE aerial radiation measurements made within the plume on
a regular basis over a two week period, resulted in the DOE integrated dose pat tern
shown in Fig. 3.[5] Note that the highest doses occurred in the areas immediately north
of the plant with secondary nodes extending in the southeast and easterly directions.
A similar pattern was generated by GPU after integrating the TLD measurements with
their finite plume dispersion modeling.l1l These studies indicate that a total dose of
100 mrem was exceeded over an area extending several kilometers in a northeast to
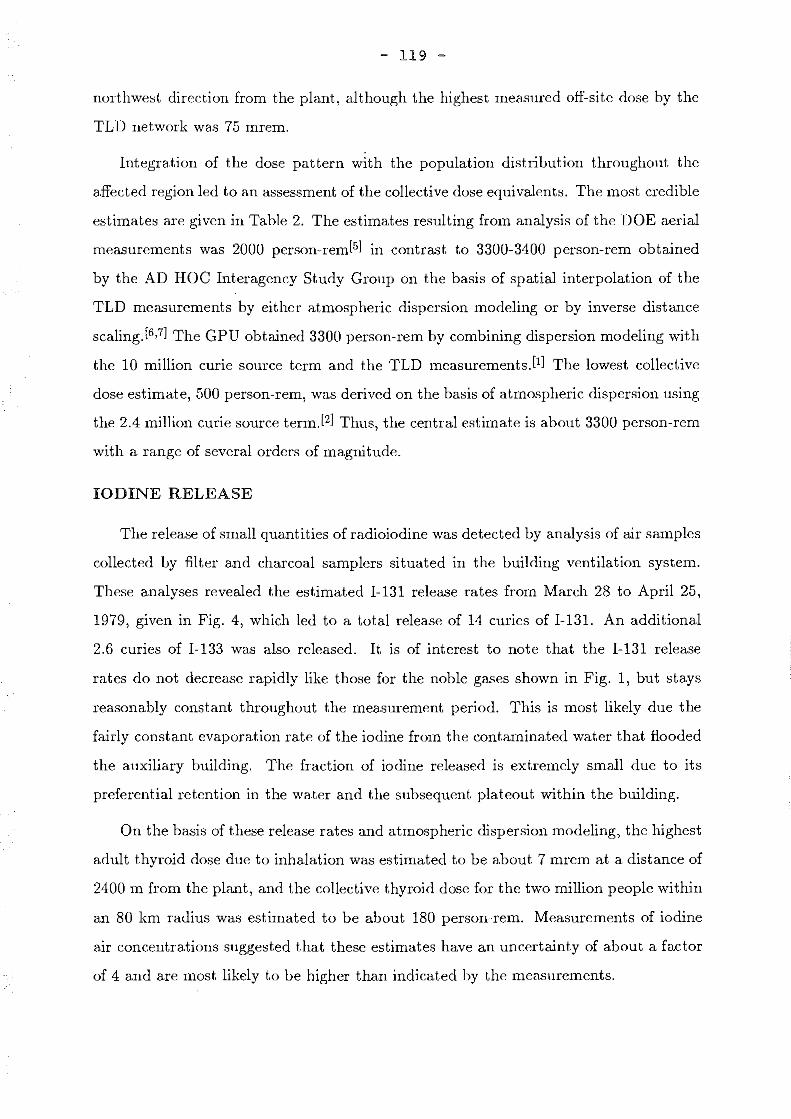
- 119 -
northwest direction from the plant, although the highest measured off-site dose by the
TLD network was 75 mrem.
Integration of the dose pattern with the population distribution throughout the
affected region led to an assessment of the collective dose equivalents. The most credible
estimates are given in Table 2. The estimates resulting from analysis of the DOE aerial
measurements was 2000 person-rem[5l in contrast to 3300-3400 person-rem obtained
by the AD HOC Interagency Study Group on the basis of spatial interpolation of the
TLD measurements by either atmospheric dispersion modeling or by inverse distance
scaling.[6 ,71 The GPU obtained 3300 person-rem by combining dispersion modeling with
the 10 million curie source term and the TLD measurementsJ1l The lowest collective
dose estimate, 500 person-rem, was derived on the basis of atmospheric dispersion using
the 2.4 million curie source term.[2] Thus, the central estimate is about 3300 person-rem
with a range of several orders of magnitude.
IODINE RELEASE
The release of small quantities of radioiodine was detected by analysis of air samples
collected by filter and charcoal samplers situated in the building ventilation system.
These analyses revealed the estimated I-131 release rates from March 28 to April 25,
1979, given in Fig. 4, which led to a total release of 14 curies of I-131. An additional
2.6 curies of I-133 was also released. It is of interest to note that the I-131 release
rates do not decrease rapidly like those for the noble gases shown in Fig. 1, but stays
reasonably constant throughout the measurement period. This is most likely due the
fairly constant evaporation rate of the iodine from the contaminated water that flooded
the auxiliary building. The fraction of iodine released is extremely small due to its
preferential retention in the water and the subsequent plateout within the building.
On the basis of these release rates and atmospheric dispersion modeling, the highest
adult thyroid dose due to inhalation was estimated to be about 7 mrem at a distance of
2400 m from the plant, and the collective thyroid dose for the two million people within
an 80 km radius was estimated to be about 180 person-rem. Measurements of iodine
air concentrations suggested that these estimates have an uncertainty of about a factor
of 4 and are most likely to be higher than indicated by the measurements.

- 120 -
Milk samples were collected at numerous dairies to evaluate the I-131 concentra
tions. Of approximately 250 samples collected, less than half of the samples showed
detectable concentrations. The highest measured concentration in milk was 41 pci/1
and the average concentration was less than 20 pCi/U5l This potentially could have
resulted in a child thyroid dose of about one millirem.
CONCLUSIONS
Extensive environmental monitoring of radioactivity throughout the Harrisburg area
during the TMI-2 accident revealed that the environmental and health implications of
the noble gas and iodine releases were minimal. Approximately 2.4-10 million curies
of noble gases (mainly Xe-133) were released; the higher value being the most likely.
The collective dose resulting from the release to the 2 million people living within a
radius of 80 km of the plant was about 3300 person-rem. This represents about 1 % of
the normal annual background radiation dose for that area. The average dose to an
individual living within 8 km of the plant was estimated to be about 10% of the annual
background dose. The maximum estimated dose received by an off-site individual was
about 75 mrem.
The 14 Ci release of I-131 resulted in barely detectable levels of I-131 in air and milk
samples collected during the accident. These low levels of activity may have produced
thyroid doses of a few millirem to a small segment of the surrounding population. Thus,
no detectable health impacts due to radiation exposure were expected to occur as a result
of the accident.
REFERENCES
1. Woodard, K., "Assessment of off-site radiation doses from the Three Mile Island
Unit 2 accident," General Public Utilities Report TDR-TMI-116, 1979.
2. Auxier, J.A., Berger C.D., Eisenhauser C. M., Gesell T. F., Jones A. R. and Mas
terson M. E., "Report of the Task Group of Health Physics and Dosimetry," in:
Report of the Public Health and Safety Task Force to the President's Commission
on the Accident at Three Mile Island, 1979.

- 121 -
3. Akers, D.W., Tolman E.L., Kuan, P., Golden, D.W. and Nishio, M., "Three Mile
Island Unit 2 fission product inventory estimates," Nucl. Technology, 87, 205-213,
1989.
4. Knox, J.B., Dickerson, M.H., Greenly, G.D., Gudiksen, P.H., and Sullivan T.J.,
"The Atmospheric Release Advisory Capability (ARAC): Its use during and after
the Three Mile Island Accident," Lawrence Livermore National Laboratory Report
UCRL-58194, 1981.
5. Hull, A.P., "A critique of source term and environmental measurement at Three
Mile Island," IEEE Transactions on Nuclear Science, NS-27, 1980.
6. AD HOC Interagency Dose Assessment Group, "Population dose and health impact
of the accident at the Three Mile Island Nuclear Station," US Nuclear Regulatory
Commission Report NUREG-0558, 1979.
7. Pasciak, W., Branagan E.F., Congel F.J., and Fairobent J.E., "A method for cal
culating doses to the population from Xe-133 releases during the Three Mile Island
accident," Health Physics, 40, 457-465, 1981.

- 122 -
FIGURE CAPTIONS
Fig. l. Estimated noble gas release rates from the TMI-2 accident.
Fig. 2. Normalized calculated integrated dose patterns in units of millirem due to TMI-
2 noble gas release on (a) March 29 (24-h integration), (b) March 30 ( 48-h
integration), ( c) March 31 (72-h integration), and ( d) April 7, 1979 (240-h
integration). The patterns are based on the release of one million curies of
Xe-133.
Fig. 3. Estimated dose pattern derived from the DOE aerial measurements from March
28-April 3, 1979. The units are in millirem.
Fig. 4. Estimated 1-131 release rates.
TABLE HEADINGS
Table l. Estimated noble gas releases ( megacuries).
Table 2. Estimates of collective dose equivalents due to noble gas releases from TMI-2
accident.
Filename: UCRL-phg-tmipaper.tex

- 123 -
108
" Estimated from TLD measurements, dispersion modeling and area monitor data
• Grab samples of vent effluent
107 ... Effluent monitor data !!!. 0 :I. I
"' -~ "' 106
"' "' "' ai ~
"' "' Cl
.Jl!
.c 105 0
c: 'ti
"' - • "' E :;::
"' w 104
.... ... .... ..
... ... 1033/28 4/3 4/6 4/15 4/21 4/27 5/3 5/9
Date
Fig. 1. Estimated noble gas release rates from the TMI-2 accident.

- 124 -
(a) (b)
4480 E .>:
:§4460 0 z Q)
g4440
"' -"' 0 4420
4400
(c) (d)
4480 E .>: • '24460 0 z Q)
g4440
'° -"' 0 4420
4400L---1.~--1.~~L..-~.l__..:,;,,._j L---'-~--'~~'--~-'---'-"-' 320 340 360 380 400 320 340 360 380 400
Distance East-km Distance East-km
Fig. 2. :'.\ormalized calculated integrated dose patterns in units of millirem due to TMI-2 noble gas release on (a) :-'larch 29 (24-h integration), (b) March 30 ( 48-h integratiun j, (c) :,larch 31 (72-h integration), and [dJ April 7, 1979 (240-h integration). The patterns are based on the release of one million curies of Xe-133.

- 125 -
0.5 1 1 0.5
Fig. 3. Estimated dose pattern derived from the DOE aerial measurements from March 28-April 3, 1979. The units are in millirem.

- 126 -
!I}_ i:3 :l. 20 (I) -"' er: (I)
"' "' (I)
Qi er: 10 ~
"" ~ .!.
03/26 3/31 4/5 4/10 4/15 4/20 4/25 4/29
Date
Fig. 4. Estimated I-131 release rates.

- 127 -
Table 1. Estimated Noble Gas Releases* (Megacuries)
Period
Isotope 3/28'-3/29 3/29-3/31 3/31-4/3
Xe-133 4.9 2.1 1.1
Xe-133m 0.12 0.039 0.015
Xe-135 1.5 0.077 0.0014
Xe-135m 0.14 0.0013 0
Kr-88 0.061 0 0
Total in Period 6.6 2.2 1.1
% of Total 65 22 10.8
Cumulative 65 86 97
*To4/30n9
4/3-4/6 4/6-4/30 Total*
0.27 0.015 8.3
0.0019 - 0.17
0 0 1.5
0 0 0.14
0 0 0.061
0.27 0.015 10.2
2.6 0.15 100
99.8

- 128 -
Table 2. Estimates of Collective Dose Equivalent Due To Noble Gas Releases From TMI-2
Accident.
Group
DOE
GPU
ADHOCGroup
ADHOCGroup
Pres. Commission
Technique
Aerial measurements
TLD measurements and
dispersion modeling
TLD measurements and
dispersion modeling
Spatial interpolation of
measurements
Source term and dispersion
modeling
Person-rem
Best Value Range
2000
3300 1650-6600
3400
3300 1600-5300
500 50-5000
- 129 -
Twenty-Five Years Before Chernobyl
Gueorguy KUZNETZOV
Vernadsky Institute of Geochemistry and Analytical Chemistry USSR Academy of Sciences, Moscow, USSR

- 130 -
Our international Seminar is to deal exclusively with the consequences of three major nuclear accidents: Kyshtym, Windscale and Chernobyl.
For this reason, I had orig i na I I y not p I anned to present this paper, which deals with another major incident. However, while attending this meeting of the International Union of Radioecologists, I felt that such a representative group of specialist radioecologists from 20 countries of the world would be interested to hear about the serious accident which took place on a nuclear submarine in 1961, 25 years before Chernobyl. This accident could also have led to a world ecological catastrophe comparable with that of Chernobyl. Fortunately, however, it was possible to prevent this, but at a high price - the loss of several I i ves. The ace i dent took p I ace in the nuc I ear reactor of the first Soviet missile-carrying nuclear submarine.
Unti I July 1990 it was forbidden even to mention this event. However, times change, and international cooperation, including cooperation in the scientific sphere, is being extended and consolidated.
We managed to have two articles pub I ished on this subject in the Pravda newspaper under the heading "Top secret". The first article was entitled "25 years ~efore Chernobyl" and the second "T~e atom did not explode in the sea".
I doubt whether al I European and American scientists subscribe to the main newspaper of our country. What is more, the newspaper articles were not long enough to Include al I the detai Is and, as I witnessed the events of 1961, I would I ike to give you first-hand information myself.
At 4 a.m. on 4 July 1961 there was a depressurization in the primary coolant circuit in one of the two water-water reactors on the missilecarrying submarine in the northwestern part of the Atlantic Ocean several thousand kilometres from the Soviet Union. This was caused by a crack in the piping of the system control I ing the reactor. This piping was connected to the primary coolant circuit. In reactors of this type the water in this circuit is a moderator and coolant at the same time, has a mean temperature of around 300'C and is kept at a pressure of several hundred atmospheres with the aid of a special gas-based highpressure system.
As a result of the depressurization the pressure in the primary coolant circuit of the stricken reactor fell to approximately atmospheric pressure and the water boiled and evaporated.
This meant that the core had no cooler. The reactor protection system functioned correctly, and the emergency shutdown rods (compensatory lattice) dropped down into the lower part of the core and the reactor became subcr it i ca I. In other words, the reactor was shut down automatically, and the operators then carried out all the necessary work on the systems of the damaged reactor. In this way, the possibi I ity of an uncontrolled chain reaction in the core of the stricken reactor was averted at the beginning.
But as they say, "it never rains, but it pours": a fire broke out in the compartment of the stricken reactor but was fortunately extinguished before it spread. The submarine surfaced for the first time after many weeks at sea.
In add it ion, the loss of pressure in the primary coolant circuit and the fire caused radioactivity to spread through the compartments of the submarine.

- 131 -
I cannot give you detailed data on the gamma, beta and alpha activity at the moment. Suffice it to say that the total contamination level in the submarine's control room reached 50 R/hour and in some parts of the reactor compartment the contamination level was extremely high, but the conditions made it extremely difficult to obtain precise values.
Natural IY, the compartments of the submarine were hermetically sealed, but it was not possible to cut off all I inks between them.
However, the greatest danger was that the temperature of the fue I elements in the shut-down, subcritical reactor, which had been working at 100% capacity for many weeks prior to the accident and whose core had been left without cooling, began to rise as a result of fission and the absence of heat removal.
Normal afterheat removal from the shut-down reactor was not possible, and the spraying of the core was ineffective. The temperature on the surface of the fuel elements rose inexorably to over soo·c. There was a serious danger that the fuel elements would melt as a result of afterheat. Melting of the fuel elements could have made the reactor core unstable. There was the possibi I lty of an uncontrollable reaction. Even if this had not happened, there was a possibility that the core and the reactor vessel would be destroyed, with all the resulting conseQuences for the crew of the submarine and the environment.
If the stricken reactor had come to rest on the ocean bed, it could not have produced an ecological disaster on the scale of Chernobyl for many objective reasons of which you wil I be aware, but it would nevertheless have been a catastrophe with global conseQuences.
In order to prevent this, a temporary emergency system for cooling the core with fresh water, of which the submarine had a reserve, was planned and implemented for a duration of several hours. A number of weapons systems on the submarine had to be dismantled in order to have sufficient piping for this system. It was necessary to carry out welding work in the reactor compartment itself. The operators who carried out this work were first-rate specialists who were fully aware of the risks involved.
The system proved to be effective, as it succeeded in stopping the rise in temperature of the fue I e I ements and prevented their me I tdown and the explosion of the core, but at the loss of several lives.
Seven people died one week later. These were Lieutenant Boris Korchi lov and petty officers and seamen Boris Ryzhikov, Yury Ordochkin, Yevgeny Kashenkov, Semen Penkov, Niko I ay Savi< in and Va I ery Khar i tonov. Three weeks after the accident Lieutenant Commander Yury Povetev died.
This is the information I wanted to give you on this previously unknown major accident which could have caused a major ecological disaster.
doubt whether al I mi I itary nuclear installations, in particular submarines, will be taken out of use In the near future. However, although the situation in the world is by no means perfect, things are certainly improving, which gives us grounds to hope that mi I itary sources of radioactivity and all potential sources of radioactive contamination of the environment will be limited and will one day disappear altogether.

- 132 -

- 133 -
Session Ill
ATMOSPHERIC DISPERSION, RESUSPENSION, CHEMICAL AND
PHYSICAL FORMS OF CONTAMINATION

- 134 -

- 135 -
Atmospheric Dispersion Models in Assessment of Accidental Releases (illustrated by the Windscale and Chernobyl
Accidents)
H.M. ApSIMON, J.J.N. WILSON, A. GODDARD
Air Pollution Group Imperial College, London SW? 2Al., UK

- 136 -
Abstract:
Analysis of the pattern of dispersal and deposition of radionuclides, using the MES OS
long-range atmospheric transport model, will be described for both the Windscale accident
of 1957, and the Chernobyl accident of 1986. Deductions about source terms will be
discussed, and limitations of the techniques used. New developments in models for use in
any future accident situation will also be reviewed.

- 137 -
Introduction
Under article 37 of the Euratom treaty member states of the European Community are
required to consider the transfrontier consequences of a nuclear accident in another country
when planning a new nuclear plant. In this connection we developed techniques for
assessing such consequences in a probabilistic manner by treating a large number of
hypothetical accidents of varying release duration and in different meteorological
conditions. This involved construction of a computer model, MESOS, for atmospheric
transport and deposition of different nuclides out to long distances. This rather simple
model has been applied to study both the Windscale and Chernobyl accidents, and the
results will be described in this paper together with some of the difficulties and
uncertainties.
The MESOS model, for application to large numbers of situations, was necessarily rather
simplified and limited by the data used. Since the Chernobyl accident new models have
been developed, suitable for use in any future emergency. These techniques will also be
described, and the ongoing work to improve them, especially in critical situations (for
example in frontal systems where wet deposition is likely to occur).
The MESOS model
Before embarking on the two accidents a brief description of the MESOS computer model,
which we have used as a tool in analysing the pattern of environmental contamination,
seems appropriate. MESOS uses meteorological data to simulate dispersal of the release
downwind. Thus it follows in detail the trajectories and history of puffs released at 3 hour
intervals, assuming that meterial released in between fans out along intermediate
pathways. The vertical dilution depends on the evolution of the atmospheric boundary
layer, particularly changes in depth of the turbulent mixing layer above the ground
Separate dry deposition and wet deposition in precipitation are calculated, as well as
time-integrated atmospheric concentrations of each nuclide. The meteorological input
comprises standard observations from synoptic weather stations reporting routinely,
including the "present weather" code to indicate rainfall and its character and intensity.
Thus the model is designed for a posteriori investigation, not in forecasting mode during
an emergency.
By comparing radiological measurements with model estimates it is possible to work
backwards to assess the source te1ms, as is illustrated in this paper.
THE WINDSCALE RELEASE:-The pattern of release
The release from Windscale took place over two days starting around 8. lOam on the

- 138 -
morning of 10 October 1957,when stack monitors first showed an increase of activity.
The accident resulted from the uncontrolled release of Wigner energy within the graphite
moderator blocks, and by the end of that day 150 channels of fuel were involved in the
resulting fire. The decision was taken to douse the pile with water, and accordingly water
was switched on at 8.55 am the next day, 11 October.
The nuclide most widely monitored was I-131, and it is this nuclide which our own
studies have concentrated on. Although stack monitors were in place the total quantities
released are still somewhat uncertain. However it seems probable that most of the
radioactivity escaped in two main peaks, the first occuning in the final hours of 10
October when the maximum number of fuel channels was involved; and the second
immediately after water was poured on the pile the next day. Over the rest of the accident
release rates were variable but much lower. The results presented here are based on the 2
release patterns shown in figure 1, and show the sensitivity to the assumptions made about
the pattern of release. The first considers just the peak periods of release; the second a
more distributed pattern of release. The consistency of these assumed release patterns with
radiological measurements will be discussed below.
The meteorological situation The meteorological situation has been discussed by Crabtree (1959), and figure 2 shows
the synoptic charts reproduced from his paper. At midday on 10 October a cold front lay to
the north-west of Windscale, gradually moving south-east and crossing Windscale shortly
after midnight. The release can rough! y be divided into two parts; that released ahead of
the front, and that released following passage of the front. Ahead of the front geostrophic
winds were light and south to south-westerly over Windscale. During the afternoon of 10
October the situation was fairly straightforward, but at dusk an inversion formed in the
lowest layers of the atmosphere. Winds at the surface differed from those higher up, with
local complications such as shallow katabatic winds. However the release took place from
the top of a stack 120 metres high, at about the same height as the inversion. It seems
likely that most of the activity released at this time was canied away to the north-east just
above the inversion. After passage of the front the wind direction veered to the north,
giving rise to a plume of radioactivity southwards down the Cumberland coast.
Subsequently the front moved on to the south-east across England, gradually decaying and
disappearing. After passage of the front the centre of an anticyclone moved slowly across
south-east England to the Continent, with moderate westerly winds to the north over the
n011hern half of England and the No11h Sea.

- 139 -
Scattered light showers were recorded in north-west England during the period from
18.00 hours on 10th to 06.00 hours on 11 October, and from records at Barrow it is
known that most of the fall occurred between 17.00 and 19.00 hours on 10 October,
before the first peak in the release. Chamberlain ((1959) and Crabtree(1959) note that no
rain fell to the East of the Pennines. It was therefore decided that rain was unlikely to be
important, and wash-out in precipitation was ignored, although there may have been some
hill-fog and slight drizzle giving enhanced deposition over high land to the south of
Windscale.
Trajectory analysis
Unfortunately the detailed meteorological data required for the MESOS program was not
available for as long ago as 1957. Trajectories were thereore plotted by hand using the
hourly presssure charts in the archives department of the UK Meteorological Office.
Inevitably these are somewhat subjective, and there are considerable uncertainties in the
neighbourhood of the frontal zone, although this was a weak and decaying
system.Various sensitivity studies were conducted to test the stability of the trajectories,
and comparison of arrival times at various locations was in fair agreement with trajectory
predictions (see figure 3).
The handplotted trajectories spanning the period of the accident are shown in figure 4. The
three trajectories in figure 4a are for the early part of the release period on the morning of
10 October, and move slowly off to the north-east across England before swinging south
towards continental Europe; the earlier the start of the trajectory the further east the
trajectory moves. If much radioactivity had been released during this period then, as
shown later, it would be expected that fairly high levels of radioactivity would have been
detected to the north-east across England, since there was no inversion during the day to
inhibit transport down to the ground. Measurements of radioactivity on grass
(Chamberlain and Dunster 1958) indicate relatively low levels of contamination in this
direction, and therefore it seems that little could have been released until later on 10
October. However small amounts emitted during this petiod could have been responsible
for the relatively early times at which monitoring stations in Europe registered increased
levels of radioactivity. The arrival of radioactivity was registered almost simultaneously in
London, Moland Antwerp at about 18.00 hours on Friday 11 October (see figure 3) and
is consistent with the plotted traject01ies .

- 140 -
Trajectories plotted, starting on the evening of IO October, are shown in figure 4b. It can
be seen that these do not reach Europe but circle round the anticyclone over south east
England before leaving the map area to the east early on 14 October. These trajectories
reach London at about the time when maximum levels were recorded there at about 02
hours on 12 October, these levels falling by an order of magnitude by mid-day on 12th.
The trajectories seem to leave the map rather too early to the east since radioactivity was
not detected on filters in Norway until 15 October; but trajectories become increasingly
inaccurate with longer travel times, and material could easily have lingered in the
anticyclonic system for longer.
Trajectories of puffs released after passage of the front when the wind veered to the north
are shown in figure 4c. These move south along the west coast and loop round before
penetrating to southern England and turning back over Wales. Relatively low levels were
detected in North Wales and it seems probable that these trajectories wuld not have looped
back so far north. The topographical features of Wales and the Pennine chain may also
have played some role as barriers channelling the flow.
Integrated atmospheric concentrations
Time-integrated atmospheric concentrations were calculated across northern Europe for
both emission patterns shown in figure 2, by modelling the dispersion and depletion along
the appropriate trajectories, assuming a basic dry deposition velocity of 3xI0-3m_s-l and a
radioactive half-life of 8.1 days for I-131. Contours of I-131 integrated concentrations
resulting from the simple two-peaked release, pattern (a), in figure 2, are shown on the
small and large scale maps in figures 5 and 6 respectively. The calculated contours within
the smaller map area show the dominance of the second peak in the release, resulting in the
plume down the Cumberland coast spreading south over Lancashire. Radiaoctivity from
the first peak travels above the inversion without reaching ground level until fumigation
occurs the following morning over North Yorkshire. This plume is partly visible in the top
right hand corner of figure 5 but is clearly seen on the larger scale map in figure 6.
Unfortunately no measurements are available over North Yorkshire to confirm this
prediction. The contours in the bottom corner of figure 5 show the effects of the second
pass of activity over south Lancashire after circulation round the anticyclone. This
recirculation is seen on a larger scale in figure 6 with radiocativity eventually dlifting over
the North Sea. The simple release pattern gives no exposure over the Continent due to the
exclusion of emission in the early phase of the accident. There is also a tendency to

- 141 -
underestimate air concentrations across England.
The MES OS calculations using the release pattern (b) are shown in figures 7 and 8. When
early releases are included the agreement between calculations and measurements in
Europe improves considerably; the agreement across England is also good. This release
pattern produces higher concentrations to the north-east of Windscale. This is consistent
with measurements of deposition on grass in the locality of Windscale but conflicts with
the fact that no activity was measured at Newcastle. Concentrations near the coast of
continental Europe are in reasonable agreement with measurements, but are too low
inland. Agreement would have been better if the trajectory initiated at 06.00 on 10 October
had been followed further; it can be seen from figure 4 that this was only tracked until just
after crossing the coast. Subsequent plotting implies that this trajectory became stationary
in the anticyclone until about 03.00 on 13 October, and this would have led to higher
concentrations.
Deductions
Comparison of calculated and measured time-integrated concentrations of 1-131 are
consistent with a release of about 30,000 Ci of I-131 ( - 1015Bq) distributed in time
approximately as shown in figure 2b. Apart from a few points over west Yorkshire the
model results and measurements are within a factor 3.Bearing in mind the sensitivity of the
contamination at the measurement positions to small changes in the trajectories, and the
uncertainty in the release pattern, it was felt that the results produced by the MESOS model
were quite satisfactory, especially since the meteorological conditions were quite complex.
THE CHERNOBYL ACCIDENT
The analysis undertaken by ApSimon and Wilson and co-workers on the Chernobyl
accident has been summarised in a recent paper (Ap Simon, Wilson and Simms1989), and
also published in Russian (ApSimon 1990). The work will therefore only be briefly
summarised here.
The early radiological data as the Chernobyl release spread across Europe were
extremely varied, confused by a wide range of units, types of measurements and
measurement techniques. Some countries reported peak activity, others indicated average
levels and yet others provided little information at all. Although the MESOS model had

- 142 -
never been intended for application to a real accident situation, it was operational, only
requiring meteorological data standardly available from the UK Meteorological Office.
Consequently within 3 weeks of the accident we had undertaken an initial analysis of the
pattern of dispersal, and deduced approximate source terms which were in good agreement
with Soviet estimates subsequently presented in Vienna in August 1986. It was also
apparent from observations over S Europe that there had been a continued release into the
early days of May, although the reasons for this were not known at the time.
A detailed description of the spread of the release may be found in ApSimon, Wilson
and Simms (1989). Sequential maps show the transport of the initial release to
Scandinavia, where a weak frontal system led to some areas of high wet deposition.
Subsequent material moved south across Poland; and then across central Europe, in a
wedge shaped formation to the south of a ridge of high pressure which intruded from the
Atlantic. Some material went east across the Soviet Union, and then trajectories turned
westwards again across Europe. As a centre of high pressure moved across the north
coast of Europe radioactive material circulated northwards behind it, reaching the UK on 2
May, and venting much of the material to the North Sea. During the early days of May
trajectories moved down over Greece, and then turned north to give further enhanced
levels over Scandinavia again.
As more extensive radiological measurements became available more detailed
calculations were undertaken, and used to assess approximate daily releases of 1-131,
Cs137, and the less volatile Ru-103.These results are given in table I. It should be noted
that these are less than the Soviet estimates, which is to be expected since they exclude the
coarser material which was deposited locally close to the reactor. The ratio of Ru to Cs
increases in the later phases when temperatures in the core rose, blanketed by the loads of
boron, lead, sand and dolomite dropped from above to cover the exposed core. The total
1-131 released was two orders of magnitude greater than from the Windscale accident, but
for Europe the main problems arose from Cs-137, which was patchily deposited according
to rainfall patterns.
The calculated deposition of Cs, averaged over rather large grid squares is shown in
figure 9. Based on these averaged levels of deposition the effective whole body collective
dose commitment over 50 years was calculated for the European population outside the
USSR. This allowed for exposure from both ingestion and external irradiation, and
amounted to a total of 2.0. 10s man Sv., implying an average dose commitment to these
- 143 -
550 million people of 0.4 mSv; equivalent to about 2 months natural exposure to radiation.
The variation about this was ve1y large however, especially in areas where precipitation
occurred.
It was concluded that the MESOS model had given a general indication of the pattern
of dispersal, and provided a framework for interpretation of measurements. However it is
a very simple model, essentially based on surface meteorological data, and its limitations
were well recognised- for example in the frontal system over Scandinavia where the
wind-field is very 3-dimensional in character, with ascending material following quite
different trajectories than is indicated by surface winds.
New modelling tools for use in the event of a nuclear accident.
Since the Chernobyl accident there has been development of dispersion modelling
tools in many countries.Some of these are based on trajectory calculations, but others are
far more sophisticated requiring considerable computer resources. There ai·e basically 2
approaches. The first integrates the advection-diffusion equations for a regular
3-dimensional grid, the so-called Eulerian approach. The second involves simulating the
release as an assembly of particles followed across the domain- the Lagrangian approach.
(There are also some hybrid models such as the particle -in cell approach of Lawrence
Livermore Laboratory, which considers an assembly of particles but in conjunction with
diffusion according to concentration disttibution within a giid).
For our own improved model we chose a Monte-Carlo approach. There were several
reasons for this; it avoids some numerical problems (numerical diffusion), it is easy to
distinguish different sections of the release and revise results for different evolution of the
source terms, and it gives some indication of probabilities of material deviating from the
mean trajectory path. This model has been incorporated in an overall EC computer package
(which is available from ENEA in Italy) for application in nuclear accident
situations.together with models for closer-in assessment of contamination, and dose
estimation and effectiveness of counter measures. Since it is quite likely that if depositing
nuclides are released in an accident, they may become incorporated in frontal systems, we
feel that it is especially important to study transport through such systems.
Accordingly studies are now in progress in collaboration with the UK Meteorological
Office, together with more refined development of the overall 3DRA W model. Another
aspect where technological capabilites can be improved is in the treatment of wet

- 144 -
deposition. In the UK, there is a good network of weather radars giving detailed
observations of rain in space and time. Following Chernobyl we used this data to estimate
small-scale maps of deposition (see ApSimon, Collier and Simms 1988), and successfully
picked out the more contaminated areas. This approach could be very useful for direction
of monitoring teams to the most affected spots in any future, and is feasible over
increasing areas of Europe as weather radar coverage increases. Thus in any future
accident far more sophisticated tools will potentially be available to assist in direction of
emergency procedures.
References:-
ApSimon HM, Goddard AJH, and Wrigley J 1985 Long-range atmospheric dispersion of
radioisotopes- I The MESOS model. Atmos. Env. 19, 99-111
ApSimon HM Collier C, Simms KL 1988 The use of weather radar in assessing
deposition of radioctivity from Chernobyl across England and Wales. Atmospheric
Environment 22,
ApSimon, HM Wilson JJN and Simms KL 1989 Analysis of the dispersal and deposition
of radionuclides from Chernobyl across Europe. Proc. R.Soc Lond. A425, 365-405
Chamberlain AC 1959. Quart J Royal Met Soc 85,350-361
Chamberlain AC and Dunster J 1958 Nature 182, 629-630
Crabtree J 1959 The travel and diffusion of the radioactive material emitted during the
Windscale accident. Quart J Royal Met Soc. 85, 362-370

- 145 -
Table 1 :- Estimated daily releases of 3 nuclides based on MES OS model results and
available measurements

- 146 -
Figure 1. Release patterns postulated for the release in 1957 of 1-131 from the Windscale
No 1 pile.
Figure 2. Surface synoptic charts 10-12 October 1957 (from Crabtree 1959)
Figure 3. Variation of air activity at a number of stations 11-13 October 1957(from
Crabtree 1959)
Figure 4a Estimated trajectories initiated ahead of the front passing over Windscale
Figure 4b Estimated trajectories starting on evening of 10 October
Figure 4c Estimated trajectories starting on the morning of 11 October
Figure 5.Calculated time-integrated air concentrations (contours) compared with measured
values (underlined) over NW England for release pattern (a)
Figure 6.Calculated time-integrated air concentrations (contours) compared with measured
values (underlined) over NW Europe for release pattern (a)
Figure 7. Calculated time-integrated air concentrations (contours) compared with measured
values ( underlined) over N W England for release pattern (b)
Figure 8.Calculated time-integrated air concentrations (contours) compared with measured
values (underlined) over NW Europe for release pattern (b)
Figure 9. Calculated deposition of Cs-137 from Chernobyl across Europe

- 147 -
Table 1:- Estimated daily releases of 3 nuclides based on MESOS model results and
available measurements
day estimated release/ ( 1015 Bq day-1 )
(from 21 hOO to 21 hOO) rnaRu 131cs 131J
25/04 - 26/04 29 15 190 26/04 - 27 /04 12 5.6 43 27 /04 - 28/04 9.9 4.71 25 28/04 - 29/04 Iowa low• low" 29/04 - 30/04 0.76 0.38 3.8 :l0/04 - 01/05 :l.6 0.76 I. I 01 /05 - 02/05 6.:l f. l 4.9 02/05 - o:i/o5 3.5 1. !J 15 o:l/05 - 04/05 4.H 2.7 rn 04/05 - 0.5/05 5.9 :i.o 21 05/0.5 - Ofi/05 low• low" low•
totals at O(i.05 fi7 :l.5 170
" [ ,P,SS than 1.() X 1014 .

- 148 -
5000 Release Pattern (a)
4000
JOOO
2000
L ~
1000
u
J:' ::' " ~ d Release Pattern (bl " " er JOOO
2000
1000
06 12 18 06 11
10th OCTOBER 11th OCTOBER
Figure 1. Release patterns postulated for the release in 1957 of I-131 from the Windscale
No 1 pile.

L
- 149 -
(a) 1200 GMT 10 October 1957
__J
(c) 0000 GMT 11 October 1957
(e) 0000 GMT 12 October 1957
(b) 1800 GMT 10 October 1957
(d) 1200 GMT 11 October 1957
(f) 1200 GMT 12 October 1957
Figure 2. Surface synoptic charts 10-12 October 1957 (from Crabtree 1959)

- 150 -
MOL
>~ f---'--1,-=:::L...-t-~'---_l__~~.J.._~__JL_.__.____J
>
Figure 3. Variation of air activity at a number of stations 11-13 October 1957

- 151 -
311 ,
,.'}'/\,, / 21·10
/
6·11
- -- 0600 hours 0-------0 0900 hours .,....__.. 1200 hour s
Figure 4a Estimated trajectories initiated ahead of the front passing over Windscale
18·13
___, 2100hours _........, 2400hours
'\OOkm
Figure 4b Estimated trajectories starting on evening of 10 October

- 152 -
613
- 0600hours: -.. 0900hours - 1200hours:
~
Figure 4c Estimated trajectories starring on the morning of 11 October

- 153 -
s,,·"~~~,V0~\,\%
xx meosurerrents - (pC1.days.rii 3)
llll liver pool measurement takes om a mooth \J
Figure 5.Calculated time-integrated air concentrations (contours) compared with measured
values (underlined) over NW England for release pattern (a)
5•1, 57°N~--~----------:----=---,ir.;----,
g measurementslp(i.days.lll 1) /7
10°E
31 l9.
Figure 6.Calculated time-integrated air concentrations (contours) compared with measured
values (underlined) over NW Europe for release pattern (a)

- 154 -
54 7°N~~...,,------,-;:,;,-----------,\.,;-V -,---;\ \c-i0
.,, Q • \
X)( measurements - (pCi. days. rii3 I
• Liverpool measurement taken over a month.
Figure 7.Calculated time-integrated air concentrations (contours) compared with measured
values (underlined) over NW England for release pattern (b)
Figure 8.Calculated time-integrated air concentrations (contours) compared with measured
values (underlined) over NW Europe for release pattern (b)

I
< 11,::1 I I•::! I 1,::1
" I 1,::1- I Kt " I !•:+ I E,, 111 > I 1,:,,
I
,./'
/ ( ()
- 155 -
-~---- -- ----·------- --- ---------· ----·------------·-----------------
Figure 9, Calculated deposition of Cs-137 from Chernobyl across Europe
l
_J

- 156 -

- 157 -
Some Common Features of the Formation and Conduct of the
Products of Chernobyl Accident in the Environment
O.V. RIJMIANTSEV, LM. KHITROV
Vernadsky Institute of Geochemistry and Analytical Chemistry USSR Academy of Sciences, Moscow, USSR

- 158 -
I N T R O D U C T I O N
Permanent ingress of the long-I ived artificial radionucl ides into the environment due to global fal I-out and wide use of the nuclear technologies contributes to transformation of the radioactive contamination into a new ecological factor of the environment. These radifonucl ides are included into the natural biological cycle, penetrate into the man's organism over various biological chains, and are accumulated therein, causing a permanent radiation effect.
The relative annual effective equivalent irradiation dose resulting from global fal I-out reached the maximum value of about 7% of the natural background in the early sixties, then it decreased to about 0.8% of the natural background in 1980, and now it equals 0.02 mSv.y 1 in absolute value.
On the contrary, the irradiation dose engineering increased from 0.001% of the 0.035% in 1980 and equals on average i I lustrated by the chart shown in Fig. 1.
resulting from nuclear power natural background in 1965 to 0.001 mSv.y-1 /1/. This is
Thus, the experience gained in the course of many years of service of the atomic power plants and enterprises of the nuclear power cycle under normal operating conditions proves that the radioactive contamination of the environment in the areas where these plants are located has no substantial effect on the irradiation doses of people nor of populations of organisms.
Thus, according to the data given in pub I icat ion /2/, the individual effective equivalent dose of irradiation of the population I iving in the 35-km zone of the Chernobyl atomic power plant resulting from operation of the plant amounted to 0.0004 msv.y-1, the natural background being equal to 2.7 msv.y-1.
However, the atomic power plants and other installations of the nuclear power cycle which are radioecological ly safe under normal operating conditions may become sources of large-scale contamination of the ecological systems in emergency situations associated with the escape of radioactivity into the environment, i.e. in case of a radiation accident.

- 159 -
1. Comparative Characteristics of Grave Radiation Accidents
Grave radiation accidents include first of al I the accident at the plant of the Ministry of Defence on the Southern Urals (September 29, 1957), the accident at the plant in Windscale (October 8, 1957), and the accident at the Chernobyl atomic power plant (Apri I 26, 1986). In the two latter cases, the accidents took place in industrial reactors, though the technological conditions of reactor operation at the time of the accidents and also nuclear fuel compositions were quite different. The accident on the Southern Urals occurred as a result of the explosion of the reservoir containing 70 to 80 tons of the high-activity liquid waste.
The cause of these ace i dents were ana I yzed in deta i I in a number of works /3,4,5/.
As a result of the accidents, a considerable amount of radioactivity got into the environment. The comparative evaluation of the total initial activity at the time of the accident and the share of the activity that escaped into the environment is given in Table 1 /3,6,7/.
Table
Total activity at time Activity which escaped Accident of accident, MCI into environment
MCi %
Southern Urals 20 2 10
Windscale 0.038
Chernobyl 1295 * (2015**) 50 *** 4 ***
* **
Disregarding inert gases With regard for Np-239 Fission products± 50%
and activation Np-239
***
Thus, with respect to the escape of activity into the environment, the accidents in the southern Urals and at the Chernobyl atomic power plant are the largest accident that occurred throughout the use of the nuclear technologies. From the point of view of the radioecological effects, the radionuclide composition of the release into the environment is extremely important. These data in MCi are given in Table 2 /6,7,9,10/ and shown in Fig. 2 (Chernobyl accident).

- 160 -
Table 2
Radionuclide Southern Urals Windscale Chernoby I
Np-239 - - 29 Mo-99 - - 3 Te-132 - 0.012 5.3 1-131 - 0.02 10 to 17 Ba-140 - - 4.3 Ce-141 - 0.00019 2.8 Ru-103 - - 3.2 Sr-89 - 0.00008 2.2 Zr-95 0.5 - 3.8 Nb-95 3.8 Ce-144 1. 32 - 2.4 Pr-144 -Ru-106 0.074 - 1. 6 Cs-134 - - 0.5 to 1 Sr-90 0. 11 0.000002 0.22 Cs-137 0.00072 0.0018 1 to 2 Pu-238 - - 0.0008 Pu-239 - - 0.0007 Pu-240 - - 0.0001 Pu-241 - - 0. 14 Cm-242 - - 0.021
It shal I be mentioned that the data given in Tables 1 and 2 concerning the accident at the Chernobyl atomic power plant have been corrected according to the recent pub I ications in the Soviet press /9/. By their evaluation, about 96% of the reactor ful I fuel loading is located in the reactor core and in the rooms of the 4th power unit. The estimated total release of activity (including the inert gases) equals 100 MCi (3.1.1018 Bq), release of 1-131 10 to 17 MCi (3.7 to 6.3) x 1017 Bq, release of Cs-137 - 2 MCi (7.4.1016 Bq).
The gravity of the radioecological effects of the accidents was substantially different both from the point of view of the escape into the environment of the inert gases, radioiodine and long-I ived products and with respect to the season of the year. These data are given in Table 3.

- 161 -
Table 3
% of activity penetrating into Activity of environment (disregarding
Accident Season of year inert gases inert gases) MCi
I Cs-1371 I Sr-90 1-131 Pu
Southern Urals Autumn - 2.7 0.036 - Traces
Windscale Autumn 0. 1 0.006 5 60 -
Chernoby I Spring 50 0.5 4 20 to 34 0.3
Thus, the radioecological effects of the accident in the Southern Urals were caused mainly by the release of long-I ived Sr-90 and Cs-137, the accident in Windscale - by the release of iodine and inert gases, and for the accident at the Chernobyl atomic power plant - by al I these factors. The radioecological effects of the accident at the Chernobyl atomic power plant were aggravated by the season of the year when the accident took place. In this season of the year, the farming operations were coming to an end, the cattle was driven to the pastures, the natural and agricultural plants were at the beginning of the growing period but their vegetative mass was already sufficient.
The radioecological effects of the radiation accidents are closely connected with the area of the contamination zone which depends primarily on the height of the accident release and time of formation of its ground track. These data are given in Table 4.

- 162 -
Table 4
Accident Characteristics of release
Southern Urals Windscale Chernobyl
Height of release, km 1 0.07 1 to 7
Time of formation of main track, hour 11 50 300
Power of release, Ci. h-1 11 Sa Iva" 660 6700 to 40000
Accident release track area 15000 * 520 ** 200000 *** km2 280000 ****
Number of evacuated population (thousand people) 10 - 115 *****
* With respect to 0.1 Ci .km-2 double value of density of global Sr-90
** Area where I imitations were introduced and content of 1-131 in
*** **** *****
milk was checked In the first days, with respect to isodose 0.2 mR.h-1 Within the I imits of Cs-137 fal I-out density over 5 Ci .km-2 In accordance with the decision taken in 1990, evacuation of the population wi I I be continued
Accident Characteristics of release
Southern Urals Windscale Chernobyl
Average doses for population I iv i ng on contaminated territories, rem 1 . 2 * 0.02 ** 5.3 ***
Alienated
*
**
***
**** *****
territories, km2 1000 **** - 3100 *****
The average effective equivalent dose of irradiation for nonevacuated population within 25 years The effective equivalent dose of irradiation (maximum dose for the thyroid gland 16 rem for children and 9.5 rem for the adults) The dose of the internal and external irradiation for the population I iving on the contaminated territories in 1988 (the second year after the accident) By the present time - about 190 km2 By the present time, the territories shall be equal to about 4800 km2

- 163 -
It fol lows from Table 4 that the development of the emergency situations in time was quite different for al I three accidents.
The accident in the Southern Urals was characterized by the explosive destruct ion of the technological equipment and "salvo" ( instantaneous) release of radioactivity into the environment to a considerable height. The radioactive substance contained in the explosion cloud was deposited within a comparatively short period of time. This ensured formation of the track zone in the "classic" variant : of the extended form, with maximum density of the radioactive contamination on the track axis in the vicinity of the source of release of 15.103 Ci .km-2 (4.103 Ci .km-2 with respect to sr-90), with monotonous decrease of the density of the radioactive contamination along the axis towards the periphery, and with sharp decrease of the density of contamination in directions perpendicular to the track axis /6/.
The accident in Windscale was more prolonged (because of the attemps at its localization) and from the radioecological point of view it consisted in the outflow of the gas component of the release through the ventilation pipe. The release was I imited though the reactor was not provided with a containment. The release into the atmosphere included about 100% of the inert gases, 12% or 1-131 content in the reactor core, 7,5% of Te and about 0.03% of Sr /11/. The average level of air contamination in the course of the release was approximately equal to 0.2 Bq.1-1 (the maximum level of contamination w~s about 1.1 Bq.1-1 at a distance of about 3 km from the reactor). The contamination was of a "spot" pattern due to the effect of the atmospheric processes (Figs. 3 and 4).
The accident at the Chernobyl atomic power plant combined the "salvo" release (about 25%) of radioactivity to a height of approximately 7 km with explosive destruction of the reactor core and subsequent continuous outflow of the radioactive stream (about 75%) rising to a height of up to 1.5 km. For the estimation of the scale of this largest radiation accident, suffice it to say that only 5% of the fuel (about 7 tons) was i nvo I ved in the ace i dent in W i ndsca I e whereas approximate I y the same amount of the fuel was discharged from the reactor during the accident at the Chernobyl atomic power plant.

- 164 -
Recently, the scales and radioecological effects of the accidents in the USSR were revised and this accident was referred to the category of the ecological catastrophy /12/. In the course of development or the accident, 10 to 20% of the volatile radionucl ides - fission products (I, Cs, Te, Ru) and 3 to 6% of the non-volatile radionucl ides (Ce, Ba, Zr, Pu, Sr and others) were released into the environment.
The only thing which is common for the accidents at the Chernobyl atomic power plant and in Windscale is that both accidents took place in reactors and were simi far in the first phase of their radioecological effects (escape into the environment of the inert gases and radioiodine with activity of 10 to 17 MCi and 0.02 MCi, respectively). However, the causes of the accidents and, which is most important, their development which determined the gravity of the radioecological effects were quite different.
In W i ndsca I e, two days passed from the moment of the error in the control of I iberation of Wigner energy to the fire in the core. During this time period the personnel tried to correct the situation and managed to partially localize the accident. In this respect, the accident in Windscale is simi far to the accident on Three Mi le Island and sharply differs from the accident at the Chernobyl atomic power plant which is characterized first of al I by the explosive initiation of the accident resulting in destruct ion of the reactor core and technological equipment of the power unit and by the long-time localization of the accident releases and by the considerable I iberation of energy from the fuel remaining in the destroyed core. This determins the gravity of the radioecological effects of the accident at the Chernobyl atomic power plant - the greatest radiation accident since th time nuclear technologies are used.
/12/ Statement of Supreme Soviet of the USSR

- 165 -
Despite the differences in the effects of the three accidents which are under consideration, there are some common features. As it has been already mentioned, the accidents at the Chernobyl atomic power plant and in Windscale are characterized by the simi Jar first phases of the accident effects - contamination of the environment with the inert gases and radioiodine. During the accident in the Southern Urals, I ike in the accident at the Chernobyl atomic power plant, the environment was contaminated with a considerable number of the long-I ived radionucl ides.
2. Some Common Pecul larities of Spatial-Nuclide Structure of Contamination Resulting from Accident at Chernobyl Atomic Power Plant
The radiation situation in the contamination zone, forecast of its variation in time J and gravity of the radioecological effects of the accident are connected in many respects with the pecularities of formation of the spatial-nuclide structure of contamination in the course of development of the accident.
Naturally, these pecularities wi I I be primarily determined by the process of production of the released radioactive materials in the course of the accident, i.e. by the type and operation of the equipment as wel I as by the characteristics of the release, radionuclide composition and its peculiar features, physcial and chemical processess taking place in the course of development of the emergency situation, and the like, i.e. by the function of the source in a broad sense of this word.
Further on, formation of the spatial-nuclide structure of radioactive contamination wi I I be affected by the mechanisms of transfer and deposition of the materials discharged during the accident which are primarily determined by the dispersal and phase of these materials as wel I as by the weather conditions in the area of the accident and in the remote areas in the direction of propagation of the contaminated air masses.
During the accident at the Chernobyl atomic power plant, formation of the release into the environment was determined by two processes :
dispersion of the nuclear fuel as a result of the explosion of the reactor core on April 36, 1986 which led to the formation of an aerosol consisting of fuel matrix particles containing mainly the entire spectrum of radionucl ides - fission products;
outflow of the vapours (or gases) of the fragmentation radionucl ides from the fuel remaining in the reactor core after is was heated to 1500 - 2ooo·c in the course of burning of the core graphite on Apri I 27, 1986 to May 5, 1986 which resulted in formation of condensation aerosols which are mainly characterized by their monoradionucl ide composition or a weakly developed nomenclature of radionucl ides.
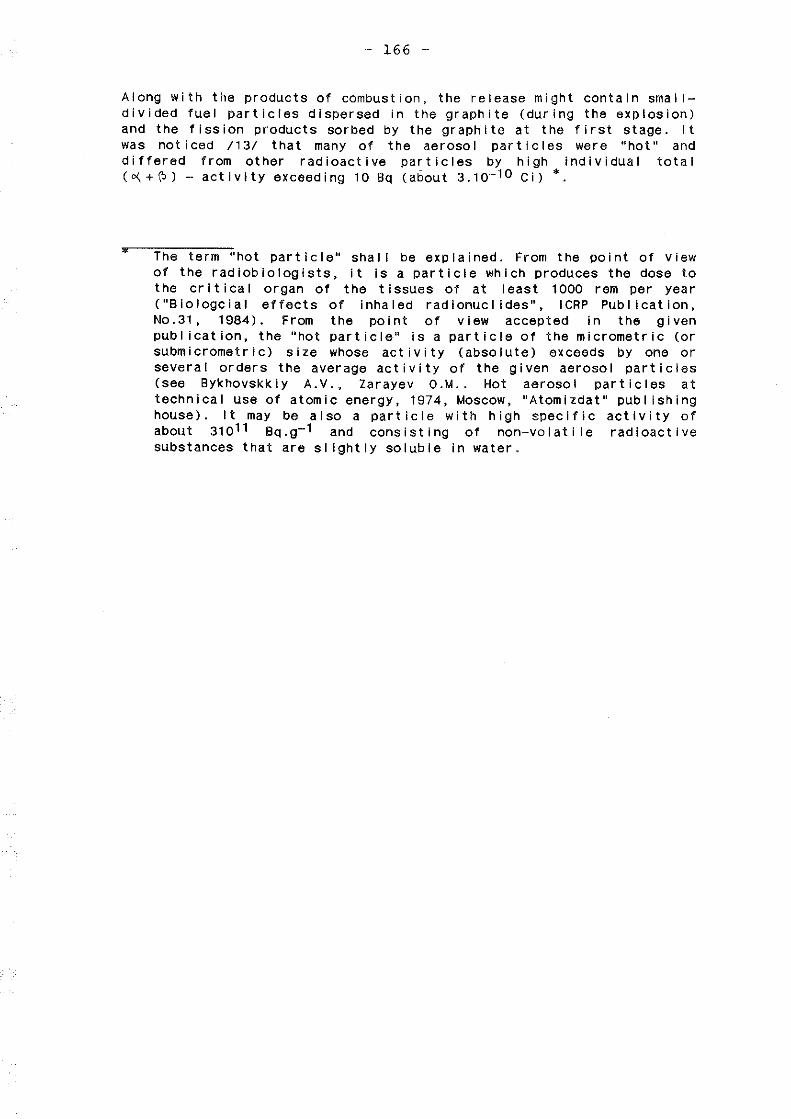
- 166 -
Along with the products of combustion, the release might contain smal !divided fuel particles dispersed in the graphite (during the explosion) and the fission products sorbed by the graphite at the first stage. It was not iced /13/ that many of the aerosol particles were "hot" and differed from other radioactive particles by high individual total (oi,+\>) - activity exceeding 10 Bq (about 3.10-10 Ci)*
The term "hot particle" shal I be explained. From the point of view of the radiobiologists, it is a particle which produces the dose to the critical organ of the tissues of at least 1000 rem per year ("Biologcial effects of inhaled radionucl ides", ICRP Pub I ication, No.31, 1984). From the point of view accepted in the given publication, the "hot particle" is a particle of the micrometric (or submicrometric) size whose activity (absolute) exceeds by one or several orders the average activity of the given aerosol particles (see Bykhovskkiy A.V., Zarayev O.M .. Hot aerosol particles at technical use of atomic energy, 1974, Moscow, "Atomizdat" pub I ishing house). It may be also a particle with high <':pecific activity of about 31011 Bq.g-1 and consisting of non-volatile radioactive substances that are slightly soluble in water.

- 167 -
It may be also assumed that the complex processes of dispersion of the nuclear fuel, oxidation and reduction processes, phase transitions, sorption and desorption processes, processes of recrystal I ization of the nuclear fuel, and the I ike could result in a redistribution of the fission products in the nuclear fuel matrix.
A certain peculiarity of the characteristics of the released products could also be Jaused by the fact that fuel burn-up whose average value was 10.300 "'><w.u might be different in various parts of the core of reactor P BMK~1000 in virtue of its technologinal peculiarities.
Thus, a mixture of the fuel matrix aerosol particles termed "fuel particles" and condensation aerosol particles termed "condensation particles" was released into the environment.
It was stated in the report of the Soviet experts in IAEA /8/ that owing to these processes the radionuclide composition of the release which is at al I stages close to jhe composition of the irradiated fuel with a burn-up of 8 to 1 O H:1.
4 was enriched with the vo I at i I e components
(iodine, tellurium, caJs1um and partially ruthenium). In other words, the formation of the nuclide structure of contamination might be affected in the microscale by primary fractionation. As it is known, the process of fr act ionat ion of various fragmentation products leads to considerable deviation of the ratio of the activities of two radionucl ides fractionating in a different manner from the theoretical values. Actually, if the fractionation standard is represented by the ratio of activity of the i-th radionuclide to the activity of refractory zirconium-95 (Ai I Ags CN1> or cerium-144 (Ai/ A144 • CN2l by the time of the accident, then according to publications /4,12/ these ratios wi I I correspond to the data given in Table 5.
Thus, if the fractionation ·coefficient equals :
F, ( A,;A~s) exf · ~{\)1 > 1
this testifies to the prevai I ing release of the i-th radionuclide in comparsion with the refractory substances since the zirconium (and cerium) oxides are refractory.

- 168 -
Table 5
Radionuclide 1-131 Cs-137 Cs-134 sr-90 Ru-103 Ru-106 Pu-239
CN1 0.66 o:66 0.03 0.05 1 0.46 1 .8.10-4
I 1.44 0.67 2.6.10-4 CN2 0.96 0.09 0.044 0.07
Values· of f = ± 0.5 for al I radionuclides (or non-volatile radionucl ides) means that the radionucl ides were transferred by the fuel particles.
By way of example, Fig. 5 i I lustrates the behaviour of f131.95 and f 137 .95 in the stream ove.r the atomic power station. These data prove that enrichment with iodine and caesium was continued to greater or lesser extent practically in the course of the entire period of the accident release.
The complex nature of the processes of nuclear absorption of the radionucl ides (or their oxides) degrees of volati I ity on the aerosol particles, fractionation in the dispersed phase.
fue I dispersion and possessing various
has promoted their
The results of the investigations /13,14/ show that distribution of the aerosols by size was mainly of the bimodal nature
fraction of the fine-divided aerosol with an active median diameter of 0.1 to 0.2 µ /3/;
fraction of the coarse-divided aerosol with the active median diameter of 25 to 100 µ.
The results of our measurements show /13/ that -active nucl ides are contained mainly in the coarse-divided aerosol and 13 -active nucl ides are contained in both fractions is evidently made up of the fuel matrix aerosol particles while the smal I-divided and fine-divided fraction includes mainly the condensation aerosol particles. The analysis of the content of the gamma-radiators in the fractions shows that the finedivided fr act ion of the aerosols of 13 -active nucl ides is represented pr imar I ly by Ru-103, 106 (up to 90% of the content) while the coarsedivided fraction contains radionucl ides Ce-144, 144 (up to 25%), (Zr+Nb)-95 (up to 45% of the content), Ru-103, 106 (up to 20%) and Cs-134, 137 (up to 8%). The i sot op i c composition of the coarse-divided fraction of o(-radiators was determined mainly by Cm-242 (up to 85%), Pu-239 (up to 4%), Pu-238 (up to 3%) and Cm-244 (up to 3%).
As it is known (15/, fractionation in the dispersed phase has resulted in the fact that the fine-divided fraction of the condensation aerosol (and partially of the fuel matrix aerosol) was prevailing in the upper layers of the release cone and spreading cloud.
I

- 169 -
Three branches of the radioactive track of the accident release may be distinguished on the contaminated territory in the microscale northern, southern and western branches whose formation was mainly completed on May 4 - 5, 1986 (Fig. 6). The map projection of the radioactive contmaination of the ground surface as a whole coincides with the map projection of air contamination /16/ and is indicative of the generic I ink between these two contaminations. During transport of the radionucl ides fractionated in the dispersed phase, there occurred "potential" fractionation assoc·iated with different rates of dry deposition of the fuel matrix heavy particles and condensation aerosols, physical form of the inactive carrier, and the I ike.
The investigations of the isotopic composition in various branches of the radioactive track conducted by the authors of the present pub I ication have shown that fractionation of the radionuclides is traced at distances over 15 to 20 km from the destroyed reactor. The contamination within this area is represented mainly by the fuel matrix aerosol which resulted in maximum contamination of these territories with the isotopes of plutonium and strontium. The contamination of the air with the two types of the aerosols explains abnormal fractionation of the fragmentation radionucl ides on the soi I cover : with the increase of the distance to the place of accident, the contribution of the condensation aerosols into general contamination grows, with simultaneous increase of the coefficients of fractionation of several isotopes, in particular, fractionation of radiocaesium.
Practically, all contaminations at distances over 100 to 150 km refer to a greatly fractionated kind of contamination. The contribution of the volatile radionucl ides into the total radioactivity grows with the decrease of the exposure dose rate in the radioactive track (Fig. 6).
By virtue of these pecularities in the development of the accident, the spatial structure of any branch of the radioactive track produced by the accident at the Chernobyl atomic power plant differs from the "classic" structure formed as a result of the "salvo" release as it was on the Southern Urals.
A distinguishing feature of the contamination of the environment during the accident at the Chernobyl atomic power plant was that the contaminated areas were in the form of "spots" of various scales. Making no analysis of the causes of the mesoscale and macroscale "spots" whose formation was affected, apart from the fractionation processes, by the landscape and weather conditions, we shal I state that the microstructure of contamination was to a great extent determined by the presence of "hot particles" in the fal I-out. This peculiarity of the release during the accident at the Chernobyl atomic power plant is discussed below.
Nevertheless, on the southern branch of the accident release track characterized by negi igible fractionation /17/, the change of the density of contamination with increasing the distance to the source is more regular. By way of example, Fig. 7 shows the data (as of 1986) relating to the measurement of the activity density of Cs-137 and LPu along the Pr ipyat - Kiev sect ion. The pattern of contamination on the territory of Kiev was very comp I icated. Our measurements show that the activity density distribution was greatly affected by the extremely

- 170 -
broken relief of the city, by the microclimate depending on the temperature fields of the city, a great number of the natural water basins, forest parts, and the I ike. Thus, the range of change of the activity density of plutonium in 1988 varied from approximately 37 Bq/m2 to 370 Bq/m2* at an average value of about 100 Bq/m2, caes i um-137 - from 5600 Bq/m2 to 25. 104 Bq/m2 at an aver age va I ue of about 16.103 Bq/m2. The contamination was mainly of the "fuel" (or close to it) type. The nature of the contamination was determined proceedini;i from the fol lowing condition : Ce-144/Cs-137 > 9 to 11 -"fuel" type, Ce-144/Cs-137 > 8 - "fractionated" type or intermediate type. The presence of several types of contamination resulted in that the correlations crij) between various radionuclides in the samples taken from various types were substantially different
For al I types of contamination only f 134 , 137 - 1. Fig. 8 shows the diagram of r'ij for several radionucl ides plotted by the results of measurements on the intermediate and fractionated types of contamination (dated April 26, 1986). Nevertheless, we managed to reveal the correlation between the content of plutonium and content of cerium-144 or ruthenium for each type of contamination.
Thus, according to pub I ication /188/, the change of the plutonium content in the range of 0.005 to 15 Ci .km-2 is described with an error of not more than 30% by the equation :
log [Apul • 0.88 log [ARul + canst.
In the 60-km zone, the estimation given in pub I ication /19/ seems to be more confident :
Apu ~ 6.10-4 Ace-144·
The complex radionuclide composition of the aerosol fal I-out results in that the decrease of the dose rate (or activity) in the chernobyl
* Subsequently such "spots" of plutonium were removed from the territory of the city.

- 171 -
fal I-out zone is note approximated by a simple relationship of the C.t-1.2* type. This is characteristic of al I three accidents considered above, though the reasons for it are different.
If we introduce the notion of the "apparent" decay-time for a certain time moment, it will _be equal according to our estimation fort• 600 days :
for the "fuel" type of contamination - 180 ± 30 days; for the "caesium-fractionated" type of contamination - 1020 ± 200 days.
A peculiar feature of the Chernobyl fal I-outs consists in that they include, apart from Pu-238, 239 and 242, pure B-radiator Pu-241 (E8max 21 KeV, TY., • 15, 16 years). Despite the fact that by the time of the accident its content in the reactor was about 0.1 of the content of Pu-240 (about 15 kg), its share equals about 98% of plutonium activity. In the results of B-decay it transforms into Am-241 whose radiotoxlcity is close to that of Pu-239.
In conclusion, we shal I state that the results of our analyses of the soi I cover samples show that the activity density of the long-I ived radionucl ides may be arranged in the fol lowing row, irrespective of the distance to the damaged reactor :
cs-137 > Cs-134 > sr-90 > Pu-239
Nevertheless, the accident products radiation of fresh
average effective energy of (0.6 to 0.8 MeV) is close
products of the atomic blast.
t-radiat ion of the to the energy of
- 172 -
3. "Hot Particles" In Accident Release at Chernobyl Atomic Power Plant
As it has been already stated, the peculiar feature of the accident at the Chernobyl atomic power plant consisted in the presence of "hot particles" in the aerosol composition. Proceeding from the results of the gamma-spectrometric analysis and determination of the content of stront ium-90 and -active radionucl ides, the "hot particles" were conventionally divided into two groups
- fuel (or quasifuel) particles; - condensation particles.
The first group included the particles containing the radionucl ides (al I of them or most of them) in the proportions corresponding to the average fuel burn-up of 8 to 10 MW.d .
kg u We investigated the particles of this group measuring 20 to 100 µ which turned to be either fragments of the uranium oxide or the black amorphous conglomerates which were easily disintegrated into smaller fragments at a slight mechanical effect. Some of the particles are depleted with radiocaesium (as compared with its content in the fuel) which is evidently indicative of long exposure to high temperatures sufficient for diffusion and evaporation of the low-boi I ing elements. Other particles, on the contrary, are enriched with radionucl ides Zr, Ce, Cs, etc .. In accordance with our measurement results, the content of plutonium in this type of the particles ranges from 0.02 to 6 Sq/particle (about 60% of Pu-239 and about 40% of Pu-238).
Some particles contain Cm-242 (its content is about -6 4%).** The total activity of "hot particles" of this size equals according to our measurements 250 to 1000 Sq/particle at an average activity of about 350 Sq/particle.
The smal !er-divided particles of this group <t 10 µ) have an even higher specific activity and are enriched with the volatile radionucl ides (quasifuel composition). Their content in the soi I cover depends on the azimuth and distance to the damaged reactor and equals 20 to 60% for the 30-km zone. The content of the radionucl ides in these particles varies within relatively wide I imits. According to our estimation, the average B-activity equals 150 to 200 Sq/particle and the average o<-activity amounts to approximately 0.5 Sq/particle.

- 173 -
The "hot particles" of the fuel group are present to a greater or lesser extent in al I types of contamination in the near (up to 80 km) and intermediate (up to 150 km) zones of the track. Their presence was traced also in the far zone of the track /20, 21, 22/. Our estimation of the contribution of the "hard hot particles" (20 to 100 µ) to the irradiation dose shows that on the fuel type of contamination in March 1988 they could form 15 to 20% of the reference level for the dose rate*, i.e. 0.03 to 0.05 mR/h, and on the intermediate type of contamination - 5 to 10%.
The "hot particles" of the condensation group are more seldom found even on the highly-fractionated type of contamination. By our opinion their content on the fuel type of contamination does not exceed 5 - 7% of the total content of the "hot particles". Belonging to this group of the particles are first of all the "ruthenium" and "caesium" particles, i;e. particles containing the monoelements. Such particles, mainly "ruthenium" particles, were detected in the far zone of the track as wel I /23, 24/. The analysis of the inactive carrier of such particles has shown /25/ that they include ferrum, nickel, molybdenum, technetium, rhodium, palladium and do not include fixed oxygen. As a rule, the size of such particles is not over 1 µ.
The activity of these particles is extremely high. We have detected "ruthenium" particles with the activity of up to 6.105 Bq and "caesium" particles with the activity of up to 104 Bq. The content of plutonium in the "ruthenium" particles was not over 0.04 Bq and the content of strontium was not over 70 Bq. In the "caesium" particles, the content of plutonium and strontium was 0.004 and 10 Bq, respectively. It is worthwhile mentioning that ruthenium is contained in the particles evidently in the metal phase /23/.
The reference level of the exposure dose rate is 0.2 mR/h. ** December 1987

- 174 -
The condensation type of the "hot particles" is closely connected with the subgroup of the so-cal led "rarity hot particles" whose radionuclide composition is determined by 95zr + 103, 106Ru or by 141, 144ce + 95zr. These particles were found also in the far zone of the accident release, in particular, in Finland /26/. Some particles of this subgroup which were at our di sposa I represented (by the data of the mi crop robe analysis) evidently dolomite with absorbed radionucl ides, which was the result of the introduction of various fire extinguishers into the burning .reactor.
The contribution of the condensation "hot particles" to the dose rate is smal I but these particles together with the smal I-divided fuel "hot particles" are referred to the fraction of the inhaled aerosols (~ 10µ) so that their radiation hazard in the first post-accident year was high. The "hot particles" are easily transportable which shal I be primarily taken into account when estimating the biological hazard of these particles.
The investigation of the solubility of aerosols sampled in the area of the Chernobyl atomic power plant shows /14/ that some 25 to 50% of caesium in the atmosphere was in the non-soluble form, i.e. caesium was contained in the particles of the fuel matrix aerosol. This content comp I ies with the values of the fractionation coefficient of 4 to 2 actually observed in the near zone (see Fig. 6).
Low transportation ability of the alpha-radiators /8/ confirms the assumption on their strong I inks with the fuel matrix. However, it is stated /27/ that some samples of the aerosols taken above the 4th power unit in May, 1986 were highly enriched with plutonium which testifies to the fact that conditions providing for production of the volatile forms of plutonium exist during burning and mixing of the fUel. Thus, the fragmentation radionucl ides were contained in the atmospheric aersol in the soluble and non-soluble forms. The ratio betwenn these forms is evidently determined by the respective fragmentation coefficients. This effect shou Id be most bright I y di sp I ayed by the isotopes of caesium since al I its compounds are absolutely soluble. The radionucl Ides contained in the particles of the fuel matrix aerosol are .evidently not transportable. The particles of the condensation aerosol consisting of the metals, oxides or iodides of various isotopes of fragmentation and corrosion elements possess various degrees of transportation abi I ity.
Thus, the peculiarities of development of the accident at the Chernobyl atomic power plant cal led for determination of the spatial-nuclide structure of the contamination zone by :
spectrum of the fission and activation products of the nuclear fuel by the time of the accident; relative volati I ity of the radionucl ides or their oxides at t>1500"C; amount of the released radioactivity; dispersal and relative content of the radionuclide in various dispersed phases; presence of "hot particles" in the accident release; meteorological conditions of particle transportation and type of particle deposition on the soi I cover.

- 175 -
R E F E R E N C E S
1. Radiation. Doses, effects, risks. United Nations. Environment Programme. 1988, Moscow, Mir
2. Shanda la M.G., Karachev I. I. et al .. Thesises of the Reports of the Al I-round Union radiobiologlcal Conference. 1989, Puschino, USSR
3. USSR 1986 Working documents for the Chernobyl post-accident review meeting in Vienna on 25-29 August 1989.
4. M. Eisenbud. Environmental radioactivity 1967 Atomizdat, Moscow
5. ltogi izuchenija i opyt licvidacii posledstvij zagrjaznenija territori i produktami delenija urana. 1990, Energoatomizdat, Moscow
avar i Jnogo
6. Nikipelov B.V., Romanov G.N. et al .. Atomic Energy, 1989, v.67, 2
7. lzrael Y.A. et al .. Atomic energy, 1988, v.64, 1
8. Asmolov V.G. et al .. Atomic energy, 1988, v.64, 1
9. Aleksahin R.M. et al .. Atomic energy, 1990, v.68, 5
10. lzrael Y.A. Chernobyl-90, newspaper "Pravda" no 107, 1990
11. Spravochnik po jadernoj energotehnologi i, 1989, Energoatomizdat, Moscow
12. Statement of Supreme Soviet of the USSR
13. Khitrov L.M., Report Series in aerosol science 1988, no 7, Helsinki
14. Loschi lov N.A., Curinny V.D. et al. Thesises of the Reports of the Al I-round Union Conference "Landscape Geochemical Studies of Radionuclide Migration" 1989, Suzdal, USSR

- 176 -
10
o, 1
1955 1910 1915
Medicine.
Atomic pow<>r -l
0,00~ "'c;v · y
Fig.1 Average effective equivalent dose from power station, weapons fallout and medicine (in re of natural environmental dose)

·; ro-
IO
Io-I
Io-2
14
IO
6
2
M, k~ A
Sr--90 .. • Ru-\OE>
.Zr-SS• • Nb-!l5 "Ru-10'!>
• 5r-89
38 42. 46
MCt B
@ \lu-lOb
- 177 -
• Cs-111
.. Ce-144
• C&·l?i4
.. Ce-H1
l-1?,1 " "B11-140
So
.. 'Te-132
54
l·\"31
Te-tJl ..
56
,. Pu.-21~
• Pu-240
•Pu-2:is
94 96 A"t.omi.c num'oe.r
MCL
10-2
Io-3
Fig.2 Chernobyl release <A-in mass unit, B-in activity uni·

- 178 -
]ri'sh Sea
D fO
->45 ,..,c.:Jt ., 4.lf ,.uCi/( ->4f ,,,.c,/f ~· 4116 /' (('/( c::J<O,l){J)'frl(
Fig.3 Levels of I-131 in milk after Windscale accident

- 179 -
Irish Sea
0 10 JIJ<N
->0,15 ml</h m,o,o., mR/~ ~>qai NJR/h
Fig.4 Levels of dose after Windscale accident

700
650
&00
550
500
450 -+---. 400
350
300
250
200
150
100
- 180 -
I· 151
f
Releu!;e 16
Cs-137 12
4
2 3 4 s 6 1 a 9
Fig.5 Fractionation of Cs-137, Ru-106, I-131 during Chernobyl accident

t \"!,"1, gi,
1 3
I
2 4
- 181 -
J1=il,'..1S"
5
3
I
• MINSK 2 4 6 8 IO
• 6 8 IO ..,R.1.-'
o,os-r t'!."1,9!>
(,,.t. ~-1) 3
I
2 4 6 8 IO
Fig. 6 Behaviour of the coefficient of fractional f~'3,,'l5 fur three directions of the compass at Chernobyl
... ~.1,-1
-t,1 R. ~

5. 105
105
5. 104
104
5.103
103
5.102
102
I 1· I I
•
I I I I \ I I
- 182 -
•
\ . \ , Cs-i37 \
\ \ :
1 ________.>- ' ~ rv- - -
X -- • ---
•
• -- -------- --•
_ _ _ _ _ _ _ _ _ _ _ _ Weuf_cn f,J.lout Cs-Ei?
•
IO
•
• • • •
30 50
• • •
•
70 90 IIO 130 X, k.m
Fig.7 Distribution of Cs-137 and f Pu <Pripiat-Kiev, south branch of the Chernobyl release)

i
o,s
0,5
- 183 -
r:i '"'cs 117C, "•Ru "'Ru 1'"Ce 'lSZr "Nb r .. ·a T I
I u
A
B
Fig. 8 Data on the correlation coefficient r~j <A-fractionated type of contamination, B-intermediate type)
1
0,5
0,5

- 184 -

- 185 -
Forms of Occurrence and Migration of Radionuclides from the Chernobyl NPP Accident in
Typical landscapes of Byelorussia
E.P. PETRYAEV, G.A. SOKOLIK, S.V. OVSYANNIKOVA, S.l. LEYNOVA, T.G. IVANOVA
Byelorussian V.I. Lenin State University, Minsk, USSR

- 186 -
ABSTRACT
In order to assess the radiation situation and predict how it wi 11 change we needed to establish the processes involved in the migration of radionucl ides - especially in the topsoi I as the main element in the radionuclide cycle in the biosphere.
Studies were carried out in three landscape-geochemical areas (typical for the affected Byelorussian territory in terms of radioactive contamination and the var fety of soi ls/landscapes), the aim being to extrapolate the underlying processes found to the entire territory contaminated with radionucl ides.
The fol lowing were studied:
1. Isotopic composition, degree of contamination, vertical distribution of radioactive fallout in the soi I.
2. Ratio between the various forms of occurrence of the radionucl ides - water-soluble, exchangeable, mobile and 'fixed'.
3. Abundance fa II out, stability.
of active their size,
particles (including fuel isotopic composition
particles) in and geochemical
4. Abundance of "hot" particles in the air and the I ikel ihood of their being incorporated into the human body.
Studies of the vertical distribution of the radionucl ides showed that four ?years after the accident the upper 0-1 cm layer of soi I contains 50-97 % of the general content of radionucl ides in the soi I profile. Studies of the forms of occurrence of 137cs and 90sr revealed that in 1989 between 76 and 99 % of the caesium was in the "fixed' state (does not separate from the soi I when treated with SN HCI). Specific to 90sr is the large proportion found in the water-soluble (up to 16 %) ,
exchangeable (up to 88 %) and mobile states (up to 98 %). The amount of exchangeable strontium increases with distance from the Chernobyl NPP. Active particles of varying fineness are found in practically all the regions studied in concentrations of 103 - 105 particles per m2. We also found particles enriched with 106Ru, 144ce and 137cs. All isotopes were present in the fuel particles, including isotopes of plutonium, and we studied the content of active particles in human lungs and determined their isotopic composition.

- 187 -
The complex radioecological situation arising after the Chernobyl accident meant that the contaminated area of Byelorussia needed to be monitored. This involved determining the level of radioactive cont am i nation and forecasting how it wou Id change over time, with a view to drawing up sci ent if i ca I I y based recommendations for combating the negative effects of the accident. In order to assess and forecast the radiation situation, we needed to find out the main forms of occurrence of radlonucl ides and the main processes governing their migration, in particular in the topsoi I, which is the main element in the cycle of radioactive substances in the biosphere.
In order to study the migration capacity of radionucl ides, we selected three landscape-geochemical areas typical for the affected Byelorussian territory in terms of radioactive contamination, variety of soi Is and landscape forms (Fig. 1). The three monitoring sites - No. I: Khoyniki district (rayon), physico-geographical province of the Polesye (Pripyat Marshes); No. 11: Cherikov district, province of the Orsha'-Mogi lev plain, and No. 111: Korma district, straddling the boundary between provinces - are centred 40, 250 and 200 km respectively from the Chernobyl NPP. The fol lowing three main geomorphological levels are monitored at each site: floodplain, the terraces above the floodplain and the original plateau. The types of soi I found in the selected areas are soddy-podzol ic soi I of I ight mechanical composition, soddy soi I and peat-bog soi I, which are most widespread in the Republic's southern areas. The fact that a selection of monitoring sites was used means that the data obtained on the migration of radionucl·ides can be extrapolated for the rest of the contaminated territory in Byelorussia, and that a long-term forecast of changes in the radiation situation can be made.
This comprehensive study of the nature of the radioactive contamination was carried out at 12 reference points on the monitoring sites and focused on the fol lowing areas:
1) isotopic composition, degree of contamination and vertical distribution of radioactive fallout in the topsoi I;
2) proportion of the various forms of occurrence of the radioactive isotopes in the soi I (water-soluble, exchangeable, mobile and 11 fixed 11
);
3) abundance of active particles in the fallout, their content, size, composition and geochemical stabi I ity;
4) analysis of the content of active particles in human lungs as an important integrating indicator of their migration.
To this end, soi I samples in layers of 1 and 5 cm were taken every year at the reference points down to a depth of 0.5 m. The samples were then analysed to determine the content of the isotopes of caesium, ruthenium and cerium (using an ADKAM-300 gamma-spectrometer), and of 90sr and plutonium isotopes (using radiochemistry). To determine the forms of occurrence of the radlonucl ides in the soi I, we used successive selective leaching 1, 2, a technique which is used in geochemistry and soi I science to analyse the state of various elements, including radionucl ides from global fallout. The presence of radioactive particles was established by means of radiography 3, with X-ray fi Im as the I ight-sensitive layer.

- 188 -
It was established that the isotopic composition, amount and physicochemical properties of the radioactive fallout depend on distance from the source of contamination. At al I the reference points we identified the isotopes of 137cs, 134cs, 106Ru, 144ce, 90sr and others, the relative content of each of which varied from one place to another. The greater the distance from the Chernobyl NPP, the greater the contribution of highfy volatile radionucl ides of caesium and the lower the proportion of 106Ru and 144ce. The reference points were highly contamina.ted with gamma-emitting radionucl ides. The level of fallout ranged from 20 to 100 Ci/km,, the level of contamination at the distant sites (Nos. I I and I I I) being approximately twice that of the near site (No. I). Most of the general gamma-activity was caused by 137cs (56-77%). The quantity of 90sr found in the soi I varied from 0.3 to 3.7 Ci/km,. The level of 9Dsr contamination at the distant sites was 4-5 times lower than that at the near site.
The dynamics of the behaviour of the main c137cs and 9DsrJ were assessed using distribution of the radionucl ides in soi I ( in
dose-forming isotopes charts showing the terms of the relative
activity in layers of various depths) on the basis of observations made between 1987 and 1989. The results (Table 1 and Figs. 2 and 3) show that they migrate slowly through the soi I profile. At most of the sites, three years after the accident the upper 0-1 cm soi I layer was found to contain 50-97% of the general content of radionucl ides in the soi I prof i I e. Moreover, a consider ab I e proportion of the gamma- and beta-emitters was found in the surface layer (forest I itter, moss, grass cover). In 1987 most of the radionucl ides (70-90%) were in the forest I itter and the surface layers of the soi I. Between 1987 and 1989 the contamination level of the surface layer fel I by 15-40%, the radionuclide content in the various layers in the upper 0-5 cm of the soi I did not change by more than 15%, and the content in the lower layers did not exceed 2% of the total amount in the soi I profile. As a rule, the specific activity of the soi I layers at a depth of 20-25 cm is the same as background levels. Only in one case (site 20) was the contamination of the lower layers comparable with that of the surface layer. In this case, migration took place on soddy-podzol ic soi I with an alluvial sandy and wel I-aerated upper horizon. The reasons for the rapid migration in this case may be the intensive eluvial regime, the low physico-chemical absorptive capacity and the specific mechanical and mineralogical composition of the soi I. The migration capacity of the various isotopes 19Dsr, 137cs and 106Ru) did not differ significantly.
In order to determine the parameters influencing the speed of migration, the experimental data on the vertical distribution of radionucl ides in soi I were analysed using the fol lowing equation 4.
q(x,'=.):: 4cq_ E\f (-~ ) -r jcb e.xf(-~ 1 I I} 11' fl1At 4.M~ ~ ~();bl:/
where q(x,t) is the quantity of the radionuclide at depth x after time t from the moment of the accident, qc is the quantity of the radionuclide on the surface of the soi I at the time of the accident, M1 and M2 are the migration coefficients of slow and fast movement, and a and b their proportional shares.

- 189 -
We used this formula to produce a rough forecast of radionuclide movement deeper into the soi I. The mathematical model in quest ion was successfully used to forecast the dynamics of the migration of radionucl ides in global fallout 4-6. It made it possible to describe the main processes governing radionuclide displacement in the soi I under natural conditions, viz. diffusion and convective migration. The migration coefficients express the overal I speed of simultaneously occurring processes under the influence of factors such as the filtration of atmospheric precipitation, and transport on migrating colloidal and finely dispersed particles and through the root system of plants etc. It was established that the magnitude of the migration coefficients depends on the particular features of the soi Is and the physico-chemical state of the radionucl Ides, and that it ranges from 0.4 to 10 and from 10 to 90·10-8 cm2-s-1 for the slow and fast types of movement.
The results of long-term forecasts for various periods of migration are shown in Table 2 on the basis of the distribution of 90sr and 137cs at reference point No. 17, which was typical for most cases. An analysis of the forecast shows that natural cleansing of the soi I by means of vertical migration wi I I proceed slowly. Most of the radionucl ides wi I I remain in the top soi I horizon for many decades.
Since the egress of the radionucl ides from the accumulative layer into other genetic horizons of the soi I may lead to a considerable change in the migration coefficients, model calculations were carried out to yield the vertical distribution of isotopes which are known to have high coefficients: (100-300) -10-8 cm2·s-1. The variants for calculated soi I profiles showed that in the next few decades there wi I I be no danger of contamination of the groundwater in idiomorphic and semi-hydromorphic soddy-podzol ic soi Is, but that there is I ikely to be contamination in f I oodp I a in soddy and peat-bog soi Is which have aqu i ferous horizons close to the surface and a high level of initial radionuclide contamination.
From the predictions of the changes in the spatial distribution of radionucl ides in the topsoi I over time we were able to estimate the effective period of semi-elimination <Teffl· The magnitude of Teff is connected to two-half periods: physical decay (T1;2 phys.l and biological decay <T 112 bio1.l, the latter being the time for semiloss of the radionuclide as a result of vertical migration beyond the boundaries of the topsoi I layer 7. For the long-I ived isotopes of 90sr and 137cs the values for Taff. ranged from 17 to 23 years and, in the case of intensive migration of radionucl ides (for example, at reference point 20), the period of effective semi-removal was approximately 10 years.
It should be noted that the values for the period of semi-elimination are higher than the normal values for Teff. typical of radionucl ides in global fallout 7,8. This discrepancy can be explained by the particular features of the Chernobyl contamination, which include certain physico-chemical properties of the fallout (its fineness, so I Ub i Ii ty etc).

- 190 -
Tables 3 and 4 and Figs. 4-7 show the results of studying the forms of occurrence of caesium and strontium radioisotopes. It can be observed that 134cs and 137cs are present in al I the soi Is analysed, mainly in the "fixed" state, which has hardly changed in the four years since the accident. In 1987 this form accounted for between 60 and 98% of the overal I content of these radionucl ides, and in 1989 between 49 and 98%, with part of them being in the firmly bound state (i.e. present in .the soi I residue after processing with 6 N HCI), possibly due to penetration of caesium isotopes into the crystal lattice of clayey minerals, such as vermiculite, montmori I lonite and to the presence of low-solubility active particles in the composition. The quantity of water-soluble isotopes of caesium is not significant (max. 1%). The amount of caesium isotopes in exchangeab I e form does not exceed 22% and, in mobile form, 40%. The ratio between the various forms of occurrence of caesium radionucl ides in the sol I did not depend on the distance of the reference point from the source of contamination.
It should be noted that the caesium radionucl ides from the Chernobyl emissions differ in their forms of occurrence from the caesium in global fallout. The proportion of "fixed" Chernoby I is 2-5 times higher and the re I at i ve exchangeable and mobile forms is significantly lower proportion of these forms in global contamination.
isotopes of caesium from quantity of
than the
In comparison with the isotopes of caesium, there is more 90sr in the water-soluble (up to 16%), exchangeable (up to 88%) and mobile (up to 98%) forms and, correspondingly, less in the "fixed" state (between 2 and 56%) (Table 4). The relative quantity of exchangeable 90sr rises with increasing distance from the Chernobyl NPP and hence, at a di stance of 200 - 250 km from the reactor, 90sr is present in the soi I mainly in the exchangeable form. In 1988 an increase in the content of 90sr in water-soluble form was observed in certain soi Is, in particular those with a high humus content - e.g. in peat-bog soi I (reference points 4 and 11) and floodplain soddy soi I (reference points 1 and 20) - which may be caused by the breakdown of the "fixed" form. There was a general trend towards an increase in the relative content of 90sr in exchangeable form in the lower soi I layers (Table 5). Hence, vertical migration of 90sr isotopes takes place mainly in exchangeable form. In the case of 137cs, the ratio between the forms of occurrence hardly changes with depth. The data indicate that 90sr is more mobile than the isotopes of 134cs and 137cs.
Our study of the nature of radioactive fallout at the selected monitoring sites also showed that a considerable proportion of the radioisotopes is present in the form of active particles, which can be sub-divided into fuel particles ("hot" particles) and condensation particles. The content of active particles, their size and isotopic composition depend on the distance from the Chernobyl NPP.
Active particles of various sizes are present at almost al I the reference points. Fig. 8 shows the radiographic traces of active particles detected at various sites. Fig. 9 shows an image of the largest particles detected at the site 40 km from the Chernobyl NPP. Within a radius of 40-250 km of the Chernobyl NPP, the greater the distance from the source of contamination, the lower the quantity of particles per m2 (the figures ranging from 1.4·103 to 1.2·105), accompanied by a decrease in the proportion of active particles in overal I specific gamma-activity.
- 191 -
There are significant differences in the isotopic composition of the active particles (Table 6). Some of the most frequently occurring particles at the sites (in al I, about 100 particles were analysed) are rich in ruthenium (No. 7), cerium and ruthenium (Nos. 5 and 6), and caesium (Nos. 14 and 15). Particles rich in caesium are more common at the distant sites.
In order to study the chemical stability of active particles, soil samples containing such particles were treated with various acids, including those used for leaching during radiochemical analysis of samples to determine the amount of radioactive isotopes in them 9, 10. Samples calcined at 650"C and non-calcined samples were processed. Concentrated solutions of the acids HCI, HN03, HCI04 and the mixtures HN03 + H2o2 and HCI04 + HF were used as solvents. The quantity of active particles, the total beta-activity and the part of the beta-activity which came from active particles were determined in each source sample and in each residue which had not dissolved in the above-mentioned reagents.
The data obtained (Table 7) show that it is much easier to dissolve the active particles in the calcined soi I samples than in the non-calcined samples. Fu! I dissolution of the active particles was observed only in the calcined samples when HN03 or a mixture of HCI04 + HF were used.
A study of the correlation between the granulometric composition of the soi Is and the amount of isotopes in the various mechanical fr act ions, revealed that the distribution of radionucl ides by fractions is virtually identical, irrespective of the type of soi I and the distance of the reference point from the source of contamination. The highest specific gamma- and beta-activity was observed in the finest particles (< 10 µm), which account for no more than 20% of the mass. In th is mechanical fraction we discovered some 50% of the 90sr, 30% of the 106Ru, 40% of the 144ce, 25% of the plutonium isotopes, and the maximum content of active particles.
The results obtained indicate the capacity of active particles to play a role in the mechanical displacement of radionucl ides via dust transport, surface runoff and penetration into the soi I profile. Although it should be pointed out that currently the bulk of active particles (around 70%) is in the first surface layer, in peat-bog soi Is the active particles are fixed even down to a depth of 30 cm. When considering the surface distribution of active particles, it is important to take into account the possibi I ity of contamination of ponded air and consequently the danger of particles being inhaled into the human body. Analysis of filters infiltration and ventilation units revealed up to several hundred active particles - many of which with an extremely high level of radioactivity - per mi I I ion cubic metres of air in the populated areas studied. Active particles were also discovered on screens positioned 1 m above ground level in many populated areas of Byelorussia. It was revealed that the quantity of particles and their contribution to the total radioactivity was considerably higher in the south-eastern areas of the Republic than in the north-western areas. Thus, the distribution of active particles in the atmosphere was similar to their geographical distribution in the soi I.

- 192 -
The hypothesis concerning the possibi I ity of active particles being inhaled into the human body was also confirmed. In around 70% of the lung samples studied (the material being obtained from post-mortems on people from the contaminated area of the Gome I and Magi lev ob lasts [regions]), active particles of various or1g1ns, including fuel particles, were detected with certainty. This last point must be taken into account in al I recommendations on radiation safeguards, the performance of practical work (especially agricultural work) and when deciding on resettlement of people from contaminated areas.
In conclusion, the data in this paper on the nature of radioactive contamination in the southern areas of the Republic are useful for forecasting changes in the radiation situation. This thorough analysis of radionuclide migration, which takes into account the given I andscape, soi I characteristics, forms of occurrence of the radionucl ides and physico-chemical properties of the active particles, has made it possible for us to explain the nature of the migratory processes in the topsoi I, and to establish correlations between the relationships observed and those previously established for global fallout. This constitutes a basis for long-term forecasting of the migration of radionucl ides in geochemical and biological chains.

- 193 -
BIBLIOGRAPHY
1. E. V. Arinushkina: Manual of chemical soi I analysis; Moscow State University, 1970, 487 pp.
2. F. I. Pavlotskaya: Forms of occurrence and migration of artificial radionucl ides in soi Is; Moscow, Atomizdat, 1979, 215 pp.
3. A. V. Bykhovsky, o. M. Zarayev: Hot aerosol particles in the technical appl !cation of atomic energy; Moscow, Atomizdat, 1974, 256 pp.
4. E. D. Shagalova, F. I. Pavlotskaya, M. D. Mazurova; Pochvovedeniye, 1986, No. 10, pp. 114-121.
5. I.E. Konstantinov, o. G. Skotnikova, L. s. Soldayeva, et al.; Pochvovedeniye, 1974, No. 5, pp. 54-58.
6. F. I. Pavlotskaya, T. A. Goryachenkova, V. F. Myasoyedov; Atomnaya Energiya, 1986, vol. 61, No. 3, pp. 195-198.
7. N. A. Bakunov; Agrokhimiya, 1988, No. 1, pp. 85-89.
8. A. V. Marakushin, E. A. Fedorov; Agrokhimiya, 1977, No. 9, pp. 102-107.
9. Methods of determining the content of 9Dsr and 137cs in soi Is and plants; Moscow, 1985, 64 pp.
10. Consultants' Meeting on Fallout Radioactivity Monitoring in the Environment and Food (MEF), 15-19 December 1986, held at the headquarters of the IAEA, Vienna, conference room 007/v, 51 pp.

LA
YE
H-B
Y-L
AY
ER
C
ON
TE
NT
O
F
TH
E
ISO
TO
PE
S
OF
C
s-1
37
A
ND
S
r-9
0
IN
SO
ILS
IJ
UL
Y
19
88
1
li I I~ fp
Ii L
,nb
er
DE
SC
RIP
TIO
N
OF
ref.
RE
FE
RE
NC
E
PO
INT
in
t
Cs-1
37
C
ON
TE
NT
TO
TA
L
RE
LA
TIV
E
c ii k
m•
0-3
0
cm
0 -
l cm
I I
-2
cm
I
r-S
ITE
N
o I
LH
OG
NIK
I D
IST
RIC
T.(
=
40
k
m.f
rom
C
hein
ob
yl
NP
PI
II J
Lo
w
flo
od
p
lain
I
23
.4
I 6
4.2
I
24
.l
3 j
Terrace
ab
ov
e
flo
od
p
lain
2
8.5
9
1.9
3
.6
%
4 -
5 cm
0.7
0.4
' S
r-9
0
CO
NT
EN
T
II 11 __
____
____
____
JI "
TO
TA
L
RE
LA
TIV
E
%
II C
ii k
m'
II _
__
__
_ II
0-3
0
cm
0 -
I cm
l
-2
cm
f 4
-5
cm
-,,
I I
• II
2.8
5
0.0
3
0.8
2
. 6
II
3.
7 8
3.
5 9
.6
o. 6
11
I 4
Am
eli
orate
d
mead
ow
1
7.6
8
6.2
3
.0
0.4
3
.0
79
.4
I 3
.2
I 1
.7
L __ ~_
-L
oessia
l p
late
au
1
1.8
5
5.7
3
4.9
0
.9
2.3
4
8.6
J
44
~ ___
j ___ o_~_4
__ 1
i, I'
r S
ITE
N
o.
11
l
KO
RM
A
DIS
TR
ICT
(=
2
00
km
fr
om
C
hern
ob
vl
NP
PI
' llf-
' I
. '
. I
. I
O
11 ~
! !O
L
ow
flo
od
p
lain
4
1.6
1
2.6
1
1.0
1
1.2
0
.3
15
.I
11
.o
6 ..
II
' .I
I
I 2
1
Terrace
82
.9
65
.l
32
.6
0.3
1
.5
97
.0
2.t
, o
JII ,
I l 21
F
orest
46
.5
62
.0
9.6
2
.7
0.4
4
2.7
1
1.9
4
.6
I ~
. -
1' I
Sll
E
No
JI
CH
ER
IKO
V
DIS
TR
ICT
(=
25
0
km
fro
m
Ch
ern
ob
vl
NP
PI
,I I
I I
I I
i !!
l JO
L
ow
flo
od
p
lain
5
9.7
9
4.8
1
.8
I I
I 11
M
ars
hv
flo
od
p
Lii
n
46
.0
79
.7
12
.6
I 0
.2
0.4
I 7
5.
4
0.9
0
.8
56
.4
I! ,Ill
Terr
c1
ce
47
.8
61
.l
18
.9
2.2
0
.8
5 0
. 0
I I
Ji
Fo
rest
32
.9
56
.l
13
.3
2.
5 0
.4
68
.3
10
G
ard
en
6
7.0
6
4.5
1
7.1
--
---
~J
_l
l .
6 0
.9
53
.2

FOR
EC
AST
O
F TH
E O
ITR
IBU
TIO
N
OF
RA
OIO
NU
CL
IOE
S BY
D
EPH
T
OF
SO
IL
PR
OF
ILE
RE
LA
TIV
E
CO
NTE
NT
OF
ISO
TO
PE
S
IN
J-cm
LA
YER
(
% )
j D
ep
th
of
Sr-
90
(
CY
Y)l
. :,
-1
) C
s-1
37
(c
rr/.:
:,-A
) la
yer
:C-
j(,(
~ 0
, 8'1
. 10
-b
( q
~ 0,
8'1
,;,{
~;
0, 5
0. "
10 -
8 (a
.~ o
, '/b
)
( CV'l
l) Ji..
2.. 28
,2.
. .-1
0-8
(&,,
0,1:
i)
d1z.
~ .A
-1,0
. .
,(0 _
g (b
.,. 0
,24
)
5 y
ears
10
y
ears
50
y
ears
5
years
10
y
ears
50
v
ears
0.
5 4 I
. I 2
9.7
l
3 . 5
4
8.0
3
5.
2
''.-:1
I .
5 2
8.9
2
4 . <
I l
3 .
I 2
6.8
2
6.2
I:
: I
5.0
I
. 4
3.8
8
.8
2.3
2
.6
l O
. 0
0.6
0
.7
2.
5 0
.8
l .
I I
. 5
20
.0
0.1
0
. 3
0.
3 0
. 0 I
0
. l
0.6
30
.0
0.0
1
0 .
I 0
.2
traces
traces
0 .
3
40
.0
traces
0 . 0
I
0.1
0
traces
0 .
l
60
.0
0 0
0 .
I 0
0 tr
aces
I ~
.... '-"
Ln
-\
::!:
,
(]'>
~I
I"'

FORM
S O
F O
CC
UR
ENC
E O
F R
AD
IOC
AE
SIU
M
IN
THE
0-1
CM
S
OIL
LA
YE
R
( 19
87
-19
89
J
: N
umbe
r I
Exc
ha
nq
ea
ble
fo
rm
i o
f I
H20
%
(H20
+
NH
4 CO
OCH3
IH
l %
:
refe
r.
i p
oin
t I
' L I I ii ,, ,I ,, ,, :1 I~ 11
198'
1 1
98
8
19
89
1
98
7
1988
Sil
E N
o I
LHO
GN
TKI
DIS
TR
ICT
(:::
: 4
0
km
fro
m
Ch
ern
ob
yl
NPP
J I
0.
3 :!
0
. l
< 0
. l
I o.
l ±
o.
1
l. 5
±
O
2
0.6
±
O
2
' 0
. 3
! 0
. l
0.
5 ±
0
. l
0.
3 ±
0
. l
15
.± 2
1.8
±
0
.2
' [0
.2
!0
.l
04
±0
.l
0.
l :t
O
.1
1. 8
±
0.
2 3
. 4
±
0.
4
lo.s
,o.1
fo
z,0
.1
6 0
.3
±
0.1
8
:t 1
6 ±
l
SIT
E
No
III
KOHM
A D
IS'J
'HIC
T
(:::
20
0
km
fro
m
Ch
ern
ob
yl
NP
P)
20
0.
5 !
0.
l 0
.2
±
0.1
I 0
.2
:!: 0
.1
3.5
±0
.6 11
. 9 ±
0
. 3
'3
0.9
±
0
.2
o 6
,
0.1
I 1
.3
, o
.,
22
±
3
6 ±
2
Ll
:!
0.
2 :!
0
.1
I· <
0.1
0
.1
±
0.1
3
0 ±
0
4 2
.6
± 0
.3
SIT
E
No
11
CH
ER
IKO
V
OIS
TR
ICT
(::
: 2
50
km
fr
om
C
he
rno
byl
NP
Pl
10
I <
0.
l <
0.1
0
.1
±
0.1
0
.3
±
0.1
0
. 2
:!: 0
.1
l l
0.
l :!
0
. l
0.
l :t
O.
l 0
. !
~ 0
. 1
l. 2
:t
O.
2 1
.3
±
0.2
13
0.
I :!:
0.
l 0
. l
:: 0
. 1
0.4
±
0
.1
4.
3 :!:
0.
6 0
.8
±
0.1
ll
I ( o
. l
< 0
. l
0.
l :!:
0.
l 2
O :
t O
. 4
0.7
±
0
.1
19
j O
. I
±
0.
l 0
.8±
0.1
0
. 7
±
0.
l 5
±
l 8
.1
±
0 4
I 19
89
I I
0.
7 .±
0.
2
5.
3 ±
0
, 9
1. 0
:t
O 3
4 ,
1 I '
110,
021
34
, 4
I
1. 6
:!:
0 3
r
0.7
±0
.2
1.2
±0
.3
2.
3 :!:
0.
4
8 8
:!: I.
7
18
±
4
4.
11
-P
ea
t
1987
I '
3.
I .±
0.
4
5 ±
l
6.
I ±
0
4
7 ±
l
7 ±
l
I 18
±
2
20
±
3
l . 5
:!:
0.
5
3.6
±
0
.6
12
±
2
7 ±
l
15
±
2
HC
l IH
%
l t;'8
8 I
1989
1 I '
Ta
ble
3
"Fix
ed
" fo
rm
ii " (
GH
HC
l +
so
il
resid
ue
) %
ii :1
I I
I ·11
I
l 98
'/
I 1
98
8
I l 9
M9
,
==~~
"===
~~~=
=~~~
1 3
. 2
±
0 2
I 1. o
± o
2 I
95
±
8
10
±
1 I
12
±
2 8
0
± 8
3. 8
:t
O.
5 4
. 5
:t l.
2
Q2
±
7
l :!:
l 1 o
i 3
I 8
5
±
8
5 ±
l
I 1. 8
!
o. 4
I
90
±
l O
I l
l •
3 I
l '/
±
2 6
0
:!
5 -
. I
I 16
±
2
i IO
±
2
I 77
±
8
08
±0
.l
,1.2
±0
.3
98
±
5
3 4
±
0.3
,
2.4
±
0
.7
95
±
6
2.1
±
0
.2
5.4
:!:
1.2
84
±
5
3 4
±
0.4
1
2.
7:!:
2 .1
91
±
8
16
:t 2
16
±
4
80
:t 5
I 9
6
! 6
I I 8
8
:!
6 I I
93
:t ·1
I i 9·
1 ±
6
93
±
'?
Tl
:!
12
81
±
6
I 9
9
:t 6
I I
95
:t
6
97
±
6
I 9
6
±
5
I 76
:!:
5 l
98
:!:
13
83
! 8
94
.!
12
86
12
11 I I I I I
~ I ii !I
9·1
±
7
49
±
'1
88
±
11
98
:!:
l
96
::
13
92
±
1
2
78
:t
10
II 11 ,1 11 I I 6
6
' 9
·1 I.
2
0.
10
-F
loo
d o
lain
so
ils
(so
d m
eado
w)
23
. 1
3.
17
-S
od
dy-o
od
zo
lic
san
dy
6.
2'1,
19
-
So
dd
y-p
od
zo
l ic
san
dy-
loa
m so
ils
r cO °'

FOR
MS
OF
OC
CU
REN
CE
OF
STR
ON
TIU
M
90
IN
SU
RFA
CE
SO
IL
LAY
ERS
(0-1
cm
) (1
98
7-1
98
9)
Num
ber
Ex
ch
an
geab
le
form
o
f H
20
(%)
(H20
+
N
H4
CO
OC
H3
lH)
refe
r.
po
int
19
87
1
98
8
19
89
1
98
7
19
88
SIT
E
No
I L
HO
GN
IKI
DIS
TR
IC1"
(::
: 40
km
fr
om
C
hern
ob
vl
NP
PI
l
I 4
:t
2 7
:t 3
4 ±
2
37
±
'I 41
±
6
I 3
l ±
1
6 ±
2
2 ,
l 35
:t
6
48
±
8
4 l
±
1 5
±
2 l
:!: l
14
±
3 17
t
4
6 2
±
l 3
±
l 2
±
l 28
±
5
32
±
5
SIT
E
No
III
KO
RMA
U
IST
RIC
T
(:::
20
0
km
fro
m
Ch
ern
ob
yl
NP
PI
20
l :!:
l 16
±
6
14
:t 5
87
±
2
2
88
±
2
2
23
3 :t
I
3 :t
1
27
±
11
64
±
1
2
75
t 1
2
27
l :!:
l l
:!: l
1 ±
l
91
±
18
8
8
±
17
SIT
E
No
II
CH
ERIK
OV
D
IST
RIC
T
(:::
25
0
km
fro
m
Ch
ern
ob
vl
NPP
) 10
5
±
3 5
:t 3
3 ±
l
76
±
15
78
±
1
5
11
1 :t
1 7
:t
3 5
:t
2 4
5
±
9 6
2
±
11
17
4 t
2 4
:t 2
7 :t
3
87
±
1
7
84
±
12
13
11
:t 2
8 :t
3 14
:t
6 6
9
±
9 6
9
±
12
19
4 :!:
2 1
3
t 5
19
±
8
91
±
17
8
4
±
14
(%)
19
89
1
98
7
49
± 8
16
±
5
77
±
15
14
±
4
20
:t
4
20
:t
2
41
±
7 19
±
4
93
:t
2
3
3 ±
2
96
±
2
7
l O :
!: 3
86
±
1
5
5 ±
2
83
±
1
6
20
± 1
0
63
:t 9
25
±
9
89
:t
1
2
I 9
±
4
66
±
1
2
I
24
±
l O
87
±
16
"I
:!: 3
"Fix
ed
" fo
rm
HC
J IH
(%
) I I
19
88
l
t98
Q
19
87
!
I 14
:t
4 I
l O =
3
I 4
7
:!: 9
I I
8 :!:
3 8
±
3 I
51
±
10
21
:!: 4
I 2
2
±
4 '/6
:!:
JO
l 7
±
3 !
20
:t
4 53
:t
J l
I
4 ±
2
5 :t
2 I
10
±
5 I
I I
14
±
3 4
±
2 I
26
:!:
11
I i
10
t 4
11
t 5
4 ±
2
I
20
±
8
I 17
±
7
I 4
± 2
I '
I '
24
±
5 2
6
t 6
I 30
:t
6 I I I
14
t 5
IO
±
12
4
±
2 I
I I
26
:t
10
I 2
4
:t 10
·1
:a: 4
I !
11
±
4 1
2
±
5 2
:t 2
!
(%)
: 1
98
8
I I
45
:t
5
I ' 44
±
8
i
62
±
5
51
±
l O
!
8 ±
4
I I 11
:!:
5 i
2 :t
2 i
2 :!:
l
14
±
6
6 :t
3
5 :t
2
5 ±
2
·1ab
! e
·I
!()8
9 ·-·
··-
4 l
• 4
l 5
... ,,
58
~ '.C
39
!
8
-·--
!. ::
1 l
3 ~
l
-
j
11
-"-4
1 :
1
10
~ 5
l -"-
I
,. ' _
J!
-II " ':
r "' -J

ratJ
le
5:
FOR
'1S
OF
OC
CllR
EN
CE
O
f R
AD
IOA
CT
IVE
IS
OT
OPE
S O
f C
AE
SJU
M
AN
D
STR
ON
TIU
M
!Ju
1v
1
98
8)
~-----.
' N
um
ber
J
of
iDe
oth
re
fer.
i o
r !
oo
int
j la
ver
I
cm
_,_
snc:
'No
l , a
i ;
o L
-3
5 -
(l
!, :,
r b
I i
O
-
L 4 -
:J
4!C
-J
i0
-
~) -
0
n \ (i
1 ()
2 -
,,
4 -
5
~ H
E
No
Ill
/1)1
,))
IO
-
I I !
i: -
_l
_,
[ I
Exch
an
oe
ab
le
form
I
I I
! H
20
(%)
lrn
2o
+N
H4
C
OO
CH
3 JH
) (%
) I
lN
l!Cl
(%)
I "F
ixed
" fo
rm
(%)
1
i====
====
==;:=
====
====
::j===
====
==:::;
:====
====
==1=
====
====
=::;==
====
====
!===
====
====
====
:::;==
====
===::
:: i
I I
I I
! I
I T
ota
l C
s i
Sr-
90
I
To
tal
Cs
I S
r-9
0
I T
ota
l C
s I
Sr-
90
I
To
tal
Cs
I S
r-9
0
I!
LIJ
Ol;N
JKI
DIS
TR
ICT
<
0.
I I
< 0
. I I I
o.s
,0.1
I
0.4
0.L
I <
0.
2 i I i
, o.
1 I
-I I I
±
0.
J i
< o
. 2 I I i
(z
40
7 ±
3
5 ±
2
6 ±
2
5 !
2
5 ±
2
3 !
3 ±
km f
rom
C
hern
obvl
N
PP
l 1
0.6
!0
.l
I 4
1±
6
I .
0.4
!0
.l
72
±
1
3
2 ±
1.8
!
0.2
48
±
8
2.0
±
0
.6
95
!
18
2 ±
l
94
±
3
5
±
3.4
!
0.4
!'
I ±
4
4 !
2 7
8
±
20
6 ±
3
2
±
5
7 !
77
±
1
5
n ±
2
8
3.2
!
0.2
14
±
4
2.9
±
0
.4
18
! 4
l !
I
JO
! l
8 !
3
8 !
2 4
±
2
4 ±
2
2 ±
3.8
±
0
.5
21
! 4
4 ±
2
22
±
6
/ ±
ll
c 3
8 !
2 18
!
7
! 8
-t Q
06
±
6
(30
)*
o l
±
6 ( 2
8 l
CJ7
±9
(3
0)
88
! 6
< 2
8 l
90
±
7 (
3 (J
)
04
±
i
I 3
2)
9 3
±
'I I
18
)
92
,
l I
16
)
Bi
:: b
< 2
81
85
±
6
( 29
\ -!
__
lj
4 5
::: 5
: ! ,, 1
0
, 4
I
44 '8
<1 -:::
!
02
:::
5
( h
51
! l O
I i 11 ,, •I i ' ' II 1: :1 ,. :, ,, ., I'
S L
!! -
q
5 "!:
3 ,, !,
II ., !
~!
KO
RMA
0
.2
0.
l
l) 1
ST
RIC
T
( z
20
0
km
fro
m
Ch
ern
ob
v J
NP
P)
±
0.
l I
16
±
b
I l
. 9
±
0.
, 88
±
22
I
'>. 0
!
0.
6
I j
I !
0.
l I
13
±
5 I
L.
6 !
0.
2 9
4
±
30
5
. 0
±
0.
4 i
5 ±
3
I 0
2
! 6
( 30
) I
' I
I I
(28
) 4
! 2
93
±
'1
8 ::_
4
c
'I ' . I i I I!
I I
· ·
. ,
9 -
l O
I
-I
! l
'> ±
2
I 2
! 2
I !
8 3
±
5 ( 2
0)
I Ii
• L
-·-
---_
__
_ J_
•
• _
L_
_
_J I
1--" '° a,

i'at1
1e
::, ic
on
t Ln
uecl
l
r .. ,,
i\u
mb
er !
or
:1h?
pth
.re
f Pr.
i o
f p
oi1
1t
ilo:1
ver
H20
; cm
i
To
tai
Cs
(%1
Sr-
90
Ex
chan
oea
ble
fo
rm
I l<
H20
+NH
4 C
OO
CH
3 !H
l (%
) I
~-----·~
----_
_[
lN
HCI
I I
l i
To
ta 1
Cs
! S
r-9
0
I T
ot.
al
Cs
I
II (%
) !!
Fix
ed"
form
(%
l ll
_-_-_-
_-_...,!
!! S
r-9
0
To
tal
Cs
Sr-(
)0
il
. ·-=
t==
---c
:±
. -·-
! n
, u,
1
o -
1 i o
. o
, o.
1
3 ,
1 I
6 ±
2
I 7
5
, 1
2
I l 7
,
2 I
l 4
, 3
I 6
0
-: s
, 181
I
: 1
+
'> 11
/ (
( d
)
\ I T
i:
. U
; d
I
L (('I
', i il)
i ,'
: i")
)
] >_
) {
(1
)
i 2
-'.
I 0
.4
s 0
.2
7 ±
91
±
33
14
!
2
0 -
' ,. <i
-l O
~o
i l
0 / -
)
l, -
' ,. li -
,'. u -
,! ()
-
l )
I <
0.
l !
2.6
!
0.3
8
8
±
17
16
±
2
()
',
0.
l 2
±
1 14
-
97
!
25
1
4
±
17
±
2
l 3
! 2
Cl·!i
oR l
KO
V IJ
l STR
l C
T ( z
25
0 km
fr
om
Ch
ern
ob
vl
NPP
) 3
I 0
.2
±
0.1
I
18
±
1,
<O
.Ji
o!
I -
0.
8 ,
0.
l
< 0
.2
I)
] :
0.
l
< 0
, l
(I .
l
! 0
. l
< 0
. I
< 0
. l
0.
0.
I
0.8
, 0
.1
! I I
0.2
l •
3 I
1.3
±
0
.2
!
8 ±
3
3 !
4 :!.
L
2 :t:
2
' ' 1
.2±
0.2
0.8
!0
.l
0.5
±
0
.1
0.l
±
0
.1
0.6
±0
.3
83
±
34
0
.3
±
0.1
62
!
11
3.4
±
0
.3
76
!
22
2
.5
! 0
.6
! 6
9
±
I 2
! 2
. l
! 0
. 2
I /J±
14
1
2.4
±0
.3
I 84
±
12
I
3.
4 ,
o. 4
I
<JO
± n
I 4
!
i I
i I 3
!
'> I
8.
l !
0.
4 I
84
!
I 4
[ 16
±
2
8 !
4
10
±
4
3 ±
20
! 8
U
±
4
24
!
5
24
!
IO
26
! l O
n ±
1
2
14
! :1
10
±
4
11
+
4
I I
i I
!
"/9
±
', ,2
01
81
+6
(2
41
l2
±
5 i 2
5)
70
!
·1 (2
3)
•
6 (
4 l
I
10
0
! 5
14
01
GS
cb
(3
11
96
±
7
I ·;
1 I
<rt
±
6 (
3<.)
)
G"/
±
6 {
·.3g
\
96
±
5
( 38
I
95
!
6 I
3 o
\
16
= 5
(2
51
z =
2
r !
<
2 l .:l
(>
( !
) !
2
i -
II I' :! 11 .. " •I
q
.-1 I ii I! .. ,. " I I ' !I I'
·I II
i;, ft " I
o 3
ii It
<
I it
!! )
: ,!
" J_
~ ___ : _
__ ~-~
2
±
0.1
I
2 !
I I
o ±
2
I 9
3
±
23
! 14
±
3
! 7
! 3
i 8
0
±
l 1
23
1
< L
_J,
·-··--·--
----
---~
..J
sod-
mea
d01,
: (b
l so
dd
v-p
od
zol
ic
sanc
lv:
1c)
oeatb
oo
: (d
i so
dd
v-o
od
zo
lic
san
dv
.lo
am
,·,>
11
f.,n
t o
f C
aesi
um
ra
dio
iso
too
es
in
so
il
resi
du
e aft
er
pro
c<>
ssin
g
wit
h
6N
HC
l
I-' "' "'

Tao,.e o: ISOi'OPll' (U~POSJ"i'IO., Or ACTIVE PART!C!Fo
- 200 -
r~
!I A'6 I Site Ce-144 Hu- J Oo " " ' il index I ll Cl ) Ill O ) 1 ( ll (I )
!r-' ,· j . l . 4 I E ! b-. 38 E I I 2.21 E I :I
ii ,, ii 2. I . o 9 F 2 b.73 E I 3.2b E I I' :I " " "
3. '> . 2 9 E 2 I . I 8 E 2 4.34 E j
!I II 4. 2. 5 4 E 2 I .00 E 2 5. 4 8 E 1
11 5. 2.95 E 3 3 . 4 1 E 1.92 E I I
I I 6. 1 . I 2 E 2 6.39 E I 4. n E 1
II II 7. 7. 8 4 E 1 2.80 E j
II ,, 8. 5. 9 2 E j 1.24 E 1 11
1: ·I 9. 3. 19 E 2 2. 4 7 E j 11
Ii Ii
IO . 3.32 E 2 2.73 E 2
II I 1 . 9. 5 0 E j 3. 6 7 E I
i/ 11 12. j . 9 "/ I: 2 l . 3 0 E 2 ii "
!I j 3 . I . 3 4 E 2 7. 17 E
Ii 1 4 . 5. 3 9 E 1 Ii ,.
1 5 . 5.41 E
II
Cs-134 Cs-131 II
( Ila l I ll a l
1 . 0 8
2.43 1 . 1 8 F 1
3 . 9 '> 1 . 8 9 F 1
7. 3 2 3.40 E
E 4.20 ~; 1
1.48 4.47
11
I' I! I! !! !! 1: !! ii ,. " !i ii Ii I' I' I! II I!
2.13 1.11 i: 1 i!
3 . l 5 1; 11 " 4. 89 l. "/0 c l 1:
l .34
4 . 0 8
2.67 l .40 F
I.Sb 9.76
11 !I
11 L'===================::::'.:=:====:::======'=====··.J

Table I: PART OF THE G-ACTJVITY RESULTING FROM 'HOT' PART! CLES IN SOURCE SAMPLES. UNOISSOLVEU RESIDUES ,U,D29ijj1CllATES
!r I Soi J !Part of Part of activitv resultinqll I, ,, Processinq ore oar at ion I l.'>-act i vi tv from I hot I oart icles -11 ,I
II Acids time C=calcined lwhich has II <hours) N=non-calci- aone into Source Lindi ssolved II ,,
I n-ed !solution (%) samples (%) residues (%) II 'I
11 HCl
I 1.5 N 26 33 27 I
! I HCl 24 N 43 46 38 I
I HCl 72 N 66 46 20
11 I HC] l . 5 c 82 40 20 II I I HNO:, 1.5 N 52 26 10 11
!1 HNO:, 1.5 c 65 49 0 II
HN03 +H2 Ol 1.5 N 64 54 15
I I HNO:, + Hz Oe, I. 5 c 81 30 5. I
1! HC!O~ 1.5 N 28 46 38 'I 11 I I HClOi, 1.5 c 81 44 20 II
I 11 I HCl04 +Hf 1.5 N 69 18 '/ . '/ II
II ii I HClO\ +HF I. 5 c 93 25 0 I
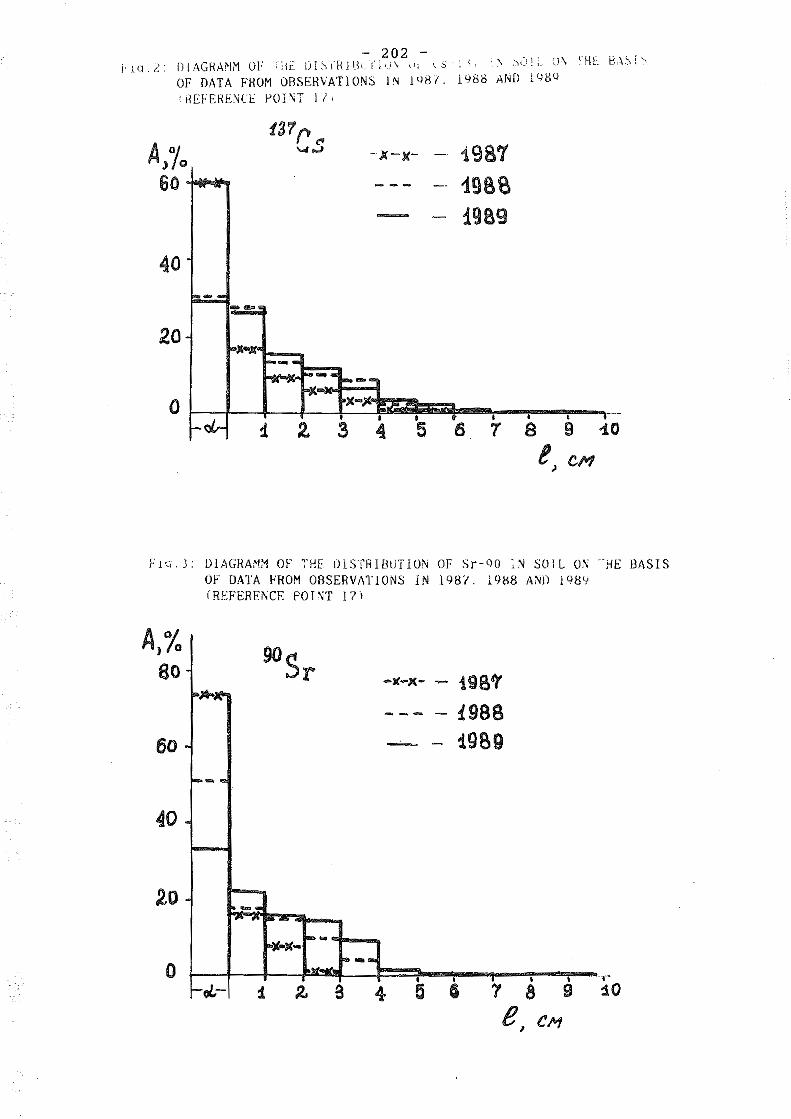
- 202 -i·1q.i: DfAGHA!"lM OF :"Hi:: iJI\·1·R1t~t.-t"J,_1\ tn \_s-: :;.· :.\ ."il)!; U.\ rHL i:3,\.'.:,f\
OF DATA FROM OBSERVATIONS 11~ 11.j8/. 1988 AND l98W
'REFERENCE POINT II,
A,10 60 ~ii'-,
40 - --
20
1987 19BS 1989
• • • s r a s 1.0
/!> CM
FJG. }: ll!AGRAM,'1 OF THE OlSTR!BuTION OF Sr-l)Q ;,; SOlL ON HE BASIS OF DATA FROM OBSERVA1'JONS IN 198'1. 1988 ANJl 1989 (REFERENCE POINT 171
- 9og:r 198, ->C-,c- -
. --- - i988
. --'-- - ~989 60
i-- -
40 .
. --- ~ ~-i«-x- -- ....
0 • • . • • -rJ.- 1 z a 5 Ci "f 8 9 r :l.O
e, C/11

203 -
Fig.4: FOR.'1S OF OCCURE~CE OF THE RADIOACTIVE ISOTOPES OF CAESIUM AND STRONTIUM IN SANDY SOIL. SITE 3 ( = 40 km FROM CHERNOBYL NPPl
• •
• • ••• • • ffi····:. ....-.t ••••
• • • • • • • • • • •• . .. . .
n 'l) O> ......
C'-co O> ....
•
• • • • • • • • • •• • • • •
• • • • • • • • • •
* C\l * • •
• • • • • • • • • • • • • • • • • • • • • • • •
•• • • • • • • • • • • • * UJ ..... ~
• • • • • • • • • • • • • • • • • • • • • • • • • • • •
• •
•
C'-
>-,
••• I :·:.
• • • -.:!' • :"!'
rt-+-+-+-t--t • • • • ... ~
H--+--++++-1 • • • • • • ....., ...... ,.....-+--+--+-~• • • • • • • • •• • •
~
UJ ~ C')
• .... • UJ
• • • • • • • • • • • • •• • • • • • • • • • • • • • • • • • • • • • • • • ~
@U'l.
u :,::
z
"C Q)
> -0 ,,, ,,, -~ Q
D
Q) -.0
"' Q) er c: "' .c: <.) :,( Ci)
I "C Q) :,( -~ ""
~

- 204 -
Fiq,5; FOHMS OF OCCURE);CE OF THE HAll!OACTIVE ISOTOPES OF CAESIUM ANll STRONTIUM IN SANDY SOIL. SITE 17 (• 250 km FROM CHEHNOBYL NPPl
~
O> ""-.. • • • • • • • •
O> • • • .. co • • • • O> • • • • • • H • • • • • • • • • • •• • • • • • • .. . • •
* H ~
•.O
• O'> • • • • • • • • • • • • • • • • • • ffi • • • • • • • • O> .. • • • • ...... • • • • • • • • • • • • • • • • • • • • •
* ~ C\I ...... • O> • • • • • • • • • • • • • •
!:"- • • • • co • • • • • O> • • • • • ...... • • • • • • • • • • • • • • • • • • • • • • • • • • • • • • <j ~
~ 1.:l
co ,
IJ)
'
\
'
'.O
,
)p,
~~ •• "'
.. , :J •
I-
,,
iJ
u :,::
z
0 "' "'
D
., -.J:l
"' "' C'· c: "' .c: <.)
" "'
'O
"' " ·~ "-

- 205 -
F1q.o: FORMS OF OCClJRE~CE OF THE RADIOACTIVE ISOTOPES OF CAESIUM IN SOD-MEADOW SOILS
~ ~ ~
• • • • co O> • • • • • • • .. • •• ..
• .. • .. .. • .. .. . .. • • • • •• • • • ... O> • • • • • • • 1) • • • • • • .. cJ) • • • • .. ,-.; • • • • • • • • • • ..
• • • • • • • • • .. • • • • • • • .. ~ 0
~
<.O • • • • • cJ)
• • • • • • • • • • • • • • • • • • • • ::) • • • • • • • • • • 'U • • • • • •
cJ) • • • • ,-.; • • • • • • • • • • • • • • • • • • • • • • • • • • • • • • • • • • • •
• • • • • • • • • • • • • ~
~
...... ~ I.Q
• • • O>
• • .. • • • • • • • • • • • • • !'- • • • • • 1) • •• • • • • • • a, • • • ... • ,-.; • • • • • • • •
• •• • • • • .. • • • • • • • • • • • • • • • • • • • • • • ,,-... :a
..J3 :,:: :.ts ......
2
~ ~
.. . • • co O>
• • • • • • • • • • • • • • • • • • • • • • • • • • • • • • • • • • • • •
• •
• • • • • • • • • • • • • • • • • • • • .. • • • • • • • • • • • • • • • • • • • •
ls'<:
C\l ~
0 ~
• • O> • • • • a, • • • • • • • • • • • • • • • • • • • • • • • • • • • • • • • • • • • • • • • • • • • • • • • • • • • • • • • • • • • • • • • • • • • • • • • • • •
~ ty) ~
0
• •• • •• • • • ••••• •••• • •••
• • • • • •
• • • •• • ••• • •
I e e • • • • • • • • • ••••• • • • • • • • • • • • • • • • • •
• • • • • • • • ~ :,::
c: ·~
D
"' -.0
"' "' <:f· c: "' .<:: <.) x ,..,
I ;, Q) x ·~ ...
• • • • • • • • ••

$;~
1 ('-
40
KM
)
1987
37 %
4%
~ .
e2~~-,m
111111 l
ffi~
%
fl 1
1111
1 t
IIII
IEF
Ft
Exc
hang
eabl
e
Wat
er-s
olu
ble
5%
4%
1988
• •
• ••
• •
• •••
• •
•••
• . .
. . ...
. . . ...
!.
...-
--
78
7 %
%
5%
2 %
I I D
isso
lved
in
IN
H
Cl
~·.;.;.
:1 "F
ixed
"
1989
Al 111
11 I IJ
.ll' :%
83
f'- •
~ -
%
3 %
<
l %
.,., ~·
.Q
...; .,., 0 :,:,
:i: "' 0 .,., 0 (")
(") c :,:,
(Tl
:z
(")
(Tl
0 .,., ..., ...,
:,:
0 (T
l
"' :,:
, >
c - 0 "' ..., :,:,
0 2 ..., -c:: :i: - z "' 0 0 ' :i:
trJ >
0 0 ,c "' 0 - r "'

- 207 -
a)
6)
Fia ~. \CTllE PARTlCLES DETECTED UTHE :-!ONlTORI~G S!Tf: 40 km FROM CHERNOBYL ~PP. Photomicroaraph al X 650 b I \ 800

- 208 -
a)
b)
fto.H: THACES OF ACTIVE PARTICLES fOU~D ON THE TERRITORY OF VAH I OIJS ~ON !TOR I NG S ITJ::S RADIOGHAPHY X4 EXPOSURE TIME: 72 HOVRS al 200 km from Chernobvl NPP 0 l ·1') km ~·rom Chernobv 1 \PP

0 E ,1 ·= n t i ~
•. ;
11
• ;; oa • 5
p
) I J
• E ~· ID • c L A~ 0
. ;
209
I !
i ..
< !
;
I
'· ..... .._.· ......
c . . " ,
• ' ' , ; '
~
' " . ;
' ~
! -~
. >
; > . 7 ;
,,
t- -•, '
" , . ' ~
l
' '
r > 4
~
,, i
<'
I
l < - ..
. :, ~
~
Q
·, ' -~ ::, ~
;,. ' ~
, •
f ' I
,
"
~
~
" ' ' , .•
I
L_
.... '----~ ·-- · ---- .. -· . ••••o £,o•~o,c~••• ,n~,,.., .... nG "'~Do••••ooo'";;"OOlll, ....,.. yAS.-.... -•

- 210 -
- 211 -
Hot Particles in Sweden One Year After Chernobyl
A. KEREKES, R. FALK, J. SUOMELA
National Research Institute for Radiobiology and Radiohygiene, Budapest
National Institute of Radiation Protection, Stockholm

- 212 -
ABSTRACT
Hot particles were collected on ground areas at three locations in Sweden one year after the Chernobyl accident. The aim wa:s to determine the density of the particlee on ground eurface, the radionuclide and elementary compoeition, the etructure, the size and other aerodynamic properties. Altogether 36 particles were detected by an end-window GM-tube on the 476 m• total area investigated. The observed surface densities varied between 0.03 and 0.07 particles/m'. Based on gamma spectrometric investigations and gross alpha activity measurements the particles found could be classified into two groups. One group of particles were fragments from the fuel elements, containing Zr/Nb-95, Ce-144, Ru-103/106, Sb-125 and alpha emitting nuclides. The highest total gamma activity was 800 Bq with about 0.7 Bq alpha activity after decay correction. The Ru-103 and Ru/Rh-106 isotopes took almost 95 per cent of the activity in the second group without alpha emitters. The l,ighest individual total gamma activity was over 20 kBq after decay correction. The scanning electron microscopic studiee of these particles showed an elementary composition of Ru, Mo, Tc, Fe and Ni. The diameters of three of the particles were as high as 9, 11 and 12 microns. The aerodynamic diameter and density of two of theee particles were derived by their fall forced by gravity in air.

- 213 -
INTRODUCTION
The hot particles originated from the nuclear weapons· tests were studied intensively in the "60-s and ·10-s [1-3]. These investigations were performed mainly on particles collected by air filters and fall-out samples. However very little is known about the hot particles' fate after their deposition into the euvironme11t. Some of the hot particles found after the Chernobyl accident showed rather unusual properties [4-5]. These particles had very high gamma activity in a size of few micrometers without alpha radiation. The radionuclide composition and the lack of the alpha radiation have denied the possibility to originate this kind of particles from the fuel element material. To ar,swer these questions hot particles were collected and investigated one year after the Chernobyl accident in Sweden.
METHODS
An er,d-window type GM-tube (window thickness 2 mg/cm•, surface 17 cm•) was used to detect the particles on ground surface. The investigated areas were in grassy parks without trees and any cultivation. The grass was cut several times since the accident, but the first cut was about one and half month after the d.:1,>oeition in all cases. Th.: detector was kept to the ground surface as close as possible, but the average distance was between 1 and 2 cm because of the grass and ground's roughness. The in-situ criteria to detect a hot particle was a doubled
-counting rate to the average background on the given place. The cc,llected soil samples took usually 100-200 g of mass. We used a rather simple mechanical separation to prepare the samples for the gamma spectrometric measurements. We got finally soil fragments containing the hot particle with diameters of~ few tenth of millimeter up to appr. 1 mm. In 9 cases of the total 45 ones it was not possible to identify a hot partic!e. Finally 36 particles were separated and fixed between two layers of adhesive paper. Th•s gamma spectrometric measurements were performed by a HpGe samiconductor detector. f0r alpha measurements the samples were cleaned further. usually by the help of an optical microscope. The soil fragments

- 214 -
co11tained hard sili~on crystallic structuree, in which the partic!es were trapped. To remove the impurities and to destroy th>: si.!..i.con structu,·es ·an 01·ganic solvent was used simultaneously with ruechanical destruction between two glass plates. This meth,,d was repeated until we got the particle on a piece nf paper of a few tenth of mm in size and without impurities visible under optical microscope. The alpha intensity measurements were carried out by Si surface barrier type detectors. For the scanning electron microscopic (SEM) studies further purification was made by ashing in several cases. Two particles were prepared for alpha spectrometry by electrodepc,sition and Pu separation.
GAMMA SPECTROMETRIC INVESTIGATIONS
Based on our gamma spectrometric results the particles could be .,rra11ged into two groups (Table 1), in close agreement with the observations published earlier [5-8). The medians and ranges of the total activities, corrected for the radioactive decay to 26 April 1986 can be seen in Table 1. Tl1e ranges of the total activities illustrate, that the two groups differ considerably not only in the radionuclide composition, but in their total activities too. The first type of particles, containing mainly Ru-103 and Rh-106 isotopes, by at least 95 per cent of the total activities, differ strongly from the hot particles found after the 11uclear weapons· tests [1-3]. In most cases was found a small quantity of Co-60, Sb-125, Cs-134 and Cs-137 nuclides, but the last ones could from the soil impurities of the samples. In several cases we found Cd-109 too, but we could measure only very small activity or none of Zr-95/Nb-95 or Ce-144 isotopes. The activity ratios of the Ru-103 and Rh-106 isotopes, ranged from 2.6 to 5.7, with the average of 3.7 . These figures corn,,;p,md to 22500, 8000 and 13000 MWd/tU burn-up levels of fuel eh:ments [6J. The more usual particles of the second type contained Zr-95, Nb··95 and Ce-144 radionuclides. by 60- 80 per cent of the total activity. About 10-20 % of the activity came from Ru-103 and Rb-106. Most cf them also contained a small quantity of Cd-109, S~-lZ~. Cs-134 and Cs-137.

- 215 -
AL~HA MEASUHEMENTS
Do not dissolve and loose the hot particles there was measured only the tota::. alpLa intensity for all of the samples. Tho alpha intensity measurements have proved, that none of the Fu/Rh particles contained detectable alpha emitting radionuclides, i.e. fragments from the fuel element matrix. This finding might be valuable to explain the origin of these particles. The Ru/Rh particles were claimed by several authors alsv to be: fuel element fragments [5-6). However our results support Chyseler's data [4] on the chemical composition of these particles and the explanation of Persson et al. [7] of their f0rmation. Fig. 1 shows the alpha spectrum of a Zr/Nb/Ce particle after electrudeposition. The measured and decay corrected alpha activities of two particles can be seen in Table 2.
STUDIES ON THE PAFTICLES' SIZES AND COMPOSITION PERFORMED BY SEM AND AERODYNAMIC MEASUREMENTS
We cor,centrated on the rather peculiar Ru/Rh particles in this phase of our study. We could localize, take photos and analyze the elemental composition uf the hot particles in five cases. The presence of the particle was judged by X-ray analysis in all cases. The SEM micrographs of three of the particles can be seen in Fig. 2-4. The surface of the particles was rough and the shape quite irregular, usually, although one of them showed rather regular shape and smooth surface (Fig. 2). The data on the particles derived from the SEM photos and X-ray spectra are collected in Table 3. The elemental composition supported the expectations referred in the previous paragraph. The only discrepancy was the presence of another metals, i.e. Fe.Ni and Al in the spectra, but they might cvme from the sample holder. The aerodynamical properties of two particles were investigated by their fall forced by gravity in air. The falling time was determined by the help of two GM-tubes positioned in a knuwn distai,ce along a vertical tube. The aerodynamic diameter and the density of the particles could be derived because the
. ge~ruetrical diameter~ were known. These parameters are also preclented 111 Table 3. The values of the specific activity of

- 216 -
Bu-103 (last line uf Table 3) agree well, except of the two par~icles for which the diameter was derived only from backscattere:d microgr.:ipbs.
THE SURFACE DENSITIES ON GROUND OF THE PARTICLES
Table 4 summarizes the number of particles found together with the observed and corrected surface densities on ground. It was observed under the preparation of samples, that the particles were found usually in the upper root zone of grass. However, because of the much higher efficiency of the GM-tube for betas we have to take into consideration the absorption of soil. It can be stated from these results, that we could probably detect a Zr/Nb/Ce type particle of the highest activity no deeper in soil than 3-6 mm, but we likely could not observe particles of activities lower than 90-220 Bq at all. For the Ru/Rh type pa1·ticles the depth limit of the detection was between 7 and 9 mm for the upper end of the activity range, and 1-4 mm for the particles of the lowest activities. These results give an acceptable explanation of the difference between the ratio of the numbers of particles of two typeE observed by us (Table 4) and published earlier. In Sweden a 5 to 41 [9], in Finland a 1 to 8 [6) ratio of the Ru/Rh and Zr/Nb/Ce particles were estimated. Our result (2 to 1 as an average) is much higher than these values. The surface densities of the particles were corrected based on tl1t, detection limits and presumptions on the real activity distribution and initial densities on ground [10). According to the corrected values (Table 41 a 15 per cent fraction of the Zr/Nb/Ce particles was still in a depth of up to 3-6 mm one year after the accident, indicating an environmental half-time of 130 days. 70 per cent of the Ru/Rh particles was in a depth of up to 3-9 mm, suggesting an environmental half-life of 700 daye. The ratio of the corrected surface densities of Ru/Rh particles in Gavlc and Stockholm or Gotland (see Table 4) differs strongly from the ratios of the Cs-137 depositions on that area::;. The last values were 2-3 kBq/m" in Gotland and Stockholm, but 100·120 kBq/m" in Gavle [7]. The most probably explanation of this discrepaucy is. that the hot particles· depu,~itiou occurred mainly in the form of dry deposit.ion, and was L01.. offected c,)nsiden,bly by the amount of pre·~ipi tati·c;n.

- 217 -
P.EtERENCES
[1] Persson G .. Sisefsky J. ,19?1: Radioactive particles from the Bth Chinese nuclear test (Health Physics,21,421-428)
[2] Nakahara H. ,Sotobayashi T.,Nitho 0. ,Suzuki T.,Koyama S .. 1975: Fallout from the 15th Chinese nuclear test (Health Fhysics,29,291-300)
[3] Sisefsky J.,Arntsing R. ,1980: Particle properties of debris appearing in Sweden from the Chinese nuclear test of March 18, 1972 (FOA Rapport,C 40113-TZ(Al))
[4] Chyssler J.,1986: Analysis of particles in.the fallout from Chernobyl. Part 2. (Studsvik Report NP-86/169)
[5] Devell L. ,Tovedal H.,Bergstrom U. ;Appelgren A .• Chyssler J. ,Andersson L .• 1986: Initial observations of fallou~ from the reactor accident at Chernobyl (Nature,321,192-193)
'.6] Rytomaa T. ,Toivonen H.,Servomaa K.,Sinkko K. ,Kaituri M., 1986: Uranium Aerosols in Chernobyl Fall-out (Finnish Centre for Radiation and Nuclear Safety, internal report)
~7] Persson C.,Rodhe H. ,De Geer L.E.,1986: The Chernobyl acci-dent: a meteorological analysis of how radionuclides reacl1ed Sweden ( SMHI Reports,Nr55)
[8] Van der Veen J. ,Van der Wijk A. ,Mook W.G. ,1986: Core fragments in Chernobyl fallout (Nature,323,399-400)
[9) Edvarson K.,1987: Private communication [10] Kerekes A .. Falk R.,Suomela J.,1987: Analysis of hot par
ticles collected in Sweden one year after the Chernobyl accident (Proc.of the NOSA Aerosolsymposium, LilleetromJ

1
~t.or-t Ti-• 9-JlM-88 11,20 11ea1 n- a 23, oo. oo. oo LI.,. Ti- I 23,00.00.00
- 218 -
liaolpl• Ttlioople 10. ic,,tple Type,
t-JUN-811 00. DO Ml 12 1,1.FA
--Off-to 7. IIE--01 s1_. -a. tlllE-01
Fig. l. The alpha spec,;run, of a Zr /Nb/Ce type particle afu,r electrodep0sition
Fig. 2. The SEM micrograph of particle HAGAl

- 219 -
Fig. 3. The SEM micrograph of particle GUAN1
Fig. 4. The SEK-micrograph of particle GUAN2

- 220 -
':'able 1. TLe garuma emitting radionuclide composition of the hot particles
1. 2.
Total gamma activity (per activity* ( Bq) Zr/ Ru-103/
median range Nb-95 Rh-106
2000 320-22000 + 95 400 25-770 60 20
• decay corrected for 26 April 1986 + Jetectabl~. but less than 1 %
cent of the total) -
Cd-109 Sb-125 Ce-144
+ 1 1 1 1 15
Table~- Alpha activities of two particles from the Zr/Nb/Ce gr<.ltlp
Particle Alpha activity in mBq (corrected for 26 April 1986) Pu-239 Pu·238 Cm-244 Crn-242
/Pu-240 /Am-241
HAGA11 14.5 11.0 0.69 105 HAGA12* 53 50 3.6 580
* the particle wae fragmented under preparation
··--· ------- ---- - -----·~
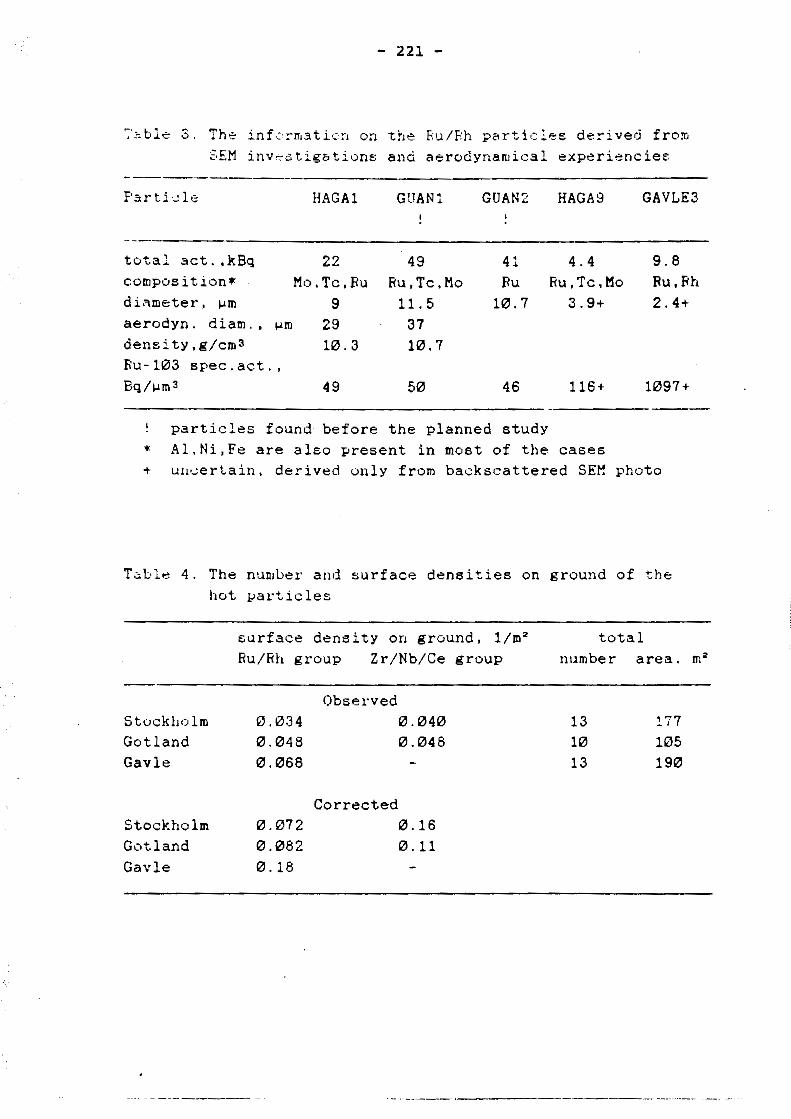
- 221 -
~~ble 3. The inf,,rmaticn on the Ru/Ph particles derived from SEM inv~stig&ti0ns and aerodynamical experienciee
F'art.L: le;
total act. ,kBq
composition* d i.'lmeter, µm aerodyn. diam., µm density,g/cm3 Ru-103 spec.act., Bq/µm3
HAG Al
22 Mo.Tc.Ru
9 29 10.3
49
GUAN::.
49 Ru.Tc.Mo
11. 5 37 10.7
50
GUAN2
41 Fu
10.7
46
particles found before the planned study
HAGA9
4.4 Ru,Tc,Mo
3.9+
116+
GAVLE3
9.8 Ru.Rh 2.4+
1097+
~ Al,Ni,Fe are also present in most of the cases + u11Gertain, derived only from backscattered SEH photo
T.:.bl,; 4. The number and surface densities on ground of the hot pat·t ic les
Stockholm Got land Gav le
Stockholm Got land Gav le
surface density on ground, 1/m" Ru/Rh group Zr/Nb/Ce group
Observed 0.034 0.040 0.048 0.048 0.068
Corrected 0.072 0.16 0.082 0. 11 0.18
total number area. m•
13 '..77 10 105 13 190

- 222 -

- 223 -
Biological Monitoring of the Deposition and Transport of
Radioactive Aerosol Particles in the Chernobyl NPP Zone of
Influence
N.V. VIKTOROVA, E.K. GARGER
Kiev Radioecological Department, Institute of Experimental Meteorology , Science and Production Organisation,
'Typhoon', Kiev, USSR

- 224 -
It is wel I lcnown by now that, as a result of the Chernobyl accident, a large
quantity of finely dispersed radioactive aerosol (consisting of an extremely
heterogeneous mixture of fuel and radionuclide particles of varying
composition, sizes and physico-chemical properties) was deposited in the
environment. Particles with high individual activity were earlier termed
"hot" particles in the specialist literature. 1 According to some official
data, the quantity of finely dispersed fuel ejected during the Chernobyl
accident in the form of "hot particles" is estimated at 6-8 t, not including
the "fuel dust" which remained within the enclosure or "sarcophagus".
The accident coincided with the active vegetation period of the higher plants
in this region, and a considerable proportion of the radioactive particles
settled on the leaves of trees, shrubs and herbaceous plants. our initial
research (one month after the accident) into the fa! lout of radioactive
particles onto the leaves of plants in the Chernobyl NPP 30-lcm zone and in
the city of Kiev, led us to draw certain conclusions as to the dynamics of
behaviour and forms of the activity deposited, and demonstrated the
expediency of using plants• leaf blades to solve geophysical problems and as
the object of radiobiologlcal experiments (in much the same way as
traditional screens are used).
Plants are one of the main I inlcs in the trophic chains of radionuclide
transport. The role of plants in such transport was studied mainly in
relation to soluble compounds of radionuclides (as in the case of the Kyshtym
accident, for example 2), or to global fa! lout in which radionucl ides were
in soluble or exchangeable forms. The specifics of the Chernobyl accident led
to the radioactivity occurring in particular forms, and the lcinetics of
radionuclide migration within trophic chains sometimes vary considerably from
what was established In earlier experiments. It is important to study the
interaction between plants and· "hot particles", whose physico-chemical
properties determine their non-solubility, which is characteristic, for
example, of the carbides and oxides of some metals. When particles come into
contact with plant surface tissues, "dissolving" factors come into play such
as changes in the acidity of the solution or interaction with complex-forming
compounds and organic materials exuded by the leaves of some plants. Thanks
to these factors, many plants are capable of extracting compounds of low
solubility from the soi I minerals.

- 225 -
Making use of macro- and micro-radioautography, we set out to estimate the
rate of conversion of low-solubll lty radionuclide particles into biologically
mobile forms of radlonuclides accessible to plants; to study the density of
fuel particle fallout In the near-ground layer of the atmosphere and to
assess how this varies at different distances from the fallout source over
time (during the four years following the accident, 1986-1989); to study the
size of the particles deposited on the leaves of plants at various strata,
their act lvity, morphology and behaviour when kept In the form of herbar ium
exhibits; and to assess the contribution of alpha-active particles to the
general amount offal lout and how It changes over time.
Methods and materials
From June 1986 to the present we collected leaves of plants at specific
points in the Chernobyl NPP zone of influence (2, 5, 10, 15, 30 and 90 km
from the wrecked unit), noting down every one or two months the stratum in
which we found them, i.e. their distance from the ground surface, during the
whole vegetative period (from April to October). In some experiments samples
were collected more frequently.
The leaves thus gathered were dried in herbarium meshes and the part intended
for radioautographic analysis processed as herbarium exhibits, which remain
preserved in an undamaged state to this day. To assess their total activity
the leaves were ground and, using a widely accepted method, prepared for
gamma-spectrometric analysis of contamination.
"Hot" particles on the leaves were identified by bringing the leaves into
contact with various radiographic films (RT-5 or RM-V) for a length of time
specific to each experiment. We developed the films by a standard method,
counted the number of dark blotches at the various particle locations, and
determined the diameter of the blotches (this being known to correlate to
particle activity).
To study individual particles we matched their autographs on the film against
the specimen, cut out a section and isolated a given particle under an
optical microscope; we then ascertained Its size and, where necessary,
photo-recorded it under the microscope. Gamma-spectral analysis of
individual particles and beta-radiometry were carried out, and further
radioautographs taken one or two years later for comparative analysis of
their decay (if this formed part of the researcher's brief).

- 226 -
To identify the alpha-active particles we used solid-state tracl< detectors
(CN-85, CR-39 and LR-115) which, after being brought into contact with a
specimen, were processed as specified in the accompanying instructions and
analysed under an optical microscope. We used the same sol id-state detectors
to identify fission fragments following neutron activation of the specimens
via a 1012 cm-2 neutron flux in the mlcrotron-22 belonging to the Nuclear
Research Laboratory of the Joint Institute for Nuclear Research (Dubna,
Moscow region). The number of alpha-tracl<s was determined under a microscope
to Identify the uranium and plutonium nuclides.
An over a 11 estimate of fa I lout over space and t lme was obtained vi a the
horizontal gauze screen method involving gamma-spectrometric analysis of the
screen contents.
Resu I ts
Since completion of the "sarcophagus" enclosing the wrecl<ed reactor (November
1986), radioactive aerosol particles in the near-ground layer of the
atmosphere have contributed to secondary contamination mainly through being
resuspended from the ground by the wind. In order to learn more about this
process we monitored the intensity and coefficient of wind-uplift throughout
the year, drawing on gradient-related observations of the volumetric
radlonucl Ide concentration in the near-ground layer of the atmosphere,
together with daily measurement of the volumetric concentration in the towns
of Pripyat and Chernobyl and of radionuclide deposition across a networl< of
points within the Chernobyl NPP 30-l<m zone.
Fig. 1 shows the change over space and time in the caesium-137 fallout value,
based on screen measurement data obtained along the Pripyat-Zeleny Mys axis.
A steady drop in the fallout value can be seen over time (this being
particularly sharp In the first half of 1988 but slowing down In 1989). The
values for "hot" particle deposition density evolve in a similar manner over
distance and time (Fig. 2); the number of "hot" particles deposited on the
leaves of plants in 1988 was five times lower than that deposited in 1986 in
the area 5 l<m from the reactor (Kopachi, Novoshepelichi), and in the 30-km
area (Otashev) 25 times lower.
Thus, radioactive aerosol emission into the atmosphere as a result of natural
wind-up I ift and other factors stabilises to a certain degree.

- 227 -
The data presented were obtained from radioautographic analysis of the
activity deposited on plant foliage; some specimens are shown in Figs. 3-5.
As we can see, in 1986 there was no difference In the fallout density of
particles deposited on leaves in the various strata: It is the same for
leaves growing 10-50 cm above soi I level and for those 2 metres above it.
However, the situation changes in 1987 and 1988, when the largest "hot"
particles display a tendency to collect on the leaves of near-ground whorls.
A decrease in the density of radioactive particle deposition on leaves
observed at certain points in the area In 1988 and 1989, made It very
difficult to carry out a representative autoradlographlc analysis, thus
leading to a 25-30,i; increase in measurement error. Dur Ing these periods
particle fallout density was assessed from leaves in the near-ground stratum
(plantain, burdock, cinquefoil, etc.).
We assumed that the diameter of a dark blotch on the radiographic fl Im was
related to the activity producing the particle autograph 1, and - using
this parameter - we plotted particle distribution at two points in the
Chernobyl NPP zone - 5 km and 30 km from the reactor (Fig. 6). The main
category at both points is that of fine, low-activity particles producing
blotch aureoles smaller than 1 mm, but, as the histogram shows, at distances
over 30 km there are no heavy and highly active particles (which produce dark
aureoles larger than 10 mm). However, the complex character of the particles
specific to Chernobyl prevented us from establishing the type of direct
correlation between particle activity and size obtained via the wei I-known
formula for global fallout. 1 Many of the particles consist of al I
possible combinations of an active nuclide with a non-active carrier.
Therefore, to study the correlation between particle radioactivity and size
we need to check the particles' size and morphology directly under the
microscope, and an e I ectron microscope is requ I red to study the size and
morphology of particles under 5 microns.
In view of the great complexity involved in singling out Individual hot
particles and determining their gamma, beta and alpha activity plus their
microscopic parameters, we looked at a possible direct method of determining
the size of particles from their alpha-activity track in thin layers of BYa-2
photoemulsion. Although this method can be used, it is more suited to
studying a I imited number of particles since it is very laborious and
painstaking and ties up a large number of microscopists.
- 228 -To assess the contribution of alpha-active particles to overall mass we used
sol id-state traclc detectors brought Into contact with the particle at its
location on the specimen (leaf) as Indicated by the autograph on the RT-5 or
RM-V type radiographic films after matching with the specimen. The alpha
activity traclcs detected are shown in Fig. 7. The only drawback to this
method is the difficulty of obtaining good malces of sol id-state detectors
from abroad.
As for the physlco-chemical properties of the Chernobyl particles, a large
number of reports - by researchers In various parts of the wor Id - have
appeared on this subject over the last two years.
An Important feature of the "hot" particles studied by us Is that since being
collected they have been preserved in dry-air conditions, i.e. on dried
leaves collected at various times since the accident, the earliest being
6 June 1986. This means we can see how the dynamics of change in the
particles' activity and morphology relate to conditions at their location,
given that most studies concern research into "hot" particles in the soi I.

- 229 -BIBLIOGRAPHY
1. A. V. Bykhovsky, o. M. Zarayev: Hot aerosol particles in the technical
application of atomic energy, book, 1974, Atomlzdat, Moscow, p. 119.
2. B. V. Niklpeloy, G. N. Romanov, L. A. Buldakov, et al.: The Southern
Urals Accident of 29 September 1957; Information Bulletin, 30 June 1989,
Public Information Centre, Moscow.
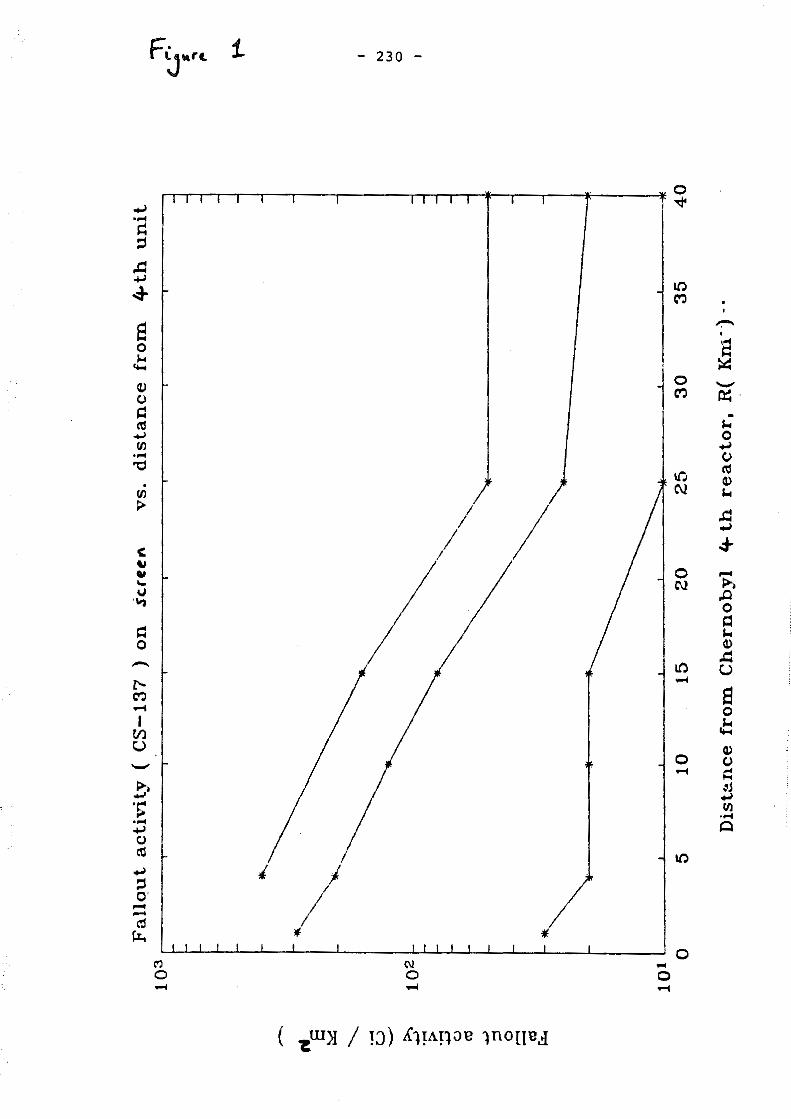
-- ,is
::,,::
........._
.... u - $ .... :> .... ..., C
) ro ..., ;:::!
0 ,..., .... ro ~
Fall
qu
t acti
vit
y (
C
S-1
37
)
on
s
cre
e~
v
s. d
ista
nce fr
om
4
-th
un
it
10
3
---,
w.--.
t·~,
I ~ ~
I 1
02
~ ~
··, """
"-,
[*
~
10
1<
--~
~--'~
~~
-'-
-~
~-~
..L
-~
~-~
J_
_.~
~..
::::
,.,,
-.~
~--'-
--~
~-'-
-~
~--
o 5
10
1
5
20
2
5
30
3
5
40
Dis
tan
ce f
rom
Ch
ern
ob
yl ~ t
h r
eacto
r, R
( K
ni-
) -·
c._:"!
' $ .. ,. ~
"' w 0

- ... ::::;:
........
...
trJ ~
......
C) --...., .... co
Ao - !;> --00 ~ ~ "d
....,
;::,
0 - -ell t:=..
Ho
t p
art
icle
fa
llo
ut
den
sit
y o
n p
lan
ts v
s.
dis
tan
ce fr
om
If
.th
u
nit
10
5..-
-~--
--,~
~~.-
~~-.
-~:..
:.._:
;~~~
~~~:
:~~~
~~~~
~~
104
16
3
102
·- ... :--
----
-__
1 9
86
-... -
...... _
...
" .. -
--""--
------
------
----...
__
;.; "' ' \
\ ' ' \
·. \ '·
\ ....
\ \ \\ -·, ·.,
' . ' ' -
'. ' . '·
', ' " l~
~ ....... _
--
-........
_
-·-
-.........
-. -- ---.....
.......
-- --- -- -- .....
........ ·- --
----
---
19
87
--- -- --
--- -- ----
19
88
--
-----
1010
;--~~
~~~-
;:c;-~
~-;'c
i;--~
~~~~
--:,:;-
-~~-
:.:-~~
--L~~
~~:.::
.=:::
..::.:.
Dis
tan
ce f
rom
4
th C
hern
ob
yl
un
it,
R(
Km
)
..,, c..
;:·
"' w ..... £ ... ,. I'
>

Fig.3, 4
- 232 -
Photos of leaves and their radioautographs; collected in 1986 in the Chernobyl NPP 30-km zone.

Fig.5
- 233 -
:Photo of leaves and their radioautographs; collected in 1986 In the Chernobyl NPP 30-km zone .
•

50l
Fre
quen
cy o
f or
:cur
ence
( %
)
40
3 2 I
Fiq
.t,;
IH
STH
IBU
TIO
N
OF
'HO
T'
PAR
TIC
LE
S BY
A
UH
EOLE
D
IAM
ETER
ON
R
AD
IOA
UTO
GR
AM
S FR
OM
V
AR
IOU
S C
HER
NO
BY
L N
PP
ZON
ES
15
and
30
km
from
u
nit
41
!p
lan
t le
aves
)
O -
Kot
•c&
..i
0 -
01-"'
"~"
I986
F'?
IO II
12
1
1
d.,
I4
/:A!.~
/
"' w ,I>

Flg.7
- 235 -
Tracks of alpha-activity (obtained using solid-state track detectors) on leaves collected 30 km from the reactor (edge of zone) in 1987.

- 236 -
. '-
! 5 3 Di! 5 ~ D B DD •.,-:,
' '
Fig.8 General view of "hot" particles on scanning electron microscope.
,- -r j .:
/
~ II 2_

- 237 -
Deposition and Resuspension of Radiocaesium after Chernobyl
J.A. GARLAND, K. PLAYFORD
AEA Environment and Energy, Harwell Laboratory, Oxfordshire OXl l ORA, UK

- 238 -
ABSTRACT
An understanding of the processes of deposition and resuspension is
required for evaluating the consequences of planned and accidental
discharges of radionuclides. Opportunities for the observation of these
processes following a widespread dispersal of material are rare. The
Chernobyl accident provided an opportunity to measure deposition and
resuspension of caesium isotopes, which were dispersed beyond the borders
of the Soviet Union chiefly as sub-micron particles.
Direct observation confirmed that dry deposition of such particles is very
slow, and allowed dry deposition velocities to be evaluated for rural and
urban surfaces. For grass in Western Europe, the deposition velocity was
about 0.5 mm s- 1 although a few measurements gave higher results. Similar
values were found for roofs.
Where rain occurred, wet deposition was dominant, but measurements of wet
deposition parameters during individual rain events were very variable. A
more useful estimate of the rate of removal by rain was derived from the
variation of the concentration of radiocaesium in air over a period of
several weeks following the accident. This approach indicated a mean of
330 for the washout ratio.
After a period of rapid removal from the atmosphere, concentrations of
137cs in air have remained measurable throughout Europe. The results of
measurements indicate that resuspension is responsible, and that local
variations in the amount deposited soon after Chernobyl are reflected in
the resulting air concentrations. Traffic appears to be a significant
mechanism at some locations. Other local effects are apparent as seasonal
differences in concentration. However, resuspension appears to vary
systematically with the amount deposited across Europe, despite the large
range of climate. There is some indication of long range transport of
resuspended caesium. The results may be used to assess the applicability
of resuspension models in Europe. Models which indicate resuspension
factors at the lower end of the range are consistent with the data. The
rates of deposition of resuspended activity were extremely variable and
unexpectedly large in some locations, suggesting that the contamination of
crops and surfaces by resuspended material is potentially a significant
process.

- 239 -
1. Introduction
Values of the parameters describing dispersion, deposition and
resuspension are required for use in models for predicting the
consequences of routine releases as well as accidents. The values used
are based chiefly on laboratory or field experiments of limited scale, or
on experience at nuclear facilities in North America. Data collected in
Europe following the Chernobyl accident increase the available
information, and extend it to include the moist temperate climate of
Western Europe.
Several sampling networks operating in the countries of Europe have
provided data that can be used to improve or confirm the parameter values
in use. Here we summarise some of the available data, using 137cs as an
example. Dry and wet deposition are discussed as well as resuspension.
2. Dry Deposition
Several authors in Europe determined the activity on grass and the soil
surface after the peak concentration in air had occurred. Where rain did
not fall, the deposition velocity, Vg, could be determined:
1 activity deposited on grass, (Bq m-2) vg (ms- ) - ~~~~~~-=-~"--~~~---'"-~-'--'-"--~"--~~~ mean airborne concentration (Bq m- 3) x duration (s)
In a few locations, direct measurements were made of activity on building
surfaces and roads, either by sampling methods or by in situ gamma
spectrometry.
Table 1 summarises several measurements. The data for grass provide
valuable confirmation of the prior understanding of dry deposition. Many
previous measurements and theoretical considerations indicated a
deposition velocity of about 0.1 mm s- 1 for particles in the range 0.1 to
1.0 µm, with a sharp rise for larger particles. Measurements of the size
of airborne particles carrying 137cs from Chernobyl (12,13,14) showed that
over Germany, Scandinavia and Switzerland the particles were principally
0.1 to 1 µmin diameter, with a small fraction up to 5 or 10 µrn, and the
contribution of these larger particles to deposition explains the observed
deposition velocities, which generally cluster about 0.5 mm s- 1 .

- 240 -
The results for building surfaces are also generally consistent with
expectation, with very low deposition velocities for walls, and values for
roofs and roads comparable with those for grass.
3. Wet Deposition
A number of direct observations of wet deposition have been reported.
Generally, models require the fractional rate of removal by rain, ~. but
the measurements have been used to determine the dimensionless washout
ratio
w -activity per unit mass of precipitation (Bq kg-1)
activity per unit mass of air observed at ground level (Bq kg- 1 )
If the rate of rain is p and the vertical extent of the (assumed by well
mixed) plume is H, i can be related to W
i - Wp/pH
where pis the density of air. In practice, the vertical profile of
material in the atmosphere is rarely observed. Thus, i can seldom be
determined directly from measurements. Examination of a small number of
data (Table 2) is sufficient to show that values of W vary widely. There
are a number of possible explanations, but the most significant are
probably (i) variations in the relationship between the concentration
measured in air at ground level and that present at rain-forming
altitudes, (ii) temporal variations in the airborne concentration so that
the mean concentration during the air sampling period is not
representative of that present during the (often much shorter) period of
rain. These variations lead to difficulties in the collection of
representative washout data.
Fortunately, another approach may be used. During the period from about
20 to 80 days after the Chernobyl accident, weekly air concentrations at
several stations in the northern hemisphere were similar (Fig. 1),
suggesting that on this averaging time the Chernobyl activity was fairly
well mixed through the northern half of the troposphere. Moreover,
during this period the concentration declined exponentially with a mean
residence time of about 8.7 days. Given that the mass of the troposphere

- 241 -
is about 9000 kg m· 2 and the precipitation rate for May to July averaged
over the northern hemisphere is about 3.1 kg m·2 d- 1 , and noting that wet
deposition was far more important than dry deposition for Chernobyl
caesium, the mean washout ratio can be deduced as
9000 W - - 330
3.1 x 8.8
This value is broadly consistent with values determined for the trace
elements that occur in small particles (15). This value of W implies a
mean value of 3 x 10· 5 s· 1 for i, if a representative value of 3 mm h" 1 is
assumed for the precipitation rate. These parameter values are rather
smaller than those used to model Chernobyl dispersion. For example
ApSimon et al. (16) used i - 5 x 10·5 q0.8 (where q is the precipitation
rate in mm h" 1 ), equivalent to a mean effective value of about 8 x 10· 5
-1 s .
4. Resuspension
4.1 Introductory Lemarks
By autumn 1986 it was obvious that the concentration of radiocaesium in
the atmosphere was not continuing to fall at the rate observed from May to
July. Possible explanations, including return of some material injected
into the lower stratosphere and continuing dispersion of material from the
vicinity of the damaged reactor, were considered. However these
hypotheses could not account for the dependence of the air concentration
on local deposition. It is now clear that resuspension of material
deposited within the vicinity of each sampling point must explain most of
the continuing air concentrations.
Previous studies of resuspension have included observations from nuclear
weapon testing grounds, nuclear plant in America and the surrounding of
Palomares in Spain. The only information relevant to the humid climate of
North West Europe had been gleaned from wind tunnel investigations and
small scale tracers experiments. To improve this data base, the IAEA has
provided support to an assessment of the considerable amount of data
available in environmental measurements during the years following
Chernobyl.

- 242
Resuspension has the potential to cause persistent air concentrations and
to redistribute material on the ground. Inhalation and contamination of
crops may result in internal radiation exposures, and the contamination of
previously clean areas causes the redistribution of external radiation
doses. All three pathways need to be assessed in predicting accident
consequences.
The resuspension factor
Concentration in air, Ca (Bq m·3) K(m" 1 ) -
Surface deposit, d (Bq m·2)
has often been used to describe observations of resuspension. Both
numerator and demoninator are directly measurable, but using K implies an
equilibrium relationship between these two quantities which may be
achieved only over an extensive area of uniform deposit. In principle,
when the deposit varies spatially, concentrations would be better
predicted using the resuspension rate,
resuspension flux, R (Bq m·2 sl)
d (Bq m· 2 )
Thus A is the fraction removed per second by resuspension. Unfortunately
this quantity cannot readily be deduced from field observations, but, if
it were known, its use with a suitable dispersion and deposition model
would enable the movement of contamination from place to place to be
predicted. Such an approach is necessary for calculating air
concentrations due to resuspension downwind of a contaminated area.
Whether A or Kare used, it is clear that the value of the parameter must
be expected to vary with many environmental variables. Perhaps the most
important of these will be time after deposition, surface structure,
nature of contaminant, wind speed, surface moisture and rate of mechanical
disturbance of the surface. Measurements after Chernobyl must reflect all
these, but it is unlikely that the data will contain sufficient detail to
allow the influence of more than one or two to be distinguished.

- 243 -
4.2 Air concentrations
Sequences of two or three year's air concentration data are available for
several stations across Europe. Where the deposition on the ground is
known, K can be calculated. The results show a general decline of K with
time, t, after deposition. A simple exponential function gave a
reasonable description of the decrease with time for all stations (Table 3
and Fig. 2; see reference 17 for data sources). Results have been
analysed for twenty stations in all. Some were unsuitable for the time
trend analysis in Table 3. This data set includes a range of three orders
of magnitude in initial deposit, d, and it is clearly apparent that the
air concentration, averaged over suitable periods after deposition, does
increase with d. However, the increase was less than proportional to d,
so that K decreases as d increases (Fig. 3). This trend may reflect long
range transport of airborne resuspended material from sites of high
deposition to those of low deposition. Another explanation may relate to
an effect of deposition mechanism. Areas of high deposition received
their 137cs in rain, and this material may be less available for
resuspension than that deposited in dry conditions.
Several models have been proposed for the resuspension factor. Some of
the commonly used models are shown in Fig. 4, and the range occupied by
the exponential functions fitted to the data is also shown. Clearly the
results are more nearly consistent with the models that predict the lowest
concentrations.
A number of details may be seen in the results. At some stations
pronounced seasonal effects may be seen in the results, but it has not yet
been possible to indicate the cause. At coastal sites on the island of
Bornholm and at Ris~ (18), there is an effect of wind direction, which
would be explained if most of the resuspended material measured derived
from land areas within 20 km of each site. Finally, results at Ris~ (18)
and also at Harwell (19) clearly indicate the effect of traffic.
4.3 Deposition of resuspended material
Several sites deploy deposition collectors. Often these are funnels which
collect dry deposition as well as rain, and the results of measurements of
deposition during the period influenced by resuspension are useful since

- 244 -
they give some information on the possible contamination of crops and
other materials due to resuspension.
The results show some evidence of a relationship between the amount of
resuspended material deposited during the year from August 1986 to July
1987 and the initial deposit (Fig. 5). However there is a broad variation
in this relationship. At some sites the extent of deposition of
resuspended material is quite minor, only a percent or so of the initial
deposit, while at other locations it is as large as the initial deposit.
This may reflect variations in the surroundings of the sites, but may also
be influenced by sampling techniques. If the resuspended material were
available for crop contamination, it might make a significant contribution
to doses.
The resuspended material also exhibits a wide range of total deposition
velocity (ie the long term average deposition flux including rain and dry
deposition divided by the air concentration). At some stations this is of
order metres per second indicating a contribution of very large particles,
which can only be of very local origin, and local circumstances which
favour or prevent the resuspension and sampling of particles several tens
or hundreds of microns in diameter may be crucial in determining the
result of the deposition measurement.
Conclusions
Results from measurements following Chernobyl have confirmed the expected
dry deposition rate for small particles. The analysis of wet deposition
rates has given rise to difficulties which were not completely unexpected.
Wide variations in individual observations made the derivation of
representative parameters difficult. The long term behaviour of the
aerosol indicates a mean residence time which is in agreement with
previous estimates of the residence time for the most persistent aerosols,
but this leads to washout parameters somewhat smaller than the values
commonly used in models.
More has been learned of resuspension. Previously, resuspension had never
been observed from a widespread contamination incident in temperate, humid
zones of Europe, but results have been obtained that demonstrate the
significance of resuspension of radiocaesium in this area. Air

- 245 -
concentrations were modest, and caused only a minor increase in inhalation
dose in comparison to the dose from the initial plume, However, the
potential for contamination of crops and other surfaces by the deposition
of resuspended material appears to be much more significant in some
locations.
References
1. Cambray, R.S, Cawse, P.A., Garland, J.A., Gibson, J.A.B.,
Johnson, P., Lewis, G.N.J., Newton, D., Salmon, L. and Wade, B.O.
(1987). J. Nuclear Energy 26, 77-101.
2. Devell, L. (1988), Characteristics of the Chernobyl release and
fallout relating to the OECD/NEA/GRECA parameter study. ANS, June
12-16, 1988, San Diego.
3. Maqua, M., Bonka, H. and Horn, H.G. (1987). Radiation Protection
Dosimetry 21, 43-49.
4. Roed, J. (1987). Radiation Protection Dosimetry 21, 33-36.
5, Monte, L. (1990). J. Environmental Radioactivity 12, 13-22.
6. Nicholson, K.W. (1989). J. Radiological Protection~. 113-119.
7. Erlandsson, B. and Isaksson, M. (1988). Environment International
14, 165-175.
8. Papastefanou, C., Manolopoulou, M. and Charalambous, S. (1988). J.
Environmental Radioactivity l, 49-64.
9. Persson, C., Rodhe, H. and de Geer, L.E. (1987). Ambia 16, 20-31.
10. Clark, M.J. and Smith, F.B. (1988). Nature 332, 245-249.
11. Hotzl, H., Rosner, G. and Winkler, R. (1987). Radiochimica Acta 41,
181-190.

- 246 -
12. Jost, D.T., Gaggeler, H.W., Baltensperger, U., Zinder, B. and
Haller, P. Nature 324, 22-23.
13. Reineking, A., Becker, K.H., Porstendorfer, J. and Wicke, A. (1987).
Radiation Protection Dosimetry 19, 159-163.
14. Kauppinen, E.I., Hillamo, R.E., Aaltonen, S.H. and Sinkko, K.T.S.
(1982). Environ. Sci. Technol. 20, 1257-1259.
15. Cawse, P.A. (1974). AERE·R 7669, HMSO, London.
16. ApSimon, H., Wilson, J.J.H. and Simms, K.L. (1989). Proc. R. Soc.
London A425, 365-405.
17. Garland, J.A. and Pattenden, N.J. (1989). Resuspension following
Chernobyl. CEC Seminar on Methods and Code for Assessing the
Off-site Consequences of Nuclear Accidents. Athens, May 1990.
18. Aarkrog, A., Botter·Jensen, L., Chen Quing Jiang, Dahlgaard, H.,
Hansen, H., Holm, E., Lauridsen, B., Nielsen, S.P. and
Sogaard-Hansen, J. Ris~ Laboratory Report Ris~-R-563.
19. Garland, J.A. and Cambray, R.S. (1989). Resuspension after
Chernobyl. Aerosols: their Generation, Behaviour and Application,
3rd Annual Conference of the Aerosol Society.
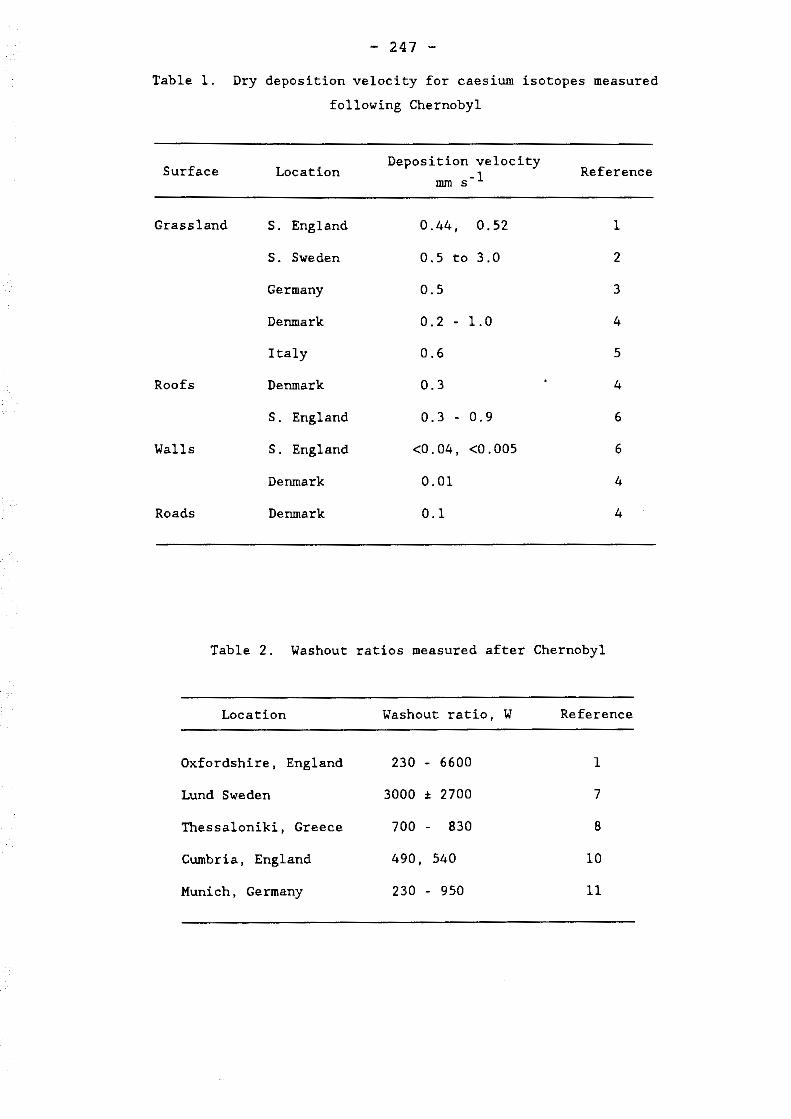
- 247 -
Table 1. Dry deposition velocity for caesium isotopes measured
following Chernobyl
Surface Location Deposition velocity
Reference mm s· 1
Grassland s. England 0.44, 0.52 1
s. Sweden 0.5 to 3.0 2
Germany 0.5 3
Denmark 0.2 . 1.0 4
Italy 0.6 5
Roofs Denmark 0.3 4
s. England 0.3 · 0.9 6
Walls s. England <0.04, <0.005 6
Denmark 0.01 4
Roads Denmark 0.1 4
Table 2. Washout ratios measured after Chernobyl
Location Washout ratio, w Reference
Oxfordshire, England 230 · 6600 1
Lund Sweden 3000 ± 2700 7
Thessaloniki, Greece 700 830 8
Cumbria, England 490, 540 10
Munich, Germany 230 . 950 11

- 248 -
Table 3. The time dependence of the resuspension factor (K) for 137cs
as expressed by the exponential function:
K (t) - A exp (-Bt) (t - time in months after mid-June 1986)
Initial Period of Location Deposit observation A B
(Bq m-2) (m- 1 x 10⁻⁹) (month- 1)
Klagenfurt, Austria 43700 1/87 - 12/89 3.6 0.049
Neuherberg, fRG 19700 7/86 - 12/88 7.4 0.090
Bregenz, Austria 13200 1/87 - 8/89 5.3 0.061
Ispra, Italy 11900 7/86 - 6/88 5.9 0.026
Nurmijarvi, Finland 7100 7/86 - 12/89 10.0 0.063
Wien, Austria 4000 1/87 - 8/89 12.8 0.053
'Warsaw, Poland 3200 7/86 10/89 15.0 0.062
Braunschweig, FRG 2700 7/86 12/88 28 0.124
Eskmeals, UK 2500 7/86 6/89 16.0 0.082
West Berlin, FRG 2300 7/86 12/88 35 0.099
Riso, Denmark 800 7/86 12/88 31 0.106
Bornholm, Denmark 620 7/86 12/88 31 0.082
Skibotn, Norway 195 7/86 12/88 35 0.060
Chilton, UK 52 7/86 6/89 49 0.037

100
Ch
ilto
n
---•
lro
mso
•-·-
+ G
,bra
lla
r o
--
---0
H
on
g
Ko
ng
1o
l ~ ~
--
-j
jl I
\
i \~
,lri
• _
ch
Ulo
n
lj Ii
'' .I
· ~
G1
bro
lto
r
11, I
/'-
, f i ,
./ '-
·. /h
om
,o
I ·
I \"
' "
~ 1,
I i
\ \
:;:-I
I ·
.:: I
~_i \\
E .
0·1
f H
;
.._j
I
~ if
\\~
'I ~
I I
Ho
ng
,
Ko
ng
0-
011-
11
\ \
-j
I o
-00
1lL
L!
I I
I I
I I
I I
I I
I I
I I
I I
21
28
S 12
19
26
2
9 16
23
30
7
1,
21
28
I. 11
18
!Ap
ril I
Mo
y
I J
un
~
-=1·:
Ju
ly
r·-A
ug
. I
AE
RE
R
12
46
2
FIG
.1a
C
ON
CE
NT
RA
TIO
NS
O
F 13
7 cs
IN
AIR
A
T F
OU
R
ST
AT
ION
S
IN
TH
E
NO
RT
HE
RN
H
EM
ISP
HE
RE
.
100 10
1-0
" • E .;
m E • 6 •. 1
L I
" j
0,0
1
0-00
1 I
I I
I I
I I
I I
I I
I I
I I
21
ZB
S
12
19
26
2 9
16
23
JO
7 14
21
!•••
Hi
May
1
9!6
l
Jun
e
l Ju
ly
I A
ER
E
R 1
24
62
FIG
.1b
W
EE
KL
Y
CO
NC
EN
TR
AT
ION
S
OF
137 c
s
IN
AIR
A
T
CH
ILT
ON
, M
AY
-J
UL
Y
19
86
,
N ... "'

0 IS)
N
10-1
K .,
.m 1a·s
10·9
- I'.)
• • •
•
• • •
• •
•
•
•
• I • • •
• •
• -O·OJ7t
49e
• •
•
• •
• •
• •
lQ6 ~-'-LgJ-J'--'-~12--'----"-,'3'--'-...L-6~-'-9-!--'-'-1~2-L..J.,...l..3-'--L-'-6...L..L...lg-'--'-c'12',--L...L-Jc---'----'----'6
1986 1987 1988 1989 Date
CHILTON ' 37 Cs RESUSPENSION FACTOR (m·11
1a·s L.•
·I K,m
109
• ........ . •
•
~1.4io.oso,
• • . . . ;-,.... . •
• • •
" • •
10'0 L-.1.J...l-JL._L..L.~-'-L.!.-'--L-'--'--'--'-'-.L..l-'-.l-J'--L...L.L.L-'-.LJ 6 9 12 3 6 9 12 3 6 9 12
1986 1987 1988 Date
NEUHERBERG, 137Cs RESUSPENSION FACTOR (m-1
)
Fig. 2, Examples of data for resuspension of 137cs from Chernobyl

-
< :; ::::. :; .... -----..., .... --rt> ., rt>
"' = ..:!; -rt> ::::.. --"' = ., ---· -= ~
> --., -· -' -= --rt> --: ce ~
--•.. -r. -c ., = = --· --' -= --('t
.... --.... --('t ~ -----= -----('t
-= c CJ; -· .... ('t ::::..
0 re -..... --rJJ .... -· c --> --., -· -i:....
= --('t ....... -: ce
~C's
i:::: -----I N
..... 0 =
-= --=
-= ----0
- 251 -
Resuspension factor, mid June 1986, (10-9 m·l)
... {
,' .·· .· /
/ 0
.........
.. ····· ..
~ .. v ......
...... .. ··· .. ·· ,
/
..···· 0
0 o.·
/o
0
0

- 252 -
Resuspension Factors
Resusoension Factor ( 1 /m) 0.001 f
0.0001 f1 ---------
1 E-06 ;r, -o:::::--------1E-07 f ·----------------------.••
1E-08 f
1 E-09 f
··t~~:~~-:::~::~:::~~~---·.~-9--s---.c!,,..--
1E-10 f ·-: -----------------------
NRPB R-75
Anspaugh
WASH 1535
WASH 1400
Gerland
European dote
1E-11 -~~~~'----~~~~L--~~~~J.....~~~~"'-~~~~ 10 100 1,000 10,000 100,000
Time (days)
Fig,4, Empirical descriptions for the resuspension factor, used to predict air concentrations, showing the range occupied by the exponential functions fitted to European post-Chernobyl data.
Models:
USAEC (1974) K = 10-5 exp(-0.0139t) + 10-9 m-1
USAEC (1975) K = 10-5 exp(-0.00185t) + 10-9 m-1
Anspaugh (1975) K = 10-4 exp(-0.15vt) + 10-9 m-1
Linsley (1978) K = 10-6 exp(-0.0lt) + 10-9 m-1
Garland (1982) K = 1.2 x 10⁻⁶ / t

/
~·
/ /
(\J
J • E • '-- • cr
• aJ /
/
/
1000 --1 • • • • • r--aJ m / ..... / • :,..
...--, 1: 1 :::,
/ • J / • • 0 ... .µ
• •• lD / (D
m • • • ..... 100 • M .µ
• "' U) • N :::, • Dl • • • .. :::, <( /
1: 100 .µ .. . ·rl U)
0 • 0. w 0 I •
• 10 -1---- -- l . --1 ·· - ···r ··· --T- · r ··· ··, · · . ( I I T .. ·1 ... - ·1 . I r·
100 1000 10000
Oepos it January to July · 1986 (Chernobyl l Bq/1112
Fig. 5. Deposit during August 1986 to July 1987 plotted against initial deposit from Chernobyl.

- 254 -

- 255 -
Characteristics of Primary and Secondary
Caesium-Radionuclide Contamination of the
Countryside Following the Chernobyl NPP Accident
E.D. STUKIN
Institute of Applied Geophysics of the State Committee for Hydrometeorology, USSR

- 256 -
The accident at the Chernobyl NPP was the second serious accident involving a nuclear reactor (the first being at Windscale) and led to a wide area being contaminated with a large number of different radionucl ides, including some elements with a high melting point.
From May 1986 onwards a team of researchers from the Soviet Goskomgidromet* and the Soviet Mingee** carried out extensive studies around the Chernobyl NPP using aerial gamma and aerial gammaspectrometric survey methods: these covered a 5-km zone around the Chernobyl NPP (78.5 km2), a 60-km zone around the Chernobyl NPP (11 500 km2) and five administrative regions bordering the accident zone Cover 350 x 103 km2). It was possible - via Integration - to determine from these studies the absolute and relative contributions received by each zone from the total caeslum-137 release Into the atmosphere from the reactor. Comparison of a map plotting actual contamination of the countryside with estimates based on various mathematical models allows us to evaluate any shortcomings In the individual components of the models.
In order to obtain a quantitative assessment of possible redistribution of the original radioactive deposition, a recording network (with a radius of 60 km) was set up covering an area of 11 500 1<m2 (geometrically centred on the fourth unit at the Chernobyl NPP). The network consists of over 400 recording points located at distances ranging from 1 to 60 km (36 radii, up to 19 points per radius). From 1987 to 1989 five series of soil samples were taken at nodal points in the network and analysed to establish their caesium-137 content. on two occasions (spring and autumn 1989) gauze screens were set up at various points throughout the network; after one month's exposure these screens were analysed for caesium-137 content.
Comparing the degree of caeslum-137 primary contamination with the degree of resuspension for this radlonucl ide we were able to make quantitative assessments and predict wlndborne migration of primary contamination. The paper sets out the differences In regional contamination at micro-, meso- and macro-scale levels.
* State Committee for Hydrometeorology
** Ministry for Geology

Since May institutes "Radiation working at NPP.
- 257 -
1986 a large group of scientists from various Soviet and services, cooperating under a single programme entitled monitoring of the Chernoby I NPP 60-km zone", has been
the town of Chernobyl In the 30-km zone around the Chernobyl
The programme comprises the fol lowing main sections:
1. Radiation monitoring of the countryside using remote methods of aerial gamma-spectrometry.
2. Radiation monitoring of the countryside by taking and analysing soi I samples from permanent and ad-hoc calibration networks.
3. Radiation monitoring of plutonium and strontium-90 radionuclide contamination of the countryside.
4. Radiation monitoring of fallout of radionucl Ides onto screens erected In the calibration network (area covered• 11.5 thousand km2) .
5. Radiation monitoring of "hot" particles deposited on the countryside after the Chernobyl accident and of fallout currently sett I ing on screens as a result of wind resuspension of dust.
6. Radiation monitoring of contamination In populated areas, In both the 30-km zone and adjacent territories.
7. Initial evaluation of the impact of the accidental releases on people and the environment by a calculation of integrated indicators.
This paper covers some of the above.
The basic aims and tasks Involved In monitoring radiation in the 60-km zone are as fol lows:
1 . Collection, processing, information on radioactive by the accident.
rapid present at ion and storage of contamination of the near zone affected
2. Checking the certainty of the Information obtained.
3. Devising ways of increasing the effectiveness both of the monitoring methods themselves and of data presentation.
4. Initial scientific Interpretation and systematization of the unique material obtained.

- 258 -
MAPPING ANO DRAWING UP AN INVENTORY OF RADIONUCLIDE CONTAMINATION OF THE COUNTRYSIDE AND POPULATED AREAS USING THE MAKFAR-2 AERIAL GAMMA-SPECTROMETRIC SYSTEM
Since the Chernobyl accident many maps have been produced showing the different radiation contamination conditions, Including for individual radionucl ides. As a rule, such •radionuclide" maps, covering vast areas, were drawn up on the basis of the analysis of soi I samples collected mainly in populated areas. Such samples were analysed for caeslum-137, strontlum-90 and total plutonium radlonucl Ides. Although these maps were fully adequate for the operational tasks in the Initial period following the accident, they do have a number of deficiencies.
First of all, a map drawn up as a result of sample analysis wi II always contain a degree of inaccuracy due to the smal I area represented by any given sample, and "Chernobyl" fallout is no exception here: after "envelope-type" collection of samples on an area of just 100 m2, the readings from five samples sometimes differed by 3 to 10 times. But apart from such micro-scale differences In "Chernobyl" fallout, mesosca I e d I ff erences a I so occur red, there being as many as 10 environmental contamination gradients over a single lei lometre. Such differences could lead to fairly large patches of contamination being overlooked when drawing up maps, and make information on the shape of such patches and their internal structure highly uncertain.
An alternative to producing maps from analysis of samples is automated aerial gamma-spectrometric surveying of the ground coupled with automat I c product ion of maps by computer. Th is method Is based on installing a gamma-spectrometer, with a wide-range detector, on a helicopter (aeroplane) to survey a given area at a constant height along a predetermined set of fl lght paths, after which the information recorded on magnet le media is loaded into a computer, which produces maps (using a specific program) showing the ground contamination levels for any given radlonucl ide which is a gamma-emitter and whose gamma peak shows up on the gamma spectrum at flight height.
In the aerial gamma-spectrometric surveys undertaken after the Chernobyl accident we used various gamma-spectrometric systems of bothSoviet and foreign origin. Here we shal I look at the results of the aerial gamma-spectrometric research carried out by a large group of scientists from the "Aerogeology" division of the Soviet Ministry for Geology and from the Chernobyl laboratory of the Institute of Applied Geophysics of the Soviet State Committee for Hydrometeorology, who used the "Makfar-2" aerial gamma-spectrometric system, consisting of:
an on-board gamma-spectrometer with a system of detectors and primary Information storage;
an on-board navigation system locked In to the local area;
a facility for In-situ Information processing;
a ground-based computer for processing the data and producing the maps.
The gamma-radiation detectors used consist of Nal(TI) crystals produced by composite methods in the form of prisms 10x10x40 cm3 and 5x10x25 cm3 In size, have minimum and maximum overal I volumes of 1.25 I and 48 I respectively, and a resolving power of 9.8% along the caesium-137 0.66 MeV line.

- 259 -
The on-board navigation facility consists of three main units:
A) a Doppler antenna for computing the fl lght speed and angle of drift of the aircraft;
B) a gyroscopic direction-finding system providing information on the aircraft's spatial orientation (course, bank, pitch);
C) an on-board navigational computer using data received from the two above-mentioned instal lat Ions to plot the route covered using a geographical or quadrate system of coordinates.
Thanks to the above, the aircraft's current spatial coordinates can be calculated to within 35-45 m.
The "Makfar-2" aer lal gamma-spectrometer Is used to make surveys on scales of 1:10 ooo, 1:50 ooo and 1:300 000 (i.e. flights spaced out every 100 m, 500 m and 3 km). The gamma-radiation spectra in the 0.38 -3.0 MeV range are recorded in steps of 10 keV on two channels simultaneously, using detectors with crystal volumes of 16 I and 1.25 I respectively. For further Investigation of areas where caesium-137 surface contamination exceeds 15 Cl/km2 we use the information recorded by the latter channel, whereas that recorded by the former channel is used for areas below 15 Ci/km2. This means we can a) keep analogue-code converter "downtime" to a minimum In Intensive gamma fields, thus al lowing us to carry out quantitative measurements at high dose-rate levels (above 0.5-0.7 mR/h), and b) accurately measure areas where caesium-137 surface contamination Is below 5 Ci/km2.
The whole apparatus is Installed on the aircraft, the survey height is between 140 and 160 m, the speed depends on the desired scale, varying from 70-110 km/h (scales 1:10 000 and 1:50 000) to 170-180 km/h (scale 1:300 000), and the measurement cycle is one second.
To convert the counting-rate unit (pulses/sec.) recorded by the "Makfar-2" Into dose-rate units (mR/h) and surface contamination levels (Ci/km2), we use readings from flights over calibration sites specially set up for this purpose at the end of 1987/beginning of 1988 (Table 1).
Four main criteria dictated our selection of sites: (1) mean contamination intensities on the various sites had to differ considerably from one site to another; (2) the sites had to contain areas with radionucl ides of slightly fractionated composition and with clearly pronounced "caesium" contamination; (3) most of the sites had to have I and scape features wh I ch c I ear I y d I ffered from one a not her (forest, arable land, meadow, water meadow, etc.); (4) the radionuclide contamination at each given site had to be evenly spread (as far as POSS i b le).
As Table 1 shows, despite the considerable time spent on choosing sites, it was not always possible to meet the last selection requirement. Therefore, aerial gamma-spectrometric surveys (scale 1:25 000) of al I the sites are carried out each year to cal lbrate the gamma-spectrometer prior to starting (and also during) the work.
To check map accuracy we always compare the readings obtained with the findings for samples collected In situ throughout the survey area.

Tab
le
I:
DA
TA
FRO
M
CA
LIB
RA
TIO
N
SIT
ES
U
SED
TO
C
AL
IBR
AT
E
THE
'MA
KF
AR
-2'
SYST
EM
I· I
Caesi
um
-13
7
Sit
e
rad
ion
ucli
de
1! S
ite
I <
Cil
km
2 l
co
nta
min
ati
on
ra
tio
s
Are
a II
ind
ex
k
m'
/I m
in.
mea
n
max
. C
s-1
37
/Ru
-!0
5
Cs-
13
'1/C
e-1
44
IJ l
4.5
9
.4
11 4
4
57
3
. I
-8
.5
3 .
I -
7.0
Ii II
l I
5.2
0
.4
2.5
5
.4
1.5
-
2.0
0
.86
-
1.0
.,
I '
I 6
. I
I 4
5 3
. 3
I 4
0.
7 -
1.6
0
.37
-
0.6
3
I I
5 ()
4
.0
7.
I 1
0.0
0
.19
-
0.6
6
0.2
-
0.3
1
I I
I 6
Io
'(.
9 1
4.
6 22
0
.45
-
0.9
2
0.2
6
-0
.33
II Ii
7 I
2 I
4.0
7
.3
II.
I 0
.67
-
0.7
4
0.3
3
I' ()
10
I
5 34
47
2
-2
. 'f
I I
. 2
-2
.0
\ I
l O
7
I 2
44
83
3
-3
. I
2.5
-
3.4
I' 0
.51
I
62
14
8
20
8
3.8
2
.6
11 I
I I
22
2
2.7
1
.3
II IT
I
38
3
II 21
' I
IO I
3
33
7
42
2
.9
2.0
4
I I I
"' "' 0

- 261 -
Measurement accuracy (repeatabi I lty of results) was assessed by repeating flights (overlapping sections of 150 km). The resultant margin of error for the survey was± 6.3% at a mean dose rate of 0.065 mR/h and a mean caesium-137 concentration of 7 Cl/km2.
Due to practical economic considerations, the 15 Ci/km2 and 40 Ci/km2 lsol Ines are the main points of Interest on al I the maps drawn up by us. In 1986 and 1987 5 Ci/km2 was taken as the upper I imit for carrying out farming and tending private holdings without decontamination being compulsory. The 15 Ci/km2 isol ine is the upper I imit for areas where people are al lowed to stay on without there being a need to bring in produce from outside the region. Therefore, it Is essential that this lsol ine Is defined precisely, not only so that important national economic decisions can be taken, but also to ensure that people can continue to live In safety In populated areas adjacent to contaminated patches with levels above 15 Ci/km2.
Fig. 1 shows a typical result from aerial gamma-spectrometric surveying of a large populated area and its environs, with distances of 100 m {sea le 1: 10 000) and 250 m {sea le 1 :25 000) between the he I icopter flight paths. As we can see, the town of Chernobyl, now unfortunately notorious throughout the world, I ies In a zone where caesium-137 contamination is generally over 15 Ci/km2 (but under 40 Ci/km2). It should be noted for clarity's sake that the methodology Involved in aerial gamma-spectrometric surveys of populated areas has not yet been fully perfected, although the results obtained now tally quite wel I with the readings from in-situ sampl Ing.
As is known, the reactor ejected considerable amounts of radioact Ive products for more than 10 days. According to eye-witness accounts, the release initially took the form of an explosion, after which - as the fire developed and the temperatures at the source changed - it assumed the form of a jet dispersed by the wind. As this Jet was blown in different directions the radionucl Ide composition within it changed, since the changes in the temperature and redox state of the source affected the molecular composition of the release and, consequently, its radionuclide composition. We now know that during the crucial period the release was rich in radionuclldes of caesium-137,134 and lodlne-131, and in order to determine which sections of the overall radioactive trail were rich In caesium-137, we used a computer to calculate the fields of concentration of the caesium-137/cerium-144 fractionation coefficient, using the formula
and
J nt ( c; 1?,l I r; ., •• \:
1~~ ( A1~"1 / ,l\ 1~~ )T
Is the experimentally determined ratio of caesium-137 radioactive contamination {"volatile" component) to cerium-144 ("non-volatile" component), related to the time of the accident,
Is the rat lo of the tot a I caesium-137 to cerium-144 stored by the time the accident occurred.
activities of in the reactor

- 262 -
It fol lows from this formula that there should be a I Ink between a) the surveyed sites where and b) the processes involved in the "explosive" ejection of the slightly fractionated cocktai I of radionucl ides from the reactor, plus their subsequent additional removal during ventilation of the active zone when water was used to extinguish the fire.
Using the "Makfar-2" aerial gamma-spectrometer (supported by a powerful ground-based computer) meant we cou Id not on I y produce maps showing contamination levels broken down Into the var lous radlonucl Ides, but also obtain schematic maps by combining the readings In various ways. This was how we drew up the cartogram showing the distribution, over the survey area, of the fractionation coefficient worked out using the above formula.
Fig. 2 contains part of the map (excluding the 30-km zone) showing the caesium-137 contamination level. The map was obtained on the scale of 1:200 000, whereas the fragment shown Is on the scale of 1:500 ooo. It clearly shows six large patches containing significant amounts of caesium-137 in the soi I, including what is known as the "western" trai I (between the populated areas of Tolsty Les and Vllcha).
For the purposes of compar Ison with Fig. 3, Fig. 4 shows (with an unimportant change in scale for technical reasons) the -cartogram obtained from having the computer combine the caesium-137 and cerium-144 contamination levels. This shows clearly that the "western" and "southern" trai Is were caused by releases containing a slightly fractionated mix of radionucl ides. It is also reasonably clear that the south-western and north-western patches are places where a large amount of caesium-137 fel I during the second fallout phase, with some of this fallout being deposited in the northern sector as wel I.

- 263 -
Fig.I: CAES!lM-131 CO~TAMINATION IN THE l'OW\ O~ CHERNOBYL AND ENVIRONS SU!lVEY SCALE I : 25 000
~ ~ ~
in 1-4 • in
~ ~ 0 in v
~ D·. ' . . : .
: : ~

Fi o. 2
SURVEY
,, .. -- .. -'-i ' ' ' ' ,,.,,,. r
'Q __ ...... \ ........ \ ·,
l ',,
264
PART OF ~AP SHO~JNG EXCLUDING
SCALE 200 000
CAES[l:M-137 30-km ZONE:
MAP SCALE
..... : :·:. ·~
CO~TAMI~A"flON
500 000
,, .. , ..
:-~·
·.,
.•. ~ ... ·. _!
.. { < \. '·, .....
'·

fig . .l 265 STHlBUllO\ 'HOWl~G Ul. ZONE RT OF CARlOGHA~CL~UING THE 30-km PA CJENT. EX COEFFI
SUHVfY SCALE 200 000
OF THE
' ' , __
4
' / .;
;,
' .. . I . ' '~

- 266 -
Aerial gamma-spectrometric surveying was an Important phase In studying the consequences of the Chernoby I ace i dent. It provided us with rapid Information on the radioactive contamination over vast areas, by al lowing us In the early stages to trace and pinpoint al I the large "caesium patches" with severe contamination (above 5 Cl/km2); then to plot In detal I their shape and internal structure; to determine the areas of low contamination where residence and farming could continue; to pinpoint the populated areas with complex radiation conditions (situated on sites with sharply varying contamination levels) requiring examination of each Individual farm or holding; to target areas for landscape and geochemical, radloblologlcal and geophysical scientific studies; and to harness the survey material In determining the radloecological characteristics of the areas studied.
Fig. 4 Is a map obtained In 1987 using the "Makfar-2" survey system on flight paths spaced out every 3 km over an area larger than 105 km2. It reveals the uneven spatial distribution of the contamination In both the near and distant zones affected by the Chernobyl accident. Thus, for example, the Chernlgov oblast (region) of the Ukrainian SSR was In a healthier state than the Gome I and Mogi lev oblasts of the Byelorusslan SSR and the Bryansk oblast of the RSFSR.
It should be stressed that we never use the results of the aerial gamma-spectrometric survey on their own without comparing them with insitu sampling findings. Table 2 shows (In concise form) the results of comparing the readings from aerial-gamma surveys of the Gamel and Mogi lev ob lasts with In-situ sampl Ing data from a number of sites in the area. It sets out the differences between the In-situ and aerial data.
By making such comparisons we can draw up maps Integrating both types of data, an example of which Is the caeslum-137 contamination map for the 60-km Chernobyl NPP zone shown In Fig. 5.

i- ) Q . 4 :
.. \;-: .. -
... .r
- 267 -
CAESl0M-i37 CONTAMl\ATJOI\' WHEr<E CO\TAMl~ATION
LEVEL JS HIGHER THAN 15 Ci/km'
.... :;;. ..... ·~ ......
. . . . . . ·_· .. -
,· ..
c.-. · c lo.tr 11;,.. oltl ,
tiev
t::J < 5 Cilkm' 1c:·,,·:'.I 5 • 1 5 r i ; km 2
tl:\t,1e 40·100 Ci/km'
mr:l'·.{1 1 5 • 4 o c ii k m '
- > 100 Cilkm'

Tab
le
2:
CO
MP
AR
ISO
N
OF
DA
TA
BR
YA
NS
K-M
OG
ILE
V
OB
LA
ST
JU
LY
JQ
89
11 C
s-1
37
Ii in
-sit
u
I I
5 8
<l I
I 9 rn
I 5
3
60
'
52
5
8
63
7
8
I 3
3
' I 1
9
25
I 3
8
26
4
3
28
4
0
I 3
5
I 6
1
6 =
c
IO
Ci/
km
•
(Ci/
km
•)
aeria
l D
iffe
ren
ce
20
-
5 1
00
-
I I
90
+
29
4
8
-IO
5
0
+3
60
0
70
-
I 8
70
-1
2
80
-
!'I
70
+
8
45
-
I 2
27
-8
3
2
-'I
40
-2
4
0
-14
4
5
-2
36
-8
4
5
-5
45
-
IO
72
-
I I
rt=
t 2
4.5
%
w
here
m
ean
=
48
.65
C
i/k
m•
I I I
N "' 00

- 269 -
This figure is based on data col Jected up to January 1990, including:
1) the results from aerial gamma-spectrometric surveys of various parts of the 60-km zone on the scales 1 :200 000, 1 :100 000, 1:50 ooo and 1:25 000;
2) information from the radiation monitoring network In the 60-km zone (results of collecting samples from the calibration network), and data pertaining to samples collected in-situ in populated areas.
Thus, to produce the map we used two types of information obtained by different methods, Which Is extremely Important in ensuring that the maps give an objective picture, since each type of information verifies and supplements the other.
The map shows that the worst and most complex caeslum-137 contamination occurring In the near zone after the accident Is to the west and north of the Chernobyl NPP. The map clearly shows the narrow western trai I from the Chernobyl NPP to VI Jcha, the northern trai Is forming the contaminated sector of Chernobyl NPP-Narovlya-Khoyniki-Bragin, and -ttie south-western tral I from the Chernobyl NPP to Polesskoye. Contamination levels inside these trai Is exceed 100 Ci/km2, both In the immediate vicinity of the Chernobyl NPP and in places much further afield.
The southern trai I (Chernobyl NPP-Chernobyl) is also clearly visible on the map, but it quickly peters out; outside the 30-km zone levels exceed 5 Ci/km2 at isolated points only.
The eastern trail (Chernobyl NPP-Nedanchichl) is not clearly pronounced outside the 30-km zone, and in the Slavutich zone occurs in the form of isolated patches only.
Paradoxically, the south-western and eastern parts of the 60-km zone suffered I ittle from the accident; caeslum-137 levels there do not exceed 1 Ci/km2.
The figures on which this map is based are given In Table 3.

- 270 -
F10.5: CAESJU~-!37 CHERNOBYL NPP 60-km ZONE 1 Cilkm')
•
IO O IO 20 KM IS C:, /,. .. ... ,"f

Tab
le
3:
UA
TA
SER
VIN
G
AS
BA
SIS
FO
R
MAP
SH
OW
ING
C
AE
SIU
M-1
37
CO
NTA
MIN
ATI
ON
IN
TH
E C
HER
NO
BY
L N
PP
60
-km
ZO
NE
I A
rea
Am
ount
I L
ev
els
C
ii k
m'
km'
%
Ci
%
r u
nd
er
I 2
44
5
22
1
96
0
1
I -
5 3
80
5
34
11
40
0
2
5 -
I 5
15
85
14
1
59
00
5
I 5
-4
0
15
05
I
3 4
06
00
1
2
40
-
JOO
1
28
0
I I
89
60
0
28
ov
er
10
0
66
0
6 1
65
00
0
51
To
tal
11
30
0
10
0
32
45
00
1
00
"' ..., ....

- 272 -
11 DISTRIBUTION OF RADIONUCLIDES IN THE VERTICAL SOIL PROFILE AT THE CALIBRATION SITES
The purpose of having calibration sites In the Chernobyl NPP accident area was to lntercal lbrate the various methods of remote gammaspectrometry under actual conditions, and to determine the dynamics of vertical migration of radlonucl ides In various landscape and geochemical contexts. Such geocomplex-related aspects dictated the choice of sites representing the main zones of the Polesye (Pripyat Marshes), taking into account landscape uniformity at any one site, the presence (absence) of farming activity, the size of the site and the degree of uniformity of radionuclide contamination and its isotopic composition. Our calibration sites are located on floodplains and terraces above them Camel iorated and natural), in watersheds under ploughing or used for ley, and in swamps and forest tracts (coniferous, broad-leaved and mixed), such places having a broad spectrum of sol I types - from peaty-swampy to s I I ght I y podzo I i c forest and sandy soi Is with slight sod cover.
In the Polesye, soil formed mainly on sandy and sandy-loam substrates of morainal, fluvioglacial and alluvial origin, where the soil profile usually clearly separates (with the exception of individual superaqueous phases) into an upper section rich in organic matter and loamy constituents, and a lower section usually of mainly mono-mineral sli iceous composition. Given such a soi I profile structure we expect to see a sharp contrast in radionuclide vertical-migration conditions.
Depending on the specific nature of the soil formation processes, the upper horizons are able to delay - for a certain length of time - the penetration of radiocaesium into the aeration zone's deep horizons and its ingress into groundwater. The evaluation of the duration of the presence of radiocaeslum in the humic horizon (which depends on local landscape and geochemical conditions) is based not only on annual insitu measurements of activity but also on the following experimentally determined parameters: forms of occurrence, degree of complexation with the individual fractions of organic matter, capacity of Quaternary sediments (of different origins and .mineral composition) to sorb caesium and strontium, the calculation of the cleansing coefficients of solutions of soil composed of different minerals and the role of the latter as geochemical barriers, and plotting the curves describing the sorptive and desorptive processes involved in redistribution of activity in typical landscape and geochemical conditions in the Chernobyl NPP's zone of influence, etc.
In order to do the above, samples of soll and substrates are regularly
The work for this section was carried out together with researchers at the Institute of Mineral Geochemistry and Physics, Ukrainian Academy of Sciences, under the direction of I. Sadoiko.

l'R
ble
4
: C
HA
RA
CT
ER
IST
ICS
OF
RA
DIO
NU
CL
IDE
U
IST
RIB
UT
!ON
IN
TH
E P
RO
FIL
E
OF
SO
ILS
IN
TH
E 3
0-k
m
ZON
E
f -
.I
Ii
So
il
co
ntr
ibu
t. !
Lo
cati
on
I
I M
inim
um
I ils
i te
Po
int
of
Yea
r o
f I a
ver
of
iso
top
e
of
cen
tre
I C
on
ten
t J av
er
of
I il
ind
ex
co
llecti
on
. m
easu
re-
Iso
too
e
wit
h
max
. to
to
tal
of
accu
m.
in
o-~
cm
ls
oi.
l w
her
e ·
II tv
oe
of
so
il
men
t co
nta
m.
co
nta
min
. ]a
ver
tota
l A
»9
0%
1
II 1 ev
e 1
. cm
l i %
cm
%
cm
I'
'I Ii
1 P
l.4
. T
.I
! 1
98
7
I C
s-1
37
I
O -
I I
! 0
.'19
I
98
.0
I O
-J
11 :1
lso
dd
v,
med
ium
1
98
9
Cs-
13
/ I
0 -
I I
0.8
3
9 7
. 7
I 0
-2
II p
od
zo
lic.
oeat
19
90
C
s· 1
3'/
I 0
-2
4 ·,
. 5
I . 6
6 9
5.4
I
0 -
3 Ii
co
ver)
1
98
7
Ce-
14
4
0 -
1 I
0.6
2
99
.0
I 0
-J
I' fl
oo
do
lain
1
98
9
Ce-
14
4
0 -
1 I
I 0
. 5
5 Q
7.
3 0
-1
" 1
99
0
Ce-
14
4
0 -
2 7.
7.
6 J
• 27
I
98
.7
I 11
0 -
l
" I
19
87
R
u-1
06
0
-I
I 0
. 6
l I
JOO
0
-2
1, II I
19
89
R
u-1
06
0
-I
I 0
. 5 7
JO
O
0 -
l 11
19'1
0 R
u-1
06
0
-2
I 1
4 . 4
I
. l I
I
Q<J
,6
0 -
2 II
19
89
S
r-9
0
0 -
2 I
l . 0
0
'19
.9
0 -
7,
' 1
99
0
Sr-
90
0
-2
I .
I 3
'19
.9-
0 -
2
I 2
Pl
. 5.
T.
3 !s
od
19
8 '/
Cs-
13
7
0 -
J 0
.67
9
9.0
I
0 -
I
ii (s
od
dv
. m
ediu
m
19
89
C
s-1
37
0
-l
I 0
.65
'1
8.2
0
-?,
po
dzo
lic.
cla
yev
1
99
0
Cs-
13
7
0 -
I 5
2.
l 0
.68
9
8.5
0
-2
Ii -s
an
dy
·9le
yev
l 1
98
7
Ce-
14
4
0 -
I 0
.59
I
100
0 -
l m
eado
w,
19
89
C
e-1
44
0
-l
0.7
0
97
.8
0 -
3
ll fl
oo
dp
lain
'
"' ..... w

Tab
le
4:
(co
nti
nu
ed
)
r;:===
====
====
====
====
====
:;===
====
==:;::
:====
====
==;:::
====
====
==;==
====
====
=:;==
====
====
=:;:==
====
====
=;::==
====
====
=~
So
il
co
ntr
ibu
t. !
Lo
cati
on
I
Min
imum
I
Sit
e
Po
int
of
Yea
r o
f !a
ver
of
iso
top
e
of
cen
tre
Co
nte
nt
!av
er
of
I in
dex
co
llecti
on
. m
easu
re-
Iso
top
e
wit
h
max
. to
to
tal
of
accu
m.
lin
0
-5
cm
so
il
wh
ere
tvp
e
of
so
il
men
t co
nta
m.
co
nta
min
. ll
av
er
tota
l A
>>90
%
lev
el,
cm
! %
cm
.
%
cm
J' 2
Pl5
..
T.3
1
98
9
Sr-
90
I
O
-I
0.6
3
'19
.9
I O
-
2 j
13
Pl.
5.
T.4
1
98
7
Cs-
13
7
O -
I I.I
I
96
.0
I o
-2
I (s
od
dv
. m
ediu
m
I 1
99
0
Cs-
13
7
O -
2 4
6.7
-7
.15
9
4.5
I
o -
4 II
· sJiq
htl
v
po
dzo
lic
19
87
C
e-1
44
I
II m
ead
ow
v-s
wam
py
, 1
99
0
Ce-
14
4
O -
2 2
3.5
1
.77
I
98
.4
o -
4 II
san
dy
) fl
oo
dp
lain
1
99
0
Ru
-10
6
O -
2 1
8.8
1
.57
I
100
I O
-3
IJ I'
wate
rlo
ed
m
eado
w
19
90
O
-l
2.0
4
I <1
5.8
1 O
-
6 I I II
4
II l'J,'
/,
T.3
(s
liq
htl
y
po
dzo
lic
san
dy
, sli
qh
t so
d
co
ver.
w
e))
d
ev
elo
ped
li
tter
of
l-2
cm
p
ine
fore
st
19
87
1
99
0
19
87
1
99
0
19
87
1
99
0
19
89
1
99
0
Cs-
13
7
Cs-
13
7
Ce-
14
4
Ce-
14
4
Ru
-10
6
Ru
-10
6
Sr-
90
S
r-9
0
0 -
l 0
-l
0 -
l 0
-l
0 -
l 0
-l
0 -
l l
-2
44
.8
27
.3
17
.6
0.6
1
0.9
1
0.5
6
0.8
2
0.5
5
l.2
3
I .3
0
l .
I 5
99
.0
99
.7
10
0
99
.5
10
0
98
.4
'I 8
. 3
<I 8
. I
0 -
Z
0 -
? 0
-I
0 -
2 0
-2
0 -
2 0
-5
0 -
5
I I I, I
I I 5
Pl.
4.
M-1
2 (s
an
d.
no
so
d
co
ver)
fl
oo
dp
lain
6 l'l.
1.
T.5
(s
an
d.
no
so
d
co
verl
, sa
nd
y
rid
qe
19
89
1
98
9
19
89
1
98
9
19
89
Cs-
13
7
Ce-
14
4
Ru
-10
6
Sr-
90
Sr-
90
0 -
I 0
-l
0 -
I 0
-I
0 -
l
I . 1
8 0
. 'I
l 0
.83
2
.30
3.
08
97
.6
97
.8
99
.2
9 3
. l
80
. I
0 -
5 0
-5
0 -
3 0
-7
0 -
I 3
"' '" ...

- 275 -
collected from the cal lbration sites and subjected to gammaspectrometric, radiochemical, physlco-chemical, mineralogical and other types of examination.
The findings obtained In the past three years at a number of calibration sites are given in Table 4 and Figs. 6-10. Table 4 shows a) how the centre of radionuclide accumulation shifts over time, b) the soi I layer with the highest radionucl Ide content and c) the amount (%)
of a given radlonucl Ide In the 0-5 cm layer for a number of typical soi I types.
Figs. 6-10 show how Increased moisture content affects radiocaesium penetration to a deeper level In Identical or slmi lar types of soi I. Fig. 6 shows the comparative penetration of radlostrontlum depending on the presence of organic substances In the soil, while Fig. 7 shows the redistribution of radlocaeslum In the vertical soil profile at a number of calibration sites.

R.,j U/l.
10-6
5
2
5
2
10-8
5
2
5
2
ro-10
)
~ f' -
•n ' ~ .. - )
-
I ~
-
-
-
- 276 -
,...
--..~ ......... . . ~
':--.......... l".t ....__
~
) /\ I '
.
~· '~ ...
5 15 20 , 25
fio.b: DISTRIBUTION OF RADIOSTRONTIUM IN THE VERTICAL PROFILE OF SOILS AT SITES 4 AND I
·PJ.4. T.I <l)<>at rover. hiqh)v humicl - P l . 1 . s l , sand . n ,-., sod co\" er I
cu

- 277 -
.
5 >---
- . 2 .
10-?
. t\.
>---
I·~
5
2 .... '\\ 10-8
\
(\ \.· :.............. - .. 5
"J J 1\r . 1 ~
. I I- i\• "' • 2
\.
5 >---- \ "' ~
2 >--
5 IO 15 20 CII
Fio.'f: IJlSTRil:ll'lJO~ OF RADIOCAESILM l\ THE VERTICAL PRO~lLE OF SOILS Al' SI1ES 4 AND
·Pl.4. T.l lsoddv. sliohtlv oodzolic. siltv-sandv soil with peat cover!
-Pl .l. ~-it 1pe~t,·-5~an10,-sanr1~· Sul~ katPr!oqaed)

. <
- 278 -
Fio.8: lJISTR!BlllON OF RADJOCAES!uM CO~TA~INAllO\ I~ THE VERTICAL PROFILE OF SOIL Al SIT~ 4
(Soddv. sliohlv podzolic. siltv-sandv soil with peat cover)
o> co cc H
I ' H
0 H
Ex3 Ci> H
I r:.J
::, :r --·-u
r
• 0
0 H
r r
I
I
' H I 0 ......
r
r
r
I
I
' H I 0 H
I I
(\,/ I 0 H
0 ::,; C\l ,:;
co - H
c.O H
<:!' H
(\,/ H
0 - H
Cl)
<D
<:!'
(\,/
0 (\,/
I 0 H
(\,/ ~ ::;;:
< :<: ....... ·-u ::;;: C)
...r • <O_._ c,__ .,
<:!'"
CV
0
Cl) H
0 Q) Q) H
<D ......
<:!' H
C\I H
0 H
CJ
<D
<:!'
(\,/
0 H
0 I 0 0
I 0
H H ......
::. c.:

- 279 -
Fio.9: UlSl'HIBLTION OF HAD!OC,ESIUM CO~TAMl~AT!O~ IN THE VEHTICAL PROFILE OF SOIL AT SITE,9
oJ
1 --0
I I
I ..... 0 -.....
I I
I
•
I I
-.:, . -
•
~
..
• ..... 6 .....
<O ..... '<l' .....
C\I ..... 0 ..... (X)
'° '<l'
C\J
0
0 .....
. co
._-
..., ~ ..--~~I.__~~~~~-+- C\I
- I (;--+----,-----.-~--~~ ...... ;
'";' ' ..... 0 ..... 0 0
~ .....
JQ87-JQ8Q
f v
,::;i ..... ~
<O ..... '<l'
O'> ..... ro O> ..... ~
0 Fl
co
'° '<!'
C\I
't O
.... .....

- 280 -
fiq.JQ: DISTRIBUTION OF HADIOCAES!lM COKTA~INATIO~ IN THE VERTICAL PROFILE Of SOIL AT SITE I
<arable land. ploughed in JQ87)
) )
a
c 0 0 H
I
I I .
O H -<"'1 0 I
<C ::. ...... 0 :,, H
' \j
I I
' ' 0 0 ......
. C) C" ...... u
...s=· <O ......... ...... " -:;
• '<:!' ......
C\I ......
• C> ......
• Cl.)
<:)
'<:!'
C\I
0
C" 0 v C\I .::c..._ Cl.) .. ...... """"t',
<O ......
'<:!' ......
... C\I ......
0 ......
... co
~ <D
'<:!'
C\/
0

- 281 -
Fiq.JJ: DISTRIBUTION OF RADIOCAESJU~ CONTA~INATION IN THE VERTICAL PROFILE OF SOIL AT SITE 7 1oine forestl
IN 1987-1990
0 O> O> H
I I
• 00
H
;:; C)
"SI' -H
C\I H
_o H
- co
- <0
-r~ 'st'
I C\I
. H C\I
I I 0 0 H H
~___,l ____ "i'
I ~--.L-1-------+C\I I
. H
I 0 H
C\) I 0 H
C' u

- 282 -
The distribution of 137cs contamination was determined on the various sites at points In the same or adjacent locations.
Site 9 (Fig. 9) - Soddy, slightly podzolic, sandy-loam soil, hay meadow; the pattern of distribution hardly changed over three years - the bu I k of the radionuclldes (up to 97%) Is found In the 0-5 cm layer, while In 1987 and 1989 the centre of accumulation was at a depth of 1.22 cm.
Site 1 (Fig. 10) - Soddy-podzollc, clayey-sandy soil, arable land, ploughed In 1987; the sampling points are located 5 m apart, but the overall contamination level varies considerably, while the pattern of radlocaeslum vertical distribution Is almost Identical, the contamination It causes amounting to hundredths of a Ci/km2 at a depth of 25-30 cm.
Site 4 (Fig. 8) - Soddy, slightly podzolic, silty-sandy soil, with thick peat cover; radiocaeslum penetrates further (although not very rapidly) In this type of soi I. Over four years the centre of accumulation shifted from a depth of 0.70 cm to 1.66 cm, wh I le the amount In the 0-5 cm layer decreased from 98 to 95.4%.
Site 7 (Fig. 11) - SI ightly and medium podzol lc, sandy soi I with thin sod cover and well-developed litter. The maximum amount of caesium (up to 99%) continues to be found In the I itter and the top few centimetres, but It is now penetrating (in hundredths of a Ci/km2) to a depth of 13-15 cm.

- 283 -
So far the research findings on vertical migration of Chernobyl accident radlonuclldes In the Chernobyl NPP region show the following:
1. The bulk of the radionuclldes scattered over the surface of the contaminated areas Is located In the 0-5 cm layer of soil (In the overwhelming majority of the local geocomplexes - by up to 90-98%).
2. In al I the types of sol I studied In the Chernobyl NPP 30-km zone the mlgratlonal capacity of radiostrontlum is greater than that of other radionuclides.
3. The bulk of radlostrontlum and radiocaeslum binds with organic compounds having a molecular mass of (2.8-4.0) x 10. and (0.6-3.0) x 10,. In grey-forest soddy-podzol ic sol I caesium-137 is mainly found in the form of highly Insoluble compounds (up to 60-80%), with exchangeable forms accounting for 10-15%, those sorbed onto ferrous and aluminium hydroxide for 20-30%, and organic compounds 10-20%.
4. In most cases at the 30-km zone sites studied, 11-15% of the strontium-SO content is in water-soluble form, with 75-98% In the exchangeable form (60-65% In the near zone); this shows that practically all the strontium leaves the fuel matrix and other stable compounds, with the leaching processes occurring more quickly with increasing distance from the accident site.
5. Sandy soils (incorporatl'ng medium and large grains of sand) with no or only slight sod cover were the most macro-permeable in terms of radlostrontlum vertical migration (floodplain sands, dunes, sandy ridges, eskers, etc.).
6. In descending order of sorptive capacity (or the capacity to retain radionuclldes In the upper layer) the soils line up as follows: soddy-podzol ic, loamy, clayey - soddy-podzol lc, sandy-loam, with peat cover - meadow-bog, soddy-podzolic, sandy - sand without sod cover.
7. Radionuclides penetrate downwards more quickly In wetlands.
8. The forest sol Is displaying the greatest sorptive capacity soddy-podzo I i c and soddy-s I i ght I y podzo I i c types having developed litter (the litter containing 70-80% radlonucl ides).
were the a we 11-
of the
Downward migration of radionucl Ides in wet or marshy forest sol ls Is slml lar for non-1 lsted areas. Sol I density {porosity) plays a significant role In such downward penetration by radionuclides.
9. Over a three-year period the centre of radionuclide accumulation shifted downwards by no more than 0.5-1 cm on average as compared to 1987 (and by a I lttle more In sandy sol ls with no sod cover, i.e. 1.5 to 2.5 cm for strontium). It should be noted that, whereas In 1986 and 1987 radlocaeslum was found In several samples at depths of 10-15 cm In quant It les of tenths and hundredths of a percent of overall column content, and In quantities of up to 0.5-1% in the 3-4 cm layer (In soils with slight sod cover, porous peat-covered and sandy water-logged soils in quantities of up to 2-2.5%), by May 1990 the radlocaeslum content In these layers had increased by 1.5-3.0 times. Almost the same happens with strontium-90, except that in sandy soils with no sod cover It is found in

- 284 -
quantities of 2-5 x 10⁻⁹ Cl/kg at a depth of 40-41 cm and in quantities of 2-3 x 10⁻¹⁰ Cl/kg at a depth of 60-70 cm, while from the 3-5 cm to 30-40 cm levels Its activity gradually decreases from the order of 10-8 to 5 x 10⁻⁹ Ci/kg.
10. The radionuclide migration rate greatly depends on how the radioactive fallout particles convert over time, I.e. on changes In the ratios between the nuclldes' Ionic, exchangeable and fixed forms.
11. The main factors determining radionuclide mob II lty In the top layers of the soil cover are the quantity and composition of the finely dispersed fraction and the organic matter present (the latter facilitating sorptlon of the radlonuclldes and accelerating their vertical migration).
12. Vertical migration of the radlonuclldes, although not very significant, Is taking place, and study of subsoil geochemical barriers Is therefore vital now.

- 285 -
II I. "HOT" PARTICLES IN SECONDARY FALLOUT AFTER THE ACCIDENT
The prob I em of "hot" part I c I es (and here we refer on I y to the geophysical aspects involved) became evident in the very early days after the accident. Radiographs of leaves from trees some 100 km south of the Chernobyl NPP revealed many large black blotches standing out clearly against a very weak fog. Sometime later, in mid-and late May 1986, we discovered - during radionucl Ide analysis of soi I samples (collected using samplers with an area of some 150 cm2) - a rather unexpected phenomenon, viz. that sometimes samples collected on a flat and even I y sod-covered area produced resu I ts d I ffer Ing by as much as tenfold from one another. We had never come across this phenomenon when studying trails of radioactive fallout from nuclear blasts, apart from in the zone nearest to ground zero. Subsequent autoradiography of the soil samples showed that sometimes several dozen highly active "hot" particles accounted for over 90% of the activity In the entire sample.
The problem of "hot" partlclees was first broached and worked on In the late fifties/early sixties, when highly active particles were discovered and studied which differed from the overall sample by their unusual radionuclide composition, since they mainly contained isotopes of refractory elements (or refractory compounds of elements). Subsequent studies extended and deepened our knowledge of the chemical and radionuclide composition of "hot" particles, the distribution of total radioactivity and Individual radionuclides by particle size, and other characteristics and properties. General agreement was reached on what "hot" particles are exactly. In a fairly early piece of work based on an investigation of the relationship between particle size and radioactivity, Sisevsky showed that "hot" particles are not an exclusive group of particles but, In terms of size, essentially form part of the overall distribution of a radioactive aerosol.
The discovery of "hot" part I c ies In the ace I dent a I re I eases from Unit IV of the Chernobyl NPP revived the old arguments on al I aspects of this problem. This Is not surprising, given that "hot" particles can -if we take nuclear power engineering as a whole - occur in the nearsurface layer of the atmosphere In only two events: a) If a satellite fitted with a nuclear reactor fai Is to burn up completely in the Earth's atmosphere, and b) In the event of a serious reactor accident entai I Ing the eject ion of aerosols Into the atmosphere. The second of these is involved here, of course, it being the second serious reactor accident (after Windscale) to leave a significant trali of radioactive fallout on the ground. The fact that "hot" particles formed In reactor accidents had not been fully studied, led to a revival of the old debates.
Nowadays, an accident involving active zone meltdown and complete (or partial) breaching of the vessel Is classed as a serious reactor accident. In such incidents the quantity and radionuclide composition of the radioactivity released Into the atmosphere depends on such a large number of factors that they cannot as yet be physically or
ma thema tlca lly mode II ed to any sat I sf actory degree (even when us Ing highly powerful computers). The USA, Federal Republic of Germany, Japan and various other countries "armed" with nuclear power are carrying out intensive research Into the chemistry of serious accidents and evaluating the associated releases of radioactivity. But each a~cldent springs Its own surprises. For example, studies of the accidental releases from the USA's Three Mile Island nuclear power plant revealed

- 286 -
that much less (by several orders of magnitude) lodlne-131 and tellurium-132 was released than expected, while analysis of the Chernobyl releases shows that they contained highly significant amounts (also exceeding the computed expectations) of such low-volatl I ity substances as barium, strontium and cerium radionuclldes as compared to the amounts of the radlonuclldes of caesium, Iodine and tellurium released.
Model I Ing of serious accidents also provides Important (but not as yet extensive) Information on the nature of the aerosol particles formed in accidental releases, "hot• particles Included. Thus, for example, it has been established that Intense fuel burn-up facilitates the formation of the smallest particles by size and the greatest release of radioactivity, that radlonucl Ide fractionation Is related to fuel porosity, that the overal I mass of aerosols rises with Increasing temperature and scale of oxidation processes, and that much of the substances released In accidents Is transported In the form of aerosols ranging from 0.01 to 10 microns In size.
Since we do not wish to become Involved In, or continue, the controversy (against the backcloth of Sisevsky's findings) about what a "hot" particle is, people should decide for themselves what they understand by this designation for the highly active particles which show up clearly when exposed to an X-ray plate while the fog from the fine particles goes practically unnoticed.
In our view, the above-mentioned geophysical aspects of the "hot" particle problem embrace al I issues relating to their distribution Int he various parts of the environment (soi I, air, bed sediments, leaves and needles of trees, etc.), particle distribution by size (Insofar as this Is linked to fallout characteristics), radionuclide distribution by various particle types and, of course, secondary contamination of the atmosphere by "hot" particles due to wind resuspension of dust.
Aerosol contamination of the atmospheric air occurs over time In two stages, the first (a relatively short one) encompassing release of radioactivity from the reactor, transport of radioactive clouds In the atmosphere and sett I Ing of aerosols onto ground and water surfaces, whl le the second (which Is continuous) Involves secondary contamination of the atmosphere via wind resuspension of dust.
On the basis of this breakdown we also proceeded to collect samples of radioactive aerosols and the "hot" particles contained therein.
In order to obtain samples of such particles from the soil, we took the thin upper layer (less than 1 cm thick), and then carefully dried and Intermixed It prior to radiography, doing the same for samples of bed sediments taken from rivers and other water bodies.
To collect samples of atmospheric fallout deriving from resuspension of dust we used the calibration network mentioned earlier, cutting out rectangles (15 x 20 cm) from the centre of screens In order to study the hot particles.
Figs. 12 and 13 are radiograms of pieces of gauze cut out of screens; they show "hot" particles which were lifted Into the air by wind resuspension of dust and settled on the screens. Fig. 12 (screen 8 km from the Chernobyl NPP) shows four large (In terms of specific

- 287 -
fiq.12: AUTORADIOGRAPH OF Cc~TRAL SECTION OF A GANZE SCREEN EXPOSED FOR A MONTH (2.09.88 - 5.10.881 AT
A CALIBRATION POINT WITH A BEARING OF 250". 8 km FROM UNIT IV OF THE CHERNOBYL NPP
/
• • c
• • -1a e ··
I 3
• • ..
•
• 2

- 288 -
Pig.13: AUTORADlOGRAPH Of CENTRAL SECTION Of A GANZE SCREEN EXPOStD FOR A MONTH (9,09.88 - 10.10.88) AT
A CALlHRATJON POINT WITH A BEARING OF 20", 30 km PROM UNIT IV OF THE CHERNOBYL NPP
• •
\ -i
_·.·.'.':~ ,.:-· ... ,~~
. - •'". • •
, • •
' • ......

- 289 -
activity) particles and eight "medium-sized" particles represented by black blotches which are clearly smaller. Fig. 13 (further out from the Chernobyl NPP at 30 km) has only four particles, and these are mediumsized.
Autoradiography was the main method of pinpointing "hot" particles for subsequent removal from the samples collected.
Our Investigations Involved several hundred autoradlographs of various samples, mostly of soil, bed sediments and dust which had settled on the gauze screens.
The only main alternative to autoradiography Is selection of particles using a tightly collimated detector pointed at the surface under study, and which Is moved automatlcal ly or manually to scan the surface successively and continuously. In our experience (we used this back In the early sixties) this method Is very laborious and does not guarantee that researchers will pinpoint even all the highly active particles.
The autoradlography method we use al lows us to a) establish unequivocally the presence and number of "hot• particles on the surface of the sample studlad, bl classify them Initially by dewree of activity (by blotch size and Intensity), c) pick out Individual particles (If they are not In the conglomerate) from the whole sample for further gamma-spectrometric and radiochemical analysis, d) detect particles of fairly low-level activity by exposing the sample for a long time, and e) set up a documentation bank on "hot" particles.
Fol lowing autoradlography, al I parts of the exposed samples on which any significant dark blotches were detected were subjected to visual checking under a powerful microscope. It should be noted that during the who1,, time we worked with particles we very rarely saw any individua, "hot" particles; they were either fixed as "riders" on larger particles, or were bound up in the particle conglomerate, from which It was quite difficult to pick out the "hot" particle proper. We put this down to the fact that all the particles we collected are what one might call "secondary" particles, a term explained below.
Given the accident phenomena Involved here, It can be said that the aerosol component In the release must, of necessity, have Included the fol lowing two basic types of particle (by structure and composition):
Type 1 - dispersed substances stemming from the fuel elements and ejected Into the atmosphere, Including both radionucl Ides from the fuel as wel I as shattered and Induced radionucl Ides which had accumulated during the reactor's operational life, and
Type 2 - particles formed via the condensation on various germs (condensation nuclei) of substances which evaporated during the explosive and high-temperature processes.
The radlonucl Ide composition of Type-1 particles should typically be reasonably stable, whereas the composition of Type-2 particles greatly depends on the condensation nuclei. Obviously, combinations of (highly variegated) particles from these two types also exist, for example when the condensation nucleus of a Type-2 particle Is a dispersed substance, I.e. a Type-1 particle.

- 290 -
The phase Involving formation of primary particles was followed by a phase In which they changed their form and composition during atmospheric transport due to their interaction with non-radioactive atmospheric dust, a time when many of the primary particles formed conglomerates. The formation of particles with radioactive carriers (which we designated "secondary" particles) ended as the radioactive atmospheric dust fell onto the earth, water or anthropogenic surface or as It Interacted with vegetation, the particles deposited In this manner being richer In non-radioactive components.
We traced this process - from the primary particle through to the dust destined to be resuspended In the air by the wind - In order to back up the fol lowing two assumptions: a) the dispersive size of the "hot" particles appearing In the air In the course of wind transport should not differ from the dispersive size of the non-radioactive dust in each specific area, and b) when evaluating the medico-biological aspect of the "hot" particle hazard, we should not be guided by the size-related distribution of the primary "hot• particles, since this might lead to large errors In our evaluations.
Fig. 14 Is a photograph (taken under a microscope) of a typical conglomerate of radioact Ive and non-rad loact Ive part I c les (extracted from a dried sample of bed sediment taken from the cooling pond). On the particle about one millimetre In size we can see smaller fused "riders", which are also primary "hot" articles deposited near the accident site.
Fig. 15 shows the result of Interaction between fine radioactive dust and an "Item of vegetation". This secondary "hot" particle fell onto a screen In the summer of 1989 (bearing 250", 8 km from the str lcken unit).
Fig. 16 shows a "hot" particle of particular Interest since it represents a special class of "hot" particles In the "Chernobyl" releases. It, too, was taken from a screen in 1989 (bearing 250·, 8 km away). Structurally speaking, It Is a fragment of graphite ash, one of whose formation sources was the black Jet of ash ejected (mainly southwards and south-westwards) In the second half of 26 April 1986, as confirmed by precise eye-witness accounts. These particles crumble easily when touched lightly by a needle, and this Is clearly visible under the microscope.
After being checked visually and selectively photographed, all parts of the sample showing up on the autoradlographs as clearly Identified black blotches were cut out, tagged and then subjected to gammaspectrometric analysis.

- 291 -
Fiq.14: PHOTO <under microscope) OF A TYPICAL CONGLOMERATE OF HADJOACTIVE AND NON-RADIOACTIVE
PARTICLES <bed sediment from coolinq pondl

- 292 -
Fig.JS: FINE PARTICLES ATTACHED TO AN "ITEM OF VEGETATION"
cr'IIDIIIrro====:::i:'====J2====::r::3=:==i4MM •

.- 293 -
Fiq.16: 'HOT' PARTICLE COMPOSED OF GRAPHITE A5H: SETTLED IN 1989 ON SCREEN 8 km FROM THE CHERNOBYL NPP
1 0 1 L

- 294
So far we have subjected several hundred particles (or particle conglomerates) to radionucl Ide analysis using semiconductor gammaspectrometers. Without going Into too much detal I, we can divide al I the particles Into two types:
particles containing cerlum-144 and zlrconlum-95 with one or other collection of radlonuclldes;
particles In which these radlonuclldes are either completely absent or are present In hardly noticeable quantities only.
The fact that there are two groups Is quite logical, given that radioactivity was released from the stricken reactor In two phases. The release phase relating to the series of explosions (In the early hours of 26 April 1986) Involved the formation of aerosols with a radlonucl Ide composition slml lar to the non-fractionated type, reflecting the composition of the fuel and fission fragments prior to the accident. The phase of releases during the reactor fire was accompanied by high temperatures and, as already known, Involved large amounts of radlonucl Ides of caeslum-137, caeslum-134, lodlne-131 and other volatile products.
Table 5 gives the findings from radionuclide analysis of "hot" particles taken from fallout !anding on screens In spring 1989. As we can see, the "hot" particles greatly differed In their radionuclide composition and were found In fallout throughout the 60-km zone.
Some of the particles stand out on account of their being very rich In ruthenium-106 (as Table 5 shows). Fig. 17 shows the gamma spectrum of one such part lcle collected In the •red" forest (measured on 1 March 1989). The caesium-137 peak on the gamma spectrum of the overall soil sample collected at the same site is several times higher than the ruthenium-106 gamma peak, while in Fig. 17 it Is the other way around.
It Is interesting to compare the fractionation characteristics of the radionucl Ides In the "hot" particles In the manner the authors did earlier for samples of atmospheric aerosols and fallout from nuclear explosions. Figs. 18-20 give the results of just such an analysis for four pairs of radionuclides: the reference pair caeslum-137/cerium-144 and the pairs under scrutiny - zirconlum-95/cerium-144, ruthenium-106/cerium-144, and antimony-125/cerium-144.
The fractionation coefficients were calculated using the usual formulae. As Figs. 18-20 show, the correlatlonal dependencies of the fractionation coefficients studied are slmi lar to those In nuclear blasts: there Is hardly any fractionation of zlrconium-95 from cerlum-144, while the volatility of ruthenium-106 Is somewhat lower than that of caeslum-137, and that of antlmony-125 Is, In contrast, greater than that of caeslum-137.

Tab
le
5:
CO
NTE
NT
OF
RA
UlO
NU
CL
IDE
S IN
'H
OT
' PA
RT
lCJ.
ES
SET
TL
ING
ON
SC
REE
NS
IN
THE
CA
LIB
RA
TIO
N
NET
WO
RK
n !C
oo
rdin
ate
s o
f C
on
ten
t o
f ra
dio
nu
cli
des
in
'ho
t'
oart
icle
s !
Num
ber
orl
l
II p
lace at
wh
ich
in
re
lati
on
to
d
ate
o
f accid
en
t lo
art
!clc
s II
!scre
en
ere
cte
d
(Ba/p
rep
ara
tio
n)
1se
tt.1
na
Is i
te
on
cen
trell
I i
nd
ex
beari
ng
d
is tan
-lo
f sc
reen
! .!
deg
rees
ce
<km
l 1
06
1
25
1
34
I 3
7
I 4 4
I I
.
I 1
0
5.0
-
-0
.50
0
.53
-
I I
I 2
. 2
30
6
.0
--
0.2
9
0.4
2
-6
I 3
. 3
40
7
.0
--
0.7
0
1.6
-
I I
I 4
. 2
40
1
0
--
I . 8
2
.4
-I
5 5
. 4
0
l 4
. 5
--
7.2
I 3
-
6 I
b.
10
1
'/ .
5 -
-5
. I
I I
-R
'(
. 2
0
20
-
-0
.37
0
.96
-
3 I
B.
50
2
5
--
2.3
8
.5
-3
9.
20
3
0
--
6.9
I
5 -
7 1
0.
40
4
5
--
0.2
4
0.3
3
-l
I I
. 2
60
6
0
--
0.8
9
1.3
-
4
I 2.
31
0
5 -
-0
.99
2
.6
44
4 I
13
. 2
50
8
.3
--
3.3
6
.2
28
0
16
1
4 .
12
0
10
-
-3
.0
5.2
3
50
5
I I
5.
19
0
12
-
-3
. 3
8.9
4
30
6
11
6.
36
0
14
.5
--
I . 5
6
.2
12
0
7 I
I 7.
10
}
'(.
5 -
-3
.7
I 2
21
0
8 I I
s.
60
2
5
--
3.0
5
.4
27
0
2
ll 19.
20
0
37
.5
--
0.
51
0.5
4
46
2
20
. 2
70
5
2.5
-
-2
.7
7.6
2
40
I
I 21
.
25
0
60
-
-4
. 9
l I
10
0
I 5
I I 1
22
. 3
40
5
44
I. 0
2
.8
5.7
l
IO
6 II
I 23.
25
0
8.3
2
00
-
'l,O
21
2
70
0
16
2
4.
60
1
0
23
0
.59
0
. 9
6 4
.2
I 50
2
. 2
5.
34
0
1 2
. 5
12
0
2.6
I
. 3
2.
5 3
30
2
I 2
" .
I 3
20
2
0
l ()
-1
. 3
2.4
4
I 3
I 2
1.
I 6
0
25
2
6
-1
. 4
2.
5 2
00
7,
11 2
8.
2'10
3
0
10
0
-2
.3
3.9
2
20
4
Ii 29
. 2
0
3 7
. 5
21
0
3 . (
) 2
8
56
6
60
I
"' "' u,

- 296 -
fiq.17: GAMMA SPECTRUM OF A HOT PARTICLE RICH IN RUTHENIUM-106 'RED' FOREST. BEARING 210°, 1500 m FROM UNIT IV
OF THE CHERNOBYL NPP
--~~-"--~-~~~~~~~--, ,----------------l ' •
I I
I J
I I I I
I
t.i £~ -'1.J 90•-n~
£10~- nc.1
.,, '7'et-SJ ji
. 5?t-<tS -
,--
.: 1 -
L ______________ L __ ···---···-- ___ ... ___ ,, _______ J ·---~-) __ 0 0 0 In
0 0 0 ....
0 0 0 (")
0 0 0 C\J
0 0 0 -

- 297 -
fjq,J8: CORHELATIONAL DEPENDENCE OF THE FRACTIONATION COEFFICIENT 1,s ON THE FRACTIONATION
J1i.1.t
COEFF l CI ENT .r~1 'HOT' PARTICLES TAKEN FROM A~ SAMPLES OF SOIL. 1987-1988
10 •
•
• • •
1 • I I • • • • • • •
•
•
0,1 0, 'JI 0, I I.,·O IO 100
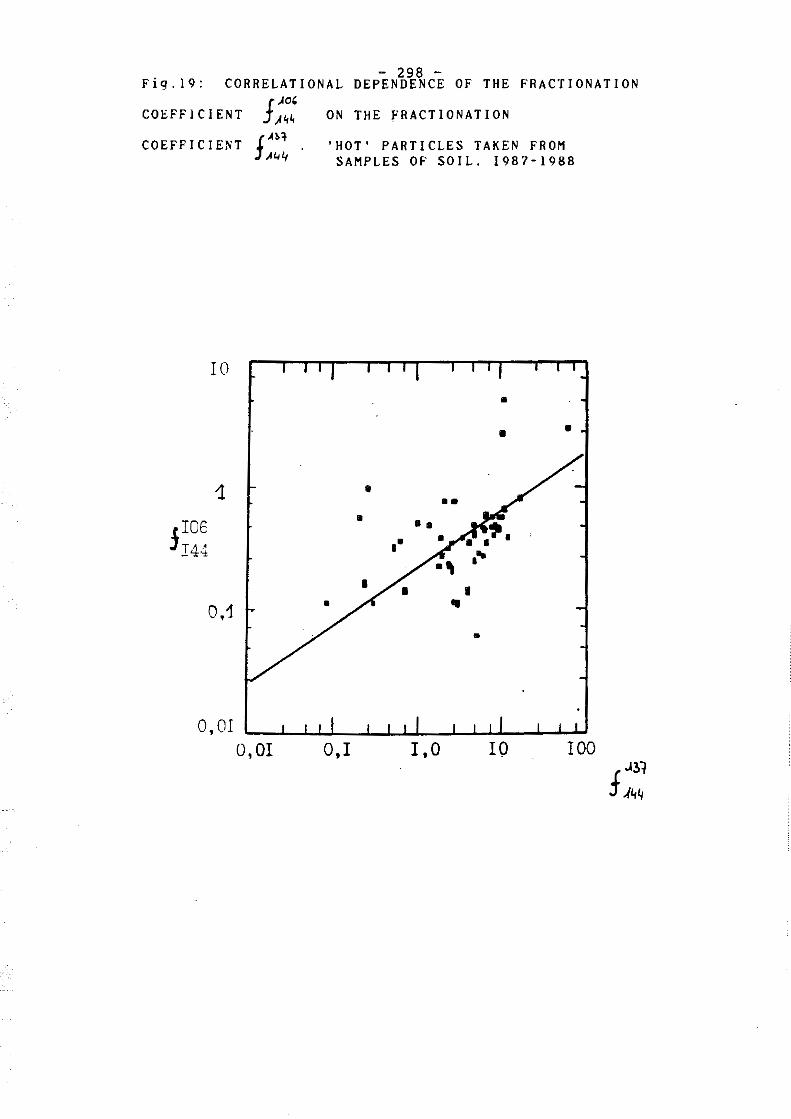
- 298 -Fig.19: CORRELATIONAL DEPENDENCE OF THE FRACTIONATION
COEFFICIENT
COEFFICIENT
1106 1 I44
IO
1
0,1
O,OI
f AH,
A44
0,01
ON THE FRACTIONATION
'HOT' PARTICLES TAKEN FROM SAMPLES OF SOIL. 1987-1988
•
• •
0,I I ,0 IO 100

- 299 -DEPENDENCE OF THE FRACTIONATION Fiq.20: CORRELATIONAL t.125
COEFFICIENT ].Ji.,~ ON THE FRACTIONATION
COEFFICIENT ()b'l J Al./4
IO
I
0, I I ,0
'HOT' PARTICLES TAKEN FROM SAMPLES OF SOIL. 1987-1988
IO

- 300 -
Although four years have elapsed since the Chernobyl NPP accident, our knowledge of the intensity of radiation, and the forms, structures and chemical composition of "hot" particles still leaves a lot to be desired. And we should not forget that each Individual "hot" particle contains a great deal of Information about the physico-chemical processes occurring at the time of the accident, in particular at the time any given particle was formed and ejected into the atmosphere.

- 301 -
Session IV
ENVIRONMENTAL CONTAMINATION AND TRANSFER
Part I

- 302 -

- 303 -
Deposition of Activity from the Windscale Accident
A.C. CHAMBERLAIN
l Fifth Road, Newbury, Berkshire, RG14 6DN, UK

- 304 -
ABSTRACT
The.deposition pattern was determined by measuring activity in grass and
soil, gamma dose rate near the ground and gamma dose at 150 m ( aerial survey). The deposited activity was mainly 132Te + 1321 and 1311, The
137csf1311 ratio in deposition was 0.02 1 compared with about 0.1 in air
filters, Relatively small activities of Sr and refractory fission
products were deposited.
The effective half life of 1311 in herbage was 4. 9 days, and in milk
4,7 days. Assuming a herbage consumption of 30 kg wet weight per day, the
transfer factor herbage/milk was Jx10-3 d 1-1.
A ban on milk consumption was enforced where the peak concentration of
13lI exceeded O .1 µ.9u Iii -2, corresponding approximately to the 1 µ.Ci m-2
isopleth of deposition.
In the area of maximum deposition, near Seascale, 137cs in milk reached
about 1500 Bq 1-1. outside the restricted area, concentrations of 137 Cs
in milk were of the same order as those due to weapons fallout.

- 305 -
1. Pattern of deposition
The deposition from the Windscale accident was described in a paper by Dunster et al to the 1958 Geneva conference(!) and in a series of published papers and reports, copies of which have been lodged with IAEA, It is not proposed to attempt to reproduce all this data in the present paper, but to bring out some points for comparison with the Kyshtym and Chernobyl accidents. After the accident, the first measurements of deposited activity were made with ionisation chambers mounted on vehicles, but the vehicles picked up activity from the roads, raising the background, and it was found better to use hand-held geological survey instruments, These were of the gamma scintillator type, calibrated in mRjhr against radium sources, but with an energy-dependent response, The gamma dose was due mainly to 132Te + 1321, 1311 and 137cs, In the period 4 to 20 days from the accident, the dose
from 1311 was dominant, and this enabled a simple conversion from recorded dose rate to deposited activity of 1311 to be calculated(3),
Beginning 8 days after the accident, an aerial survey of the district was done, with an aircraft flying at 150 m height ( 4) , By this time, the pattern of deposition had been established from ground measurements, but the aerial survey was useful in confirming it, Subsequently, the results of the gamma surveys and measurements of 1311 in grass and soil were correlated to establish the isopleths of deposition more accurately( 5). Emissions from Windscale lasted about 18 hours, from 1600 on 10th October to 1000 on 11th October 1957, at which time the fire was put out with water(2), On 10th October, the wind was light from the SW, but at 0100 on the 11th a weak cold front passed over, giving a change in wind direction to NW( 6). The activity emitted before the passage of the front was carried to the NE, then swept down to the SW. The release peaked about 0900 on the 11th, and gave a plume of deposition running SSE. At 100 km from Windscale, the half value width of this plume was 8 km(5), similar to the width of the Kyshtym plume at this distance Pl, The maximum dkeposition of 1311, 30 µCi/m2 (1,1xlo5 Bq/m2)
was in this plume at 7 km from Windscale,
2, Nuclides deposited With the gamma spectrometry available in 1957, the deposition of 137cs could not be assessed until the 1311 had decayed, A survey of 137cs in

- 306 -
soil, carried out in 1958 ( 8) showed a pattern of deposition similar to that of 1311, the 1311;137cs ratio (as at 10.10.57) being 50:1 (Table 1). This compares with 20:1 in the fuel and 11:1 on air filters(9,lO),
Despite the use of water to extinguish a graphite/uranium fire which had reached 1300°c, there was no explosion at Windscale, and very little dissemination of uranium or refractory fission products. The release of 90sr was less than 1% of that of 137cs, and the deposition of 90sr near Windscale could not be readily distinguished from that deposited locally in previous emissions of uranium oxide particles(11), or from distant weapon tests. 210po behaved similarly to 137cs in respect of fractional release from the fire zone and deposition to grassland (Table 1).
3. Retention on herbage During the month after accident, repeated samples of grass were taken from a field at Seascale, 4 km from Windscale, which was not being grazed by cattle, and these showed activity of 1311, on grass, per m2 of soil surface, diminishing with a 4.9 day half life( 12). The corresponding field loss half life is 13 days. The 1311;137 Cs ratio in the grass decayed with an apparent half life of 9.5 days, slightly longer than the radioactive half life of 1311. This implies that field loss of 137cs was slightly faster than that of 1311. Re-volatilization of 1311 from grass or soil was not observed, and there was no evidence of re-suspension of activity in dust. Most of west Cumberland is grassland, the climate is moist, and soil erosion is minimal
4. Velocity of deposition There was no measurement of air dosage in the area immediately downwind of Windscale. In Lancashire and Yorkshire, cellulose filters were operated by local authorisities for measuring smoke in the atmosphere. These were collected and analysed at Harwe11(10). Relative to the dosage deduced, the local deposition of 1311 gave a velocity of deposition of 4 mm/s( 5). The filters would not have trapped organic iodine vapour, but they were probably fairly efficient for inorganic iodine. The velocity of deposition of 137cs can be estimated to havge been about 0.7 mm/s, similar to values noted in Britain and Denmark for 137cs from Chernobyl.
5. Transfer of activity to milk

- 307 -
West CUinberland is a milk producing area, and, at the time of the accident, the cows were grazing the fields. It was decided to sequester IIUlk in areas where the 1311 activity exceeded 0.1 µCi/1 (3700 Bq/1) and the measures taken to do this were fully described in ref (1). At a farm in Seascale, where extensive measurements were made, the transfer factor grass/milk defined by
Transfer factor = 1311 per litre milk
1311 per kg fresh wt of grass
was 0.1(1,12). Assuming a daily consumption of 30 kg wet weight (allowing for some supplementary feed in autumn)
Fm = 1311 per litre milk = 3xio-3 d/l
Daily intake by cow
137cs in milk in the same area was not measured until 28th October, because of limited facilities for gamma spectrometry. By extrapolation, the peak activity was about 40 nCi/1 (1500 Bq/1). Measurements of l37cs in dried milk from several areas of England and South Wales showed transient peaks in OctoberjNovember 1957, compared with varying levels due to weapons testing( 13). There was no comparable increase in 90sr in milk, even at farms in the zone of maximum fallout(l).
6. References 1. Dunster, H.J., Howells, H. & Templeton, W.L. (1958). District surveys
following the Windscale incident, Octobr 1957. 2nd International Conf. on Peaceful Uses of Atomic Energy, Geneva, 18, 296-308.
2. Penney, W, (1957). Accident at Windscale No 1 Pile on 10th October 1957. cmnd 302. HMSO.
3. Chamberlain, A.C. ( 1958). Relations between measurements of deposited activity after the Windscale accident of October 1957. AERE, Harwell Report HPfR 2606. HMSO.
4, Williams, D., Cambray, R.S. & Maskell, s.c. (1958). An airborne radiometric survey of the Windscale area, October 19-22, 1957. AERE,
Harwell Report EL/R 2438. 5. Chamberlain, A.C. (1959). Deposition of iodine-131 in Northern
England in October 1957. Quart. J. Roy Meteor. soc. 85, 350-361.

- 308 -
6, Crabtree, J. ( 1958), The travel and diffusion of the radioactive
material emitted during the Windscale accident, Quart, J, Roy.
Meteor. Soc, 85, 362-370,
7. Nikipelov, B,V, et al (1989. Accident in the Southern Urals on 29
September 1957. IAEA translation INF CIRC/368,
8. Booker, D.V. (1962), Caesium-137 in soil in the Windscale area,
AERE, Harwell Report R 4020,
9, Stewart, N,G, & Crooks, R,N, (1958). Long range travel of the
radioactive cloud from the accident at Windscale, Nature, 182,
627-630.
10. Stewart, N.G., Crooks, R.N. & Fisher, E.M.R. (1961). Measurements of
the radioactivity of the cloud from the accident at Windscale: data
submitted to the IGY, AERE, Harwell Report M 857.
11. Chamberlain, A. c. ( 1986, Environmental impact of particles emitted
from Windscale piles 1954-7, The Science of the Total Environment,
63, 139-160,
12. Booker, D. V, ( 1958), physical measurements of activity in samples
from Windscale. AERE, Harwell Report HP/R 2607, HMSO, 13, Booker, D,V, (1959),
921-4,
Caesium-137 in dried milk.
Table 1
Activities relative to 137cs = 1.00
1311 90sr 210p0
Reactor(!) 20 1 0.13
Air filters 11 0,004 0,20
Grass/soil 50 0,16
(1) Inventory in zone of melting
Nature, 183,

- 309 -
Landscape and Geochemical Approach to Drawing up a Soil Distribution Profile for Chernobyl Radionuclides in Distant Areas
E.M. KOROBOVA, P.A. KOROVAYKOV
V.I. Vemadsky Institute of Geochemistry and Analytical Chemistry. USSR Academy of Sciences. Moscow. USSR

- 310 -
ABSTRACT
A study (between 1987 and 1989) of the distribution of radlonucl ides in the 0-5 cm sol I layer In var lous typical landscapes 60-200 km from Chernobyl revea.led a I Ink with landscape structures. One year after the accident, concentrations of caesium-137/134, ruthenlum-106 and cerium-144 were found at depths of 1.5-5 cm In the sol I In forests and in meadowy reg ions of a hydromorph i c nature. In subsequent years distribution of the radionuclldes within the soil varied In line with the biological cycles and typomorphlc component of the sol I (organic and inorganic, such as iron and manganese hydroxides and calcium carbonate forms).
While most of the radionuclides accumulated In the 0-5 cm layer, some penetrated to depths of 10-15 cm and deeper In sandy hydromorphic soils and swampy soi Is, with ruthenium-106 proving most and cerium-144 least mobile.
The study findings show how vital it is to analyse the distribution of Chernobyl radionucl Ides and their secondary migration in the environment, and to draw conclusions on the role played by spatial effects.

- 311 -
The landscape and geochemical structure of the region contaminated by technogenlc radlonucl Ides Is of considerable significance both in the initial local distribution of radionuclide fallout and the secondary redistribution of chemical elements In sol I, vegetation and subsoi I water. This is because the landcape-geochemical structure reflects the variable physical and chemical properties of soil-forming rocks, soils, water, blocenoses and their generic composition, typomorphlc elements and compounds and geochemical barriers, which define the character and scope of the aerial, aquatic, mechanical and blogenlc migration of chemical elements, Including radioactive ones 1-10.
General landscape and geochemical characteristics of the contaminated area
The Prlpyat-Dnieper region where the accident took place Is characterized by slightly fragmented type-1 geochemical landscapes (polesye • Prlpyat marshes) on ancient al luvlal and sand deposits. They are a combination of agricultural land and pine forests on podzol ic and soddy-podzol ic soi Is on watersheds and terraces (eluvial landscapes), on the one hand, and herbaceous communities on alluvial stratified, acidic, meadow and marshy soils (superaqueous landscapes) on the other. Distinctive features of the "polesye" are more Intensive elimination of chemical elements under autonomous conditions and the active migration of chemical elements (acid, acid-gley class) In water, Inter al la in mob I le soluble organic complexes. The elements are concentrated In the soi Is at biogeochemical, oxygenous, gley and sorptlonal barriers. The migration of catlonogenlc elements in landscapes of the H-Ca water migration class Is normally slower; In the region in quest ion, these landscapes are represented by meadows and coniferous and mixed forests on glacial and topsoil deposits of varying composition. In addition to the geochemical barriers mentioned above, the alkaline barrier also has a definite role to play here. The Mozyr heights (formed by aeolian and eluvlal sand and loess deposits on an underlying moraine) and the Bryansk and Chernlgov opolye (eluvial landscapes compr Ising agrocenoses with fragments of oak forest on grey forest sol ls, soil-forming rocks and loesslal and covering loams) stand out as highly
Islands on the low plains. fragmented nature (type-I I
They are character I sed by the Ir geochemical landscapes), the
combination of chemical and mechanical denudation and Improved fixation of many catlonogenlc elements In blogeochemlcal, sorptlve and alkaline barriers. Water migration of elements In automonous ca-class foreststeppe and steppe landscapes (the less fragmented ones In the southern part of the region) Is the least significant. This does not relate to elements capable of forming mobile carbonate complexes, for example plutonium Isotopes (see report by F. I. Pavlotskaya, et al.). In addition, where watersheds and slopes are fragmented and more Intensely cultivated, mechanical migration of elements plays a more significant role.

- 312 -
Distribution of the main ganvna-emltters In the soils of some connected landscapes In the
outer zone affected by the Chernobyl accident
Apart from reveal Ing the main geochemical landscapes, geochem i ca I investlgat Ions presuppose a study of interlinking of elementary landscapes which reflect a elements of the relief, types of plant communities Identical source rocks7,11 using test sections.
I andscape and the catenary
comb lnat Ion of and sol ls on
The authors Investigated such sections between 1987 and 1989 In various directions from Chernobyl. on the whole, the concentrations and ratios of the main ganvna-emltters corresponded to the estimates of contaminatlon12, 13 Fig. 2). With a slml lar ratio of main gammaemitters In the upper 5 cm of eluvlal and superaqueous soi Is, in 1987 their absolute content In the catenae differed by between 2 and 5 times (Tables 1, 2). In contrast to watershed superaqueous meadows, watershed forest landscapes were characterized by their relative accumulation of al I radionucl Ides, most nuclides being concentrated In the forest litter. Examination of the terrace-edge zones which are the accumulators of global fal'lout of artificial radionucl Ides - did not show a different relative accumulation pattern for Chernobyl radioisotopes. This leads us to assume that the contrasting nature of elementary landscapes was a significant primary factor and was linked to the influence of relief and vegetation on the character of the fallout and Its retention. In addition, it could not be ruled out that some of the nuclide fallout was lost from meadow plant communities In 1986 due to removal of biomass through haymaking and grazing.
In undisturbed soils, most of the radlonuclldes are concentrated In the upper 5 cm. In the Khocheva River valley (30 km south of Chernobyl) in 1988, for example, this layer contained virtually 100% of the 144ce, 125sb and 155Eu, 92-100% of the 134cs, 75-99% of the 137cs and 61-97% of the 106Ru10. Maximum accumulation of all radlonuclldes was noted In sol ls In forest belts situated In watershed areas (the forest-edge effect, Fig. 3). Arable soils were found to have the lowest levels of radioisotopes, which were more evenly distributed, sometimes Inversely. This Inverse distribution was also seen In undisturbed fragmented loesslal landscapes at the bottoms of gul I ies (Fig. 4). This Indicates that secondary radionuclide redistribution in the catenae had begun and that It Is possible to use them as reference points in tracing mass transfer In landscape and geochemical systems.

- 313 -
Trends in the dynamics of radionuclide distribution In the soils of connected landscapes
Re-exam I nation of a number of test s I tes In the Khocheva RI ver va I I ey and on the Ovruch plateau (one year later) showed no significant lateral or vertical migration during this period of the main artificial gammaem it ters beyond the top 5 cm of ground cover and so I I (compar I son of concentration Intervals with the concentrations of elements, account being taken of natural decay; Fig. 5). At the same time, mention may be made of a number of trends towards vertical and lateral redistribution of radlonucl Ides, for Instance: 1. A rel at Ive reduct Ion In radionucl Ide concentrat Ions In the upper 5 cm of sol 1, In some cases up to 10:1: by comparison with the amount calculated for this horizon, with a simultaneous Increase In the proportions contained In the 5-15 cm layer both In eluvial landscapes under pine forest on sandy soils and in superaQueous grassy landscapes on alluvial soddy sandy-loam sol ls (an Increase In this layer of up to 50%);
2. A
certain lateral relative increase In trans It Iona I grassy elementary
radlonucl Ide concentration in I andscapes I Inked w Ith e I uv I a I
forest soi Is, the overall level of radionucl Ide contamination being maintained throughout, cannot be excluded (Figs. 5 and 6). The Inverse distribution of radlonucl Ides at the bottom of gorges In fragmented loessial landscapes referred to above (Fig. 4) may also be the result of secondary lateral redistribution.
Conclusions
The data given here underline how Important It Is to take account of the landscape and geochemical structure of a geographical area when studying and forecast Ing radioisotope migration and dlstr I but Ion In the env I ronment at a I I stages of contamination profile. This
the investigation Into the post-accident allows the spatial distribution of
Chernobyl radionucl ides to be classified and a forecast to be made of changes In distribution due to mass transfer In the landscape. It Is advisable to study the dynamics of radionuclide distribution and migration In represented sufficiently
natural conditions In geochemically by connected structures, with long Intervals.
contrasting landscapes, repeat sampl Ing at

- 314 -
Table 1
The contrast between connected landscapes In the upper and central reaches of the Vlt river (60 km south-south west of
Chernobyl) In 1987
Elementary Solt/ Contra1tln9 rodlonucllde concentration• I and scope vegetation {o-5 an)
cover
9Szr I 95Nb I 106Ru , 143c, 1137c, I 1~.1
~e•r reoche1
Neo-eluv1o1 Graa• lfteadow I I I I I I I with couch 9raa1 and 2.5 1.9 21.0 9.3 25.6 39.7 100.0 euphorbia on 1oddy-podzo 11 c cultivated eandy-loan 1oi I
Superoqueoua Gra11-aedge 1.7 3.5 1.6 1.9 1. 7 2.0 1.9 meadow on al luvlol hP.1nu1 2.2 3.5 18.4 9.4 24.0 42.4 100.0 gley loany aol I
Superoqueoua Mlxed-9ro11 1. 7 5.4 1.9 1.5 1.6 2.0 1.9 meadow on ol luvlol aoddy 2.2 5.5 21.2 7.5 20.7 42.9 100.0 I aye red aondy-loan aol I
gentral reaches
Neo-eluvlol Pine fore1t1: 2.2 1.2 1.3 1.1 1.1 1.5 1.3 Mo11 and I lchen on 1.5 4.6 20.0 10.7 28.8 34.1 100.0 1oddy-podzo I i c cultivated aondy 1011
Eluvial - Blue-gro11 1.04 0.9 0.8 0.9 0.9 1.1 0.9 occl.lTlulatlve meadow on
loany aandy 1. 7 4.8 17.7 11.5 30.7 33.6 100.0 aoi I
Superaqueou1 Cinquefoil- I I I I I I I blue-graaa me,..dow on 1.5 5.1 19.5 11.9 32.4 29.6 100.0 i I luviol ferrtferou1 1andy-loan aol I
Comments: Upper I lne - lateral contrast of connected landscapes, the concentration of nuclldes In one of which being taken as 1; Lower line - contribution of separate nuclldes to the total gamma-emitter contamination In separate landscapes (as a percentage of total contamination).

- 315 -
Table 2
Contrasting concentrations of the main gamma-emitters in the soils of connected landscapes in the Sozh river valley (250 km north of Chernobyl)
Elementary land-scape
Super aqueous
Super aqueous (terrace-side)
Neo-eluvial
Eluvial
Eluvial
Notes:
Vegetation Sol I cover Contrast In radionuclide concentrations
106Ru 134cs 137cs (Ru+ Cs) I I I
Clnquefol I Humlc peat 1.7 1.4 1. 5 1 .6 -grass gley meadow 9.9 24.3 63.9 98.1
Horseta 11/ Humic 1.9 1.3 1.4 1.4 grass gley meadow 11.5 23.2 65.3 100.0
Blue grass/ Humlc 2.3 2.0 2.1 2.1 grass meadow podzol lc 9.8 24.7 65.5 100.0
Spruce grove/ Podzol lc I I I I mountain sandy sorrel loam 8.8 26.0 64.6 99.4
Apple Soddy 1. 5 1.3 1. 4 1 .4 orchard with podzollc ml xed legume sandy 9.2 24.2 66.6 100.0 -grass cover loam
1. See comments on Table 1.
2 The final column gives the proportion of total gamma activity In the sol I (between O and 5 cm) accounted for by the three main gamma-eml tters.
- 316 -
BIBLIOGRAPHY
1. R. M. Aleksakhln, M. A. Naryshkin: Migration of radlonuclides In forest blogeocenoses; Nauka, Moscow, 1977, 142 pp.
2. V. L. Anokhln: Modelling radioisotope migration patterns in landscapes; Atomlzdat, Moscow, 1974, 142 pp.
3. G. V. Gegamyan: Ex per I men ta I study of the behav lour of cer ta In radlonucl Ides In model biogeocenoses; author's abstract of the thesis he submitted for the post graduate degree of "Kandldat" In biology, Yerevan, 1970, 29 pp.
4. E. N. Karavayeva, I. E. Molchanova, N. v. Kulikov: Regime of soil moistening conditions and migration of radlonucl Ides In soil and vegetation cover; Sverdlovsk, 1979, pp. 3-15.
5. A. A. Moiseyev, P.V. Ramzayev: caeslum-137 In the biosphere; Atomizdat, Moscow, 1975, 184 pp.
6. F. I. Pav1otskaya: Forms of occurrence and migration of the radioactive products of global fallout in soils; author's abstract of the thesis she submitted for the degree of doctor of chemistry, Moscow, 1981, p. 43.
7. A. I. Perelman: Landscape geochemistry; Vysshaya Shkola, Moscow, 1975, 341 pp.
8. E. B. Tyuryukanova: Soi I-related and geochemical aspects of radionucl Ide contamlnat Ion of the biosphere (with reference to strontium-90); thesis submitted for the degree of doctor of biology, Moscow, 1982, 310 pp.
9. E. M. Korobova, L. M. Khitrov: Landscape and geochemical Investigations of Chernobyl radionuclide migration (All-Union Conference, Suzdal); Geokhlmlya, No. 10, 1990 (in press).
10. P. J. Coughtrey: Models for radlonucl Ide transport In sol ls -Implications of the Chernobyl accident. Contribution to the Suzdal conference; Moscow, 1989, 21 pp.
11. I. P. Gavr i I ova, N. s. Kaslmov: Pract lcal studies on landscape geochemistry; Moscow University publishing house, 1989, 72 pp.
12. Yu. A. lzrael, V. N. Petrov, s. I. Avdyunln, N. K. Gas I I Ina, F. Ya. Rovinsky, V. A. Petrov, s. M. Vakulovsky: Radioactive contamination of the environment In the area around the Chernobyl power station; Gidrometeoizdat, Moscow, 1987, 53 pp.

- 317 -
13. I. A. Lebedev: Radionuclide composition of the Chernobyl fallout
in sol 1. Report series In aerosol science, No. 7, Symposium on
Chernobyl fallout studies, Helsinki, 9.12.1988, pp. 6-10.
14. E. M. Korobova, E. V. Yesakova, B. G. Llnnlk, P. A. Korovaykov:
Technogenlc radlonucl Ides In the sol ls of connected polesye and
opolye landscapes In the Kiev region; principles and methods of
studying the landscape and geochemical migration of radionuclides,
Report of proceedings, suzdal, 13-17.11.1989, GEOKHI AN USSR,
Moscow, 1989, 35 pp.
15. E. M. Korobova, E. v. Yesaicova, P. A. Korovayicov: Studying the
distribution dynamics of Chernobyl gamma-emitters in the soils of
connected polesye-type landscapes; geochemical migration paths for
artificial radlonuclldes in the biosphere; Gomel, 15-19.10.1990 (in press).

- 318 -
Additional convnents
Fig. 1 Legend to survey map of geochemical landscapes: Genuses: I - flat plain rel tef; stow water exchange, chemical denudation often predom I nates over mechan I ca I constant boundaries between autonomous and I andscapes, Ins lgn If I cant d If ferences (where they
denudation, subordinated
ex I st); I I -
hilly relief, broken heights; mean water exchange rate; varying proportions of mechanical and chemical denudation; distinct boundary between autonomous and subordinated landscapes. Types: a) on glacial deposits of varying composition (boulder loams, sands and combinations thereof); b) alluvial and fluvioglaclal sands, mainly quartz; c) toess and loess-type rocks; d) combination of toess-type rocks with platform sedimentary formations (llmestones and clays), Including those near a related seam of shield formations. Classes (by water migration type): A) st lghtly mineralized neutral or st ightly acid waters, sometimes rich in organic matter: H) acidic, H-Fe) acid-gtey; B) hydrocarbonate/calcium st ightly and moderately mineral I zed waters, often hard: Ca) carbonate, ca-Fe) carbonate-gley; C) moderately and heavily mineralized waters, hydrocarbonate and chloride-sulphate: H-Ca) transitional from acid to calcium, sometimes combined with acid and calcium, ca-Na) calcium-sodium. 1a) potesye landscapes with predominantly podzol ic soi Is in autonomous conditions, I) soddy podzotlc. The division in contour 7 is due to the greater role played by water migration in Starodub landscapes (7a; A. I. Perelman) compared with Poltava landscapes (7b).
Fig. 3 Description of vegetation and soil cover at the test sites: 159) oak and pine forest with birch on st lghtly soddy, medium podzolic sandy soil;
160) arable soddy s I lght I y podzo 11 c so I I sown w I th fodder grass; 161) grass meadow on soddy gleyey sandy soi I; 162). mixed-grass meadow on soddy gteyey sandy loam soil on banded alluvium; 164) mixed-grass meadow on soddy gleyey cultivated soil; 165) grass/leguminous crops on soddy slightly podzollc sandy loam sol I; 166) field-protecting belt of pine forest with forest I ltter on soddy slightly podzol ic cultivated sandy soil; 167) grass meadow on soddy slightly podzolic sandy cultivated soil; 168) sparse pine stands on similar sol I.

- 319 -
Fig. 4 Soll and vegetation cover: 120, 129 - slightly loamy leached chernozem under crops; 121-123, 126-128, 131 natural grass/herbaceous vegetation on loamy chernozems, partly podzollzed, sometimes with burled humlc horizons; 124, 125, 130, 132 - sedge/herbaceous/grass meadow on meadow chernozems, partly washed or sl lty.
Figs. 5, 6Soll/vegetatlon cover on test sampling sections: 158) pine forest on formerly arable soddy, slightly podzollc sandy soi I on alluvial sand; 157) herbaceous/grass meadow on Soddy sandy cultivated soil on alluvial sand; 156) herbaceous/grass pasture on soddy gleyey moderately loamy sl lty soil on sandy alluvium; 153) grass/leguminous/herbaceous meadow with sedge on alluvial stratified moderately loamy soil with burled humlc horizon; 152) herbaceous/leguminous/grass meadow on soddy gleyey sandy sol I on stratified al luvlum; 151) herbaceous/grass meadow on soddy podzol lzed sandy sol I on stratified sandy alluvium; 150 - pine forest with green moss and forest litter on slightly podzolic cultivated sandy soil.

Fig
. 1
~,Type
1 C
1 a
ss
5 I
A
I t!
J B
I
c I
H
H-F
e H
-Ca
I a
Ca
Ca
-Fe
1ca-N4
~
I b
• ·1
0 c
__
L_ ~
nl . I
I ~ ..
r.. I
a d
Map
o
f n
atu
ral
geo
ehem
teal
lan
dsc
ap
es
in
the P
rip
yat-
Dn
iep
er
reg
ion
. (A
.I.
Per
elm
an,
19
62
;19
75
; w
ith
ad
dit
ion
s).

- 321 -
oNovoz;y'bkov
12]
~Xorosten
Fig. 2 Denei ty o.f topsoil contamination by gamma-emitters . (resp. units) at sampling sites on 26.07.1987,
[J< 1 a >16

H,m
12
0
11
5
159
. . .
• •
16
0
161
16
2
o ·1
0011
1 h
ori
eo
nta
l S
cale
--';;
;, 1
0m
vert
ical j
L C
on
ten
t-'?
9 ..
z 1,
o:.1
04B
ql.!
!!}
16
4
165
166
16'7
A
a
"~
~4
.
. .
. . . .
. .
.
l.J
lJ.J
D
epth
, cm
. .
f
> 13?
cs ~r
i"w
f
rm-
r I~,~~~
13
4cs
0 5
~
10
1
r ~
~
I~'
ii ~
14
4ce
~
~$
jj l
w?
Y~
~-3
!Y~
1,~
~~
~4
?'4
106R
_u lf
~M
i C
on
ten
t O
0
,5
1.0
.10
4
12
5sb
o
,17,7,
7, ..,.
., ...
>
-,,
S°
154E
u ~E
ZI
I
rr
V7J
Z4
Pl ~
l?J
~,,l-
¥ W
l
r 0
VO
ZZ
Z.J
0
VZ
ZZ
A
12
Zi0
Fig
.3
Dis
trib
uti
on
of
gam
ma-
emit
te~
s in
th
e
top
soil
o
f co
nn
ecte
d l
an
dsc
ap
es
in
the
mid
dle
re
ach
es
of
the
Kho
chev
a ri
ver
(po
lesy
e
lan
dsc
ap
e,
30 k
m
sou
th o
f C
her
no
by
l),
1.0
8.1
98
8.
(Lig
ht
shad
ing
mea
ns
that
the
ele
men
t w
as
fou
nd
in
o
ne
ou
t o
f th
ree
sam
ple
s1,
.
.....
N
N
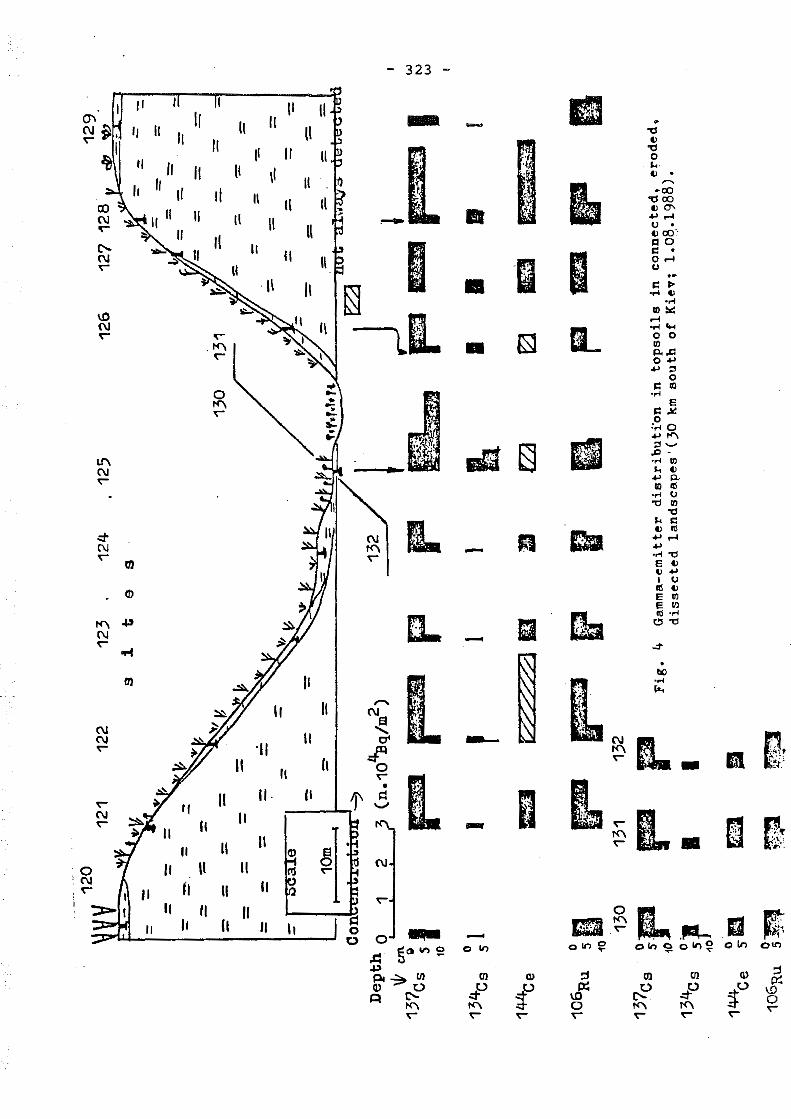
= -
- -- - -
13
4c
5 :
l
14
4ce
O lt
'1 1
06
Ru
5
fiil
iO
13
0
13
7cs
~m
10
J -
~
13
4cs
11
14
4C
e ;a
1
06
Ru
i .
$4
- --=
-
--
12
1
I ~
p
13
1
pa
I -~ t\tl
12
2
12
3
12
4
. 1
25
1
26
1
27
1
28
1
29
!&
~
=
-~
--
--
--
--
-1
30
1
31
-
~
--
=
--
::=
-=
.
=
=
-'•'l'
•M•H
:::
=
I ~
F
F
a L~#
M
jM';;
'.-®
•/J I
, I
I L
I
I II
I
f;?;:
7J/2
j m
J)J
m
0
E
JK
t:tr
~i·
!!II
-~
. V
'f#
it,-
.
F
Ir
Ii
I\
f1 m
a IP
II
1
32
p
I !I
tf:;tt
l
Fig
. 4
Gam
ma-e
mit
ter
die
trib
uti
:on
in
to
pso
ils
in
co
nn
ecte
d,
ero
ded
, d
issecte
d la
nd
scap
es'(
30
km
eo
uth
o
f K
iev
; 1.
08_
.19
88
).
·'
w "' w

10
6R
u
13
4cs
13
7cs
Wea
k sa
nd
y p
od
sol
( 15
0)
So
d-g
ley
sa
nd
y s
oil
( 1
52
)
~~
~~
~~
~~
~~
~...........
0 1
0
-9.6
58
S;:§
~~~~
~~~~
~~~'
5~~~
~:-:
:::~
~~~~
'0~~
~~~~
1
s +
100.
0 1
0B
..r+
e1.s
· -~
""-~
~ -
2.9
20
+
_3
3,0
0 1~~~~~"~~ -
4.6
~~~~~~""'™'~~
-3.1
10
+
36
.2
0 16
~~
;'~
~~
"'~
-o.3
~lli'
~~~~
"~"'"
'""%'
SEI -2
,7
10
+
76
,5
I
~r~
~~
-1
.0
~~~~~~~~-1.1
10
+
12
5.0
1
0
+4
2,3
.A
l"\I
"\
-
15
2
0 F
ig,
5 P
rog
no
sis
bas
ed o
n 19
8& d
ata
(a
ssu
min
g n
o ra
dio
nu
cli
de
mig
rati
on
) an
d actu
~l
resu
lt o
f re
peat
sam
pli
ng
in
19
89
(u
nsh
ad
ed
);
ex
pre
ssed
as
a
perc
en
tag
e o
f _
rad
iois
oto
pe
co
ncen
trati
on
in
se
pa·
rate
so
il
ho
rizo
ns
( whe
re
100%
is
th
e
gen
era1
co
ncen
trati
on
o
f el
emen
ts
in a
se
cti
on
to
th
e
co
rresp
on
din
g d
ep
th).
w "' ...

fo 15
8
10
0
C"\
s,o
:,
t,(;,
1 2
3 4
u·
/0
t 1
0
0 v
' ~
.)
--'-
C"\
"'
-0
c:j
'I
2 3
4 LC
\
-.L
.,
'
2 I 0
1 .
,-0
_. ..
j L~
CJ
:L
('
I ~
..:,
0 -
4 :,
157
156
153
152
151
,;,,
TI1lfflll
l~ IM
1
2 3
4 1
23
41
23
41
23
41
23
4
I!_!
!f-6
1
I !f
lt
L 1
f:J 1
11 I
w_li
l 1 f
I I
Fl t
{N f
t1
1 W
I W
J ( V
1 f [I
I
ra I
M r
llJ
I Rz
f
12
34
12
34
12
34
12
3
4
1 2
3 4
Fig_
. 5
(sic
) P
rog
no
sis
bas
ed o
n 1
98
8 d
ata
(a
ssu
min
g n
o ra
dio
nu
cli
de
mig
rati
on
) an
d actu
al
resu
lt o
f re
peat
sam
pli
ng
in
19
89
(s
had
ed
);
ex
pre
ssed
as
a p
erc
en
tag
e
of
rad
iois
oto
pe
co
ncen
trati
on
in
se
para
te so
il
ho
rizo
ns
(wh
ere
100%
is
th
e g
en
era
l co
ncen
trati
on
of
elem
ents
in
a
secti
on
do
wn
to
the
corr
esp
on
din
g
dep
th).
150
1 2
3 4
c L 3
4
1 -
lOG
Ru;
2
-1
34 c
s;
3 -
13
7cs;
4
-to
tal
gam
ma
acti
vi.
u.
w "' u,
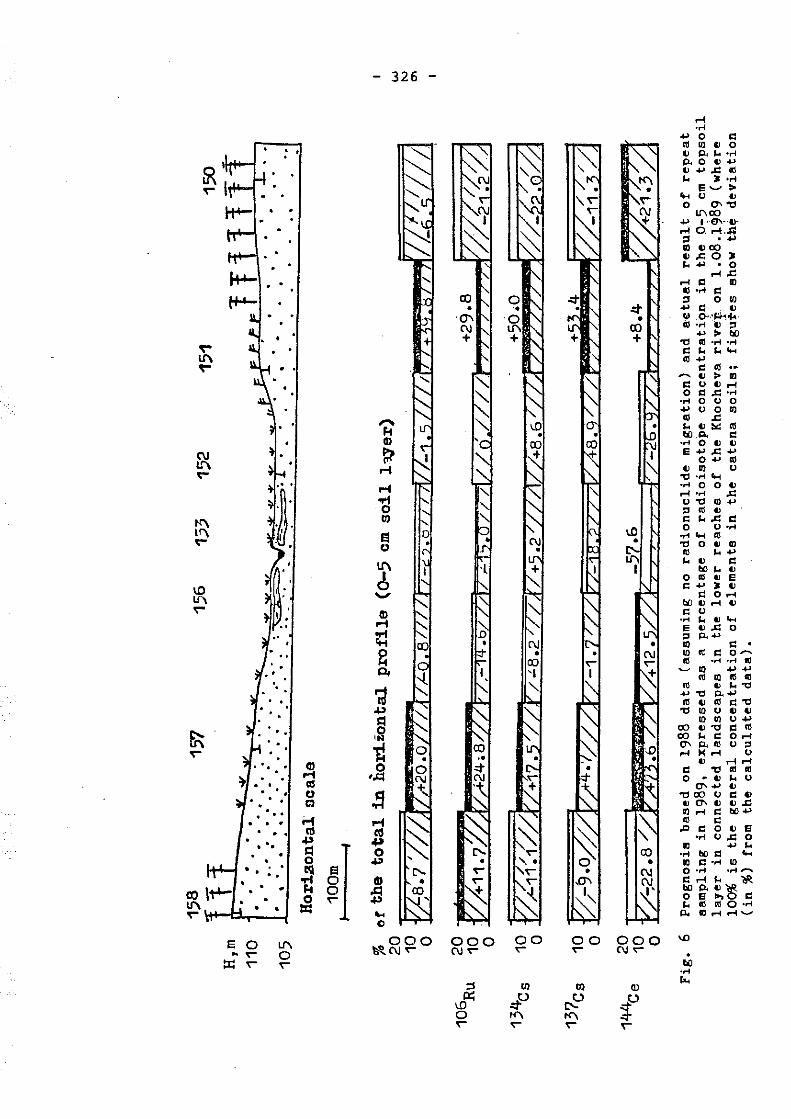
106R
u
134c
s
137c
s
144c
e
158
157
H, m
.f. .1
. 11
0 ,
105
J.
•
. . .
. ~
. . .
. . . .
.... .
. .
. . .. .
. . . .
.. .
. . .
. . .
. .
.· ...
. .
. .. ..
. . .
. H
ori
ao
nta
l sc
ale
100m
156
153
1.52
151
%
of
the to
tal
in h
ori
.zo
nta
l p
rofi
le (0
-5 c
m s
oil
l3
Yer
)
~g V,s:
7 7ld
2tffo
,o)7
!)I ,
L0
,81
1 !/
j 1
-.;7
.01
I I J
V/-
1,5
///1
rn +%
4,§1 I l!
[{3/ !l
!I
20
-t;
·~ ''
'. 5
+2
9,8
v //_
/ 12~
1 g
J11
.7;(
2).
24
.sfl
t;.-
·14
.b1
z2
,/ ,.
:.J2
,01t
7111
0./l
/ /t
,,,,,,
, ( / 1
_;1.
2=
10
/ +5
0.0
0 '.
/,'-
11
~1
//,
/~8
.2
1 g ~-
9.op
7p;4
.·1/J
a/-1
.27 /Z
Pz
1e.2
22
1vA
s.q
///P
4
(··--(
+. ,·
~·/····
·~-~
./,
/· IV
-11 ;
;//]
~g -b~
22.s
/;h
,tt?
Yv
?+
12
.51
2Jz
,-;~
·~ 2
2
J> /-
26.g
zztlz
2 ;5 ;4 2
2 21
2?+
'2 432
1 F
ig.
6 P
rog
no
sis
bas
ed o
n 1
98
8
data
(a
ssu
min
g
no
rad
ion
ucli
de
mig
rati
on
) an
d
actu
al
resu
lt o
f re
peat
sam
pli
ng
in
19
89
, ex
pre
ssed
as
a
perc
en
tag
e
of
rad
iois
oto
pe
co
ncen
trati
on
in
th
e
0~5
cm
top
soil
la
yer
in
con
nec
ted
lan
dsc
ap
es
in
the
low
er
reach
es
of
the
Kh
och
eva
rive
':(,
on
1.0
8.)
.~8
9
(wh
ere
100%
is
th
e
gen
era
l co
ncen
trati
on
of
elem
ents
in
th
e
cate
na s
oil
s;
fig
ui-
es
show
th
~
dev
iati
on
(i
n%
) fr
om
the
calc
ula
ted
data
).
w "' "'

- 327 -
Radionuclides in the Soil and Vegetation in the 30 km
Accident Zone Around the Chernobyl NPP
N.V. KULIKOV, I.V. MOLCHANOVA, A.N. KARAVAYEVA
Department of Continental Radioecology, Institute of Plant and Animal Ecology
Ural Branch of the Soviet Academy of Sciences, Sverdlovsk, USSR

- 328 -
ABSTRACT
Under the programme of the USSR Academy of Sciences to combat the consequences of the Chernobyl reactor accident, radioecological research was carried out In Interconnected landscape components affected by runoff at various distances from the damaged unit Inside the 30-km accident zone.
The results showed that the radionuclides studied could be arranged in the order of 137cs > 134cs > 90sr In terms of decreasing content in the sol I and vegetation, with a higher contamination density occurring in the Immediate vicinity of the nuclear power plant. No geochem i ca I trend was observed In the migration processes in interconnected landscape components affected by runoff. Oisplacement of the maximum content of 90sr and 134,137cs to a depth of 10-15 cm was observed only In the most dynamic geochemically I Inked components (valleys and floodplains). In forest and open areas radionucl Ides were concentrated in the forest litter and the upper 0-5 cm soil layer. Of al I the wi Id plant species studied, mosses had the greatest concentration capacity; their 90sr and 137cs content and concentration coefficients were 5-10 times higher than those for the overground mass of members of herbaceous plant communities.
In the immediate vicinity of the damaged reactor 90sr Is found in the soi I in the firmly fixed state, but a substantial proportion of it converts Into Ion-exchangeable forms with Increasing distance from the reactor. Work carried out by the Experimental Scientific Research Station along the radiation trail of the 1957 accident also showed that 72-95% of this radionuclide is In the Ion-exchangeable form. The period of semi-el lminat Ion of 90sr from the 0-5 cm layer of contaminated soil is 9 years. Cs radioisotopes in the soil are mainly in the form of firmly fixed compounds.

- 329 -
Under the programme of the USSR Academy of Sc lences to combat the consequences of the Chernoby I reactor ace I dent, rad i oeco log i ca I research was carried out In Interconnected landscape components affected by runoff at various distances from the damaged unit Inside the 30-km accident zone. The first area was 6 km south-east of the NPP and covered the top, central section and foot of the slope leading to the River Pripyat floodplain. The second area was 18 km south of the NPP and also covered the top, central section and foot of the slope forming the swampy bayou of the River Uzh.
On each of the main rel lef elements of the geochemical profiles mentioned we exposed soil cross-sections and from these took samples in layers of 0.5-1.0 cm down to a depth of 5-10 cm, recording the collection site and the genetic horizons. In the areas around the exposed soil cross-sections, we took samples of herbage, forest litter and other dead plant matter. The presence of 90sr was determined by means of the daughter radlonucl Ide 90y, which was measured using a low-background UMF-1500 unit with an SBT-16 end-window counter with a margin of error of up to 15%. The content of the radionucl ides 134,137cs was determined on an AM-A-02FI multi-channel analyser with a DGDK-50-B semiconductor detector. The areas of the photopeaks were calculated using equipment with a measurement error of no more than 3%.
The results obtained show that the radionucl Ides studied could be arranged in the order 137cs > 134cs > 90sr In terms of decreasing content in the soil and vegetation, with a higher contamination density occurring In the area In the Immediate vicinity of the destroyed NPP unit. Thus, the level of radlonucl Ides In the upper 0-2 cm sol I layer amounted to hundreds of kBq/m2 (for 90sr and 134cs) and thousands of kBq/m2 (for 137cs) (Fig. 1). In the areas 18 km from the NPP the amount of radlonucl Ides was about one order of magnitude lower. The maximum concentrations of radionuclldes were confined to the upper 0-2 cm soi I layer in open areas and to the layer of forest I itter in forest stands. Of al I the types of wi Id plants studied, mosses were found to have the greatest capacity for accumulation, the concentration of nuclides therein being 5-10 times higher than that in other types of plant. Spatial differentiation in radionuclide content in the various rel lef elements was not yet evident because of the short space of time which had elapsed since the accident.
In the period after the accident the Involvement of radionucl Ides in the biogeochemlcal migration cycles depended on their capacity to form compounds with varying degrees of mobility, as well as on their general content and distribution In the sol I. The physico-chemical forms of 90sr and 137cs In sl lghtly humlc sandy sol ls at var lous distances from the damaged reactor were studied In this connection.
The Table shows that 90sr Is found primarily In the fixed state (up to 74%) near the damaged unit (3 km), while no more than 1% Is In the water-soluble compound form, and the exchangeable and acid-soluble forms account for 17.7% and 7.7% respectively.

- 330 -
Table 1
Relative distribution of the physico-chemical forms of 90sr and 137cs with varying degrees of mobility in sol ls(%)
(Data for 1987)
Distance from Physlco-chemlcal forms of radlonucl Ides In sol ls NPP (km)
Water- Exchangeable Acid- Fixed soluble soluble
90sr
3 0.6+0.3 17.7!2.9 7.7+2.1 74.1+1.7
18 1.8!0.4 48.4!1.2 11.7!1.0 38.2+2.6
------------- ------------~------------· ------------ ----------137cs
3 3.1+0.4 6,6!0,9 13.1!1,6 77.2+1.7
18 1 .5+1.2 8.3+3.0 8,5!1. 7 81.8+2.6
The proport Ion of water-soluble and exchangeable radiostront lum rises with Increasing distance from the accident site, whereas that of fixed radlostrontlum falls to 38.2%. This has been confirmed by the research work carr led out In the zone of the Kyshtym accident In the Urals in 1957, which showed that 72-95% of this nuclide occurs in ionexchangeable form and that the period of semi-el imlnation from the contaminated soil is approximately 9 yearsC1),
The Table shows that 137cs is present in the soi I primarily in the form of firm I y f I xed compounds, Irrespective of the p I aces where the soil samples were taken.
BIBLIOGRAPHY
1. Research conclusions and exper lence from the work to combat the consequences of accidental environmental contamination with uranium fission products; Editor: A. 1. Burnazyan; Moscow: Energoatomizdat, 1990, p. 72.

- 331 -
Fi Cl. l : RAD IONUCLI OE CONT AM I NA Tl ON LEVEL IN THE SO 1 L AND VEGETATION OF THE ACCIDENT ZONE AROUND THE CHERNOBYL NPP
~
< ~
"" KEY "° ..,
I Banks of Pripyat 0 River
I I Banks of Uzh 0 0 River 0
C") r\ 0 ,, = Top of slope H a J.. "" . "'\ b Central section f rti" I \ of slope I \
0 \ c I \\ Foot of slope lJ 8 I \ 0 I = Sr-90 <.O
' \ I \ 2 = Cs-134 \ ' ' 3 = Cs-137 \ I \.
0 '\ 0 I t\l ' 0
' C\l ..... C\l ... ...... _ --- • -• 0 0
0 0 <.O H
0 01 0 -... 0 "' LC) I "I \ C"".l I \ H + ~ ,111~ 0
I \ 8 I . \ 0 co I \ il~\, , \ I \
.D 0 , , ..... 0 ,. t\l • ' 0 ... "1 / ~ ......... C\l I
.... __ -• -0 0
0 0 0 er:, ,~, 0
LC) 0 I \ H 0
LC)
,"If\' H I \ I •\ 0
I \ 0
' ! H tll f l ~
0 r·, 0 r .(\\ 0 I C") tD
. \ \ : I . ' I I \\I • I
'· (\I \', 0 I l\ __ 0 0 • ' C\l I H
' H ... _ -H 0 H 0
s;j< LC) H C\l C") 'SI' LC) H C\l C")

- 332 -

- 333 -
Content of Cs-134, Cs-137 and Sr-90 in Birch Crowns in Woods Within 30 km of the Chernobyl Power Plant During the Initial
Years Following the Accident
P.I. YUSHKOV, T.A. CHUYEVA, N.V. KULIKOV
Department of Continental Radioecology, Institute of Plant and Animal Ecology
Ural Branch of the USSR Academy of Sciences, Sverdlovsk, USSR

- 334 -
ABSTRACT
Between 1987 and 1989, as part of the programme of the Soviet Academy of Sciences, we studied the effect of the radioactive releases from the damaged Chernobyl reactor on Betula verrucosa Ehrh. stands located 1.5, 6 and 18 km from the power plant.
It was establ I shed that the content of 134, 137cs and 90sr in crowns decreased significantly with Increasing distance from the power plant, with major differences being observed even within each stand. Thus, the concentrations of 134,137cs in seeds produced in 1987 varied by a factor of 14 near the NPP, and by a factor of 30 at the most distant site. The concentration of total 134,137cs In catkins in 1988 was lower than in 1987 by a factor of 1.7, whereas in 1989 it was, on average, 17 times higher than in 1987. The concentration of 90sr in catkins rose over this three-year period. Evidently, the temporary decrease in the amount of radiocaesium in the catkins was caused in part by decay of 134cs atoms, while the Increase In the radionuclide content in crowns in 1989 reflected greater ingress of radionuct ides into the trees through the roots.
The concentration of 134,137cs in seeds in the birch stands studied was similar to that in the leaves, but lower by a factor of 2.2 than that in the fruit scales of the catkins. The concentration of 90sr in seeds was 2.1 times higher than in the fruit scales, while the radionuclide content in leaves was higher than - or hardly differed from - that in seeds. The concentration of 134,137cs in seeds, fruit scales and leaves was higher than the 90sr concentration.
The research also showed that the birch seeds produced in 1987 in the stand close to the NPP had better sowing qua I ities and greater resistance to gamma irradiation cha I tenge than seeds from the two other stands.

- 335 -
A number of authors in the USSR and other countries have shown that in the event of airborne contamination of forest areas by radioactive substances as much as 40 - 90% of such substances are retained by the tree crowns.1-4 The structural elements In the crown play varying roles in the radionuclide cycle in forest biogeocenoses. Thus, the skeletal parts of the crown - the trunk, branches - act as a store and as transport routes for the radionucl ides. The parts of the crown which are shed each year - leaves, needles, reproduct Ive organs - can be considered as donors of radionucl ides to axillary organs and the soi I but also as recipients of radionucl ides which enter trees via the roots. Although of al I the elements which are shed by the crown the leaves play the most Important part In the radionuclide cycle, one should not ignore the contribution made by the reproductive organs which, in the case of some trees such as wl I low and birch, can be quite considerable in fruitful years. In add It ion, the uptake of radionucl Ides by fruit and seeds leads to a bui Id-up In their internal irradiation. In this connection our study of the Influence of high background radiation on the biological properties of birch seeds within 30 km of Chernobyl NPP Includes investigations of the mechanisms involved in the uptake of 134,137cs and 90sr In the catkins and leaves of this species of tree. In the I iterature we found no references to the accumulation of the radionucl ides in quest ion by reproductive organs of birch.
The present report contains data on the accumulation of 134,137cs and 90sr in reproductive organs and leaves of the Betula verrucosa Ehrh. birch tree within a 30-km radius of the Chernobyl NPP in the first three years after the accident there.
The investigative method used was as fol lows. In three stands of mixed pine and birch at distances of 1.5, 6 and 18 km from the demolished NPP unit, work in the first year centred in each area on 15-20 heav i I y fruiting young birch trees; in August 1987, 1988 and 1989 catkins were collected, and leaves as wel I in the next two years.
The radionuclide content in catkins and leaves was determined separately for each tree and also for the structural elements of the catkins - seeds, seed wings and fruit scales. The concentration of 90sr was measured by its daughter 90y, using the low-background UMF-1500 apparatus with an SBT-16 end-window counter. The concentration of radiocaesium was determined by means of an AM-A-02FI multichannel analyser with a DGDK-50-B semiconductor detector.
Because of the very poor fruiting of birch trees in 1988 and 1989 in stands further away from the NPP no count was made in those years of the concentration of radionuclides in reproductive organs and in leaves.
Fig. 1 shows that the concentration of radiocaeslum in birch catkins produced in 1987 diminished with Increasing distance of the stand from the power plant. Thus, the concentration of this radionuclide In seeds from the first stand 1.5 km from the NPP was 113 kBq/kg of dry material and from the second and third stands, at distances of 6 and 18 km from the plant, the concentrations were 65 and 25 kBq/kg of dry material respective I y. Seeds and seed wings had pr act i ca I I y the same concentration but this was 1.6 to 2.2 times greater than in fruit scales.

- 336 -
In the next two years there was an increase in the content of radiocaesium in both seeds and leaves, with the most noticeable increase - by a factor of 9 to 10 - in trees near the NPP. It should be noted that the concentration of 134,137cs in seeds and leaves was simi tar in 1988 and 1989.
Table
Amount of 134,137cs in seeds and leaves of 8etula verrucosa growing at different distances from Chernobyl NPP during the Initial years following the accident, measured In lc.Bq/kq of dry material
Growth Year Distance from NPP in lcm
element 1. 5 6 ~-
1988 420 ± 115.5 45 ± 18.5
Seeds
1989 4 187 ± 535.5 164 ± 36.6
1988 407 ± 121.2 38 ± 12 .0
Leaves
1989 3 628 ± 861. 4 149 ± 26.3
Since there was not a sufficient volume of catkin samples to al low the radiochemical analysis of radlostrontium, material from five trees in each of the stands investigated was used. The amount of 90sr in structural elements of birch catkins and leaves decreased with increasing distance from the demo I ished unit (Fig. 2). Thus, in the first stand, the amount of radionucl Ides per lcilogram of dry material in seeds produced in 1987 was 120 le.SQ and in the second and third stands it was respective I y 25 and O. 75 kBQ. In 1988 and 1989 the increase over the 1987 concentration of radiostrontium in structural elements of catlcins and leaves was significantly lower than the increase referred to above in the concentration of radiocaesium. In the second stand this did not emerge so clearly. Within the caticins the concentration of 90sr was higher in the seeds than in the fruit scales. However, these differences were statistically significant only in seeds produced in 1989 from the first stand (tst • 4.0 at to.05 • 2.3). It will also be seen from Fig. 2 that the concentration of this radionuclide In seeds and leaves is, as a rule, identical. An exception to this is found in specimens of such seeds and leaves gathered in 1989, In which the amount of 90sr is clearly higher In the leaves Ctst • 2.8 at to.OS • 2.3). From the above It is clear that in the three years after the Chernobyl accident there has been a but Id-up of an ever increasing amount of caesium and strontium radionucl ides in the reproductive organs (catkins) and leaves of Betula verrucosa growing within a 30-km radius of the power plant. The uptake of radionucl ides in tree crowns was more marked in 1989 in the stand 1.5 km away from the demolished unit. This was due to some extent to repeated
- 337 -
contamination of the trees by radioactive dust raised into the air as a result of decontamination operations in the territory adjoining the stand. However, since similar decontamination operations were also carried out in this zone in ear I ier years, the main reason for the phenomenon referred to is evidently the increased uptake of 134,137cs and 9Dsr by the trees through the soi I In 1988 and 1989. This in turn led to an increase In the return of radionucl ides into the soil through the shedding of leaves and, in the final analysis, to an extension of the scale of their incorporation in the cycle of matter in the biogeocenosis.
BIBLIOGRAPHY
1. R. M. Aleksakhin, M. A. Naryshkin: Migration of radionucl ides in forest blogeocenoses; Nauka, Moscow, 1977, 144 pp.
2. M. A. Naryshkin, R. M. Aleksal<hin, N. N. Mishenl<ov: Migrat Ion of 9Dsr, 106Ru, 137cs and 144ce deposited with fallout in a forest blogeocenosls; Lesovedeniye, 1973, No 3, p. 10.
3. F. A. Tikhomirov: Effect of ionizing radiation on ecological systems; Atomizdat, Moscow, 1972, 176 pp.
4. F. A. Til<homirov, R. M. Aleksakhin, E. A. Fedorov: Migration of radionucl ides in forests and the effect of ionizing radiation on forest stands; in Peaceful Uses of Atomic Energy, UN, New York, 1972, Vo I . I I , p. 675.

- 338 -
Fig. 1. Content of 134,137cs in 1987 in crowns of Betula verrucosa growing
within 30 km of Chernobyl NPP. 1 - seeds; 2 - seed wings;
3 - fruit scales.
250
0 I
200 ~ ,2
~ 3 150
c: ·c-1 .... "' IOO +'
" E ,,., ....
'C
..., 50 0
t.:: -" "'-cc cc -"'
0 I .5 6 I8
Distance from nower plant in km

rl al . .., " <I> +> al E ,,., « .,,
..... 0
bC -" "-c
"' -"
- 339 -
Fig. 2. Changes in the content of 90sr in crowns of Betula verrucosa,
growing within 30 km of Chernobyl NPP, in the first three years
fol lowing the accident. 1 - seeds; 2 - fruit scales; 3 - leaves.
400
35U ..,..
300
25[1
2C:l, I98E
I5G I9l:7
ruvr
50
0 I,5 6 !8 I,5 I,5
Distance from power plant in km
I':!b9
D I
~ 2
~ 3
6

- 340 -

- 341 -
Forms of Radionuclide Occurence in Soil
Y.P. DAVYDOV, N.I. VORONIK, N.N. SHATILO
Institute of Nuclear Power Engineering Byelorussian Academy of Sciences

- 342 -
ABSTRACT
This paper covers research Into the forms of the 137cs and 144ce radionucl ides having entered the soi I as a result of the Chernobyl accident. The difference between the sorptive behaviour of these radionucl ides and that of the same radionucl Ides introduced Into the same soi I in ionic form may be useful in drawing conclusions about the forms of radionucl ides In the soi I.
86 sol I samples were taken at the fol lowing distances to the north of the reactor: 6, 80 and 150 km (Gome I region) and 260 km (Mogi lev region) of 8yelorussia.
In addition to sorption and desorption experiments using solutions of different composition, we also carried out experiments involving ultrafi ltration of solutions (using membranes with a pore diameter of 0.5, 0.19, 0.1 and 0.06 microns) produced by desorption of Cs and Ce in real and model experiments.
From the overal I results we conclude that Cs and Ce are present in soi Is of widely differing composition, partly in ionic forms and partly in the form of particles, the matrices of which are either uranium dioxide or graphite.

- 343 -
In order to solve the technical problems involved in overcoming the aftermath of the Chernobyl accident, it is essential to know in which form the radionucl ides occur in the environment.
What we mainly need to lcnow is whether a radionuclide occurs in the form of particles or in dissolved, ionic form. After the Chernobyl accident two conflicting views were advanced. The first was that al I the radionucl ides in the environment were in the form of particles, whose matrices were either uranium dioxide or graphite. The second view was that al I the radlonucl ides were present in dissolved, ionic form. It should be pointed out that identifying the form of a radionucl Ide In the environment is a formidable task. Although there is a substantial body of I iterature on the state of radionucl ides in solutions and In soi Is, I ittle is known about the forms of occurrence of the radionucl ides deposited on the soi I as a result of the Chernobyl accident. The point Is that the overwhelming majority of investigations were conducted with model systems even if real sol ls and rea I river and sea water were used. 1-3 The main character I st i c of such models is that dissolved, ionic forms of radionucl ides are introduced into the sol I or water, after which the researchers examine what form a radionuclide wi I I assume in a solution of given composition, how it is distributed between water and soi I, etc. In our case the original form of the radionuclide is not clear, being determined by the circumstances of the accident. However, it is precisely this form of the radionuclide that has to be determined.
Changing conditions in the reactor, changing meteorological conditions and uninterrupted ejections over a ten-day period may have led to the formation of very different forms of radionucl Ides on the territory of Byelorussia.4,5
In this study conclusions on the form of the radionucl ides were based primarily on data on the sorptive and desorptive behaviour of the radionucl ides Cs-137 and Ce-144 deposited in soi Is as a result of the accident, and the behaviour of these radionucl ides when introduced into the same soi Is in ionic form. The difference in the sorptive behaviour of radionucl ides in real and model systems was the basis for conclusions on the forms of radionucl ides in the soi I. In addition we used ultrafi ltration with the aid of nucleopore filters (pores 1 to 0.05 µm in diameter) and the ion exchange method.
The soi I samples used were collected In October 1986 along the "northern track" at a distance of 6 km from the reactor (at Masany), and at a distance of 40 and 150 km in the Khoynlki and Narovlya rayons (districts) in Gome! oblast (region), and at a distance of 260 km in Mogi lev oblast (Chudyany).
The standard soi I core was cut Into two layers. Since over 95% of the radioactivity was concentrated in the top layer of soi I, this layer was used for the real experiments and the bottom part for the model experiments. For the model experiments the soi I samples were Immersed in an aqueous solution (pH 4) containing the radionucl ides Cs-137 and Ce-144 In ionic form. The mixture was stirred for 7 hours and left to stand overnight. After this the solution was filtered off through a paper filter (pore diameter 2.5 µm) and the sol I was dried in the air. In these conditions the sorption rate was 97-99% for Cs-137 and 80-95% for Ce-144.

- 344 -For desorption, the fol lowing solutions were used: H20; 0.1 mole HCI; 0.1 mole HCI + 0.1 mole KCI + 0.1 mole FeCl 3 ; and 0.1 mole NaOH + 0.1 mole Na4P207. The 0.1 mole NaOH + 0.1 mole Na4P207 solution is used to extract humic acids from the soi 16, the data on desorption of radionucl ides by this solution possibly giving some indication of the role of humic acids In binding radionucl ides in the soi I.
The desorpt ive solution was poured onto real and model soi I samples (weighed amounts) and stirred for 7 hours. The solution was separated from the soi I through a "blue band" paper fl lter. The results shown in the tables and figures are average values from 5 or 6 experiments.
Table 1
Extraction of Cs-137 from soi I
Amount extracted, X Atnount extracted,,; Real experiment a Model experiments
Soi I H20 0.1M 0.1Mtel, 0.1M H20 0.1M 0.1M
tel KCI, NoOH, tel tel, KCI FeCl 3 No4P2~ FeCl3
Sandy .... 3±1 3±1 38±8 12±2 1.&.e0.3 1.3±0.4 19±1 Grey meadow 5±2 6±2 28±14 30±9 1.4±0.2 0.9±0.2 22±4 locrny 8±2 6±1 24±15 6±1 1.0±0.1 1.2±0.8 10±2 Soddy-podzol ic 2±1 3±1 19±4 30±12 0.3±0.1 2.2±0.6 22±2 Peaty 4±1 7±3 7±5 - 1.4±0.8 - 28±5
As the results show (Table 1), water and 0.1 mol/litre HCI solutions extract only a smal I fraction of Cs-137 and the quantity does not vary much w i th soi I type.
The ultrafiltration data reproduced in Figures 1 and 2 show real 0.1 mole HCI and H2o solutions, Cs-137 partly occurs form (50%). But this also applies to the model solutions. nature of these particles?
that in the in particle What is the
The data reproduced in Table 2 show that Cs-137 is wel I sorbed by al I soi Is examined from the 0.1 mole HCI solution and even from the HCI + KCI + FeCl3 solution.

- 345 -Table 2
Sorption of Cs-137 by soi Is
0.11.4 HCI 0.11.4 HCl+0.11.4 KCl+0.11.4 FeCl3 Soi I
Soi I Sorbed Quantity Soi I Sor bed quantity amount amount
(g) Absolute " (g) Absolute %
11 517 97 7 57 55 .... oamy 27 440 98 14 13 52
46 300 95 23 12 50
1 132 34 15 6 32 Sandy 12 170 88 17 5 31
26 204 93 19 5 32
Soddy- 1 168 43 4 10 18 podzol ic 9 91 80 12 7 30
20 81 88 21 26 74
2 990 84 - - ->eaty-swampy 13 760 91 - - -
30 250 95 - - -
This may serve as an indication that the Cs-137 particles in the solution are particles of soi I with adsorbed ions of caesium, i.e. Cs-137 occurs in the solution in the form of pseudocol loids. The fact that a solution containing the ions H+, K+ and Fe3+ increases caesium desorption from the soi Is evidently indicates that these ions displace caesium. The conclusion to be drawn from the data as a whole is that Cs-137 is mainly found in the soi Is in ionic form.
The data in Table 1 show that the greater the quantity of humic acids the more Cs-137 is extracted by the 0.1 mole NaOH + 0.1 mole Na 4P2o7 solution. At the same time, the data in Figure 4 show that the presence of dissolved forms of humates in the solution has no significant effect on the sorption of Cs-137 by sandy soi I.
This suggests that Cs-137 interacts weakly with humates. It is not impossible that the sorptive properties of humic substances in the soil differ from their properties when in pure form.
The data presented in Figure 3 show that independently of the distance from the reactor, Cs-137 occurs in the soi I mainly in Ionic forms, i.e. no significant change in the forms of occurrence of Cs-137 is observed as a function of distance.
Similar investigations were conducted with Ce-144. The data reproduced in Table 3 show that there is a substantial difference between the sorptlve behaviour of ionic forms of ce-144 In the model experiments and that of Ce-144 entering the soi I as a result of the accident. While in the model experiments 80% of the ionic forms of Ce-144 are extracted from the soils (irrespective of type), in the real experiments the quantity extracted was between 15% and 30%.

- 346 -Table 3
Extraction of Ce-144 from soils(%)
Real experiments Model experiments
H20 0.11.4 0.11.4 0.11.4 H20 0.11.4 0.1M Soi I HCI HCI, Na OH HCI HC I,
KCI, Na4P207 KCI,
FeCl3 FeCl3
sandy 1±1 1±1 49±7 23±7 1±1 14±1 82±2 Grey meadow 2±1 4±1 38±6 67±12 10±1 30±4 86±2 Loamy 2±1 1±1 13±1 - 1o±1 34±8 79±4 Soddy-podzol ic 3±1 2±1 28±12 75±10 1±1 27±3 81±3
The u I traf i I trat ion data (Figures 5 and 6) show how the forms of occurrence of cerium differ in the real and model solutions. In the real solutions of 0.11.4 HCI (Figure 5) approximately 70% of the Ce-144 occurs in the form of particles, while in the model solutions the figure is approximately 40%. What is the nature of these particles? In such low concentrations c10-10 to 10-12 mol/1 itre) cerium cannot itself form particles of colloidal dimensions. In the 0.11.4 HCI solution, prepared with twice-dist i I led water, at al I concentrations cerium occurs only in ionic form and only as ce3+ cations.7 In this case the cerium is evidently not in the form of particles whose matrix is uranium dioxide. In point of fact, the ultrafi ltration experiments with solutions containing the ions H+, K+ and Fe3+ (curves 2,4) show that - as in the model experiments - cerium occurs only in ionic form, i.e. in these solutions Ce is not sorbed by soi I particles nor do pseudocol loids of cerium form in the solution as a result.
The data in Table 4 show that there are differences in the ratio of Ce-144 to Cs-137 in the soi I (prior to contact with solutions) and in so I ut ion.

- 347 -Table 4
Ratio of Ce-144 to Cs-137 in soi I and in a 0.1M HCI + 0.1 M KCI + 0.1M Fec1 3 solution
Distance from reactor in lcm Ratio of Ce-144 to Cs-137
Soi I Solution
6 2.0 ±0.2 11.6±2.7 30 0.4 ±0.2 2.4±0.4 40 0.3 ±0.1 4.o±0.4 70 0.6 ±0.3 1 .5±0.4
260 0.01±0.01 0.2±0.1
This suggests that the process is one of desorption or leaching, and not the dissolving of particles. Moreover, these processes differ for caesium and cerium.
- 348 -BIBLIOGRAPHY
1. v. M. Prokhorov: Migration of Radioactive Contaminants in Soi Is; Moscow, Energoatomizdat, 1981, 98 pp.
2. N. V. Timofeyev-Resovsky, A. A. Titlyanova, N. A. Timofeyeva, G. I. Maxon i na, et a I.: The Behaviour of Radioactive Isotopes in the Soi I-Solution System; Soil Radioactivity and its Measurement; Moscow, Nauka, 1966, pp. 174-195.
3. F. I. Pavlotskaya, B. F. Myasoyedov: Determining the Content and Forms of Occurrence of Artificial Radionuclides in the Environment; Modern Methods of Separating and Determining Radioactive Elements; Moscow, Nauka, 1989, pp. 36-45.
4. Yu. A. lzrael, v. N. Petrov, s. I. Avdyushin, et al.: Radioactive Contamlnat ion of the Environment in the Chernobyl NPP Accident Zone; Meteorologiya i Gidrologiya, 1987, No 2, pp. 5-18.
5. v. G. Asmolov, A. A. Borovoy, v. F. Oemin, et al.: The Accident at the Chernobyl NPP - A Year After; Atomnaya Energiya, 1988, Vol 64, No 1 , pp. 3-23.
6. N. P. Belchikova: ~ccelerated Determination of Humus Composition of Mineral Soi Is using the Kononova and Belchikova Method (using Sodium Pyrophosphate to extract Humic Substances from Soi Is); Agrochemical Methods of Soi I Research; Moscow, Nauka, 1965.
7. Yu. P. Davydov: The State of Radionucl ides In Solutions; edited by A. K. Krasin; Minsk, Nauka i Tekhnika, 1968, 224 pp.

- 349 -
% ria tee 14)
-,..tl
l!)I\JIC
F'cilh1!i, 8 ti ,r--·
I. 60
0
r VO
i:.O
~I {l/:J
Figure 1 : Cs-1 37 u It r a f i It rat ion. Sandy soi I .
Real solutions: 1) 0.1 mole HCI
2) H20 3) 0.1 mole each of: HCI, KCI, FeCl3
Model solut Ions: 4) o. 1 mole HCI
5) H20
6) 0.1 mole each of: HC I, KC I, FeCl3

- 350 -
60
20
0,1 0,19 4s
Figure 2: Cs-137 ultrafi ltration.
Real solut Ions: 1 )
2)
3)
Model solutions: 4)
5) 6)
F"II.TER. 9t>~£ .'CIAMt~~)
""' "'
Soddy-podzo I i c soi I.
0.1 mole HCI
H20
0.1 mole each of: HCI, KCI, FeCl3
H20
0. 1 mole HCI
0.1 mole each of: HCI, KCI, FeCl3

Figure 3:
- 351 -
fO
6 '10 IS°/)
Content of ionic forms of Cs-137 in a 0.1 mole HCI + 0.1 mole KCI + 0.1 mole FeCl 3 solution as a function of distance from reactor.
Filter pore diameter: 0.1 micron

f I
iO
60
zo
0
Figure 4:
- 352 -
J(----
10 50
Sorption of Cs-137 by sandy soil as a function of the concentration of humic acids in a solution of pH• 8.1.

- 353 -
~*·~~~·::::=========~~:-=:======~~~ D '£
'-------"'.3
,-------0-------0 j_ o-.r-o
Figure 5: Ce-144 ultrafiltration. Soddy-podzo I i c soi I.
Real so I ut ions: 1) 0. 1 mole HCI
2) 0. 1 mole each of: HCI, KCI, FeCl3
Model solutions: 3) 0. 1 mole HCI
4) 0. 1 mole each of: HCI, KCI, FeCl3

- 354 -
% IOIJIC iJ 3 fo,i:.,.t.
80 L
(()
2,1}
(P
Figure 6: Ce-144 u I tr a f i I tr at ion. Sandy soi I.
Real solutions: 1) 0. 1 mole HCI 2) 0. 1 mole each of: HC I, KC!, FeCl3
Model so I ut ions: 3) 0. 1 mole HCI 4) o. 1 mole each of: HC I, KCI, FeCl3

- 355 -
Migration Peculiarities of long-Lived Radionuclides in
Soils in Areas Contaminated by the Chernobyl NPP Accident
S.K. NOVIKOVA, S.V. SEVOSTYANOV
Vernadsky Institute of Geochemistry and Analytical Chemistry USSR Academy of Sciences, Moscow, USSR

- 356 -
ABSTRACT
We studied migration of long-I ived radionucl ides of caesium-134/137, cerium-144 and ruthenium-106 In soi I samples from regions contaminated by the Chernobyl accident. Samples of three types of contamination -fuel (A), quasi-fuel (Bl and aerosol (Cl - were taken at cal lbration sites in August 1988 down to a depth of 5 cm using conventional core samplers. The radioactivity of the samples was measured at intervals of 0.5 cm, as was the activity of three mechanical fractions of the samples: 1-2 (>2) mm; 0.25-1.0 mm; <0.25 mm.
The equipment used to measure the radioactivity included the AFOPA LP-49008 multichannel programming analyser (Finland) and the OGDK-100V-3 semiconductor (germanium) diffusion drift detector (USSR), the results being processed by the ASPRO automatic programming faci I ity (Vernadsl<y Institute, USSR).
Regardless of the type of soi I and landscape most of the caesium-134/137, cerium-144 and ruthenium-106 is concentrated in the upper 0-2 (to 5) cm in the form of strongly bonded compounds. Migration of caesium and ruthenium radionucl ides down to a depth of 3.5-4.5 cm was observed in humus-deficient, soddy-podzol le sandy soi Is (found in watersheds) and in soi Is of a hydromorphic nature.
The maximum concentrations of caesium, cerium and ruthenium radionucl ides (30-50 % of total activity) were found in the 1-2 (>2) mm fractions (grass, roots and tillering nodes) In the 0-1 (to 2) cm layer, which reflects the increasing role of biogenic migration processes in mass transfer of radionucl ides despite their apparent lack of mobi I ity in biocenoses. The soi l's dust and clay fraction (<0.25 mm) helps to fix the radionucl ides in the crystal structures of soi I minerals and organic matter. The ratio of caesium-134/caesium-137 in soi Is exhibiting the quasi-fuel type of contamination varies from 0.17-0.55 In the 1-2 mm and <0.25 mm sample fractions, evidently reflecting the various radionucl Ide occurrence forms and topographies in the fallout matrix, isotope separation included.

- 357 -
lntroduct ion
One of the most serious consequences of the accident at the Chernobyl NPP was the greatest radioactive contamination of the biosphere, Including the soi I cover, that has ever taken place in one go.
The need for in-situ studies, spread over many years, of the vast area contaminated made it necessary to set up special calibration sites -areas typ i ca I both as regards the various types of cont am i nation and the physico-geographic areas affected.
The radiochemical studies of radionuclides carried out at these sites form one of the main bases for radioecological monitoring of the contaminated areas of the USSR.
This report covers specific studies into the dynamics and forms of occurrence of long-I ived "Chernobyl" radionucl ides in samples of soi I collected in August 1988.
Methods
Collection of samples*
The soi I samples were collected from virgin unused land chosen on the basis of landscape and geochemical features and the various types of radioactive contamination discovered, and systematic observations were carried out from 1986 onwards. At the calibration sites we selected a 5 x 7 m area with an incline of no more than 10·, without any ho I lows, with vegetation no higher than 5-10 cm and located no more than 150 m away from the nearest forest.
The basic types of contamination specified in 1986 by B. F. Myasoyedov, I. A. Lebedev et al. (Vernadsky Institute) were classed according to the differing radionuclide composition of the fa! lout discharged from the damaged unit over the protracted period and the changes occurring during this time:
Type A: ratios of all the radionucl ides close to those calculated for fuel with a burn-up intensity of 10.3 GWd/t;
Type B: disruption of the radionuclide fuel ratios, with an increase in the relative amounts of plutonium, ruthenium, barium and caesium as compared to type A;
Type C: samples containing a large amount of volatile components from the fuel due to graphite burn-up: up to 14 times more plutonium, up to 30 times more barium, up to BO times more ruthenium and up to 900 times more caesium than in type A;
Type D: even greater anomalies in radionuclide composition, with up to 200 times more plutonium and caesium than the calculated levels, but with a low ruthenium content.
-----------------------------------------------------------------------* O.V. Rumyantsev and E. t.4. Korobova were responsible for the
collection and description of the samples.

- 358 -
Type A occurred at the fol lowing calibration sites:
No 5, situated south of the settlement of Zalesye and bounded by the Chernobyl-Kiev road and the River Uzh (30-l<m zone), where the soi I is of the floodplain, soddy, sandy type on layered sandy alluvium;
No 7, situated west of settlements of Opachlchi soddy-podzol le sandy type
the Cherevach-Zeleny Mys road between and Kupovatoye, where the soi I is of
on al luvlal sandy deposits.
Type B: this type of contamination was found at the fol lowing sites:
the the
R-Sh-9, in the Khocheva River valley near the settlement of Stepanovka, on tussocky herbaceous meadowland, directly to the south of the town of Pr i pyat on the 30-km zone boundary, where the soi I is of the soddyg t eyey, sandy type on alluvial sandy deposits.
R-Sh-8, at the mouth of the Khocheva River directly south of the town of Pripyat on the 30-km zone bounda•y, in an area of oak and pine forest with birch, where the soi I Is of a medium podzol ic sandy type on al tuvial loam.
Type C: this type was found in soi Is of a soddy-meadowy sandy-loam type on alluvial loam collected near the settlement of Matye Kleshchi 100 km south-west of the town of Pripyat.
The soi I samples were collected using standard core samplers (15 cm in diameter, 5 cm long), then the total surface gamma activity and that of the individual radionucl ides were measured (Table 1), after which the samples were measured layer by layer (in steps of 0.5-1 cm), as was the activity of the fol lowing three mechanical fractions in each sample: 1-2 (> 2) mm; 0.25-1.0 mm and< 0.25 mm.
The radioactivity of a I I the samp I es was measured on integrated gamma spectrometric equipment, including the AFOPA LP-49008 multi-channel programming analyser (Finland) and the DGDK-100V-3 semi-conductor (germanium) diffusion drift detector (USSR), and the data processed by the ASPRO automatic programming faci I ity (Vernadsky Institute).
Model experiments to study the form of occurrence of the individual long-I ived radionucl ides/gamma-emitters were carried out on the abovementioned samples of soil. We looked at desorption of the radionucl ides in static conditions by means of consecutive elutriation using the fol lowing solutions: disti lied water, sodium acetate (pH 7) and hydrochloric acid 1M. The radlonucl ide concentrations in the eluate and samples were determined via gamma spectrometry.
Discussion of results
The studies of the distribution peculiarities of the long-I ived radionucl ides stil I responsible for the gamma-radioactive contamination in the soi Is up to this day, show that - regardless of the form of contamination, the type of soi I and landscape - they are mainly concentrated in the top 0-2 (to 5) cm (Table 2).

RE
LA
TIV
E
GA
MM
A-A
CT
IVIT
Y
AT
LO
NG
-LIV
ED
R
AD
JON
UC
LID
ES
ON
THE
SUR
FAC
E AT
TH
E C
AL
IBR
AT
ION
S
ITE
S
ON
15
.08
.88
-
TOTA
L A
CT
IVIT
Y
TAK
EN
AS
l*
Co
nta
min
ati
on
R
EL
AT
IVE
A
CT
IVIT
Y
OF
RA
DIO
NU
CL
IDE
S T
yp
es
So
il
typ
e
Sit
e
Ru
-10
6
Ce-
14
4
Cs-
13
7
Cs-
13
4
A
A
Sit
e
No
5 F
loo
dp
lain
so
dd
y
san
dy
0
. 16
0
.27
0
. 4
5 0
. Io
Sit
e
No
7 S
od
dy
-po
dzo
lic
san
dy
0
.22
0
.30
0
.36
0
. IO
B
R-S
h-9
S
tep
an
ov
ka
So
dd
y-g
ley
ey
sa
nd
y
0.3
3
0.2
3
0.3
4
0.
IO
R-S
h-8
K
ho
chev
a M
ediu
m
po
dzo
lic
san
dy
0
.17
0
. 3
4 0
.38
0
.10
c S
od
dy
-mea
do
ny
0
.02
0
.00
0
.76
0
.29
H
oly
K
lesh
ch
i sa
nd
y-l
oam
• G
am
ma-a
cti
vit
y
of
sam
ple
s m
easu
red
b
y
AFO
RA
-ASP
RO
fa
cil
ity
w
U1
ID

- 360 -
Table 2
Comparative content of long-lived radionuclides in the 0-1 cm layer as against content in the sample as a whole (0-5 cm)
Collection site, Radionuclide content, as a% of total in 0-5 cm layer contamination type
cerium-144 caeslum-134 caeslum-137 ruthenium-106
site No 7, A 67 62 59 65
Site No 5, A 98 98 97 97
R-Sh-9, B 76 63 69 42
R-Sh-8, B 68 81 76 79
M. KI eshch i, c - 69 60 -
By the end of 1988 the radionucl ides deposited on the surface of the soi I had entered ( in varying degrees according to their form of uptake, physico-chemical form in the fallout and their particular characteristics) the geochemical migration cycle, as demonstrated by the data given in Table 3.

DIS
TR
IBU
TIO
N
OF
LO
NG
-LIV
ED
R
AD
ION
UC
LID
ES
BY
D
EP
TH
(T
ota
l acti
vit
y
of
sam
ple
ta
ken
as
I)
Co
nta
min
ati
on
R
EL
AT
IVE
A
CT
IVIT
Y
OF
RA
DIO
NU
CL
IDE
S
AT
TIM
E
Ty
pe
Dep
th
SAM
PLE
C
OL
LE
CT
ED
cm
S
ite
Ce
-I
4 4
Cs-
13
4
Cs-
13
7
Ru
-10
6
A
0 -
I 0
.98
0
.97
0
.96
0
.98
S
ite
No
5 I
-I.
5
0.0
2
0.0
2
0.0
3
0.0
1
1.5
-2.0
0
.00
1
0.0
08
0
. o
I 2
-3
3-4
4
-5
Sit
e
No
7 0
-I
0.6
1
0.6
2
0.6
3
0.6
4
I -
5 0
.39
0
.38
0
.47
0
.26
B
0-1
0
.76
0
.66
0
.62
0
.42
R
-Sh
-8
I -I. 5
0
. IO
0
. 1
2
0.
I 5
0.2
0
Ste
pan
ov
ka
1.5
-2.0
0
. I
6 0
.21
0
.22
0
.38
2
-3
3-4
0
.00
3
0.
0 0
I 4
-5
R-S
h-9
1
-0
0.6
8
0.8
1
0.7
5
0.2
0
Kh
och
ev
a
I -I.
5
0.3
2
0.
19
0
.22
0
.80
1
.5-2
.0
0.0
02
0
.03
0
. 0
I 2
-3-4
-5
c 0
-I
0.6
8
0.6
2
Maly
e
Kle
sh
ch
i I
-2
0.2
4
0.2
2
2-3
0
.03
0
. 1
2
3-4
0
.02
0
.01
4
-5
0.0
2
0.0
2
w "' I-"

- 362 -
No particular differences were noted in the distribution of the longI ived radionucl ides in the 2 cm layer in the soi Is with different types of contamination, and no major change in the nuclide composition of the fallout had been noted by the end of 1988.
Furthermore, we fully established that there was a tendency for the general patterns of radionuclide migration in soi Is to be fol lowed, regardless of uptake source, i.e. accumulation in local geochemical barriers, concentration in the sod, I ltter and humic horizon, migration to 3-5 cm in sandy soi Is (Site 7) and of a hydromorphic nature during periodic flooding (M. Kleshchl).
Determination of the concentrations of radionucl ides in the mechanical fractions showed that a substantial amount was concentrated in the roots, in the earth around the roots and in the I ltter: up to 70-80% of the total activity in the 0-1 cm layer in the case of type A contamination, up to 40-50% in the case of type B and - 30% in the case of type C. This testifies to the increasing role of uptake of radionucl ides into plants via the roots, and to their increasing mobi I ity, i.e. to biogenic migration in the mass transfer of radionucl ides despite their apparent poor mob ii ity In biogeocenoses.
The dust and clay fractions of the soi I (< 0.25 mm) help to fix an average of up to 20% of the radionucl Ides in the crystal I ine structures of the soi I minerals and organic component. It was fully established that as the portion of this fraction increases, the maximum concentration of radionucl ides shifts upwards (Table 3, Fig. 1).
It is interesting to note that the caesium-134/caesium-137 ratio in soi Is with the quasi-fuel type of contamination varies from 0.23 to 0.55, apparently reflecting the various radionuclide occurrence forms and topographies in the fallout matrix, including isotope separation.
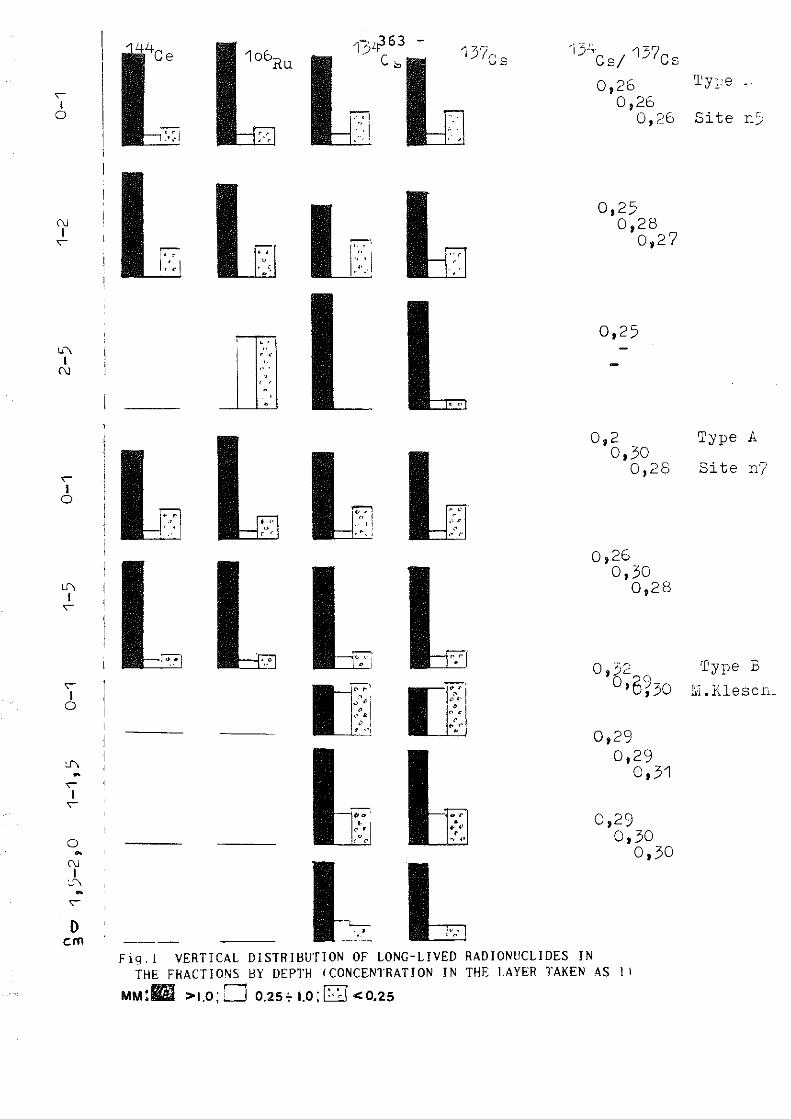
' I 0
(\j
I '
\J\ I
(\j
' I 0
\J\ I '
' I 0
' I '
0
0 cm
1?,Lf363 -c"'
I_ u
17>~; .,,, Cs
lL
'i34Cs/ 137cs
0,26 Ty,,e ·· 0,26
0,26 Site n5
0,25 0,28
0,27
0,25
0,2 0,30
0,28
0,26 0,30
0,28
Type A
Site n7
0,3220
Type B 01 0?30 Ll.Klescn.
0,29 0,29
0,31
0,29 0,30
0,30
Fig. l VERTICAL DISTRIBUTION OF LONG-LIVED RADIONUCLJDES IN THE FHACTIONS HY DEPTH (CONCENTRATION IN THE LAYER TAKEN AS l I
MM:D >1.0; 0 0.25':- 1.0; l=·~I <0,25

' I 0
' I '
0 -(\J I
,f\ -'
' I 0
LI\ -' I ' 0 -(\J I
Lf\
' 0 cm
14L:Ce
~ I/' ( 1
'er~ l . '
• , . •
' . .. ' ' ' • '
,. •
0 ' ' ' .
~ . ; ' ... • •" ,. ' ' ' .. ' .. • ' ' ,. . '
:Fig.1 (cont.)
- 364 -
I] c
' . .
' . ' '
lL
. ' ' ' ' • ,. ,. ' . ,
. " > . ' • '',, '
;· ,. .. c
' .. . , ,.
' ' ' ' ' ' ' .. ' " N
0 34 'u,46
0,54
0,31 0,25
0,30
0,28
0,28 0,25
0,26
o, 24 0,22
0,30
0,23 0,30
0,30
'I'ype B
R-S\i-8 l<ho,he0a
Type C
R-5\.,-j S~epa,(\ovl.<'.0v

- 365 -
The very weak migration of the radionucl ides which are at present the main cause of the radiation and radioecological situation in the contaminated areas, is explained primarily by the short space of time which had elapsed since the accident and the peculiarities of the radioactive contamination (emitted over 10 days) in the area, and, conseQuently, by the presence of a large number of hot particles (the highly distinctive feature of the Chernobyl disaster).
We examined two samp I es of soi I radioactive contamination types contamination.
of similar morphology affected by A and B fuel and quasi-fuel
The result of model I ing the processes of desorption of the radionucl ides caesium-134,137, cerium-144 and ruthenium-106 are given in Table 4.
As noted ear I ier, the fact that the radionucl ides concentrate in the roots and the soi I around the roots is evidence of their avai labi I ity for uptake by plants. For this reason we used only three eluents, since we believe that, in order to assess how available these elements are in the soi I for the plants, it is sufficient to determine the basic forms of radionuclide occurrence (water-soluble, exchangeable and mobile) which have a bearing on the soi I processes.
The investigations showed that over 70% of the radlonuc I ides studied are fairly strongly bound to the soi I complex, and that no more than 1-2% of each element is in the water-soluble form.
In the readily soluble form (after elutriation using ammonium carbonate, pH 7, and a 1M solution of hydrochloric acid) the various elements I ine up as fol lows: cer ium-144, caesium-134 > caesium-137, ruthenium-106, and in the mobile form they behave unconventionally. One would think that, as the most mobile, ruthenium-106 ought to be first in the sequence, not last. Evidently a role is played here by the presence in these samples of (hot) fuel particles rich in ruthenium and low in of cerium.
Consecutive elutriation reveals that the concentrations of the relatively firmly bound (and thus not readily available) radionucl ides in the soi I samples studied for contamination types A and B are as fol lows on average: cerium-144 0.26, caesium-134 0.25-0.45, caesium-137 - 0.24-0.40, ruthenium-106 - 0.30-0.70.
Conclusions
1. Regardless of the type of soi I and radioactive contamination the bulk of the long-I ived radionuclides/gamma-emitters is concentrated in the upper 0-1 (2) cm soi I horizon. As a coral lary to this, up to 1989 the boundaries of the contaminated areas had not changed from what they were immediately after the accident.
2. The maximum concentration of radionucl Ides Is found in the> 1 mm fraction - tillering nodes, roots, root matt, litter and soil around the roots - which is proof of the growing role of biogenic migration processes in the mass transfer of radionucl ides in biogeocenoses. The dust and clay fractions of the soi I fix the radionucl ides in the crystal I ine structures of the minerals and organic component of the soi I.

- 366 -
3. The caesium-134/caesium-137 ratio in soi Is with c:iuasi-fuel contamination differs from the calculated value, which might be due to differences in the topographies and forms of occurrence of the radionucl ides in the fallout matrices.
4. In the soils studied the radionuclides cerium-144, caesium-134,137 and ruthenium-106 are found in the relatively available form. In the low-solubi I ity state, depending on the type of radioactive contamination, the concentrations were found to be as follows: cer i um-144 O. 26, caes i um-134 O. 25-0. 45, caes i um-137 0.24-0.60, ruthenlum-106 - 0.30-0.70.
BIBLIOGRAPHY
V. P. I I in: Some geochem i ca I mi gr at ion mechan Isms of caes i um-137 in landscapes of the Byelorussian Polesye; Short Report of the Proceedings of the All-Union Conference on "Principles and methods of combined landscape and geochemical studies of radionuclide migration", Moscow, 1989, p. 33.
I . V. Mo I chanova, E. N. Kar avayeva, N. V. Ku I i kov: Rad i onuc I ides in geochemically connected parts of the landscape in the Chernobyl NPP zone; ibid., p. 40.
G. N. Bondarenko, A. G. Chekalova, et al.: Hot particles - morphology, material composition and mobi I ity of radionucl ides; ibid., p. 56.
B. A. Galushkin, S. v. Gorbunov, et al.: Distribution of fuel and condensed forms of radioactive fallout In the Chernobyl NPP zone; i b i d • , p • 59 .
E. P. Buravlev, s. K. Drich, et al.: Radionuclide redistribution mechanism in sol Is in the Chernobyl NPP 30-km zone; ibid., p. 75.
S. K. Novikova: On the question of vertical migration of radionucl ides in soi Is with various types of contamination in the Chernobyl NPP area; ibid., p. 80.
B. E. Serebryakov: Predicting vertical distribution of strontium-90 and caesium-137 on the basis of numerical model I Ing; Ibid., p. 85.
Yu. I. Bondar, G. s. Shmanay, et al.: Radionuclide forms in the soi I complex in the zone near the Chernobyl NPP; ibid., p. 91.

Tab
le
4:
MOD
ELLI
NG
OF
FORM
S OF
OC
CURE
NCE
OF
LON
G-L
IVED
RA
DJO
NU
CLJD
ES
BY
MEA
NS
OF
THEI
R CO
NSE
CUTI
VE
DES
ORP
TIO
N
~mre
e, (
nll
ec\.
,,"1
'. ..
! .
! Re
.fc,.h
0e
conr
, 11\-
-oJ
,aJ,
~~
de.
s
lJ.
tl
! E
luen
t !
Fra
cti
on
!
( •il,
\-i«f
Cow
:enh
<1.\i
oo
pri
o(
\.o p
(oC
ll."-
';~
~ -
1)
'-'i
·-1
,cm
I
-I
• I
· ·
mm
·
. .
! !
! C
e -1
44
C
s -1
34
C
c -1
37
H
u -1
06
Si\
i Jf,
5 >1
0
,99
0
,99
0
,99
0
,99
Sr
eA
Dis
till
, 0
,25
-1,0
0
,99
0
,99
0
,99
0
,99
0
-1
CM
Wate
r <
0,2
5
0,9
8
0,9
9
0,9
9
0,9
9
l _
2 CM
)2
-
0,9
b
0,9
9
0,9
9
I-2
-
0, 9
9 0
, 90
0, 9
9 ~
0,2
5-I
,O
--
0,9
9
0,9
9
_, <
0 ,
25
0 , 9
9 0
, 99
0 , 9
9 0
, 99
0 -
I CM
)1
O
,tJ4
0, 7
3 0
,85
0
,83
CH
3CO
ON
a 0
,25
-I,0
0
,80
0
,71
0
,84
0,
'70
pH
7 <
0,2
5
0,8'
7 0
,70
0
,89
0,
'70
)2
-O
,tJI
0,b
6
0,7
2
1-2
-
0,9
9
0,8
0
0,7
5
0,2
5-I
,O
--
0,9
9
0,9'
J <'
.0,2
5 O
,'?tJ
0,
8'7
0,9
0
0,7
2

Tab
le
4 (c
on
t.)
I 2
J 4
5 6
'7
0 -
I CM
>I
0,
26
0,3
3
0,26
0
34
, H
Cl
0 25
-1
0 '
' 0,
2'7
0,2
2
O,JO
1 M
<'
.0,2
b u,
22
0,2
4
0, lt
J l
-2
CM
>2
-0,
I'J
0, 1
9 O
,Jl
1-2
0,2
5-1
,0
(0,2
5
0,6
J -
0, 2
Ll
0' j
':)
R . K
rioc\
ieJo
.. >I
0
, ':1':J
0,98
0,
9b
0,98
w
°' t~
peB
Dis
till
. 0
,25
-I,O
0,
99
0,98
0
,9b
0,
9Ll
0,
0 -
I CM
';
Jate
r <
0,25
0,
99
0,99
0,
99
0,98
I
-I,
ti C
M
>I
-0,
99
0,98
0,
99
0,2
5-I
,O
<0
,25
U -
l CM
)1
U
,tJ6
0,'7
4 O
,b5
0 76
,
CH
,,CO
O!:
a :J
0
,25
-I,O
0
,'7
J
0,'7
8 0,
83
0,68
pH
7 ,(
0, 2
ti U
79
' 0,
'75
0 ,0
0 0,
'71

Tab
le
4 (c
on
t)
I 2
3 4
'. 0 6
'7
l -
1,5
CM
C
H3CO
ON
c1
>I
-0
,?6
0
,83
0
,?4
pH
7
0,2
5-1
,0
0,'7
5 0,
42
0,'7
8 0,
75
<0,
25
-0,
80
o,eo
0 -
I CM
)I
0,
34
0,45
0
,44
0,
6'7
0,2
5-I
,O
0,26
0,
33
0,46
0,
86
uG
l <
0,25
-
-0,
38
0,7
6
w
)1
0,4'
7 I
-1
,5 C
M
1 M
-
0,36
0
,52
"' \!)
0,2
5-1
,0
-0,
30
<0,
25

- 370 -

- 371 -
Comparative Analysis of Chemical Forms of Long-Lived
Radionuclides and their Migration and Transformation in the Environment Following the
Kyshtym and Chernobyl Accidents
A.V. KONOPLEV, T.I. BOBOVNIKOVA
Institute of Experimental Meteorology 'Typhoon' Science and Production Organization, Obninsk, USSR

- 372 -
ABSTRACT
This paper presents data from systematic research into the chem i ca I forms of occurrence of long-lived radionuclides In atmospheric fa! lout, soi Is, and bed sediments and suspended particles In water bodies in contaminated regions of the Soviet Union after the Chernobyl accident. The work concentrates on the ratios between the different forms of the most eco log i ca I I y hazardous rad ionuc Ii des 90sr and 137cs. The main specific feature of Cherne, .11 fa! tout was the presence of fuel particles, and this is what determined its subsequent behaviour, such fuel particles being found mostly in the zone close to the Chernobyl NPP. In the initial years fol lowing the accident the main feature of soi I contamination within the 30-km zone around the Chernobyl NPP was the large proport Ion of non-exchangeable forms present as compared to Kyshtym contamination and global fa! lout. This was due to the nature of the atmospheric fat lout, as more than 70% of the 137cs and more than 85% of the 90sr in the fallout in the town of Chernobyl was in nonexchangeable forms, whereas the radionuclide fa! lout in Kyshtym mainly comprised soluble compounds.
The difference in the forms of occurrence of the radionucl ides in the environment caused ·differences in their migratory properties (coefficients of washout, dispersion and distribution) and prevai I ing migratory patterns.
We ana I yse the mechanisms behind changes In chem i ca I forms in the environment, and determine rate coefficients for the main processes involved in the transformation of chemical forms from one to another. This work high! ights the need to take account of the processes involved in the transformation of radionuclide forms when studying and model I ing radionuclide propagation.

- 373 -
The distinctive feature of radioactive contamination of the environment fol lowing a nuclear accident is the multipl iclty of chemical forms of radionucl ides in atmospheric fallout, soi Is and water bodies. When a reactor bui I ding is destroyed, particles of nuclear fuel (U02) and the decay products in their composition are released into the environment. The rest of the radionucl Ides are deposited on the surface layer as aerosol particles formed in the atmosphere by condensation (condensation particles). These particles differ in their dimensions, chemical composition and behaviour in the environment.
Hot condensation particles generally have surface contamination and a lower specific activity than fuel particles. The properties of condensation particles are similar to those of particles formed in the last stage of a nuclear explosion and to the global fallout of radionucl ides in the period of nuclear weapons test Ing. This means that it Is possible to obtain a reasonably reliable forecast of the behaviour of radionuclides in the composition of condensation particles from data on the behaviour of global fallout.
The behaviour of fuel particles, which were the distinguishing feature of the Chernobyl trai I and were concentrated in the zone near the Chernobyl NPP, posed a serious scientific problem fol lowing the ace i dent.
In the case of the Kyshtym accident, radioactive substances in the form of I iquid pulp were ejected up to a height of 1-2 km and formed a cloud composed of I iquid and sol id aerosols. The radioactive substances in these aerosols were present in readily soluble compounds (nitrates) 1
In order to forecast the exchange of the many forms of radionucl ides between various components of the environment and their dispersion in the "soi I-water" system, they should first be divided up into watersoluble, exchangeable and non-exchangeable forms. These forms of radionucl ides were determined in soi Is, bed sediments, suspended material and atmospheric fallout by means of successive extractions:
1) the water-soluble forms were separated out by means of dist i I led water, the phase ratio being 1 :5;
2) the exchangeable forms were extracted with the aid of a 1N solution of CH3COONH4 , in the ratio of 1:8;
3) the non-exchangeable forms were separated out by boi I ing in a 6N solution of hydrochloric acid;
4) the firmly bonded, irreversibly sorbed forms were extracted by means of a mixture of hydrofluoric acid and nitric acid.
The soluble complex compounds of radionuclides and soi I components (in neutral or anionic form) and their cations (which are desorbed by the ion exchange mechanism) transfer to the aqueous extract. The concentration of radionuclide cations in the aqueous extract solution depends on the ion-exchangeable equilibrium, which is determined by the exchange capacity of the soil and the concentration of exchangeable Ions in solution. The main exchangeable ions in the soi I are ca2+, Mg2+, Na+ and K+. In the case of the soi Is in the zone around the Chernoby I NPP, the amount of exchangeab I e ca I c i um is gen er a I I y considerably higher than that of other ions.

- 374 -
Radionucl ides sorbed into the soi I by means of ion exchange transfer to the acetate extract.
Non-exchangeable forms of radlonucl ides, i.e. forms which do not transfer to water in the environment under normal conditions, transfer to acid extracts. The non-exchangeable form includes radionucl ides found in the composition of fuel particles and those known as 'irreversibly sorbed' forms (those in the crystal lattice of minerals and radionuclide-organic compounds with an Insoluble natural organic substance).
Table 1 shows data on the chemical forms of the most ecologically dangerous radionucl ides - 137cs and 90sr - In atmospheric fallout during the period of radionuclide release from the damaged reactor between 26.04.86 and 10.05.86. It Is evident that the composition of the fallout changed considerably during the accident period. These changes were caused by physlco-chemical processes in the damaged reactor and In the atmosphere once the radioactivity had been released from the reactor.
After being deposited on the ground surface, the water-soluble component of the radionucl ides interacts with the absorptive soi I complex, is sorbed onto particles and is involved in a complexing reaction.
After 90sr is redistribution
deposited of mobile
on and
the soil, non-mobile
there forms.
Is no significant The water-soluble
fraction offal lout switches primarily to the exchangeable state.
The situation is completely different for 137cs. After the watersoluble fraction of the 137cs fallout is absorbed by the soi I complex, it switches to the exchangeable form, which is then rapidly fixed, however, as it switches to the irreversibly sorbed state due to its being incorporated into the crystal lattice of the minerals. The model experiments we carried out immediately after the Chernobyl accident in the summer of 1986 showed that it normally takes several dozen days for 137cs to become fixed in the soi I. These values tally with those obtained for 137cs from global fallout and other sources.
The sum total of the radionuclide transformation processes in the "soi I-water" system may be shown schematically as fol lows:
where
----A3 A A' --------
1 -- nt ------------- A A• ' l
( 1 )
A1 ... At t AJ-. A::,.,. A'-t - Ao A0 is the overal I content of the radionuclide A1 is the radionucl ides in the composition of the fuel particles A2 is the cation form of the radionuclide in solution A~ is the rad i onuc I ides absorbed by the soi I in ion
exchange A3 is the irreversibly sorbed form of the radionuclide A4 is the dissolved complex compounds of the radionuclide K is the constant for the ion-exchange equi I ibrium Kij is the rate constant for the corresponding
transformation process.

- 375 -
The main forms of occurrence of rad i onuc I ides shown in this diagram
differ considerably in their migration mechanisms and rates. The A2 and A4 forms migrate with water in solution, but the rate of movement
of A2 is
considerably lower than that of A4 , due to moderation of adsorption
and desorption under ion-exchange Interaction with the solid phase.
The A1 , A2 and A3 forms migrate only with particles in whose
composition they are present. The main movement processes for these
forms are the transport of suspended load (In water courses and
reservoirs), and seepage through pores, fissures etc. and what are
known as 'biomixlng processes' (in sol I and bed sediments).
When descr I bing the mlgrat ion of radionucl ides, it Is essential to
consider the movement of each form separately. Moreover, it is
necessary to take into account the on-going processes of transformation
between forms, i.e. the mutual transfer of one form to another.
The equations which describe radionuclide migration in soi I and bed
sediments in this case are as fol lows:
( 2)
and boundary conditions of
AJ ==-o L )(:c,P
where Di and 1X' are the effective coefficients of migration of each
form. Experimental studies in the Chernobyl accident area have shown
that\X::o o for fuel particles. The rate of convective movement of the
dissolved radionucl ides is determined by the moisture infiltration
rate.
The exchangeable
retention factor
The magnitude of
forms migrate with the infiltration flow, their
depending largely on the distribution coefficient.
the distribution coefficient for cations in the
radionucl ides Is determined by the exchange capacity of the sorbent
(soi I, bed sediments) and the concentration of exchangeable ions
(Ca2+, Mg2+, Na+, K+) in solution.

- 376 -
In the case of the Kyshtym accident, the main long-lived radionuclide responsible for contamination was 90sr. The 137cs content in the mixture of fission products amounted to less than 1%.
In the Chernoby I NPP near zone the I eve I of 90sr and 137 cs contamination was about the same, whereas at greater distances from the Chernobyl NPP the contamination was caused primarily by 137cs.
Table 2 [ll shows the amounts of 90sr various types of soil in the seventh year The proportion of the exchangeable form relatively high, ranging from 72 to 96%.
in exchangeable forms in after the Kyshtym accident. in the upper soi I layer is
No significant change over time in the forms of occurrence of 90sr from the Kyshtym ace i dent was observed. 90sr is found pr imar i I y in the exchangeable form and only an insignificant part of it transfers into mobile complex compounds with organic soil substances. Fixing and transfer of the exchangeable form into the non-exchangeable form do not play a major role for ~Osr.
For the purposes of comparison, Tables 3 and 4 provide data on the amounts of the various forms of 90sr and 137cs in the main soi Is of the 30-lcm zone around the Chernobyl NPP in 1986-87 [2]. The high proportion of non-exchangeable forms of 90sr in the initial years after the accident in the soi Is of the Chernobyl NPP near zone stemmed from the fact that most of this radionuclide was deposited in the form
of fuel particles.
As time passed after the accident, the fuel particles broke down, thus effectively increasing their surface area in contact with the aqueous medium, and an additional quantity of radionucl ides transferred into solution (see Fig. 1). This led to an increase in the proportion of exchangeable forms of 90sr. Experiments concerning the content of the forms of occurrence of 90sr and 137cs in the main soi Is of the 30-lcm zone around the Chernobyl NPP made it possible to establish the constant for the rate at which these radionucl ides leached from fuel particles (K1 2) and the constant for the 137cs fixation rate (K23 ). The figures obtained are shown In Table 5. Table 6 contains figures on the effective dispersion coefficients of the exchangeable and non-exchangeable forms of 90sr and 137cs in soi Is in the 30-lcm
zone around the Chernobyl NPP.

- 377 -
Fig. 1 shows experimental profiles for various forms of 137cs in soddy-podzo Ii c soi I 700 days after the ace i dent and the resu I ts of model calculations. Fig. 2 illustrates the migration of exchangeable forms of 90sr and 137cs in this soi I, account being talcen of their transformation processes.
The transfer of radionucl ides into surface runoff is the most important process In their egress from contaminated territory into water bodies. The washout coefficient, which Is eQuivalent to the proportion of the radionuclide in the soi I entering the water body with surface runoff, defines radionuclide washout. It is best to examine separately the washout of radionucl ides in dissolved form and in suspension-sorbed form. ,.
I< = I C\l,(i)Q(t)dt
t Jcsds s
,. J Ca.(t)Q(t)dt
l<s= o JCsdS s
( 3)
where K1 and Ks are the coefficients of "liquid" and "solid" washout, Cw is the concentration of the radionucl Ide in the runoff
solution,
Ca Is the concentration of the rad ionuc Ii de on the suspensions,
Cs is the sol I contamination level at the surface, s is the area of the catchment area, T is the duration of runoff. Q is the intensity Of runoff, M is the intensity Of removal of suspensions.
In order to compare the results of the experiments with various hydrological scenarios and use them to forecast secondary contamination of water bodies, K1 and Ks can be related to the main hydrological features of runoff: K1 over the runoff layer and Ks over the mass of suspensions removed from one unit of area:
(4)
where h is the runoff layer, m Is the mass of suspensions removed from one unit of area, and Cw, Ca and Cs are the weighted mean concentrations in solution and on suspensions and the weighted mean amount of the radionuclide In the catchment area.
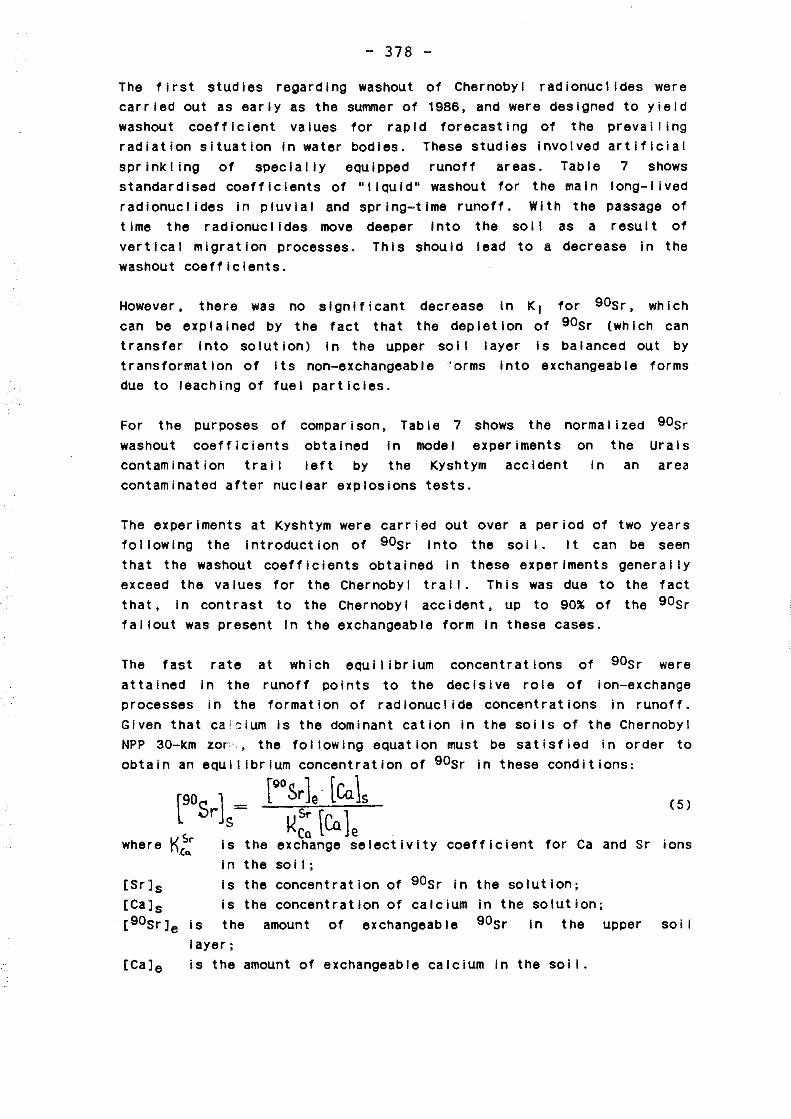
- 378 -
The first studies regarding washout of Chernobyl radionuclldes were
carried out as early as the sunvner of 1986, and were designed to yield
washout coefficient values for rapid forecasting of the prevai I Ing
radiation situation in water bodies. These studies involved artificial
spr ink I i ng of spec I a II y equipped runoff areas. Tab I e 7 shows
standardised coefficients of "liquid" washout for the main long-lived
radlonucl ides in pluvial and spring-time runoff. With the passage of
t lme the radionucl Ides move deeper Into the soi I as a result of
vertical migration processes. This should lead to a decrease in the
washout coefficients.
However, there was no significant decrease in K1 can be explained by the fact that the depletion of
for 90sr, which
90sr (wh I ch can
transfer Into solution) In the upper sol I layer is balanced out by
transformation of its non-exchangeable ·orms Into exchangeable forms
due to leaching of fuel particles.
For the purposes of
washout coefficients
contamination trail
comparison,
obtained
left by
Table 7 shows the normalized 90sr
in model experiments on the Urals
the Kyshtym accident in an area
contaminated after nuclear explosions tests.
The experiments at Kyshtym were carried out over a period of two years
following the Introduction of 90sr into the soi I. It can be seen
that the washout coefficients obtained in these experiments genera I ly
exceed the values for the Chernobyl tral I. This was due to the fact
that, In contrast to the Chernobyl accident, up to 90% of the 90sr
fallout was present in the exchangeable form in these cases.
The fast rate at which equl I ibrium concentrations of 90sr were
attained in the runoff points to the decisive role of ion-exchange
processes in the formation of radionuclide concentrations in runoff.
Given that ca!~ium is the dominant cation in the soi Is of the Chernobyl
NPP 30-km zor , the following equation must be satisfied in order to
obtain an equilibrium concentration of 90sr in these conditions:
[Srls
[Cals [90srJe
[Cale
[90$r}e· [Ca1s
I( Sr r Ca.] Cn l e
(5)
is the exchange selectivity coefficient for Ca and Sr ions
In the soi I;
is the concentration of 90sr in the solution;
is the concentration of calcium in the solution;
is the amount Of exchangeable 90sr In the upper soi I
layer;
is the amount of exchangeable calcium In the soil.

- 379 -
In accordance with (5) the concentration of 90sr in runoff should,
for the same soi Is, be directly proportional to the concentration of
ca. Experiments showed that the concentration of 90sr In runoff
depends on the amount of Ca in runoff (Fig. 3).
During snowmelt runoff (in contrast to pluvial runoff), we observed
that the concentration of 90sr is largely dependent on runoff
Intensity (see Fig. 4). This can be explained by the fact that when
the sol I Is partly frozen some of the water flows off without touching
the soi I, which reduces the 90sr concentration In the runoff. In
this case c90srJs is not directly proportional to [Cals (see Fig.
5).
Where [Cals1
thawed soi I;
(6)
is the concentration of calcium In water flowing over
[Cals2 is the background concentration of calcium in snow.
When the upper soi I layer has fully thawed, runoff continues due to the
previously frozen water being released in the soi I and to
precipitation. The 90sr concentration therefore remains constant and
is not dependent on runoff intensity, as In the case of pluvial runoff.
The distribution coefficient (Kdl, which is the ratio between the
concentration of the radionucl Ide in the sol id phase and its
concentration in solution, is the most Important value for describing
and forecasting the behaviour of radionucl Ides in water bodies. The
Kd value depends primarl ly on the radionuclide's chemical nature, the
adsorption mechanism and the phys i co-chemi ca I characteristics of the
sol id material determining Its adsorption properties.
Each chemical form of the radionucl Ide has a specific Kd value.
Thus, in the case of soluble complex compounds of radionucl ides and
fulvic acids (A,il, the Kd is close to zero because these compounds
are not easily sorbed and exist primarily in solution. The
distribution of the Ionic form

- 380 -
of the radionuclide Is governed by the processes of ion exchange and, as a rule, the Kd for 90sr ranges from several units to several tens of un I ts. The Kd for non-exchangeab I e forms is very high ( > 1 000). The actually observed distribution coefficient is the weighted mean of the contributions from the various chemical forms of the rad lonuc Ii des.
In the case of Chernobyl radionucl ides, the effective Kd value for 90sr In the "suspensions-water" system is between 50 and 1 000, and for 137cs it ranges from 1 ooo to 100 ooo.
The significant difference In the values of the 90sr and 137cs distribution coefficients Is caused by the difference in the predominant adsorption processes affecting these radlonucl ides. Reversible adsorption via Ion exchange Is characteristic of 90sr. Processes of fast fixation as a result of incorporation Into the crystal lattice of minerals are characteristic of 137cs.
The presence of major increase composition.
fue I part I c I es In the Chernoby I re I ease I eads to a in the Kd value for each radionuclide in its
The ratio between the phases (solutlon:sol Id phase) has a considerable influence on the magnitude of the distribution coefficient. The Kd increases when the ratio between the phases increases. The results of model experiments to study this relationship for 90sr are shown in Fig. 6. The same relationship Is observed for other radionucl ides as well. The fact that the Kd Is dependent on the ratio between the phases explains the considerable difference between the Kd for the "bed sediments-water" system and that for the "suspensions-water" system.
It should be pointed out that in the case of low phase ratios the adsorption-desorption equilibrium is reached far more slowly than in suspension, where desorption equi I ibrium is attained after no more than 15 minutes. A temperature change (within the range 4-45'C) has no significant influence on the Kd value.
Table 8 shows the average values for the distribution coefficients of 90sr and 137cs in the "suspensions-water" system of surface runoff in catchment areas of the 30-km zone around the Chernobyl NPP after the accident. The ratio between the phases in the surface runoff was more than 1 000.

- 381 -
BIBLIOGRAPHY
1. Research conclusions and experience in dealing with the conseQuences of accidental contamination of an area with uranium fission products; Editor: A. I. Burnazyan, Moscow, Energoatomizdat, 1990 , 144 pp .
2. A. V. Konoplev, et al.: Distribution of radionucl ides deposited in the "sol I-water" system fol lowing the Chernobyl accident; Meteorologiya i Gidrologiya, No. 12, 1988.
3. V. A. Borzi lov, A. V. Konoplev, et al.: Experimental research on the washout of radlonucl ides deposited on the soi I fol lowing the Chernobyl accident; Meteorologlya i Gidrologlya, No. 11, 1988.
4. A. V. Konoplev, A. A. 8ulgakov, I. G. Shkuratova: Migration of certain radioactive products In the soil and surface runoff in the Chernobyl NPP zone; Meteorologlya i Gidrologiya, No. 6, 1990.
5. A. A. Bulgakov, A. V. Konoplev, et al.: Dynamics of the washout of long-I ived radlonucl Ides from the sol I by surface runoff in the Chernobyl NPP area; Pochvovedenie, 1990, No. 4.
6. v. V. Pisarev, et al.: Washout of 90sr from the topsoi I by surface waters; Pochvovedenie, 1972, No. 3, pp. 66-75.
7. F. Ya. Rovinsky, et al.: Transfer of radionucl Ides into water and their migration capacities as a corollary to the peaceful use of atomic energy; In the book entitled "Radioecology of aquatic biota", vol. 2, 1973, Riga: "Zinatne", pp. 20-29.
8. Ts. I. Bobovnikova, K. P. Makhonl<o: Migration of 90sr in inland freshwaters, Ibid., pp. 30-35.
9. V. E. Popov, L. P. Vyrodova, I. V. Kutnyal<ov: Effect of change in the ratio between the I iquld and sol id phases on the 90sr desorption equilibrium in solutions of alluvial soddy acidic soi I; transactions of the IEM, 1990, issue 17 (145), pp. 85-94.

Dat
e o
f ex
po
sure
W
ater
-A
cet.
so
lub
le
exch
.
25
-26
.04
4
.3
25
.8
26
-27
.04
1
4.3
4
.9
27
-28
.04
0
.3
4.3
2
8-2
9.0
4
5.9
2
6.2
2
9-3
0.0
4
3.4
14
. 8
1.2
.05
13
.0
2
2.2
2
-3.0
5
7.8
19
. 7
3-4
.05
1.
3
11. 0
21
-23
.06
1.
2
1. 7
6
25
-26
.06
3
.4
3.4
2
6-2
7.0
6
3.
1 3
.5
Tab
le
1
Che
mic
al
form
s o
f 13
7cs
and
90
sr
fall
ou
t,
Ch
ern
ob
yl,
19
86
13
7cs
, %
9
0sr
, %
To
tal
Aci
d U
nd
isso
lved
W
ater
-A
cet.
T
ota
l A
cid
mo
bil
e ex
ch.
resi
du
e
solu
ble
ex
ch.
mo
bil
e ex
ch.
30
. 1
24
.0
21
.3
0 0
0 3
7.5
1
9.2
3
0.9
2
4.2
1
.0
1. 5
2
.5
80
.2
4.6
-
-0
1. 8
1.
8
85
.2
32
. 1
27
. 1
5.9
6
.3
21
.0
27
.3
65
.1
18
.2
42
.2
3.2
1.
0
5.0
6
.0
91
.0
35
.2
55
.4
5.0
4
.0
9.0
13
.0
8
2.3
2
7.5
5
5.4
0
.9
1. 3
3
.6
4.9
9
2.0
12
. 3
34
. 1
-0
.72
7
.9
8.6
8
8.6
2.9
6
85
.4
10
.7
0.2
1
. 5
1. 7
9
3.4
6
.8
80
. 1
5.9
-
--
-6
.6
86
.4
4.3
-
--
-
Un
dis
solv
ed
resi
du
e
62
.5
17. 7
13
. 0
7.6
3
.0
5.0
3
.0
2.8
4.9
- -
w
ex, "'

- 383 -
Table 2
Percentage of exchangeable forms of 90sr
in various types of sol I in the 7th year after
the formation of the Kyshtym trai I 1
Exchangeable strontium as a percentage
Type of soi I of the tot a I quantity of strontium
Soddy-podzo I i c 95
Grey forest 89
Leached chernozem 86
Meadow solod 79
Solonchak 72
Marshy 76

- 384 -
90 Sr chemical forms in soils •R
Table 3 f'I-,. Cise,,..~J/ Nff '3o-l::M
~o"'e..., 1?86-l'!l!'~ 1988)
(after Konoplcv A.V. et al.,
Soil type
Date .s • ...,,. c.c,11 .... ~.J
Watersoluble, %
1. podzol 16.07.87 0.06±0.02
0.67.±0.12 2. modera- 09.07.87 tely podzolic
3. " 09.07.87 0.72+0.03 0.18+0.06 0.39+0.25
" 15.07.87 5. slight- 09.07.87
ly pod-zolic
6. sod_pod-14.07.87 zolic
0.10+0.05
7. culti- 15.07.87 0.04±0.01 vated
8.
1 o.
11.
12.
land
" " " " "
13.07.87 0.40+0.14
12.07.87 0.05±0.02
15.07.87 0.06,±0.01
11.07.87 0.4 .±0.1
24.07.87 0.5 ,±0.1
13. primary 14.07.87 0.8 ,±0.1 sandy
14. sod- 20.11.86 0.8 ,±0.5 alluvial
15.
16.
17.
18.
19.
20.
" " "
" "
"
13.07.86 1.0 +0.8
10.01.87 0.2 .±0.1
16.07.87 0.1 +0.02
17.07.87 0.1 +0.04
08.07.87 O.J ,±0.1
12.07.87 0.3 .±0.1
Exchangeable, %
11.1.±3·2
35.4+7.5
34.0.±2-4 16.1,±2.6
23.4.±5.1
Non-e.xc1, .. ....,1table, %
88.8,±3.2
64.0+7.7
65.2.±2.5 83.8,±2.7 76.2,±5.4
23.9.±3·9 71.8,±1.6
7-5.±2.5 94 .±5
8.0±0.25 92 .±1
15.3.±1.8 84.3±1.8
38.8+2.l 60.7,±2.0
13 ,±11
13.6.±2.6
5.5±2.8
24.9.±3•0
31.8.±5-4
30.5+0.6
94.5.±1.0
75.2,±5.3
86 ±12
86.2,±2.6
94.4.±2.8
75 +2
67.9±5.5
69.2+0.7

- 385 -
Table 3 (contin.)
s.~ .. Soil Date Water- Exchange- Non-e.,cclteA3e -No type s .. .., .•
c.lle.deJ soluble,% able, % able,%
21. meadow 08.07.87 O.l+0.02 23.2,±2.7 72.7.±2,9 alluvial
22. sod 16.07.87 0.8+0.1 7.2±0.2 92 ±2
23. swamp 08.07.87 alluvial
3,2,±0,3 31.1+1.6 65.7±1,8
24. II 08.07.87 4,5±0,5 23,5±3.2 72.0.±3.3

- 386 -
Table 4
137 Cs chemical forms in soils '" ,-,..,._ c1ie, ... ~ll ""
'3o-k"' 2 .,,.., , 1q 86:... I "I 8-:+-- ( af'.;er Kcmopl e.v A. V.
S,rc. No
et al., 1988)
Soil type
Date .so ... plt c..1/utd/
Wateraoluble,%
4 moderately 15.07.87 0.9..±0.5 podzolic
5. slightly 09.07.87 podzolic
7. cultivated 15.07.87 o.;,..±0.1 land
8.
10.
11.
11
"
" 14. sod
alluvial
15.
19,
" II
13.07.37
15.07,37
11. 07. 87 ,
20.11.86
13.07.86
13.07.86
1.0+0.2
0,1..±0.02
0.6.±0.2
o.1+0.02
0.2..±0.02
0.2..±0.05
23. swamp 08.07.87 0.1 alluvial
24. 11 08.07.87 0.1
Exchangeable,%
5.2.±0.2
6,3,±0,l
10 .±1
8,9..±0.6
6,9.±0,3
1.7+0.4
.4.7+0,6
0.6.±0,1
1,5
0.5
Non·- e.,ccJ,a .. je
able, %
93.5.±5,0
89 ..±1
91 + 1
92,5+2.5
98.2+0.4
99.2..±0,2
98.4
99.4

- 387 -
Table 5
Constants of rate of 90sr and 137cs leaching from fuel particles and of
137cs fixation in various soi Is of the 30-km zone around the Chernobyl NPP
Site Place Type of soi I K12/day K23/day
number
1. Chernoby I Soddy, SI ightly 1. 5 -10-3 1.s-10-2
podzo Ii c
2. Benevka Alluvia I, soddy, 1. 7 -10-3 1.2-10-2
acidic
3. Kopachi Slightly podzol ic 4 -1 o-4
4. Korogod Soddy-podzo I i c 3.6·10-3 1. 5 -10-2

Pla
ce s
ampl
e to
ken
1.
Tow
n o
f C
hern
obyl
2.
Set
tlem
ent
of
Ben
evko
3.
Set
tlem
ent
of
Kor
ogod
Tob
ie 6
Eff
ecti
ve
mig
rati
on
co
eff
icie
nts
fo
r ex
chan
gea
ble
an
d n
on
-ex
chan
gea
ble
fo
rms
of
90sr
an
d 1
37
c,
in c
ert
ain
so
i Is
of
the
3o-k
m z
one
arou
nd
the
Che
rnon
byl
NPP
Typ
e o
f so
l I
190s
, l
10--
8 c.
;i Is
,1
37
c,1
10
--8
c.;i
/s
Exc
hong
eobl
e N
on-e
xcha
ngea
ble
Exc
hang
eabl
e N
on-e
xcha
ngea
ble
form
fo
rm
form
fo
rm
Cu
ltiv
ated
, oo
ddy-
5.4
+ 2
.0
2.8
+
1.2
2
.6 +
0.6
1
.9 +
0.6
podz
o I t
c.
san
dy
Al
luv
lal,
ao
ddy,
3
.2 +
1
.0
2.
1 +
0.6
1
.6+
1
.1
1.4
+ 0
.5
acld
tc.
sand
y-lo
om
Cu
ltiv
ated
, oo
ddy-
2.1
+0
.5
1.5
+ 0
.8
2.
1 +
0.6
1
.5 0
0
.5
po
dzo
llc,
sa
nd
y-
loam
w
(X)
(X)

Sit
e L
ocat
ion
nu
rrbe
r
Se
t ti e
men
t o
f 1
Do
vlyo
dy
" " " "
Se
tt le
mo
n\
of
4 B
enev
ka
"
Set
tlem
ent
of
4 B
enev
ka
Se
ttle
me
nt
of
5 K
op
ach
l
Se
t ti
omen
\ o
f 6
Kor
ogod
Kys
hty
m
Nuc
lear
ex
plo
sion
s
Co
eff
icie
nts
o
f "li
qu
id"
wa
sh
ou
t o
f c
ert
ain
n
uc
lea
r fu
el
fis
sio
n
pro
du
cts
,
sta
nd
ard
ize
d
by
ru
no
ff
lay
er
Dat
e ,o
-5rr
m -
1
137c
5 13
4cs
103R
u 10
6Ru
Plu
vial
ru
nof
f
16
.07
.86
3
.4 +
1
.2
3.5
+
1.3
-
0.7
+ 0
.3
12.
10. 8
6 1
.6+
0.7
1
.3 +
0.6
1
.6 +
0.8
-
" 0
.5 +
0.2
0
.4 +
0.2
0
.7 +
0.4
-
" 1
.4 +
0.5
1
.3 +
0.6
-
-"
0.6
+ 0
.4
0.4
+ 0
.3
--
14
.10
.86
0
.6 +
0.2
0
.6 +
0.3
-
-1
0.8
7
0.3
+0
.1
0.3
+ o
. 1
--
Snow
mel
t ru
nof
f
Mor
ch
-Ap
r I I
19
87
0.2
+0
.1
0.3
+ 0
.2
-0
.3 +
0.2
" 0
.4 +
0.
1 0
.3 +
0
.1
--
" 5
.7 +
2
.5
5.0
+ 2
.4
-0
.7 +
0.3
" 0
.7 +
0.4
-
-
--
--
--
--
144c
0
-0
.6 +
0.3
-0
.5 +
0
.3
- -0
.2 +
o
. 1
0.2
+ o
. 1
0.5
+ 0
.4
0.4
+ 0
.2
0.6
+ 0
.2
- -
To
bie
)
90
s,
10
+ 4
8
.4 +
2
.8
8.4
+ 3
.0
6.5
+ 2
.0
5.2
+
1.7
5.8
+2
.1
18
+ 0
.4
0.6
+ 0
.3
1.1
+
0.3
6
.6 +
1.6
0.8
+ 0
.3
13
83
w
co "'

Site 11.iumber
1 .
2.
3.
4.
- 390 -
Coefficients of distribution (Kd) of 90sr and 137cs in surface runoff, 1986 2
Date Kdc90sr)
16.07 293
.. 1 240
12. 10 317
" 534
18.07 -14.10 493
.. 325
Table 8
Kc! (1~1Cs)
2 380
9 870
2 380
3 800
370
4 760
3 100

Ai, 0,8 cm- 1
0,6
0,4
0,2
0
A2, 0,2 cm-•
o. i5
0.1
0,05'
0 0
A3, 0,25
cm- 4
0,2
0,i5
0,1
0,05
0
1 j + - 391 - Cs Q
]) -l/ 2. 1=3.5·10 Cl'l"l/da~
]) -4 . 2.,. 5.0· 4 0 crn2
/ daj
D -4 ;. 3,. i.S. iO cm d"'~
fl, cm 4
V1= V3::. 0
8' -l/ V2 = 3. 10 c.mµa~
k12 = 1.5 · i O~'do~ 1
k -i/ I 23:f,-10day
ft cm 0 1 2 3
, A1 = D.6 g
b 0
A2 =0.21 0
A3 = o.os
1 2 3 4
o± model a.n...il e.xper-tmen.tal
Jor d i~eren...t chemica~ jOf'rr
d~ a.{tu- +he. a.cc'1clen-t<:J

- 392 -
-l A
2 ,cm O,!i
go Sr- Q.
- ~ '2. )),= °!..5· 10 C:.M /do.'j
0,J.\ )) - 4 2.1
2. 2. = 1-.0·IO C.1"'1 cl~
o.~ V1=-V'!.=O
-11 I V2.=3·\0 c.~ d°''.j k -!,J I
IZ.::. f~ • /0 <a.j -
0,2 k.,a3 = 0 A1 = o, a,
0,1 A; = o, 15" Ao
.3 == 0
0 h, cm 0 4 6 8
-i A2,cm 0,2 .--------------.
i~1 cs O,lS
0, i
0,05
0
0 2 4, 6 8
F~.2: Mod<le. ve,-\:ic.o.L rr-o} i ~<; O_t V(c..ha....,~~
:S-°'""ms of 90 Sr-(a..) CU1.-oi-131
Cs ( ~) OYL "foo ... (1.), 140011,(2
t1AJ '2.lool!.(!.) d~ a.f-\:u- -lk. .etcci.J~~t.

.,j -·-u
.! • 0 -
20
iO
Fig,3:
- 393 -
0
0
0
10 20 30
Experimental dependence of- 'fOs,-
runoff concentration on Ca concentration
in solution

m ~4 ....... .-I •
Q)
t,O
~ q,; .Cl () m
"'1 'O
'H 'H o.?. 0 § ~
0.1
- 394 -
partially frozen co ... 1ltl~'Y h,o ... u 1Afpt.I l•1e.r ,i .so·,l
~ \ 9 \ I
I 9 I I
, I ti
18.03
Fig. 4;
0
0 0 -0-----------. -0 0
0 0
0
19.03 20.03 21.03 22.03 23.03 24.03 Time, days
Dependence of 90sr concentration on runoff
inte11si ty c:t'-'''"-' S"DIJ ..,.~,~
runoff discharge
90sr cone entration in solution of runoff.
...>
0 0 -l s

.., -u .2 • 0 -... _, ~
Cf.l 0 (J'\ .___.
- 395 -
12
40
a
6
4
2 4
••• • • •
•
6
•
• •
•
8
Fig. 5: Dependence of 9°sr concentration on Ca
concentration J,..riAJ c;;;;io1,1t-1il~ runoff when
soil is partially frozen
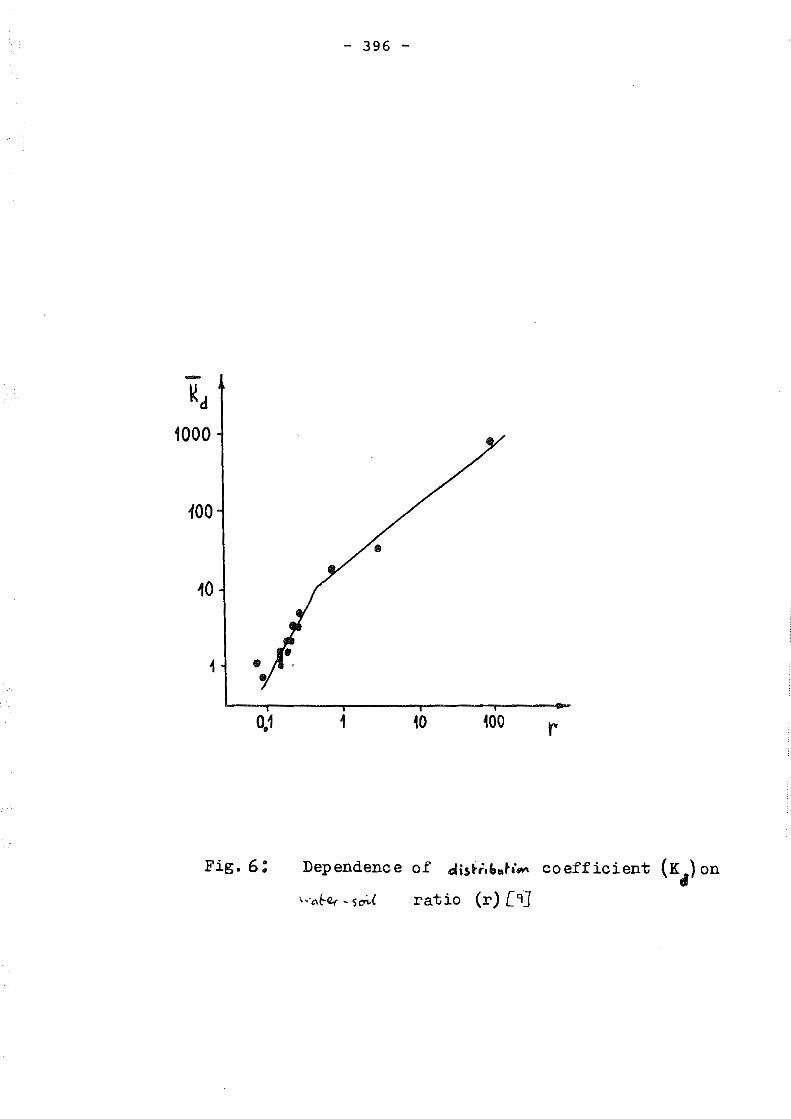
-~d
1000
100
10
0,1
Fig, 6;
- 396 -
•
1 10 100
Dependence of c:li$~;,1,.t;.., coefficient (Kcf) on
ratio (r)[9]

- 397 -
Behaviour of Pu-239 and Pu-240 in Soils Following the Southern Urals and Chernobyl Accidents
F.I. PAVLOTSKAYA, T.A. GORYACHENKOVA, V.V. YEMELYANOV, I.E. KAZINSKAYA, E.M. KOROBOVA, B.F. MYASOYEDOV

- 398 -
ABSTRACT
In addition to determining the plutonium content of sol ls we focused our attention on studying its forms of occurrence and migration in topsoi I, comparing the data obtained with other sources relating to plutonium deposition on the earth's surface.
The study revealed that plutonium is quickly and lastingly absorbed by soi Is, and that Its distribution between water-soluble, exchangeable, mobile, amorphous and silicate forms (as well as between the various components of organic and inorganic soi I matter) is determined by soi I type and deposltic source.
It was shown that µlutonium distribution and migration in the landscape and soi Is is deter~ined by their location, type, genetic structure, species of vegetation and other natural factors, as wel I as forms of uptake and occur ranee in soi Is. We es tab I I shed zones of p I u ton i um removal and plutonium presence in geochemical barriers.
soi Is: the of plutonium
(with migration
We established two types of plutonium transfer in predominant, slow mode (which accounts for 65-100% transfer in the various soi I types), and the rapid type coefficients one or two orders of magnitude greater).
The depth, coefficients and intensity of plutonium migration in soi Is increase with increasing amounts of water-soluble organic matter and light mechanical fractions, as well as In more hydromorphic soils containing higher concentrations of carbonates.
We evaluated plutonium removal from the surface horizons of various types of soi I, and established that such layers are cleansed naturally, mainly via vertical migration through the soi I profile.
The data obtained on the forms of plutonium occurrence and distribution in soi Is helped explain the observed processes and mechanisms governing Its migration in the soi I profile, leading us to conclude that "Southern Urals" and "Chernobyl" plutonium does not behave in a specific way: such behaviour depends both on the forms of occurrence and landscape-geochemical conditions. The only difference could be in the rate of migration of plutonium when It Is deposited on topsoi I together with finely dispersed fuel. particles.

- 399 -
This article contains a summary of the results of investigations into the behaviour of plutonium in soi Is fol lowing two accidents which differed with regard to the radionuclide and chemical composition of the material released. The study of the processes governing the distribution and migration of plutonium, apart from its radioecological significance, Is Important for our understanding of the radiogeochemistry of this element, whose isotopes are unstable under natural conditions.
Since the Southern Urals accident was the result of a fault in a container for storing highly radioactive waste from the production of plutonium, It was Important to evaluate the amount of this element in the surrounding area and determine Its distribution characteristics in soi Is.
The investigation showed that, compared to 90sr and other fission products, there were only traces of plutonium fallout, most of which was concentrated close to the site. At a distance of a few kilometres, the plutonium content In soi Is was close to normal background levels. The 238pu;239, 240pu ratio in soils was 0.03-0.05.
Over the course of 24-26 years there was noticeable plutonium migration to deeper soil horizons (Fig. 1); between 47-82% and 82-97% of plutonium fallout remained in the upper 0-5 (8) and 0-18 (20) cm layers respective I y, depending on soi I and p I ant cover type. For ex amp I e, the depth of migration in meadow-chernozem soi I on carbonate loam (final profile) where plutonium was observed at a depth of 45 cm, is due not only to the hydromorphic nature of the soi I but also to the formation of soluble carbonate compounds. The influence of the genetic structure of the soi I profile was seen most clearly in grey forest soi I under park-type birch forest (first profile). The plutonium removed from I itter and then from the eluvial horizon A2 accumulated in humlc and i I luvial horizons. In other soi Is there was also a tendency towards secondary migration of plutonium at a depth of 13 (14) - 18 (20) cm.
The ratio between the plutonium content In grasses and soi I in meadows and under forest cover is close to that for other contamination sources (Tab le 1).
The plutonium content in soi Is in the European part of the Soviet Union fol lowing the Chernobyl accident varied, according to distance and direction from the power station, from a few dozen to four thousand Bq/m2 outside the 30 km zone and from tens to hundreds of thousands within it. The considerable patchiness and diversity of plutonium content in the sol ls of a single region and even of a single sample resulted not only from the laws governing atmospheric transfer and fallout onto the earth's surface, but also from the presence of particles of different sizes and different radionuclide and chemical composition.
The average 238pu;239, 240pu ratio aerosol and fallout samples examined and 0. 35), a I though in some samples values of 0.01-0.05 were noted. contaminated either by fresh fuel or from the accident. such sites were the Chernobyl NPP.
In the majority of the soil, was 0.3 (variations between 0.25 it was lower than 0.20 and even
These soi Is may have been were not contaminated by material found both close to and far from

- 400 -
Data on the ratio between volatile and non-volatile radionuclides in environmental features and the amount calculated to be In the irradiated fuel at the time of the accident made it possible to define three types of contamination;
Type A: mechanically released finely dispersed fuel with unchanged compos i t ion , most I y found in the cent r a I zone ( ma in I y i n the lower section) and up to 6D-7D Km to the west.
Type B: finely dispersed fuel particles and other emissions, enriched with volatile radlonuclides of ruthenium, caesium and barium by 4, B and 2 times respectively. Plutonium enrichment is up to twice as much as ca I cu I ated and four times as much as In type A. This type of contamination is observed up to a distance of 100 Km.
Type C: Emissions heavl ly enriched with radionucl ides of caesium and ruthenium (up to 9DO and BO times respectively) and also with plutonium (up to appt.:>ximately 14 times).
It Is typical for distances between 100 and 150 Km and is observed at di stances up to 500 lcm. Even higher soi I enrichment .with plutonium (up to 200 times the calculated value) observed at considerable distances from Chernobyl may be due to re I at i ve I y vo I at i I e compounds formed during the accident.
At sites contaminated with finely dispersed fuel particles a correlat Ion was noted between the content of plutonium and 144ce and between the content of plutonium and volatile 103Ru In soi I (Table 3). The paired correlation coefficients of Pu-Ce decline with increasing distance from the accident site and with the change to contamination by more volatile emission products, while those of Pu-Ru increase.
Vertical migration of plutonium in soi Is becomes apparent quite soon after it settles on the surface (Fig. 2); as in the case of the Kyshtym accident, it is more pronounced in soi Is with a high carbonate content. Retention of plutonium in the upper 1-1.5 cm layer is made possible by the steppe root matting and by the tillering nodes of cereals, with a higher concentration In soi Is with a humic or clayey mineral content.
The influence of natural factors and the depth of plutonium penetration both Increase with time (Fig. 3). Where the maximum plutonium content in non-hydromorphic soi Is remains in the 0-2 cm layer (73-92%), most intensive migration is observed in formerly arable soddy podzolic soi I. Where a layer of moss (1 cm thick) covers the soi I surface in pine forest, It was found to contain 92% of the plutonium.
A different pattern was observed in other geochemically connected landscapes (Fig.4). While a high proportion of plutonium has remained in the upper profile of sol Is In drained marshes on high flood plains with a higher plutonium content, the content in hydromorphlc soils in terraces above flood plains and particularly in the terrace-edge hollows has been lower and vertical migration has been more intensive. The reason for the latter, in addition to inundation, may be the high proportion of water-soluble organic I igands and the anaerobic conditions causing the reduction of tetravalent plutonium to the more mobile trivalent form. The secondary concentration of plutonium in i I luvial and silty horizons is very pronounced for soi Is of this landscape.

- 401 -
The data presented, and the discoveries we had made beforehand, which have been pub 11 shed In the 11 terature, about the processes governing the behaviour of global and technogenic plutonium lead us to the conclusion that It quickly becomes incorporated into the biogeochemical migration cycles accompanying Its redistribution in landscapes and soi Is. In this case, plutonium behaves according to the general mechanisms governing the migration of chemical elements and artificial radionucl ides of strontium, caesium and others, which also accumulate In geochemical barriers - depressions in the relief, II luvial and muddy horizons - in the course of horizontal and vertical transfer.
Table 4 shows two types of plutonium movement In soi Is: slow (which predominates) and fast, with migration coefficients varying by 1 - 2 orders of magnitude. The plutonium migration coefficients found are of the same order as those for other artificial radionucl ides, and they also increase with depth as the amount of humus and heavy fractions in the mechanical composition of the soil declines.
Assessments of plutonium removal from surface soil horizons, averaged over a long period of time, showed no substant i a I dependence on the source of contamination (Table 5). Maximum removal was observed from Ii tter on forest soi Is and from turf on peaty soi Is. More intensive removal of Chernobyl plutonium was most probably I inked to the formation of soluble compounds with natural organic I igands through the decomposlt ion of contaminated I itter and turf. The depths at which thousandths of 1% of plutonium may be observed in different types of soi I are estimated to be 40-80, 50-160 and 100-440 cm after 25, 50 and 100 years respectively.
In addition to studying the influence of landscape and geochemical conditions In order to understand the processes taking place In the soi I and vegetation cover which are responsible for the processes governing migration, a great deal of attention was paid to the forms of occurrence of plutonium In soi Is and to ascertaining Its possible I inks with components of organic and inorganic soi I components. Where it enters the soi I in the form of soluble compounds, for example nitrates, it is mainly in acid-soluble and amorphous forms, irrespective of soi I type (Fig. 5).
Plutonium content in more mobile forms, though the quantities involved are smaller, depends on the soil type, decreasing from soddy podzol ic soi I to leached chernozem. As expected, the proportion of mobile forms of Chernobyl plutonium Increases, even In carbonate sol I, from finely dispersed fuel to volatile emission products. In the case of the latter, the content of plutonium In amorphous form, i.e. potentially mobile, is virtually the same as that from other contamination sources.
The absorption of plutonium by amorphous compounds, covering the mineral fraction with a fi Im, Is a very rapid process regardless of soi I type and local conditions; more than 90% is absorbed in this way (Table 6). Most of the plutonium (Fig. 6) was found in the two uppermost films in all soils, the films being compounds of natural organic substances with chem i ca I e I ements and hydroxides of iron and aluminium. The presence of a smal I amount of plutonium In si I icate form is evidence of Its slow penetration into the crystal lattice of soi I minerals.
In organic soi I matter, plutonium is I inked both with humic acids and with non-specific organic substances. Plutonium di str i but Ion between separate groups of organic matter depends on the physico-chemical properties of soi Is and, above al I, on the qua I itative and quantitative composition (translator's note: text becomes .unreadable here)

- 402 -
Plutonium is attached to all groups of organic soi I matter (Fig. 7), its maximum content being in the humic acids, where it correlates with the amount of humus in the soil.
Within the groups of humic acids (Table 7) most of the plutonium is found in the humates of calcium, and within the group of fulvic and low-molecular acids most of the plutonium Is found in free acids and their compounds with mobile hydroxides of iron and aluminium on the one hand and fulvates and low-mobi I ity hydroxides on the other.
Data obtained on the forms of occurence of plutonium have made it possible to explain the mechanisms governing Its behaviour in sol Is.
For example, increased vertical migration of plutonium in soi Is and in the soi I and plant system in the fol lowing order: leached chernozem < grey forest< soddy podzol le correlates with the increased Quantity of the most mobile fulvic and low-molecular acids and their complex compounds with chemical elements; it also increases with the formation of soluble carbonates. Secondary accumulation of plutonium in humic, illuvial and silty horizons is caused by its presence in the structure of iow-solubi iity humic acids and humates, primarily of typomorphic elements of the forest and forest-steppe zones investigated (of calcium or iron) and hydroxides of iron and aluminium.
The basic form of vertical plutonium migration in soi Is is movement with finely dispersed particles washed out of soi Is by atmospheric precipitation; in these particles it is found mainly as a part of the low-solubi I ity compounds mentioned. In the area around the Chernobyl NPP the part of the plutonium which was deposited with the finely dispersed fuel particles may migrate in the form of oxides and other compounds with low solubi I ity.
In conclusion, the behaviour of "Urals" and "Chernobyl" plutonium in soi Is In the form of volatile fallout products with which a large area of the European part of the country is contaminated, is non-specific. Forms of uptalce into the surface of the earth and into soi Is are the factors determining its fate, similar to other sources of uptake and to other fission products2, 4, 6, 7, 9-14, 18, 21, including the state of dispersion and the actual landscape and geochemical conditions it meets. Forecasts of plutonium distribution in soi Is made in the first days fol lowing the Chernobyl accident on the basis of already-revealed mechanisms governing Its migration have proved largely correct. The specific behaviour of plutonium fallout In the form of finely dispersed fuel and "hot" particles may in the final analysis only show up in the intensity of its migration in surface ecosystems.

1 .
2.
- 403 -
BIBLIOGRAPHY
F. I. Pavlotskaya, T. A. Goryachenkova, Z. M. Yemelyanov: Methods for determining plutonium Radiokhimiya, 1984, vol. 26, No. 4, pp. 460-466.
Fedor ova, V. V. levels in soi I;
Study resu I ts and consequences of the
experience accidental
gained in dea I i ng w i th the contamination of territory with
uranium fission products; Energoatomizdat, 1990, 144 pp.
Ed. A. I . Burnazyan. Moscow,
3. B. V. Nikipelov, G. N. Romanov, L. A. Buldakov, H. S. Babayev, Yu. B. Khol ina, E. I. Miker in: The 1957 radiation accident in the Southern Urals; Atomnaya energiya, 1989, vol. 67, issue 2, pp. 74-80.
4. F. I. Pavlotskaya, T. A. Goryachenkova, B. F. Myasoyedov: Plutonium migration in soi Is; Atomnaya energiya, 1986, vol. 61, issue 3, pp. 195-198.
5. A. Aarkrog, J. Lippert: Environmental radioactivity in Denmark, 1976; Riso report 1977, No. 361.
6. F. I. Pavlotskaya, G. G. Pol ikarpov: Transuranic nuclide migration in the environment and its biological effects; ltogi nauki i tekhniki. Radiatsyonnaya biologiya. vol. 4. Problems of radioecology, Moscow: UNITI, 1983, pp. 99-141.
7. F. I. Pavlotskaya, B. F. Myasoyedov: Plutonium behaviour in surface biogeocenoses; Radiokhimiya, 1984, vol. 26, issue 4, pp. 554-567.
8. R. T. Watters, D. N. Edgington, T. E. Hakonsen, et al.: Synthesis of the Research Literature; Transuranic Elements in the Environment. w. c. Hanson (Ed.). Springfield: Techn. Inform. Center/DOE, 1980, pp. 1-40.
9. F. I. Pavlotskaya, E. B. Tyuryukanova, V. I. distribution of radioactive strontium on the Moscow: Nauka, 1970, 159 pp.
Baranov: Overal I earth's surface;
10. F. I. Pavlotskaya: Migration of radioactive products of global fallout in soi I; Moscow, Atomizdat, 1974, 215 pp.
11. F. I. Pavlotskaya: Forms of occurrence of radioactive fallout products and their migration in soil; author's abstract of the thesis she submitted for a doctorate in chemistry; Moscow: GEOKHI AN SSSR, 1981, 43 pp.
12. E. B. Tyuryukanova: Radiogeochemistry of polesye soi Is on the Russian plain, Moscow: Nauka, 1974, 154 pp.
13. E. B. Tyuryukanova: The ecology of strontium-90 in soi Is; Moscow: Atomizdat, 1976, 128 pp.
14. P. W. Krey, plutonium and 318, 1977, pp.
E. P. Hardy, L. E. Toonkel: The distribution of americium with depth in soi I at Rocky Flats; HASL-29-76.
15. J. H. Harley: Plutonium in the Environment; A Review; J. Radiat. Res., 1980, vol. 21, No 1, pp. 83-104.

- 404 -
16. E. I. Belova, A. I. Pogodin, diffusion in 90sr di sp I a cement Inform. byul I. 1971, No. 13, pp.
A. Ya. in soi I 62-65.
Kochetkov, The role of profiles; Radiobiologiya.
17. F. I. Pavlotskaya, T. A. Goryachenkova: Plutonium distribution in natural organic substances and their role in its migration in soi I; Radiokhimiya, 1987, vol. 29, No. 1, pp. 99-106.
18. T. A. Goryachenkova, Hguen Tkhan' Bin', F. I. Pavlotskaya: Forms of occurrence of plutonium in soi Is; Radiokhimiya, 1990, vol. 32, No. 2, pp. 47-54.
19. R. N. Mui ler: Chemical and characterization (sic) of stratospheric plutonium in Ohio soi Is; Soi I Sci., 1978, No. 3, pp. 131-136.
loca I and VO I. 125,
20. E. A. Fedorov, A. s. Bakurov, M. Plutonium behaviour in soi Is and Agrokhimiya, 1986, No. 12, pp. 83-88.
N. Fedorova, M. its uptake in
F. Rasulev: vegetation;
21. N. N. Kul ikov, I. B. Molchanova: Continental radioecology; Moscow; Nauka, 1975, 184 pp.

- 405 -
Table 1. 239 •240Pu content in soils
. Accident zone Background areas
Soil Bq/m 2 Soil Bq/m2
rv 8 km from the source Chelyabinsk district
near the Ct(..\i I a.xis i~ various directions from the accident site
Leached chernozem, Leached chernozem, meadow 10566 meadow 411
Grey forest, birch D, t-t- o 138 forest of park type 12724 D.r~c 114
rv 4 km from the som::ce Dark grey forest, meadow 105 near 1:-J.-a, i:-n;:.,/ . boundary - ' meadow 74
Leached chernozem, Sverdlovsk district birch forest 665
Brown forest, glade 118-142 0,H·c skrit 523
D; t+e I
forest 117-128 •
Between the axis and the countries I rra; I boundary Other
Meadow chernozem, Italy 159-537 dry meadow 1292 Austria 44-566
Japan 55-131 USA 63-192

- 406 -
Table 2. 239 •240Pu concentration ratios
1---------------------------------,1 / 83eloyarsk Nr'P / Other regions 6-~ Southern Urals'
10 - 5 - 10-4
Table J. Correlation coefficients
Soils (n > 100) Aerosols Fallo,ci:· (n,,,, 9) (n=.10)
Nuclides pollution type Various Various
I pollution pollution
A B, c types types
' 239,240Pu _ 144ce 0,71 0.36 0,75 0,71
239,240Pu _ 103Ru 0,71 0.88 0,65 0.81

- 407 -
Table 4. 239 ' 24°:eu migration coefficients in soils -8 ' 2 slow (M1) and rapid (M2) transfer, 10 cm /s
/Type of pollution I M1 Share ,% M2 Share ,%
Southern Urals' accident
Technogenic, USA 1
(l,,(l • C(. 'i.,- t rAvP1/ C, • C- >
(type B)
The same ( type C}
\Global fallout 2
1. 2 0,4-2
8 7-9
-+ 7 o.i-J.4 0,8
i'fComments: 1 - Calculated from
2 - Calculated from t,
88 76-96
86 65-94
-
77
21 2-40
15 11-19
68 26-103
57
14
Soviet Union's soils were estimated kn,,
(0,6-21),10-8 cm2/s
12 4-24
14 6-35
-
23
I

- 408 -
Table 5. 239,240Pu from the upper horizons
of various soil type~%/ year
' Horizon, la1obal depth, fallout cm (At? 20
years)
Turf, litter,
0-2 (5) 3,3-4,2
D; th +
humus horizon
0-5 (8) 2,3-2,9
I
' !
Accident '" 6j~ I';' 1 a,·, k Accident the Southern IV PP at Chuaob11 I\J ( t'
Urals (A t=24-26 (4 t >- 20 year) (At=15 months years)
2,2-3.8 1.4-9
0,9-2,2 2,3-3,4 6

- 409 -
Table 6. Plutonium distribution between amorphous and
Soil
silicate compounds in soils,%
Time and conditions of occurence in soil
Amorphous compounds, soluble in:
0.1 N NaOH+ Tamm's 0.05 N Na 2c2o4 ; solution Tamm• s solution
Sod·-~- pod- 5 days-J years; 85.7:t4-7 zolic laboratory ex
periments
Grey forest 5 days-4 years;
diC-~c
Leached chernozem
O;t:+o
Silty loam '9
17 hours-) years; 98.2:t0.8 .i,H,
Experimental·axea; 97.0+1.7 10 years
global fallout
85.0;t4.9
88.J:!;:4.5
82.J-t-5.2
! Silicate I compounds)
0.8:tO.J
I
1.0+0.02
1.0:!;:0• J
0.6+0.4

- 410 -
Table 7, Plutonium distribution in hum,c acids, %
'Group of compounds
Free acids and their compounds .with mobile iron and aluminum ,hydroxides I
Humates and fulvates of calcium
1Humates, fulvates and mobile hydroxides of iron and aluminium
Hu.mates, fulvates and slightly mobile hydroxides of iron and aluminium
Humic acids
14-5~ 72-8
2-11 4-16
0 1 6-5 4-18
Comments: 1 - % the cont.ent in soil;
2 % the content in hun1tc acids.
Fulvic acids
'l ) 0.3-112) 3.4-51
Not found
2-5 16-24
3-6 27- 60

- 411 -
THE LIST OF FIGURES
Fig. 1. 239 , 24°Pu distribution in soils, contaminated after the
Southern Urals' accident in 1957: a - leached chernozem,
birch forest; b - c1.;t:ho ~5 m from site a at the forest
boundary; c - the same,forb-cereal community; d - grey
forest, birch forest of park typer e - meadow ch.ernozem,
grassland
Fig. 2. 239, 240Pu distribution in soils four-five months after the
Chernobyl accident: a - podzolic sandy ( finely dispersed
fuel, enriched in volatile products); band c - sandy-
loam (volatile products); d - dark-grey forest sandy-loa~
carbonate (volatile products); e-soddy meadow loamy (volatile
products)
Fig. 3, 2>9 , 240Pu content 4Bg/m1) and distribution in soils fiftee:r;i
months after the Chernobyl accident (length of landscape
profile ,v 150 m, the distance from Cher,cby 1 £Vff ~60 km, fine
ly dispersed fuel, enriched in volatile products; a -forb-cereal meadow
alluvial soddy laminated sandy-lciain,':b - humus gley,ce-
reals-forb meadow; c - sod-podzolic sandy-loam, •tt~o.
Fig. 4, 239, 240Pu content QBg/m~) and distribution in soils fifteer
months after Chernobyl accident (length of landscape pro-
Fig. 5.
file ,-,.,,. 2000 m, distance from Che.0 ,00_11 NPP v 150 km,
volatile products): a - humus-peaty-gley,potentilla-ce
reals; b - humus-gley clay strongly ~ydromoFphic,equise-
tum-cereals; c - humus-podzolic hydromorphic,forb-cereals
community; d - podzolic sandy-loam '.i..lluvial-ferrugenous,
bilberry spruce forest.
' .._.i.. i'..' C( ~.rrt,\lt in soils, % :iverall
content in· soil: 1, 2 and 3 - sod-podzolic, grey forest.

- 412 -
and leached chernozem (laboratory experiments); 4 - lea-
ched chernozem (experiment plot c~ the Southern Urals'
1:,-C\, l); 5 - different soil types (Chernobyl accident,
f111e1 y dispersed fuel of unaffected composition); 6 - cl, ti:-c
{f;o~iy
7 - cl,t~c
dispersed fuel enriched w,th VJlatile products);
(volatile products); 8 - carbonate soil
(volatile products); • - water-soluble; !L2l - exchangec,01,
and easily soluble;
D - amorphous
t±~I - mobile; ~"] - acid-soluble;
Fig. 6, Plutonium distri~ution between organic and inorganic
soil components, % of content in soil ii A, Band
C - sod -podzolic, grey forest and leached chernozem
(laboratory experiments); D - leached chernozem (experi-
mental plot); [IID - free hum ,c a.cids and their compo-
unds with Ca, Fe, Al ttc i . ga - Fe and Al hydro)( .. /e;_ (,3-organio substances released from bonds with hydroxide,
~ - organic substances conne ted with clay
minerals; D - mineral fraction; in DJ / 2 I IT/ - content in Fe and Al hydroxides ( 1), amorphous for.m
( 2) and organic substances and their compounds with chem,c,
elements (J) considerable.
Fig. 7. Plutonium distribution between components of organic
matter,% cf content in soil: 1 and 2 - leached cherno2,
(laboratory experiments and experimental plot);
J and 4 - grey forest and sod-podzolic; m , rn and Ei
- soluble in 0,05, 0,25 and 0.5 M H2so4
respectively;
i]sl - fulvic acids; 1§,l - humic acids; ill] - unhydro
lizable residue (humines).

239 240 . ' Pu con teat in each layer• % ( 1)
c 20 40 6C 0 :w 40 60 0 20 i,O 0 20 40 [[' D F"'2D ~o Jlo i Jlo ' Jlg z i .!Jo Jig ~ =' ,, ,,,.,.. 3
i JtJ:'2 =3 a z ;('""" /77' '"i
t 0 z J1 ~: ./ltf{,. 6 A g g =ri g ~ .A1 JO Jh,.,,,...w ..cl J1 A ...,
.A l~ Jlz B 0, i~ 13 (l)
b L~ 14 "' a A c d
• Z J e ~ lZ 18 1S =i8 ,cl
i~ • B 22 -,20
22
I •rl 25
,,5 I M~ .-j O
;?6 25 "'l:d
30 30 0 10 ,W :SO 0 !O ?.O 50 {O ~D 0 iO zo 50 0 w 20
239• 240Pu content %/cm (2)

23
9 2
40
'
Pu
co
nte
nt,
% i
n e
ach
lay
er
(1)
or
%/c
m
(2)
0 20
Li(
) GD
80
0
zo
40
60
80
iDD
0
20
LiD
&O
80
---,
----
----
-,-
_ I
I I
• A2
.A3
! A
L
-rm-r!
.
A~Ai
z
9 2.
m,,;
,:n 2
a 17
TP'3
b Jlj
JI! 3
LA
c
rrrr
r3
.A1Az
4
Jl~Jli
4
s <)
sLII
Jl
5 ~
.Cl ...,
0 20
40
D
2
0
'-10
60
0.
0 za
40
,i
s
Q)
Jl~
!~
I
V '
I •
I-'
'cl
,is
~
A3
Jlj
.i s::
l 0
.l. "' -rl
2 2,
1-1
1-r,
,;w
Z,
0 \:C
d r7
n1
7
e =
I
A
t Jlj
Jli 3
3
3
" i
lljJl!
lj
.Aj.Ai
4 ~
--
5 5
5
:r-(i
'' '/
~
. "

r '(
I '(
~
v r
x'r
-~
't_
!1~3
21
11a§o
J
23
9,2
40
Pu
co
nte
nt
in
ea.c
l1 la
yer,
%
(1
)
0 20
J.i
(J 60
80
10
0 0
20
40
60
BO
i.00
O
20
40
60
I . A
•4!,,r
. .
. ?11
1
Ahr .
. .
21 1
~t . ;
;::.
:--?
! ~
~o
;!..
2
1. µ
i u
i
~ ~
A G
a
6 b
Apt &
c
•H
.µ
"'
0.
O
Q)
p:t
,c,
12
a 12
0
!O
ZO
30
40
50
D
!IJ
ZO
30
40
£0
0 !O
ZD
30
L.
23
9,2
40 P
u co
nte
nt,
%
/cm
(2
)
r,9. 1

~
w
lit
if,'
'!. /
J j
9941
j 12
61 134
11
23
9,24
~ co
nte
nt
in e
ach
lay
er,
%
(1
)
0 .2
0 Ji
[)
60
0 ZD
liD
&O
O
20
4D
60
~
.Ai.T
2 k,
:>-3
1'
I M
Aii~
,A '
1
i JIJJ
U,
~ 4
.cl
6 .p
°' (1) "
'Cl
,..,,.,.
,,10,
1
--
§ Bi.
c;. l /2
. .;:]
i5
,...
. J:.<
0 ::,:
:
a
2ou.
......
...__
_. _
__
J
O
l.O
20
30 .A
h&
~~
b
1.0
2. .I.
l.5'
21}
I '
' '
D
!IJ
20
30
rn
'77
7"
Ah 6
mrJD
Jlh
A2
.l.5
c
2 i
zo .....
.... ...
..,.
..--
-' D
!D
2
0
3D
23
9,2
4~
co
nte
nt,
%
/cm
(2
)
f ''.I
Cf
0 ./1.
o
.AiA
i ,_
.,-
.ll2B
w
l5
,1 j 65
41
20
l/D
E,D
d
2. I.!.
21).
.,_.
__,_
_.__
_.
D
.I.D
20
30
.... I-' "'

r/~ ,, IOO
50
IO 5
3
o/o IOO
50
IO
3
0
<!q
q
"'-v 'Q
q
"'"' <!
<!
"'
n
v •+ <J., ... <1
5
- 417 -
<1q 11., <1<:t
•+ .,. +-+ •+ ·~
<; t~
6 7 8
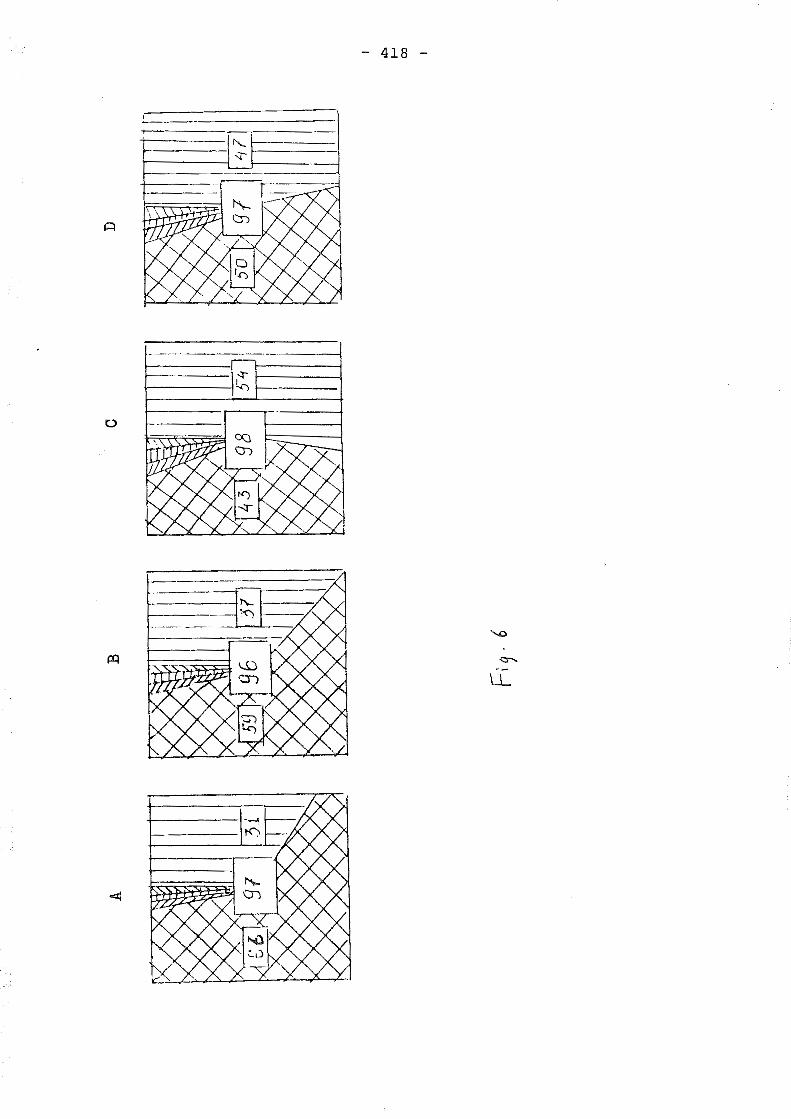
A
B
~·-
---
--~
I 11
I i ltl1 l
I ljll I
F,9. 6
c
~~
Ill~
4
3 .
s s I
1;-4
.
D
tt:i1 ~
; 1111 ~
1
,,,. I-'
0,

- 419 -
70%
50
i 2 3
F,9. 7

- 420 -

- 421 -
Peculiarities of Sr-90 Migration in the Environment
G.N. ROMANOV, D.A. STUKIN, R.M. ALEKSAKHIN

- 422 -
ABSTRACT
The Eastern Urals radioactive track which formed as a result of the Kyshtym accident constituted a natural experimental base for studying the dynamics of Sr-90 behaviour and migration in the environment. Sr-90 behaviour in soi I depends on the processes involved in its physical migration horizontally (water runoff, wind transport) and vertically (effective diffusion), on the intensity with which the physico-chemical forms of strontium change, and primarily on Sr-90 incorporation into the soi I-absorptive complex. Over 30 years the effective diffusion processes led to downward displacement of Sr-90 in undisturbed soi I to a depth of 30 to 50 cm. In 1988 84-94% of the sr-90 was located in the 10 cm layer as against 90% in the 2 cm layer in the initial 1 or 2 years. The amount of Sr-90 in mobile forms in leached chernozem and grey forest soi I hardly changed over time, amounting to between 76 and 90%. In the first 5-10 years sr-90 surface water runoff was about 0.2% (and sr-90 wind resuspension 0.1-1.0%) per year of the Sr-90 inventory per unit area. Due to Sr-90 loss from the top soi I layer the water runoff and wind resuspension processes decreased exponentially, halving every 4 to 5 years.
In most cases, Sr-90 transfer from soi I to plants via the roots does not involve discrimination of Sr-90 with regard to calcium, and therefore the Sr-90 accumulation level in various species of natural and agricultural plants depends on their calcium requirements and the amount of exchangeable calcium in the soi I. This made it possible to work out quantitative Indices for forecasting Sr-90 accumulation in various species of plants for given types of soi I.
As Sr-90 moves through the trophic chains (including the agricultural one) we find - depending on whether two adjoining I inks discriminate against it or not as regards calcium - that some organisms reject it while others concentrate it. When restoring farming on the contaminated territory the fact that cattle discriminated against sr-90 vis-a-vis calcium was the main reason for opting for meat production instead of grain or fruit production.
- 423 -
The Eastern Urals radioactive track formed after the Kyshtym accident constituted a natural experimental base for studying the dynamics of the behaviour and migration of Sr-90 in the environment.
The contaminated territory i8 part of the zauralskaya wooded steppes with the relatively flat relief characteristic of this zone. Two types of plant growth predominate - grassland and woodland and there are a large number of water bodies, mainly in the form of shallow, precipitation-fed lakes.
The soi Is of the radioactive track are heterogeneous. Grey forest soi I, leached chernozem and soddy-podzol ic soi Is, including excessively wet and saline soi Is, predominate.
In examining the behaviour and migration of radionucl ides in the environment and the food chain in the aftermath of the accident, it is essential to distinguish between two phases: the phase of initial dispersal of the radioactive substances in the area or systems under consideration, and the subsequent redistribution of the radionucl ides under the influence of natural (including biogenic) and anthropogenic factors.
Immediately after being deposited the radioactive fallout started to redistribute under the influence of natural forces, whose vertical component, where mass transfer predominates, conditioned the subsequent displacement of radioactive material from the tree crowns and herbaceous cover to the soi I surface and (in lakes) from water to bed sediment. In the course of time the soi I and sediment became the basic accumulators of radioactivity, and the long-term behaviour of the radionucl ides in different natural systems reflected the role of these depots in the overal I mobi I ity of radionucl ides in the environment.
1 . Soi I cover
Radionuclide behaviour and speed of migration in the soi I depend on the soi I's physico-chemical properties, which themselves are a function of the type of soil, (absorption capacity, including the quantity of exchangeable calcium, acidity, humus content, si It fractions, sands, soi I class, permeabi I ity to water, mineral composition), and the way it is wetted.
Each radionuclide's mobi I ity in soi I is determined by the watersolubi I ity of the nuclide's chemical compounds and the soi I's sorptive capacity in respect of the nuc Ii de. Both these factors determine the intensity of horizontal migration (runoff) and vertical migration of radionuclides in the soil cover.
The fallout radionucl ides I ine up as fol lows when ranked by increasing mobi I ity in soi I: Cs-137< Sr-90< Ce-144< Ru-106. Cs-137 has lowest mobi I ity because of its high irreversible sorption in soi I particles, with Cs-137 atoms being incorporated into the crystal I ine lattice of clay minerals. The content of mobile Sr-90 - i.e. forms that are watersoluble and displaced by ammonium acetate - remains virtually unchanged over ti me and accounts for 76% to 90% of tot a I Sr-90 in the surf ace layer. The mobi I ity of Sr-90 and Cs-137 in the soi Is of the track increases from soddy-podzol ic soi Is through grey forest soi Is to leached chernozem, in I ine with differences in the intensity of soi I formation processes in these types of soi I.

- 424 -
Vertical downward migration of Sr-90 and Cs-137 in undisturbed soi Is is determined by a combination of diffusion (displacement together with moisture in the soi I) and mass transfer (mechanical displacement together with soil particles). The linear speed of total downward migration of Sr-90 in the undisturbed 15-cm soi I layer I ies between 0.2 and 0.4 cm/year. For Cs-137 the range is 0.15 to 0.3 cm/year.
The past 30 years have seen a redistribution of radionucl ides in the undisturbed soi I profile, the main feature being sr-90 and Cs-137 enrichment of the 2-10 cm soi I layer (Figure 1). Table 1 shows the distribution of radionuclides in the profile of characteristic soil types 30 years after the accident. While in the first one to two years after the accident up to 90% was concentrated in the 0-2 cm layer, at the present ti me the surf ace I ayers are to a I I intents and purposes free of radioactivity. In leached chernozem half the Sr-90 is removed in 5 years from the 0-2 cm layer and in 19 years for the 0-5 cm layer; in the case of soddy-podzol ic soi Is, the corresponding periods are 2 and 7 years.
Table 1
Sr-90 and Cs-137 in soi I layers (1988) - % of total
Type STRONTIUM-90 CAESIUM-137 of soi I 0-2 cm 0-10 cm 10-50 cm 0-2 cm 0-10 cm 10-50 cm
Chernozem 31 94 6 41 93 7
Grey forest soi I 11 84 16 51 89 11
Soddy-podzo I i c 8 54 46 44 84 16
Migration processes differ considerably for ploughed fields, swamps and soi Is of lakeside meadows waterlogged by groundwater. In ploughed soi Is annual ploughing mingles the radionucl ides deposited on the soi I surface, so that after 30 years there is uniform distribution of radionucl ides throughout the ploughed soi I layer. After 30 years only a few hundredths of a percent of the radionucl ides in the soi I had migrated below the ploughed layer.
In swampy (peaty) soi Is Sr-90 and Cs-137 migrate through the soi I profile very rapidly. After just six years, 40% of the total radionuclide inventory had migrated more than 10 cm below the surface, while after 30 years the radionucl ides are uniformly distributed throughout the entire peat layer (up to 1-1.5m deep). In waterlogged soi Is evaporation inhibits virtually al I vertical migration and al I the radionucl ides remain in the surface layer of the soi I (0-2cm).*
2. Migration of radioactive material through water and wind erosion.
Water runoff and wind def lat ion are the predominant natural processes affecting migration of radioactive material over the earth's crust.
Water runoff - which is low because of the flatness of the terrain and the moderate amount of precipitation accumulates in undrained lowlands, lake basins and a smal I number of minor rivers. We distinguish between surface runoff, subsoi I runoff and channel runoff.
* predominance of evaporation over precipitation

- 425 -
Surface runoff, which is most common in spring, when up to 70-80% of annual runoff occurs, leads to the runoff of radioactive material in its dissolved (ionic) and sol id states. Among the factors influencing water runoff, the surface runoff of radioactive material depends on the quantity of radionucl ides in the soi l's surface layer and their water solubi I ity. To express surface runoff of radioactive material in quantitative terms, use is made of a runoff coefficient indicating the proportion of activity in the catchment area which is removed by runoff annually.
In the five to ten years immediately fol lowing the accident the mean value of the runoff coefficient for Sr-90 was approximately 0.2%/year, while subsequently, due to binding of the radioactive material in the soi I and downward migration, there was an exponential decrease in runoff with a halving approximately every 4 to 5 years. currently, the sr-90 runoff coefficient is estimated to be approximately 0.05%/year. Runoff of Sr-90 in its sol id state makes up approximately 10-60% of aggregate Sr-90 surface runoff. Runoff varies with soi I surface, being lowest in wooded areas ( .001%/year) and highest in meadows and ploughed land (0.3%/year).
Subsoil runoff, which is characteristic of raised, drained and nonwooded watersheds and is mainly influenced by the infiltration of precipitation, plays a secondary role in the affected territory. The sub soi I runoff coefficient for sr-90 is reckoned to be one order of magnitude less than that of surface runoff. The low specific activity of the investigated groundwater and underground contaminated area substantiate this conclusion: in the concentration of Sr-90 in groundwater lay between 2 x 10⁻¹ O c i J I i tr e.
waters in early 1960s 4 x 10-12
the the and
Channel runoff of radioactive material via permanent watercourses as an integral characteristic of surface and subsoi I runoff depends on the location of the water catchment basin. Channel runoff in the affected territory has much the same dynamics as surface runoff, decreasing from 0.3%/year in the first decade to 0.05-0.1%/year at present. Runoff from marshes into rivers is more intensive than surface runoff.
In the 1960s the radionuclide runoff coefficient was approximately 4% per annum, because of the increased content of ionic forms of radionucl ides in the marsh waters.
The total quantity of activity removed through runoff is estimated at 500 Ci, of which 60% was removed during the first five years.
Wind resuspension of radioactive material located on the surface (soi I, vegetation, other elements of the landscape) and its subsequent transport and secondary deposit ion downwind are the key features of wind migration, whose role is particularly pronounced in the initial fallout phase, when the radioactive material is concentrated on the surface in weakly bound form.
The intensity of wind resuspension A, which is determined by the ratio between the intensity of the vertical flow of radioactive material (or intensity of dust creation), Ci/(m2.sec) and surface radioactive contamination at the site, Ci/km2, in general characterizes the proportion of the inventory of activity per unit area raised into the air during a unit of time.

- 426 -
Just after the accident the intensity of wind resuspension A was estimated at 10-9.sec-1, while subsequently it decreased exponentially, with a halving every four years. The maximum value established for A for the spring, summer and autumn periods is 1 o -11 . sec-1 .
over al I annual wind resuspension of radioactive material is estimated at 10-3 to 10-2 of total activity per unit area for the first year and 10-5 to 10-4 thereafter. In al I, during the first three years some 2% of the radioactive material per unit area was removed by the wind.
Water and wind migration of the radioactive material did not decontaminate the territory, alter the macro-structure of contamination in the area, or change the axis and boundaries of the radioactive track. The combined contribution of these factors to the redistribution of activity is put at 1-2% of the inventory of material in the area in the initial period, and at fractions of one percent during the entire subsequent period. Changes in the contamination microstructure under the influence of water and wind migration, in particular the accumulation of radioactive material at certain localities, were in large measure offset by radioactive decay of the fa! lout, which occurred at the rate of 40-65% per annum from 1957 to 1960 and 2% per annum thereafter.
3. Plant cover
The behaviour of radionucl ides in plant cover, being subordinated to the processes involved in the biogeochemical cycle of mineral elements, depends on the ratio between the intensity with which such substances migrate from plants to soi I and that with which they migrate in the reverse direction. Initially (during the first one to three years) residual surface contamination and exorhizic contamination caused the downward flow of radioactive material to prevai I under the impact of leaf fa! I, the death of plants and their organs, and dispersion through wind and rain. However, in the fol lowing period root uptake of Sr-90 from the soi I created a fairly stable ratio between the radionuclide inventories in plants and in the soi I.
In pastures, hayfields and fallow land almost al I fallout was initially concentrated on the plant surfaces, the resulting concentrations of radionuclide mixtures depending on the amount of plant biomass and the degree of projecting cover. Rainfal I during the initial weeks transferred approximately 90% of the activity to the sod, litter and soi I under the plant cover, with seasonal plant death also contributing to this phenomenon. In the fol lowing growing season ·20-65% of radioactive contamination of herbaceous plants was caused by exorhizic contamination redeposited by the wind, 25-70% by root uptake from the sod and approximately 10% by root uptake from soi I. The sod was the main source of root uptake for the first three years, after which - due to its mineralization in conjunction with the reduced role of wind resuspension root uptake from the soi I began to predominate (currently 95%). The maximum concentration of Sr-90 in herbaceous plants was observed five years after fa! lout - this being the time it took for mobile Sr-90 to reach the nutrition zones of the roots of most plant species with surface root systems. In plant species with deeper roots, sr-90 concentrations peaked after 8 to 15 years (Figure 2).

- 427 -
The root uptake of Sr-90 by various herbaceous plants depends largely on the calcium requirements of different plant species - calcium being strontium's non-isotopic chemical analogue - and this is why there are substantial differences in Sr-90 accumulation in plants of different species growing on soi Is of different kinds. General IY, the quantitative index of Sr-90 accumulation in herbaceous plants ranges from 7-30 nCi/kg of dry mass in grey forest soi I to 4-15 nCi/kg of dry mass in leached chernozem, assuming an Sr-90 activity of 1 Ci/km2.
In forest plantations, after initial retention of approximately 80-90% of the radioactive fallout in the tree crowns, downward migration also began immediately after contamination. The process was conditioned by the action of the wind, precipitation, falling leaves (birch) and needles (pine). During the first few months activity in the crowns dropped by 20-40% due to washout and blowoff of retained radioactive substances. Approximately 80% of the activity in the crowns was transferred to the I itter with fal I ing leaves in autumn. Subsequently, the basic factors in the redistribution of the radionucl ides in the forest biogeocenoses were biogenic migration (root uptake of radionucl ides from I itter and soi I, fal I ing needles, leaves and twigs, herbaceous vegetation), the downward migration of radionucl ides to the I itter and mineralized part of the soi I, and exorhizic contamination (which fel I rapidly in the first years) due to wind resuspension.
In the first three years Sr-90 content in forest was determined by residual contamination and exorhizic contamination, and thus concentration values were maximum. During the subsequent 20-25 years Sr-90 uptake in trees was almost exclusively via the roots, gradually decreasing from year to year in I eaves and branches, wh i I e increasing in wood and bark.
Twenty to thirty years after the accident the concentration of sr-90 in the forest cenosis, assuming Sr-90 activity of 1 Ci/km2, was as fol lows (in nCi/kg of dry material): pinewood - 0.3; birchwood - 1.8; pine needles - 2.7; birch leaves - 12.
The distribution of Sr-90 in herbaceous and forest biogeocenoses is shown in Table 2. It can be seen that natural herbaceous and arboreal vegetation do not play much of a role in the redistribution of radioactive strontium in ecosystems. The percentage of Sr-90 in arboreal vegetation is much the same as in herbaceous vegetation, bearing in mind that there is relatively more arboreal biomass.
4. Water bodies
A number of endorheic, steppe-type lakes and three smal I ish rivers are located within the radioactive track. The basic source of radioactive contamination of surface water bodies was the initial deposition of radioactive material on the water surface, and the subsequent surface runoff of radioactivity from the basin over a period of many years.
Natura I c I eans i ng of the water took p I ace reasonab I y qui ck I y unt i I a dynamic equi I ibrium in the distribution of radionucl ides in the lake hydrocenoses was achieved. The semi-elimination period in water was 120-190 days for sr-90, 18-110 days for Ru-106 and 1-24 days for Ce-144. Because of the smal I quantity of biomass in the lakes the further distribution of radionucl ides depended almost entirely on the interaction between the water and the bed sediment. The concentration

- 428 -
of radioactive material in the lake waters dropped, with a semidecrease period of approximately 5-6 years; 30 years on, the concentrations are less than 1/1500 of the initial values. During this period Sr-90 was transferred to si Its to a depth of more than 30 cm, most of it being concentrated in the 0-15 cm layer.
In the initial period, radioactive contamination of waterways was determined by the degree of dilution of the total quantity of fallout on the water surface by the mass of flowing water. Subsequently, surface runoff of radioactive material from the basin was the predominant factor. Thus, the maximum seasonal concentration of Sr-90 in the river waters occurred during snowmelt. In the river. whose water source is a swampy depression in the affected area, the peak spring concentration of Sr-90 in the water was considerably less. For over 30 years the dynamics of Sr-90 concentration in river water have been similar to those of lake water.
5. Fauna
The behaviour and migration of radionucl ides in different ecosystems and biological systems, including the characteristic quantitative and qualitative diversity of their biological species and trophic levels, are in general subordinate to the processes involved in the biogeochemical cycling of substances in nature.
In flora, the behaviour of Sr-90 and Cs-137 is largely identical to that of their nm-isotopic chemical analogues - calcium and potassium -in the soi I-plant system. Fauna, however, discriminate between strontium and calcium on the one hand and caesium and potassium on the other, and thus the levels of retention of Sr-90 and Cs-137 in I iving organisms, and consequently the intensity of transfer of these radionucl ides from one trophic level to another, are determined by more complex mechanisms. As a result, the food chains through which Sr-90 and Cs-137 migrate include both organisms that concentrate radionucl ides and organisms that discriminate against them.
The general quantitative measure of the concentration of radionucl ides in I iving organisms is known as the 'accumulation coefficient' (AC), this expresses the ratio of the concentration of a radionuclide in the organism to its concentration in the preceding trophic I ink (or soil. this being the original depot). The ACs for terrestrial and aquatic organisms in the fallout track are shown in Tables 3 and 4.
The total uptake of radionucl ides into the biological cycle of I iving organisms is quite smal I because of their low biomass, and is two to three orders of magnitude lower than uptake in plant communities.
The fact that certain I inks in the biological chains can distinguish Sr-90 from calcium was the reason for concentrating on I ivestockkeeping when resuming agricultural activity in the contaminated territory. As distinct from plants, which do not distinguish between strontium and calcium in root uptake, the organisms of farm animals distinguish between the two, and farm animals constitute a discriminatory barrier in the migration chain of sr-90 (soil-plantanimal-1 ivestock produce). The discrimination of Sr-90 in cattle (as a ratio of Sr-90 concentration to that of calcium, or in strontium units) is, for a given quantity of feedstuffs consumption, 0.5 in blood, 0.25 in the bones, 0.4 in muscle and 0.1 in milk. This is why, when reorganizing and establishing agriculture in the affected territory, it was decided to opt for meat production (pork and beef).

- 429 -
BIBLIOGRAPHY
1 . B. V. Niki pe I ov, G. N. Romanov, L. A. Bu I dakov, N. S. Babayev , Yu. B. Kho! ina, E. I. Miker in: The Radiation Accident in the southern Urals in 1957; Atomnaya Energlya, 1989, Vol. 67, No 2, pp 74-80.
2. G. N. Romanov, D. A. Spirin, R. M. Aleksakhin: Behaviour of Radioactive Substances in the Environment, Priroda, 1990, No 5 (897), pp. 53-58.
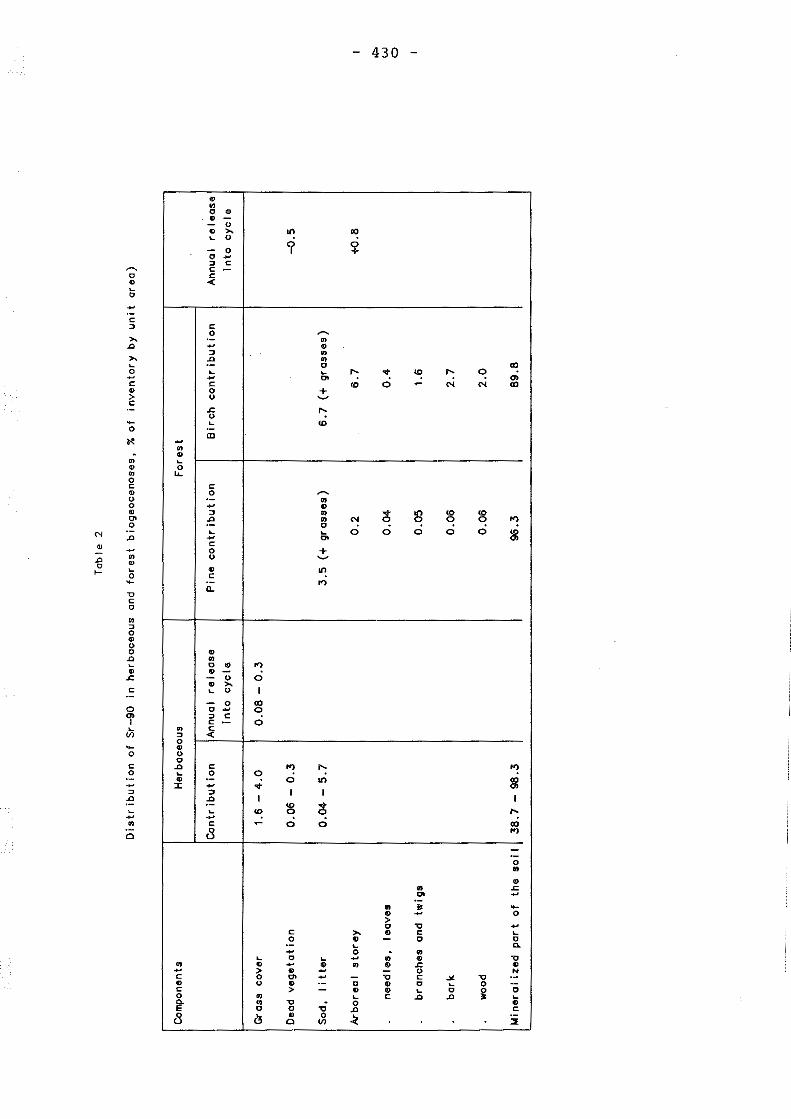
Com
pone
nts
Gr as
s co
ver
Dea
d v
eget
atio
n
Sod
, I i
t ter
Arb
orea
l st
ore
y
nee
dle
s,
leav
es
bran
ches
an
d tw
igs
bark
woo
d
Min
eral
ized
par
t of
th
e so
il
Tab
le 2
Dis
trib
uti
on
of
Sr-
90
in
he
rbac
eous
and
fo
rest
b
iog
eoce
no
ses,
%
of
inv
ento
ry b
y u
nit
o
rea)
Her
bace
ous
Fo
rest
Co
ntr
ibu
tio
n
Ann
ua I
re
I eas
e P
ine
con
trib
uti
on
B
irch
co
ntr
ibu
tio
n
Ann
ua I
re
I eas
e in
to c
ycl
e in
to c
ycl
e
1.6
-4
.0
0.0
8 -
0.3
0.06
-0
.3
--0.
5
0.0
4 -
5.7
3
.5 (
+ g
ross
es)
6
.7
(+ g
ross
es)
0.2
6
.7
+o.
8
0.0
4
0.4
0.05
1
.6
0.06
2
.7
0.06
2
.0
38
.7 -
98
.3
96
.3
89
.8
"" w 0

INVE
RTEB
RATE
S
Soi
I m
icro
faun
a
Wor
ms
Inse
cts
-P
hyto
phag
a
AW
HIB
IA
REP
TILE
S
BIRD
S Pla
nt-
eati
ng
Inse
ct-e
atin
g
Pre
dato
ry
Tob
ie 3
:
Co
effi
cien
ts o
f tr
an
sfer
of
Sr-
90
and
C
s-13
7 in
li
vin
g o
rgan
ism
s v
ia
the
land
ec
osy
stem
Sr-
90
Cs-
137
Co
effi
cien
t of
A
ccum
ulat
ion
coef
fici
ent
Co
effi
cien
t of
A
ccum
ulat
ion
coef
fici
ent
prop
or ti o
na I
i ty
p
rop
ort
ion
alit
y
wit
h co
ntam
inat
ion
in
rela
tio
n
in r
elat
ion
w
ith
cont
amin
atio
n in
rel
atio
n
in
rela
tio
n
leve
l to
pre
cedi
ng
to s
oi
I le
vel
to p
rece
ding
to
so
i I
Ci/
kg/C
i/km
2 I i
nk
Ci/
kg/C
i/km
2 I i
nk
2 3
4 5
6 7
2.4
1
3.1
0-9
! 0
.5
0.2
3. 1
0 -9
0.5
0
.2
1. 1
0-<I
-9
3.1
0
0.5
0
.2
1.
10-<
I
-9
6. 1
0 3
0.4
5
1.
10-<
I 0
.75
0
.75
2. 1
0 -7
10
150
1. 1
0-<I
3
.0
0.7
5
-7
3. 1
0 45
20
3
. 1
0-9
0
.5
0.2
5
-<I
7. 1
0 30
5
5. 1
0-9
0.5
0
.4
7 .1
0-7
3.5
50
1
. 10
-10
0.4
o.
1
.., w
1--'

TABL
E 3
(co
ntd
.)
2 I
3 I
4
MAY
MAL
S
Smal
I
rod
en
ts
2.
10 -7
4
0
ts
Ung
ulat
e an
imal
s -8
5
. 10
10
4
Inse
ct-e
ati
ng
-8
4
. 10
20
3
smol
I
pre
da
tors
8
/10
-8
0.4
6
NOTE
S
1.
The
coef
fici
ents
are
cal
cula
ted
in
te
rms
of a
ir-d
ry m
atte
r.
2.
In
the
case
of
vert
ebra
tes.
on
ly S
r-90
in
th
e sk
elet
on w
as
take
n in
to a
ccou
nt.
5 l
6
3.
10
-9
0.5
3.
10
-9
0.5
8.
10
-9
0.8
5
4.1
0-9
1
I 7 0.2
5
0.2
5
0.6
0.3
... w
N

433 -
Table 4
Coefficients of occl.l'nulotion of Sr-90 and Cs-137 in living organisms in aquatic and related environments (1)
Sr-90 Cs-137 LIVING ORGANISMS
in relation to in relation to in relation to in rel at ion to preceding I ink water preceding I ink water
FISH
Plant-eat Ing 3 450 0.4 130
Mixed diet 3 450 0.4 130
Level I predators 0.6 350 4 540
Level II predators 0.2 70 2 1 200
BIRDS
Plant-eating 4 3 700 - -
Fish-eating 0.2 150 0.8 100
1) in terms of air-dry matter; only Sr-90 in the skeleton is taken into account.

r u
:r
e A Ill I.ii
fO
20
JO
~ 40 ...
JO
40
- 434 -
1 1-5 YEARS
2- -to YEP.I?~
3-25 YEARS
Sr-90 INVENTORY(%)
50,.__ _______ ::_G_:::f<E'/ i:-o::._c:"'c::e.s:.:c...cT ____ _
10 20 30 40 so 50 70 Bo go
2 1
J
JO
40
LE.AC1-1£D CI-IEl?NOcE.N\ __J so
Fiq. 1: DYNAMICS OF DISTRIBUTION OF RADIOACTIVE SUBSTANCES THROUGH PROFILES OF DIFFERENT SOIL TYPES

( ,._,
0 OJ ' I,.
VI
- 435 -
10',--~·------·------- ------~----~--+---------
8 ,--+---•----+-------t--+-----+---l---+------t--+---
5i-----t-----+.,..--~,f-----+-----+----f------+----1-----1--l----~
10' ~=+==t>-. 8 f-----+--
51--+---+-----l----+--.:::0,,f-_c;::---+----:--+---c-=-+--+---_j_---j
-f 10
1958 19.i2. 19f6 1970 1974 f97d
'/EAR.
Fig. 2: CHANGE IN Sr-90 CONCENTRATION IN HERBACEOUS VEGETATION AS A FUNCTION OF THE DEPTH OF THE ROOT SYSTEMS

- 436 -

- 437 -
Plutonium Release to the Environment During Chernobyl
Accident
V.M. KULAKOV, 1.L. DOBRYNIN, V.N. KOSYAKOV, S.K. LISIN, Y.F. RODIONOV, I.K. SHVETOV
I.V. Kurchatov Institute of Atomic Energy Moscow, USSR

- 438 -
INTRODUCTION
About 4,5 years passed since the Chernobyl accident. During this time
the true scale of the catastrophe has become more and more clear, the
data on the quantity of the radionucl ides released, the structure of
their environmental distribution and other aspects have been corrected
and summarized. At present the fol lowing long-I ived radionucl ides can
be considered responsible for the radiation situation in the
contaminated areas : Sr-90 (Tv., • 29 years), Cs-137 <Tv., - 30 years),
Pu-238 <Tv., - 88 years), Pu-239 <Tv., - 2.4.104 years), Pu-240 (Tv.,
6.6.103 years), Pu-241 (Tv., 14 years), Am-241 (Tv., • 430
years), Cm-244 (Tv., - 18.5 years).
As has been found, the main feature of the Chernobyl accident is that
apart from the .release of the volatile and gaseous fission products,
the fuel itself, small "hot" particles of dispersed fuel, structural
materials and products of their interaction at high temperatures have
been released to the environment. The largest longterm impact of the
accident wi 11 be due to the release of the long-I ived highly toxic
radifonucl ides of transuranium elements (and mainly of plutonium) to
the environment. Evaluation of the quantity of plutonium release and
the study of plutonium distribution in the environment at the first
stage were especially important not only for the evaluation of the
radioecological situation, but for the determination of the true scale
of the accidental release as wel I.
I. Plutonium accumulation in the fuel and quantity of the plutonium
released to the environment
The 4-th block of Chernobyl NPP was commissioned in December 1983. By
the time of the accident it had 715 effective operating days. The
burnup of most pat of 190.2 T nuclear fuel (about 75% reached the value
of 11-17 MW days/kg (of U). The average burnup value for the core was
10.9 MWD/kg. As a result 660 kg plutonium had accumulated in the core
of the reactor by 26.04.1986. (See Table 1).

- 439 -
Table 1
The quantities of some radionucl ides accumulated in
the fuel of ChNPP-4 by 26.04.1986 (Ref.1)
Rad i onuc I ides Mass, kg Radioactivity, Bq
238 1.479 9.38 1014
239 412.7 9.48 1014
PU 240 176 1 .48 1015
241 49. 11 1 .84 1017
242 14. 16 2.06 1012
241 1.08 1 .37 1014
Am 243 0.73 5.38 1012
242 0.256 3.08 1016
Cm 244 0.06 1. 78 1014
Preliminary evaluations of the released fuel fraction conducted in June
1986 at Kurchatov IAE have given the figure of about 3% (Ref .2). Later
this figure was corrected and taking into account all the experimental
data it was accepted as 3.5±0.5%. It means that the total plutonium
isotopes quantity released to the environment reaches about 23 kg.
11. Techniques for the determination of plutonium isotopes in
environmental samples
2.1 Radiochemical techniques for plutonium isolation and determination
The representative samples of contaminated soi Is were taken according
to the data of pre I iminary ¥-spectral measurements. After the
mineralization for 5 hours at 500-550 c· the samples were homogenized
by quartering and 20g fractions were weighed out and directed to the

- 440 -
analyses. Complete dissolution of samples by treatment with HN03 -HF
mixture as we! I as radionuclide leaching by treatment with 0.3 M
solution of KBro3 in 7M HN03 at heating were applied. An average
leaching efficiency of the last procedure reached the value of
86.5±1.8% at P•95. The routine ionexchange technique used at the very
beginning for the plutonium isolation was replaced by express
techniques based on the extract ion of Pu( IV) by Tr ioctyl amine (TOA)
(Ref .3) or by Trioctylphosphine oxide (TOPO) (Ref.4) depending on the
task and instrumental avai labi I ity. The solvent extraction with 10% TOA
solution in oxylene was most widely applied. The flow sheet of the
technique Is shown in Fig.1. The plutonium isotope contents were
determined by the isotope dilution technique with Pu-236 as a tracer.
The activity of plutonium isotopes were calculated by using the
fol lowing equation
A. ~1 V (N1-N2) (Bq)
N3
( 1 )
where A is tht total ~-activity of the plutonium isotopes (Pu-238+Pu-
239+Pu-240) in the sample analysed (Bq); A1 -is the specific
<>I-activity of the tracer solution (Bq/ml);; V - is the volume of the
introduced tracer solution (ml); N1 - is the fraction of the total
~-activity contributed by Pu-238 + Pu-239 + Pu-240 to the ~-spectrum of
plutonium obtained from the sample (%); N2 - is the fr act ion of the
~-activity of the tracer, contributed by the heavier plutonium isotopes
(Pu-238 and Pu-239) to the ~-spectrum of the tracer (%); N3 - is the
fraction of the total ~-activity contributed by Pu-236 to the
~-spectrum of the sample analysed(%).
The total plutonium "\-activity in these express techniques can be
determined by measuring an aliquot of the extract evaporated on
specially prepared spectrometric targets (Ref.3), or the whole extract
volume when using a I iquid scinti I lat ion counter (Ref.4). In the latter
case the sensitivity of plutonium determination can be essentially
increased by measuring the B-activity of Pu-241.

- 441 -
Soi I sampling by ~8and~rd device S • 1.58 10 km
Separation of the active soi I layer (2 - 3 cm)
Mineralization at soo·c for 5-6 hours
Homogenization by quartering
Weighing and fractionation (20g)
- spectral analysis
Pu leaching by 7 MHN03 + 03 M KBr03 I at 90"C
Filtration or centrifugation
Pu-extraction by 10% TOA
- target preparation
- activity measurement, - spectrometry
Pu content calculation
Fig. 1. The flow sheet of an express technique for plutonium determination in soi I samples

- 442 -
Table 2
The values of Pu/Ce correlation factor calculated for the time of the accident
NN Determination time Sample type Number of Chemical Xcorx10-4 samples treatment
1 . May 1986 aerosols 2 solution 9.8 ± 1.5
2. May-Sept. 1986 soi I 12 solution 9.3 ± 1.0
3. Apr i I 1987 soi I 7 solution 10. 1 ± 1 .o
4. Apr i I 1988 soi I 25 leaching 10.2 ± 0.7
5. December 1988 11 Entombment 11 14 solution 9.4 ± 0.8
6. December 1988 soi I 27 leaching 9.7 ± 1 . 5
7. Apr i I 1989 soi I 13 leaching 10.2 ± 1 .o
8. October 1989 soi I 22 leaching 9.6 ± 1 .0
9. Apri I-Oct. 1989 bottom sediments 6 leaching 10. 1 ± 1.0
10. October 1989 plants 2 leaching 9.6 ± 1.0
11. October 1989 organic comp. 1 leaching 7.8 ± 1 . 5 of soi I
12. October 1989 mineral comp. 2 leaching 9.4 ± 0.9 of soi I
13. October 1989 heavy fraction 2 leaching 9.4 ± 0.8
14. Apr i I 1990 soi I "hot 2 solution 9.4 ± 1 .0 particles"
15. Apr i I 1990 11 Entombment 11 6 solution 9.1 ± 0.4
16. Apr i I 1990 peat soi I 8 leaching 10.5 ± 1 .8
17. Apr i I 1990 sand soi I 7 leaching 9. 1 ± 1 . 1 .
Average 9.6 ± 0.6

- 443 -
2.2 Plutonium determination by using t-spectrometric data
Analyses of the first samples of aerosols and soi Is taken at
contaminated areas immediately after the accident have shown the
presence of dispersed fuel particles with a radionucl ides composition
typicial for RBMC fuel in al I samples. Significant deviations from this
composition appeared only for gaseous and volatile radionucl ides. The
bulk of raidonuclides were strongly associated with the U02 fuel
matrix and relatively stable to atmospheric influences. These results,
together with calculations of the accumulation of plutonium and fission
products, taking into account their diffusion during reactor operation,
demonstrated the possibl ity of applying the i-spectrometric data
obtained during radiation assessment of contaminated areas for the
determination of plutonium. Plutonium isotope activity may be
determined by using certain rel at ions between plutonium isotopes ans
some ¥-emitting radionucl ides, which can be used as tracers for RBMC
fuel of similar burnup. Zr-95, Nd-145 and Ce-144 can be applied as such
tracers. Most of the analyses were accomplished using the fol lowing
correlation factor between the contents of plutonium isotopes and Ce-
144:
Kcor. • A~ (~Pu)/AB (Ce-144) (2)
The value of this correlation factor averaged for the entire
the time of the accident was 9.0 10-4 - Wide application
correlation factor the '6-spectrometr ic measurements
core at of this
of the
contaminated areas al lowed the data of various Institutions to be
corrected and compared and the maps of surface plutonium contamlantion
of areas to be produced and the entire plutonium release to be
quantitatively evaluated.
I I I.Experimental verification of the Pu/Ce correlation factor stab I I lty
Real plutonium content determinations using radiochemical techniques
were carried out periodically in para I lei with If-spectrometric
measurements of the samples. such periodical verifications were

- 444 -
important both for elucidation of the possibi I ity of separation of
plutonium and cerium during the accident and confirmation of
applicability of the correlation factor. It is obvious that the
radionucl ides released to the environment are gradually involved into
the existing natural migration process and their behaviour will be
mostly detemrlned by physico-chemical properties of the elements which
are sufficiently different.
A large number of samples of various kinds of soil taken at
contamianted areas, individual ground components, aerosols, bottom
sediments, various fuel containing debris from the "Entombment"
(Containment of destroyed reactor bui !ding), "hot particles" taken in
the "Envtombment" and in soi I samples have been analysed since Apri I
1986. Some data on the correlation factor determination using the
Pu/Ce-144 relation are summarized in Table 2. It is seem from the table
that the correlation factor values obtained for the samples taken from
the reactor core and from the environment are in a rather good
agreement.
IV. An automated system for data treatment and contamination maps
drawing
An automated Information System (AIS) "Proba" was developped in 1986 at
Kurchatov IAE for the expert evaluation of the information received
from Chernoby I and other areas (Ref. 5). It gave us the poss i bi Ii ty to
accumulate, evaluate and store various actual and digital information
on the radiation contamination of the areas associated with certain
geographical coordinates by electronic maps. At the present time AIS
converted to radioecological monitoring system with the purposes, tasks
and possibi I ities designated to developpe techniques for verification
and evaluation of the data reveiced from the areas with various
contamination levels (from practically clean to heavy contaminated).
Not only the Chernobyl area, but also some areas in Belorussia, the
Ukraine, RSFSR are involved in the assessment sphere of AIS "Proba".

- 445 -
The information-analysis system includes developed calculation and
analytical programs ut i I izing the techniques and concepts of expert
evaluation of incoming data and their statistical and model treatment.
The system al lows to evaluate the qua I ity (representativeness) of
samples and measurements, rel iabi I ity level of the data, to carry out
statistical polyparametric analysis and to give the information In form
of video and hard copies of coloured maps, where area distribution of
plutonium, strontium and caesium is shown with different colours in
accordance with the temporary standards for soi I radioactive
contamination density (established in May 1986). The scales of
measurements and the volume of Information to be treated to obtain the
contamination distribution maps are seen from the fol lowing figures.
The natural background in the European part of the USSR is 0.01-0.02
mR/h and the total area contaminated up to a level of 0.2 mR/h was about 200.000 km2 in the first days after the accident.
The first evaluations of the levels of radioactive contamination
delineating the most critical spots had been accomplished by the summer
1986. The appl icatlon of the correlation factor al lowed to obtain the
maps of surface contamination by plutonium for the large areas around
Chernobyl by 1987. These maps were directed to the Government. One of
these maps are presented in figure 2.
At present AIS is used for continuous inspect ion of radionucl ides
behaviour in the environment (migration mechanism, penetration levels,
correlation factors stabi I ity). Some prognoses for dose values are
prepared on the basis of AIS memory and mathematical models (Monte
Carlo calculations) for the areas inspected.
At present radioisotopes of Cs and Sr are the main components of the
radioactive contamination outside the 30-km Chernobyl zone and
plutonium isotopes - inside the zone. Aero- and ground inspection
accomplished in 1988 covering about 350.000 km2 area did not reveal
significant changes in Pu isol ine positions in comparison with the past
- 446 -
years. The depth of plutonium contaminated layers averaged over various
soi Is is not more than 5-7 cm (for 4 years). This layers contains about
90% of plutonium.
The results of regressive analysis and the maps of space-time
distribution (from Chernobyl around Europe) were also obtained with the
help of AIS. We suppose that these data would al low us to describe more
precisely the accident process and release characteristics and to test
the model of radioactivity transport in the atmosphere.
The AIS programm makes it possible to prepare passports for large areas
and to replace the inspection by monitoring.
- 447 -
R E F E R E N C E S
1. A.A. BOROVOY, Y.L. DOBRYNIN, V.M. KULAKOV, L.A. LEVINA
"Calculations of correlation factors for the fuel of 4-th reactor
of CNPP". Al I Union Conf. "Radiation aspects of Chernobyl
ace i dent", Obn i nsl< 22-25 June, 1988.
2. USSR St. Com. Utl I. At. Energy - "The accident at the Chernobyl NPP
and its consequences". IAEA Post Accident Review Meeting, Vienna
25-29 Sept. 1986.
3. I .K. SHVETSOV, B.S. KALINICHENKO et al.
Express detection of plutonium in environmental objects, Abstracts
of Int. Conf. "Actinides-89". Tashkent 24-29 Sept. 1989. M. NAUKA?
1989, p. 442.
4. V.N. KOSYAKOV, N.G. YAKOVLEY et al.
"Determination of actinides in the environment". Abstracts of Int.
Conf. "Actinides-89", M, NAUKA, 1989, pp. 433-434.
5. S.A. ANSHUKOV et al.
"lnformat ion System for the assessment of radioactive
contaminat Ion". - Preprint IAE - 4925/1, M. 1989.

/ I /~~-' ) --------- -
0
Pu(0-) _ 13?1
Pu Cs)- A 38:l
_ 448 -
fu(o)
/ .. / /
;

- 449 -
Agricultural Aspects of the Radiation Situation in the Areas Contaminated by the Southern Urals and Chernobyl Accidents
Boris s. PRISTER

- 450 -
ABSTRACT
Being different in nature, the accidents in the Southern Urals and at
Chernobyl gave rise to radiation situations with their own specific
features, affecting, In particular, agricultural activities in the
contaminated area. The main specific features of the Chernobyl accident
were the vast scale of contamination, the large contamination gradients
even at considerable distances from the accident site, the
heterogeneity of radioactive fallout distribution at micro-level, the
inconsistent nature of changes in soi I contamination levels, and
separation of the radionucl ides from the fallout.
In spite of the fundamental differences in the chemical character of
the types of radioactive fallout, the radionucl ides of 90sr and
137cs were in both cases readily avai I able for assimilation by plant
root systems. In both the Southern Urals and the Ukraine the
coefficients of radionuclide bui Id-up in soi Is with identical
agrochemical properties fal I within the observation accuracy I imits. As
a resu It of the Chernoby I ace i dent, Ii ght soi Is of soddy-podzo Ii c
composition were subjected to the greatest contamination, their
radionuclide bul Id-up coefficients being 8-15 times higher than those
of the chernozem soi Is in the Southern Urals. An abnormally high level
of radiocaesium accumulation was observed in meadow grasses, which
explains the leading role of milk contamination in the radiation
situation on private holdings.

- 451 -
The greatest danger during the initial period after the Chernobyl NPP
accident was the "iodine hazard", which was mainly reflected in 1311
contamination of milk, whose consumption by the population accounts for
up to 90% of the total intake of this nuclide into the human body. The
only real IY effective way of avoiding high doses to the thyroid gland
of humans on a wide scale was to take the precaution (as in the
Chernobyl case) of banning milk consumption in the various areas, where
the radiation situation was monitored on the basis of the gamma
radiation dose rate.
Prohibitive measures are difficult to maintain for any major length of
time, but the iodine hazard period did not last more than 45 days.
After this time no 1311 was detected in milk, this being due to both
radioactive decay and natural cleansing of pasture vegetation. The
process of removal of 1311 and of other radionucl ides in fields is
expressed wel I by an exponential model with two components.
Both in simulation experiments involving plants contaminated with a
soluble form of the nuclide in 1- ionic form, and under the actual
conditions resulting from the Chernobyl accident, some 70-90% of the
nuclide is removed from the vegetative plant mass with a half-loss
period of TJ:::; 0.8-3.0 days, while some 10-30% is removed with Tl -
7-14 days, depending on the plants' biological characteristics and age,
the type of fallout and the weather conditions. 1 The fraction which
fixes more strongly in plants is basically the sole component playing a
role in 1311 intake by cows, and then by man, and this feature is
also observed with respect to other nucl ides.
Caesium intake into the human body via food products in the first post
accident year is mainly via the "non-root" contamination pathway.
Calculations are based on the assumption that the coefficient of
radionuclide retention on pasture vegetation with a biomass of 1 kg/m,
is 0.2; the caesium content in grass is described by a two-component
exponential model with half-periods of natural cleansing of 3 days
(70%) and 50 days (30%):
where b is a fallout density of 10-6 Ci/m,.

- 452 -
The grazing season lasts 6 months, with haymaking taking place in the
I ast 3 months of this. A cow consumes 50 kg of gr ass per day, the
biological half-I ife of 137cs in a cow is 30 days, and the amount of
radionucl ides in the daily milk yield is 0.13 or 0.013 per I itre of
milk (given an average daily milk yield of 10 litres). The caesium
content in milk before the cows are stabled is calculated by the
formula:
where 9n is
(qO is the
the daily intake of 137cs by a cow,
initial contamination of the grass); >.K
equa I to q~. 50
is the constant T
of radionuclide biological half-I ife in a cow - 0.023 day-1, \2 =
0.014, ~1 = 0.231.
During the time the cows are stabled the caesium concentration in the
hay is taken as being a constant equal to the average concentration in
the grass during the haymaking period, determined by the formula:
h I . th were Ctis e period of averaging (haymaking).
The 134cs content in grass and milk in the first year is calculated
on the assumption that the ratio of its concentration in fallout to the
concentration of 137cs is maintained at 1:2 - 1:1.5.
The models described were used to predict the radiation situation in
the zone of influence of the Chernobyl accident. 2
Experimental research into the process involved in non-root
contamination of vegetation, carried out in 1986 in the 30-km zone and
the environs of Kiev 3, showed that the quantitative parameters of
this process (retention coefficients and half-loss periods) came close
to the values we had observed in experiments involving contamination of

- 453 -
grocenoses with radionucl ides in soluble forms. This demonstrates the
high degree of relative biological mobi I ity (RBM) of radionucl ides in
the composition of the matter contained in Chernobyl fallout. The RBM
of 137cs outside the 30-km zone is 80-100%.
Over-irradiation of the thyroid gland in man was avoided through
restrictive measures, primarily stopping the consumption of whole milk
with a total volumetric (!·activity of over 1·10-7 Ci/I (3 700 Bq/1).
In p I aces where such measures were int reduced I ate due to a I ack of
information on the radiation situation, or were not strictly
implemented, the thyroid gland irradiation doses were extremely high in
some chi I dren.
Banning milk consumption during the
intake of the long-I ived nucl ides
This is particularly important
iodine hazard period also I imited
134, 137cs and 89, 90sr into man.
as regards 90sr, which when
deposited in the skeleton even fol lowing just brief intake - wi I I cause
irradiation of the bone marrow ti I I the end of a person's I ife.
Estimates of the radionuclide composition of fallout on the territory
of the Ukrainian SSR - based on data obtained in May/early June 1986 -
showed that the radiation hazard outside the 30-km zone stemmed mainly
from external gamma-irradiation (gamma-radiation from short- and
medium-I ived radionucl ides)
134,137cs. The 137cs;90sr
and from internal gamma-irradiation by
concentration ratio in soi I varied
widely, from 10 for the "western" fa! lout trai I to 1.2 (from 2.0 to
0.5) for the "southern" trai I on average. A 137cs;90sr ratio near
1.0 was usually observed at 90sr soi I contamination levels below 3.0
Ci/km, (3.0 TBq/km,), which was taken as the I imit value. Therefore,
the chief factor in the radiation situation after the "iodine period"
is 137cs contamination, which causes both external and internal
irradiation of humans.
The main specific feature of the radiation situation in the Polesye
(Pripyat Marshes) is the absence of soi I contamination gradients
displaying the consistent changes in certain directions characteristic
of the radioactive trai Is formed in the Windscale and Southern Urals
accidents. Similar studies of soi I contamination levels in the
Ukrainian part of the Polesye revealed a large degree of heterogeneity
in the radiation field pattern; this makes it virtually impossible to

- 454 -
rely on maps plotting contamination levels by means of isol ines to
predict the radioactive contamination levels of agricultural products
from a given piece of land - field, pasture or haymeadow. Fields with
a mean contamination level of from 40 to 100 Ci/km, occur in areas
bounded by 137cs soi I contamination isol ines of from 5 to 15 Ci/km,,
while fields some 50-150 ha large with a mean contamination level of
under 15 Ci/km, have been recorded in areas intersected by 40 Ci/km,
i so Ii nes.
The contamination levels of the Republic's soi Is were rapidly estimated
in 1986 by taking representative samples from each administrative area,
including 20-25 collective farms. For this purpose, 25 samples of soi I
were taken from the arable horizon at each farm and carefully averaged.
An average sample for each area was prepared from the average samples
taken at each farm, and the 134,137cs concentration in these
determined by a gamma-spectrometric method and the 90sr concentration
by a radiochemical method. In this way we were able to carry out a
pre I iminary analysis of the situation in the Republic's agricultural
areas as a whole within 10 days, using the faci I ities of a number of
government departments. In 1987 a thorough gamma-survey was carried
out of al I agricultural lands in some 20 areas where 137cs
contamination exceeded 5 Ci/km,. At the same time, samples were taken
to study the radionuclide c.omposit ion of the contamination. In
subsequent years areas with a contamination level of up to 1 Ci/km,
were also gamma-surveyed.
A detailed study of the soi Is led to those with contamination exceeding
40 Ci/km, being taken out of use, and to a reduct ion in produce,
primarily milk, with a radionuclide concentration above the set I imits.
A forecast of contamination levels in agricultural produce in 1987 was
made using previously obtained values for coefficients of soi I-to-plant
radionuclide transfer (mostly obtained from
fallout tr a i I). 5 From 1987 on, a
studies of
study was
the
made
Eastern
of the Urals
137cs concentration in al I the I inks of the human food-cha ins and in
animal feedstuffs in 31 areas of the Ukrainian Polesye, i.e. in Rovno,
Zh i tomi r, Kiev and Chernigov ob lasts (regions). The 137cs
concentration in the soi I was measured in averaged samples taken from
each field from which plant samples were taken.

- 455 -
Table 1 gives the transfer coefficient (TC) values, averaged for zones
with similar agrochemical soi I properties, these soi Is being divided
into 3 groups according to their saline extract pH: - from 4.5 to
5.5, acidic; 11 - from 5.6 to 6.5, slightly acidic; 111 - from 6.6 to
7.2, neutral. This parameter best reflects 137cs uptake by plants,
as confirmed by other studies. 6
As Table shows, for a given contamination level the 137cs
concentration in products from Group I soi Is wi I I be 2-8 times higher
than in those from Group I I I soi Is.
Group I inc I udes soddy-podzo I i c sandy and sandy- I oam soi Is, Group I I -
light-grey and grey podzolised soils, and Group Ill - dark-grey and
chernozem soi Is with signs of podzol isation.
Table 2 gives the TC for 90sr transfer into the main agricultural
plants from the soi Is classified above. The differences in the 90sr
TC values for the soil categories are 2-5 times lower than those for
137cs.
Overal I, radionuclide transfer into plants from the soi Is of the
Polesye reflects the particular properties of the soi Is: Ii ght
mechanical composition, low in micaceous and argi I laceous minerals, low
in humus (0.4-2.1%), and with low absorptive capacity (1-10 mg equiv.
per 100 g of soi I).
The averaged values for the coefficients of radionuclide transfer from
different types of soi I into the main types of agricultural produce,
observed in the Kyshtym and Chernobyl accident zones, tally with one
another quite wel I despite considerable differences in soi I and
climatic conditions (Table 3). This confirms the high biological
avai labi I ity of the 90sr in the Chernobyl fallout and, in our
opinion, is of key sign if i ca nee, s i nee i t means we can use the I a r ge
amount of previously obtained experimental material on radionuclide
behaviour in food chains to predict the consequences of different types
of radiation accidents to a degree of accuracy sufficient for planning
protective measures, at least in the period immediately after an
accident.

- 456 -
One general conclusion to emerge from the voluminous factual material,
was that crop-farming produce with a radionuclide concentration below
the established I imits can be obtained from land in the Ukrainian
Polesye with a 137cs soi I contamination level below 40 Ci/km,.
Farming operations have been discontinued on land with higher
contamination levels, while forest has been planted on land where
contamination exceeds 80 Ci/km,.
From 1987 to 1989 there was no significant decrease in the rate of
137cs transfer from soi I to plants (Fig. 1). Evidently,
contamination of agricultural produce wi 11 decrease slowly in future
years as a result of radioactive decay and migration processes.
Introduction of special agrotechnical and agrochemical measures reduces
137cs accumulation in the main agricultural crops harvested by a
factor of 1.5-5.0. Most effective in this respect is the application
of I ime, potassic and phosphoric/potassic fertilisers, wh i I e
application of organic ferti I isers gives the greatest effect.
One radioecological peculiarity of the zone contaminated by the
Chernobyl accident is the substantial increase (three-fold in some
cases) in 137cs accumulation in plants upon appl !cation of nitrogen
ferti I isers, usually in the form of acid salts. In the Southern Urals.
nitrogen ferti I iser caused a much smaller increase in radionuclide
concentrations in plants - by 20-30%. In low-humus sandy soi Is an
increase in crop yields is impossible unless nitrogen fert i I isers are
used, but these should be in the ammonium form as far as possible with
an N:P:K ratio of 1:1,5-1,8:2,0.
Intake of 137cs into man in the Ukrainian Polesye zone is mainly due
(70-90%) to consumption of milk and beef, and attention should
therefore focus on the conditions under which these foods are produced.
An analysis of the structure of I ivestock rat ions has shown that
contaminated hay accounts for contamination of milk and meat produced
in the pub I ic sector to the fol lowing degrees: 35% in the winter season
(cows stabled) and up to 97% in summer (grazing on cultivated
pastures). Differences in ration structure lead to substantially

- 457 -
greater (up to 5 times) intake of 137cs by cattle on private
holdings, something also observed in the Southern Urals accident zone.
The complex radiation situation in the Polesye area was further
comp I icated by the fact that in most populated areas the people grow
hay and graze cattle on various types of unsuitable land, at forest
edges and even deep inside forests. such p I aces have cont am i nation
levels between 1.5 and 8.0 times higher than the adjacent arable land,
this being due to air turbulence as the radioactive cloud passed over
them, leading to the capture and deposition on the soi I of radioactive
substances from higher atmospheric layers.
Similar mechanisms played a role in formation of the Eastern Urals
fallout trai I.
This was one of the reasons why cows produced milk with a 137cs
concentration substantially exceeding the established I im it of
370 Bq/kg, even on contamination isol ines very much lower than the
15 Ci/km, adopted as the I imit level for soi I contamination.
The main problem encountered in ensuring radiation safety stems from
production of milk on private holdings, which obtain coarse feeds from
natural lands. Research in the southern Urals 7 has shown that on
peaty soi Is 137cs accumulation by plants can be 30 times higher than
on soddy-podzol ic sandy-loam soi I.
Peat-bog soi Is are widely found throughout the Ukrainian Polesye zone.
For example, in the northern areas of Rovno oblast which suffered the
worst contamination, peaty soi Is make up some 30% of the agricultural
land. Many of the terraces above the floodplain and undrained
depressions in the Chernigov, Kiev and Zhitomir oblasts also have peaty
and peat-bog soi Is with a varying degree of gleying, where the
coefficients of 137cs transfer into meadow vegetation are dozens of
times higher than those in mineralised soddy-podzol ic soi Is.
In field experiments, improvement of soi Is by I iming, ploughing or
rotavating and applying mineral ferti I isers reduces 137cs transfer
into plants by up to 10 times, but in actual production conditions this

- 458 -
approach is not as effective, the concentration of the nuclide in grass
being reduced by 1.3-3.5 times.
The distribution of 137cs in biomass by herbage height is non
uniform: in the basal parts of plants (up to a height of 5 cm) it is
found in concentrations which are 3-8 times greater than in the top
part. Nuclide concentrations substantially greater than those in the
basal parts are observed in the mat of dead, but not yet decomposed,
plants. Thus, when grazing animals on low-yielding overgrazed pastures
the 137cs concentration in cows' milk may be substantially higher
than when grazing them or making hay on high-yielding or cultivated
pastures with the same contamination level.
Al I this, together with the heterogeneous nature of the contamination
in the area, explains why mi II< exceeding the permissible I imit was
produced on some private holdings on land with a 137cs contamination
level of 2 Ci/km, or even lower.
The Chernobyl accident contaminated much vaster expanses of land than
did the Windscale and Southern Urals accidents (in which only narrow
fallout trai Is were formed); as a result, private holdings are
hindered, and in some populated areas even prevented, from providing
coarse feed with a permissible radionuclide concentration through
changing the structure of sown areas and by grazing their cat t I e and
growing hay in 11 clean" areas only.
An important radioecological feature of the zone of intense Chernobyl
contamination is that it belongs to a geochemical province in which the
amount of most trace elements in the soi I is from several to dozens of
times lower than the minimum amount required by plants and animals.
Liming soi Is for the purpose of reducing radionuclide transfer from
soi I to plants reduces the concentration of trace elements in
feedstuffs and food products, which aggravates trace element deficiency
in the diet of man and animals and faci I itates the spread of plant,
animal and human diseases. It is therefore necessary to devise and
take measures to increase the amount of trace elements in soi Is,
feedstuffs and food products.

- 459 -
BIBLIOGRAPHY
1. B. S. Prister, N. A. Loshchilov, O. F. Nemets. V. A. Poyarkov:
Fundamentals of agricultural radiology; Kiev, Urozhay, 1988,
264 pp.
2. R. M. Barkudarov, E. I. Gordeyev, I. K. Dibobeye; I. A. Likhtarev,
U. Ya. Margulis, D. P. Osanov, o. A. Pavlovsky, B. s. Prister, M.
N. Savkin, V. P. Shashov: Methodological principles of calculating
the levels of external and internal irradiation of the population
for taking rapid dee is i ans; Medi ca I aspects of the Chernoby I NPP
accident; materials of scientific conference, 11-13 May 1988, Kiev,
Zdorove, 1988, pp. 111-118.
3. B. S. Prister, N. V. Tkachenko: Distribution of gamma-emitting
radionucl ides among various components of coniferous forest over a
period of two years after radioactive contamination: proceedings of
the First Al I-Union Radiobiological Congress, Moscow, 21-27 August
1989, Pushchino, 1989, pp. 514-515.
4. P. F. Bandar, Yu. A. Ivanov, V. V. Zaika: Vertical migration in the
soi I by radionuclide fallout from the Chernobyl NPP release; in
Pr inc i p I es and methods of I andscape-geochem i ca I studies of
radionuclide migration, suzdal, 13-17 November 1989, Moscow, USSR
Sc. Acad., p. 74.
5. B. v. Nikipelov, G. N. Romanov, L.A. Buldakov, N. s. Babayev,
Yu. B. Kho I ina, E. I. Miker in: The 1957 Southern Urals radiation
accident; Atomnaya energiya, vol. 67, No. 2, August 1989, pp. 74-
80.
6. W. Kezpen: 137cs sorption and desorption in relation to
properties of 17 soi Is; 4th International Symposium of
Radioecologists on the Environmental Impact of Nuclear Accidents,
Cadarache, 14-18 March 1988, Vol 1 Cadarache 1988, pp. D 188 to
D 201.
7. T. A. Fedorova: Assimilation of strontium and calcium by plants as
a function of soi I properties; Agrokhimiya, 1968, No. 6, pp. 108-
114.

,.1
bie
l:
C
s-1
37
P
RO
PO
RT
ION
AL
ITY
C
OE
FF
ICIE
NT
S
(av
era
ge
for
19
87
-19
89
) (B
q/k
g
natu
ral
pro
du
ct)
I
(kB
q/m
' so
il)
-- r If O
bla
st
KIE
V
1, S
oi
1 g
rou
p
I I
I I
sali
ne
pH
4.5
-5.5
5
.6-6
.5
I' 11 :-1
i 1
k
l.9
-2.1
0
.3
. M
eat
1.1
-l.
8
0.6
I
Hay
fr
om
cu
ltiv
ate
d
' p
astu
res
3.9
2
.8
I I H
ay
fro
m
natu
ral
i h
av
field
s
1 0
. 7
4.0
.
.
1-----·
!I L
ucern
e
( fr
esh
m
ass
) 0
.8
0.4
i
Clo
ver
lfre
sh
m
ass
) 0
.8-2
.3
0.3
ii
Vetc
h
( fr
esh
m
ass
J 0
.9-3
.6
0.5
i
Lu
pin
<
fresh
m
ass
) 0
.9-1
.9
0.4
ii
Fo
dd
er
beet
0.5
0
.4
Ii S
i !a
ge
maiz
e
0.
5 0
.2
I~ \! W
inte
r w
heat
(gra
in)
0.
5 0
.2
ii Win
ter
rye
(gra
in)
0.4
O
.l
L W
inte
r b
arl
ey
(g
rain
) 0
.3
O.l
If
-:1
Po
tato
0
.3
0.1
!I
I E
dib
le
beet
0.6
0
.3
i cab
bag
e
0.3
0
.1
i T
om
ato
0
.2
0.0
9
! C
uc
um
be
r 0
.1
0.0
6
d O
nio
n
0.6
0
.2
)i G
reen
s 0
.3
0.0
5
iJ:.-:.:c~
r ro
t (r
oo
t)
0.
3 0
.12
ZH
ITO
MIR
I I
I I
6.5
-7.5
4
.5-5
.5
0.1
5
0.5
-l .
6
0.3
-0.4
l.
3-2
.2
1.7
4
. l
I .
9 l O
-I
5
0 . 2
0
.8
0.3
0
.9
0.2
1
. 1
0.2
-
0.2
0
.7
0.1
0
. 5
0.0
5
0.4
0
.07
0
.3
0.0
0
. 3
0.0
4
0.4
0
.06
0
.7
0.
0 4
0.4
0
.03
0
.2
0.0
3
0.1
5
0 .
l l
0.7
0
.02
0
.2
0.0
5
0.4
CH
ERN
I G
OV
I 4
.5-5
.5
0.1
-1.5
0
.6-4
.8
4.7
I 7
0.6
I
. I
I . 6
0
.7
0.
5 0
. 5
0.4
0
. 3
0.2
0.4
0
.4
0.2
0
. I 9
0
.1
0.
5 0
.2
0.3
RO
VN
O
I I
6.5
-7.5
0.3
-0.6
I
.0-2
.2
2.2
10
-40
0.9
0
.4
0.5
-0
.4
0.2
0.2
0
. I
0.2
0.
4 0
.2
0 .
1 0
.09
0
.06
0
.16
0
.05
0
.2
]
~
O'\
0

Tab
le
2:
Sr-
90
PR
OPO
RT
ION
AL
ITY
C
OE
FF
ICIE
NT
S
(AV
ERA
GE
FOR
19
87
-19
89
) (B
q/k
g
natu
ral
pro
du
ct)
I
(kB
q/m
' so
il)
Ob
last
KIE
V
So
il
gro
up
I
l l
I l
I
Sali
ne
pH
4.5
-5
.5
5.5
-6
.5
6.5
-7
.2
Mi 1
k
3 .
I 1
.4
0.4
7
Hay
fr
om
g
rass
es
(mea
do
w)
10
2
40
I
8
Lu
cern
e
(fre
sh
m
ass)
7
3
58
I
6
Sil
ag
e
Mai
ze
49
I 2
6
Fo
dd
er
beet
1 5
I 2
5
ZH
ITO
MIR
l 4
.5-5
.5
2.5
12
4
6 l
35
I 7
ROV
NO
l I
5.6
-6
.5
2.0
65
37
I 5
I 2
~ "' ,_.

Tab
le
3:
CO
MPA
RIS
ON
O
F M
EAN
MU
LT
I-Y
EA
R
VA
LUES
O
F C
OE
FF
ICIE
NT
S
OF
RA
DIO
NU
CL
IDE
T
RA
NSF
ER
FR
OM
S
OIL
IN
TO
A
GR
ICU
LT
UR
AL
PR
OD
UC
E IN
TH
E SO
UTH
ERN
U
RA
LS
AND
UK
RA
INIA
N
POL
ESY
E
(l!C
i/k
g)/
(Ci/
km
')
of
pro
du
ct,
(f
±
30
%
Ex
ch
an
geab
le
Ca'
in
so
il
Rad
io-
mg
eq
uiv
./1
00
g
(sali
ne
pH)
nu
cli
de
Pro
du
ct
Co
nta
min
ati
on
are
a
0.9
4
.0
25
pH
=4
.5-5
.5
pH
=5
.6-6
.5
pH
=6
.6-7
.2
Hay
fr
om
S
ou
thern
U
rals
I
3 4
. 4
1.1
-1.9
so
wn
gra
sses
Po
lesy
e
I O
2.8
I
. 9
Co
ws'
s S
ou
thern
U
rals
0
. 50
0
.20
0
. 0
4 C
s-1
37
m
ilk
P
ole
sye
0.3
5
0.
19
0 .
I 3
So
uth
ern
U
rals
2
.0
0.8
0
0.2
0
Bee
f P
ole
sye
I .
4 0
.76
0
.55
Hay
fr
om
S
ou
thern
U
rals
5
.7-1
4
I .3
-3.2
0
.3-0
.7
sow
n g
rasses
Po
lesy
e
IO
4.8
2
. 4
Sr-
90
S
ou
thern
U
rals
2
.6
0.5
6
0.0
7-0
.!3
M
i I k
P
ole
s y
e 2
. I
I .
4 0
.07
"" "' N
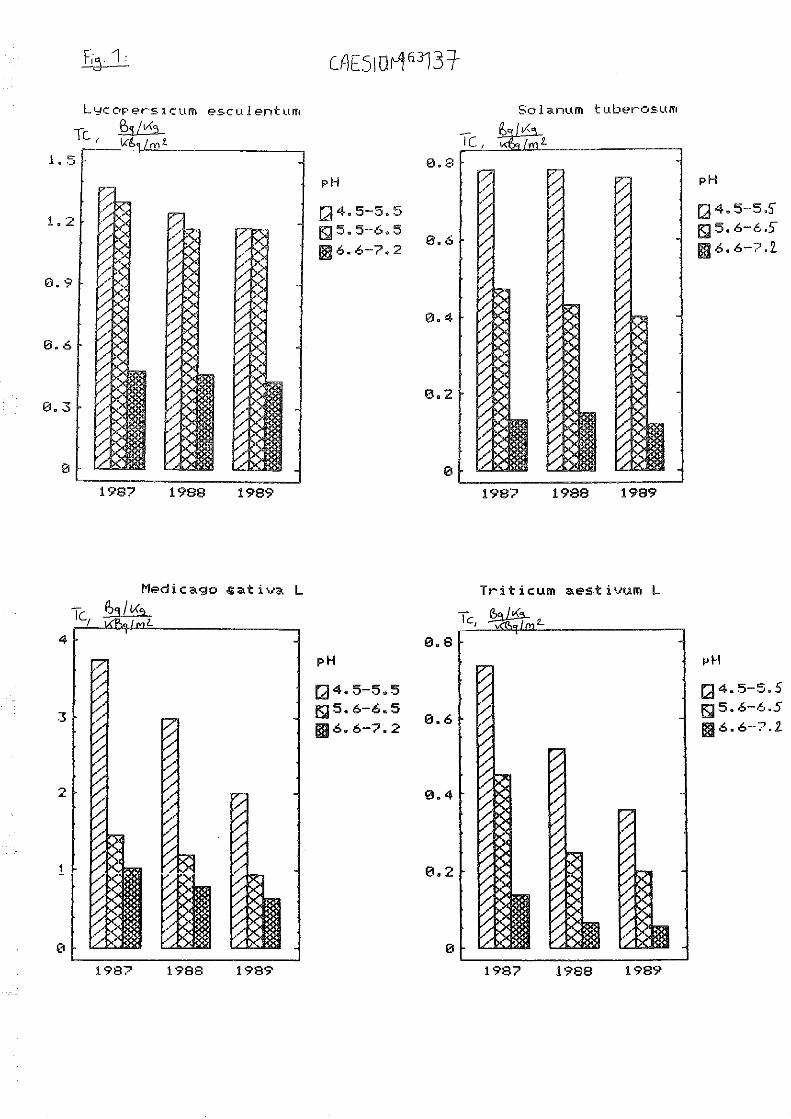
F,5 1 ,_
1. 2
0.9
0.6
0.3
0
1987 1988 1989
.... ti va L
4
3
2
!
(1
1987 1988 1989
CAESiOt-'1 6313=]-
pH
CJ 4. 5-5. 5 !SJ 5. 5-6. 5 Ba 6. 6-7. 2
pH
CJ 4. 5-5. 5 !SJ 5. 6-6. 5
1!!16,6-7.2
0.8
0.6
0.4
0.2
0
0.8
0.6
0.4
0.2
0
Sol :anLlm t u.berosLUT1
Tc,
1987 1988 1989
Triticum aestivum L
Tc,~2..
1987 1988 1989
pH
CJ 4. 5-5.5 !SJ5,6-6.5 1iJJ 6, 6-7. 2.
pH
CJ 4. 5-5. 5 !SJ 5. 6-6.5
1!116,6-7.2.

- 464 -

- 465 -
Processes Governing the Transfer of Radionuclides into
Crops Following the Chernobyl Accident
N.V. GREBENSHCHIKOVA, S.I(. flRSAKOVA, S.f. TIMOFEYEV, A.A. NOVIK, G.I. PALEKSHANOVA
Byelorussian Branch of the Institute of Agricultural Radiology Gomel, USSR

- 466 -
ABSTRACT
Given that the Chernoby I ace i dent cont am i na ted I arge areas of
Byelorussia, we studied the processes governing - and the quantitative
features of - radionuclide accumulation in meadow herbage and staple
agricultural crops grown by farms in the Gome! Region.
The fields are situated on soddy-podzol ic sandy and sandy-loam soi Is
where radiocaesium contamination varied between 15 and 80 Ci/km2.
The quantitative features detected in radionuclide accumulation levels
in crops (depending on soi I composition and p I ant bi o I og i ca I
properties) confirmed the previously established basic mechanisms
governing the transfer of radionucl ides from soi I to plants.
Proportionality coefficients were determined for prediction purposes,
and in 1987 these were (expressed in units of 10-9 Ci/kg per
Ci/km2) 0.24 for grains of winter rye, 0.19 for barley and 0.65 for
oats, 0.16 for potato tubers, 0.10 for beetroot and 0.23 for silage
maize.
These values were a factor of 4-5 lower in 1989.
Depending on meadow type and soi I properties, contamination levels in
meadow herbage differed by up to two orders of magnitude. When the
contaminated turf was reploughed or disc-harrowed and I ime and
potassium phosphate ferti I izers added, contamination levels in the
cultivated herbage fel I by a factor of 4-t.

- 467 -
As a result of the accident at the Chernobyl NPP, the Byelorussian and
Ukrainian Polesye (Pripyat Marshes) - the soi Is of which are critical
as regards the accumulation of radioactive caesium in plants - was the
"region most contaminated with radionucl ides, among which the isotopes
of caesium account for most of the dose.
The study of the processes governing the transfer of radioactive
substances into crops fol lowing the radioactive contamination of
Byelorussia is therefore not merely of scientific interest, but is
essential for making long-term forecasts about radionuclide
accumulation in plants and for devising measures to I imit the uptake of
isotopes into harvest crops.
The migration of radionucl ides in the soi I and plant system was studied
and the quantitative aspects of radionuclide accumulation in meadow
herbage and the main agricultural crops evaluated on farmland in the
Gomel oblast (region) in 1987.
The fields concerned are situated primari IY on soddy-podzol ic sandy and
sandy-loam soi Is, whose radiocaesium contamination density varied from
500 to 2 800 k8q/m2.
The analysis of radiocaesium accumulation levels in crops showed that,
generally speaking, the adoption of a series of soi I improvement
measures (liming, the application of higher doses of mineral
ferti I izers, deep ploughing) produces crops on a farm scale which do
not exceed the maximum permissible radionuclide concentration
(provisionally permissible level), even given contamination densities
of up to 1 500 k8q/m2.
The research and experiments conducted in the Gome I region fol lowing
the Chernobyl accident confirmed the main, wel I-known mechanisms
governing radionuclide accumulation in agricultural plants, i.e. the
transfer of radioactive substances into crops depends on the quantity
and the physico-chemical properties offal lout, the characteristics of
the soi I, the particular biological features of plants and the way the
land is farmed.

- 468 -
Cereals can be classified as fol lows in terms of decreasing
radiocaesium accumulation levels oats-> winter rye-> barley, with
the order for crops requiring ti I I i ng between rows being maize ->
potatoes-> fodder beet.
As a rule, high radiocaesium accumulation in plants was observed where
the soil was supplied with little mobile potassium and the soil
solution produced an acid reaction.
For the purposes of forecasting, multiplier coefficients were
determined, the levels in 1987 (expressed in Sq/kg /k8q/m2) being
0.24 for the grain of winter rye, 0.19 for barley, 0.65 for oats, 0.16
for potato tubers, 0.10 for beetroot and 0.23 for silage maize.
These values had fallen 4 to 5 times by 1989 (Table 1).
The contamination levels of the meadow herbage differed by up to two
orders of magnitude, depending on the type of meadow and the soi I
properties. With the passing of time since the accident, radiocaesium
accumulation in grass fel I by tens and hundreds of times, but the
content of the radionuclide in natural vegetation is sti I I fairly high
(Table 2).
The study of the effect of different soi I cultivation methods on
pollution levels in pasture proves the effectiveness of approaches such
as disc-harrowing with the application of complete mineral ferti I izer
and I ime, and ploughing with prior application of potassium ferti I izers
at the rate of 250 kg active substance per hectare in comparison with
traditional ploughing (Table 3).
The study of the act ion of soi I improvers added to contaminated pasture
prior to sowing to grass showed that double I iming (on the surface and
along the furrow) and the application of zeolite were more effective
than traditional ploughing and the application of phosphogypsum (Table
4) .
Our research has clearly shown that agricultural crops can be
cultivated in areas pol luted by the Chernobyl accident, provided that a
number of measures are taken not only to reduce the extent of
radionuclide transfer from soi Is to plants but also to preserve and
increase soil fertility.

Crop
Winter rye
Bar I ey
Oats
Potatoes
Beet
Maize
Part of
Grain
Straw
Grain
Straw
Grain
Straw
Tubers
- 469 -
COEFFICIENTS OF RADIOCAESIUM
TRANSFER FROM SOILS TO THE
MAIN AGRICULTURAL CROPS
Bq/kg I kBq/m2
crop 1987 1988
0.24 ± 0.06 0.12 ±
0.44 ± 0.20 0.20 ±
0.19 ± 0.09 0.06 ±
0.50 ± 0.30 0.20 ±
0 .65 ± 0. 19 0.30 ±
0.90 ± 0.40 0.40 ±
0.16 ± 0.03 0. 11 ±
Stem & Leaf 0.32 ± 0.04
Table 1
0.04
0.05
0.01
0.05
0. 10
0.10
0.01
Roots 0.10 ± 0.02
0.60 ± 0.10
0.06 ± 0.01
Stem & Leaf
For s i I age 0.23 ± 0.07 0.09 ± 0.02
1989
0.05 ± 0.01
0. 11 ± o. 20
0.04 ± 0. 01
0. 10 ± 0.01
0.22 ± 0. 11
0.48 ± 0.20
0.04 ± 0. 01
0.11 ± 0.01
0.04 ± 0.01
0. 13 ± 0. 02
0.06 ± 0.01

Tab
le
2
DY
NA
MIC
S OF
RA
DIO
CAES
IUM
CO
NTE
NT
IN
THE
HERB
AGE
OF
NATU
RAL
MEA
DOW
S IN
TH
E GO
MEL
RE
GIO
N
Lo
cati
on
o
f sit
es
134,
137
C
s R
adio
caes
ium
co
nte
nt
in g
rass
(k
Bq
/kg
) in
so
i I
----
----
----
----
----
----
----
----
----
----
----
----
----
----
----
----
----
----
---
kBq/
m2
Aut
umn
1987
A
utum
n 19
88
Sp
rin
g
1989
A
utum
n 19
89
Sp
rin
g
1990
Dis
tric
t o
f B
rag
in,
vi I
I age
o
f K
rasn
aya
Gor
a 1
573
62
.90
0
.48
0
. 14
o
. 16
0
.08
Dis
tric
t o
f K
ho
yn
iki,
5
120
no
t d
eter
min
ed
17
.39
6
.66
5
. 18
4
.44
vi
I I
age
of
Lom
achi
Dis
tric
t o
f K
ho
yn
iki,
3
330
155.
40
1.63
0
.56
0
.37
0
.48
vi
I I a
ge
of
Lom
achi
Dis
tric
t o
f N
aro
vly
a,
2 82
7 11
1. 0
4
8.
10
5.9
2
5.9
2
3.
18
vi I
I age
o
f V
erb
ov
ich
i I
"" ..., D
istr
ict
of
Nar
ov
lya,
91
8 4
4.4
0
7.7
7
1. 4
4 1
.66
0
.37
0
vi I
I age
o
f K
onot
op
Dis
tric
t o
f V
etk
a,
4 12
2 n
ot
det
erm
ined
2
8.8
6
14
.80
15
. 17
6
. 10
vi
I I a
ge
of
Bar
tolo
mee
vk
a
Dis
tric
t o
f V
etka
2
490
no
t d
eter
min
ed
6.6
6
1.8
9
1.3
7
o. 5
9 vi
I I a
ge o
f B
arto
lom
eev
ka
Dis
tric
t o
f C
hec
her
sk

- 471 -
THE EFFECT OF DIFFERENT METHODS OF SOIL TREATMENT
ON POLLUTION LEVELS IN PASTURE
(flood plain meadow, 1 110 kBq/m2J
Radiocaesium content in fresh mass
TABLE 3
(kBq/kg)
Experiment variant 1989 1990
~---------------- ---------------- --------------1st crop 2nd crop 1st crop
1 . Control
(natural state) 2.36 ± 0.26 1.30 ± 0.07 1 .07 ± 0.41
2. St/ha I ime on the
ground, disc-harrowing 0.96 ± 0.33 1.59 ± 0.33 0.96 ± 0.26
3. N30-P90-K200 + St/ha
I ime on the ground,
disc-harrowing 0.08 ± 0.04 0.21 ± 0.02 0. 11 ± 0.02
4. Ploughing, along the
furrow N30-P90-K120
+ St/ha I ime 0.78 ± 0.33 0.81 ± 0. 11 1 . 11 ± 0.22
5. K250 on the ground,
ploughing, along the
furrow N30-P90-K120
+ St/ha I ime 0.10 ± 0.02 0.28 ± 0.10 0.30 ± 0.07

EFFE
CT
OF
LAND
IM
PROV
EMEN
T M
EASU
RES
ON
THE
TRA
NSF
ER
OF
RAD
ION
UCL
IDES
IN
TO
PAST
URE
( d
ry
va I
I ey
m
eado
w,
1 59
0 kB
q/m
2)
Rad
ioca
esiu
m
con
ten
t in
fr
esh
m
ass,
K
Bq/
kg
----
----
----
----
----
----
----
----
----
----
---
----
----
----
----
--E
xp
erim
ent
vari
an
t 1
st
cro
p,
1988
2n
d cr
op
, 19
89
1st
cr
op
, 19
90
1 .
Co
ntr
ol
(natu
ral
her
bag
e)
9.2
5 ±
2
.96
3
.33
±
0.4
8
2.3
3 ±
0
.37
2.
Ti
11 i
ng
2.4
1
± 0
.52
1.
66
± 0
. 48
0.3
3 ±
0
.04
3.
10
t/h
a ze
ol
ite o
n th
e g
rou
nd
, ti
11
i ng
1. 3
7 ±
0
. 26
0.7
0 ±
0
.04
0
.33
±
0.2
2
4.
St/
ha
phos
phog
ypsu
m o
n th
e g
rou
nd
, ti
11
i ng
2.5
5 ±
0
.52
1.
48
±
0.7
4
1.0
4 ±
0.5
9
5.
St/
ha
I im
e on
th
e g
rou
nd
, ti
11
i ng
1.3
0 ±
0
.18
0
.67
±
0.1
5
0. 5
6 ±
0
. 11
TABL
E 4 sr-9
0
in
hay
, kB
q/kg
19
89
1.6
6
0.2
9
0.3
0
o. 1
7
0.7
2
... -.J
N

- 473 -
Environmental Distribution and Transport of Radionuclides in West Cumbria following the Windscale and Chernobyl
Accidents
P.J. COUGHTREY, J.A. KIRTON, N.G. MITCHELL
Associated Nuclear Services Ltd. 60 East Street, Epsom, Surrey KT19 8EB, UK

- 474 -
ABSTRACT
Data are summarised for the pattern of deposition of Cs-137 and 1-131 in
\,Jest Cumbria, UK, following the Windscale and Chernobyl accidents and on
the apparent environmental behaviour in terms of retention on plants,
transfer from soil to plant, and transfer to milk and meat. For the 1957
accident, peak deposits of Cs-137 several kilometres south of Windscale
are estimated to be in the range -16000-40000 Bq/Di", Peak recorded
concentration of Cs-137 in milk in October 1957 was 592 Bq/1, two weeks
after the accident. The ratio of concentration in milk (Bq/1) to content
in herbage (Bq/m~l was -0.4 to 0.6 m~/1 for Cs-137 and -0.06 to 0.1 m2 /l
for 1-131. Peak recorded concentration of Cs-137 in milk in May 1986 was
356 Bq/1 and the corresponding ratios of concentration in milk to content
in herbage were 0.37 m"/1 for Cs-137 and 0.31 m:"'/1 for 1-131. The reason
for the higher value for 1-131 recorded after Chernobyl compared to that
for Windscale is not clear. Whereas the initial decline in Cs-137 and 1-
131 content in herbage after the Windscale accident occurred with a
biological half-life of -16 d, initial loss after the Chernobyl accident
was much more rapid, reflecting both the effects of rainfall and the
different times of year of the two inputs. No data appear to exist for
radiocaesium concentrations in meat after the Windscale accident. After
Chernobyl, radiocaesium concentration ratios for soil-to-plant transfer in
upland ecosystems ranged from 1 to 10. Radiocaesium concentrations in
sheep at some locations did not show any substantial decline from 1986 to
1989. Experience on soil-plant-animal transfer after the Chernobyl
accident, coupled with measurements on contents of radiocaesium in soil
from the 1950s and 1970s, indicates that Cs-137 concentrations in indivi
dual lambs from a few locations in 1958 and the middle 1960s may have been
similar to concentrations measured in individual animals in summer 1986.

- 475 -
INTRODUCTION
West Cumbria (fig. ll has received deposits of radioaccivity since the
early 1950s from several sources. These include uranium oxide particles
from the Windscale piles over the period 1954 to 1957 due to damaged car
tridges lodged in the outlet air ducts [ll, releases of volatile fission
products during the Windscale accident of 1957 [2l, weapons-testing fall
out [3J, routine discharges to atmosphere from fuel reprocessing by
British Nuclear fuels plc. at Sellafield (41, and deposits during Hay 1986
following atmJspheric dispersion of material from Chernobyl (5). This
paper evaluates data that exist for Cs-137 and 1-131 from these sources in
relation to retention by vegetation and transfer to animal products.
PRE-1957 RELEASES
The environmental impact of particles released prior to 1957 has been
evaluated by Chamberlain [ 1 l who estimated that -12 kg of uranium was
discharged containing (amongst other nuclides l - 7. 4x10" Bq Cs-137.
Chamberlain concluded that the impact of these releases on the food chain
wauld have betn relatively less significant than for other farms of
deposit because of their large particle size (i.e. 857. between 10 and
100 1-'m). No published information exists for Cs-137 concentrations in
soils, vegetation or animal products for the 1954-1957 period. However,
data for Sr-90 concentrations in soils in November 1957 were used by
Booker (6 J to provide estimates of Cs-137 deposits prior to 1957. These
ranged from 12'200 Br..J!m2 at 0.5 km to <185 Bq/m2 at >13. l km to the north
east of Winds.cale.
OCTOBER 1957 RELEASES
Chamberlain [ 7J estimated a release of 8xl0'" Bq Cs-137 from fuel during
the October l 957 accident. Of this, ~-10/~ \1.)-as retained on the stack
filter, allo,..;ing ~7xl0 1 -3 Bq to be released to atmosphere. Assuming an
overall ratio of 1-131/Cs-137 of 20 (i.e. similar- to th2.t in the fuel),
Chamber-lain estimated thd.t -1.4.xl0 1':=· Bq 1-131 1,,.10uld have been re.leased to
atmosphe.r-e. Envir·onmer1tal measurements following the i.,.lindscale: accident
have l:.'"::en rt:por-ted and evaluated by se'·./era.l authors l l ,2,6,8-11]. Booker
[SJ u::ed da-t.::. on 1-1.31 levels in herbage during the period 13-28 October

- 476 -
1957 to construct contours for the relative distribution of Cs-137
assuming an 1-131/Cs-137 ratio of 50: 1 (Fig. 2). His analysis showed
total Cs-137 deposits reaching 7000-12000 Bq/m2 at some locations several
km to the south and south east of Windscale. Booker neglected to include
the original 1-131 contour to the south which equated to 16300 Bq/m2
Cs-137 - this has been included in Fig. 2. Though Booker assumed an
1-131/Cs-137 ratio of 50:1, Chamberlain (above) suggested that a ratio of
20:1 can be supported by the available data. This ratio would increase
the estimated Cs-137 deposits given in Fig. 2 by a factor of 2.5, i.e. for
Black Coombe from -16000 to -40000 Bq/m2•
Contents of Cs-137 reported for vegetation after the Windscale accident
ranged from 500 Bq/m2 at Millam to 1440 Bq/m2 at Seascale on 28 October
1957, and represented 16 to 377. of the total observed deposit to 4 inches
depth in soil [8]. Concentrations in spot samples of herbage ranged from
<100 to 36000 Bq/kg dw. For herbage at Seascale, the peak concentration
(65300 Bq/kg dw) was recorded on 13 October 1957 and the effective half
life for decline in 1-131 concentration over the period October to
November 1957 based on deposit per unit area was -4.9 d [81, implying a
biological half -life of -,15 d. Cs-137 showed a similar pattern to that
for 1-131 during October and November 1957 but a relatively slow decline
from January to March 1958.
Booker [81 reported a peak 1-131 concentration in milk at Sellafield of
48800 Bq/1 on the afternoon of 12 October 1957; subsequently concentra
tions declined with an effective half-life of -4.7 d (i.e. similar to that
for herbage at Seascale). At Seascale, the rati·o of 1-131 concentration
in milk CBq/lJ to content in herbage (Bq/m2 J on 13 October 1957 was
0. 05 m"/1.
0.1 m'"/1.
Chamberlain and Dunster [9] repo,ted a corresponding ,atio of
No data are available for Cs-137 concentrations in milk prior to 28
October 1957, reflecting difficulties in detecting Cs-137 in the presence
of 1-131 with the equipment then in use [2,121. Samples from Sea.scale for
28 October 1957 showed a Cs-137 concentration of 592 Bq/1. The ratio of
concentration in milk to content in herbage was O. 41 m2 /l. In a more
detailed survey of milk concentrations over the period 8-11 Noveruber 1957,
the maximum Cs-1.37 concentration recorded was 555 Bq/1 at CoLney Con
rising ground ~ 15 kn1 south ot \l.lindscale). The herbage content at this
site on 28 OctobeL- 1957 \..'as ~,1.300 Bq/m2 . Allo'.,.,,in.g for a decline due to

- 477 -
weathering from 28 October to 8-11 November, this implies a ratio of milk
concentration to herbage content of -0.6 m2 /l. Milk concentrations were
lower than might have been anticipated because the accident occurred at a
time of year when dairy cattle were receiving an increasing intake of
conserved fodder harvested prior to the accident.
No published data appear to exist for l-131 or Cs-137 concentrations in
meat of animals. The impact to the consumer would have been reduced
because beef cattle and sheep can be expected to have been slaughtered at
relatively long times after the original deposit.
WEAPONS-TESTING FALLOUT
Several publications provide information on the cumulative input of Cs-137
to soils of the UK as a result of weapons-testing fallout [3,13-151.
Fallout contributions of Cs-137 can be estimated from relationships
between measured deposits and average annual rainfall. Maximum cumulative
inputs to soils of \vest Cumbria from weapons-testing to the end of 1980
calculated on this basis are unlikely to have exceeded 6000 Bq/m2 [lll.
Cs-137 contents in soils in Cumbria in 1978 are given in Fig. 3 and show a
complex pattern which combines the local influence of Sellafield, alti
tude, and pre- and post-1957 releases (Fig. 2l.
Surveys in the UK in 1963, the period of maximum weapons-testing fallout,
showed highest concentrations of Cs-137 in vegetation and animal products
from unimproved upland pastures [6].
Cs-137 concentration in vegetation
At one site in Cumbria, the reported
in 1963 was 629 Bq/kg dw. Cs-137
concentrations in mutton from upland areas of the UK other than from
Cumbria ranged from 50-200 Bq/kg during 1963. However, no published data
appear to exist for Cs-137 concentrations in animals grazing unimproved
pastures in Cumbria during the period of maximum fallout from weapons
testing. Studies in other parts of the UK and elsewhere generally
suggested that Cs-137 concentrations in food products were dominated by
recent deposits rather than by the cumulative inventory, but these studies
were for soi ls with an appreciable mineral content.

- 478 -
ROUTINE RELEASES FROM SELLAFIELD
Maximum annual Cs-137 discharges to atmosphere from Sellafield (4.5x10e
Bql occurred in 1980 (41 and corresponded with a maximum recorded concen
tration in milk of 13 Bq/1 for farms within 3 km of the site. Routine
discharges are small when compared with the 7.4x10'' and 7x10'~ Bq
released prior to 1957 and during the 1957 accident (above). By April
1986, concentrations in milk had declined to only a few Bq/1 at most.
DEPOSITION FROM CHERNOBYL
Results of monitoring in the vicinity of Sellafield during May 1986 have
been discussed by Jackson et al (17]. There is evidence to suggest that a
large fraction of I-131 and Cs-137 initially intercepted by vegetation was
removed rapidly, possibly as a result of rainfall. Data for a farm at
Beckermet (within 2 km of Sellafield) collected over the period 3-12 May
1986 showed a total Cs-137 inventory in soil of 15000 Bq/m2 (18]. for
four farms within 1.5 km of the works sampled over the period 1979-1982,
Bradford et al (19] reported Cs-137 contents in root matt plus soil in the
range 9900 to 53000 Bq/m2 • Clearly, a significant fraction of the 15000
Bq/m2 measured in 1986 must have been attributable to sources other than
Chernobyl. A similar conclusion emerges for sites at greater distance to
the south of Sellafield. For example, a location near Bootle showed
-12000 Bq/m2 on 13 May 1986. Nearby locations showed measured contents of
6600 Bq/m2 in 1957, 7800 Bq/m2 in 1961 and 9700 Bq/m2 in 1977.
Though it was recognised during 1986 that Cs-137 contents in soils of
upland areas of \,.Jest Cumbria Y."'ere in the range 20000 to 30000 Bq/m2 , it
'w'aS not until summer 1988 that the full extent of the contamination
became clear as a result of an aerial survey (20]. This showed a central
spine of Cs-137 contamination at >30000 Bq/m2 (Fig. 4al. There \i.1ef"e,
however, some inconsistencies bet=en the patterns observed for Cs-137 and
Cs-134, particularly in upland areas to the south of Sellafield, where the
aerial survey indicated Cs-137 inventories in the range 30000-50000 Bq/m"'
in some locations but corresponding Cs-134 inventories in the range 9000-
12000 Bq/m:.;.: (Fig. 4b). Such inconsistencies i;,..---er-e not entirely unexpected,
especially if much of the Cs-137 present in the 1950s (Fig. 2) and in the
1970s (Fig. 3) remained in situ and \1.18.S not removed by leaching or

- 479 -
erosion. Naturally, the aerial survey results do not provide any indi
cation of the availability of radiocaesium.
The maximum I-131 concentration in milk recorded at farms near Sellafield
during May 1986 was -370 Bq/1 (211. This corresponded to an initial
content on pasture of 1200 Bq/m2 giving a milk concentration to pasture
content ratio of 0.31 nf'/1. The maximum Cs-137 concentration in milk of
356 Bq/1 occurred on 5 May 1986 and corresponded to a pasture content of
970 Bq/m2 on 3 May 1986, giving a milk concentration to pasture content
ratio of 0.37 m2/l. Since the Chernobyl deposit occurred at a time of
year at which animals were just beginning to graze fresh pastures, the
patterns of concentration in milk at different farms were highly variable
according to agricultural practice (211.
DISCUSSION
Concentrations of Cs-137 and I-131 recorded in milk in October/November
1957 after the ~~ndscale accident were higher than for May 1986 after the
Chernobyl accident. For 1-131, this reflects a relatively low I-131/Cs-
137 ratio for the Chernobyl deposit in Cumbria. For Cs-137, the explan
ation appears to be the relatively small fraction retained by herbage
after the Chernobyl deposit (17,181. The ratio of concentration of Cs-137
in milk to content on herbage observed after the Chernobyl accident
(0.37 m2 /l) is close to that observed after the Windscale accident
(0.41 m2 /l, but note that measurements of Cs-137 were not available until
some time after the 1957 accident). Similar ratios after Chernobyl and
Windscale contrast \.Ii.th the markedly lower equilibrium transfer factors
(fml derived post-Chernobyl relative to weapons-testing fallout and tracer
experiments [5]. For 1-131, the ratio observed after Chernobyl (0.31
m''/1) was considerably higher than that observed after Windscale (0, 06 to
0. 1 m" /1). The reasons for this are not clear but could involve either
differences in the relative contributions of organic and inorganic forms
in the two source terms, or differences in dietary intakes between spring
and autumn.
By far the major imp,sct of the Chernobyl deposit in ~lest Cumbria has been
the effect on sheep which graze upland areas. Cs~l37 concentrations in
sheep in some areas did not decline from 1986 to 19.39. This observation
is particular-ly imp0~tant since it implies thd..t the cumulative inventory

- 480 -
of Cs-137 in soil is an important aspect of the environmental consequences
of radiocaesium contamination in UK uplands. Given the fact that some
upland areas of West Cumbria contained significant inventories of Cs-137
prior to the Chernobyl accident, it is interesting to speculate on the
relative significance of the various components of these inventories.
The direct method for assessing the significance of the various components
requires detailed information on the past history of Cs-137 deposits and
assumptions concerning the extent to which radiocaesium remains available
in soil or is removed from the rooting zone via erosion or leaching.
There is emerging evidence from studies in the UK and Scandinavia that, in
highly organic soils, radiocaesium remains available for plant uptake but
not for physical or chemical removal processes [51. Fells to the south of
Windscale received maximum deposits of Cs-137 in 1957 in the range 16000
to 40000 Bq/m2• Some of these fells are dominated by Cal lur,a vulqar is
(heather) which is known to be particularly effective at recycling
radiocaesium and retaining it in surface layers (22,231. Making the
optimistic assumption that losses from soil represented 50% of the
original input and taking into account radioactive decay, the maximum 1957
deposit \vOUld have reduced to 4000-10000 Bq/m2 by 1986. Maximum weapons
testing fallout accumulated by 1986 and corrected for radioactive decay is
unlikely to have exceeded 6000 Bq/m2 (equivalent to 2 m rainfall), giving
a maximum total inventory by 1986 of 10000-16000 Bq/m2•
The second method makes use of the input of Cs-134 with the Chernobyl
deposit and requires assumptions concerning the Cs-137/Cs-134 ratio in
the initial deposit for the area considered. On a UK basis, this ratio
appears to have been rather variable (a reasonable range being 1.5 to 2.0
[5 J l. However, when data for Cumbria alone are examined, the reported
values include [11]: 1.59 (range 1.51 to 1.65) for air in the vicinity of
Sellafield; 1.5.3 for rainwater at Sellafield; and 1.5 for water from two
lakes. To these data can be added the value of 1.55 (range 1.35 to 1.79)
for rainwater from South Cumbria [!TE, unpublished]. Assuming a ratio of
1.6 for the initial deposit in Southwest Cumbria, no more than 507. of the
Cs-137 inventories measured 1n upland soils during 1986 at the most
contaminated sites can be attributed to Chernobyl [23l. A maximum Cs-137
content in soil of .34500 Bq/m2 ~B.s obser;red under- ,-...21lu.::·a vuiq~r"15 on
fells to the south of Sellafield during November 1987 [23l. Correcting
for radioactive decay, and assuming an initial Cs-137/Cs-134 ratio of 1.6
(range 1.8 to 1.4), indicates a pre-Chernobyl Cs-137 content at this site

- 481 -
of 15800 (range 14600 to 19100) Bq/m2• This corresponds with the maximum
value estimated above by the direct method.
Unfortunately, if the second method is applied to vegetation samples
collected from 1985 to 1989, it becomes clear that some plant species must
have had an appreciable concentration of Cs-137 prior to 1986 [24]. These
species include native herbs and shrubs typical of acid grasslands in the
UK (i.e. Eriophorum vagi~atum~ Trichophorum caespitosum, Calluna vulgaris,
Nart"bt:·cium ossifraqum and species of Care)-::) [23-25]. For these species)
soil-to-plant transfer factors observed in 1986 and subsequently were
typically in the range 1-10 [26,27]. As a result, Cs-137/Cs-134 ratios
derived for individual plant species varied quite widely according to the
relative contributions of Chernobyl and other sources to the radiocaesium
inventory in soil at different depths in the rooting zone [11,23].
Both methods imply that maximum Cs-137 contents in soil at selected
upland locations in West Cumbria prior to the Chernobyl accident may have
been in the order of 15000 Bq/m2 • Using the conservative assumption that
this inventory was dispersed in the top 15 cm of soil, assuming a soil
bulk density of 0.5 g/cm~ and a soil-to-plant transfer factor in the
range 1-10, the estimated Cs-137 concentration in vegetation would have
been 200-2000 Bq/kg dw. Assuming a transfer coefficient for lamb of 0.6
d/kg and a daily dry matter intake of 0.6 kg/d, the estimated range of
maximum concentrations in individual lambs would have been 70-700 Bq/kg
fw. On the basis of the observed continuing availability of the Chernobyl
deposit in upland areas, the pattern of Cs-137 concentration in sheep
prior to the Chernobyl accident can be expected to have followed the
cumulative Cs-137 content in soil.
Taking into account the higher concentrations of Cs-137 reported for milk
in 1957 compared with those reported for 1986 and the known pattern of
input of weapons-testing fallout, then maximum concentrations of Cs-137
in sheep after the 1957 accident and in the middle 1960s will have been
similar to or higher than maxima recorded after the Chernobyl deposit. To
our knos.•ledge, this factor has not been considered when assessing the
relative radiological impacts of the Windscale and Chernobyl accidents to
the population of West Cumbria.

- 482 -
REFERENCES
1. Chamberlain, A.C. Environmental impact of particles emitted from
Windscale piles.
1986.
AERE-R12163. Atomic Energy Authority, Harwell,
2. Dunster, H.J. , Howell, H. and Templeton, W. L. District surveys
following the Windscale accident, October 1957. Proceedings of the
Second International Conference on the Peaceful Uses of Atomic
Energy, Part 19, pp. 296-308. UN, Geneva, 1958.
3. Cawse, P.A. Studies of environmental radioactivity in Cumbria,
part 4. caesium-137 and plutonium in soils of Cumbria and the Isle
of Man. AERE-R9851. Atomic Energy Authority, Harwell, 1980.
4. British Nuclear Fuels plc .. Annual Reports on Radioactive Discharges
and Monitoring of the Environment. Health and Safety Directorate,
Risley.
5. Coughtrey, P.J., Jackson, A., Beetham, C.J. and Cuff, Y.S. Radio-
nuclide distribution and transport in terrestrial and aquatic
ecosystems after the Chernobyl disaster.
Nuclear Services Ltd., Epsom, 1990.
ANS 2370-Rl. Associated
6. Booker, D.V. Caesium-137 in soil in the Windscale area. AERE-R4020.
7.
8.
UK Atomic Energy Authority, Harwell, 1962.
Chamberlain, A.C. Comparisons of the emissions in the Windscale and
Chernobyl accidents.
Harwell, 1987.
AERE-M3568. UK Atomic Energy Authority,
Booker, D.V. Physical measurements of activity in samples from
Windscale. AERE/HP/R2607.
1958.
UK Atomic Energy Authority, Har~~ll,
9. Chamberlain, A.C. and Dunster, H.J. Deposition of radioactivity in
north west England from the accident at Windscale.
182:629-630, 1958.
Nature (Lond. l
10. Chamberlain, A.C. Deposition of iodine-131 in Northern England in
October 1957. Nature (Lond.) 183:360-361, 1959.
11. Coughtrey, P.J. A review of levels and distribution of caesium in
upland environments priot- to the Chernobyl accident. ANS 2131-Rl.
Associated Nuclear Services Ltd., Epsom, 1989.
12. Chamberlain, A.C. Relation bet~~en measurements of deposited
activity after the Windscale accident of Octobet-, 1957. AERE HP/R-
2605. UK Atomic Energy Authority, Har we 11, 1958.
- 483 -
13. Cambray, R.S. and Eakins, J.D.
activity in Cumbria, part 1.
Studies of environmental radio
Concentrations of plutonium and
14.
15.
caesium,-137 in environmental samples from ...est Cumbria and a
possible maritime effect.
Harwell, 1980.
Eakins, J. D.' Pattenden,
Playford, K. Studies of
AERE-R9807. UK Atomic Energy Authority,
N. J., Cambray, R. S. , Lally. A. E. and
environmental radioactivity in Cumbria,
part 2. Radionuclide deposits in soil in the coastal region of
Cumbria. AERE-R9873. UK Atomic Energy Authority, Harwell, 1981.
Cawse, P.A. and Horr ill, A.D. A survey of caesium-137 and plutonium
in British soils in 1977. AERE-Rl0155. UK Atomic Energy Authority,
Har we 11 , 1986.
16. Agricultural Research Council Radiological Laboratory. Annual
Reports for 1961-1962, 1962-1963, 1963-1964 and 1964-1965. ARCRL-8,
-10, -12 and -14. ARC, Letcombe, 1962-1965.
17. Jackson, D., Jones, S.R., Fulker, H.J. and Coverdale, N.G.M.
Environmental monitoring in the vicinity of Sellafield following the
deposition of radioactivity from the Chernobyl accident. J. Soc.
Radial. Prot. 1:75-87, 1987.
18. Fulker, M.J. Aspects of environmental monitoring by British Nuclear
fuels plc following the Chernobyl reactor accident. J. Environ.
Radioactivity ~:235-244.
19. Bradford, W.R., Curtis, E.J.C. and Popplewell, D.S. Radioactivity in
environmental samples taken in the Sellafield and Ravenglass areas of
~~st Cumbria. Sci. Total Environ. 35:267-283, 1984.
20. Sanderson, D.C.W. and Scott, E.M. Aerial radiometric survey in West
Cumbria 1988. final Report Project N611. Scottish Universities
Research and Reactor Centre, East Kilbride, 1988.
21. Coughtrey, P.J., Jones, C.H., Mitchell, N.G. and Smith, A. D.
Radionuclide uptake in foodstuffs produced in the UK following the
Chernobyl incident - model evaluations and field data.
Associated Nuclear Services Ltd., Epsom, 1986.
ANS 750-Rl.
22. Bunzl, K. and Kracke, W. Distribution of Pb-210, Po-210, stable
lead and fallout in soil, plants and moorland sheep of a heath. Sci.
Total Environ. 39:143-159, 1984.
23. Coughtcey, P. J. Models for radionuclide transport in soils-
implications of the Chernobyl accident. Paper presented at the All
Union Confet-ence on Landscape Geochemical Aspects of Radionuclide
Migration. Suzdal, 13-17 Novembet- 1989.

- 484 -
24. Coughtrey, P.J., Kirton, J.A. and Mitchell, N.G. Caesium transfer
and cycling in upland pastures. Sci. Total Environ. 85:149-158,
1989.
25. Coughtrey, P.J., Kirton, J.A. and Mitchell, N.G. caesium distri-
bution and cycling in upland pastures of N. l,iales and Cumbria. Sci.
Total Environ. (in press).
25. Kirton, J.A., Coughtrey, P.J. and Mitchell, N.G. derivation of soil
to plant concentration ratios for upland plant species in the
glasshouse and comparison with field and experimental measurements.
Sci. Total Environ. ( in press).
27. Coughtrey, P.J., Kirton, J.A., Mitchell, N.G. and Morris, C.
Transfer of radioactive caesium from soil to vegetation and compari
son with potassium in upland grasslands. Environ. Pollut. 52:281-315.

30km
10km
IRISH SEA
- 485 -
y
20 KM
FIGURE 1. LOCATION OF SITES REFERRED TO IN TEXT.

0 a: (!)
w a: 1-w 2 0 _J
:::s::::
1295
IRISH SEA
05
Notes 1.
2.
3.
- 486 -
0 370
0
WASDALE
0
ESKDALE
-~ ~7 ~o
BOOTLE 215 '" 555 I \
1480
10
' ' ' ' ' \ ., ':.~
BLACK -OM
15
After Booker [6]
,..o '\
6560 1110
3700 1480
"'/'•'
BARROW IN FURNESS.
20
1480
~ c G7o
740
25
.,.,, 0
f'UR1'-!ESS
- 2 Figures are Bq m of Cs-137 in soil
Contours contours
are Bq x 0.02
- 2 m rEproduced from 1-131
05
00
95
90
85
80
75
4. Additional contour based on obser:~tj I-131 deposits equivalent to 11, 100 Bq m , Cs-137 assuming I-131/Cs-137 ratio~ 50/a.
FIGURE 2. PATTERN OF DEPOSITION 0° Cs-137 WINDSCALE ACCIDENT.
DUE TO THE
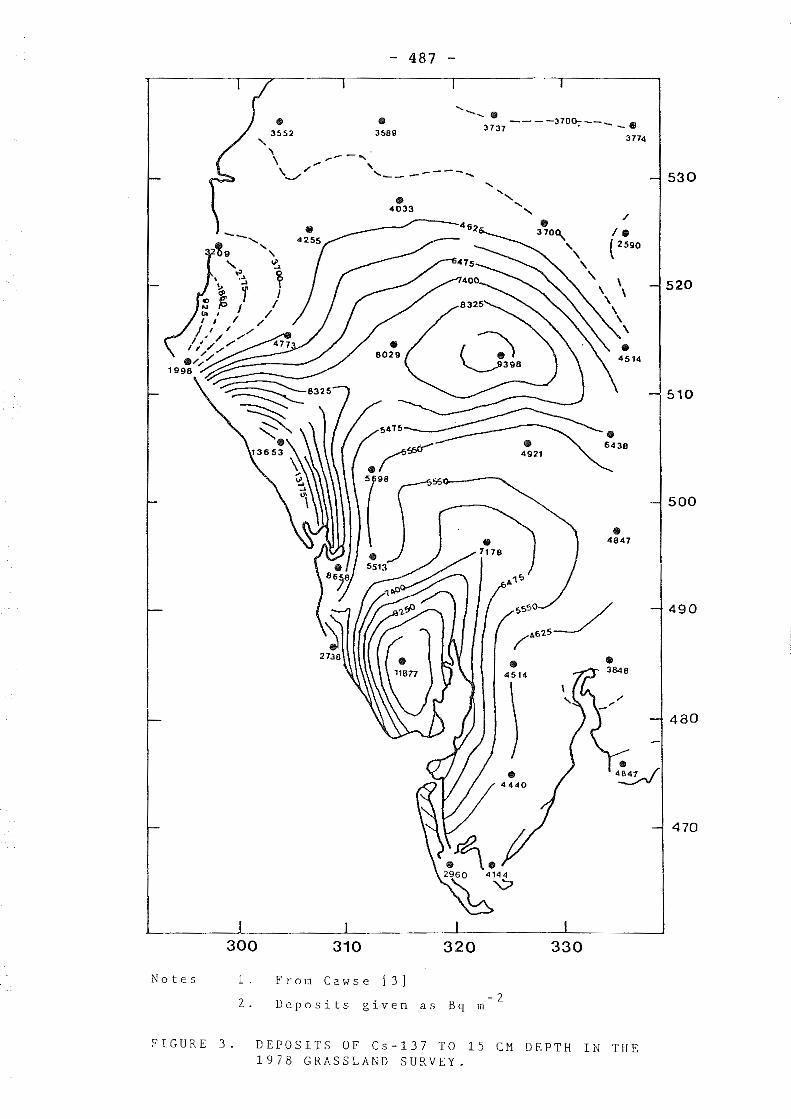
'
- 487 -
.. 3552
.. 3589
...... ___ . 3737----J?OO;---- - (t
3774
' ,,,..-- -, ',.._....../- , ..... __ ----- .......
.. 4033
.r 5698
( .. ss13
o'6
..
.. 370°'
4921
' ' ' '
/ ,,, t 2590
.. 4514
• 643B
.. 4647
300 310 320 330
Notes
FIGURE 3.
1 .
2 .
From Cawse [3]
Deposits given as Bq - 2
m
DEPOSITS OF Cs-137 TO 15 CM DEPTH IN Tl!E 1978 GRASSLAND SURVEY.
530
520
510
500
490
480
470
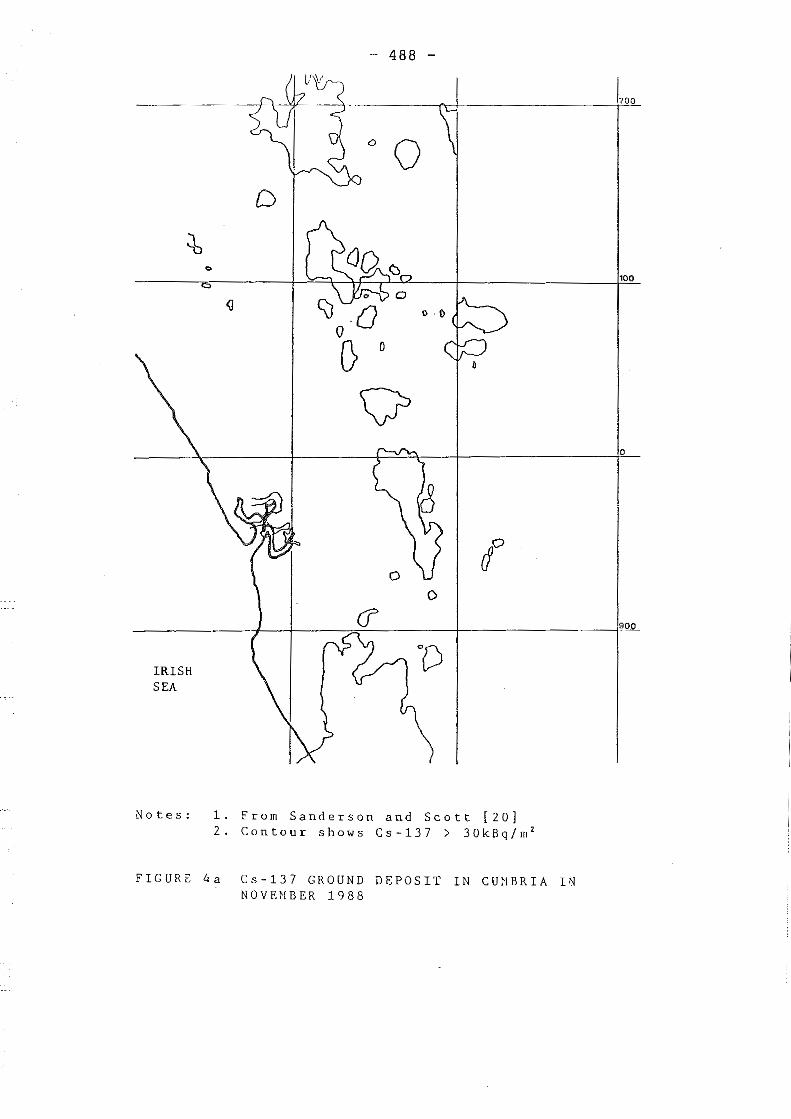
IRISH SEA
Notes:
- 488 -
0 D
lJ G Q oo v
0
1. From Sanderson and Scott [20] 2. Contour shows Cs-137 > 30kBq/m 2
FIGURE 4a Cs-137 GROUND DEPOSIT IN CUMBRIA I~ NOVEMBER 1988
700
100
0

0
200
100
0
900
I.RISH SEA
No te.c:
0
1~ From
- 489 -l,oo
D
0
•
200
Sanderson and Scott [20]
2. Contour shows Cs-134 > 12kBq/m 2
FIGURE 4b. Cs-134 GROUND DEPOSITS IN CCMBRIA IN NOVEMBER 1988.
1

- 490 -

- 491 -
Session V
ENVIRONMENTAL CONTAMINATION AND TRANSFER
Part II

- 492 -

- 493 -
Analysis of Chernobyl Fuel Particles and their Migration
Characteristics in Water and Soil
V.V. DEMCHUK, O.V. VOYTSEKHOVICH, V.A. KASHPAROV, N.V. VIKTOROVA, G.V. LAPTEV

- 494 -
INTRODUCTION
Contamination of the environment in the wake of the accident at the fourth unit of the Chernobyl NPP differs quite considerably from global fallout after nuclear explosions. Apart from various volatile radioactive materials, dispersed nuclear fuel was also released into the atmosphere.
This study reflects the results of experimental investigations into the behaviour of fuel particles in the water and soi I of the floodlands in the Chernobyl NPP near zone. In the initial fallout these products took the form of low-solubility matrices (U02-U03). In the case of the Chernobyl accident there was a most unfortunate constellation in that the territory most severely affected by the fallout was a floodplain with a high probabi I ity of flooding by river waters (Figure 1). Accordingly, the prime goal of our research was to determine the kinetics of radionuclide transfer from the fuel particles to the water as a basis for predicting the radioecological impact on the environment. The results are Important for predicting the processes of mass exchange of exchangeable forms of radionucl ides in soi I and bed sediment, their washout from the soi I surface and the filtration element in migration.
The floodlands area investigated is the plain adjacent to the Chernobyl NPP zone. Its characteristic features are wel I-developed floodplain vegetation, soddy-, podzolic, gleyey soi Is and low to medium podzol ic sandy soi Is with underlying sands.
The hydrological conditions for inundation of this area are determined by the regimen of the Pripyat, with flooding of the patch of contamination studied occurring once every four to five years approximately. The water from such floods may remain on the floodplain surface for several weeks.
Once every 10-15 years on average this surface is fully flooded by a developed system of floodplain streams. Less often (once every 25 to 50 years, and most recently in 1979), the high water may cause up to 50% of the river flow to be transported across the floodplain (f load levels of up to 3 m), while flooding of the intermediate and low-lying par ts may I ast for 6 to 8 weeks. During f I ood i ng the speed of the current may range from a few centimetres to one metre per second. However, the usual speed of the water flowing over the floodplain is 0.1 to 0.2 m per second, and thus it normally takes the water masses two days to pass over the worst contaminated part of the floodplain within the northern fallout track, although the actual exchange of floodplain waters with the river may take considerably longer (10 days or more) because of the large number of standing and circulating water zones on the floodplain.
Given the direct hydraulic I ink between the floodplain groundwaters and the River Pripyat, groundwaters formed over the year flow from the river towards the floodplain water bodies. The water table is usually no higher than 1.5 m below the surface, but in a number of places it reaches the surface, forming swampy lowlands and floodplain lakes. The chemical composition of the groundwater is similar to that of waters of the hydrocarbonate-calcium type, but with a different degree of mineralization and richer in organic acids and iron. The extreme wetness of the soi I causes it to be washed through intensively and promotes migration of the dispersed nuclear fuel both in solution and in non-exchangeab I e and I ow-so I ub i I i ty phys i co-chem i ca I forms.

- 495 -
Moreover, observations have shown that during high water substances are mainly removed from the floodplain in both floodplain channels and surface runoff. Since the accident (1986-1990) there has been no major flooding of the floodlands and the water flow of the Pripyat has been characteristic of low-water years. This al lowed us to study in greater detai I the potential source of contamination, including changes in the fuel particles and the mechanisms by which the resultant products are transferred to the river waters.
The object of the investigations was as fol lows: to study the processes of radionuclide floodplain migration and the kinetic parameters of the changes in the radionucl ides' chemical forms, and then propose a number of protective measures with a view to reducing the potent i a I washout of radioactive products into the river system of the Dnieper basin.
FORMATION OF FUEL AND CONDENSED FORMS OF FALLOUT
The destruction of the reactor was accompanied by the ejection not only of volatile fission products but also by a large quantity (2-5%) of dispersed nuclear fuel .1, 2, The fuel was dispersed under the impact of a sudden energy release in the fuel elements due to a surge in neutron flow, the shock wave of the thermal explosion and the temperature gradients. Thus, in the case of high energy release values 3 (over 285 caiories/g uo2) the fuel element casing is destroyed, while at 320 calories/g uo2 the fuel itself breaks up into fine particles. The high temperature in the active reactor zone resulting from the continued heat release and burning graphite led to further break-up of fuel and its eject ion beyond the reactor zone. Subsequently - from 26 April to 6 May - fuel particles were ejected into the atmosphere together with volatile radionucl ides . During and after the thermal explosion, the high-temperature oxidizing processes promoted the partial transformation of sintered uo2 into u3o8 , whose structure is more susceptible to mechanical break-up.
In al I probabi I ity the further oxidization of uo2 at a range of high temperatures took place in the fol lowing stages. At temperatures of 260 to 300· C, uo2 with its cube-shaped lattice oxidizes at the rate of 0.3 mg/cm2 per hour to u3o8 with its orthorhombic lattice.4,5 The process occurred in two stages with the formation of an inter~ediate tetragonal phase u3o7 . Then according to 6 in the 300 to 6oo·c temperature range oxidization to u3o8 should have occurred rapidly, resulting in the break-up of the fuel pellets into fine particles. From 600 to 850'C the oxidization process slowed down. At 800-900"C oxidization takes place in two stages, a slow one fol lowed by a fast one. Depending on the properties of the specimen, the second stage begins 80-180 minutes after the commencement of oxidization.
The first stage is characterized by diffuse penetration of oxygen into the fuel pellet and takes the form uo2 uo2+x u4o9 . The rapidity of the process during the second stage of oxidization is I inked to the phase transformation of u4o9 to u3o8 , and is accompanied by break-up of the specimen. uo2 particles are brown, U308 are black and uo3 are orange.
Greenish-ye! low particles of a glass-I ike material may be created when U02 enters into contact with water and the partial Jy hydro! ised oxide uo30.8H 2o forms.

- 496 -
The macro- and mi crest ructura I changes in uo2 (during reactor operations) under the effect of neutron irradiation and radially directed thermal flow (neutron fluence, burn-up, temperature gradient across the fuel radius, irradiation duration, swel I ing, etc.) as wel I as temperature shocks had a major impact on the process of nuclear fuel dispersion. Thus, "hot" fuel particles formed as a result of the explosion shock waves, temperature gradients and uo2 oxidization.
During ejection, over 90% of al I particles formed in this manner were uo2-uo3 particles with a radionuclide composition similar to that of the irradiated fuel (Table 1) 7 and containing a variety of highly mobile volatile fission products.
The fractionation of the fission products in the nuclear fuel took place both during the accident (subsequent reactor heat effects, or "annea I i ng") and during nor ma I reactor operations. The re I at i ve migration rate of the fission products from uo2 in the presence of high temperatures is reduced as their binding energy in respect of oxygen grows, in the fol lowing sequence:
Kr<0.09 eV; Xe-0.38 eV; 1-0.91 eV; Ag-2.22 eV; Cs-3.09 eV; Te-4.06 eV; Sr>4.72 eV; Ru-5.0 eV; Ba>5.85 eV; Zr-7.9 eV; Ce-8.25 ev.B
Gaseous and volatile fission products such as Kr, Xe, I, Te, Cs, which have fairly high migration properties, are more readily fractionated in the nuclear fuel. During normal reactor operations, high temperature gradients (3x10⁵ degrees/minute) are observed across the radial profile of the fuel pel let.4 This led to a redistribution of fission products from regions with high temperatures (pellet centre) to regions with lower ones.
Table 1
Mean specific activity of radionuclides in fuel of the Chernobyl NPP fourth unit at the time of the accident (Bq/g uo2J
Nuclide Activity Nuc Ii de Activity Nuc Ii de Activity
Sr-90 1 . 2E+09 Cs-134 8.6E+08 Sb-125 1 . 8E+08 Zr-95 3.3E+10 Cs-137 1.5E+09 Eu-154 7.1E+07 Nb-95 3.4E+10 Ce-141 3.2E+10 Eu-155 1 . OE+OS Ru-103 2.6E+10 Ce-144 2.4E+10 Pu-238 5.4E+06 Ru-106 7.0E+09 Pm-147 3.8E+09 Pu-239 4.5E+06
PU-240 6.3E+06

- 497 -
As a result of high-temperature "annealing" of the fuel particles, these lost their highly mobile fission products. On the other hand, at relatively low temperatures these fission products condensed and were adsorbed on the surfaces on al I kinds of carriers. This explains the different quantities of caesium present in the hot fuel particles (mean coefficient of fractionation: 0.4-0.6) and, to a lesser degree, strontium (0.9-1.0).
Insoluble fission products in microsections of irradiated fuel take the form of second-phase inclusions with a characteristic metal I ic sheen. Most of the inclusions have a roundish form, and are generally sited on the margins of the granules and bound to the pores. The presence of inclusions may explain the abnormal quantities of refractory radionucl ides in certain hot particles.
As a result of the destruction of the fuel elements and the "annealing" of the nuclear fuel, a substantial quantity of volatile fission products (I, Cs, Sr etc., the so-cal led steam-gas or jet components of the release) was ejected into the atmosphere. Some of these condensed on inert carriers - particles of soot, dust, construction materials, etc. Hot particles formed in this manner are characterised by surface contamination and low specific activity by comparison with the fuel particles.
These finely dispersed hot particles and the steam-gas component were drawn into the jet of ejected materials, and subsequently into the atmosphere. Their further dispersion was determined by the movements of the air masses - deposition of aeroso Is on I and and washout of radioactive products through rain.
Of the known tracks of aerosol deposition in the area, the northern track is the worst contaminated, with much of the countryside in this fallout track 10-15 km from the power plant forming part of the Pripyat floodplain. It was here that the basic cycle of complex investigations was carried out, including analysis of the radionuclide inventories, contamination structure, landscape and geochemical analysis of the environment and hydrochemical flooding regimen (Figure 1).
In order to determine the inventories and distribution densities of the radioactive substances deposited, soi I samples were taken using special 50 mm-long sampling tubes with a diameter of 140 mm. To investigate vertical migration, cores of bed sediment and soi I were removed using two types of sampling · device, of 50 mm and 25 mm diameters respectively, capable of removing cores up to 250 and 500 mm long. The samples were taken In May/June 1989 and June/July 1990.
Examination of the samples· nuclide composition was conducted with the aid of an ORTEC gamma spectrometer I inked to an IBM PC/XT, using a HPGe coaxial detector.
The contamination levels in soi Is in the Krasnansky and Benevsky bayous are shown in Table 2.
The vertical distribution of fission products in the soil and bed sediment cores taken from the most representative parts of the f I oodp I a in was ana I ysed. The samp I es had been removed using spec i a I tubular sampling devices, so as not to destroy their structure. Samples were taken from:
1. a non-flooded dry sector on the floodplain;

- 498 -
2. a regularly flooded sector at the perimeter of a floodplain lake;
3. bed sediments in a closed water body.
Samples for analysis were also taken from patches of abnormally high contamination. The cores were sliced into 1-2 cm thick layers, dried and homogenized. After gamma spectrometry they were subjected to radiochemical analysis of total strontium content.
The distribution characteristics are given in Figure 2. They show that three years after the accident the bulk of the radionucl ides (95-98%) is distributed through the top 3 to 5 cm layers. This is confirmation that the fallout's main component - I.e. fuel (90-98%) - participates only In the convective migration mechanism, I.e. movement through pore spaces together with infiltrating waters. Autoradiographic photographs of the top layers suggest an exponential law of distribution of hot particles, both as regards their dimensions and the soi I profile. Hot particles were not discovered at depths of more than 6 cm.
In bed sediments from closed and standing water bodies there was a more uniform distribution of radioactive substances through the profile. Specific activity in the top layers of the bed sediment (less than 5 cm) constitutes 80-90% of total activity. Hot particles have been discovered at depths of up to 8 cm and this, most probably, is I inked with turbidity and load deposition/accumulation on the bed.
Table 2
Soi I contamination in the abandoned Krasnansky and Benevsky channels, Pripyat left-bank floodplain in the Chernobyl NPP near zone (1989)
SAMPLING POINT RANGE OF ACTIVITY A (Ci/km2 )
Ce-144 Cs-137 Sr-90 total PU (38,39,40)
Krasnansky 200-900 100-500 130-600 3.46-15.60 bayou <425> <230> <280> <7.90>
Benevsky 20-150 10-100 13-100 0.3-2.6 bayou <55> <32> <36> <0.9>
Table 3
Weighted mean estimates of major gamma-emitting nucl ides in total activity of the nuclear fuel (26 Apri I 1986) - percentage figures
Ru-106 Cs-134 Cs-137 Ce-144 Sb-125 Eu-155
20.70 2.55 4. 15 71 .20 0.53 0.21

- 499 -
An analysis of the radionuclide activity ratios in terms of Ce-144 units shows that the sampling procedure was methodologically sound. The growth in the activity ratios vis-a-vis Ce-144 with increasing depth indicates increasing.radionuclide migratory capacity in the fol lowing order: Ce-144 < Sb-125 < Ru-106 < Cs-137 < Sr-90.
The figures for the distribution of sr-90 both in bed sediment and in soi I show a relative shift towards Sr-90 as compared with Ce-144 and other gamma-emitting radionucl ides through layer depth. From this we can conclude that Sr-90 has a greater migratory capacity than the other rad i onuc Ii des.
With a view to learning more about the structure of fuel fallout, we investigated the size and radlonucl ide composition of the hot particles. Autoradiographic and micro-photographic analyses of the hot particles, which account for 95-98% of contamination in the area under investigation, showed that they consist of particles of micron or submicron dimensions, while their radionuclide composition resembles that of irradiated fuel. In the years immediately fol lowing the accident, the ratio between fuel and condensed forms in the soi I samples was 90-98%:2-10% on average. Currently, because the physico-chemical forms of the fuel radionucl ides change, the proportion of more mobile forms is increasing.
In determining the dimensions of the hot particles in various soi Is and bed sediments, use was made of the contact autoradiography method, and coefficients of correlation were established between the diameters of the black patches on the autoradiographs and the activity and dimensions of the fuel particles. Some 10,000 particles in the soi I samples were covered.
Figure 3a shows the size distribution of soi I sample particles. Figure 3b shows the cumulative frequencies for this distribution. On a probabi I ity-logarithmic scale the particle distribution adequately fits a straight I ine, so one can assume that the distribution is log-normal and hence estimate its parameters. The mean geometric diameter of the particles is D • 8 microns, while the median diameter of the hot particles was approximately 7 microns.
The mean geometric diameter of particles taken from bed sediment was found to be D • 14 microns, most probably because the finer particles had dissolved.
The process of hot particle separation by size could be observed at as early a stage as that of aerosol deposit ion and settlement in water bodies. Here, the larger particles and their carriers sank more rapidly, while the finest particles under the influence of hydrodynamic factors - were carried closer to the shores. Then, as the high water receded and lake water levels dropped, they attached to the soi Is around the shore. This is confirmed by the existence of zones of increased contamination at the edges of water bodies.
Analysis of the size distribution of hot particles in the soi I samples (Figure 4), taken from a site 10 km north of the power plant in 1987 and again in 1989, shows a reduction in the proportion of fine particles (< 2 microns) over time. Clearly, this is because the fine particles dissolve under natural physico-chemical conditions. The proportion of 2-4 micron particles increases, presumably because of the decrease in the number of fine particles and because the larger particles undergo mechanical break-up. Clearly, this deserves closer study.

- 500 -
Microscopic examination shows that the bulk of particles from soi I and bed sediment is to be found in fragile aggregates containing fine particles of soi I and a variety of organic and mineral inclusions. The hot particles themselves have irregular structures with wel I-developed surfaces. They easily break up under mechanical impact. Most are black, while some have an orange or matt sheen and a granular structure. Some particles were found to have a fused, uniform surface, and uni ike the others were very hard. Spectral analysis showed that Ru-106 was the main source of activity in these particles.
Under the assumption that the particles consist of uo2 with a density of 10.4 g/cm3 and a burn-up of 11.6-12.5 MWd/kg uo2 , particle diameter was estimated by means of Ce-144 activity. Ce-144 was selected because it has a relatively smal I coefficient of diffusion in fuel (3
to 4 orders of magnitude less than other nucl ides) and because of its capacity to replace uranium in the uo2 lattice.
For the estimates it was assumed that the hot particles were spherical. Ce-144 activity at the time of the accident on 26 Apri I 1986 was assumed to be 2.2 x 10¹⁰ Bq/g uo2 .9 Hence the calculation coefficient for estimating the diameter of the fuel particles by Ce-144 activity is:
A(Ce-144/Dp ~ 11.43 x 10⁻²exp(-2.44 x 10⁻⁹ x Tl
where:
Dp: A(Ce-144): T:
estimated particle diameter (microns) Ce-144 activity at the time of measurement (Bq); number of days since the accident.
In addition, De is the diameter of the particles as determined visually on a microscope scale (microns).
The mean ratio of measured to estimated values (De/Dp) is 1.2. This difference would suggest that besides errors in the visual measurement of the size of particles in conglomerate with inactive carriers, there was some change in the stoichiometric composition of the particles during oxidization to u3o8 with a density of 7-8 g/cm3.
RADIONUCLIDE COMPOSITION OF THE HOT PARTICLES
Table 3 shows the weighted mean(%) estimated contributions of the main gamma-emitting isotopes to total gamma activity of "average" fuel on 26 Apr i I 1986.
From 7 and Table 3 it is clear that the mean weighted composition of the main gamma-emitting nucl ides in "average" fuel at the time of the accident corresponds to a burn-up rate of 11.6-12.5 MWd/kg uo2 , i.e. to the 4th or 5th group of fuel element assemblies.
The radionuclide composition of the soi I and bed sediment samples tal I ies wel I with the estimated figures for "average" fuel as shown in Table 3 (within margins of 10-15%).
To classify the hot particles by isotopic composition, we established the distribution of the ratios of experimental and estimated contributions ("average" fuel) to total gamma activity of the isotopes Ce-144, Ru-106, Cs-134 and Cs-137.

- 501 -
Figures 5 and 6 show the distribution of these ratios for hot particles from soi I and bed sediment. For Ce-144 the contribution is higher than expected, with a mean of 1 .1 for particles taken from soi I, while for bed sediment it is 1.18. This can be interpreted as indicating a decrease since the accident in the amount of the other radionucl ides contained in the fuel particles in soi I and aquatic environments, particularly Sr-90 and Cs-137. Below we show the estimated values (%) of radionuclide impoverishment in fuel particles from soi I and bed sediment:
Soi I Sediment
Cs-137, 134
(20-25%) (35-40%)
Ru-106
(5-9%) (5-9%)
Sb-125
( 15-20%) (20-25%)
Sr-90
(5-10%) (10-15%)
Ruthenium impoverishment was estimated without taking into account pure ruthenium particles, which make up 5-10% of the total number of particles.
Similar estimates, previously carried out by the authors for particles in aggregate with soi I and bed sediment material 11 , showed that for caesium, radionuclide impoverishment did not exceed 5%, while in the case of sr-90 impoverishment in the soi I was close to that for individual particles, and in some of the 1989 samples exceeded 30%. The increased impoverishment of caesium and strontium in particles taken from bed sediment is evidence of their water-soluble and exchangeable forms leaching into the aquatic environment by comparison with dry parts of the floodplain. The difference amounts to 10-15%.
PHYSICAL AND CHEMICAL CHARACTERISTICS OF FUEL FALLOUT AND ANALYSIS OF ITS BEHAVIOUR IN THE AQUATIC ENVIRONMENT
The estimates of the distribution of radionuclide forms of occurrence in the aquatic and soi I environment were obtained via classical consecutive I ixiviation of soi I and bed sediment samples in (1) a water solution (using disti I led water and water from the Pripyat River), (2) a 0.1N solution of CH 3COONH 4 , and (3) 6N HCL. The first extracts were used to determine the proportion of radionucl ides in water-soluble form for different degrees of mineralization of the solvent (disti I led water and river water); the second set of extracts made it possible to determine the quantity of radionucl ides capable of participating in migration via the ion exchange mechanism; the third set of extracts, together with the quantity of radionucl ides in the insoluble residue, made it possible to determine the proportion in non-exchangeable sorbed form and in the composition of the fuel particle matrix.
The mobile and non-exchangeable forms were determined for areas of soi I and bed sediment with different degrees of surface contamination. Table 4 shows the results for the measurements conducted in 1989.
The data for 1990 show that the proportion of mobile radionucl ides, in particular of Sr-90, continued to grow. Towards summer 1990 the total proportion of exchangeable and water-soluble Sr-90 in the floodplain soi Is in many areas amounted to as much as 60-75%, indicating that the fuel matrix was subjected to very intensive transformation processes.

- 502 -
Similar estimates were conducted for different down-core sections of soi I and bed sediment samples. The data show that for Cs-137 the percentage both of water-soluble and exchangeable forms of the radionuclide increases with the depth of the soi I layer in which migration takes place. At the same time the proportion of nonexchangeable sorbed and fuel forms of Cs-137 decreases with depth. The percentage of water-soluble and exchangeable caesium grows from 1-2% at the surface to 20-30% at a depth of 10-15 cm. At the same time, the water-soluble proportion of caesium for these horizons grows from 0.1% to 1.5% in dry non-flooded areas and to 5-10% in moist soi Is. For Sr-90 there is no statistically significant increase in its mobile form in the top 20-25 cm I ayer. The tot a I proportion of exchangeab I e and water-soluble Sr-90 in the floodplain soi I samples was 30-40% in summer 1989, but had grown to 50-70% in spring-summer 1990 in the same region. At deeper horizons exchangeable forms made up 90% and more. Less than 10% were fixed to soi I particles as a result of adsorption. In absolute terms the radioactivity (Sr-90) of the soi I sections was 10-25% at depths below 1 cm, 1-5% at depths below 5 cm and 0.1-0.5% at depths below 10 cm, while at depths below 20 cm the specific radioactivity of the sections did not exceed 0.1% of the total content in the floodplain soi Is.
Table 4
Mean data on radionuclide forms of occurrence (as a% of total content) in soil and bed sediment in the floodplain of the Chernobyl NPP near zone ( 1989)
Percentage in extract soi I/bed sediment
Form of occurrence Ce-144 Cs-137 Ru-106 Sr-90
Water-soluble 0.30/0.10 0.17/0.10 0. 20/0 .10 15.0/25.0
Exchangeable 2.8/1.0 1.1/0.5 0.05/0.5 30.0/25.0
Non-exchang. 97.9/99.5 98.7/99.4 99.8/99.4 55.0/50.0
For Cs-137 the corresponding figures are approximately 1% below 5 cm and 0.01-0.1% below 20 cm. The lakeside samples constitute an exception, the lower layers being contaminated due to a rise in contaminated groundwater and lake waters through capi I lary action. These results al low us to draw an indirect but important conclusion concerning the impact of water on the migration properties of fuel fallout. Bearing in mind that initially the floodplain was contaminated almost exclusively by fuel fallout, and then by convection transfer through pore spaces, four years after the accident the bulk of the fuel materials had not migrated to layers lower than 2-3 cm, total radioactive contamination in the lower levels possibly being mainly attributable to mobile strontium from the fuel matrix. At the same time, layers below 20 cm contained less than 0.1% of total radionucl ides on average. Thus, the quantity of radionucl ides in the lower levels may be ignored (Fig. 2).

- 503 -
The total content of radioactivity in the intermediate 3-20 cm layer is mainly attributable to the effective quantity of mobile sr-90 in the years fol lowing the accident. This constitutes approximately 10% of the tot a I inventory of Sr-90 within the I im its of the potent i a I I y floodable Pripyat lowlands tn the Chernobyl NPP near zone. Likewise, mobile strontium entered the soi I at an annual rate of 2-3%, depending on water levels during the year.
As is we! I known, since the accident (1986-1990) most of the territory under investigation has not experienced direct flooding. Accordingly, washout of radionucl ides from the fuel particles was exclusively due to the influence of rain and melting snow. Total precipitation from spring 1986 to spring 1990 was approximately 600 mm (ignoring evaporation). The indirect integral estimate of Sr-90 washout in the investigated area from an inventory of approximately 12 000 Ci is in the order of 1.0 x 10⁻⁴ mm-1. Within a margin of 20%, this estimate coincides with the value of the integral washout coefficient obtained at water-sprinkling sites.10
The ratio of infiltration flow to surface runoff from total precipitation on the floodplain was approximately 30:70. Accordingly, the waters flowing off the surface of the floodplain during the flood periods of the preceding years must have carried a considerably smaller quantity of radionucl ides to the river than was localized in the flood land soi Is during the same period. This is confirmed by the results of experimental observations concerning the radionuclide migration balance on the floodplain.11
s i nee the exchangeab I e forms of Sr-90 cons i derab I y exceed the actua I amount of initial fa! lout washed out - and accounted for 40-70% in 1990 - it seems that a large part of the Sr-90 is already potentially ready for water migration. It is I ikely that very soon the key factor in the water migration of Sr-90 wi I I be the size of the layer of water runoff occurring during inundation of the floodplain.
In conditions of washout by infiltrating waters after rain, the period of contact between the water masses and the radioactive material in the surface layer is I imited; this prevents equi I ibrium concentrations of exchangeable forms of radionucl ides from forming between the I iquid and sol id phases (infiltrate-soi I). During protracted flooding of the floodplain surface the picture is completely different. In these conditions the fuel particles may be in direct contact with water for several months, and the quantity of exchangeable strontium in the soi!water solution capable of transferring to the water is determined by the quantity of exchangeable ions in the river water able to substitute Sr-90 in first-order chemical reactions.
In this connection experiments on the kinetics of radionuclide removal from soi Is provide useful information.
These were conducted in natural conditions. Three soi I mono! iths with mean dimensions 70 x 40 x 20 cm were removed from the floodplain. They were placed in special basins, and after their sides had been made impermeable, Pripyat River water was poured onto them to give overlying water levels ranging from 5 to 20 cm in depth. Subsequently, water samp I es were period i ca I I y taken from the containers over a 45-day period (the water being stirred each time) and measured for Sr-90 and Cs-137 content. The findings were used to calculate washout coefficients, these being the ratio of the concentration of radionucl ides in the water to the surface contamination of the mono! iths at the time they were dug out.

- 504 -
On completion of the experiment the water was poured off, and the total quantity of Sr-90 removed into the water during submersion was calculated. A curve showing the kinetics of sr-90 removal during the experiment is reproduced in Figure 7. The results show that during the experiments anything from 2.0% to 2.6% of the strontium inventory in the soi I fallout transferred into aqueous solution above the flooded soi I. These results are 25% to 30% higher than those pertaining to another floodplain area for 1986 (reproduced in 10). While in the 1986 experiments the washout coefficient for Sr-90 from floodplain soi Is (standardized for flooding depth) ranged in some cases from 3 to 13 x 10-5 mm-1 after 35 days, in our experiments the values for this coefficient after flooding the monoliths for 35 days ranged from 16 to 30 x 10-5 mm-1. This tal I ies with data showing a 2.5- to 3.5-fold increase in the quantity of exchangeable Sr-90 in the period between these experiments. The results showed that during the experiment period no equilibrium concentration of the radionuclide formed in the soi I solution. In contrast to experiments with sprinkling, where such an equi I ibrium concentration was observed very soon, in this case the process by which Sr-90 entered the water was largely determined by the diffusion flow of the radionuclide out of the flooded soi I. Additional flooding of the soi I monoliths over different periods of time showed that the average rate of mass exchange of exchangeable Sr-90 radionucl ides amounts to 0.15-0.20% per day of the Sr-90 inventory in the near zone f I oodp I a in. Consequent I y, in conditions of extreme flooding lasting over 40-50 days, not more than 10% of the sr-90 inventory in the investigated territory can enter the river waters. Nevertheless, this quantity can substantially increase the radiostrontium content of the waters of the River Pripyat and Kiev reservoir and cause highly undesirable radioecological problems. In this connection the conclusion drawn was. that it is essential to isolate this particular area of the floodplain from direct contact with the river waters and take steps to dry the area, which would make it possible to substantially reduce the speed of migration of radionucl ides into the aquatic system of the Dnieper basin.
CONCLUSIONS
1. 90%-95% of the contamination of the Pripyat floodplain in the northern part of the Chernobyl NPP near zone (radius of 10-15 km) was caused by fue I mater i a I with a nuc Ii de composition corresponding to irradiated fuel from the 4th/5th group of fuel element assemblies. The mean geometric diameter of the particles was 8.0 microns for soi I samples and 14.0 microns for bed sediment. The median diameter of the particles was on average 20%-25% greater than the estimated values, suggesting that there was an oxidization-induced change in the stoichiometric composition of the particles and a reduction in their density to approximately 7-8 g/cm3.
2. The bulk of the particles (70-80%) are black and friable. Regularly shaped particles are also encountered, and these are firm and have a characteristic metallic sheen. Ru-106 is responsible for most of the activity of these particles. Pure ruthenium particles account for 5-10% and pure. caesium for 2-3%.
3. The vertical distribition of the particles in the soi I fits an exponential curve, both for quantity and size. Particles larger than 1 micron were not discovered below 5-6 cm in soi I and below 7-8 cm in bed sediment.

- 505 -
4. In natural conditions in soi I there is a change over time in the fine fraction of the fuel particles (under 2 microns), their share being down by 5-10% in 1989 compared with 1987. Apart from the processes of physical and chemical degradation of the fuel material, processes of mechanical break-UR also occur with the formation of colloid fractions (under O. 1 micron).
5. Since the accident, as a result of mechanical and chemical transformation of the fuel matrix, there has been a gradual increase in exchangeable forms of the radionucl ides in the soi Is. Thus, while water-soluble and exchangeable forms taken together in the floodplain territory accounted for 30-40% in 1989, in 1990 they accounted for 70%.
6. An analysis of the kinetics of Sr-90 removal into water during inundation of the floodplain fuel fallout zone showed that in the event of ful I flooding during extreme high water, only 10% of the inventory of Sr-90 exchangeable forms (making up 50-70% of the total) can enter the river water.
7. Bearing in mind the critical conditions obtaining for a possible increase in Sr-90 migration from the fuel fallout zone within the floodplain, there is a need for urgent measures to prevent the washout of radioactive substances.

- 506 -
BIBLIOGRAPHY
1. USSR State Committee on the Uti I ization of Atomic Energy: The Accident at the Chernobyl Nuclear Power Plant and its Consequences; information comp! Jed for the JAEA Experts' Meeting in Vienna, Austria, August 25-29, 1989.
2. Committee for the Assessment of the Health Consequences in Exposed Populations: Health and Environmental Consequences of the Chernoby I Nuc I ear Power PI ant Ace i dent; Report to the US Department of Energy Office of Hea I th and Env i ronmenta I Research from the Inter I aboratory Task Group on Hea I th and Env i ronmenta I Aspects of the Soviet Nuclear Accident, July 1987.
3. Nuclear Engineering and Design. 1988, Vol. 106, No 2, p. 179.
4. R. B. Kotelnikov, s. N. Bashlykov, et al.: High-temperature Atomic Fuel; Atomizdat, Moscow, 1978.
5. V. S. Yemelyanov, A. I. Yevstyukhin, et al.: Metallurgy of Atomic Fuel; Atomizdat, Moscow, 1968.
6. M. Iwasaki, Ishikawa: Air: oxidant of uo 2 pellets at 800-900'C: Journal of Nuclear Materials, 1970. Vol. 36, No 2, p. 116.
7. A. A. Borovoy, et al.: The Fuel Chernobyl NPP; handbook, Chernobyl 1988, p. 147.
in the Fourth Unit of the Institute of Atomic Energy,
8. C. D. Andr iesse, R. H. Tanke: Dominant Factor in the Release of Fission Products from overheated Urania; Journal of Nuclear Techology, Vol. 65, 1984, p. 415.
9. Yu. V. Dubasov, A. s. Krivokhvatsky, et al.: Radionucl ides in Chernobyl NPP near zone fallout; of the Soviet Academy of Sciences, Chernobyl 1990.
Fr act ionat ion of Radium Institute
1 O. A. A. Bu I gakov, A. V. Konop I ev, et a I . : Dynamics of Long- I i ved Radionuclide Washout from the Soi I by surface Runoff in the Chernobyl NPP Region; Pochvovedeniye, Moscow, 1990, No 4, pp. 47-53.
11. o. V. Voytsekhovich, V. V. Demchuk, G. V. Laptev: Analysis of Secondary Effects of Radioactive Contamination of the Pripyat after Inundation of the Floodlands in the Chernobyl NPP Near Zone; Works of the Ukrainian Hydrometeorological Scientific Research Institute, No 240, Moscow, 1990.

Sot Fio.l: Sr-QO CONTAMINATION IN GH6~~0BYL NPP NEAR ZONE
(Ci/km')
())
f •
I I
L() ~-
f')
,·
I 1-
I ' r
. I
\ .()
I
r·- 1· I .. !
I I
T -·--·r · L I
-............ () l/(l .. ,
j_ i
-·- r· '
()
f')
I
If)
{ (' ( ''.'" 1 _j
;t·
•.j
' I
·J i
2

cm
5oB fia.2: VERTICAL
SEDIMENT DISTRIBUT[ON OF 6~819NUCL!DES IN SOIL AND BED IN THE FLOODPLAIN IZONE CLOSE TO CHERNOBYL NPP)
1989
10
0
IO ---
10 CJ -
C)
10 \
Hq;,,cn1 [lq/ cm .5 _, IO I I [) I O ' 1D ' I D _, IO _, IO I 1 0 IO ' 1 0 -' I Cl 4 IO __ ! _L w_utL I illilltL J uuu14-_1~_au ul,,.1L~ l\!JD
, ' ' <,> ..
I
I
~ I~
> I
If .. ,· t,
I
, .. 11 jl
I I I I
.,it-,,¢
I
Bq/crn 3
, .. ,d
, I " , I , ,, ' I ,
" 0 -'"' I I " I I ,,
I I " :rr,I
o)
Cl - J lllllnl _ LllllilLJ LWII~ l.l lUllli_J_illlliLUi~-al,LW!JihJp _/_ ... - . ~ ..... -··:.,,
crr1
HJ ---
b)
llq/ crn .3 -I 1 10 10 2 10J I O --z 1 () - I 1 I () I (J l 1 0
/
__ LLLUwL___1_+-umlL-,al--l-~+--1-J_JJJlill
.. I ..
I
I I
I I
I I
0
a c
I _,
I
t'J
"' I
I
* ' "
I / ,,(_///
I " I/',,
' ' ., I
f I , ~
I .'
v' I .
fiJ ,,, r,A{ I '
"
, I
" I
,; I I ' I ' _.,. 1*
I'
I I ;
ii- *· I
1' , >;}
~ , ,, I
I
* , I '
, •
' I r,
, ,,
I
* I
I
>t '
I
*
drv soil moist soil
144 ['J / '.___, ',._,
,)
b ct
o _LilllWL_.Ll_Lillill ____ L.L\!l,J.lltl __ J,,e-Jll~c,,.1-D urnl
~J
CfT)
10
1
J "
' ' ~
I ,
' ,
I
I I
' ,:;
)'
I <;
' '
I' ,, I
J
abnormal fallout
" ,,
I I
~~
bed sediment of lake
* ") Lu ·t'A
,,
' I
I J . .., , I
F
,' / I
-1

Fia.3: '5c'3
TYPICAL PARTICLE SIZE D!-S'J:iJll)lJBltTIONS FOR "HOT" PARTICLES OF SOIL TAKEN FROM THE PRIPYAT RIVER FLOODPLAIN IN THE CHERNOBYL NPP NEAR ZONE
' ___ {I ,. .
_::,.···.
-1-··
'· '- ,_ '.' -l -,
I I L·,--'
--r ..
Q 1
,-.. '- '-'.'
A - Size distribution
,; '<
B - Cumulative frequency <in%)
----·-----~--- .
(A)
: ·-···,-- : ---r- ···1·-----··--- .-
( R)

Fig. 4: 510
VARIATION OF "HOT" PARTI-C~D-ISTRIBIJTION AT DIFFERENT TIMES AFTER THE CHERNOBYL ACCIDENT SAMPLES TAKEN FROM SOIL 10 km NORTH OF THE NPP IN 1987-1989
G.5
0.4
i -· y ' I· ,. /) I,,
1 H8'(
7 P. 1 .. ~

Fio.5:
t c
511 DISTRIBUTION OF ACTIVIT¥ BIIIQS PARTICLES. A (experimental) I A ZONE 10-15 km NOTH OF CHERNOBYL
A: Cs-134 B: Cs-137
FOR RADIONUCLIOES (calculated) NPP. 1989
JN
Distribution of activitv ratios IAe/Acl for Cs-134
··1·
(A)
f ' -, r i -,
)
,.- ,j _,
' ' ' ;·· I
·"· ·i j /I ··1
_j ' 1 r i !
i " ' I r'
!- I I - ! i ' ;
• ;.ll-::. i
• _ __h_'
t ·- ". /'",
"HOT 0
Distribution of activitv ratios IAe/Ac) for Cs-137 -F_; ,· -·
:"> J r _ .. \ ,. -; .-I
;· I ' ) . ! .·l
.! j
f i .i ! ' I • . . ,- ' i
I
.. .;'-- ·-.,<-.
r-:'"'! ,- .I ' .i ~; ' i _;!, ,-
cl
i I( ' " :>-.I
. ,-.-; !•
( fl )
. -

Fiq,6:
:1'
'
512. DISTRIBUTION OF ACTIV!TY-RSl]'l0-8 PAHTICLES, A (experimental) I A ZONE 10-15 km NOTH OF CHEHNOBYL
A: Ce-144 B: Ru-106
FOR RAOIONUCL!DES (calculated) NPP. 1989
IN
Distribution of activitv ratios IAe/Acl for Ce-144
"'"-
40
-_,.--1 v .,·1 ,) :,· ·1
,i I ,J .11 -,l . f> A '' i-· 1 ,l I '
!·· : i-.l ~- j .J. ·,.- -
- - -----·----·---- ------------~-----··------. -·---,
1·
( I\ )
,I ' j_ _.L_
'"" 1 4
r,!_ e'· ~lf'flTT< '/Ai,-_.,~',·
"HOT"
Distribution of activity ratios IAe/Ac) for Ru-106
" ·-L
.".4
2 .:!
-, .-:;
' -'!-·
'
"
. ..,----·· --------- ----------------------- --·--------- -~---···-------·----------
i-;-1
-, j
.J ' ' -f
' ! ' 1- ,1 ' ·l k : r ,I
!
I I ' ' i r !-' ' :, .j
,-·-.-, ~ .· j r ·1!'"'1
1-[ !,
'
( B)
' '

- 513 -Fia.7: KINETIC CURVES OF RELEASE OF Sr-90 FROM SOIL AFTER WATERING
5
K '10 *mm L
?,5-
- - - -- -- - - - - -- - - - - - - ·- - - -- - -- - - - - - - ·-i:, 3
30
25 -
20 -----u l
u 15 - I>
10- I> D
* ll
* I>
5 * * ~; [> D
-•wlti tJ D D
0 ,-T11T11 ·--,- ,--r, -r,,-TT-,,-1TTT!TT1 r,,-TT"il-r-rTTT,-1 0 :, 1 0 1 5 20 25 .30 35 40
Day
K Liauid Washout coefficient standardized to run-off layer l .2 Sandy /Silty soils: 3 clav soils

- 514 -

- 515 -
Forms of Radioactive Fallout and Mobility of Radionuclides
in Ukrainian Aqueous Landscapes
E.V. SOBOTOVITCH, Y.A. OLKHOVIK, N.V. GOLOVKO, T.I. KOROMYSLICHENKO
Institute of Mineral Geochemistry and Physics Ukrainian Academy of Sciences. Kiev. USSR

- 516 -
ABSTRACT
The mechanisms underlying the kinetics of caesium-137 and strontium-90 washout from bed sediments were studied. Migratory radiostrontium was shown to be present mainly in the form of cations, and radiocaesium was present in both mineral and organic forms bound to both humic acids and oi I products. Radiocaesium migration in surface waters was mainly technogenic in character.
Three i I lustrations; one table; bib I iography: nine references.

- 517 -
As a result of the accidental release of radioactivity at the Chernobyl NPP in 1986, and the processes of surface runoff from contaminated catchment areas since then, bed sediments in water cours.es and reservoirs in the Dnieper Cascade are now a repository for large amounts of long-I ived radioisotopes of caesium and strontium. In 1989 it was estimated that the bed sediments in the Dnieper Cascade reservoirs contained 1.5 x 10¹⁴ Sq of caesium-137, and that the Kiev reservoir contained 1 x 10¹⁴ Bq of caesium-137 and 1.5 x 10¹³sq of strontium-90. The subsequent behaviour of these radionucl ides is governed by a range of natural processes; for instance, the overlaying of radioactive sediments with new, less contaminated layers reduces the avai labi I ity of radionucl ides for transfer into the water. The reverse process occurs simultaneously; silty waters, containing water-soluble forms of the elements found in the sediments, form in the initial stages of di agenes is as a resu It of compact ion of the upper I ayers. The presence of an "upwards" transfer process determines the need for a detailed investigation of the forms of occurrence of radionucl ides in bed sediments, fol lowed by an assessment of the scale of secondary contamination of surface waters.
The attachment of radionucl ides to the bed sediments of water bodies is mentioned in many p=pers: in connection with global f.:.1 lout 1, with I iquid radioactive wastes from enterprises involved in the nuclear energy cycle 2, 3 or with the operation of nuclear power plants using coo I i ng ponds 4
However, the fallout from the Chernobyl accident has specific characteristics, since the catchment areas and surfaces of rivers in the near zone (Pripyat, Uzh, Dnieper and others) and the northern section of the Kiev reservoir were contaminated chiefly by fissionproduced radionucl ides contained in the uranium dioxide matrix. As a result of this particular characteristic, each radioisotope can be I iberated during the course of the fol lowing processes:
al egress from the matrix (through diffusion or dissolution of the matrix substance);
bl interaction with the sediment matter (sorption or formation of chemical compounds);
c) migration of dissolved forms through mixing of silty and surface waters.
Naturally, the speed at which the successive processes occur is determined by the speed of the slowest stage, which, initially, constituted the processes taking place at the phase boundary between fuel matrix and sediment. At the present time, the accumulation of migratory forms of radionucl ides in bed sediments indicates retarded mixing of interstitial solutions with the main mass of water. Removing these kinetic I imitations under laboratory conditions through constantly m1x1ng sediments with fresh water al lows us both to establish the speed of desorption for migratory forms of radionucl ides, and to estimate the parameters of the process governing the egress of radioisotopes from dispersed nuclear fuel.
Extensive information has now been accumulated relating to the composition and particle dimensions of radioactive fallout in the near zone. There is a significant amount of carbon (graphite) - up to 15% -in the uranium dioxide particles, and the distribution of particles by size in relation to distance from Reactor No 4 is log-normal. Data from radiochemical and instrument studies indicate significant oxidation of the uranium dioxide as a result of the high temperatures produced during the accident.

- 518 -
These factors are what cause the significant instabi I ity of the dispersed nuclear fuel in water. According to the authors' original calculations, alpha-radiolysis of the water and subsequent oxidation of uranium (+4) to uranium (+6) engender the disintegration and dissolution of approximately 3% per year of the uranium matrix.5 Clearly, the diffusion mechanism contributes significantly to radionuclide egress from uranium dioxide, particularly for particles with dimensions measured in microns. Starting from a diffusion coefficient value of D. 1 x 10-19 cm,/sec, as determined for the diffusion of inert gases from irradiated uranium dioxide at temperatures below 6oo·c 6, it is not difficult to estimate the I lkely scale of radionuclide egress. Thus, in the case of 2 µin-diameter particles of uo2 the losses over three years of fission-produced radionucl ides through diffusion amount to over 1%.
Naturally, using the diffusion parameters for inert gases wi 11 give very high values for the diffusion of radionucl ides of caesium and strontium since, in contrast to inert gas atoms, these radionucl ides are capable of dissolving within the molecular lattice of uranium dioxide. However, given the possible decrease in the density of the crystal lattice of uo2 due to high-temperature carbon penetration and partial oxidation to u3o8 , use of the parameters mentioned above is sufficiently justified.
Because both processes occurred simultaneously over four years, there was a significant redistribution of radioisotopes from· the initial fallout particles into bed sediments. Thus, the processes of radionuclide interaction with the mineral and organic components of the sediments now play an increasingly decisive role in the format ion of fixed and migratory forms of radiocaesium and radiostrontium. The dominant role played by natural layered minerals in fixing fissionproduced radionucl ides is widely known, and no explanation is necessary here. Quartz, with its characteristic cryptocrystai I ine and amorphous diversity, plays a significant role. As for the problems of interaction between technogenic radionucl ides and natural organic substances, insufficient research has been done in this area. The paper I isted at 7 shows that the fulvic and humic acids washed out of soi Is are capable of forming stable complexes with many metals present in macroconcentrations.
The authors of the report I isted at 8 investigated the molecular and mass composition of organic compounds separated from soi I using the radio gel chromatography method. Unti I now, however, the I iterature has not contained much information on the processes determining the kinetics of technogenic radionuclide washout from soi Is and bed sediments.
The aim of this paper is to investigate these processes as they relate to caesium-137 and strontium-90 washout from bed sediments.
Our attention focused on bed sediments from the floodplain of the Pripyat river (sample P5), silts from the northern sector of the artificial cooling pond at the Chernobyl NPP (sample R5), and silted sands taken from the southern sector of the same body of water (sample R1). Radioactive contamination in si Its from areas adjoining the power plant site was mainly in the form of dispersed reactor fuel; this was clearly indicated by the results of mass spectrum analysis, as the uranium separated from the samples has an isotopic composition which differs from that of natural uranium. By means of the relationship

- 519 -
between the f i ss Ion react Ions of 235u and the capture react ion of 235u c n, '6 > and 236u, fue I part i c I es show Ing a 50% 235u burn-up (the Initial amount being 1.9%) were identified in the separated fraction. The "fuel" origin of the fallout on the floodplain is also confirmed by the results of isotopic analysis of the uranium, the atomic ratio of 238u and 235u In the samples analysed being 87-92 9.
The samples were processed over the course of 28 hours using water of natural hydrochemical composition, a check on the amount of organic substances and radlonuclldes washed out being made every 3 hours. The radionuclide composition of the samples was determined by a germaniumllthium semiconductor detector after passing the solution through a membrane filter with a pore diameter of 0.2 µm, evaporating It and then using radiochemical means to determine the strontlum-90 content .
. Infrared spectra of dried aqueous extracts were obtained using the UR-20 infrared spectrometer on the fourth slit programme. 0.1 N solutions of ammonium acetate and sodium hydroxide were used to extract the ion-exchangeable forms of radlonuclides and organic components.
The results obtained for radiostrontium leaching In kinetic conditions are the most suitable reflection of processes on the matrix-sediment phase boundary, since strontium ions are the ones least subject to sorptlon by slit components. The calculated speeds of strontlum-90 egress are given in Fig. 1. In interpreting the results, the concept of two processes occurring simultaneously was used - a) the transfer of radiostrontium Into solution from water-accessible positions through the ion-exchangeable desorption mechanism, and b) egress from the matrix through diffusion and simultaneous dissolution of the "hot" particle substance. Superimposing these processes yields the differential curves shown in Fig. 1, the downward portions of which are caused mainly by desorption, while the horizontal portions reflect the egress of strontium atoms from the matrix. These experimental curves are a long way from providing an ideal picture of the superposition of the two independent processes, reflecting the diversity of actual stront lum desorption processes. The lowest V value should be used to evaluate the speed of egress of radlonucl ides from dispersed fuel particles. The large variation in the Vmin values for samples RS and PS may be explained by the difference in the fallout particle sizes; typical particle sizes for the area where sample RS was taken went up to 200 µm, while the average diameter in the area where sample PS was taken was 3-5 µm. Bearing in mind that the amount of oxidised forms of uranium contained is In proportion to the surface area of the particles, it is not surprising that the matrix egress speeds for radlostrontium should be so high, or that the degree of leaching should be so significant (up to 50%) (Fig. 2a, curve 1).
The amount of mobile forms of radlostrontium found in all the samples examined does not correlate with the samples' organic substance content (see Table), which leads us to suggest that strontium Is present mainly in the form of cations. Radiocaesium egress is governed by other processes.
The highest degree of caesium-137 egress is noted in soi I with the lowest organic substance content (losses through calcination 1.8%) (Fig. 2b, curve 3), the smallest in silts with the highest organic substance content (losses through calcination 23.3%) (Fig. 2b, curve 2). Bed sediments taken from the Pripyat river floodplain (PS) I le between these two extremes in terms of caesium-137 and organic compound

- 520
content (Fig. 2b, curve 1). There is a relationship between losses through calcination and the distribution of this radioisotope by forms of occurrence. Thus, in sample R1 (smallest losses through calcination, i.e. 1.8%) the largest quantity of caesium-137 is found in the water-soluble (4.6%) and ion-exchangeable forms (9.6%), while the smallest amount is bound to humic and fulvic acids (see Table). For the sample R5 (with the greatest losses through caicinatlon, i.e. 23.3%) the content of water-soluble forms of radiocaesium Is lowest (0.03%), caesium-137 is not observed at all in ion-exchangeable form, and practically all the radioisotope is bound up with humic and fulvic acids.
It may be assumed that caesium-137 is found in two forms, mineral and organic, in contrast to migratory strontium-90, which is mainly found in ion-exchangeable form.
On the basis of the infra-red spectra obtained, which show the presence of functional groups of organic compounds with which radionuclides bind, a correlation was found between the Intensity of the C-0 and c-c bonds in organic compounds and the egress of caeslum-137.
Fig. 3 (a, bl shows the relative egress of caesium-137 and the relative intensity of the C-0 and C-C bond regions after processing a sample with water. Infra-red spectra from consecutive sample processing show that the C-C and C-0 regions can belong to humic and aromatic acids. It was shown that the curve shapes in Fig. 3a fully coincide with the curve shapes In Fig. 3b; however, in the case of samp I e P5 < curve 1) the influence of the mineral fraction is apparent, since Si-0 groups also absorb in the region 1 000 - 1 100 cm-1.
It has been established that radiocaesium dissolved in water also binds to oi I products, and in conditions of intensive technogenic loading its migration in surface waters is essentially technogenic in character. Study of the kinetic processes involved established the parameters of radionucl Ide egress from nuclear fuel, and also allowed an estimate to be made of the desorption speed and composition of migratory forms of radionucl ides. It has been shown that migratory radiostrontium is mainly found in the form of cations, while radiocaesium is found both in mineral and organic forms and is combined with humic and aromatic acids.

- 521 -
BIBLIOGRAPHY
1. Yu. v. Kuznetsov, v. N. Shchebetkovsky, A. G. fundamental principles governing the removal of contamination from water; Moscow, Atomizdat, 1974, 360 pp.
Trusov: The radioactive
2. E. A. Timofeyeva-Resovskaya, V. N. Agafonov, N. V. TimofeyevResovsky: The fate of radioisotopes In water bodies; Reports of the Institute of Biology, Urals Branch of the Soviet Academy of Sciences, 1962, No 22, pp. 49-67.
3. R. J. Pickering, P. H. Carrigan, T. Tamura, et al.: Radioactivity in bot tom sed I men ts of the c II nch and Tennessee r Ivers; Di sposa I of Radioactive Wastes into Seas, Oceans and Surface Waters; Vienna, IAEA, 1966, pp. 57-88.
4. Yu. A. Yegorov, s. v. Kazanov: Forecasting radlonucl Ide accumulation in the main ecosystem components of NPP cool Ing ponds; Nuclear safety and NPP protection; Moscow, Energoatomlzdat, 1987, No 12, pp. 107-116.
5. Yu. A. Olkhovik, s. I. Chebanenko, N. G. Kostyuchenko: Water radlolysis; the probable egress mechanism involved in radionuclide egress from "hot" particles derived from fuel; in "Geochemical migration pathways for artificial radionucl ides in the biosphere"; summary report of proceedings, Gomel, 1990, p. 74.
6. B. Lastman: Radiation phenonema In uranium dioxide; Moscow, Atomizdat, 1964, 211 pp.
7. G. M. Varshal, T. K. Velyukhanova, I. Ya. Koshcheyeva, I. V. Kubrakova, N. N. Baranova: Complexing of noble metals with fulvic acids in natural waters and the geochemical role of these processes; Analytical chemistry of rare elements; Moscow, Nauka, 1988, pp. 112-146.
8. A. I. Samchuk, B. F. Mltskevich, Yu. A. sushchik, I. v. Sadolko, T. K. Kokot: Investigation of the forms of occurrence of rad i onuc I ides in Ukrainian Polesye soi Is; Summary report of proceedings of the XVI Ith Al I-Union Chugaev Conference on the Chemistry of Complex Compounds, Minsk, 1990, Part 4, p. 687.
9. E. V. Sobotovlch, Yu. A. Olkhovik, T. I. Koromysl ichenko, G. A. Sokolik: Comparative characteristics of the migrational capacity of radionucl ides In the bed sediments of water bodies in the Chernobyl NPP near zone; Reports of the Ukrainian Academy of Sciences, Series B, 1990, No. 8, pp. 12-16.

Tab
le
I:
DIS
TRIB
UTI
ON
OF
RA
DIO
NU
CLID
ES
BY
FORM
S OF
OC
CURE
NCE
IN
BED
SEO
IMEN
TS
r~J:
:::;
::::
r==
=:=
==
=r=
==
I~
I S
ampl
e I
II re
fere
nce
P
-5
R-1
R
-~
'I I L
osse
s th
rou
gh
I I I
I I I I i I i I i I I ' I I calc
inati
on
%
' I For
ms
ol
! occ
ure
nce
Wat
er-s
olu
ble
Non
-ex
chan
Qea
ble
Hum
ic
acid
Fu
lvic
aci
d
I l'
I 12
.8
Hu-
106
Cs-
134
Cs-
137
I . I
l
. l
0.8
-0.
72
0. 5
4
4.4
0
.64
0
.27
I. 3
0
.86
0
.07
I I.
8
! 2
3.3
I
HA
DIO
ISO
TOPE
S D
ISTR
IBU
TIO
N
BY
FORM
S.
%
II I
Sr-
90
R
u-10
6 C
s-13
4 C
s-13
7 S
r-9
0
Ru-
106
Cs-
134
Cs-
137
Sr-
90
I J
6.9
-
6.8
4
.6
l. 7
I.
0
0.0
8
0.0
6
0.6
2
11
25
.4
-9
.4
9.6
8
.8
--
-I.
25
0.0
9
--
0.5
3
.0
0.0
7
0. I
0
.6
0.0
5
5.8
-
0.9
7
0.6
5
0.8
0
.05
0
.03
0
. 15
0.
14
01
"' "'

'Vc-1
-5 HO
-6 5·10
!·106
s167
f-107
5·to8
- 523 -
• • • • • • • 1 •
0
2. 0 0
0 0 0 0
3 6 9 12 15 18 21 24 27 30
Fig. 1 Speed of strontium-90 egress from bed sediments: (1) Floodplain (2) Cooling pond

4D
30
20
10
1.6 -
1.4
1.2 -
1.0 -
0.8
0.6
0.4
0.2
" "-...E • o~ !!? • ,, " t t-ll ...
3
- 524 -
Q)
3 2
3
•
2 b)
6 9 12 15 18 21 24 27 30
Fig. 2 Dependence on sample-processing time of overall egress of water-soluble strontium-90 (a) and caesium-137 (b): 1 • PS, 2 • RS, 3 • R1.
hr5

- 525 -
0.6
0.4
0.2 a..)
fe\ Vt1i ~
40
30 .....,>-.. b)
;,
20 ~ 10 J
~
a:
0 3 6 9 12. 15 1B 2.1 2.4 2.7 30 "t,
Fig. 3 Interrelationship between the relative content of water-soluble caesium-137 and the structure of organic compounds: (a) Relative content of caeslum-137 (b) Relative intensity of C-C and C-0 bond regions. For key
see Fig. 1.

- 526 -

- 527 -
Hydrological Aspects of Radionuclide Migration in
Water Bodies Following the Chernobyl Accident
G.V. VOYTSEKHOVICH, V.A. BORZILOV, V.A. KONOPLEV

- 528 -
ABSTRACT
The variety of secondary effects determining migration processes stands out as the main specific feature of the radioactive contamination of water bodies fol lowing the Chernobyl accident. Of these the paper highlights the transformation processes of the various physico-chemical forms of radioactive fallout products as observed in catchment areas and water bodies, such processes taking place in different geochemical and hydrological conditions depending on the landscape. The following are considered: dynamics of physico-chemical forms of radioactive fallout, changes in the contamination pattern of soils and water-body bed sediments fol lowing the accident and - as a result of runoff formation in these areas - the radioactive contamination regime of the Pripyat and Dnieper rivers between 1986 and 1990.
The paper presents experimental data for evaluating retention factors for waterborne migration of Chernobyl radionucl ides In surface washout, via seepage waters In soils, in silt solutions of bed sediments and via transport of suspensions In rivers and reservoirs. It also considers the different approaches to evaluating these parameters and the field research methods.
We consider the methods used in field studies of washout mechanisms and mass transfer parameters for water-soluble, exchangeable forms of radionuclides and contaminated particles of soil and bed sediments in runoff and floodplain flows, and provide data on the kinetics of these processes. We also analyse the observed processes of flow purification through sedimentation, and the role of catchment-area and river-channel load in the transport and deposition of radionucl ides such as 137cs, 90sr and total Pu. The paper provides transport and accumulation balances for Chernobyl radionuclides in the large reservoirs of the Dnieper Cascade. It also takes a close look at the specifics of 90sr migration in Dnieper river water systems fol lowing the Chernobyl accident, comparing them with the specifics of 90sr dispersion in the river network and lakes fol lowing the Kyshtym accident.

- 529 -
INTRODUCTION
On 26 Apri I 1986 a serious nuclear accident took place In the fourth unit of the Chernobyl NPP, destroying the reactor and Its housing, and releasing into the atmosphere approximately 3.5% of the fission and activation products accumulated in the reactor.1, 2
A cloud formed and the fallout of aerosols from this left a radioactive trai I in areas to the west and north depending on the meteorological conditions governing air mass transfer. From 26 April to 8 May 1986 the continuing discharge of a jet of gaseous, volatile and aerosol products led to the formation of what are known as the near and distant zones of radioactive fallout.
Data on the daily releases Into the atmosphere 1 make it possible to determine the composition of the release and the radionucl ides' physico-chemical properties, which changed during the time the various branches of the trail were being formed. For this reason, the composition of the radionucl ides in the fallout on the territory studied was heterogeneous and depended on direction and distance from the NPP.
The shock wave of the Chernobyl explosion, the temperature gradients and oxidation of the nuclear fuel (uranium dioxide - uo2) led to the formation of "hot" fuel particles, over 90% of which, with an activity of 10-9 Ci, had a radionucl Ide composition similar to that of spent fuel and whose content of highly mobile fission products varied. 3 The ingress of hot fuel particles into the environment is the main feature of contamination from the Chernobyl accident. The destruction of the fuel elements and the "anneal Ing" of the nuclear fuel released into the atmosphere a considerable Quantity of volatile fission products as we! I, some of which condensed on the inert carrier particles of the aerosols: mixtures of dust, construction materials, etc. The "hot• particles formed in the accident had properties similar to those formed in the last stage of a nuclear explosion, their surface contamination level and specific activity being lower than those of fuel particles.
The condensed part i c I es formed as a resu It of the Chernoby I ace i dent are slmi lar to the global fallout of radionucl ides after nuclear weapons t9sts, and it Is therefore possible to predict their behaviour in water bodies to a reasonably accurate degree. The behaviour of the fuel particles, however, which are the uniQue feature of the Chernobyl "trail" and are concentrated primarily In the 60-km zone around the Chernobyl NPP, presents major scientific problems.
Most of the radioactive fallout was deposited on the catchment areas of the Pripyat, Dnieper and Desna Rivers, which are the main ones feeding the reservoirs in the Dnieper cascade (Fig. 1). The radioactive trail has three distinct branches (northern, southern and western) which cover the southern rayons (districts) of Byelorussia, the western part of the Bryansk oblast of the RSFSR and the northern and central oblasts (regions) of the Ukraine. Estimates of the content of 137cs and 90sr in the catchment areas of the main tributaries of the River Pripyat and the Upper Dnieper are shown in Table 1. The accident contaminated the water bodies in two stages: via direct fallout and as a result of various secondary radionucl Ide migration processes via aQuatic pathways.

*
- 530 -
Table 1
137cs and 90sr content
in the catchment areas of the main rivers/tributaries
feeding the Kiev Reservoir
Catchment area Content of radionucl Ides River in thousands of km2 in Ci
basin A>1 Ci/km2 137cs 90sr
Dnieper mouth 105 29 275 6
Pripyat mouth 115 27 180 42
Braginka and interfluve 2 2 55 12
Desna mouth 89 61 8 <1
The radioactive contamination of the Chernobyl NPP site was not taken into account when evaluating the radionuclide content.

fi_,1, Cs-131 ;.,,,, I-he
Co1"1h1mine1ho., oJ cahhmen\- a(ea5
urper \Jnieper be1.:;i n
' \ ,--/
.... _ -,,,,, I
;
I
' .
'1- 5 C, / v:.mt
5-15 C,./v.mt
[ill]
•

- 532 -
1. PRIMARY CONTAMINATION OF WATER BODIES
Immediately after the accident the water bodies were radioactively contaminated by direct fallout of accident aerosols onto the surface of rivers, reservoirs and seas. Table 2 shows the maximum concentrations of certain radionuclldes in the water during the observation period (which started on 01.05) in various rivers, where water contamination levels changed considerably up to the end of the fallout per iod.4 The total beta-activity of the Prlpyat River fell from 10-7 Cl/I in the initial days after the accident to 4-6 x 10⁻⁹ Ci/I by the end of May. The maximum concentrations of 239pu observed in the Pripyat River In the initial days after the accident c,o-11 Ci/I) fell to 2 x 10-13 Cl/I by August, which is four orders of magnitude lower than the maximum permissible level. Up to 98% of this was found insuspensions and bed load. For this reason, attention was then focused on studying the water migration processes of long-lived Isotopes such as 90sr and 137cs.
Table 2
Radionuclide content in rivers in the
initial period following the Chernobyl accident 4
River Date Rad ionuc Ii des content c,o-9 Ci II)
sample 144ce 141ce 131 I 103Ru 137cs 95zr 140sa
collected
Pripyat 1.05.86 10 11 57 15 6.7 11 38 Chernobyl 2.05.86 -- -- 120 22 15 42 60
6.05.86 -- 2.4 22 4.6 43 4.5 4.5 3.06.86 -- -- 0.9 0.7 0.6 0.3 --
16.07.86 1.0 0.4 -- 0.4 0.2 1.0 --Teterev 3.05.86 -- 18 54 19 -- 39 34 I rpen 6.05.86 -- -- 50 -- -- 22 30 Dnieper, 3.05.86 -- 9 35 -- -- 19 19 Kiev
The content of 90sr in various waters was determined from 1 May onwards. The highest levels were observed in the first few days of May in the Prlpyat and reached 4 x 10⁻¹⁰ Ci/I. From the end of May until June its content in the Pripyat remained within the range 3-5 x ,o-11 C II I . 4, 5
The river creeks, lakes and floodplain water courses in the Chernobyl NPP zone were contaminated via direct deposition of radioactive substances onto the water surface and bed. In smal I rivers the initial period of contamination lasted the whole of May 1986. Their level of radioactive contamination was determined by the speed with which fallout was deposited onto - and dissolved in - the water, as well as by river flow itself, i.e. the throughput of water in the contaminated

- 533 -
area. Thus, this period lasted about 20 days In the case of the Lubyanka RI ver, the 137cs content in I ts waters fa I Ii ng from 10-8 to 10-11 Cl/1.6 The highest contamination levels in the waters of the reservoirs In the Dnieper cascade were also registered In the initial period after the accident.4 The observation data showed that the radioactivity of the water in this period came primarily from particles suspended in the water. The activity of the filtrate accounted for just some 10% of the total activity of the gamma-emitters In the sample. The total beta-activity of the water in the period of aerosol fallout reached 10-7 Ci/I.
From that time onwards, the sharp fall in the intensity of emissions from the source led to a reduction in the role played by the aerosol component in reservoir contamination. suspended particles settled quite quickly onto the bed of the reservoir, and as early as 7 May the total beta-activity of the water in the area around the settlement of Lyutezh was of the order of 10-11 Ci/I.
Isotopes of 1311 played an important role In the contamination of water bodies In the initial period. The highest content of 1311 in the Dnieper, observed in the Dnieper water intake area, came from fallout of radioactive aerosols and, according to 4, amounted to 3 x 10⁻⁹ Ci/I on 3 May. Once atmospheric fallout of radioactive aerosols onto the water surface had ceased, secondary processes became the main source of water contamination, the most important being a) radionuclide washout from contaminated catchment areas and river floodplains and bl radionuclide exchange processes in the "bedsediment/water" system. The intensity of secondary water-contamination processes was determined largely by the physico-chemical forms of the radionucl ides In the fallout and by their rate of transformation in the ''soi I-water" system.
2. RADIONUCLIDE WASHOUT FROM CONTAMINATED CATCHMENT AREAS
Immediately after the Chernobyl accident there was a need for rapid forecasting of secondary radioactive contamination of water bodies. The Question of radioactive contamination in the water courses of the Dnieper basin was particularly Important, given that this is the Ukraine's main source of water and that migration of radlonucl Ides via the river systems may contaminate areas a long way from the accident site. One of the main processes resulting in secondary contamination of surface waters is washout of radlonucl ides from the contaminated territory In surface runoff. The first studies into washout of Chernobyl radionucl Ides were carried out as early as the summer of 1986, the aim being to calculate washout coefficients in order to provide a rapid forecast of the radiation situation in water bodies.7, 8 These studies were carried out using artificial sprinkling on specially equipped runoff sites. Table 3 shows the standardized washout coefficients for the main long-lived radionuclides as a result of pluvial and snowmelt runoff, these being obtained In experiments at runoff sites. In the spring and summer of 1987 studies were carried out in actual catchment areas in the Boguslav rayon of Kiev oblast into washout of 134cs, 137cs, 106Ru and 144ce with surface runoff into rivers. The standardized coefficients of I iQuld washout (K 1) calculated using the data from these studies tally with the experimental findings from the runoff sites.
After the radionucl ides fal I out onto the surface of the soi I, they

- 534 -
become fixed and migrate into the depths of the soil. These processes resulted In a reduction in the magnitude of the standardized coefficients of radionuclide washout in surface runoff. However, no significant fall In the Ki level for 90sr was observed between the summer of 1986 and the autumn of 1989. This can be explained by the fact that migrat Ion into the lower soi I layers by this radionuclide's mobile soluble forms is balanced out by transformation of its nonexchangeable forms due to leaching of the fuel particles. As a result, the content of exchangeable forms of 90sr in the upper soil layer does not change much in the catchment areas In the zone, with the exception of the areas In the near zone of the fuel contamination trail where, In recent years, we have observed increased rates of radionuclide leaching from the matrix of the fuel particles and, at the same time, conditions have not been conducive to water-based migration of their exchangeable components into the depths of the soiJ.9
Table 3
Coefficients of liquid washout of 137cs and 90sr standardized by runoff layer, obtained at experimental sites
in the 30-km zone around the Chernobyl NPP, k 1-10-5 I/mm
Experimental site Date 137cs 90sr
Chernobyl 9.07.88 1. 1 42 10.07.89 1 .o 45
Benevka 14. 10. 86 0.6 5.8 .03.87 0.2 0.6
17.09.87 0.3 21 8.07.BB 1.0 20
11.07.88 0.7 13 29.09.88 0.9 17
Kopachi 03.87 0.4 1 . 1 04.87 5.7 6.6
16.09.87 0.1 2.0 10.07.88 0.7 12 27.09.88 0.8 10
Korogod 03.87 0.7 0.8 18.09.87 0.4 11 7.07.88 1 .4 13
24.09.88 1.5 a.a 7.07.89 0.7 15
Dovlyady 16.07.86 5.5 10 16.07.86 3.4 10 12. 10. 86 0.8 7.2 16.10.86 0.6 12 16.10.86 1 .6 8.4
Experiments involving sprinkling runoff sites and flooding soil monoliths were carried out around the Benevka settlement during various seasons of 1986-1987 to study the washout of radionucl ides under various conditions of water-runoff format ion in the catchment areas. The monolith flooding experiment showed that a balance between the concentrations of dissolved 137cs and 90sr formed within some three weeks. The K1 values calculated from these tal I led, within a given margin of error, with the standardized coefficients of "I iquid" washout

- 535 -
obtained at the runoff sites. In spite of considerable differences in the sprinkling regimes (Intensity and duration of experiments), the radionuclide concentrations in the runoff at these sites did not change much. The durat Ion of sprlnkl ing ranged from under one hour to 24 hours. All this shows that equil lbrium concentrations are produced In the "soil-water" system during contact between rain water and the uppermost soil layer, in which surface runoff Is formed.10 In the turfy sections of the soi Is where the experiments were carried out, this layer comprised surface vegetation and the uppermost rootsupporting layer of soll particles, I.e. where most of the radioactive fallout Is concentrated. In washout experiments Involving artificial sprinkling, the uptake of radlonuclides Into the waters of surface runoff resulted mainly from direct desorption and ion-exchange of radionucl Ides In the upper contact layer of the soi Is. At the same time, in the case of complete prolonged flooding, diffusive flows of contaminated interstitial waters In the upper soil layer were also Involved In the mass exchange between water and contaminated soi I. Speedy format Ion of equi I ibr lum concentrat Ions points to the decisive role of ion-exchange processes in the formation of radionuclide content in water runoff. Where considerable time Is taken to establish equi librlum conditions, the major role in mass exchange between radionuclides and water is played by diffusive migration processes.
Calcium, which largely determines the equi I lbrium content of 90sr in the waters forming or accumulating in the 30-km zone around the Chernobyl NPP, Is the main exchangeable Ion in the sol ls of this zone and is extremely important for the migration of this radionuclide In the soi Is of the areas studied. The studies therefore also Included data on the chemistry of the waters in the zone.
In the case of formation of snowmelt (in contrast to pluvial) runoff, the 90sr content in the water is clearly dependent on the Intensity of runoff in radioactively contaminated catchment areas. This can be explained by the fact that when snow melts, part of the melted water drains along the surface of the lower layers of snow and frozen soi I and has I it tie contact with the latter, and therefore di lutes the contaminated runoff. When the upper, most contaminated soil layer has completely thawed, the incorporation of radionuclldes into the snowmelt (via mass exchange with the soi I) is balanced out since the less contaminated snowmelt water di lutes the radionuclide content (Fig. 2). The 90sr concentration therefore remained constant, and, as in the case of the experiments with pluvial washout, did not depend on the intensity of surface runoff formation. In contrast to the processes of formation of radionuclide washout in snowmelt and pluvial runoff, we identified - through in-situ observations - a number of features specific to radioactive contamination of river waters during flooding of soils In the floodplain landscape of the Chernobyl NPP near zone. 11 The main hydrological features of floodplain washout In this area are usually prolonged flooding, a wide range of ways In which the water masses move along the rel lef surface of the floodplain I andscape, and the mu It i-d I rect iona I nature of water movement In the aeration zone and In subsoi I flows where there is a direct hydraulic I ink between the levels of river and floodplain waters. The particular physico-chemical features of radionuclide migration In this area were determined by the high content of fuel particles in the trail of fallout deposited, by the favourable conditions for their breakdown

- 536 -
given the presence of organic substances in floodplain soils, by the large amount of hydrocarbonaceous substrates, and by the relative scarcity of geochemical barriers to their migration In al iuvial subsoils. As a result of the first of these factors, a major role In river contamination was played by the processes of water yield and post-high-water runoff of the contaminated floodplain flows via the surface and fi ltratlon pathways.
Dependence of 90sr level In surface runoff water
on snowmelt Intensity
Frozen soi I Thawed so 11
0 0 -o----------0 0 00 s u
10 Sr-.!lO
r 0.1{ f a q
c 0 n
c I Q e O.J I
I
c e
5 n I
r ~ u 0.2 I n I I
0 ti f
0
t r a t i
f 0./ 0
n f
.Ci/ I 0
w 18.03 ;JJ.0.3 t?J0.3 t?.203 J.3.03 £1/.03 1010)
( I /s)
surface runoff flow
o concentration of 90sr in solution
Fig. 2

- 537 -
It should be pointed out that in the years fol lowing the accident the low flows and levels of water during high water meant there was no significant flooding of the floodplain area In the near zone (Figure 3). As high water developed and reached its peak, floodplain runoff of insignificant volume was diluted by the high water in the river. When the high water fell, the Intensity of floodplain water runoff Increased because of the fall in river water level, which led to a significant rise in the 90sr content in the channel flow (Figure 3). The longer the water forming part of river channel capacity spent on the floodplain landscape, the higher the content of radionuclldes In floodplain runoff. The kinetics of this process were determined by the speed of flow of the river waters across the surface of the floodplain, and by the Quant lty of radionucl Ides In exchangeable form In sol ls In contact with the floodplain waters. In the closed floodplain lakes in this zone equi I lbrium between the 90sr content in water and Its content In bed sediments formed over a period of several months after the accident and has not changed significantly since, having stabilized at 8-10" of its content In the bed ground. Data on typical contamination levels of water bodies in the zone near the Chernobyl NPP are given in Table 4. The findings showing how strontium Is distributed among the various components of the water bodies are close to those observed for lakes in the area contaminated by the Kyshtym accident. Thus, flushing of these numerous floodplain water bodies In the high water period may also have a considerable effect on the level of general removal of radioactivity Into the river when the floodplain territory Is flooded.
In the years after the accident when no more than 10% of the floodplain area within the near zone was submerged, annual 90sr washout from Its surface amounted to 0.5-2% of its content in the given territory, while the contribution of runoff from Its surface to contamination of the river (at the mouth) amounted to 30-40% of a 11 the other sources of 90sr uptake into the Pripyat River. The integral coefficient of radlonucl ide runoff is the Integral indicator of the radlonucl ide washout processes due to al I water runoff processes - from catchment areas, via flooding of floodplains and via filtration. For the Pripyat this coefficient was used to work out how the annual river removal of radlocaesium and radiostrontlum In the Chernobyl reach related to the amount of such radlonucl ides in the catchment area and to the strata of annual water runoff from the surface of the catchment area. The same was done for the mouth of the Dnieper River where it flows Into the Kiev Reservoir. The figures obtained for the basins of the Pripyat and Dnieper Rivers ranged from 2 to 5 x 10⁻⁴ I/mm, which is not significantly different from the experimental sprinkling findings, and we therefore conclude that the standardized runoff coefficients did not undergo major changes in the years fol lowing the accident.
3. RADIONUCLIDE RUNOFF AND THE RADIATION SITUATION IN DNIEPER BASIN WATER BODIES BETWEEN 1986 AND 1990
The most Important agents in the formation of radionuclide runoff from the contaminated regions were the climatic and landscape-geochemical factors involved In the format ion of water runoff In the catchment areas of rivers flowing across their surface. Figure 3 chronologically charts the changes in the flow of radioactivity in the Prlpyat waters on the basis of 10-day average values from 1986 to 1989. Within the I imits of the typical hydrological seasons, Fig. 3 reveals a close connection between type of river flow formation in contaminated areas and the content of radioactive substances In the Pripyat and Dnieper

- 538 -
waters. Moreover, the removal of 137cs by the river considerably depended on the content of suspended sediment flowing In the water and on the Intensity of erosional washout of fine soil particles from the surface of the catchment areas, whereas transport of river load had no significant bearing on the removal of 90sr. Figure 4 shows an example of the observed ratio between 137cs removal on suspended toad and in solution for the period following the accident (d<1µm). It is evident that the proportion of 137cs contained in sediment flow may vary between 20 and 80% depending on the roiling conditions, catchment area erosion and the transportatlonal ability of currents.
In 1987-1989 between 30 and 40% of the annual amount of caesium removed by the r Iver was on suspended toad. At the same time, whereas the l37cs activity of the suspensions In the Prtpyat River was 103-102 Sq/year at the end of 1986, by 1990 it had fat len to 101-100 Sq/year. This effect Is probably related prtmarl ty to the marked decrease in erosional removal of contaminated soi Is Into rivers after discontinuation of ploughing and sodding of contaminated catchment areas In the Potesye (Pripyat Marshes), and to the gradual downward displacement of the most contaminated soil layer in the catchment areas as a result of vertical migration processes. In addition, the specific activity of river load was - depending on the point at which it entered the river current and on its material composition and size - sti II 10, Sq/year or more in individual samples even four years after the accident.
The distribution of the specific activity of certain isotopes fol towing their sorption from water to load and sol t particles of various dimensions in the Chernobyl NPP zone is shown in Fig. 5. It fol lows from this that, given the river channel conditions obtaining, the bulk of radionucl ides cannot settle on suspended material, and that channel load (usually sands in the case of flatland rivers) wi I I remain relatively clean, as a result of the fine fraction being flushed by the current and it having lower sorption properties than muddy and clayey river load.
Channe I changes gradua II y caused f I ne I y dispersed aeroso Is which had settled onto river beds to be removed into the reservoir, and part of the heavy fraction of the fuel component in the radioactive fallout also became buried under a layer of sand as a result of ridge-type toad movement. Another trend observed was a decrease in the overal I amount of radionucl ides such as 134,137cs, 144ce, 290,240pu removed by the rivers into Kiev Reservoir via toad in river flow. A similar effect in decreasing the contamination level of the Pripyat and Dnieper waters (although less significant) was also observed in liquid-phase migration of these radionuct ides, including radiostront ium. However, whereas in the years since the accident over 70% of the 137cs In the Prlpyat has come from the region above the Chernobyl NPP 30-km zone, the contribution of the near zone to 90sr contamination of the river In recent years (1988-1989) has been 60% and more. This was mainly due to the removal of radionuclldes from floodplain areas in the near zone and by contaminated waters filtrating from dammed river creeks near the town of Pr lpyat and from the cool Ing pond of the Chernobyl NPP. The relative increase in the contribution to contamination of the Pripyat from contaminated landscapes in the Chernobyl NPP zone is due primarily to continuing physico-chemicat changes in the fuel component of the fallout and to the breakdown of the "hot" particles, both mechanically and by the lixiviation of radionuct ides.

(J} 11
.3 ,!,,
10
00
JOO
-I
600
400
dOO
A pC
i /l
I/!. 0
100
80
60
lfO
c20
1
Ch
ron
olo
gic
al
rep
rese
nta
tio
n
of
wat
er
dis
ch
arg
e
in
the
Pri
py
at
Riv
er
and
the
con
ten
t o
f cert
ain
ra
dio
nu
cl i
des
in
wat
er
nea
r th
e to
wn
of
Ch
ern
ob
yl
,. 1
"37c
/s
{
'3'C
s
(fro
m o
bse
rvati
on
s)
/
··I'····
~ .. -··
I
I .f I 6
I ;,
I a I 9
110
I 11
11.2
I I
I .2 I .
, I -<
' I . ,-
if Lf
.t 1 /L
g I
.1
1986
19
8?
wat
er
dis
char
ge
2 -
137c
s (i
n so
luti
on
)
Fig
ure
3
IU88
3 -
137c
s (i
n
susp
end
ed
load
) 4
-9
0sr
8
1989
l11 w "' ..
10
I(
/J
,

- 540 -
Table 4
Certain typical levels of radioactive contamination of surface waters in water bodies and rivers in the 30-km zone
around the Chernobyl NPP in 1989-1990 (pCi/1).
study site 137cs 90sr
Prlpyat River, Benevka Chernoby I Kiev Reservoir Uzh River, Chernobyl Sakhan River, Novoshepe I I chi Chernobyl NPP coo I i ng pond Prlpyat creek Standing floodplain water bodies in the near zone ( left bank) ozero Glubokoye ozero Vershina Goluboy ruchey Murovka channel Polder waters Clay pits
(lake) ( I ake)
Lake, Buda-Varovichi
water
2-10 5-20 5-15 5-20
10-30
100-250 80-400
(1-3)10, 800-1 200 200-300 150-300 20-50 120-350 10-30
suspension
1-6 2-15 2-5 5-10
5-20
40-60 25-100
100-200 100-140
10-30 10-40 5-30
30-60 2-8
water
5-20 15-36 10-15 20-30
60-80
250-600 (3-4)10,
(1-10)10, (6-10)10, (6-8)10, (2-4)10, 40-130
(1-3)10, 200-350
settlement 10-20 2-5 200-250 Lake, Lubyanka settlement 10-20 2-5 200-250
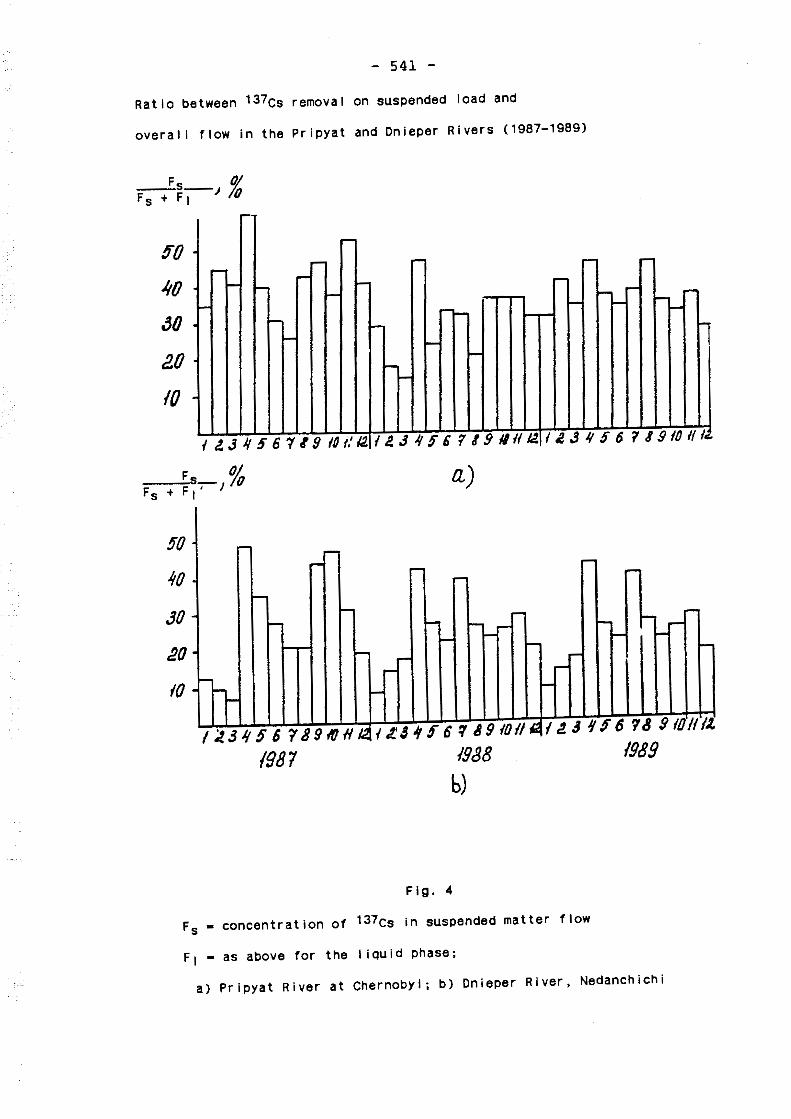
- 541 -
Ratio between 137cs removal on suspended load and
overal I flow in the Pripyat and Dnieper Rivers (1987-1989)
Fs % Fs+F-1-J 'O
ffO
it(}
JO .
/!.O
10 ·
§0
ltO
JO
,20
{0
.
.
.
-· -
-
-
.... .... L...
--
-
--- -....
---
- --
.... - .... .... .... ....
a)
-- -
-.... .... -'-.... .... - --- --....
~ --
,....
I,- ....
-
- --..- ....
tJ..51/56 789,'f/H~ I J: ~ if !' 6 !/ ~ 9 {011, I .P. 4 1/ § 8 7& $ 10/IIJ.
1988
b)
Fig. 4
Fs - concentration of 137cs In suspended matter flow
F1 • as above for the I iquid phase;
1989
a) Pripyat River at Chernobyl; b) Dnieper River, Nedanchichi

- 542 -
The reservoirs of the Dnieper cascade are - and will remain - the main receptacles for the contaminated water present In the basin. Given significant dilution In these areas and in other running water courses, the radioactive contamination level of the water is tending to fall. The typical trends over time in different geographical areas are shown in Fig. 6 (on the basis of data from in-situ observations).
The main processes Involved here in natural cleansing of the water are sedimentational removal of the radlonuclldes of caesium and cerium etc. into the bed sediments and sediment accumulation. Typical examples of this process are given In Figure 7, which shows various forms of vertical radlonucl Ide distr ibutlon in reservoir bed sediments under different roiling conditions and sedimentation rates. The mean rate of sediment accumulation as a result of r Iver load, bank erosion and Internal water-body processes ranges from a fraction of a millimetre to ten ml I I imetres per annum for the various regions. Therefore, in certain parts of the Kiev Reservoir the worst contaminated layer Is already buried under the layer of sediment which has formed on the bed s i nee the ace i dent. It bonds I ess firm I y with the bed ground and I ts behaviour in water depends largely on the presence of calcium macroions. The fact that high levels of 90sr accumulation were observed in the valves of molluscs, in particular of Dreissenacea, proves that strontium, I Ike calcium, may transfer to carbonaceous insoluble forms. Thus, the exchange selectivity coefficient of the Sr-Ca pair - which indicates their relative abi I ity to participate In substitution reactions - Is close to (or even above) one.
Therefore, the reservoirs of the Dnieper Cascade are clearly undergoing natural water-cleansing processes as a result of adsorption and sedimentational burial of contaminated load and accident fallout by cleaner products of natural sediment accumulation. The main sources of sediment accumulation material settling on the bed of the reservoirs are allochthonous river load, the products of bank abrasion and those of bed erosion. Currently, more than 70% of the radioactive substances attached to the solid ground particles of the Dnieper cascade reservoirs are located in the Kiev Reservoir's bed sediments. A substantial spi I lover of radionucl ides into the lower reservoirs is observed only in storms and transitory river flow during high water; in the case of 137cs this can be as high as 50% of the flow into the reservoir with the finest load particles. When this happens, up to 80% of the mass of sol id river load entering with the Inflow precipitates out in the reservoir's headwaters.
Between 1986 and 1989 the overal I discharge of soluble and suspended forms of 137cs In the waters flowing Into Kiev Reservoir from the Pripyat and Dnieper Rivers and other small affluents amounted to some 4 000 Ci. The discharge of 90sr in the same period amounted to approximately 2 500 Ci.
The amount of caesium which moved across the Dnieper cascade Into the Black Sea between 1987 and 1989 accounted for no more than 20% of the caesium flowing into Kiev Reservoir, while the corresponding figure for 90sr was over 70%. This points to the considerable role played by the "sorptive capacity" of the bed sediments and ground of reservoirs in cleansing contaminated water masses. This process is continuing and in the coming years the tendency for radionucl ides to accumulate in reservoirs will probably continue (Figure 6). In 1989-1990 the radiocaesium contamination level of the reservoir waters lay between 10-12 and 10-13 Ci/I, which is similar to the background levels during the global fallout period. The value for 90sr was slightly

- 543 -
higher at 5-10 pCl/1 In 1990. During 1990, 90sr content - measured from beginning to end of the cascade - var led on average from 20-30 pCl/1 in the Pripyat River mouth to 1-5 pCi/1 In the lower reservoirs.
From now on the water contamination levels In the reservoirs wi 11 depend largely on the development of the natural processes governing the migration of radionucl ides. They wi 11 be determined a) by the stabi I ity of the processes of internal water-body localization of radioactive substances in the various bed sediment components and by the rate Of Inter-phase transfer of non-exchangeable forms of radionuclldes Into water, and bl by the amount of additional radionuclldes entering the water from contaminated catchment areas. The latter will depend, in turn, on the effectiveness of the water protection measures being carried out in the Chernobyl NPP's zone of inf I uence, wh i I e the effect I veness of any p I anned water protect ion measures w i I I great I y depend on the ab i Ii ty to forecast correct I y the aftereffects of their large-scale introduction Into natural systems.
Forecasting the prevailing radiation conditions in water bodies in the zones of influence of Chernobyl contamination was founded primarily on a system of basic data on the scale and forms of radioactive contamination in the affected areas: data from analysing the processes involved In formation of water runoff and washout of radioactive substances from catchment areas In the I iquid and solid phases; analysis of the hydrological conditions governing flow in rivers and of the exchange of water in the Dnieper Cascade reservoirs; data on the most important elements involved in natural cleansing of the water bodies, on the I ithology and geochemistry of the ground and bed sediments in the water bodies in the zone of migration of radioactive substances; and a set of physico-mathematical models for describing their migration processes.
The very first rough forecasts were prepared as early as May 1986. They were based on approximations of radionuclide solubility, the work done to determine washout parameters fol lowing the Kyshtym accident and hydrological forecasts of the spring high-water flow in the Pripyat and Dnieper Rivers. Even at that early juncture it was estimated that the radionuclide content levels in river waters at the Dnieper's main water intake points would not exceed the maximum permissible levels 12 After that, approximate forecasts were needed covering pluvial washout of radionuclides from contaminated catchment areas, levels of secondary contamination of rivers, dispersion of radioactive substances in reservoirs, etc.
To this end, a series of physlco-mathematical models relating to the transport of radionuclides in various water systems was developed for the catchment area, rivers and reservoirs.a, 12, 13 Comparing the forecasts made of the radiation situation in rivers in the accident's zone of influence with the findings of In-situ monitoring of the state of the water bodies showed that the forecast data had quite a high degree of accuracy. This was achieved through a multi-facetted approach In organizing the work, involving closely coordinated studies to develop mathematical models of migrat Ion, planning of in-situ and laboratory experiments and devising a system for collect Ing data for al I the major contaminated water bodies in the Dnieper River basin. The main forecasting principles, the basic mathematical equations used in the migration models, and the experience gained from their use and parameterization in practical work after the Chernobyl accident have already been described in sufficient detail in 8, 12, 13, to which the authors of this paper contributed.

- 544 -
Distribution of the specific content of radionuclides in load
particles of various dimensions In the Pripyat River
% I/(}
JO
t!!.O
10
% 40
.!O
£0
10
.
.
.
.
a
I.
I I
b)
I .Z J 1/ ff 6 ':/ /J. d,MM
f- > 0. 2.5/lfM 2.- O.P.a - O. I J- O. I - 0.05' J/_ O.Of-0.0I
5- 0.0{ - 0.005' 6- 0.005' - 0.001 'l-<0,001
Fig. 5.

- 545 -
Radioactive contamination of Dnieper reservoirs fol lowing the Chernobyl accident
131cs 10-12 Ci/I (water) , 90sr 10-12 Ci/l (water) ,
~o
10
0
1 .
2. 3. 4. 5. 6.
O lfM6(1X) • /g87(1X) ... 1988( IX) t. l98!J(IX)
\ ..,. ~ l
I c2
<1..)
Mouth of the Pripyat and Dnieper rivers Kiev reservoir Kanev reservoir Kremenchug reservoir Dneprodzerzhinsk reservoir Kakhovka reservoir
.JO
~ ~ 198B (v1)
~o ~,t.
A t 989 (v1) 0 1990 (VI)
~'~ ot. ~
10 'i 6 0 ' 'b,e -.t..... ~a-r.-o~
0 ""' -8-0-:0 I c2 3 J/ 3 5
\,)
Figure 6
a, bl Distribution of 137cs and 90sr in the reservoirs of the Dnieper Cascade
c) Mean bed contamination d) Overall content of 137cs
in bed sediments
1

- 546 -
Typical vertical distribution of 137cs in bed sediments of the Kiev Reservoir (1989)
Content of 137cs in relative units
T h i c le n e s s
0
,E,O
4.0
6.0
&.o
f ZcH
a y e r 4.0
6.0
a.o Z CM
t!!.O
1/.0 6.0
&O
ZcM
{ 2. J I .e .J 4
a.)
c)
e)
Figure 7
!,)
d)
f)
a,b - areas of the bed with no significant sediment accumulation
c contaminated areas of the bed characterized by storm roi I ing processes
d areas with typical seasonal sediment accumulation cycles
e,f - channel flow areas of the bed with ridge-type sand movement and good filtration properties

- 547 -
By way of conclusion, It should be pointed out that, when It came to deal Ing with the consequences of the accidental radioactive contamination of the flooded areas and water bodies, no-one In the world had had experience of working in such difficult natural watersoi I landscapes in conjunction with such a scale and variety of physico-chemlcal forms of radioactive contamination. The years that have elapsed since the accident have been very benign in terms of the amount of water In the rivers In the contaminated zone. This has largely conditioned our understanding of the actual natural processes involved In the self-cleansing of water systems. However, It also allowed us to study in more detail the processes governing - and the factors Involved In - the migration of Chernobyl radionuclldes via the water pathway, and to gain experience In forecasting the long-term processes of secondary contamination of water bodies, and consequently to draw up active measures to counter radionuclide migration processes, to attempt to prevent radionucl ides from dispersing beyond the initial fallout areas and thereby devise optimum water protection measures to I imit the negative after-effects on the environment.
BIBLIOGRAPHY
1. Information on the Chernobyl accident prepared for the IAEA; Atomnaya Energiya, pp. 301-320.
and its consequences, vol. 61, issue 5, 1986,
2. Yu. A. lzrael et al.: Ecological consequences of the radioactive contamination of the environment in the zone of influence of the Chernobyl accident; Atomnaya Energiya, vol. 64, issue 1, 1989, pp. 28-40.
3. N. A. Loshchilov et al.: The particular radiation and physicochemical characteristics of radioactive fallout from the Chernobyl accident; Proceedings of the First Al I-Union Radiobiologlcal Congress, Pushchino, vol. 5, 1989, 1 203 pp.
4. S. M. Vakulovsky, o. v. Voytsekhovich, et al.: Radioactive contamination of water bodies in the area contaminated by the Chernobyl accident; Proceedings of the IAEA Symposium, Vienna, 16-20 October 1989, (in press).
5. Yu. A lzrael et al.: Radioactive contamination of the environment in the Chernobyl accident zone; Meteorologiya i Gldrologiya, 1987, No. 2, pp. 5-18.
6. V. 0. Glazunov: Study and mathematical modelling of the radioactive contamination of small rivers, taking as an example the zone of influence of the Chernobyl accident; author's abstract of the thesis he submitted for the postgraduate degree of "Kandldat" in physics and mathematics, Moscow, All-Union Scientific Research Institute on Atomic Power Stations, 1990.
7. V. A. Borzi lov, A. V. Konoplev, et al.: Experimental research on the washout of radionucl ides deposited on the soi I fol lowing the Chernobyl accident; Meteorologiya i Gidrologiya, No. 11, 1988, pp. 43-53.

- 548 -
8. Yu. s. Sedunov, V. A. Borzllov, A. v. Konoplev: Modelling and forecasting of secondary contamination of rivers in the Chernobyl accident zone with long-I ived radlonucl ides; collection entitled "Radioactive contamination of the environment in the Chernobyl accident zone", issue 3, Moscow, 1988, pp. 16-29.
9. A. V. Konoplev, v. A. Borzllov, et al.: Distribution of radionucl ides deposited in the "soi I-water" system fol lowing the Chernobyl accident; Meteorologlya I Gidrologiya, No. 12, 1988, pp. 63-74.
10. A. N. Bulgalcov, A. V. Konoplev, et al.: Dynamics of washout of long-1 lved radionucl Ides from the soi I by surface runoff in the Chernobyl NPP area, Moscow, Pochvovedenle, 1990, No. 4, pp. 47-53.
11. O. V. Voytselchovlch, V. v. Demchuic, G. V. Laptev: Analysis of the secondary effects of radioactive contamination of the Pripyat River fol lowing flooding of floodplain areas In the Chernobyl NPP near zone; pub I ication No. 240 of the Uicralnian Hydrometeorological Scientific Research Institute, 1990.
12. V. A. Borzilov, Yu. s. Sedunov, et al.: Physi~o-mathematical model I Ing of the washout of long-lived radionuclides from catchment areas in the 30-lcm zone around the Chernobyl NPP; Meteorologiya i Gldrologiya, No. 1, 1989, pp. 5-13.
13. V. A. Borzl lov, Yu. s. Sedunov, et al.: Forecasting secondary radioactive contamination of rivers in the 30-lcm zone around the Chernobyl NPP; Meteorologiya i Gidrologlya, No. 2, 1989, pp. 5-13.

- 549 -
Migration in the Pripyat and Dnieper River Basins of Caesium and Strontium
Radionuclides Accidentally Released from the Chernobyl
NPP
E.V. SENIN

- 550 -
The accident which occurred on 26 April 1966 at the IVth unit of the
Chernobyl nuclear power plant fol lowing a surge In radioactivity,
shattered the nuclear fuel into discrete particles varying considerably
in size - from a minimum of some tenths of a micron to a maximum of 100
microns. Contact between this dispersed fuel and the (water) coolant
caused a steam explosion and, in consequence, the process channels were
destroyed, the reactor breached and the dispersed fuel ejected Into the
atmosphere, a significant part of it fal I Ing In the basins of the
Prlpyat and Dnieper rivers. The material composition of the matrix of
most of these particles constituted oxides of uranium, while the
radionuclide composition matched the composition of the irradiated
fuel.
The radioactive fallout in the basins of the Pripyat and Dnieper
rivers, which consisted of solidified aerosol products from the molten
fuel, the coolant material, etc., and which radioactively contaminated
large and fairly distant territories in the nine days that fol lowed,
plays a lesser role In the 30-km zone as such, although in the
northwestern and northeastern parts of the evacuation zone its
contribution to overal I activity is highly significant.
In the soi Is of the 30-km zone more than 98% of the activity was
concentrated in the uppermost layer in the first few months after the
accident. In lower horizons (5-10 cm) activity decreased by several
orders of magnitude, almost logarithmically. The isotopic composition
was similar in each layer, testifying to vertical migration of
radionucl ides - in the form of very fine sol id radioactive particles -
through the soi I pores along with infiltrating moisture, I.e. by
leaching.
Contact between the discharged radioactive particles and the soil in
the first few weeks after fallout deposition led to the formation of
water-soluble forms of the radionucl ides, mainly through leaching. A
more active transfer of radionucl ides into soil solutions was observed
in soi Is contaminated with condensation-type precipitation in the
distant zone. The least mobile radlonuclides were in the fuel particles
of comparatively small size (50-100 microns) deposited in the near
zone.

- 551 -
Solid-phase radioactive fallout, commonly known as "hot particles",
thus formed the first barrier to the further spread of radionuclides in
the environment during the first three years following the Chernobyl
accident.
The migration of radionuclides in the 30-km zone is currently
proceeding both via "hot particles" and In water-soluble form.
The migration of radlonuclides via "hot particles" is governed by the
laws of gravitation, Just like the transport of any kind of material on
the earth's surface. The dynamics depend on a whole range of factors:
the morphology, size and density of the "hot particles", the morphology
of the surface of the land, the transport mechanism involved, the
climate, etc.
The migration of water-soluble forms of radionucl ides in the 30-km zone
depends on the chemical composition of the "hot particles", the rates
at which radionucl Ides are leached out of them, the mineralogical,
petrographic and geochemical characteristics of the soi Is, the specific
hydrological, hydrogeological and geological features of this area (the
composition of the rocks in the sedimentary mantle, their water
content, the structure of the crystal I ine substrate and the neotectonic
development of the area).
It is now becoming clear that in the 30-km zone the main vectors of
radlonucl ide migration in the Prlpyat and Dnieper basins are washout
and blowoff (i.e. water-borne and wind-borne transport mechanisms
respectively) from the entire contaminated catchment area into the
floodplain and channel of these rivers, followed by migration with the
current at the bottom of the channel into the Black Sea.
It is also clear that studies of strontlum-90 and caesium-137 migration
in the basins of these rivers are most important from the medico
biological and geochemical point of view. The present report Is devoted
to some findings from such studies.
In the initial months after the accident 1311 was the main source of
gamma activity in the surface waters, and we used it as a tracer to
monitor how the water masses moved through the reservoirs of the
Dnieper cascade.

Apart
90sr
from 1311,
and 134, 137cs
stages.
- 552 -
the radioactive isotopes
also played a substantial
106Ru,
role
95Nb,
in the
95zr,
early
The short half-life of 1311, plus the transfer of medium-lived
isotopes into sediment and their subsequent decay, meant that once
atmospheric radionucl Ide fallout directly onto the water surfaces had
ceased (by the summer of 1986), the nature of the subsequent
contamination of the water systems depends on the various mass transfer
mechanisms.
To study the nature and dynamics of these processes a network of fixed
observation points was set up in the Kiev Reservoir's main tributaries,
near the water intakes and in the upper reaches of al I the Dnieper
Cascade reservoirs. Monitoring was also carried out from floating
stations.
The overal I beta activity of the water was measured daily, while the
radionucl Ide composition of the waters and their 90sr content were
determined periodically. The radioactive contamination of the
river/reservoir bed sediments and catchment areas was also studied.
It was not until late 1986 that this monitoring system was developed in
ful I.
The radionuclide transfer processes In the water differ considerably
from one radionuclide to another. Removal of cerium-144 and plutonium
was observed only in the sol id phase, via suspended and bed load on
which these radionucl ides had sett led. Particles suspended in water
play the essential role in caesium-134 and caesium-137 transfer,
whereas migration of strontium-90 mainly involves solutions (90-95%)
and particles 0.001 mm in size (with suspensions and the transport of
bed sediment and load playing no role here).
Fig. 1 shows the distribution of the specific radioactivity of Cs and
Sr on their sorption from water to soi I and load particles in the
Chernobyl NPP area. It follows from this that, given the river channel
conditions obtaining, most of the radionuclides attached to the
suspensions are unable to settle, and the fine fraction of the sandy

- 553 -
channel sediment wil I remain relatively clean as a result of washing by
the flow.
Fig. 2 shows the portions of 137cs removed on suspended particles and
in solution. It can be seen that caesium-137 sediment discharge varies
between 10% and 60% depending on turbidity conditions and the
transporting ability of currents. It should also be remembered that the
activity of these suspensions fell by a factor of 25 from late 1986 to
1989.
In Fig. 3 the changing pattern of radioactivity in the water flow of
the River Pripyat at the town of Chernobyl can be seen from the mean
ten-day values for the 1986-1989 period. This diagram clearly shows
that the inter-relationship between the nature of river flow, the
extent of flooding and the amount of radioactive substances in the
water are quite complex. In 1986, when there was not much precipitation
and the water flow rate was correspondingly low, the fa! I in
radionuclide concentrations was due primarily to the effects of
dilution and transfer of radionuclides into bed sediments. The
insufficient number of observations in 1986 prevents us from
determining the process in detai I, and reflects its general character
only.
From 1987 onwards observations were carried out systematical IY, and
more detailed information was obtained. The lowest concentrations of
radionucl ides in the river were noted during periods of river freeze
over and freezing of soi Is in the catchment areas, when radionuclides
no longer entered the river with surface runoff (this is obvious in
January/February of 1987 and 1988).
This Fig. shows, firstly, that there Is no clear-cut correlation
between water flow rate peaks and radionucl Ide content peaks; and
secondly, that the different temporal spread and nature of the Srand Cs
behaviour curves reflect the different ways they enter the river and
the different spatial spread of the radioactive contamination sources.
In 1987 radionuclide runoff was primarily due to washout processes in
the Byelorussian Polesye (Byelorussian part of the Pripyat Marshes).
The specific way in which the river removed radioactivity in 1988 is
I inked to a decrease in the proportion of radlonucl Ide washout from the
- 554 -
catchment areas In the distant zone during the high-water period, and a
simultaneous increase In river contamination from the (worst
contaminated) Chernobyl NPP near zone.
The greatest contamfnat ion of the waters at the town of Chernoby I in
1988 was observed as flooding abated and when high-water ended.
A major role In determining the r Iver's radiation regime in 1988 was
also played by the summer rain floods, which produced a flow volume
greater than that of the spring high-water.
The simultaneous occurrence of peaks In the river's strontlum-90
content and its water content was accompanied by a significant dilution
of runoff waters, and was connected with the specific features of
surface runoff from the catchment areas in the distant contamination
zone, as well as with the flushing of the channels in the floodplain
landscape, while the surface of the floodplain in the Chernobyl NPP
near zone remained dry and unflooded. The autumn/winter peak in
radioactivity was caused solely by pluvial washout and the shedding of
contaminated waters accumulated during the spring and summer in the
Zimovishensky polder system.
The relatively stable and low levels of radioactive contamination of
the River Pripyat waters in 1989 may be explained by the very early
arrival of extreme high-water (in February) when air temperatures were
low, by surface water runoff (with relatively low radioactive
contamination levels) formed in the River Pripyat's upper catchment
areas, by the radionucl Ides continuing to be chemically fixed in the
catchment area soils, and by the absence, more or less, of snow and of
water in the catchment areas adjacent to the Chernobyl NPP.
The beginning of 1990 was also a time of low moisture levels, while the
River Pripyat high-water peak occurred in the second half of January
(the earliest high-water recorded during the whole monitoring period).
Similar radioactivity runoff processes are also found in the River
Dnieper, but with the difference that here a large role in radionuclide
migration is played by washout from the catchment area, rather than by
removal from the floodplain. This leads to corresponding differences in
the relationships between water runoff and removal of caesium and
strontium radionucl ices during the year.

- SSS -
Particular attention should be paid to the 90sr peaks in December
1987 and June, August and December 1988. An analysis of the mean 90sr
content figures and of the water flow rate in reaches upstream of the
Chernobyl NPP (Benevka) and downstream (Chernobyl) produces a figure of
140 curies per annum. This Quantity of radioactive strontium was
removed from the near zone in 1989, while in 1987-88 the Quantity was
substantially greater. The 137cs figures In 1989 for the same reaches
are practically the same, i.e. the near zone does not have such a
marked effect on the Ingress of Cs as it does for Sr.
The highly active source of this 90sr turned out to be the waters of
the many sluggish and stagnant bayous, lakes and streams of the
floodplain on the left and right banks in the near zone.
The shift in the phase of occurrence of peak water content and peak
90sr activity is related to the rise of contaminated waters on the
floodplain during high-water and their reflux from the side of the
river, since maximum activity occurs later than maximum water content.
A study of the distribution of the 90sr isotope in the various bodies
of water in this region has shown that the mean annual concentrations
in them vary from BO to 9 000 pCi/1.
These figures show that the category "b" permissible concentration for
90sr - 400 pCi/1 - is substantially exceeded in some places in the
water bodies of the near zone. Determining the concentration and mean
annual flow rates for a number of water bodies communicating directly
with the River Pripyat, and for filtration from the cooling pond,
al lowed us to ascertain the sources of some 70% of the 90sr entering
the River Pripyat, with the remaining 30% coming from sluggish and
stagnant bayous and lakes directly exchanging water with the River
Pripyat during wind setup and permanently connected with It via
f i I trat Ion.
The near zone's overal I contr lbution to 90sr contamination of the
Kiev Reservoir amounted to approximately 60% in 1988 and to some 40% in
1989. This justifies the special attention devoted to this sector in
the plan to protect the Dnieper Cascade reservoirs from radioact Ive
contamination.

- 556 -
The ingress of 90sr and 137cs radioactivity into the Kiev Reservoir
Is shown in Fig. 4. A substantial contribution to the activity of the
Dnieper river waters Is made by the River Sozh, which carries 137cs
removed from the Bryansk-Byelorussian patch Of radioactive
contamination. The River Sozh's share in River Dnieper removal falls
with time - from 80% in 1987 to 35% in 1989 - reflecting the way Cs is
fixed in its deposition areas and transport path.
The figures given reflect the dynamics of the process, since
according to other estimates - In 1986-1989 total removal by the Rivers
Pripyat and Dnieper was 4 000 Ci of 137cs and 1 200 Ci of 90sr.
The Kiev Reservoir Is the first in the Dnieper Cascade's chain of
reservoirs and also the main accumulator of radioactive isotopes. As
much as 80% of the mass of solid material entering from the Dnieper and
Prlpyat is deposited in its headwaters. The natural cleansing processes
occurring in the water of the reservoirs mainly involve transfer to
sediment of the radionuclides of caesium, cerium, etc. Sediment
accumulation does not play much of a role in the case of strontium-90
( it binds less firmly to bottom soi Is), but calcium content
considerably influences Its behaviour. High levels of strontlum-90
accumulation have been noted in the shel Is of river molluscs,
especially in the species Dreissenacea.
The radionuclides deposited on the bed, especial IY In the early years,
are now being covered over by cleaner sediment. At the present time
more than 70% of the radioactive substances bound up with the soils of
the Dnieper Cascade are located in the bed sediment of the Kiev
Reservoir. Considerable shedding of radionuclides into the lower
reservoirs is observed mainly during storms and high-water, when
caesium-137, which Is carried along with the most finely dispersed
particles, may account for up to 50% of the radionuclide influx into
the reservoir.
The slide shows diagrams relating to caesium and strontium content in
the Dnieper Cascade water bodies.
As the data show, when substantial dilution occurs the level of
radioactive contamination falls. By 1989 this level was 10-12 to
10-13 Ci/I for caesium-137, which is close to the background levels

- 557 -
obtaining prior to the accident. The level for strontium-SO is somewhat
higher, i.e. 10-11 to 10-12 Ci/I.
Of the caesium which entered Kiev Reservoir from 1987 to 1989, 20% or
less reached the Black Sea, while the corresponding figure for
strontium-SO was over 70%.
In the first few months after the accident, surface water contamination
was highly heterogeneous, with maximum contamination levels of 14 pCi/1
of caeslum-137 and 3.3 pCl/1 of strontium-SO. By 1989 these levels had
come down (as a result of horizontal and vertical Intermixing) - more
or less to the pre-accident level for strontium-SO, while for caesium-
137 they stabi I ized at 1.5 pCi/1 from 1987 onwards, t .e. some three
times higher than before the accident.
The amounts of caesium-137 and strontium-SO in the Black Sea
(determined by depth distribution) are approximately 85 000 Ci and
47 500 Ci respectively. Of these, 45 000 Ci of caesium and 7 500 Ci of
strontium entered the sea after the Chernoby I ace i dent.

- 558 -

- 559 -
Direct Continuous Multichannel y -Spectrometric
Measurements- One of the Main Methods for Control and
Study of Radioactive Environmental Pollution
L.M. KHITROV, O.V. RUMIANTSEV
Vemadsky Institute of Geochemistry and Analytical Chemistry USSR Academy of Sciences, Moscow, USSR

- 560 -
In Chernobyl along with usual methods of environment radiation control there were used methods and equipment of direct continuous multichannel measurements. The necessary equipment was i nsta I led both on permanent observation stations (river Prlpyat, Chernobyl, river Dnepr, Kiev) and on mob I le units (he! I copters, scientific river-boats, automobl les). Together with continuous control of radioactive situation and its estimation in time and space this equipment enabled to carry out the fol lowing: - determination of time-spatial structure of radioactive pollution in
stationary points and on space (mapping); - selection of representative samples for subsequent radionuclide
analysis; - direct data Input Into the computer, data storage and data base
er eat Ion.
The results and conclusions drawn are important not only for the situation on Chernobyl atomic station - they may and should be used for a continuous radioactive monitoring of the environment. Though the method and Its realization remain to be modernized and unified.
Indeed, according to /1/ by the end of 1987 197 naclear power plants were registered in the world with the total electric power of 120 GW. The number of nuclear reactors used for scientific research purposes is also increasing and In 1990 wl II reach 61, out of which 40 are situated in the developing countries /2/.
As the late academician v.v. Legasov /2,3/ noted, all safety measures C increasing the structure and cost of the equipment or the process) only decrease the risk of an accident, diminish the possibility of catastrophic consequences of the hard-ware failure or personnel mistakes to very smal I quantities but still this possibi llty is never nil. The zero risk is possible only In systems without stored energy. In a number of papers (for example in /4/) the probability of serious accidents on nuclear power plants is estimated with the account of their global increase (fig. 1). The estimation shows that for 500 active nuc I ear power p I ant ace i dents are due every 4 years. WI th a 11 possible optimistic amendments to the schedule the picture is still quite tragic. Thus, the necessity of employment of continuous radioactive environment monitoring is stipulated by: - firstly, the posslbi I lty of accidents on NPP (nuclear power plants)
with al I the consequences; - secondly, there Is always a possibi I ity of damage of nuclear power
plants and other nuclear Industry enterprises owing to other circumstances (local non-nuclear wars, natural disasters) when the great amount of radionucl Ides is released In the biospere;
- thirdly, the development of "transport" nuclear power engineering (nuclear power ships), employment of autonomous nuclear power sources, the presence of a large amount of nuclear miss Iles also enlarges the probability of accidental situations, the pollution of the environment;
- Forthly. Even the non-fai I ing (safe, normal) work of NPP causes the release of art iflcial radlonucl Ides In the environment. The employment of thermal power stations, the amount of mining and construction works lead to increase and re-distribution of the natural radionucl ides in the environment. Global radioactive fallout after nuclear weapons tests (though minimal) still exists;

- 561 -
- Fifthly. Wide utilization of radioactive isotopes (sources) In the different fields of economy, science and technology stipulates the possibl I lty of situations (for example, in Braz I I in 1987) even locally but, nevertheless, strongly affecting the man and biosphere.
Naturally, scale and character of the factors enumerated above are quite different - from the global transfer of radioactive contamination to local effect. The convnon feature Is the impossibility to forecast such accidents and disasters. On the other hand, determination of their consequences, especially on first stages In case of "medium" and "small" contamination, demands distinct criteria of definition of "fresh-spread" radioactivity from eventual fluctuation of natural radioactive background.
So, In the sixth case, direct continuous methods of radioactive monitoring of the environment are necessary for Its understanding, for creation of physical models of the possible radlonucl ide migration and distribution.
this, In the long run, enables to present an objective information for evaluation of the amount of inner and outer irradiation of the population, for the safety of which the International Commission on Radiological Protection (ICRP) recommends /5/ - "the level of the irradiation doses should be as low as can be obtained only with the account of economic and social factors".
Some Features of Direct Continuous -Spectrometry Measurements In direct continuous measurements "In situ" one can use registration of radionucildes, gamma-lrradiators because - and -irradiations have very smal I penetrating abll lty. This gives considerable mistakes caused by screening by inhomogeneous surroundings (soil) or hermetic capsule of the seasing element (data unit) pick-up in the water.
The quantum character of the gamma-Irradiation enables to take gammaspectrum of the surrounding, I.e. measure its radionuclide composition. Moreover, the major part of radionuclides important for their role in pollution and biological effect are gamma-irradiators. As to irradiator strontlum-90 and -irradlators of plutonium type their concentration may be determined in separate samples as well as In correlation with radionuclide gamma-irradiators If the initial ratio is known and the time passed from the moment of pollution is short. (The smal I period of time excludes radiogeochemical differentiation due to migration).
Registration of repeated scattering of gamma-quantums of radionuclldes in stretched and volume surroundings /6/ seems also important In gammaspectrometry "In situ".
In al I the cases we investigate irradiating-absorbing surroundings where Identification and quantitative evaluations of gamma-lrradiators are made by reglstratlng peaks of complete photoabsorption of Initial gamma-quantums. Scattering Increases Kompton's part of gamma-spectrum of each radionuclide and deteriorates the ratio "effect - background" for gamma-lrradiators which energy is less than the boundary energy of Kompton's part gamma-spectrum of any radlonucl ide. This leads to deformation of gamma-spectra and a certain difficulty in their interpretation.
Such deformation of the spectrum homogeneous irradiating-absorbing
in measurements "In situ" taken in surroundings (water) was shown

- 562 -
in /7/. These results for monoenergy source zinc-65 are given In Fig. 2. Fig. 3 gives deformation of gamma-spectrum when passing from point source Sodlum-24 to bigger volumes with the same specific activity. One may see how Increases the Kompton's part of the spectrum and decreases the relative area of photopeaks 1,38 and 2,76 Mev for the point, 3 litre-, 300 litre- and 104-1 itre volume sources.
For plane-extended sources (sol I) In measurements of "fresh" fallouts when radlonucl Ides do not yet migrate vert lcal ly the gamma-spectrum deformation will be caused by dispersion in the air. In both cases the necessary corrections are made either by theoretical calculation or when the graduated analysis of radionuclide composition of water (If It changes) Is made or on testing areas where the radionucl Ide composition is determined by Independent methods.
Dlsperclng expediency efficiency
properties of the medium considerably diminish the of semi-conductor detectors. Moreover, they have lesser
and their application (especially In water) is difficult.
When measuring low-level contamination (for example< 10-11 Ci/I for water) with the aim of constant and continuous control it Is reasonable to carry out measurements in wide energy ranges (200-500 Kev) in order to raise threshold sensitivity. More selective data can be then received by samples selection or taking down the whole gamma-spectrum (this done if some anomalies are registered In the course of measurements). The deformation of spectrum In the dispersing medium should also be taken into account when the gamma-field intensity is evaluated in dose level.
Practical realization of the method of direct continuous measurements of gamma-activity In situ Single detectors
may
Cable transmission Transmission of al I the data Changes in several ranges of energy or gamma-spectrometry Automated measurements (operator)
vary according to aims set: "field" of detectors (> telemetry level saturation signal
changes in "integral"
automatic measurements.
Measurements in stable (stationary) points:
10)
radioactive level control in rivers, testing areas, major waterworks, waste (reject) works of APS.
Measurements on mobile vehicles: river-boats and ships - square (areal) gamma-shooting of water surface, control of reject and emergency situations, determination of "mixing zones" of water with different activity, determination of dependence on natural phenomena (i.e. high waters, etc.); aviation carriers - active mapping; surface-carriers - correction and detal lzation of aerogamma-shootlng data, mapping of routs of moving, specification of radionuclide composition of revealed radioactive anomalies, measurements in "semistationary" points.
Practically al I above operations have been and are being carried out in the course of restoration at Chernobyl APP.

- 563 -
Appl icatlon of the Method and Facll ities Used in 1986-88. Measurements In Stationary Points. Direct continuous measurements have begun In May 1986 In the river Pripyat (Chernobyl region) and in river Dnieper (Kiev region). Two separate points, spaced more than 100 km apart, could secure to control the radioactive "cloud" moving towards Kiev should such had taken place. Detection blocks from sodium iodine crystals measuring 80 x 80 mm and 80 x 400 mm were installed on buoys. The buoys were placed 50-100 m from the shore at the depth of 2 m from the water surface and not less than 4 m from the bottom of the r Iver. the spectrometry Information and the power supply to the detection blocks (-30 D) were passed by the same wire. The results were registered on auto-recording display and printer having regard to astronomic time count at expositions 60 sec (1986-1987), 600 sec - as from summer 1987. The value of Immeasurable radioactivity (beyond control) considering actual debit of r. Pripyat (400 m3/sec) and concrete concentrations of radlonuclides in water could not exceed 5.10-3 Ci/I (during exposure).
Regular gamma-spectrometric and radiochemical analysis of water samples enabled to determine the radionuclide composition (Fig. 4) and, if necessary, make corrections in detector readings.
The results of continuous measurements were presented in units Ci/I of the total gamma-activity.
Al I time of continuous (24 hour) run of the units made 13000 hours.
Generalized results of the measurements are presented in Fig. 5 where the fall of the total radioactivity level with time can be seen. For the whole observation period (1986-1988) radioactivity level never exceeded the weekly mean value more than 20-30%. From May 1986 (when total radioactivity level In Pripyat river was 2.10-9 Cl/I /8/l till August 1987 it fell 40-50 times. Gamma-spectrometry and radloachemical analysis showed considerable change in radionuclide composition of water: in 1987 Caesium radionucl ides constituted the major part while in Summer 1986 a lot of fission fragment radionuclides were registered (Fig. 4).
The direct method permitted to carry out measurements under Ice cover in Winter 1987, when considerable decrease of gamma-activity took place as well as to perform control during the flood. Consequently, continuous measurements In r. Prlpyat and r. Dnieper made It possible to secure efficient control over the level of radioactivity In river waters In two po I nts. The received resu I ts were taken Into consideration also In the similar operations of Goskomhydromet of the USSR and other organizations on sampling water for analyses. Besides, the distribution of radioactivity between these two points was registered by direct continuous methods on a special boat (see below).
Measurements on Mobile Vehicles. Boat, research ship, helicopter and specially equipped car were used as mobile vehicles. On the river-boat "Academician Vernadsky" two detector blocks (Sodium crystals 80 x 80 mm or 80 x 400 mm large) were installed: one on the board of the vessel with the help of special suspernder-device placed at the depth of 1,5 m serving for water radioactivity control and another one was placed on the bow of the boat for radioactivity control of the fallout In the region. The equipment of direct measurements were a computer and a mu It i channe I amp 11 tude ana I yzer. The research equipment a I so included devices for radiochemical analysis of large amount of water (100-

- 564 -
150 I). The boat moved on the tack of 15 km/hr. The time of exposition was 20 or 60 sek, thus making possible Integration of the results from regions 80 or 250 m long. Gamma-spectrography, water sampling, sediments and suspension were taken regularly.
During 1986-1988 eight area gamma-shootings of Kiev reservoir were performed as well as three wide-scale shootings of r. Dnieper cascades (from river mouth to the Black sea), shooting of the navigable part of the Prlpyat river and up-river parts of r. Dnieper. The results are given in Fig. 6 (distribution of gamma-activity in the Kiev reservoir) and In Fig. 7 (gamma-shooting of Dnieper cascades). As It is seen, the radioactivity level fal I was quite considerable. Thus, In the Kiev reservoir from June 1986 ti II May 1987 the radioactivity level of water in the estuary of r. Pr lpyat decreased 15-fold and 20-fold near the weir. continual measurements performed In the zone where waters of r. Pripyat mix with those of the Kiev reservoir showed a specific microstructure of flows with high radioactivity level of no more than 100-200 m In width (see Fig. 8). This effect is of considerable interest for hydrology. Moreover, it i I lustrates the possibi I lty to select non-representative samples when selection Is "bl Ind".
On the ship "Academician Boris Petrov" /9/ there were used two detection blocks, one placed on sub-keel device (5 m-depth), second was towed 70 m under water surface. On drifting oceanographic stations deep water gamma-spectrometer was used. This enabled to registrate gammaspectra on different levels. The investigation of radioactive situation in the region was carried out on the oceanographic stations and ships. Integrated scientific system of data collection and processing on the major part of hydrophysical fields made clear the dependence of vertical distribution of technogenic radionucl Ides on the hydrological conditions of the region.
In 1987 gamma-shooting of a number of regions In the Black Sea and the Baltic Sea was carried out. It showed the presence of Caesium-135 with concentrations of 1-5 x 10-13 Ci/I down to 100 m in the Black Sea and in the surface layers of the Baltic Sea.
Regular gamma-shooting of next and distant zones of accidental reject from Chernobyl APP was made from helicopter by means of Sodium Iodine detector of 3000 cm3 volume. The results were used for mapping of the radioactive pollution of the region /10/. The Investigation showed the necessity of correction of the results obtained by ground shooting In order to define more exactly the boundaries, pollution level and radionuclide composition. It Is necessary for alteration of standard geophysical aerogamma-methods applied for greater inhomogeneousness of radioactive anomalies on the surface, for more complicated and variable radionuclide composition and per registration of possible radioactive fallout on the trees. It is important to note that for such aerogammashootings most essential is graduation of devices on special testing ground with defined and various radionuclide compositions and morphology.
Surface Mobile Gamma-Spectrometry Complex On land we used a mlcrobus where we installed complex measurement equipment. With it we were able to carry out continuous gamma-shooting in movement, radionuclide analysis of soi I and water and continuous dose measurements. In order to decrease the dispersed irradiat Ion of soil and plants we used collimating detection blocks and blocks similar to those on ships were used for measurements in water. The speed was

- 565 -
usually 20-40 km/hour. This complex enabled us to fulfill the following procedures:
to estimate the dose values and variations in gamma-measuring radionuclide composition In regional and local analysis of contaminated territories in the Ukraine and Byelo-Russia;
- to identify a number of local "spots" of approximately 1 km which have not registered by aerogamma-shooting;
- to make correct ions of the boundaries of radioact Ive contamination and isodoses and evaluate their dynamics;
- to identify the main radionuclide composition of the control led regions in different "spots" (this simplified the procedure of sampling and their consequent gamma-spectrometry in laboratories);
- to provide collection of representative samples for their consequent rad iochemi ca I ana I ys Is on ~ - and 11'-i rrad I at Ing.
As it was shown, the correlation between the results of direct measurements on "spots" and lab. analysis of samples from the same "spots" was: for caesium-134, caesium-137 + (15-20%), for ruthenium-106 ! (25-30%), caesium-144 ! 50%.
Fig. 9 shows results of gamma-ray measurements by means of the complex along one of the routes across the Chernobyl region.
Examples i I lustrate the efficiency of direct continuous gamma-ray measurements carried out by our Institute. this work Is only a small part of wide-scale activity in the Chernobyl atomic power plant zone in 1986-88 carried out by more than 260000 people representing 40 Ministries and other organizations of the USSR /17/.
Perspectives of Method Application Any serious accident causing radioactive contamination of the environment orders immediate actions for its I iquidation. This cal Is for objective and prompt information on existing radioactive situation and its dynamics.
In 1984 In /11/ It was shown that in an accident when dehermetizatlon of reactor core and destruction of circular pipeline take place in 1,5-2 hrs on the border of the safety zone around APP a zone of outer irradiation forms which reachs 10 zem. Another example of unsufficlent promptness of radioactive control of the environment Is the activities undertaken after the "Three Mile lsland-2" accident /12/.
Evidently, al I nuclear states have created wide systems of radiation control that function, usually, on the territories of APPs and provide (according to ICRP) "source monitoring". This system Includes measurements around APP, detection of radlonuclides in the air, fallouts, water of the surface reservoirs and ground waters, in sol I, plants, botton deposits. The system gives objective information concerning the mean annual radioactive situation and, as a rule, satisfies the radioactivity level standards accepted In different countries. But these radioactive control media have one considerable drawback: the information refers to the past. It can be neglected when the exploitation regime of the APP is normal but tho1oughly unacceptable in accident situations with uncontrolled emission of radionucl ides in the environment. In such cases prompt information is necessary and is to be received within short time.
Nowadays, especially after the Chernobyl accident, many countries work out and introduce systems of automated radioactive ecological

- 566 -
monitoring. Thus, Great Britain announced national net {RIMNETO incorporating 90 surface stations al I over the country for continuous gamma-ray measurement with Gaiger-Mul ler counters. The current Information together with aerogamma shooting data and results of samples analysis Is then passed over to the central data base /13/.
Denmark /14/ plans to lnsta 11 10 stationary observat Ion posts on the territory of the country which are to work In one-line regime. The equipment Is to register 10-20% increase of natural background which makes up 0,02 µc sv .h-1. But such f luctuat Ion may be due to Increase In radon concentration after rains. Thus, observation posts, besides ionizing cameras with the broad measurement range from 0,01 µc Sv/h-1 to 1 mSv/h-1 are provided with sodium Iodine crystals and 256-channel analysers which have to extract technogenlc nucl Ides out of natural background. The results will be accumulated on PC and will be transmitted every hour to the central station In Copenhagen and In case of an accident the data will be transmitted every 10 minutes.
In FRG /15/ a system of radioecological monitoring through continuous control of a radioactivity of the air is developed as well as technical requirements to Its precision and climatic characteristics. Besides, FRG dee ided to create integrated lnformat ion and measur Ing system to control radioactivity in the environment /16/. Powerful computer will collect, process and transmit this Information to management. This information will be collected at normal and emergency situation as wel I. Similar systems of the highest level are developed In the USSR /18/.
The method of direct continuous gamma-spectrometric measurements thanks to its promptness, efficiency and security is the main in developed systems. As this method is used in different countries It Is necessary to cal lbrate existing and developed equipment.
In conclusion it should be noted once more that besides problems of radioactivity control the method may be used for wide-scale research of the environment. It should be, evidently, recommended for the implementation of the international program "Biogeochemical pathways of artificial radionuclides" /19/.

- 567 -Literature
1. Hirschman N.A.//Nucl. Power Performance and Safety. Proc. Int. Conf. In Vienna, 1987, v. 1//Vlenna, 1988.
2. Legasov V.A.//BUI I. of IAEA, v. 29, 1987, No. 4, P. 28.
3. Legasov V.A.//"Communist", 1987, NB, P. 92-101.
4. Flavin Ch.I/Environ. Sci. Technol., 1987, v. 21, No. 7, p. 625.
5. Publication of the International Commission on Radiological Protection, No. 39, 1986.
6. Lelpunsky o.v. et al .//Raspredelenle gamma kvantov v veschestve// Moscow, FIZMATGIZ, 1960.
7. Proctor Ch.M.//Proc. 10th Pacific Sci. Congress, Honolulu, USA, 1961.
8. //"Avaria na CAES I ee posledstvi ia". lnformacia, podgotovlennaia di ia soveschani ia ekspertov MAGATE" VENAi/ch. 11, Moscow, 1986.
9. //2600 t Nauchno-issledovatelskoe sudno", Hol lming Ltd., 1984.
10. lzrael Y.A., Petrov V.N. et al.//Meteorologica i gidrologla, No. 7, 1987.
11. Volkov E.P. et al.//"Atomnaia energia"// 1984, v. 57, issue ,. 12. Bondarev A.A. et al.// Atomnaia energia//1986, v. 60, issue 2.
13. W i I k ins v. T. , Clark M.1.//Nucl. Eng.//1988, 8, No. 3-4.
14. Walmod-Larsen o .. Ryder N.P. //Nuc I. Eng. //1988, 8, No. 3-4.
15. Kreiner N.-1.//Nucl. Eng.//1988, 8, No. 3-4.
16. BUh I Ing A.' Wehner G. et al .//NUCI. Eng.//1988, 8, No. 3-4.
17. Kovalenko A.P., Kasik A.A.I/Chernobyl segodnia "Znanie" USSR, Kiev, 1988.
zavtra// 0-vo
18. Eremeev I.S. et al.//Atomnaia energia//v. 59, issue 5, 1985.
19. Dok. SCOPE - ENUVOR //"Blogeochimicheskie putl mlgrazl i iskusstvennykh radionukleidov", SCOPE VI I GA// W.P. 3, 1988.

- 568 -
·o I +'
i:: ,' QJ 'O
8 •ri I 0 0 I
rn 'O al I ~ § .-i I QJ .-i :,, :,, 6 Cl .0 I I H 0 I f..i +' i:: 0 QJ i:: f..i I +' .-i QJ QJ
0 •ri 'O .c I al 4 :a ·ri 0 I QJ 0 f..i QJ O
QJ al 0 f..i 0 .c: 0 E-< ·- 2 '"~
1970 1980 1990 2000
Fig.1. The global employment of nuclear rea~tors, 1~60-2000
___ Dashed line indicates projection f,,r 1985-200C

a, +' al H
+'
6
5
4
3
2
i:: 1 ;::s 0
0
- 569 -
.--~~~~~~~~~~~~~---,
I I . 4 I I I .
\ \ ; \ I 3 ' \ . \ \ \ I . \ '-1 :.. \ I · .. . "'"" ' \. . i u-.... l • \ f\ .... :
\ \, ,-;·-~ I I y ·-.,.i
\J
1 , 0 2,0
I
'
energy, MeV
Fig.3. Sodium-24 gamma spectra ~ransfered from the point source to ~he volume one.
The, spectra are s·;andardizerl by the photopea.k 1.37 MeV. 1 - point source 2 - 3 1 volume 3 - 300 1 volume 4 - 10 000 1 volume

Q) .µ al H
+'
§ 0 u
9
7
5
J
1
0,2
- 570 -
I-1 J1 9
7
5 Cs-1J7 Cs-1J4
Ru-1ciT7
Ru-1~ /~: n~-95 -95
s-1J
/j1
o,6 1 , 0
K-40 La-140
~7 1 , 4 energy, MeV
Fig.4. Go.rrnna spectrum of Welter in Kiev reservoir
( J.lu.y JO , , ,6)

-~ ......
.....
t 1
c·
-1
• g
A,
i -1
2
1 o-9
,
5 2
10
-1
J J
19
86
1
2
19
87
I
05
0
6
01
00
0
9
10
1°1
01
~?
c'; 04
0
5
o'G
o7
o's
-
'------------------------·-··-
1-'.i.
0.;
i,
Sw
iw,•
sri~
ed re
su
lt:;
o
f r, .
. ·.,,
surc
mcn
t.-
__ r:
;,u
int
11°1
fr
om
Ju
.. 1,
e6
to
Au
gu
st
19
'7
(riv
er
J·r.i
. p
yat,
. C
hern
ob
yl)
Ul _, I-'

I '-
~
:S
\... --
,:,;!E
ltl10
EY
L
x 1
0-
1 0C
i·l-
1
6,
1-1
0
4,o
-6,o
~-::.:!.·~
2
,1
-J,':
!.--~
1
,6-2
,0
1,0
-1,5
.
, ,
•j
' C
O
r.
,.
, ,.l
u
, -1
-''.
;'!
' ' . '
I
t I
I •
.. ' .. ' ~
.cl"
C. 4
-0,
1
V,
1 r.Ir
pen
r.
DP
sna
P:.
r,.6
. G
rum
na
acti
v:;
.ty
ais
trib
u.t
ion
in
, K
iev
:r
eserv
oir
(a
cco
rdin
g
to
19
86
-19
87
re
su
lts)
U1 ..., "'

Cl"1
E:rr
.?.o
b;yl
!
----
----
---·
·---
. ---
--
Zap
oro
zh
ie
x1
0-
11
Ci/
1
1 4
~ f
x1
0-
1 °
Ci/
1
' i
--fi""
p
C
/1,.
B
Pie
;, 7
, G
a'll!l
la acti
vit
y d
istr
ibu
tio
r: in
th
e
Dn
epr
casc
ad
es
(acc
ordi
r,.,
::-
to
19
86
-19
87
re
su
l tC
;
I -
f'U
f',U
S t
''18
h
. .....
'
B -
1c~
o~
r·r
1r.
~-~
C
-0
cto
her
-?8
7
U1
-.
J w

O·J
, 1
1,8
6
10
,04
1
1.0
~
12
,04
3G'
20
pu
lses
per
sec.
1..J
,·, •
\ 1
4,0
4
~'i
e,8
, M
icro
str
uctu
re o
f an
om
aly
re
gio
ns o
f th
e
Kie
v re
serv
oir
, 0
5,1
1,8
6
u, _, ~

- 575 -
160 dose level
80
92 100 1 u8 116 124 km
0, 16
0,08 Co-1J7
~-....... --...--...... --.,....--,---.,....--f----r ·-........,---84 92 100 '08
'), 04
Cs-1J4 c_;,, 02
84 92 100 ,OB 116 124 km
x10- 4ci.m-2
0,02 Ru-106
0,01
·~.
84 92 100 108 116 124 km
Fig.9. Results oi' the continuous au to;_;Ul!UT,a imaging on one of lho l"OU tes in the JO-km zone (August, 1 9 8'()

- 576 -
- 577 -
Radioactive Contamination of the Dnieper River and Baltic
Sea Basins after the Chernobyl NPP Accident
Y.V. KUZNETSOV

- 578 -
ABSTRACT
The paper sets out the results of radiochemical and gamma-spectrometric analyses of the aqueous phase, suspensions and bed sediments from the Prlpyat-Dnieper river network and Baltic Sea (from 1986 to 1988) employing methods devised at the V.G. Khlopln Radium Institute.
In order to study the vertical distribution of radionuclides in bed sediments and calculate their content on the bed, we adopted a layerby-layer study method involving removal of integral cores with the aid of a special IY developed sampling device; in this way we were able to establish the vertical 'and horizontal profiles of radionuclide distribution in sediments, and how they change in time and space. By means of selective I lxiviation we estimated the resuspension ability of radionuclides in Kiev Reservoir bed sediments. Investigation of radionucl Ide interphase distribution between the aqueous and suspended phases, between water and sediments, plus use of ultrafiltration, made it possible to determine the forms of uptake and migration of major radionucl ides in water bodies. It was shown that the overwhelming majority of radionuclides (over 10) are associated with the suspended Phase in water bodies, mainly with the finely divided component. The main portion of caesium isotopes, and to a lesser degree strontium-90, was I inked to the aqueous phase in water bodies, such nucl ides being highly mobile. Radionuclide concentrations exceeding the permitted values under Radiation Safety Standards NRB-76/87 were not detected in the Kiev Reservoir or in the Baltic Sea.
The paper predicts - on the basis of knowledge of radionuclide forms of occurrence in water bodies and their physico-chemical behaviour - how the radioactivity in the water masses of the water bodies studied wil I change in time and space.
The paper details the dynamics of changes in radioactivity in the nearground atmosphere of the Baltic region from April to June 1986 (on the basis of measuring the concentration In atmospheric aerosols of over 20 radionucl ides, including caesium, plutonium and iodine Isotopes).
The report ends by comparing the environmental impact of the Windscale and Chernobyl accidents.

- 579 -
The accident at unit four of the Chernobyl NPP released fragmented, Induced rad ionuc I I des and shattered reactor fue I Into the env I ronment, subjecting not only the countryside within a 30-Km radius to particularly intensive contamination, but also vast areas much further afield (via transport in the radioactive plume), including the water catchment areas of the Pripyat and Dnieper Rivers and the Kiev Reservoir. The radioactive cloud moved north, northwest and northeast, and contaminated a vast region In the northwestern USSR (Baltic Sea water catchment area and Baltic Sea proper). Although the total area of the USSR which was radioactively contaminated is considerably larger than that of the regions mentioned above, this paper deals only with these catchment areas since they were the ones studied by scientists from the Radium Institute between 1986 and 1988 (we began studying radioactive contamination of the Baltic sea Basin in 1970 and have continued to do so on a regular annual basis up to the present time).
This report presents and discusses the results of our radiochemical and gamma-spectrometric analyses of the content of the main dose-emitting radionucl ides In the I iQuid and sol id (suspensions, bed sediments) phases of the water bodies studied. Our survey of the river system of the Dnieper and the Kiev Reservoir, started as early as the end of May 1986, I asted the who I e summer and was continued In the subseQuent years. This enabled us to study the changes in the radiation situation over time.
To study how the radionuclides were distributed in the aQueous phase of the water bodies we measured their content both in unfiltered water free of suspensions and in the suspended phase as well. We separated the suspensions from the aQueous phase bY using nucleopore filters in a specially designed membrane device. We collected the sediments using aspecial sampler (designed by the Radium Institute) which allowed us to collect sediment cores without damaging their structure (retaining the surface layer), and we then studied how the radionuclides were distributed In the surface layers of the sediments (horizontal profile) and by depth (vertical profile).
To determine the plutonium content in the Pripyat-Onieper-Kiev Reservoir water system we used existing data on the distribution of radionucl ides in various parts of the environment around the Chernobyl NPP. From June to August 1986 the survey team from the v. G. Khlopin Radium Institute working as part of the "Complex Expedition" arranged by the USSR State Committee for Hydrometeorology - measured the content of a number of gamma-emitting nucl ides In the water, bed sediments and suspensions in the water system under study. We discovered that in July 1986 the caesium-137 volume activity in the water of the Pripyat River had hardly changed in the course of its flowing from Chernobyl to the river mouth, and amounted to some 4 000 BQ/m3. The caesium-137 volume activity in the water of the Dnieper

- 580 -
around Kiev and In the Kiev Reservoir was 160-200 BQ/m3. We also discovered that the content In the water of radionuct ides such as cerlum-141,144, ruthenium-103,106, zlrconium-95 and niobium-95 tended to decrease as the water flowed through the Kiev Reservoir.
From these findings we obtained a rough estimate of how much plutonium was In the water system.
Table 1 gives the Initial findings for plutonlum-239,240 and plutonium-238 and their ratio in water samples taken from the Prlpyat-OnieperKiev Reservoir system between 8 and 19 July 1986, together with the results of a second series of measurements taken between 16 May and 4 June 1987. In 1986 the plutontum-239,240 volume activity In the water of the Prlpyat River ranged from 0.6 to 48 BQ/m3 (unfiltered samples). A decrease to 0.3 8Q/m3 was observed In the surface waters of Kiev Reservoir, whereas plutonium-239,240 volume activity in the benthic waters was 27 BQ/m3. The bulk of the plutonium (over 95%) was attached to suspensions.
Comparing these figures with the permissible concentrations (PCs) for plutonium 239,240 in drinking water, we find that the levels are several orders of magnitude below the PCb or permissible concentration of radionucl ides In water (or air) for a limited section of the population (Radiation Safety Standards NRB-76/87, where for plutonium 239,240 the PCb in water is 2.2-10-9 Ci/I or 81 000 BQ/m3).
In 1987 the mean volume activity values for plutonium-239,240 in the water of the River Pripyat had decreased, whereas those in the surface waters of Kiev Reservoir had increased slightly. Fig. 1 gives the plutonium-239,240 measurements for 1986 and 1987.
Due to the smal I number of samples we are unable to specify the underlying processes involved in the distribution of plutonium. The scattered nature of the findings ts apparently due to the different amounts of suspended matter In the various water samples, and this is part lcular ly true of 1986 when the water samples were collected at a time of heavy river traffic and even dredging work. In order to determine the role played by suspensions in plutonium behaviour, we filtered water collected from the mouth of the Prlpyat River in July and August 1986 and measured the plutonium-239,240 content in the filtrate and on the filter (Table 2). over 90% of the plutonium contained In the water sample as a whole was attached to the suspended fraction. This confirms the earlier findings of French researchers, who found that 90% of the plutonium-239,240 was attached to suspensions extracted from samples of water from the var and Rh~ne Rivers.1 The major role played by suspensions in determining the behaviour of radionucl ides in r Iver waters applies not only to plutonium. Gamma-

- 581 -
spectrometric analysis of suspensions extracted from the River Pripyat has shown that some 75-97% of cerium-141,144, zirconium-95, niobium-95 and ruthenium 103,106 attaches to the suspensions. By contrast, radioactive caesium Is found mainly in the soluble form (about 66%), which explains why this radionuclide cannot serve as an Indicator of plutonium content in the water. This is confirmed by the fact that the plutonium-239,240/caeslum-137 ratio In the water samples differs by two orders from the Initial value In the damaged reactor.2 As for cer ium-144, both in the suspensions (Table 3) and the bed sediments (Table 4) we observed a correlation between its specific activities and those of plutonium-239,240. In 1987 the plutonlum-239,240/cerlum-144 activity ratios varied from 1.8 to 5.8·10-3 In suspensions and from 0.4 to 2.3·10-3 In bed sediments (mean value 1.75·10-3). These ratios were determined at the time the samples were talcen; in an extrapolation baclc to the time of the accident the ratio, according to our data, was found to be 7.85·10-4, which is close to the value given in 2 for the damaged reactor.
In 1986 the plutonium-239,240 specific activities In the Pripyat River bed sediments varied considerably - from 8 to 890 BQ/lcg (Table 5) - due to the work going on In this region to construct dylces and dams.
The plutonium content in Kiev Reservoir bed sediments varied from 10 to 54 Bq/lcg, with higher levels (up to 340 Bq/kg) being observed in stagnant areas.
Table 4 shows the measurements of plutonium content in sediments of the Pr lpyat and Dnieper Rivers; in May and June specific activities of plutonlum-239,240 varied from 26 to 810
the bed 1987 the Bq/kg in
the Pripyat River, from 13 to 29 Bq/kg In Kiev Reservoir and from 1.6 to 26 Bq/kg in the creeks and channels near Kiev. These results are comparable with those obtained from bed sediment samples talcen from this region in July and August 1986.
The attachment of plutonlum-239,240 to suspended matter determines its subsequent behav lour. The depos It ion of suspended matter on the bed or, conversely, turbidity due to flooding and human agricultural activity, wil I also determine the displacement of plutonium-239,240 in the Pripyat-Dnieper-Kiev Reservoir water system.
In 1986 most of the radionucl ides were located in the top 3 cm layer of the bed sediments. Specific activity for strontium-90 was up to 15 BQ/kg. Plutonium was unevenly distributed in the bed sediments (plutonium content varied from 41 to 2 520 BQ/lcg in one and the same sample of sediment from the zone near where the accident occurred). The specific activities in sediments on the bed surface also varied considerably (up to 315 Bq/lcg at the mouth of the Pripyat River and, on average, 22 Bq/lcg in Kiev Reservoir, i.e. more or less the same as in the suspensions). In both sediments and suspensions we observed a high

- 582 -
positive correlation between the distribution of plutonium and cerium-144 Cr • 0.99, P - 0.95, where r - correlation coefficient and P • confidence limit).
In 1986 a study of the vertical layer-by-layer distribution of radlonucl Ides (cerium-144, zlrconlum-95, niobium-95, ruthenlum-106, rhodlum-106, caeslum-137,134, strontium-90 and plutonium-239,240, inter alia) in the bed sediments revealed a sharp drop in their content below the top 3 cm layer, but as early as 1987 this high had shifted deeper into the sediment, point Ing to radionucl Ide penetration Into deeper layers.
Radioactive Contamination of the Environment in the Baltic Sea Basin
The Baltic Sea - which is a comparatively shallow and partially enclosed body of water exchanging water with the North Sea via the narrow Danish straits -is used intensively by a number of states for many economic purposes, including cooling of their nuclear power plants. This body of water has been subject to stringent ecological monitoring over the past few decades ever since it was found to be one of the worst in the world on a number of scores (e.g. pollution of the sea water with hydrocarbons). It Is also monitored for radioactive contamination by the v. G. Khlopin Radium Institute in Leningrad and the Institute for Experimental Meteorology (IEM) in the town of Obninsk which since 1970 - in conjunction with scientific establishments in the GDR, the Polish People's Republic and Finland - have carried out regular studies into the processes underlying the propagation of a number of technogenic radionucl ides in the Baltic sea. This research covers not only the water systems of the Baltic sea Basin (sea and river waters, the suspended phase, bed sediments, aquatic biota), but also the air masses in the near-surface layer of the atmosphere and atmospheric fallout, since this is one of the sources of radioactive contamination of water bodies.
The Chernobyl accident released Into the atmosphere a considerable amount of different radionucl ides, which air currents carried mainly west and northwest, leading to contamination of the Baltic Sea. Which radionuciides, and In which concentrations, determined the radiation situation In this body of water, what their fate wi Ii be and how quickly the Baltic Sea waters wi 11
cleanse themselves naturally are cardinal questions requiring an answer in the near future. In order to answer these quest Ions we need to know how radioactively contaminated the Baltic Sea was before the Chernobyl accident and what were the main radionuciides involved, what is the I ink between the radioactive contamination in the air above the Baltic and in the basin itself, what determines the dynamics of radionuclide distribution in this body of water, and how soon can the Baltic Sea waters cleanse themselves of the dose-emitting radionucl ides.
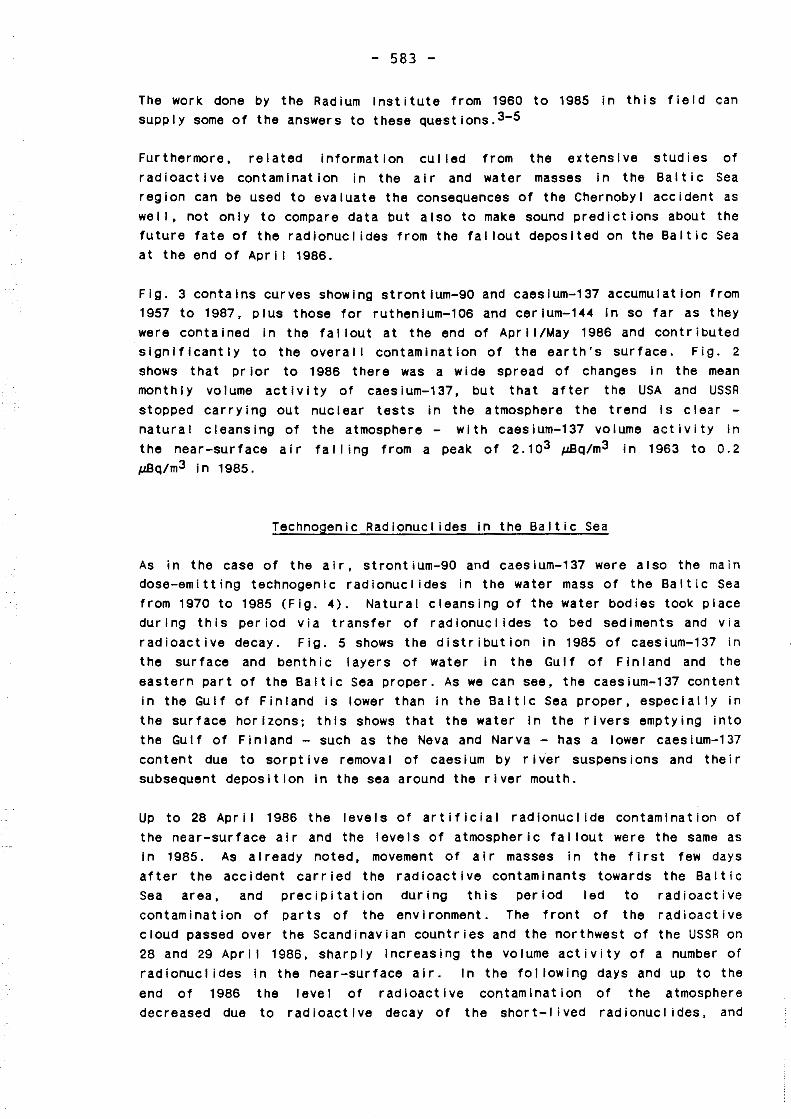
- 583 -
The work done by the Radium Institute from 1960 to 1985 in this field can supply some of the answers to these questions.3-5
Furthermore, related information cul led from the extensive studies of radioactive contamination in the air and water masses in the Bait ic Sea region can be used to evaluate the consequences of the Chernobyl accident as well, not only to compare data but also to make sound predictions about the future fate of the radionucl ides from the fallout deposited on the Baltic Sea at the end of April 1986.
Fig. 3 contains curves showing strontlum-90 and caeslum-137 accumulation from 1957 to 1987, plus those for ruthenium-106 and cerlum-144 In so far as they were contained In the fallout at the end of April/May 1986 and contributed significantly to the overal I contamination of the earth's surface. Fig. 2 shows that pr lor to 1986 there was a wide spread of changes in the mean monthly volume activity of caesium-137, but that after the USA and USSR stopped carrying out nuclear tests in the atmosphere the trend is clear -natural cleansing of the atmosphere - with caesium-137 volume activity in the near-surface air fal I ing from a peak of 2.103 µBq/m3 in 1963 to 0.2 µBq/m3 in 1985.
Technogenic Radionucl ides in the Baltic Sea
As in the case of the air, strontium-90 and caesium-137 were also the main dose-emitting technogenic radionucl ides in the water mass of the Baltic Sea from 1970 to 1985 (Fig. 4). Natural cleansing of the water bodies took place during this period via transfer of radionuci ides to bed sediments and via radioactive decay. Fig. 5 shows the distribution in 1985 of caesium-137 in the surface and benthic layers of water in the Gulf of Finland and the eastern part of the Baltic Sea proper. As we can see, the caesium-137 content in the Gulf of Finland is lower than in the Baltic Sea proper, especially in the surface horizons; this shows that the water in the rivers emptying into the Gulf of Finland - such as the Neva and Narva - has a lower caesium-137 content due to sorpt i ve remova I of caesium by r Iver suspensions and their subsequent deposition in the sea around the river mouth.
Up to 28 April 1986 the levels of artificial radionuclide contamination of the near-surface air and the levels of atmospheric fallout were the same as in 1985. As already noted, movement of air masses in the first few days after the accident carried the radioactive contaminants towards the Baltic Sea area, and precipitation during this period led to radioactive contamination of parts of the environment. The front of the radioactive cloud passed over the Scandinavian countries and the northwest of the USSR on 28 and 29 Apri I 1986, sharply increasing the volume activity of a number of radionucl ides in the near-surface air. In the fol lowing days and up to the end of 1986 the level of radioactive contamination of the atmosphere decreased due to radioactive decay of the short-I i ved rad i onuc I ides. and

- 584 -
throughout the troposphere in the northern hemisphere the fallout reaching the earth's surface also thinned out.
The intensity of fallout and accumulation of the individual radlonuclides on the earth's surface after 26 April 1986 varied. comparing the levels with those from 1961 to 1963 shows that they reached a new high for caesium-137, ruthenium-103 and ruthenium-106, while those for stront ium-90, cer ium-141, cerium-144 and zirconium-95 did not exceed the levels measured for fallout from 1970 to 1980.
Towards the end of 1985/beglnning of 1986 radon, thoron and their decay products in the air were responsible for the volume radioactivity in the atmosphere (total natural radioactivity being 1 Bq/m3), while the contribution of technogenic radionucl Ides was negligible (this was determined via caesium-137 and strontium-90 content, and amounted to< 0.2 µBq/m3),
In the first few days after the Chernobyl accident, contamination of the atmosphere with iodine-131 was the most significant feature, accounting for up to 5% of the permissible annual iodine-131 content in the air (Radiation Safety Standards NRB-76). Subsequently this fel I sharply and by 15 May did not exceed 1 000 µBq/m3, or o. 07% of the PCb. Mean caes i um-137 contamination of the air was 100 µBq/m3, I.e. 0.1% of the mean annual permissible concentration of this radionuclide in the air in populated areas. During this period the total activity of technogenic radionuclldes in the air in the Leningrad area was considerably lower than its natural radioactivity from radon, thoron and their decay products(< 1 Bq/m3), The high density of fallout inevitably increased the radioactive contamination of the Baltic Sea waters.
Initial measurements, made at the end of Apri I/beginning of May 1986 in diametrically opposite regions of the Baltic Sea (in the eastern part of the Gulf of Finland 6 and near to the Danish straits 7), revealed an increase In the radioactive contamination of the surface water layers In each case. At the same time Increased radioactive contamination was recorded In a number of bodies of water along the Baltic coast.B-9 These observations prompted wider studies.
In June 1986 we surveyed the waters in the Gulf of Finland and Gulf of Riga. The preliminary results obtained, which were presented at the 13th STC HELCOM Meeting 6, brought out in particular the heterogeneous nature the "patchiness" - of the radioactive contamination, which reflected in turn the heterogeneous nature of the fallout. In these Gulfs we discovered two contamination zones between which there was an approximately tenfold difference in the volume activities of caesium isotopes, the more contaminated zone being in the eastern and central parts of the Gulf of Finland, while the less contaminated zone covered the western part of the Gulf of Finland and the Gulf of Riga. Our findings showed that the caesium isotopes predominated among the radionucl ides present, the caesium-134/caesium-137 ratio being 0.5 on average for the entire body of water

- 585 -
surveyed, as it was in the fallout stemming from the Chernobyl accident. At the same time It was established that the strontlum-90 content did not increase, remaining more or less at the global level even in the most contaminated parts of the sea, and from then on we paid particular attention to studying the distribution of caesium Isotopes.
In July and August 1986 we surveyed the waters of the eastern part of the Baltic Sea proper, including the Kurslcy Zallv (Courland Lagoon) and the Kaliningradslcy Zal Iv (Vistula Lagoon), and carried out a fresh survey of the Gulf of Finland. The findings, given in Table 6, are improvements on the caesium Isotope measurements made In the Gulfs of Finland and Riga in June. Al I the caesium-134 and caesium-137 findings were obtained through radiochemical analysis of water samples.
The July-August survey confirmed the June observations. We saw a substantial difference in contamination levels in various parts of the Baltic Sea. In August the region of Increased contamination in the Gulf of Finland could still be easily made out, but its clear-cut boundaries had become blurred, with the more contaminated region shifting westwards in the direction of the surface-water flow. Fig. 5 shows the distribution of caesium-137 in surface waters in the Gulf in June and August 1986. Given the constant caesium-134/caesium-137 ratio in the sea areas studied, we present the findings for one Isotope only - caesium-137.
The eastern part of the Baltic Sea proper was the least contaminated of the bodies of water we surveyed, with a caesium-137 content in the surface waters of around 40 Bq/m3. In the southeastern part and the Kai inlngradslcy Zal iv, as we! I as In the Bay of Danzig as a whole 10, the caesium-137 content was slightly higher at 80-100 Bq/m3. In al I probabl I ity this region also hada "patch" of Increased fallout, but one which was significantly less marked than that in the Gulf of Finland.
Analysis of water samples from the deep water horizons clearly revealed that caesium isotopes had penetrated to the deep layers of the sea, but the penetration rate was not the same for the various sea regions. Fig. 5a shows the distribution of caeslum-137 in the surface and benthic layers of the sea throughout the regions surveyed in July and August 1986. Contamination with caesium Isotopes had Increased In the surface layers throughout the body of water surveyed, albeit to varying degrees. Thus, In July and August we observed, over the entire area, penetration of caesium isotopes from the surface layer to the deep ones. The rate of propagation of the contamination differed, as one would expect. By August 1986 it was only in the shallow areas of the Gulf of Finland (25-30 m) that the caesium-137 concentrations in the benthic and surface layers were comparable, whereas they had differed significantly in June (Table 6). In July and August we continued to find noticeable differences in caesium isotope content in the surface and benthic layers in very deep areas. Fig. 5 gives a general idea of caesium-137 distribution in the surface and benthic layers of the part of the Baltic Sea surveyed.

- 586 -
Given the Increased radioactive contamination of the Baltic Sea waters In 1986, It was necessary to monitor the Ingress of caesium Isotopes via water from the Baltic Basin rivers. Fig. 6 contains measurements of caeslum-134 and caeslum-137 In the waters of a number of rivers which empty Into the Baltic Sea from Soviet territory. Comparison of the results shows that rivers along the west coast of the Baltic were considerably less contaminated than rivers along the east coast - the Neva and the Narva. The waters of the Neva and Its source Lake Ladoga contained significantly smaller concentrations of caeslum-137 In comparison with the central part of the Gulf of Finland (Fig. 6). All this confirms· the non-uniformity of the radioactive contamination of the water surfaces, due to the non-uniformity of the fallout, as a result of which a vast radioactive patch formed In the Gulf of Finland containing areas of differing contamination Intensity. Fig. 6 contains data coverln.g November and December 1986, showing that by this time the content of caeslum-137 and caeslum-134 In the Neva River and Lake Ladoga had decreased some twenty-fold as compared to the beginning of May.
From June to August 1986 - In addition to measuring the caesium Isotopes - we measured the plutonlum-239,24D content In the Baltic Sea waters. The findings set out In 7, relating to the waters of the southwestern Baltic Sea, show that In June 1986 the Increase In plutonlum-239,240 content was small as wel I, being no more than three to five-fold compared to 1985.
When studying radioactive contamination of the waters In the Gulf of Finland we always paid great attention to the region near the Leningrad NPP - the Koporsky Zallv (bay) - where observations were carried out monthly in 1986. The Koporsky Zal Iv, I Ike the entire Gulf of Finland, was subjected to additional fallout, although to a somewhat lesser extent than the central part of the Gulf of Finland. The caeslum-137 content In the surface waters of the Koporsky Zallv fell from 400 Bq/m3 In June to 190 Bq/m3 In November 1986 (Table 6). During this period the phase distribution of caeslum-137 In the Koporsky Zal Iv waters was studied. The results obtained (Table 6) showed that most of the caeslum-137 Is found In the aqueous phase and some 2% on suspensions. Similar studies, carr led out In 1982, had also shown that some 2.5-10% of the entire amount of caeslum-137 In the water was attached to suspenslons.12
The Chernobyl accident caused an Increase In caeslum-137 content throughout the Baltic Sea waters surveyed. However, In many regions, e.g. In the eastern part of the Baltic Sea proper, the contamination caused by this nuclide Is lower than the caeslum-137 content In the North Sea, whose waters are highly contaminated due to the systematic discharge of liquid radioactive wastes from nuclear reprocessing plants In Western Europe. As a result the North Sea will continue to Increase the amount of caeslum-137 In the Baltic Sea.
Thus, on the basis of the studies carried out from June to November 1986, we can conclude that only In the case of caeslum-137 and caeslum-134 Is there an

- 587 -
additional accumulation stemming from the atmospheric transport of radlonucl Ides released during the Chernobyl accident, and that there Is no significant Increase In the accumulated amount of strontlum-90 and plutonium 238,239,240. The Increased accumulation of caeslum-137 raises the expected effective dose equivalent - for the population In the region where the highest radioactive fallout was registered - from 190 msv (mean value for the northern hemisphere) to 191.6 mSv, I.e. by no more than 0.85% In all.
Throughout most of the Baltic Sea region the contribution from caeslum-137 deposited as a result of the Chernobyl accident wl II be below this.
The contribution from the remaining radlonuclldes Is negligible, given their half-life and low content (Fig. 3).
We should therefore expect that these waters will gradually cleanse themselves of caeslum-137 as a result of cyclical sorptlve removal of this radlonucl Ide from the water by suspended matter. Caeslum-137 accumulation In bed sediments wl I I depend on the speed of suspension settlement and the type of bed sediment.

- 588 -
BIBLIOGRAPHY
I. R. Fucal, et al.: Proceedings of the Symposium on the Impact of Radionuclide Releases Into the Marine Environment; pp. 3-15, IAEA, Vienna, 1981.
2. Yu. A. lzrael, et al.: Atomnaya Energlya, 1988, vol. 64, Issue 1, pp. 28-40.
3. L. I. Gedeonov, L. N. Lazarev, L. M. lvanova, et al.: On the need to plot the boundaries of radioactive wastes discharged Into International water systems; Nuclear Power and Its Fuel Cycle, vol. 4, pp. 267-280, IAEA, Vienna, 1977.
4. L. I . Gedeonov, D. I . Gusev, L. M. I vanova, et contamination of International water systems; Radionuclide Releases Into the Marine Environment, 1981.
al.: Radioactive The Impact of IAEA-SM-248/143,
5. L. N. Lazarev, L. I. Gedeonov, L. M. lvanova, et al.: Radlokhlmlya, No.6, pp. 822-826, 1984.
6. The level of radioactive contamination of the Baltic Sea In 1986. Submitted by the USSR, STC 13/4/16, 13th STC HELCOM Meeting, September 1986, Gdynla, Poland.
7. The Impact of the Chernobyl accident on the North Sea and the Bal tic Sea. Prel lmlnary Report. Submitted by the FRG, STC 13/4/18, 13th meeting STC HELCOM, September 1986.
8. Interim report on the fallout situation In Finland from 26 Apr II to 4 May 1986. STUK-8-VALO 44, Helsinki, 1986.
9. Second Interim report on the radiation situation In Finland from 5 to 16 May 1986. STUK-B-VALO 45, Helsinki, 1986.
10. Summary report on Danish radioactivity measurements related to the Chernobyl accident; submitted by Denmark, STC 13/4/4, 13th STC HELCOM Meeting, Sept. 1986, Poland.
11. Concentrat Ions of 134cs and 137cs In the waters and In the fish of the Baltic Sea In June 1986; submitted by Poland, STC HELCOM.
12. L. N. Lazarev, Yu. V. Kuznetsov, et al.: Study of radioactive materials In the Baltic Sea, IAEA-TECDOC-362, pp. 162-175, 1986.

Tab
le
1:
CON
TEN
T O
F PL
UTO
NIU
M-2
38
AND
PLU
TON
IUM
23
9. 2
40
IN
SAM
PLES
O
F U
NFI
LTER
ED
WAT
ER
lAK
EN
FROM
TH
E R
IVER
PR
IPY
AT
AND
THE
KIE
V
RESE
RVO
IR
IN
1986
AN
D 19
87
' I' 19
86
198'
/ I
1\ ' I
11 S
ampl
e S
ampl
e co
llecti
on
po
int
Col
lee
-P
u-23
8 I
ind
ex
tio
n
Pu-
238
Pu-
239.
240
Pu-
239.
240
!! d
ate
B
q/m
3 I I
RIV
ER
PRIP
YA
T I I
t.
I C
hern
obyl
to
wn.
la
nd
ing
st
age
--
--
I 1
•.
Che
rnob
yl
tow
n.
lan
din
g
stag
e 17
. 07
33
.0
± 3
.0
48
.0
± 4
.0
0.6
9
ii 2.
abov
e C
hern
obvl
to
wn
16
.07
0
.5
± 0
.2
0.6
±
0.2
0
.85
Ii I C
hern
obvl
to
wn.
cr
eek
ii 3
. -
--
-!I
4.
Buo
v 24
0 1
7.0
7
0.7
±
0.2
1
.2 ±
0.3
0
.60
'I I, ii 5
. B
uov
234
17
.07
1'
1.0
± 2
.0
0.3
6
48
.0
! 4
.0
11 II b.
IJU
OV
21
9 -
--
-
i, I.
M
outh
16
. 0·1
1
.8
± 0
.3
5.1
±0
.5
0.3
6
\! !i K
!EV
HI
::SER
VO JR
II .. II
8·
Suk
holu
che
19.0
7 -
0.3
±
0.2
-
!I I 8*
. S
ukho
luch
e 19
.07
20
.0
± 2
.0
27 .
0
±
3. 0
0.
'15
I I 9.
Gle
bovk
a -
--
-i •
sam
ples
o
f b
enth
ic w
ater
Cal
lee-
tio
n
Pu-
238
Pu
-23
9.2
40
d
ate
25
.05
0
.70
±
0.12
I 0.
94
±
0.14
I
--
-I
-I
--
I I o
3.o
6
I 0
.17
±
0.04
0
.25
±
0.04
I
I I I
I 04.0
6
2.6
±
0.3
0
4.7
, o
.41
I I
--
-I
16.0
5 0
.34
±
0.06
o
. 54
±0.
08
I I 2
5.0
5
I . 9
±
0. 2
0 3
.5
± o
.35
I I I
26
.05
0
.7
± 0
.15
1
.2
± 0
.18
i
--
I -I
23
.05
I 0.
35
±
0.15
I 0
.4
-0
.06
I
I P
u-23
8 I
Pu-
239.
240
I I I ! I ' 0.
'14
I I I -
I I -
I ! 0
.68
I
0. 5
5 I 1.1
1 ex
,
-'°
I 0
.63
I
0. 5
4 I I .J ! I
0.
58
I I -
I I 0
.87
I I I I I I I I
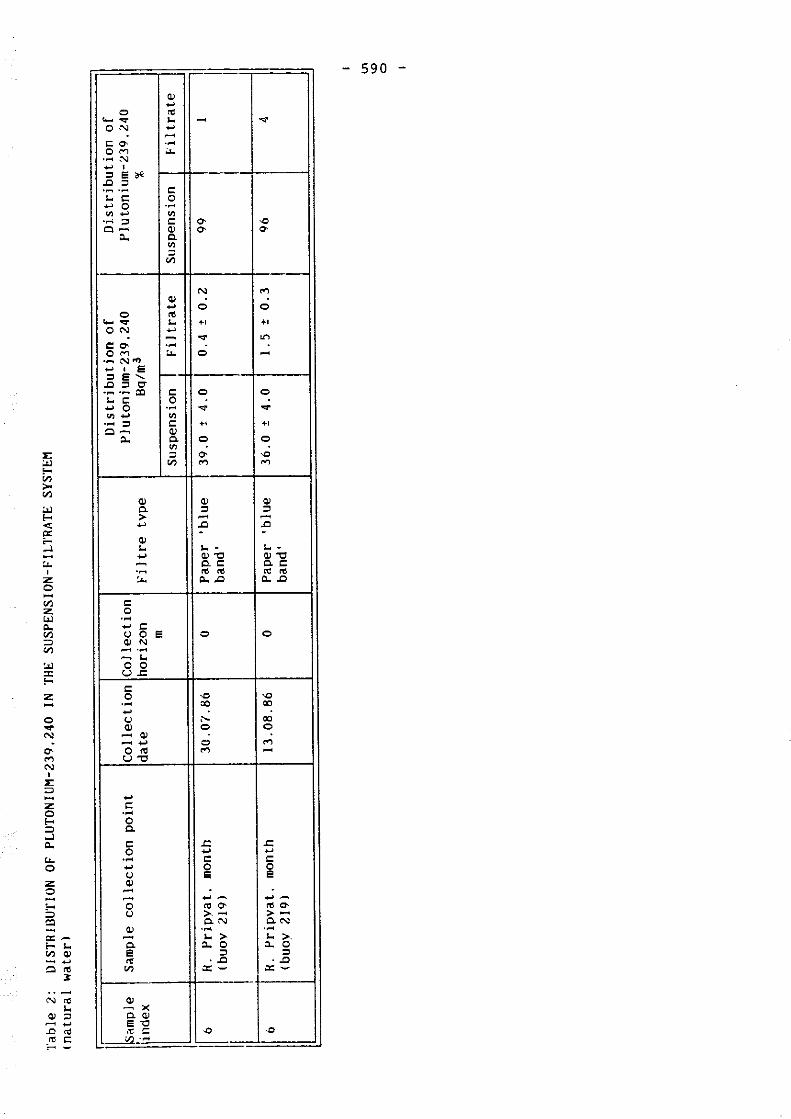
l'ab
le 2
: D
ISTR
IDU
TJO
N
OF P
LUTO
NIU
M-2
39,2
40
IN
THE
SUSP
ENSI
ON
-FIL
TRA
TE
SYST
EM
(nat
ura
l w
ater
)
lsam
pJ e
D
istr
ibu
tio
n o
f Sa
mpl
e co
llecti
on
po
int
Co
llec
t ion
Co
llec
tio
n
Plu
toni
um-2
39.2
40
inde
x d
ate
ho
rizo
n
Fil
tre
type
B
q/m
3 m
S
uspe
nsio
n F
iltr
ate
I I 6
R.
Pri
py
at.
mon
th
30. o
·,. 8
6 0
Pap
er
'blu
e 39
.0
±
4.0
0
.4
± 0
.2
I (b
uov
219)
ba
nd'
6 R.
P
rip
vat
. m
onth
13
. 08
.86
0 P
aper
'b
lue
36
.0
±
4.0
1
.5 ±
0
.3
(buo
y 21
9)
band
'
Dis
trib
uti
on
of
Plu
toni
um-2
39,2
40
%
Sus
pens
ion
Fil
trate
99
I
96
4
I V1 "' 0

lab
Je
3:
HE
SUL
TS
OF
MEA
SUH
ING
TH
E S
PE
CIF
IC
AC
TIV
ITY
O
P P
LU
TO
NIU
M-2
39.2
40
IN
SAM
PLES
O
F R
IVE
RS
SUSP
EN
SIO
NS
PRO
M
THE
PRIP
YA
T
AND
DN
IEPE
R
(Mav
an
d
Jun
e
19
87
)
Sp
ecif
ic acti
vit
y
Sam
ple
V
olum
e S
usp
en
sio
n
BQ
/kg
susp
en
sio
n
Pu
-23
9.2
40
in
dex
C
oll
ecti
on
p
oin
t o
f w
ate
r co
ncen
trat.
C
e-1
44
1
gtm
1 P
u-2
3'/
.24
0
Ce-
14
4
I .
Bu
ov
-20
3
200
21
57
1.6
2
E
4 3
.5
E
-3
2.
Bu
oy
-21
0-2
12
3
00
3
1 1
55
7
.97
E
4
I. 9
E
-3
3.
Bu
oy
-21
9
20
0
31
31
0.9
0
E
4 3
.4
E
-3
R.
PRIP
YA
T
4.
Bel
ow
p
on
too
n
bri
dg
e
200
42
20
0.5
7
E
4 3
.4
E
-3
5.
lan
din
g
stag
e
15
5
47
19
1.0
6
E
4 1
.8
E
-3
6.
lan
din
q
stag
e
at
200
47
33
5.
59
E
3 5
.8
E
-3
Ch
ern
ob
yl
7.
Bel
ow
p
on
too
n
bri
dg
e
200
4 I
238
6.3
4
E
4 3
.8
E
-3
at
en
tran
ce
to
qu
arr
y
8.
recess
o
pp
osit
e
mo
uth
20
0 47
64
I
. 81
E
4 3
.SE
-3
o
f R
. U
zh
9.
Bu
oy
-40
, K
iev
30
32
14
4
.69
E
3
3.0
E
-3
re
serv
oir
01
'° .....

Tab
le
4:
SP
EC
IFIC
A
CT
IVIT
Y
OF
PL
UT
ON
IUM
-239
,240
IN
SA
MPL
ES
OF
BED
SE
DIM
EN
TS
FRO
M
THE
RIV
ER
S P
RIP
YA
T
AND
DN
IEPE
R
(May
-Ju
ne
19
87
)
I S
pecif
ic acti
vit
y
I B
q/k
g
Sam
ple
co
llecti
on
p
oin
t P
u-2
39
,24
0
Ce-
14
4
Pu
-23
9,2
40
C
e-1
44
Buo
v at
Ch
ern
ob
vl
cre
ek
1
30
±
I
3 7
.26
E
4
I. 8
E
-3
Cre
ek
op
po
site
m
ou
th
of
H.
Uzh
(0
-3
cml
31
0
±
30
1.6
6
E
5 I
. 9
E
-3
H.
Uzh
(3
-6
cm)
270
±
30
I . 4
7 E
5 I
I. 8
E
-3
I
R.
Uzh
(6
-9
cm)
33
0
±
30
I . 9
7
E
5 I
. 7
E
-3
Cre
ek
op
po
sit
e
mo
uth
o
f H
. U
zh
81
0
±
80
4
.22
E
5
I. 9
E
-3
Hu
ov
-25
1
<b
ayo
u)
23
0
±
20
I . 8
5
E
~ I
. 'I
E
-3
Hu
ov
-21
7
180
±
20
7.9
1
E
4 2
.3
E
-3
Bu
oy
-20
3
540
±
50
2.5
8
E
5 2
. I
E
-3
i Bu
ov
-40
23
±
5
1.2
4
E
4 1
.9
E
-3
~u
ov
-15
29
±
6
1.5
8
E
4 I.
8
E
-3
Bu
ov
-01
I
3 ±
3
7.6
9
E
3 1
.7
E
-3
R.
DN
IEPE
R
Ru
san
ov
sky
ch
an
nel
1.6
±
0
.4
0.4
0
E
2 0
.4
E
-3
Mat
vev
evsk
y
cre
ek
7
.4
±
I . 4
3
.52
E
3
2.
I E
-3
Ob
olo
nsk
v
cre
ek
26
±
6
I . 4
3
E
4 1
.8
E
-3
1.11 "' "'

Tab
le
5:
RE
SUL
TS
OF
MEA
SUR
ING
S
PE
CIF
IC
AC
TIV
ITY
O
F PL
UTO
NIU
M
23
9.2
40
IN
SA
MPL
ES
OF
BED
SE
DIM
EN
TS
TAK
EN
FRO
M
THE
RIV
ER
S PR
IPY
AT
AN
D D
NIE
PER
AN
D TH
E K
IEV
R
ESE
RV
OIR
(J
uly
1
98
6)
Sam
ple
co
llecti
on
sp
ecif
ic
Sam
ple
co
llecti
on
sp
ecif
ic
po
int
acti
vit
y
po
int
acti
vit
y
Bq
/kg
*
Bq
/kq
*
R.
PRIP
YA
T
KIE
V
RE
SER
VO
IR
at
Ch
ern
ob
yl
7.9
!
0.8
B
uoy
64
230
! 35
bel
ow
b
rid
qe
43
! 4
.0
Buo
y 30
20
0 !
20
Buo
y 22
4 8
90
!
90
Su
kh
olu
ch
e
20
±
2
Buo
Y
249
20
0
±
30
Ly
ute
zh
23
±
4
Buo
y 2
51
42
!
4 S
ite
of
hv
dro
-ele
c
po
wer
sta
tio
n
47
±
5 M
outh
1
40
!
14
Nea
r da
m
340
±
40
DN
IEPE
R
ABO
VE
KIE
V
Rese
rvo
ir
9 ±
3
R.
Tete
rev
. m
ou
th
54
±
8
R.
Des
na.
m
ou
th
l. 5
±
0
.3
So
bac
he
qir
lo
l .
l ±
0
.2
Ob
olo
nsk
v
ch
an
nel
1.7
±
0
.3
Ru
san
ov
sky
ch
an
nel
32
±
3
Ven
ets
ian
ov
sky
ch
ann
, 20
!
2
• R
esu
lts
ob
tain
ed
fr
om
tw
o p
ara
llel
measu
rem
en
ts
l.11 "' w

Tab
le
o:
CON
TEN
T O
F C
AES
IUM
-134
AN
D C
AES
IUM
-137
IN
W
ATER
SA
MPL
ES
FROM
TH
E EA
STER
N
PART
O
F TH
E B
ALT
IC
SEA
PR
OPE
R AN
D TH
E G
ULF
O
F FI
NLA
ND
. AN
D A
LSO
FR
OM
THE
GU
LF
OF
RIG
A.
THE
Kl'R
SKY
ZA
LIV
(C
ou
rlan
d
lago
on)
AND
THE
KA
LIN
ING
RAD
SKY
ZA
LIV
(V
istu
la
lag
oo
n)
Gen
eral
D
epth
at
Co
nce
ntr
atio
n B
q/m
~ S
ampl
e S
ampl
e co
llecti
on
C
oll
ect.
w
ater
w
hich
C
s-13
4 in
dex
p
oin
t d
ate
d
epth
sa
mpl
e C
s-13
4 C
s-13
'/ cs
-13
7
m
tak
en m
B-2
59
°30'
N
23
"00
'E
19
.0'/
96
0
44
±
'I 11
0 ±
8
0.4
0
I B
-2
59°3
0'N
2
3°0
0'E
)9
.07
96
90
7
28
±
3 0
.25
I U
-4
59°0
0'N
2
1"3
0'E
1
9.0
7
103
0 30
±
JO
65
±
JO
0.
45
H-4
59
"00'
N
21
"30
'E
19
.07
10
3 JO
O JO
28
±
3
0. 4
0
B-6
58
"00'
N
20
"45
'E
21. O
'I 96
0
25
40
±
JI
I 0
.62
B-6
58
"00'
N
20
°45
'E
2 I.
O'/
96
90
9 23
±
3
0.3
7
B-3
7 5'
/°22
'N
19
"57
'E
23
.07
23
0 0
13
41
±
6 0
.31
I
B-3
'/ 57
"22'
N
19
"57
'E
23
.07
23
0 20
0 6
22
±
3 0
.26
H-4
6 56
°06'
N
l9°1
4'E
2
4.0
7
136
0 22
44
±
7
0.5
0
B-4
6 56
°06'
N
l9°1
4'E
2
4.0
7
)36
100
6 36
±
3
0. 1
7
B-5
0 55
"30'
N
l8°5
3'E
2
4.0
'/
90
0 35
±
10
87
±
8
0.3
9
8-5
0
55°3
0'N
l8
°53
'E
24
.07
90
80
16
±
3
34
±
3 0
.47
GU
LF
OF
RIG
A
H-1
C
entr
al
part
l'I.
06
26
0 27
±
5
68
±
5 0
.40
II H
-7
I J.
:a~t
.ern
o
art
17
.06
24
I
0 I
15
48
±
5 0
.33
I I I
Ii -
i I
I I
I I
I ~
. I I u
, "' ...
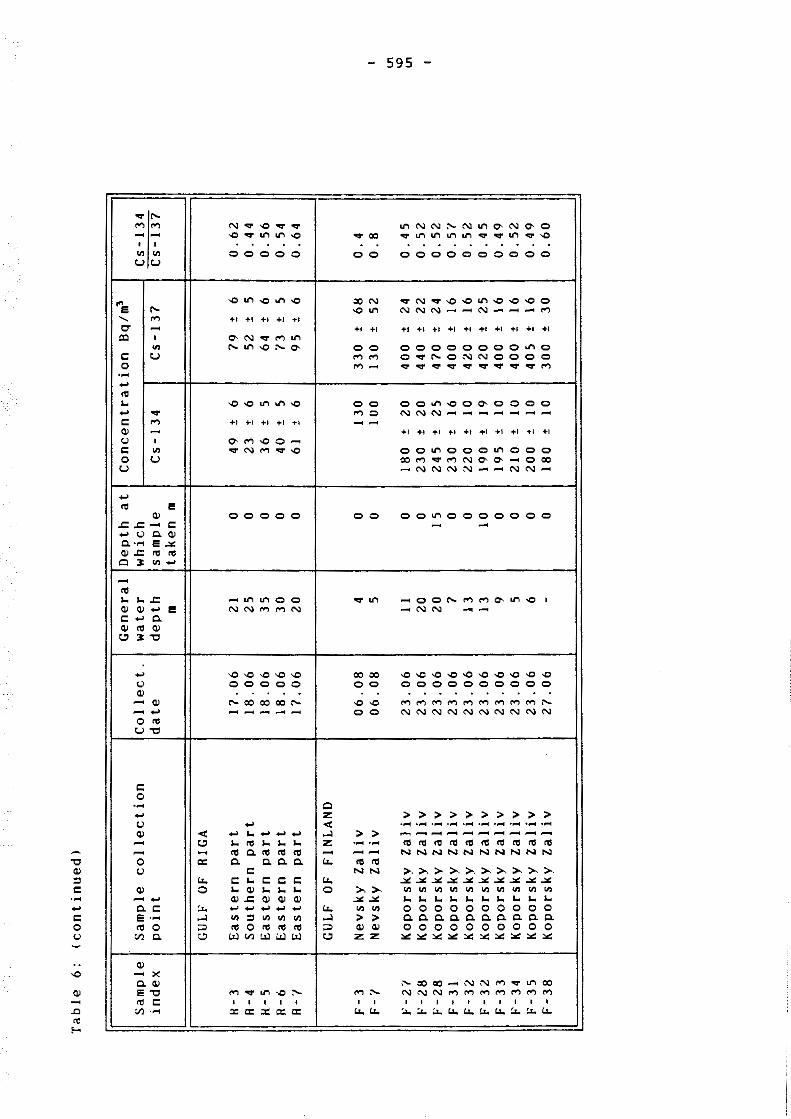
Tab
le
6:
(co
nti
nu
ed
>
Gen
era
l D
ep
th
at
Sam
ple
S
am
ple
co
llecti
on
C
oll
ect.
w
ate
r w
hic
h
ind
ex
p
oin
t d
ate
d
ep
th
sam
ple
m
ta
ken
m
GU
LF
OF
RIG
A
H-3
E
aste
rn
part
1
7.0
6
21
0 R
-4
So
uth
ern
p
art
1
8.0
6
25
0
H-5
E
aste
rn
part
1
8.0
6
35
0
R-6
E
aste
rn
part
1
8.0
6
30
0
R -
"/ E
aste
rn
part
1
7.0
6
20
0
GU
LF
OF
FIN
LA
ND
F-3
N
ev
sky
Z
ali
v
06
.08
4
0 F
-·1
Nev
sky
Z
ali
v
06
.08
5
0
F -
2 '/
Ko
po
rsk
y
Zali
v
23
.06
11
0
F-2
8
Ko
po
rsk
y
Zali
v
23
.06
2
0
0 F
-28
K
op
ors
kv
Z
ali
v
23
.06
2
0
I 5
F-3
1
Ko
po
rsk
y
Zali
v
23
.06
7
0 F
-32
K
op
ors
ky
Z
ali
v
23
.06
I
3 0
F-3
2
Ko
po
rsk
y
Za
1 iv
2
3.0
6
I 3
10
F
-33
K
op
ors
ky
Z
ali
v
23
.06
9
0 F
-34
K
op
ors
ky
Z
ali
v
23
.06
5
0 F
-35
K
op
ors
ky
Z
ali
v
23
.06
6
0 F
-38
K
op
ors
ky
Z
ali
v
27
.06
-
0
Co
ncen
trati
on
B
q/~
Cs-
13
4
Cs-
13
7
49
±
6
79
±
6
23
±
6
52
±
5
36
±
5
64
±
6
40
±
5
'l 3
±
5 61
±
6
95
±
6
13
0
33
0
±
68
1
00
1
30
±
5
2
18
0
±
20
4
00
±
2
4
23
0
±
20
4
40
±
2
2
24
5
±
25
4
70
±
2
4
23
0
±
16
40
0
±
I 6
22
0
±
IO
42
0
±
16
1
90
±
1
9
42
0
±
25
1
95
±
IO
4
00
±
1
6
21
0
±
10
4
00
±
1
6
20
0
±
10
4
05
±
1
6
18
0
±
IO
30
0
±
30
Cs-
13
4
Cs-
13
7
0.6
2
0.4
4
0.5
6
0.5
4
0.6
4
0.4
0
.8
0.4
5
0.5
2
0.5
2
0.
5'/
0
.52
0
. 4
5 0
.49
0
.52
0
.49
0
.60
U1 "' U1

Tab
le
b;
(co
nti
nu
ed
)
Gen
era
l D
ep
th
at
Sam
ple
S
am
ple
co
llecti
on
C
oll
ect.
w
ate
r w
hic
h
ind
ex
p
oin
t d
ate
d
ep
th
sam
ple
m
ta
ken
m
F-2
0
Cen
tral
part
1
4.0
6
64
0
F-2
0
Cen
tral
part
0
2.0
8
64
0
F-2
0
Cen
tral
part
0
2.0
8
64
2
5
F-2
1
Cen
tral
part
1
4.
0 6
70
0
F-2
1
Cen
tral
part
1
4.0
6
70
50
F
-21
C
en
tral
part
0
2.0
8
70
0
F-2
1
Cen
tral
part
0
2.0
8
70
5
0
F-2
3
Cen
tral
part
1
4.
06
8
4
0 F
-23
C
en
tral
part
O
I . 0
8
84
0
F-2
3
Cen
tral
part
O
I.
08
8
4
75
F-2
4
Easte
rn
part
1
4.0
6
80
0
F-2
4
Easte
rn
part
0
1.0
8
80
0
F-2
4
Easte
rn
part
O
I.
08
8
0
75
F
-36
E
aste
rn
part
2
0.0
6
35
0
F-3
7
Easte
rn
part
2
0.0
6
50
0
KU
RSK
Y
ZA
LIV
K-1
C
en
tral
part
2
4.0
7
8 0
K-2
C
en
tral
part
KA
LIN
ING
RA
DS
KY
Z
AL
IV
F-2
4
Easte
rn
part
2
4.0
7
7 0
Co
ncen
trati
on
R
Q/m
~
Cs-
13
4
Cs-
13
7
52
0
±
31
97
0
±
39
3
60
±
5
8
87
0
±
61
21
0
±
23
4
90
±
2
4
39
0
±
23
6
60
±
2
6
23
±
5
.7
·11
±
5.7
4
80
±
6
2
11
00
±
7
7
66
±
1
5 1
60
±
1
6
47
5
±
28
9
10
±
2
7
46
0
±
68
9
30
±
7
5
23
6
6
±
12
45
±
5
97
±
6
32
0
±
60
5
30
±
6
3
33
3
7
±
19
4
2
±
7 1
00
,
6 50
±
6
12
0
±
6
16
3
7
±
8 2
6
±
6 4
3
±
6
32
±
5
83
±
6
mea
n
Cs-
13
4
Cs-
13
7
0.
54
0.4
1
0.4
3
0.5
9
0.3
2
0.4
4
0.
4 1
0.5
2
0.4
9
0.3
5
0.4
7
0.6
0
0.8
7
0.4
2
0.4
2
0.4
2
0.6
1
0.3
9
0.3
8
.
u, "' a,

Tob
ie~:
V
OLU
ME
AC
TIV
ITY
O
F R
AD
ION
UC
LID
ES
IN
T
HE
G
RO
UN
D-L
EV
EL
A
IR
NEA
R
LE
NIN
GR
AD
(2
8
Ap
ril
19
86
)
IL . ..
.. =
=,i
· N
um
ber
I R
ad
ion
ucli
des
I V
olu
me
acti
vit
y
BQ
/m
!i I II !
I 2 3 4 5 6 7 8 9 JO
I I
I 2
I 3
I 4
l '>
16
I
7 1
8
19
2
0
21
22
2
3
24
25
I -
I 3
l N
p-2
39
I
-I
3 2
Te-1
32
Z
a-1
40
B
a-1
40
C
s-1
37
Z
r-9
5
Tc-
99
m
Ce-1
41
I-
13
3
Mo
-99
R
u-1
03
N
b-9
5
Ce-1
44
cs-1
34
N
s-1
47
T
e-1
29
m
Cs-
13
6
U-2
37
T
e-1
29
R
u-1
06
B
e-7
P
u-2
39
,24
0
Pu
-23
8
2.8
4
I .
I 6
0.3
72
0
.36
5
0.3
58
0
. 31
I
0.2
86
0
.?.7
9
0.2
63
0
.26
3
0.2
44
0
.24
0
0.2
33
0
.23
0
0 .
l 51
0
. I
4 0
0.
I 0
0
0.0
53
7
0.0
41
0
0.0
35
5
0.0
34
1
0.0
19
4
0.0
02
22
5
.2
E
-5
1.8
E
-5
II I fJ
l "' _,

I _ 1986
0 - 198'7
!I - b•<1~\..,c.~mrle. Seo-le: 0 - 5 6,1113
- 598 -
lo (3)
-o ®
Fig.I: Samole collection sites and volume activities of Pu-239,240 <bv scale) in the Pripyat-Onieper water svstem in 1986 and 198/

- 599 -
137c8 ,J . . . . .
1t4
. ~ 10 .
( . .
l 10
: .. " .
10 I
.
10 0
.
. I
,-,, ....... -1····1· . . ' . . ·1····1· 10
1'60 11'S 1170 1'7S 1110 lt&S
Fiq.2: Chanoe in averaoe monthlv activitv of Caesium-137 in near-surface air. Leninorad. !959-1986

Bq
~
- 600 -
,,.-----------------~
'~-t---~e..--------------l ' \ I,\ ' ....... ... \
I / '•, ' ..... it- ... I \ •I '• \
.-.· ~. \ I: · .. I : ·. ·, ., , .. ";' \- - - - - - - - - -
l~-f,~·~;7""'~·~·91~·..:--~--~\~·~---------_-_-_-_-_-_-_.:.-~-~-:-:...:-_~_·_J· \•}, '•\ !',
:\
. . "
'•i/ '\\ .._. "· ,,.' •., '•:,.•"', A ; •,1' •\
, ..... \,• ·;.· ..... . •, ...... \ · . .,: ., · .. •, I ...... .. I \
.. . . \\ . .
/-:r------------\~~JPA~'·~......l;~+.----~~·--1 ... . ':\ \ I \ ·•. : ,,. £ .•
'•J \; '•\
\ • .... ..
• I ' I
101-r---------------------_;1.:.\_.JL-~ . . . \ ... i \\1 \J
ltfO 70 0
-·-·Cc· 1~~ .... · Ru-1oi; ---- S<-3o --Cs-13t
fiq.3: Accumulation of individual radionuclides on the earth's surface in the Leningrad area. 1957-1986
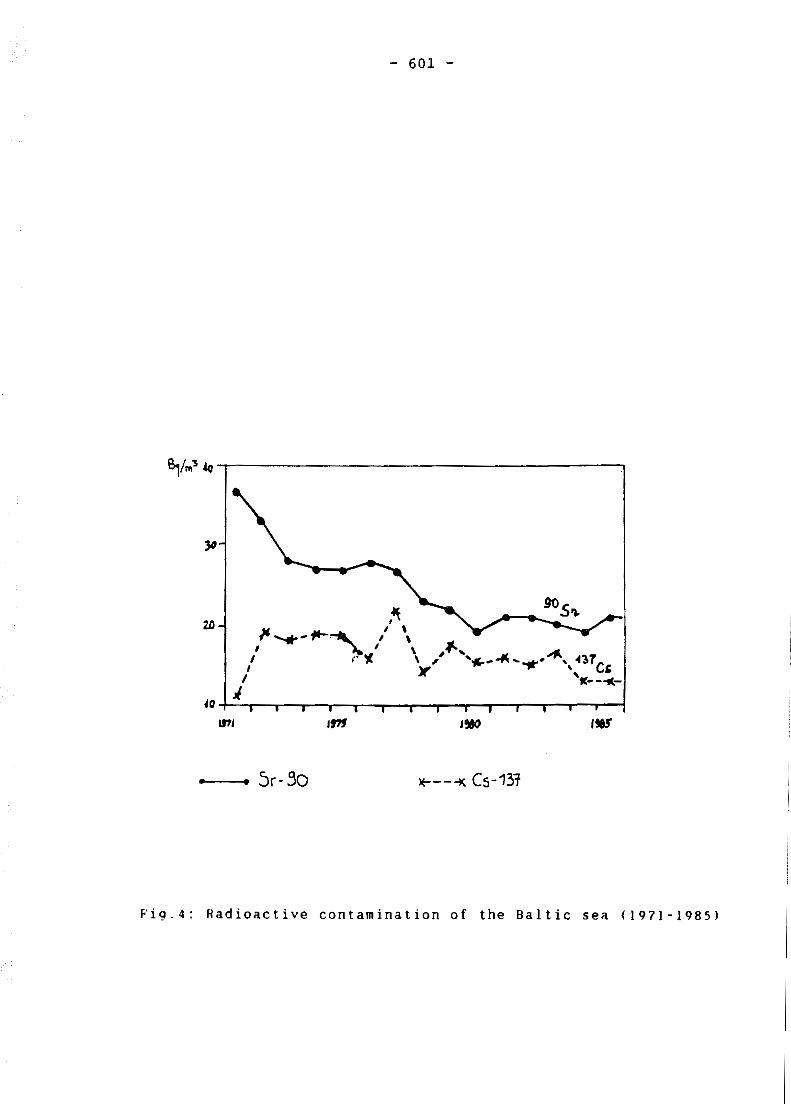
- 601 -
Sr-So *""---l( Cs-13r
Fig.4: Radioactive contamination of the Baltic sea 11971-19851
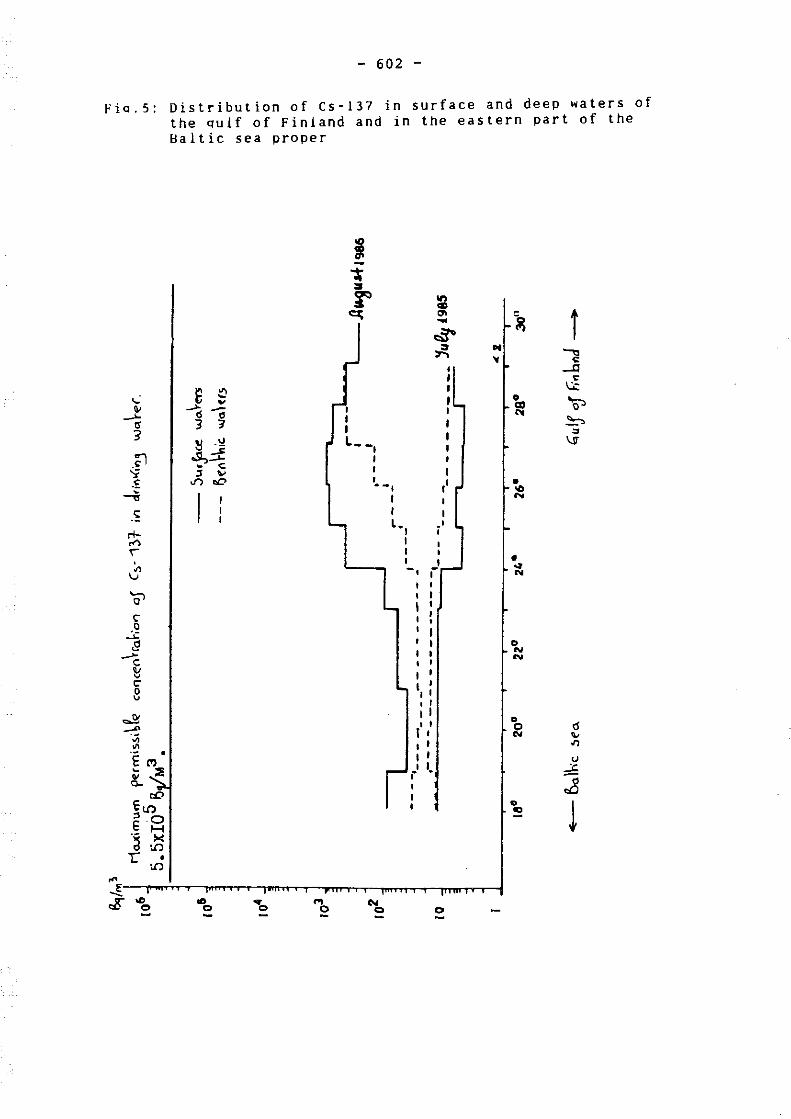
- 602 -
fia.5: Distribution of Cs-137 in surface and deep waters of the qulf of Finland and in the eastern part of the Haltic sea proper
<..: <II ~
t! 3
.~ -; .£ ---,,
-~ ri--"" ' ' ..J o' c ~ s ~ c
11 c: 8
.,.ll: _., ·.;; "' € "'
• ~ :=;: .. 0..
<£.> Eu, s ~ ·~ ><
lO r •
lO
"' ~ cE
.., 0
:!! "' ~ -3 " 3
l:l .!,!
.s.,=:E - c :s "'
.r, "°
tO 0
... 0
; -;\' ::s ~ "' cc ~ a,
~ i ... ~ ~ .. ....,,
~ " • _.Q I " I w::
' 0 'ii> I ~ I
I
I I .'.=;-,
l--, ' "' \JT
I I I I I
r' • --, ,e I N
I l., ·' I I I I I I _, l· -. I ~
I I I
' I
I I
I I I 0 I N
"' I I
I I
I I I I . ' I I
0 t I 0 d I I N "' I I .,.,
I I <) ... '· df
' " I .t:i
• 0
J ~
0

Fig.Sa:
- 603 -
I '
llistribut· qui f ~on of of Finland Cs-137 <Bq/m (June-Aug .ust
) . 1981n6lsurface x
La,l;(e
Laday.
32°
aters of the
60

.;,; ,_I
61\tic Sea
proper
•.
~
S? ·.
(half of
-·-·-·-·-·-·--· ·, • 20
Finland
,' ... ,;
Ale•
25°
B
- 604 -
JO'
USSR
RiTtra: , • Vuo:Cea 2. t:'tTa ), LUe" 4. r; ... rv .. ~ P1r1ta
:,: PJaruu 7. G11uja e. DoU£3'"• 9. v,ntc.
10. B11rta. 11,14. flei:nn 12. P:-•gol 1 ), Vil1Ja 1 5. Cbtrtkha 16. Pl.3U8ea 17. Saba 18, VolkhoT 19. S,je.a 20. Pe.aha 21, Ojat 2:z. s..-1r Lak•a 1
2J, Lado9 .. 24. Kraeoo~tlakot 25, Sa•o:,ro 26, Chullll-:o, 27, Spaa-r.ntorako• 28, Paunkjulaecko• 29, Virlejan )0, Cirmaa )1, Bo.bit•• )2, Trakaj J). Naroch )4, Razli•
Fig,6: Distribution of Cs-137 in lakes and rivers in the Baltic area of the USSR. 1986-1988

rrf>
1o3
1rl-
10
Fig. 'I:
d :,. ~ " z :z
- 605 -
pell'l'liSSi~re Co.,te~~fO.\.;o<J Oj
5.5 x 10s- B1/m>
:!, .g
cl d 41
d ~ c .., ... :!, ... f ·~ d c d ~
el ii: 0. A !II ;,
~ .. ... .. ,. 0.
Content of Cs-137 <Bq/m l in Mav. Julv 1986 compared to background level and maximum oermissibie concentration for drinking water

- 606 -