from Vernacula - International Journal of Built Environment ...
Upload
khangminh22Category
view
3download
0
�����������������
Citation: Liu, L.; Li, Z.; Fu, X.; Liu, X.;
Li, Z.; Zheng, W. Impact of Power on
Uneven Development: Evaluating
Built-Up Area Changes in Chengdu
Based on NPP-VIIRS Images
(2015–2019). Land 2022, 11, 489.
https://doi.org/10.3390/
land11040489
Academic Editors: Pere Serra and
Marta Sapena
Received: 13 February 2022
Accepted: 23 March 2022
Published: 28 March 2022
Publisher’s Note: MDPI stays neutral
with regard to jurisdictional claims in
published maps and institutional affil-
iations.
Copyright: © 2022 by the authors.
Licensee MDPI, Basel, Switzerland.
This article is an open access article
distributed under the terms and
conditions of the Creative Commons
Attribution (CC BY) license (https://
creativecommons.org/licenses/by/
4.0/).
land
Article
Impact of Power on Uneven Development: Evaluating Built-UpArea Changes in Chengdu Based on NPP-VIIRS Images(2015–2019)Long Liu 1, Zhichao Li 2, Xinyi Fu 3, Xuan Liu 3,* , Zehao Li 4 and Wenfeng Zheng 5
1 School of Political Science and Public Administration, East China University of Political Science and Law,Shanghai 200042, China; [email protected]
2 School of International and Public Affairs, Shanghai Jiao Tong University, Shanghai 200240, China;[email protected]
3 School of Public Affairs and Administration, University of Electronic Science and Technology of China,Chengdu 611731, China; [email protected]
4 School of Information Engineering, China University of Geosciences, Beijing 100083, China;[email protected]
5 School of Automation, University of Electronic Science and Technology of China, Chengdu 611731, China;[email protected]
* Correspondence: [email protected]
Abstract: In the context of uneven development studies of China, urban built-up area changesare the index of the impact of power, as the local government is the only party that is able toacquire agricultural land and convert it to construction urban land. Existing studies generally usestatistical data to describe the built-up area changes and struggle to meet the requirement of anupdated and inexpensive monitoring of uneven development, especially for western cities withtight budgets. Open access NPP-VIIRS (Suomi National Polar-orbiting Partnership Visible InfraredImaging Radiometer Suite), NDVI (Normalized Difference Vegetation Index), and nighttime LST(Land Surface Temperature) data ranging from 2015 to 2019 were analyzed with a stratified SVM(Support Vector Machine) method in this study to track urban built-up area changes in Chengdu, oneof the biggest cities in Western China. The SDE (Standard Deviation Ellipse) and Moran’s I werethen applied to evaluate the spatial variations of the built-up area changes. It was revealed that thespatial evolution of built-up area change in Chengdu over the period 2015–2019 demonstrated a“northwest-southeast” spatial expansion pattern, and the change distance in the center of gravity in2018 and 2019 was greater than that from 2015 to 2017, which reflected the faster uneven developmentin 2018 and 2019 in Chengdu. The results were verified with finer resolution Landsat-8 OLI images;the high OA (all larger than 92%) and KAPPA (all larger than 0.6) values showed the accuracy of themethod. The methodology proposed in this study offers a practical way for cities with tight budgetsto monitor uneven development, and this study suggests a further adaption using higher-resolutionremote sensing images and field experiments.
Keywords: uneven developments; urban urban built-up area; Chengdu; NPP-VIIRS
1. Introduction
Uneven development is understood as a basic geographical hallmark of the capitalistmode of production: capital produces unevenness on purpose to generate cycles of accu-mulation [1,2]. The practices to produce and exploit space to the maximum extent cause aremarkable scale of uneven development, especially in some developing countries, suchas China [3]. According to the theory of ‘production of space’, uneven development inone place is both a process and result of the uneven geographical base and developmentalcontext, which are shaped by capital, power, and class [4]. Monitoring the factors that
Land 2022, 11, 489. https://doi.org/10.3390/land11040489 https://www.mdpi.com/journal/land

Land 2022, 11, 489 2 of 21
structure the developmental context becomes important to understand and prevent unevendevelopment [5].
Based on China’s urban development context, Yeung et al. (2019) suggested usingthe built-up (constructed urban land) area as the index of power. This is because the localgovernment is the only buyer of agricultural land and the only seller of construction landin one Chinese city, and is often the main driving force for extending and expanding theconstructed urban land [6]. Yeung et al. (2019) also applied the indexes system to analyzethe uneven development in Jiangsu Province, for which the information of the built-uparea is provided in statistical data. However, the statistics data applied in Jiangsu, a richcoastal province, could hardly be obtained and renewed on time in western cities withtight budgets in China [6]. A new method for the updated and inexpensive monitoring ofbuilt-up areas is, therefore, needed.
Recently, remote sensing information, such as nighttime stable light (NTL) data, hasbecome widely acknowledged as a new resource to objectively reflect the changes in urbandevelopment and the related issues. However, there are two main deficiencies that degradethe accuracy of urban land extracted from NTL data. First, heavy cloud in bad weatherconstrains the precision of the NTL data [7], which needs to be processed in advance.Second, the overflow effects in the urban core areas limit the accuracy identity of the urbanbuilt-up area [8], which needs to be adjusted by other data sources. In response to thegaps above, this paper designed a method to extract the built-up area of Chengdu, a bigcity in Western China with open access NTL data. In detail, the Suomi National Polar-orbiting Partnership Visible Infrared Imaging Radiometer Suite (NPP-VIIRS) NTL data,the Moderate-Resolution Imaging Spectroradiometer (MODIS) Normalized DifferenceVegetation Index (NDVI) data, and the MODIS nighttime Land Surface Temperature (LST)data were utilized, and a stratified support vector machine (SVM) algorithm was applied togain a better evaluation of the built-up area. Additionally, the refined results of the built-uparea were analyzed with Standard Deviation Ellipse (SDE) to track the dynamic change inthe built-up area. Finally, the global and local Moran’s I analysis was employed to explorethe geographic correlation within Chengdu from 2015 to 2019.
2. Literature Reveiew
As a promising remote sensing data source for urban studies, NTL data are an indirectmanifestation of human activities and have been widely used in the study of built-uparea change, environmental problems, socioeconomic development, and many other socio-economic issues. For example, the NTL data can be widely employed in many city-levelor country-level socio-economic affairs, including monitoring urban industrial energyconsumption [9] , detecting the economic development in major cities in the DemocraticPeople’s Republic of Korea (DPRK) [10], and estimating the population trends in prefecture-level cities in China from 1992 to 2018 [11]. In terms of urbanization, the NTL data can notonly evaluate the built-up area change in the major urban agglomerations in China [8], suchas the Yangtze River Delta Urban Agglomeration [12] and the Guangdong-Hong Kong-Macao Greater Bay Area [13], but can also precisely measure the urban shrinkage at thecounty-level city in China [14]. In summary, there are two main kinds of NTL data sourcesthat contain NTL data for different years globally, namely, the Defense Meteorological Satel-lite Program’s Operational Line Scan System (DMSP/OLS) NTL data and the NPP-VIIRSNTL data. Since the DMSP/OLS NTL data are available online earlier than NPP-VIIRS NTLdata, some studies have already employed DMSP/OLS NTL data to study the built-uparea change. For example, Ma et al. (2015) [15] delineated that NTL brightness correlatedwith rural-urban gradients in the process of built-up area change using DMSP/OLS NTLdata. The dynamics of built-up area change in China were described with DMSP/OLSNTL data [16]. Together with remote sensing images, DMSP/OLS NTL data also helpedexamine built-up area change in Chengdu [17].
However, the saturation issue due to the digital number value of DMSP/OLS NTLdata ranging from 0 to 63, limit the performance of DMSP/OSL NTL data in urban built-up

Land 2022, 11, 489 3 of 21
areas [18]. Although some remote sensing image or NDVI data were applied to reduce themistakes of DMSP/OLI NTL data [19], it is still reported that the impact from the variationsin the atmospheric condition may severely impact the effectiveness of the application ofDMSP/OLS in the study of built-up area change [20].
As a new generation of night-time satellite products, NPP-VIIRS NTL data enabledthe daily, monthly, and annual data collection ranging from 2012 to the present. After theNPP-VIIRS NTL data were made available online, a few researchers conducted compar-ative studies between these two NTL data sources [21–23]; their results proved that theperformance of NPP-VIIRS NTL data was outweighed by the DMSP/OLS data in termsof better calibration, a wider dynamic range and the ability to identify thermal sources.For example, the NPP-VIIRS NTL data are highly effective in calibration and validation,which could detect night-time lights spanning from 75° N to 65° S with radiation from3 nW·cm−2·sr−1 to 0.02 W·cm−2·sr−1 [24]. Therefore, the application of NPP-VIIRS NTLdata to study and analyze urban development has drawn much more attention recently.
In addition to the common heavy clouds issue, the overflow effects issue also con-strains the accuracy of NPP-VIIRS NTL data in urban areas [8]. Therefore, increasingresearch has employed other remote sensing data sources as auxiliary data to improve theperformance of NPP-VIIRS NTL data in urban scenarios. For example, the NDVI data andthe nighttime LST data from the MODIS platform, which can effectively distinguish theurban and rural areas, are often employed to improve the accuracy of NPP-VIIRS NTLdata in the urban study area [8,16,25], and their results clearly demonstrate the effects ofthese two auxiliary data sources. Therefore, in this research, we also employed the NDVIdata and the nighttime LST data to improve the accuracy of the NPP-VIIRS NTL datain Chengdu.
In terms of urban-related studies, there are three main methods to extract urban built-up areas based on NTL data, namely, the thresholding, the index, and the supervisedclassification method, as one of the most popular supervised classification methods, strati-fied SVM, can achieve better performance than the thresholding and the index method [24].In addition, according to related research [16,26,27], the extraction results of the stratifiedSVM method demonstrated more accuracy and reliability than other methods. Further-more, as one of the non-parametric machine learning methods [28], SVM can not onlysolve the nonlinear and high dimensional data classification problem [25], but can alsoachieve better performance based on a few training samples [26]. Considering the regionaldiversity, the urban development level varies in different regions, the stratified SVM canclassify unknown pixels at different levels within a specific region precisely by employinga regional-specific stratified method [27]. Therefore, considering the complex situationbetween the boundary of the urban and non-urban areas, the stratified SVM method wasemployed to extract the urban built-up area based on NPP-VIIRS NTL data, NDVI data,and nighttime LST data, following related research [26,27].
In addition, there is not enough research to address the city-level socioeconomic affairsand businesses in Western China, e.g., whether these western cities have expanded dueto the economic growth in recent years in China, or whether these western cities haveshrunk due to people moving to the eastern cities in China. However, it is crucial fordecision-makers to understand the temporal-spatial pattern of western cities in China in atimely and precise manner.
Therefore, this paper extracted the urban built-up area of Chengdu over the period2015-2019 from the NPP-VIIRS NTL data, the NDVI data, and the nighttime LST data usingthe stratified SVM method, coupled with the SDE, to analyze the dynamic characteristics ofthe temporal-spatial variations [29,30]. In addition, the global and local Moran’s I indexesof the economic variation were calculated based on statistical data in the Statistical YearBook from 2015 to 2019 [31].

Land 2022, 11, 489 4 of 21
3. Methodology3.1. Study Area
In this research, the study area chosen was the city of Chengdu (see Figure 1). Chengduis located in southwestern China; its geographic coordinates are 30◦05′–31◦26′ north latitudeand 102◦54′–104◦53′ east longitude.
Figure 1. Location of Chengdu.
It includes 11 urban districts (Jinjiang, Wuhou, Chenghua, Jinniu, Qingyang, Xindu,Longquanyi, Qingbaijiang, Pidu, Wenjiang and Shuangliu), and 9 towns (Pengzhou, Du-jiangyan, Chongzhou, Qionglai, Jianyang, Dayi, Pujiang, Xinjin and Jintang). Chengdu isthe capital city of Sichuan province and plays a vital and indispensable role in WesternChina in terms of politics, economy, and culture. Having a better understanding of theexpansion patterns of Chengdu is conducive to a rational allocation of resources, and abetter design for scientific blueprints of common development. According to the 2020National Census of China, Chengdu’s population was over 20 million people, coveringthe landmass of 14,335 km2, which is one of the largest urban areas in the whole of China.The Gross Domestic Product (GDP) of Chengdu in 2019 was more than CNY 1534 billion,an increase of 8% compared to the previous last year, ranking in the top 10 in the whole

Land 2022, 11, 489 5 of 21
country. As the gateway to Western China and as the major and most important area ofDevelopment Planning of Chengdu and Chongqing Urban Agglomeration released by thecentral government, it is the responsibility of Chengdu to give full play to the functionsof strategic support and exemplary radiation in order to coordinate the socioeconomicdevelopment regionally and also of West China. According to the Chengdu City MasterPlan from 2016 to 2035, the leading role Chengdu should take is to become an open-orientedeconomic highland along the Belt and Road Initiative and hub city internationally. This ledto dense investment in the south and east parts of Chengdu. A new method is needed forthe long-term and close monitoring of uneven development.
3.2. Data Sources
In this paper, the NPP-VIIRS NTL data, with version Annual VNL V2 [7], weredownloaded from the Earth Observation Group website (https://eogdata.mines.edu/products/vnl/ (accessed on 30 September 2021)), which was launched by the NationalAeronautics and Space Administration (NASA), the National Oceanic and AtmosphericAdministration (NOAA) and the U.S. Air Force in 2011; their Suomi-National Polar-orbitingPartnership consists of 22 imaging and radiometric bands and covers wavelengths rangingfrom 0.41 to 12.5 microns, providing the sensor data records, including clouds and seasurface temperature. Their NPP-VIIRS not only performed very well in calibration andvalidation, but could also detect the NTL data spanning from 75° N to 65° S with theradiation from 3 nW·cm−2·sr−1 to 0.02 W·cm−2 ·sr−1 [17]. In addition, the DNB (Day/NightBand) is a component of the VIIRS Instrument onboard Suomi NPP, which makes it possiblefor satellite observation at night in the visible spectrum. Therefore, we extracted their NPP-VIIRS NTL data of Chengdu from 2015 to 2019, which were in 15 arc-second geographicgrids, equal to 500 m spatial resolution.
In addition, the nighttime LST data were collected from the NASA website (https://ladsweb.modaps.eosdis.nasa.gov/ (accessed on 30 September 2021)); the 1000 m spatialresolution 8-day composite nighttime LST data of MODIS (MOD11A2-level3) were em-ployed to distinguish the urban area from other non-urban areas. Following the MaximumValue Composite (MVC) method [16,26,27], the annual nighttime LST images were pro-duced in Chengdu from 2015 to 2019. Furthermore, the MODIS 16-day composite NDVIdata were also obtained from the NASA website, which was at a 250 m spatial resolution.The MVC method was also employed to obtain an annual NDVI image. We resampledthe NPP-VIIRS NTL data, the nighttime LST data, and NDVI data to unify 1000 m spatialresolution for further calculation.
Other auxiliary data include the yearly MODIS Land Cover Type product (MCD12Q1),the Landsat-8 Operational Land Imager (OLI) data, and the socio-economic census dataand administrative boundary data. The MCD12Q1 data were collected from the NASAwebsite (https://ladsweb.modaps.eosdis.nasa.gov/ (accessed on 30 September 2021)),which had a 500m spatial resolution [32]; in addition, the accuracy of the MODIS LandCover Type dataset product was evaluated in China [33]. The high-quality and fine-resolution Landsat images from Landsat-8 OLI data were employed to evaluate the urbanbuilt-up area extraction results, which were downloaded from the Geospatial Data Cloudwebsite (https://www.gscloud.cn/ (accessed on 30 September 2021)), within the Chengduarea (path/row:129-130/38-39). The socioeconomic census data we employed to analyzethe variation were downloaded from the Statistical Database of Economic and SocialDevelopment by the National Knowledge infrastructure of China (https://data.cnki.net/(accessed on 30 September 2021)). The administrative boundaries were downloaded fromthe National Geomatics Center of China in GIS files format (http://www.ngcc.cn/ngcc/(accessed on 30 September 2021)).
The three main data sources, namely, the NPP-VIIRS NTL data, the MODIS NDVIdata, and the MODIS nighttime LST data, are listed in Figure 2. Considering the overfloweffect of the NPP-VIIRS NTL data, the MODIS NDVI data and the MODIS nighttime LSTdata can help the NPP-VIIRS NTL data to distinguish the urban and non-urban areas more

Land 2022, 11, 489 6 of 21
accurately. Therefore, a combination of these three different types of data sources canenable a better understanding of the temporal-spatial characteristics of the urban built-uparea change.
Figure 2. The data of three main data sources in Chengdu from 2015 to 2019.

Land 2022, 11, 489 7 of 21
3.3. Data Processing3.3.1. Workflow
The main process in this research can be divided into three main steps, as it is illustratedin Figure 3 . First, we extracted the urban built-up area based on the stratified SVM methodand then evaluated the accuracy of extraction results based on the Landsat-8 OLI data andMODIS Land Cover data. Second, the SDE analysis method was employed to analyzethe built-up area change pattern of Chengdu from 2015 to 2019. Third, Moran’s indexanalysis was employed to discuss the geographic correlation of urban built-up areas overthe five years.
Figure 3. The flowchart of the proposed research.
3.3.2. Pre-Processing
We resampled the NPP-VIIRS NTL data at 1000 m spatial resolution after down-loading the annual data; then, the administrative regionalization mask was employed toextract the nighttime lights images of Chengdu from 2015 to 2019. The annual NDVI andLST data were obtained based on the MVC method following similar research [19]. Allthree main data were projected to uniform Albers projection with 1000 m resolution.
3.3.3. Stratified SVM-Based Urban Built-Up Areas Extraction
In terms of the urban extraction method [26,27], the main process of the proposedstratified SVM includes three main steps. First, we chose preliminary urban and non-urbantraining samples based on the values of the NTL, the NDVI, and the nighttime LST data;the urban seeds must both have a larger NTL and nighttime LST value than the averagevalue and have a smaller NDVI value than the average value in the Chengdu area, and thenon-urban seeds were selected in the opposite way. Second, based on the training seedsselected in the first step, we applied the stratified SVM classifier to other unknown pixelsin an iterative method. Third, during the loop processing, the pixels identified as urbansamples were placed into the next loop as new urban seeds, and the loop procedure wasstopped until there were more newly assigned urban seeds.
3.3.4. Verification with Landsat-8 OLI Images and Statistics Data
Since an increasing amount of research employs finer resolution images to evaluateurban extraction results, Landsat-8 OLS data with a higher spatial resolution of 30 m wereemployed to illustrate the performance of the proposed urban extraction method. Since the

Land 2022, 11, 489 8 of 21
quality of Landsat-8 OLS data is often influenced by heavy clouds of bad weather, MODISland cover data was employed to adjust the extraction results of cloud cover pixels. Wefirst extracted the urban built-up area of Chengdu based on fine-resolution Landsat-8 data,then resampled the results to the same coarse resolution of 1000 m and compared theseurban extraction results to evaluate the performance of the proposed method.
In detail, we used ENVI software to conduct a supervised classification method,namely, the Maximum Likelihood Estimation method, to extract the urban built-up areaof Chengdu based on the Landsat-8 OLI data. Although the Landsat-8 OLI data have afiner resolution, the quality of the images may be affected by heavy clouds, especially theheavy clouds of subtropical monsoon humid climate in Chengdu. Therefore, we had toreplace the value of some cloud-affected pixels with MODIS land cover data, which alreadyclassify the urban built-up area based on multiple remote sensing data sources.
3.3.5. SDE for the Direction of Built-Up Area Changes
According to related research [34–36], the SDE, which was proposed by Lefever, canreveal the spatial distribution characteristics of geographic elements [37]; the SDE canreflect the geographical spatial characteristics of urban economic elements, as well as theirspatial and temporal distributions based on the center of gravity, the spatial distributionrange and the direction and shape [38]. These geographic and urban economic elementsinclude the urban build-up area, the vegetation coverage, and the other urban land-usetypes. In terms of the urban built-up area, the center of gravity of SDE can reflect therelative position of the built-up area change, and the azimuth of the SDE can represent themain direction of the urban development trend, while the long and short axis lengths canindicate the distribution of urban economic elements. In this research, the SDE was appliedbased on the urban built-up areas extracted by the proposed stratified SVM method; thedetails are described in the functions below.
To apply SDE, we first calculated the gravity center shown
(Xw, Yw) = (∑n
i=1wixi
∑ni=1wi
,∑n
i=1 wiyi
∑ni=1 wi
) (1)
Then we calculated the SDE
SDEx =
√∑n
i=1(xi − x)2
n(2)
SDEy =
√∑n
i=1(yi − y)2
n(3)
Finally, we calculated the
tanθ =(∑n
i=1 xi2 −∑n
i=1 yi2) +
√(∑n
i=1 xi2 −∑n
i=1 yi2)2 + 4(∑n
i=1 xi yi)2
2∑ni=1 xi yi
(4)
Standard deviation of x-axis:
σx =√
2
√∑n
i=1(xi cos θ − yi sin θ)2
n(5)
Standard deviation of y-axis:
σy =√
2
√∑n
i=1(xi sin θ − yi cos θ)2
n(6)

Land 2022, 11, 489 9 of 21
In the Formulas 1-6, Y(xi, yi) is the coordinate of each government in 20 areas inChengdu; (X, Y) is the gravity center; n refers to the number of areas in Chengdu; wirepresents the weight of ith area; xi and yi is the deviation between coordinate and gravitycenter of the ith area.
3.3.6. Spatial Autocorrelation Analysis with Moran’s I
As one of the spatial statistical analysis methods, spatial autocorrelation analysiscan measure the correlation between a certain location and a neighboring location basedon the same geographic features or geographic attribute values [34,36,38]. The globalMoran’s I index, which was introduced by Moran [31], can be employed to evaluate thespatial dependence of statistical geography in the neighboring location [34]. In addition,local Moran’s I index can also be employed to reveal the characteristics of local spatialautocorrelation [34,36]. In terms of location spatial autocorrelation analysis, related researchhas commonly employed both Moran’s scatter plots and spatially linked local indicators(LISA) [36], while the Moran’s scatter plots can represent the spatial connection betweenresearch locations, and the LISA can indicate both the significance of the spatial connectionand the difference between the research locations and neighboring locations. Therefore,global Moran’s I index, local Moran’s scatter plot and the LISA was adopted in this researchto measure the spatial correlation of urban development in Chengdu from 2015 to 2019.The distribution of the values differs from –1 to 1; values ranging from 0 to 1 indicate thatthere is a positive correlation between geographical entities. There is a negative correlationbetween –1 and 0, and there is no correlation if it equals 0.
I =n
∑ni=1 ∑n
j=1wi,j∗
∑ni=1 ∑n
j=1wi,j(xi − x)(xj − x)
∑ni=1(xi − x)2 (7)
In the Formula (7), n means the number of the areas in Chengdu, xi and xj representthe expansion of urban built-up area in certain years from 2015 to 2019 in i area and j area, xis the mean value of the expansion of urban built-up area, wi,j is the spatial weight betweeni and j.
Furthermore, the social and economic census data could be employed to evaluate theextraction results of urban built-up areas. The GDP and population information were alsoused to illustrate the performance of the proposed method in Chengdu over the period2015–2019. The correlation between the extracted urban built-up area and the GDP and thepopulation was demonstrated to verify the extraction results of urban built-up areas.
4. Results4.1. Urban Built-Up Area Changes in Chengdu (2015–2019)
Since the Landsat-8 OLI images have a 30 m spatial resolution, which is better thanthat of the NPP-VIIRS NTL data, the MODIS NDVI data, and the MODIS nighttime LSTdata, we employed the urban built-up area extract from Landsat-8 and MODIS Land Coverdata as the reference data to evaluate the accuracy of the proposed urban extraction method.The overall accuracy (OA) and KAPPA values were employed to measure the performanceof the proposed stratified SVM methods. Details of the evaluation results are listed inTable 1 below.
Table 1. The extraction accuracy.
Years OA KAPPA
2015 92.23% 0.60482016 93.17% 0.65612017 92.83% 0.64452018 92.69% 0.65192019 92.74% 0.6588

Land 2022, 11, 489 10 of 21
In Table 1, first, all the OA values are larger than 92% from 2015 to 2019, whichillustrates the accuracy of the proposed method. Second, all the KAPPA values are morethan 0.6, which can indicate the high correlation between the urban built-up area extractedby the proposed stratified SVM method and the urban built-up area extracted by Landsat-8OLI and MODIS Land Cover data.
The confusion matrix of the urban built-up areas was extracted using the stratifiedSVM method from 2015 to 2019, as shown in Table 2. The urban built-up areas extractedfrom Landsat-8 OLI data and MODIS land cover data were used as the reference dataand reprojected to 1000 m spatial resolution. A total of 14,259 sampling pixels werecollected as validation data. The overall accuracy was larger than 92% from 2015 to 2019.After comparison with existing related research [16,25–27], the accuracy of the results couldbe accepted at the city level in Western China.
Table 2. The confusion matrix in Chengdu from 2015 to 2019.
References Urban
2015 Urban areas Non-urban areas Row total User’s accuracy (%)
Extracted urbanUrban areas 1022 576 1598 63.95Non-urban areas 532 12,129 12,661 95.80Column total 1554 12,705 14,259
Producer’s accuracy (%) 65.77 95.47 OA = 92.23
2016 Urban areas Non-urban areas Row total User’s accuracy (%)
Extracted urbanUrban areas 1107 517 1624 68.17Non-urban areas 457 12,178 12,635 96.38Column total 1564 12,695 14,259
Producer’s accuracy (%) 70.78 95.93 OA = 93.17
2017 Urban areas Non-urban areas Row total User’s accuracy (%)
Extracted urbanUrban areas 1112 541 1653 67.27Non-urban areas 481 12,125 12,606 96.18Column total 1593 12,666 14,259
Producer’s accuracy (%) 69.81 95.73 OA = 92.83
2018 Urban areas Non-urban areas Row total User’s accuracy (%)
Extracted urbanUrban areas 1178 558 1736 67.86Non-urban areas 485 12,038 12,523 98.28Column total 1663 12,596 14,259
Producer’s accuracy (%) 70.84 95.57 OA = 92.69
2019 Urban areas Non-urban areas Row total User’s accuracy (%)
Extracted
urban
Urban areas 1209 547 1756 68.85Non-urban areas 488 12,015 12,503 96.10Column total 1697 12,562 14,259
Producer’s accuracy (%) 71.24 95.65 OA = 92.74
In Table 2, the urban built-up area in Chengdu extracted using the stratified SVMmethod gradually increased from 1598 pixels in 2015 to 1756 pixels in 2019, which isconsistent with the results in [16,25], which indicate that the urban built-up areas ofChengdu increased from 1992 to 2012.
Furthermore, the details of urban extraction results from 2015 to 2019 are listed inFigure 4 below.

Land 2022, 11, 489 11 of 21
Figure 4. Urban built-up area change of Chengdu.

Land 2022, 11, 489 12 of 21
As illustrated in Figure 4, the green pixels increased gradually from 2015 to 2019, whichclearly reflects the stable urban built-up area increases over the five years; to better representthe development of the urban built-up area, we combine the change of the extracted urbanbuilt-up area of the five years into a single graph, as shown in Figure 5 below.
Figure 5. Change of extracted urban built-up areas in Chengdu.
As demonstrated in Figure 5, four different colors indicate the change of extractedurban built-up areas in Chengdu from 2015 to 2019. The pink color pixels, the blue colorpixel, the green color pixels, and the red color pixels represent the urban built-up areaincrease during 2015–2016, 2016–2017, 2017–2018, and 2018–2019, respectively. This canalso demonstrate the growth of the urban built-up area in Chengdu during these five years.
4.2. Direction of Urban Built-Up Area Changes in Chengdu (2015–2019)
According to the urban built-up area extraction results, the distribution of theseurban built-up areas is extremely unbalanced, for instance, most urban built-up areas areconcentrated in Jinjiang, Qingyang, Jinniu, Wuhou, and Chenghua districts; meanwhile,other districts have relatively fewer urban built-up area. This unbalanced distribution ofextracted urban built-up areas illustrates the uneven development of different districts inChengdu over the five years.
In terms of specific urban built-up areas in 20 different districts in Chengdu, the ex-tracted urban built-up areas are listed in Figure 6 below. All the extracted urban built-upareas of different districts in Chengdu increased stably from 2015 to 2019. However, somedistricts increased slowly, while other districts increased quickly, for instance, the urbanbuilt-up area in Xindu, Shuangliu and Pidu districts grew faster than other districts inChengdu over the five years. These unbalanced growth of the urban built-up area indifferent districts can also clearly demonstrate the uneven development between differentdistricts in Chengdu over the five years.

Land 2022, 11, 489 13 of 21
Figure 6. Extracted urban built-up area in different districts in Chengdu.
To further analyze the pattern of urban built-up areas in Chengdu over the period2015–2019, the SDE method was employed to explore the spatial distribution and evolutionpattern of urban growth in Chengdu from 2015 to 2019. The details of the SDE method arelisted in Table 3, Figures 7 and 8, respectively, as below.
Table 3. Standard Deviation Ellipse data of the urban built-up area in Chengdu.
Years Center Coordinates Length of LongAxis (km)
Length of ShortAxis (km)
Area of theEllipse (km2)
2015 (103.57 E, 30.42 N) 44.75 36.99 52002016 (103.58 E, 30.42 N) 45.09 37.19 52682017 (103.58 E, 30.42 N) 45.97 37.75 54502018 (103.58 E, 30.41 N) 46.22 38.11 55332019 (103.58 E, 30.41 N) 47.24 38.03 5643
The results of SDE analysis indicate that the spatial evolution of built-up area changein Chengdu over the period 2015–2019 demonstrated a “northwest-southeast” spatialexpansion pattern. Over the five years, the change in the length of the long axis was greaterthan that of the length of the short axis, which indicated that the stronger urban extensiontrends followed the north to south direction. The length of the long axis, the length ofthe short axis, and the area of the SDE ellipse gradually increased from 2015 to 2019,which correlates with the stable growth of the extracted urban built-up areas in Chengdu.The increase in SDE ellipse was relatively slower from 2015 to 2016 than that from 2017 to2019, which also corresponds with the socioeconomic census data.
Considering the gravity change in the urban built-up area in Chengdu from 2015 to2019, as illustrated in Figure 8, all the centers of gravity of urban built-up areas were locatedin Qingyang district over the five years. In detail, the evolution of the center of gravitymainly followed the north to south direction, and only the center of gravity deviated to thesouthwest to some extent in 2018, which also reflects the socioeconomic census data overthe five years in Chengdu. In addition, the change distance of the center of gravity in 2018and 2019 was greater than that from 2015 to 2017, which reflected the faster urbanization in2018 and 2019 in Chengdu.

Land 2022, 11, 489 14 of 21
Figure 7. Standard Deviation Ellipse data of the urban built-up area in Chengdu.
Figure 8. Center of gravity of urban built-up area in Chengdu.

Land 2022, 11, 489 15 of 21
4.3. Relations between the Spatial Variations in Chengdu
In order to further explore the built-up area change pattern in Chengdu, the spatialautocorrelation analysis method was also employed to study the spatial autocorrelationpattern from 2015 to 2019. In detail, global Moran’s I index, the local Moran’s scatter plotand the spatial local indication of spatial association (LISA) cluster map were employedto unveil the spatial autocorrelation pattern of the urban extension from 2015 to 2019.In addition, the calculated results are demonstrated in Table 4 and Figure 9 as follows.As presented in Table 4, all the p values were significantly lower than 0.001, which not onlyproves that global Moran’s I index passed the significance test, but also shows that theurban evolution in Chengdu from 2015 to 2019 was clustered. In addition, global Moran’sI indexes were all positive and larger than 0.5, which clearly illustrates a high spatialcorrelation. Although both the global Moran’s I index value and the z value decreasedfrom 2015 to 2017, both of them increased and were larger than those in 2015, whichcan demonstrate that the overall spatial correlation became stronger with urban spatialextension, even with fluctuations in some years. Local Moran’s scatter plot and the LISAcluster map were adopted to further investigate the local spatial correlation in 20 differentdistricts in Chengdu from 2015 to 2019; the details are listed in Figure 9.
Table 4. Global Moran’s I index.
Years Global Moran’s IIndex z Value p Value
2015 0.530 4.001 <0.0012016 0.529 3.997 <0.0012017 0.523 3.947 <0.0012018 0.538 4.078 <0.0012019 0.544 4.113 <0.001
The local Moran’s scatter plot changed from 2015 to 2019, which reflects the changein local spatial correlations in Chengdu. From 2015 to 2017, the slope of the local Moran’sscatter plot line decreased as the Moran’s I value decreased from 0.530 to 0.523, whichshows that the spatial correlation reduced with the built-up area change in these years.However, the slope of the local Moran’s scatter plot line increased from 2018 to 2019and was larger than that in 2015, which demonstrates that the spatial correlation becamestronger with the urban extension from 2018 to 2019. In addition, the LISA cluster map wasthe same from 2015 to 2019, which showed a stable cluster pattern among different districtsin Chengdu over the five years. The “High-High” clusters, which include six districts,namely, Jinjiang, Qingyang, Jinniu, Wuhou, Chenghua and Shuangliu districts, are locatedin the central and south parts of Chengdu. These districts all have relatively larger urbanbuilt-up areas, a greater population and a higher GDP than other districts in Chengdu.Meanwhile, the “Low-Low” cluster, which includes two districts, namely, Qionglai andDayi districts, is located in the west parts of Chengdu; these two districts are relativelyslower in urbanization, with smaller urban built-up areas, a lower population, and a lowerGDP than other districts in Chengdu.

Land 2022, 11, 489 16 of 21
Figure 9. Local Moran’s scatter plot and LISA cluster map.
Land 2022, 11, 489 17 of 21
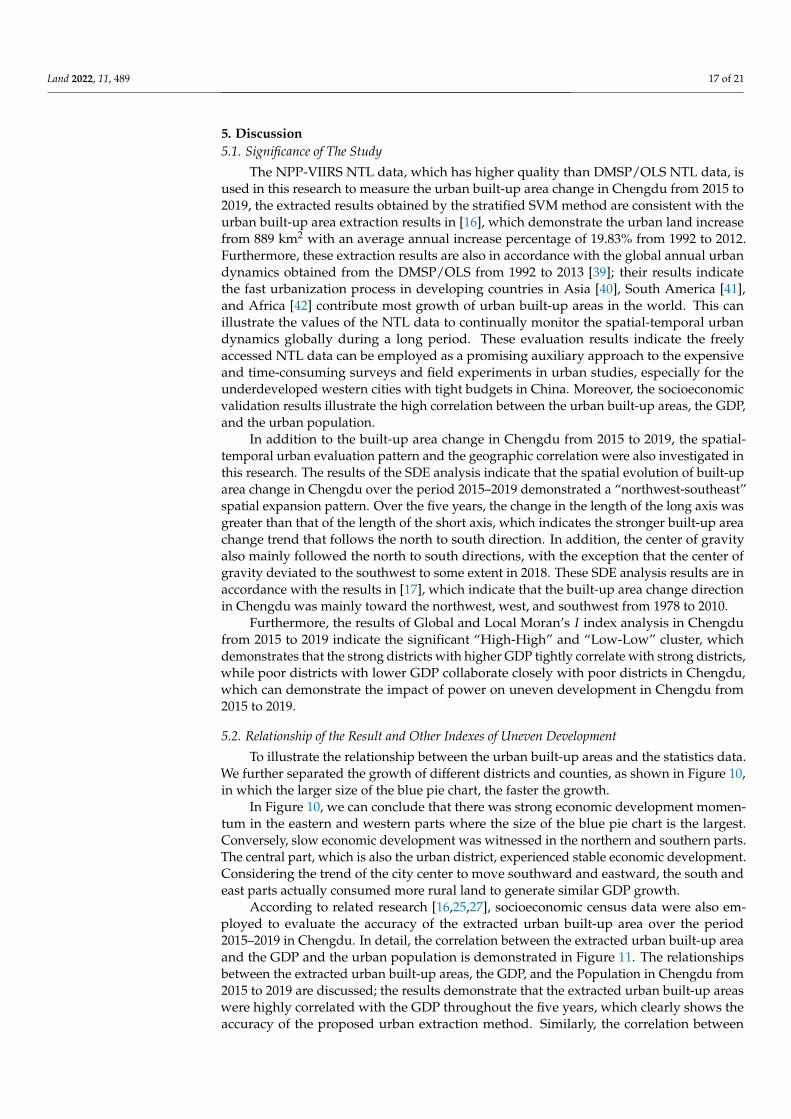
5. Discussion5.1. Significance of The Study
The NPP-VIIRS NTL data, which has higher quality than DMSP/OLS NTL data, isused in this research to measure the urban built-up area change in Chengdu from 2015 to2019, the extracted results obtained by the stratified SVM method are consistent with theurban built-up area extraction results in [16], which demonstrate the urban land increasefrom 889 km2 with an average annual increase percentage of 19.83% from 1992 to 2012.Furthermore, these extraction results are also in accordance with the global annual urbandynamics obtained from the DMSP/OLS from 1992 to 2013 [39]; their results indicatethe fast urbanization process in developing countries in Asia [40], South America [41],and Africa [42] contribute most growth of urban built-up areas in the world. This canillustrate the values of the NTL data to continually monitor the spatial-temporal urbandynamics globally during a long period. These evaluation results indicate the freelyaccessed NTL data can be employed as a promising auxiliary approach to the expensiveand time-consuming surveys and field experiments in urban studies, especially for theunderdeveloped western cities with tight budgets in China. Moreover, the socioeconomicvalidation results illustrate the high correlation between the urban built-up areas, the GDP,and the urban population.
In addition to the built-up area change in Chengdu from 2015 to 2019, the spatial-temporal urban evaluation pattern and the geographic correlation were also investigated inthis research. The results of the SDE analysis indicate that the spatial evolution of built-uparea change in Chengdu over the period 2015–2019 demonstrated a “northwest-southeast”spatial expansion pattern. Over the five years, the change in the length of the long axis wasgreater than that of the length of the short axis, which indicates the stronger built-up areachange trend that follows the north to south direction. In addition, the center of gravityalso mainly followed the north to south directions, with the exception that the center ofgravity deviated to the southwest to some extent in 2018. These SDE analysis results are inaccordance with the results in [17], which indicate that the built-up area change directionin Chengdu was mainly toward the northwest, west, and southwest from 1978 to 2010.
Furthermore, the results of Global and Local Moran’s I index analysis in Chengdufrom 2015 to 2019 indicate the significant “High-High” and “Low-Low” cluster, whichdemonstrates that the strong districts with higher GDP tightly correlate with strong districts,while poor districts with lower GDP collaborate closely with poor districts in Chengdu,which can demonstrate the impact of power on uneven development in Chengdu from2015 to 2019.
5.2. Relationship of the Result and Other Indexes of Uneven Development
To illustrate the relationship between the urban built-up areas and the statistics data.We further separated the growth of different districts and counties, as shown in Figure 10,in which the larger size of the blue pie chart, the faster the growth.
In Figure 10, we can conclude that there was strong economic development momen-tum in the eastern and western parts where the size of the blue pie chart is the largest.Conversely, slow economic development was witnessed in the northern and southern parts.The central part, which is also the urban district, experienced stable economic development.Considering the trend of the city center to move southward and eastward, the south andeast parts actually consumed more rural land to generate similar GDP growth.
According to related research [16,25,27], socioeconomic census data were also em-ployed to evaluate the accuracy of the extracted urban built-up area over the period2015–2019 in Chengdu. In detail, the correlation between the extracted urban built-up areaand the GDP and the urban population is demonstrated in Figure 11. The relationshipsbetween the extracted urban built-up areas, the GDP, and the Population in Chengdu from2015 to 2019 are discussed; the results demonstrate that the extracted urban built-up areaswere highly correlated with the GDP throughout the five years, which clearly shows theaccuracy of the proposed urban extraction method. Similarly, the correlation between

Land 2022, 11, 489 18 of 21
urban built-up areas and the urban population was calculated in Chengdu from 2015 to2019; the results illustrate that the extracted urban built-up areas had a strong correlationwith the urban population, which also clearly indicates the performance of the proposedresearch method.
Figure 10. The quantitative analysis of GDP growth rate from 2015 to 2019.
Figure 11. The correlation between built-up area and GDP/urban population.
In terms of [43], uneven development is not only reflected by urban built-up areas,but also represented in other fields, such as investment and urban population. Therefore,this research tries to visualize the changing pattern of GDP and urban population, and com-pares it with the evolution pattern of urban built-up areas. The evaluation results illustratethe same evolution pattern between built-up areas, the GDP, and the urban population. Thiscan also prove the uneven development in Chengdu during these five years. Furthermore,how to design a scientific spatial-temporal monitoring system with multiple parameters ofuneven development is vital for future studies.
5.3. Limitations and Future Research
There are some limitations in this research that must be addressed in future research.For example, the urban extraction in this research was mainly based on the NPP-VIIRSNTL data, the NDVI data and the nighttime LST data; their spatial resolution may nothave been high enough for the complex urban scenario. Recently, some research hasalready tried to extract urban built-up areas based on the high-resolution Landsat data [44].

Land 2022, 11, 489 19 of 21
Therefore, future research should be based on remote sensing information with higherspatial resolution. Furthermore, since the quality of remote sensing images is highlyvulnerable due to the clouds and weather conditions, the weather in Chengdu, like atypical city in Western China, may constrain the performance of remote sensing methods;therefore, more field experiments for urban coverage and urban land use in urban built-upareas are also required in future related studies to improve the accuracy of the urbanbuilt-up area change.
6. Conclusions
Complex human behaviors dramatically affect the urban environment and urbanland exploitation; therefore, a timely and accurate understanding of the spatial-temporalexpansion pattern of cities is crucial for better urban living and sustainable urban develop-ment. The spatial-temporal urban development characteristics of Chengdu over the period2015–2019 were explored in this paper. The extension of urban built-up area, the spatialevolution of built-up area change and the geographic spatial correlation within Chengduwere investigated. The results demonstrated in this research could supply useful referencesand guidance for urban land use and urban management in western cities.
This research tried to measure the built-up area change pattern, especially the spatialevaluation pattern of urban built-up area change and the geographic spatial correlationpattern, in Chengdu from 2015 to 2019. A stratified SVM method for the urban built-uparea extraction method was presented. Remote sensing information, mainly including theNTL data, the NDVI data, and the nighttime LST data, was employed to extract the urbanbuilt-up area. Based on the SDE and Moran’s index analysis, the built-up area changepattern, the spatial evaluation pattern and the spatial correlation pattern were discussed.
The timely and accurate measurement of the spatial-temporal pattern of urban evolu-tion is vital for urban construction and planning, especially for underdeveloped westerncities in China. The scientific measurement and understanding of the built-up area changepattern are crucial for efficient land usage decisions and urban management planning.
Author Contributions: Conceptualization, L.L., Z.L. (Zehao Li) and X.L.; methodology, Z.L. (ZehaoLi); software, X.F.; validation, L.L., X.L. and W.Z.; formal analysis, Z.L. (Zhichao Li) and W.Z.; writing—original draft preparation, L.L. and X.L.; writing—review and editing, X.L. and W.Z.; visualization,Z.L. (Zhichao Li); funding acquisition, L.L., X.L., Z.L. (Zehao Li) and W.Z. All authors have read andagreed to the published version of the manuscript.
Funding: This work was funded by the Ministry of Education through the Humanities and SocialScience project [Grant No. 19YJC630104]; the UESTC Funds for Important Social Science Research[Grant No. 2021FRJHZD003]; and the National Natural Science Foundation of China [Grant No.71974057, and Grant No. 72071031].
Institutional Review Board Statement: Not applicable.
Informed Consent Statement: Not applicable.
Data Availability Statement: Not applicable.
Conflicts of Interest: The authors declare no conflict of interest.
References1. Harvey, D. Social Justice and the City; University of Georgia Press: Athens, GA, USA, 2010; Volume 1.2. Smith, N. Toward a theory of gentrification a back to the city movement by capital, not people. J. Am. Plan. Assoc. 1979,
45, 538–548. [CrossRef]3. Lin, G.C. Chinese urbanism in question: State, society, and the reproduction of urban spaces. Urban Geogr. 2007, 28, 7–29.
[CrossRef]4. Ye, C.; Chen, M.; Chen, R.; Guo, Z. Multi-scalar separations: Land use and production of space in Xianlin, a university town in
Nanjing, China. Habitat Int. 2014, 42, 264–272. [CrossRef]5. Li, Z.; Li, X.; Wang, L. Speculative urbanism and the making of university towns in China: A case of Guangzhou University
Town. Habitat Int. 2014, 44, 422–431. [CrossRef]

Land 2022, 11, 489 20 of 21
6. Yeung, H.W.c. Rethinking mechanism and process in the geographical analysis of uneven development. Dialogues Hum. Geogr.2019, 9, 226–255. [CrossRef]
7. Elvidge, C.D.; Zhizhin, M.; Ghosh, T.; Hsu, F.C.; Taneja, J. Annual time series of global VIIRS nighttime lights derived frommonthly averages: 2012 to 2019. Remote Sens. 2021, 13, 922. [CrossRef]
8. Zheng, Y.; He, Y.; Zhou, Q.; Wang, H. Quantitative Evaluation of Urban Expansion using NPP-VIIRS Nighttime Light andLandsat Spectral Data. Sustain. Cities Soc. 2022, 76, 103338. [CrossRef]
9. Gao, K.; Yuan, Y. Spatiotemporal pattern assessment of China’s industrial green productivity and its spatial drivers: Evidencefrom city-level data over 2000–2017. Appl. Energy 2022, 307, 118248. [CrossRef]
10. Jiang, L.; Liu, Y.; Wu, S.; Yang, C. Study on Urban Spatial Pattern Based on DMSP/OLS and NPP/VIIRS in Democratic People’sRepublic of Korea. Remote Sens. 2021, 13, 4879. [CrossRef]
11. You, H.; Yang, J.; Xue, B.; Xiao, X.; Xia, J.; Jin, C.; Li, X. Spatial evolution of population change in Northeast China during1992–2018. Sci. Total Environ. 2021, 776, 146023. [CrossRef]
12. Yu, M.; Guo, S.; Guan, Y.; Cai, D.; Zhang, C.; Fraedrich, K.; Liao, Z.; Zhang, X.; Tian, Z. Spatiotemporal Heterogeneity Analysisof Yangtze River Delta Urban Agglomeration: Evidence from Nighttime Light Data (2001–2019). Remote Sens. 2021, 13, 1235.[CrossRef]
13. Zheng, Y.; Tang, L.; Wang, H. An improved approach for monitoring urban built-up areas by combining NPP-VIIRS nighttimelight, NDVI, NDWI, and NDBI. J. Clean. Prod. 2021, 328, 129488. [CrossRef]
14. Zhou, Y.; Li, C.; Zheng, W.; Rong, Y.; Liu, W. Identification of urban shrinkage using NPP-VIIRS nighttime light data at the countylevel in China. Cities 2021, 118, 103373. [CrossRef]
15. Ma, T.; Zhou, Y.; Zhou, C.; Haynie, S.; Pei, T.; Xu, T. Night-time light derived estimation of spatio-temporal characteristics ofurbanization dynamics using DMSP/OLS satellite data. Remote Sens. Environ. 2015, 158, 453–464. [CrossRef]
16. He, C.; Liu, Z.; Tian, J.; Ma, Q. Urban expansion dynamics and natural habitat loss in China: A multiscale landscape perspective.Glob. Chang. Biol. 2014, 20, 2886–2902. [CrossRef] [PubMed]
17. Peng, W.; Wang, G.; Zhou, J.; Zhao, J.; Yang, C. Studies on the temporal and spatial variations of urban expansion in Chengdu,western China, from 1978 to 2010. Sustain. Cities Soc. 2015, 17, 141–150. [CrossRef]
18. Ma, L.; Wu, J.; Li, W.; Peng, J.; Liu, H. Evaluating saturation correction methods for DMSP/OLS nighttime light data: A casestudy from China’s cities. Remote Sens. 2014, 6, 9853–9872. [CrossRef]
19. Xiao, P.; Wang, X.; Feng, X.; Zhang, X.; Yang, Y. Detecting China’s urban expansion over the past three decades using nighttimelight data. IEEE J. Sel. Top. Appl. Earth Obs. Remote Sens. 2014, 7, 4095–4106. [CrossRef]
20. Wei, Y.; Liu, H.; Song, W.; Yu, B.; Xiu, C. Normalization of time series DMSP-OLS nighttime light images for urban growthanalysis with pseudo invariant features. Landsc. Urban Plan. 2014, 128, 1–13. [CrossRef]
21. Elvidge, C.D.; Baugh, K.E.; Zhizhin, M.; Hsu, F.C. Why VIIRS data are superior to DMSP for mapping nighttime lights. Proc.Asia-Pac. Adv. Netw. 2013, 35, 62. [CrossRef]
22. Shi, K.; Yu, B.; Huang, Y.; Hu, Y.; Yin, B.; Chen, Z.; Chen, L.; Wu, J. Evaluating the ability of NPP-VIIRS nighttime light datato estimate the gross domestic product and the electric power consumption of China at multiple scales: A comparison withDMSP-OLS data. Remote Sens. 2014, 6, 1705–1724. [CrossRef]
23. Xie, Y.; Weng, Q.; Weng, A. A comparative study of NPP-VIIRS and DMSP-OLS nighttime light imagery for derivation of urbandemographic metrics. In Proceedings of the 2014 Third International Workshop on Earth Observation and Remote SensingApplications (EORSA), Changsha, China, 11–14 June 2014; pp. 335–339.
24. Dou, Y.; Liu, Z.; He, C.; Yue, H. Urban land extraction using VIIRS nighttime light data: An evaluation of three popular methods.Remote Sens. 2017, 9, 175. [CrossRef]
25. Xu, M.; He, C.; Liu, Z.; Dou, Y. How did urban land expand in China between 1992 and 2015? A multi-scale landscape analysis.PLoS ONE 2016, 11, e0154839. [CrossRef]
26. Cao, X.; Chen, J.; Imura, H.; Higashi, O. A SVM-based method to extract urban areas from DMSP-OLS and SPOT VGT data.Remote Sens. Environ. 2009, 113, 2205–2209. [CrossRef]
27. Yang, Y.; He, C.; Zhang, Q.; Han, L.; Du, S. Timely and accurate national-scale mapping of urban land in China using DefenseMeteorological Satellite Program’s Operational Linescan System nighttime stable light data. J. Appl. Remote Sens. 2013, 7, 073535.[CrossRef]
28. Vapnik, V. The Nature of Statistical Learning Theory; Springer Science & Business Media: Springer: Cham, Switzerland, 1999.29. Lu, C.; Li, L.; Lei, Y.; Ren, C.; Su, Y.; Huang, Y.; Chen, Y.; Lei, S.; Fu, W. Coupling Coordination Relationship between Urban
Sprawl and Urbanization Quality in the West Taiwan Strait Urban Agglomeration, China: Observation and Analysis fromDMSP/OLS Nighttime Light Imagery and Panel Data. Remote Sens. 2020, 12, 3217. [CrossRef]
30. Wang, X.; Cong, P.; Jin, Y.; Jia, X.; Wang, J.; Han, Y. Assessing the Effects of Land Cover Land Use Change on PrecipitationDynamics in Guangdong–Hong Kong–Macao Greater Bay Area from 2001 to 2019. Remote Sens. 2021, 13, 1135. [CrossRef]
31. Moran, P.A. The interpretation of statistical maps. J. R. Stat. Soc. Ser. B (Methodol.) 1948, 10, 243–251. [CrossRef]32. Sulla-Menashe, D.; Gray, J.M.; Abercrombie, S.P.; Friedl, M.A. Hierarchical mapping of annual global land cover 2001 to present:
The MODIS Collection 6 Land Cover product. Remote Sens. Environ. 2019, 222, 183–194. [CrossRef]33. Yang, Y.; Xiao, P.; Feng, X.; Li, H. Accuracy assessment of seven global land cover datasets over China. ISPRS J. Photogramm.
Remote Sens. 2017, 125, 156–173. [CrossRef]

Land 2022, 11, 489 21 of 21
34. Zhong, Y.; Lin, A.; He, L.; Zhou, Z.; Yuan, M. Spatiotemporal dynamics and driving forces of urban land-use expansion: A casestudy of the Yangtze River economic belt, China. Remote Sens. 2020, 12, 287. [CrossRef]
35. Guo, L.; Gong, H.; Ke, Y.; Zhu, L.; Li, X.; Lyu, M.; Zhang, K. Mechanism of Land Subsidence Mutation in Beijing Plain under theBackground of Urban Expansion. Remote Sens. 2021, 13, 3086. [CrossRef]
36. Zhong, Y.; Lin, A.; Xiao, C.; Zhou, Z. Research on the Spatio-Temporal Dynamic Evolution Characteristics and Influencing Factorsof Electrical Power Consumption in Three Urban Agglomerations of Yangtze River Economic Belt, China Based on DMSP/OLSNight Light Data. Remote Sens. 2021, 13, 1150. [CrossRef]
37. Lefever, D.W. Measuring geographic concentration by means of the standard deviational ellipse. Am. J. Sociol. 1926, 32, 88–94.[CrossRef]
38. Yuan, J.; Bian, Z.; Yan, Q.; Gu, Z.; Yu, H. An approach to the temporal and spatial characteristics of vegetation in the growingseason in Western China. Remote Sens. 2020, 12, 945. [CrossRef]
39. Zhou, Y.; Li, X.; Asrar, G.R.; Smith, S.J.; Imhoff, M. A global record of annual urban dynamics (1992–2013) from nighttime lights.Remote Sens. Environ. 2018, 219, 206–220. [CrossRef]
40. Zhou, N.; Hubacek, K.; Roberts, M. Analysis of spatial patterns of urban growth across South Asia using DMSP-OLS nighttimelights data. Appl. Geogr. 2015, 63, 292–303. [CrossRef]
41. Andrade-Núñez, M.J.; Aide, T.M. Built-up expansion between 2001 and 2011 in South America continues well beyond the cities.Environ. Res. Lett. 2018, 13, 084006. [CrossRef]
42. Jiang, S.; Wei, G.; Zhang, Z.; Wang, Y.; Xu, M.; Wang, Q.; Das, P.; Liu, B. Detecting the Dynamics of Urban Growth in Africa UsingDMSP/OLS Nighttime Light Data. Land 2020, 10, 13. [CrossRef]
43. Ye, C.; Chen, M.; Duan, J.; Yang, D. Uneven development, urbanization and production of space in the middle-scale region basedon the case of Jiangsu province, China. Habitat Int. 2017, 66, 106–116. [CrossRef]
44. Liu, X.; Huang, Y.; Xu, X.; Li, X.; Li, X.; Ciais, P.; Lin, P.; Gong, K.; Ziegler, A.D.; Chen, A.; et al. High-spatiotemporal-resolutionmapping of global urban change from 1985 to 2015. Nat. Sustain. 2020, 3, 564–570. [CrossRef]
Copyright © 2022 FDOKUMEN