The Crystallography of Aluminium and its Alloys - arXiv
93
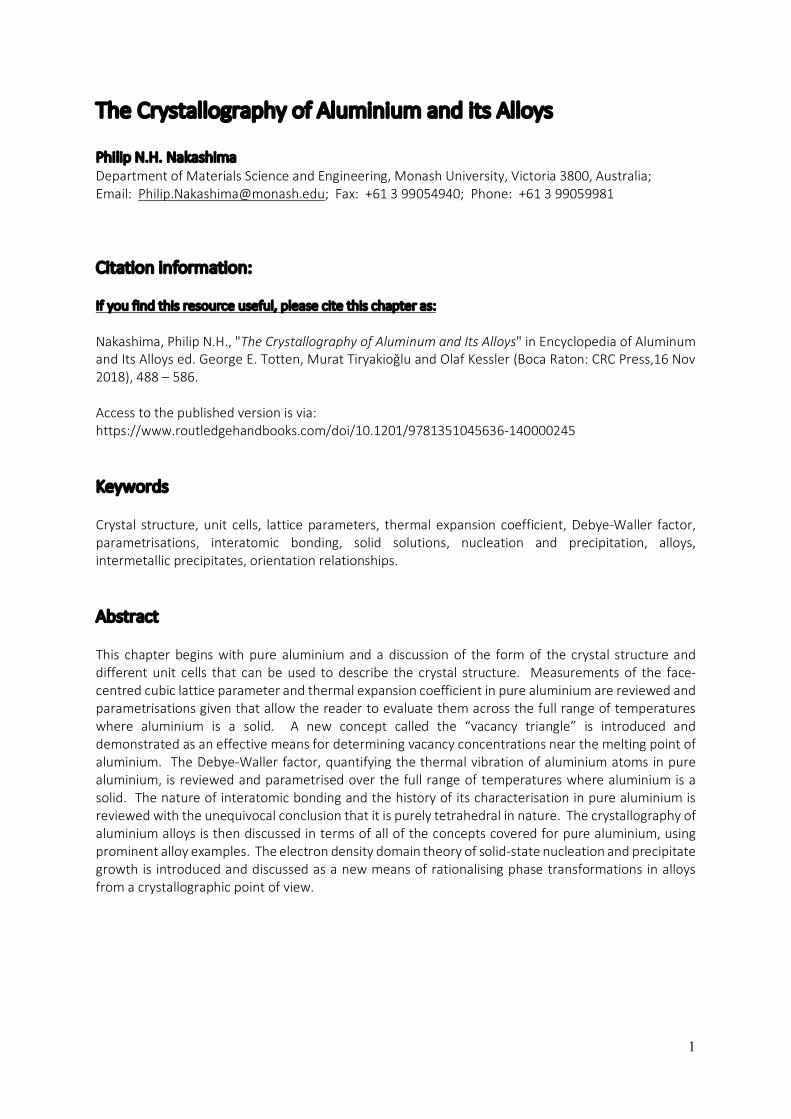
1 The Crystallography of Aluminium and its Alloys Philip N.H. Nakashima Department of Materials Science and Engineering, Monash University, Victoria 3800, Australia; Email: [email protected]; Fax: +61 3 99054940; Phone: +61 3 99059981 Citation information: If you find this resource useful, please cite this chapter as: Nakashima, Philip N.H., "The Crystallography of Aluminum and Its Alloys" in Encyclopedia of Aluminum and Its Alloys ed. George E. Totten, Murat Tiryakioğlu and Olaf Kessler (Boca Raton: CRC Press,16 Nov 2018), 488 – 586. Access to the published version is via: https://www.routledgehandbooks.com/doi/10.1201/9781351045636-140000245 Keywords Crystal structure, unit cells, lattice parameters, thermal expansion coefficient, Debye-Waller factor, parametrisations, interatomic bonding, solid solutions, nucleation and precipitation, alloys, intermetallic precipitates, orientation relationships. Abstract This chapter begins with pure aluminium and a discussion of the form of the crystal structure and different unit cells that can be used to describe the crystal structure. Measurements of the face- centred cubic lattice parameter and thermal expansion coefficient in pure aluminium are reviewed and parametrisations given that allow the reader to evaluate them across the full range of temperatures where aluminium is a solid. A new concept called the “vacancy triangle” is introduced and demonstrated as an effective means for determining vacancy concentrations near the melting point of aluminium. The Debye-Waller factor, quantifying the thermal vibration of aluminium atoms in pure aluminium, is reviewed and parametrised over the full range of temperatures where aluminium is a solid. The nature of interatomic bonding and the history of its characterisation in pure aluminium is reviewed with the unequivocal conclusion that it is purely tetrahedral in nature. The crystallography of aluminium alloys is then discussed in terms of all of the concepts covered for pure aluminium, using prominent alloy examples. The electron density domain theory of solid-state nucleation and precipitate growth is introduced and discussed as a new means of rationalising phase transformations in alloys from a crystallographic point of view.
-
Upload
khangminh22 -
Category
Documents
-
view
0 -
download
0
Transcript of The Crystallography of Aluminium and its Alloys - arXiv
1
The Crystallography of Aluminium and its Alloys
Philip N.H. Nakashima Department of Materials Science and Engineering, Monash University, Victoria 3800, Australia; Email: [email protected]; Fax: +61 3 99054940; Phone: +61 3 99059981 Citation information: If you find this resource useful, please cite this chapter as: Nakashima, Philip N.H., "The Crystallography of Aluminum and Its Alloys" in Encyclopedia of Aluminum and Its Alloys ed. George E. Totten, Murat Tiryakioğlu and Olaf Kessler (Boca Raton: CRC Press,16 Nov 2018), 488 – 586. Access to the published version is via: https://www.routledgehandbooks.com/doi/10.1201/9781351045636-140000245 Keywords Crystal structure, unit cells, lattice parameters, thermal expansion coefficient, Debye-Waller factor, parametrisations, interatomic bonding, solid solutions, nucleation and precipitation, alloys, intermetallic precipitates, orientation relationships. Abstract This chapter begins with pure aluminium and a discussion of the form of the crystal structure and different unit cells that can be used to describe the crystal structure. Measurements of the face-centred cubic lattice parameter and thermal expansion coefficient in pure aluminium are reviewed and parametrisations given that allow the reader to evaluate them across the full range of temperatures where aluminium is a solid. A new concept called the “vacancy triangle” is introduced and demonstrated as an effective means for determining vacancy concentrations near the melting point of aluminium. The Debye-Waller factor, quantifying the thermal vibration of aluminium atoms in pure aluminium, is reviewed and parametrised over the full range of temperatures where aluminium is a solid. The nature of interatomic bonding and the history of its characterisation in pure aluminium is reviewed with the unequivocal conclusion that it is purely tetrahedral in nature. The crystallography of aluminium alloys is then discussed in terms of all of the concepts covered for pure aluminium, using prominent alloy examples. The electron density domain theory of solid-state nucleation and precipitate growth is introduced and discussed as a new means of rationalising phase transformations in alloys from a crystallographic point of view.
2
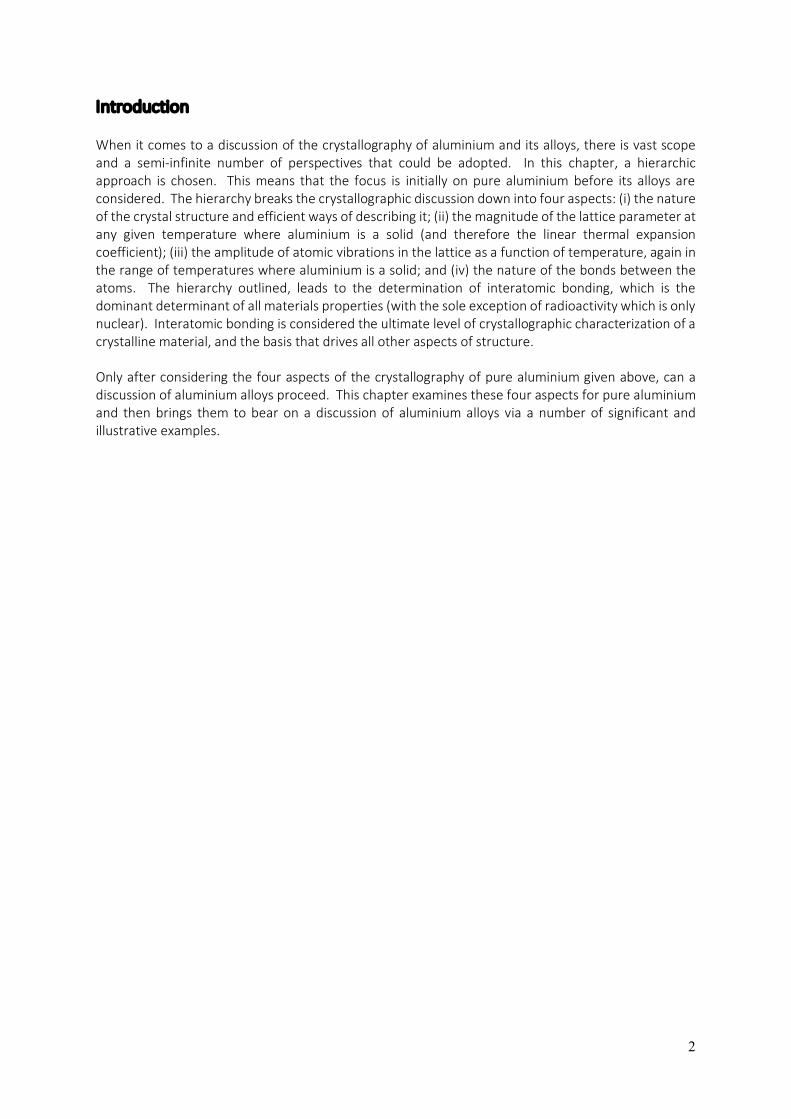
Introduction When it comes to a discussion of the crystallography of aluminium and its alloys, there is vast scope and a semi-infinite number of perspectives that could be adopted. In this chapter, a hierarchic approach is chosen. This means that the focus is initially on pure aluminium before its alloys are considered. The hierarchy breaks the crystallographic discussion down into four aspects: (i) the nature of the crystal structure and efficient ways of describing it; (ii) the magnitude of the lattice parameter at any given temperature where aluminium is a solid (and therefore the linear thermal expansion coefficient); (iii) the amplitude of atomic vibrations in the lattice as a function of temperature, again in the range of temperatures where aluminium is a solid; and (iv) the nature of the bonds between the atoms. The hierarchy outlined, leads to the determination of interatomic bonding, which is the dominant determinant of all materials properties (with the sole exception of radioactivity which is only nuclear). Interatomic bonding is considered the ultimate level of crystallographic characterization of a crystalline material, and the basis that drives all other aspects of structure. Only after considering the four aspects of the crystallography of pure aluminium given above, can a discussion of aluminium alloys proceed. This chapter examines these four aspects for pure aluminium and then brings them to bear on a discussion of aluminium alloys via a number of significant and illustrative examples.

3
The Crystal Structure of Pure Aluminium Aluminium in its pure form has a face centred cubic crystal structure (fcc), which is a close-packed arrangement (the densest geometric packing of spheres attainable) with a layer sequence of ABCABCA… This is illustrated in figure 1 below.
Figure 1: The fcc crystal structure of aluminium viewed with [111] pointing up exposes the ABCABCA… stacking of close-packed atoms (a). The atoms in a single unit cell (cell edges shown) have a darker shade. When viewed along the [111] direction (b), the order of packing is revealed by assigning each layer of atoms a different colour (blue for A, red for B and green for C). It is evident from this view that the layers A, B and C do not line up in the [111] stacking direction. The familiar fcc cell is drawn with a smaller atomic radius so that the atoms are not represented by touching spheres (c). Close-packed structures contain twice as many tetrahedral as octahedral interstices, as shown. The illustrated tessellation is a canonical description of the crystal structure as one octahedral interstice sandwiched by two tetrahedral ones form an ensemble that is the primitive rhombohedral cell. This primitive cell, containing just one atom, is, in fact, the most efficient description of the crystal structure (d). The relationships between lattice parameters for the fcc and primitive cells are also given. This figure was drawn with the aid of VESTA (1). In close-packed structures (both hexagonal close packed, hcp, and fcc), there are always twice as many tetrahedral interstices as there are octahedral ones. This is evident for an elemental fcc structure, such as aluminium, illustrated in figure 1 (c) where the primitive rhombohedral cell, that equivalently describes the structure but contains only a single atom, is drawn within the fcc unit cell. This primitive cell is composed of two tetrahedral interstices sandwiching an octahedral one and because the primitive cell tessellates with periodic repetitions of itself to canonically describe the crystal structure of aluminium, the ratio of tetrahedral to octahedral interstices of two to one applies to the bulk.

4
“Rules of thumb” for a close-packed elemental structure’s ability to accommodate atoms of different elements within its interstices can be established from basic geometric arguments governing each type of interstitial position, as schematically illustrated in figure 2. Considering the atoms of the host structure to be close packed hard spheres allows the size of each interstitial position to be calculated using simple geometry. It turns out that the largest sphere that can be accommodated by an octahedral interstice has a radius of 0.414 times that of the host matrix atom radius in a close-packed structure. For a tetrahedral interstice, the largest sphere that can be accommodated without strain has a radius 0.225 times the radius of the host atoms. If one considers metallic aluminium and its alloys, then there are very few situations in which alloying atoms are located interstitially because they would have to have radii of less than or equal to 0.593Å to be accommodated in the octahedral interstices and less than or equal to 0.322Å to be accommodated, without strain, in the tetrahedral interstices.
Figure 2: Octahedral interstices (a, b and c) can nominally fit interstitial atoms or ions whose radii are no greater than 0.414 times the radius of the host atoms (f) in close-packed structures, like aluminium. Tetrahedral interstices (a, d and e) are significantly smaller and can only accommodate atoms or ions with radii no greater than 0.225 times the radius of the host atoms (f) in close-packed structures. Here, the rhombohedral cell of aluminium is shown (a) with interstitial atoms just fitting in the octahedral interstices (red, a, b and c) and both of the tetrahedral interstices (green, a, d and e). These radius ratios (f) are geometric “rules of thumb” and do not take chemical bonding effects into account. This figure was drawn with the aid of VESTA (1). Considering only neutral atoms, only hydrogen has a sufficiently small covalent radius (0.37 Å) (2) to be accommodated interstitially in aluminium. Oxygen and fluorine atoms, having covalent radii of 0.66 Å and 0.64 Å respectively (2), can be accommodated in the octahedral interstices with considerable strain, however, these elements will form very strong chemical bonds with aluminium atoms and this will result in a change in crystal structure (e.g. the various phases of aluminium oxide). Diffusion of hydrogen via the interstices in aluminium can result in the formation of aluminium hydrides, which are very detrimental to the integrity of aluminium and its alloys. Thankfully, in most situations, aluminium and aluminium alloys are protected by a passivating oxide layer that effectively blocks, not only further oxidation of the aluminium, but also the ability of hydrogen to diffuse into the aluminium. One way in which hydrogen can become a problem is if the protective oxide surface of the aluminium or aluminium alloy is being stripped away at a rate that allows hydrogen to enter and diffuse through the exposed aluminium lattice. This can occur, for example, during electropolishing of
5
aluminium and its alloys if the temperature of the electropolishing solution is not maintained at a sufficiently low level (e.g. -20°C for HNO3/methanol solutions). Some of the most advanced aluminium alloys contain lithium. Only lithium ions can be accommodated interstitially, having ionic radii of 0.60 Å, whilst the neutral atoms have radii of 1.35 Å (2). This becomes important when it comes to characterising aluminium alloys with ionising radiation (as for example, in transmission electron microscopy). Lithium is relatively easily ionised by high-energy beams of radiation and this makes lithium highly mobile in aluminium alloys which contain it, due to migration via interstitial pathways. As a result, lithium is particularly difficult to locate in aluminium alloys using electron microscopy and techniques that probe materials with high-energy radiation. The size of the interstices in aluminium means that almost all alloy solid solutions in aluminium are substitutional, with different elements having different solid solubilities in aluminium. Upon heat treatment of supersaturated aluminium-based solid solutions, phase transformations resulting in the formation of intermetallic precipitates can occur where the precipitates have entirely different crystal structures from the host fcc aluminium matrix. Whilst the focus on aluminium alloys is left until the last section of this chapter, it will be useful at this point to consider other ways of describing the atomic structure of pure or elemental aluminium. This is done in figure 3, the purpose of which is to serve as a handy reference for the structural modelling of intermetallic precipitate phases and the surrounding aluminium matrix in aluminium alloys. Many such phases are to a greater or lesser degree, coherent with the aluminium host matrix along interfacial planes that are not necessarily {001} in the fcc cell. For example, the T1 phase (Al2CuLi) in aluminium-copper-lithium alloys is hexagonal and forms fully-coherent platelets with main facets composed of the basal plane, (001), which is coplanar to {111} planes in the fcc cell of the aluminium matrix. To model the ensemble structure of matrix / precipitate / matrix, one could either use the fcc cell of the aluminium matrix and substitute {111} planes with the T1 structure, or one could use the trigonal cell defined in figure 3 (d, e and f) to describe the aluminium matrix and then simply replace {001} planes in this description with the T1 structure, coplanar to the T1 structure’s basal plane of (001). The equivalence of these approaches to modelling this alloy structure may make the use of different descriptions of the aluminium matrix structure seem redundant, however, when it comes to applying such structural models to the analysis of experimental data, the defining frames of reference become vital to the task. An example is the interpretation of electron diffraction patterns or lattice images using the multislice formalism for describing electron scattering from crystals (3). This method requires the material being probed and analysed to be sliced into its constituent planes of atoms whose normals are parallel to the incident electron beam direction. This requires the two-dimensional periodicity of the crystal structure to be defined perpendicularly to the beam direction so that sampling of the structure within slices can be Fourier transformed as part of the multislice algorithm. This is only practical if the beam and slicing directions are defined as [001] throughout the structure being modelled. In the example of T1, this is only possible if the aluminium host matrix is described using a trigonal cell like the one defined in figure 3 (d, e and f). Whilst figures 1 and 2 show the rhombohedral primitive cell of aluminium in order to illustrate the geometric relationship between the constituent atoms in the two types of interstices that exist in the structure of aluminium, figure 3 presents four additional cells that are defined in relation to the familiar fcc unit cell (and in one case, the rhombohedral primitive cell). These are: a body centred tetragonal (bct) cell where c is the longest cell edge (figure 3 (a, b and c)), a trigonal cell (figure 3 (d, e and f)), an orthorhombic cell (figure 3 (g, h and i)) and a tetragonal cell where c is the shortest cell edge (figure 3 (j, k and l)). For each of these alternative cells, their orientation and position with respect to the fcc

6
description of the structure of aluminium is presented by showing the constituent atoms of the new cells in red. In contrast, the atoms that belong only to the fcc cell and that are not common to the fcc cell and the cell being defined, are shown in blue (figure 3 (a, d, g and j)).
Figure 3: Four alternate unit cells that will fully describe any fcc metal like aluminium. Each cell is shown in relation to the familiar fcc cell (with atoms in the alternate cell in red and those in the fcc cell but outside the alternate cell in blue) (a, d, g and j). Each alternate cell is also shown standing alone (atoms in blue) (b, e, h and k). The alternate cells shown here have axes and cell facets that correspond to the growth axes and planes of many of the precipitate phases encountered in aluminium alloys (see table 4 and the subsection Crystal structures of (some) aluminium alloys). Having the full description of the geometric relationships between these alternate cells and the fcc cell (c, f, i and l) on hand, is useful for modelling and analysing precipitate / matrix interfacial structures in aluminium alloys and for determining the degree of coherence of such interfaces and the amount of strain imparted on the host aluminium matrix by the precipitates. Reference to these geometric relationships is also very useful in the context of simulating electron scattering within aluminium alloys in different directions using the multislice formalism (3). This is becoming an important tool for interpreting transmission electron microscope (TEM) images and diffraction patterns because TEM is one of the primary techniques for characterising alloys at the atomic scale. This figure was drawn with the aid of VESTA (1).
7
The second frame in the definition of each new cell (figure 3 (b, e, h and k)), shows a single unit cell of the new definition with all atoms coloured blue. In the case of the orthorhombic cell (figure 3 (h)), the two opposing face-centred atoms are also at opposing corners of the primitive rhombohedral cell, so this has been drawn in for further context. The third frame in each cell definition (figure 3 (c, f, i and l)) explicitly states the geometric relationships between each newly defined cell and the fcc unit cell. The lengths of each of the cell edges are given in terms of afcc, the lattice parameter of the fcc cell, and the angles between cell edges are given explicitly in degrees. The orientation relationships between the edges of the cell being defined and directions in the fcc cell are given next. This is followed by the space group symmetry defining the symmetry-related locations of atoms in each new cell and, in conjunction with the assigned space group, the symmetry-independent atom positions required to locate all of the atoms constituting the new cells. The unit cells defined in figure 3 cover many of the coherent or semi-coherent systems of matrix/precipitate/matrix encountered in aluminium alloys. The only variable whose value is not specified in the definitions presented in figure 3 is the fcc lattice parameter of aluminium, afcc. The next section examines the lattice parameter of aluminium, and its associated linear thermal expansion coefficient, in sufficient detail to produce an accurate parametrisation of both of these physical characteristics as a function of temperature, allowing the user to obtain their values to high accuracy in pure aluminium at any temperature where aluminium is solid (i.e. 0K – 933K). The value of afcc at whatever temperature is relevant to a particular experiment, is the value that should be substituted into the geometric relationships listed for each cell definition in figure 3.

8
The Lattice Parameter of Pure Aluminium Fundamental to the crystallography of any crystalline material is knowledge of the lattice parameter of the unit cell. For aluminium, the fcc cell is always taken as the frame of reference (so a=b=c and α=β=γ=90°). Here, a summary of the literature is presented with particular focus on experimentally measured lattice parameters for aluminium between 0K and the melting temperature of 933K. From more than 300 measurements spanning this temperature range, a function for the lattice parameter with respect to temperature, a(T), has been determined (see equation 1 below). The present parameterisation can be used to give the lattice parameter at any temperature that aluminium is a solid. In addition, the self-normalised derivative of this function should give an accurate function for the thermal expansion coefficient of aluminium, α(T). A summary of experimentally measured thermal expansion coefficients for aluminium is also presented in this section. Measurements of the lattice parameter date back to the 1920s and the early days of X-ray diffraction and crystallography (4 – 6). A large number of measurements of the aluminium lattice parameter have been made since then (7 – 71), using not only powder and single-crystal X-ray diffraction, but also electron diffraction (54, 55). The references provided here may not be exhaustive but are as complete as possible. Appendix A gives a tabular summary of each reference (4 – 71), the temperature at which determinations were made, and the lattice parameter determined at each temperature. Notes about each measurement, where relevant, and sample purity, where available, are supplied in the summary. Prior to the mid-1940s, measurements of lattice parameter were conventionally given in units of kX. The unit, X, was derived from the calcite spacing, thought at the time of its definition to be 1x10-13m. Therefore, units of kX (or 1000X) were taken as equivalent to 10-10m – the unit of length referred to now-a-days as the Ångström. However, it was found that the calcite spacing was in error by approximately 0.2%. In 1947, none other than Bragg and Armstrong Wood made the clarifying statement that 1kX = 1.00202Å (72). Further research settled on the conversion factor of 1kX = 1.00208Å (73). When summarising the measurements of a(T) over the last 90+ years, values quoted in kX have been converted to Å using the appropriate conversion factor. Figure 4 plots all experimental measurements of the aluminium fcc lattice parameter against the temperature of each measurement. The literature includes a number of attempts to extrapolate the low temperature data to a value of a(0K) (59, 63, 65) and these are shown as the green points in the graph. The blue line is the best fit to the experimental data (including the T=0K extrapolated values) of the following function:
𝑎(T) = '(()*)+,
-∑ 𝑝0T012034 − ∑ 𝑞0𝑇0ln(𝑛 + T)1<
034 =. (1)
The optimised parameters for equation 1 are listed here to 15 significant figures to prevent rounding errors when evaluating the equation (rounding errors can make this otherwise monotonic function non-monotonic at T<20K): m = 5.46215569838344x10⁻⁴, n=86.0150000000000, p0 = 1.80595722249783x1031, p1 = 2.96317351342354x1030, p2 = 2.25855016769900x1029, p3 = 1.06004494945302x1028, p4 = 3.42305759706082x1026, p5 = 8.04609813573980x1024, p6 = 1.41998402393052x10²³, p7 = 1.91189157411850x10²¹, p8 = 1.97428843905832x10¹⁹, p9 = 1.55692828415459x10¹⁷, p10 = 9.23827056204128x10¹⁴, p11 = 4.00527886712625x10¹², p12 = 1.20273329860717x10¹⁰, p13 = 2.25714359192389x10⁷, p14 = 2.06989439078737x10⁴, p15 = 1.00000000000000, q0 = 2.04335860741967x1030, q1 = 3.32581764853519x1029, q2 = 2.51326102603950x1028, q3 = 1.16875476418741x1027, q4 = 3.73664547057534x1025, q5 = 8.68835777614448x10²³, q6 = 1.51514697020481x10²², q7 = 2.01313321790028x10²⁰, q8 = 2.04788881667471x10¹⁸, q9 = 1.58723386748412x10¹⁶, q10 = 9.22649460840626x10¹³, q11 = 3.90058588445197x10¹¹, q12 = 1.13369350824041x10⁹, q13 = 2.02772058226054x10⁶, q14 = 1.68385961108157x10³.

9
Figure 4: A graphical summary of lattice parameter measurements in pure aluminium, from 1925 to the present day (4 – 71). 326 independent experimental measurements are given as red points, ranging from 4.6K to 927K (just below the melting point of 933K). Three points are given at 0K (green) and these were determined by extrapolating low temperature measurements back to absolute zero (59, 63, 65). All points are graphed with error bars; however, some uncertainties are too small to be resolved in the graph. The blue line represents the function fitted to these experimental data (equation 1). The inset expands the graph in the low temperature range to show how equation 1 performs in this region. Figure 5 compares the present fitted function for a(T) with the seminal models of Wang and Reeber for perfect and real crystals (74) as applied to aluminium (75). The distinction between perfect and real is ignoring and accounting for the presence of vacancies respectively. These models deviate significantly from the experimental measurements and thus, from the present fit, at low temperatures. In the middle range of temperature, there is excellent agreement between both models and the present fit, whilst the perfect and real models diverge from each other at higher temperature and bound the present fit. The divergence of the two Wang and Reeber models shows the increasingly significant effect of vacancies on the average lattice parameter in a real crystal, where the concentration of vacancies increases rapidly with temperature as the melting point of aluminium is approached. This becomes even more evident when the linear thermal expansion coefficient, α(T), for aluminium is examined.

10
Figure 5: A graphical comparison of the present fitted function of lattice parameter versus temperature, a(T) (equation 1 and figure 4), with the perfect and real crystal models of aluminium by Wang and Reeber (74, 75). The low and high temperature ranges have been expanded to show the deviations between the present function, a(T), and Wang’s and Reeber’s models in these ranges. At low temperatures the perfect and real crystal models of Wang and Reeber agree exactly due to the low equilibrium concentration of vacancies. Nearer the melting point of aluminium, the vacancy concentration becomes large enough to cause the real crystal model of the lattice parameter to be significantly greater than that of the perfect crystal model. The functional form and optimised parameters of equation 1 were constrained by the requirement that the self-normalised derivative of equation 1 with respect to temperature (resulting in equation 2) must also be the best fit to experimental determinations of the thermal expansion coefficient, α(T), of aluminium. The experimental measurements of α(T) span more than 100 years of research (15, 16, 18, 20, 22, 29, 42, 43, 45, 49, 52, 53, 59, 60, 69, 76 – 96) and are plotted in figure 6. Specific values and notes from each reference are given in Appendix B. The experimental data are plotted together with α(T) according to the perfect and real crystal models of Wang and Reeber (74, 75) and the function for α(T) determined in the present work:
𝛼(T) = 1?(*)
@?(*)@*
= ∑ AB*B+CBDE
(()*)-∑ FB*B+CBDE G∑ HB*BIJ(()*)+,
BDE =. (2)
The optimised parameters for fitting equation 2 to the experimental data points are:

11
s0 = 8.55692806695981x10¹⁸, s1 = 1.09556645819752x1024, s2 = 1.78316852655619x10²³, s3 = 2.04804545623587x10²², s4 = 1.60396172331341x10²¹, s5 = 2.36491757661617x10²⁰, s6 = 2.07873881554774x10¹⁹, s7 = 9.19266228575283x10¹⁷, s8 = 2.20725652279774x10¹⁶, s9 = 2.93361641840158x10¹⁴, s10 = 2.08150841393624x10¹², s11 = 8.47737173962446x10⁹, s12 = 5.09073073293741x10⁷, s13 = 3.26718741801178x10⁵, s14 = -3.93634611081583x10², s15 = 1.00000000000000, and parameters n, pi and qi are the same as for equation 1. Again, all parameters have been listed to 15 significant figures to avoid problems associated with rounding errors.
Figure 6: A graphical summary of thermal expansion coefficients for aluminium from 0K to 933K (the melting temperature). Experimental measurements date from 1907 to the present day (15, 16, 18, 20, 22, 29, 42, 43, 45, 49, 52, 53, 59, 60, 69, 76 – 96). The thermal expansion coefficient as a function of temperature, α(T), as determined by the present review (equation 2), is plotted and compared with α(T) as determined by the perfect and real crystal models of Wang and Reeber (74, 75). The inset expands the low temperature region of the graph to show the quality of the fit of α(T) determined here with low temperature measurements. A new concept, the “vacancy triangle”, is drawn into the graph and spans the divergent area at higher temperatures where α(T) determined from changes in lattice parameter differs from α(T) determined by bulk length dilations, the latter being affected by vacancies. The constraint that interdependent equations 1 and 2 simultaneously fit the experimental determinations of a(T) and α(T) from 0K to near the melting point of 933K resulted in the large number of terms in both functions to ensure excellent simultaneous fits spanning the whole temperature range where aluminium is a solid. Previous efforts to fit functions to both a(T) and α(T) were based largely on polynomials and were only valid over limited temperature ranges (59, 63, 68, 70, 77, 91, 95, 96). One particular example by Kroeger and Swenson (96), which represents some of the most rigorous

12
work to date for α(T), fits numerous polynomial functions of varying order to four separate temperature ranges that in combination go from 0K to 330K. In total, 24 parameters are used. In the present fits, 32 independent parameters (given p15 = 1 for equation 1) are required for a(T) from 0K to 933K, and an additional 15 independent parameters (given s15 = 1 for equation 2) are required for α(T) from 0K to 933K. The present fit functions for a(T) and α(T) lie between the bounds set by the Wang and Reeber perfect and real crystal models at the high-temperature end of the graphs in figures 5 and 6. This can be understood by considering the present fits as averages over the spread in the experimental determinations spanning the literature, whilst the perfect and real crystal models of Wang and Reeber (74, 75) represent the theoretical upper and lower bounds of such measurements respectively. The experimental thermal expansion data shown in the plot of figure 6 are compiled from measurements of both ∆a/a0 and ∆L/L0. The former ratio is the change in lattice parameter from its value at a particular reference temperature, T0, divided by the value of the lattice parameter at that temperature. Measurements of lattice parameter invariably involve a diffraction experiment (usually single crystal (29, 40, 45, 60, 92) or powder X-ray diffraction (15, 16, 20, 22, 29, 42, 43, 49, 52, 53, 59, 69, 82, 84)). The second of the ratios comes from measurements of changes in length of a bulk sample of material. The length dilation, ∆L, with changes in temperature relative to a reference temperature, T0, can be very accurately measured by any number of techniques. These include interferometry (18, 53, 60, 78, 81, 86, 91), capacitance or differential transformer dilatometry (40, 89, 94 – 96), fixed comparative optical microscopy (45, 76, 77, 92) and optical levering (90). The denominator, L0, is simply the absolute length of the bulk sample at the reference temperature. The reference temperature, T0, is a temperature at which the vacancy concentration can be considered to have a negligible effect on length dilation with changes in temperature. In other words, ∆a/a0 ≡ ∆L/L0 at T0. Measurements of ∆a/a0 show what is happening in terms of only the unit cell dimension, whilst measurements of ∆L/L0 reflect what is happening to the bulk material as a result of changes in cell dimension plus dilation of the bulk caused by the presence of vacancies. This means that the difference between thermal expansion coefficients measured crystallographically and by bulk length dilation is a direct measure of vacancy concentration. By definition (40, 42, 45, 53, 60, 90), the vacancy concentration, Cvac, is given by:
𝐶LMN ≈ 3 Q∆SSE− ∆?
?ET. (3)
Using the approximations that a ≈ a0 and T ≈ T0 (both accurate to within 2% across the entire temperature range that aluminium is a solid) the thermal expansion coefficient, α(T), can be related to ∆a/a0 and ∆L/L0 as follows:
𝛼U0J(T) =1?@?@*≈ 1
?E
@?@*;𝛼UMW(T) =
1S@S@*≈ 1
SE
@S@*
. (4)
Here, αmin(T) is essentially the linear thermal expansion coefficient for a perfect crystal whilst αmax(T) is that for a crystal containing the equilibrium concentration of vacancies at temperature T. It then follows that:
∫ αU0J(T)dT ≈**E
1?E∫ d𝑎 = ∆?
?E; ∫ αUMW(T)dT ≈
**E
1[E∫ dL[[E
??E
= ∆[[E
, (5)
and therefore:
13
Q∆SSE− ∆?
?ET ≈ ∫ 𝛼UMW(T)dT − ∫ 𝛼U0J(T)dT
**E
**E
. (6)
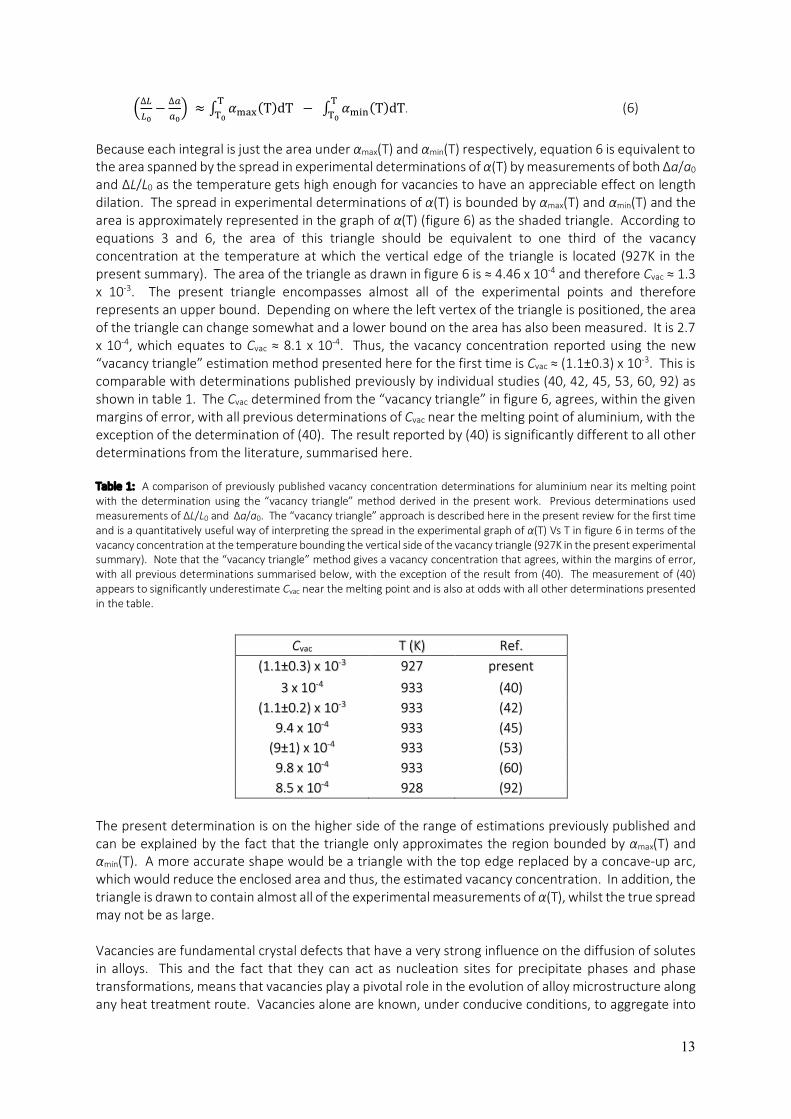
Because each integral is just the area under αmax(T) and αmin(T) respectively, equation 6 is equivalent to the area spanned by the spread in experimental determinations of α(T) by measurements of both ∆a/a0 and ∆L/L0 as the temperature gets high enough for vacancies to have an appreciable effect on length dilation. The spread in experimental determinations of α(T) is bounded by αmax(T) and αmin(T) and the area is approximately represented in the graph of α(T) (figure 6) as the shaded triangle. According to equations 3 and 6, the area of this triangle should be equivalent to one third of the vacancy concentration at the temperature at which the vertical edge of the triangle is located (927K in the present summary). The area of the triangle as drawn in figure 6 is ≈ 4.46 x 10⁻⁴ and therefore Cvac ≈ 1.3 x 10⁻³. The present triangle encompasses almost all of the experimental points and therefore represents an upper bound. Depending on where the left vertex of the triangle is positioned, the area of the triangle can change somewhat and a lower bound on the area has also been measured. It is 2.7 x 10⁻⁴, which equates to Cvac ≈ 8.1 x 10⁻⁴. Thus, the vacancy concentration reported using the new “vacancy triangle” estimation method presented here for the first time is Cvac ≈ (1.1±0.3) x 10-3. This is comparable with determinations published previously by individual studies (40, 42, 45, 53, 60, 92) as shown in table 1. The Cvac determined from the “vacancy triangle” in figure 6, agrees, within the given margins of error, with all previous determinations of Cvac near the melting point of aluminium, with the exception of the determination of (40). The result reported by (40) is significantly different to all other determinations from the literature, summarised here. Table 1: A comparison of previously published vacancy concentration determinations for aluminium near its melting point with the determination using the “vacancy triangle” method derived in the present work. Previous determinations used measurements of ∆L/L0 and ∆a/a0. The “vacancy triangle” approach is described here in the present review for the first time and is a quantitatively useful way of interpreting the spread in the experimental graph of α(T) Vs T in figure 6 in terms of the vacancy concentration at the temperature bounding the vertical side of the vacancy triangle (927K in the present experimental summary). Note that the “vacancy triangle” method gives a vacancy concentration that agrees, within the margins of error, with all previous determinations summarised below, with the exception of the result from (40). The measurement of (40) appears to significantly underestimate Cvac near the melting point and is also at odds with all other determinations presented in the table.
Cvac T (K) Ref. (1.1±0.3) x 10-3 927 present
3 x 10⁻⁴ 933 (40) (1.1±0.2) x 10-3 933 (42)
9.4 x 10⁻⁴ 933 (45) (9±1) x 10-4 933 (53) 9.8 x 10⁻⁴ 933 (60) 8.5 x 10⁻⁴ 928 (92)
The present determination is on the higher side of the range of estimations previously published and can be explained by the fact that the triangle only approximates the region bounded by αmax(T) and αmin(T). A more accurate shape would be a triangle with the top edge replaced by a concave-up arc, which would reduce the enclosed area and thus, the estimated vacancy concentration. In addition, the triangle is drawn to contain almost all of the experimental measurements of α(T), whilst the true spread may not be as large. Vacancies are fundamental crystal defects that have a very strong influence on the diffusion of solutes in alloys. This and the fact that they can act as nucleation sites for precipitate phases and phase transformations, means that vacancies play a pivotal role in the evolution of alloy microstructure along any heat treatment route. Vacancies alone are known, under conducive conditions, to aggregate into
14
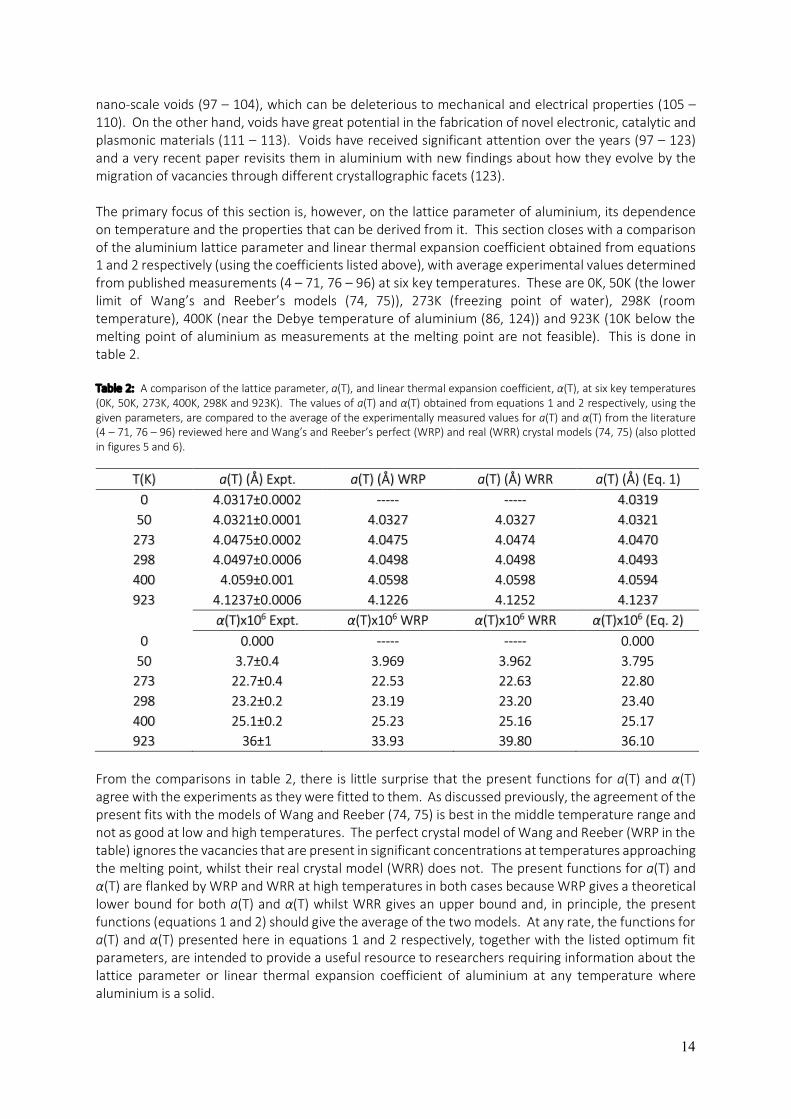
nano-scale voids (97 – 104), which can be deleterious to mechanical and electrical properties (105 – 110). On the other hand, voids have great potential in the fabrication of novel electronic, catalytic and plasmonic materials (111 – 113). Voids have received significant attention over the years (97 – 123) and a very recent paper revisits them in aluminium with new findings about how they evolve by the migration of vacancies through different crystallographic facets (123). The primary focus of this section is, however, on the lattice parameter of aluminium, its dependence on temperature and the properties that can be derived from it. This section closes with a comparison of the aluminium lattice parameter and linear thermal expansion coefficient obtained from equations 1 and 2 respectively (using the coefficients listed above), with average experimental values determined from published measurements (4 – 71, 76 – 96) at six key temperatures. These are 0K, 50K (the lower limit of Wang’s and Reeber’s models (74, 75)), 273K (freezing point of water), 298K (room temperature), 400K (near the Debye temperature of aluminium (86, 124)) and 923K (10K below the melting point of aluminium as measurements at the melting point are not feasible). This is done in table 2. Table 2: A comparison of the lattice parameter, a(T), and linear thermal expansion coefficient, α(T), at six key temperatures (0K, 50K, 273K, 400K, 298K and 923K). The values of a(T) and α(T) obtained from equations 1 and 2 respectively, using the given parameters, are compared to the average of the experimentally measured values for a(T) and α(T) from the literature (4 – 71, 76 – 96) reviewed here and Wang’s and Reeber’s perfect (WRP) and real (WRR) crystal models (74, 75) (also plotted in figures 5 and 6).
T(K) a(T) (Å) Expt. a(T) (Å) WRP a(T) (Å) WRR a(T) (Å) (Eq. 1) 0 4.0317±0.0002 ----- ----- 4.0319
50 4.0321±0.0001 4.0327 4.0327 4.0321 273 4.0475±0.0002 4.0475 4.0474 4.0470 298 4.0497±0.0006 4.0498 4.0498 4.0493 400 4.059±0.001 4.0598 4.0598 4.0594 923 4.1237±0.0006 4.1226 4.1252 4.1237
α(T)x106 Expt. α(T)x106 WRP α(T)x106 WRR α(T)x106 (Eq. 2)
0 0.000 ----- ----- 0.000 50 3.7±0.4 3.969 3.962 3.795
273 22.7±0.4 22.53 22.63 22.80 298 23.2±0.2 23.19 23.20 23.40 400 25.1±0.2 25.23 25.16 25.17 923 36±1 33.93 39.80 36.10
From the comparisons in table 2, there is little surprise that the present functions for a(T) and α(T) agree with the experiments as they were fitted to them. As discussed previously, the agreement of the present fits with the models of Wang and Reeber (74, 75) is best in the middle temperature range and not as good at low and high temperatures. The perfect crystal model of Wang and Reeber (WRP in the table) ignores the vacancies that are present in significant concentrations at temperatures approaching the melting point, whilst their real crystal model (WRR) does not. The present functions for a(T) and α(T) are flanked by WRP and WRR at high temperatures in both cases because WRP gives a theoretical lower bound for both a(T) and α(T) whilst WRR gives an upper bound and, in principle, the present functions (equations 1 and 2) should give the average of the two models. At any rate, the functions for a(T) and α(T) presented here in equations 1 and 2 respectively, together with the listed optimum fit parameters, are intended to provide a useful resource to researchers requiring information about the lattice parameter or linear thermal expansion coefficient of aluminium at any temperature where aluminium is a solid.

15
The Debye-Waller Factor of Elemental Aluminium In the pursuit of a fundamental understanding of materials properties, all routes lead back to the bonding electron density that is the dominant determinant of almost all materials properties (except radioactivity). Aluminium is no exception. Whilst the bonding electron density of aluminium is the subject of the next section, its determination depends on three fundamental pieces of á priori information. As can be gleaned from the layout of this chapter, the first is the type of unit cell and the location of the atoms within it, whilst the second is the dimension of the unit cell (or the lattice parameter). The third is the thermal vibration amplitude of the aluminium atoms. This is quantified by the Debye-Waller factor (DWF) (124, 125). Figure 7 communicates the ambiguity of whether electron distribution is due to bonding or due to thermal motion of the atoms. When viewed in connection with equations 7 and 8, the origin of this ambiguity becomes obvious. The starting point is the fact that any periodic object can be described by a Fourier sum. In the case of a crystal, this sum is:
𝜌(𝐫) =∑ _𝐠abcdB𝐠.𝐫𝐠
fghii, (7)
where ρ(r) is the electron density at a position in the unit cell with real space vector r. The sum is over all reciprocal lattice vectors, g, and Fg are the Fourier coefficients of the crystal electron density, known as structure factors. Vcell is the volume of the unit cell. The structure factors, Fg, are determined according to the following equation:
, (8) where the sum is over all atoms in the unit cell and fj(s) is the atomic form factor for the jth atom at position rj in the unit cell, and s = (sinθB)/λ for the set of atomic planes with reciprocal lattice vector g, having Miller indices hkl. θB is the Bragg angle for this set of planes, corresponding to the wavelength, λ, of the radiation being diffracted from the planes with structure factor Fg. The first component of the equation (shaded in blue) essentially quantifies the T=0K electron distribution contribution to the structure factor. The second exponential in equation 8 (shaded in red) is referred to as the temperature factor, where Bj is the Debye-Waller factor of the jth atom at a particular temperature.
Figure 7: Two pairs of bonded atoms of the same elements are compared (a and b) with clearly more electron density between the atoms in the second case (b). Is the larger electron density between the atoms in case b due to stronger bonding or larger thermal motion than in case a? Without specific knowledge of the Debye-Waller factors for each case, this cannot be answered. See equation 8. The temperature factor “smears” the electron distribution from its static form to give its time-averaged dynamic form due to the thermal vibration of the constituent atoms. Therefore, if the Debye-Waller factor is not accurately known, then one has no way of knowing the relative contributions of the static and dynamic components to the structure factor, and therefore, it is impossible to accurately determine the true bonding electron distribution. This is illustrated by figure 7.
16
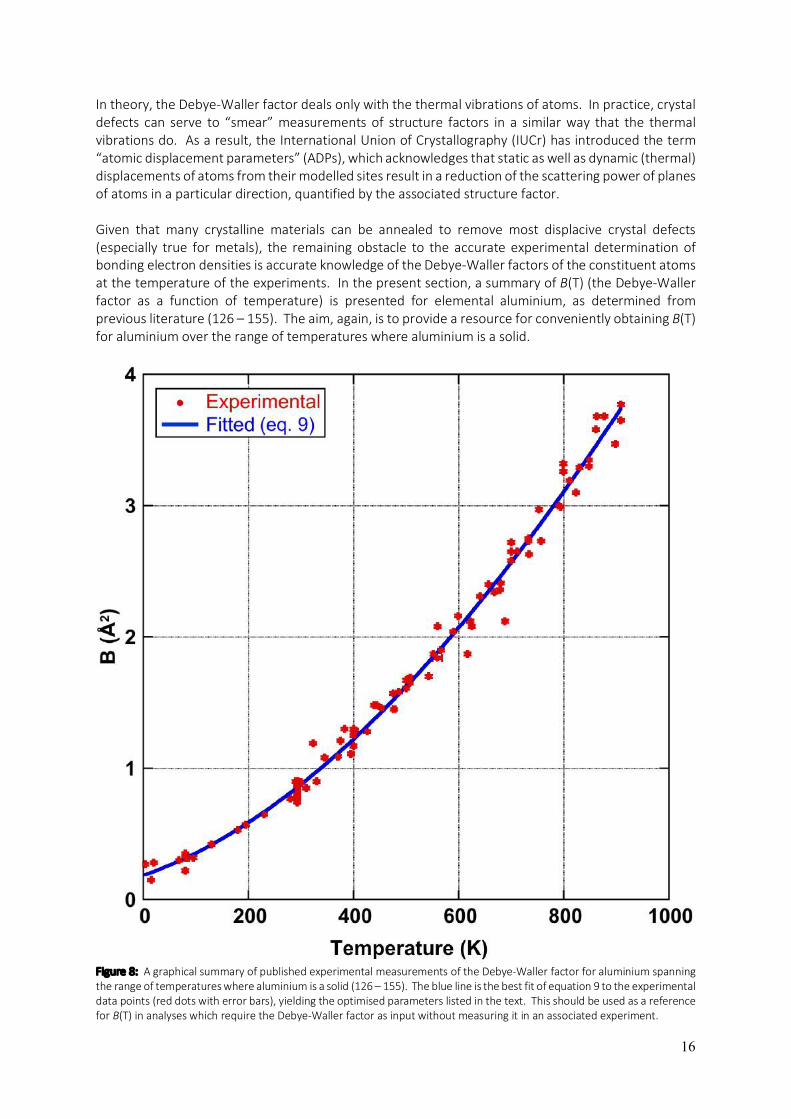
In theory, the Debye-Waller factor deals only with the thermal vibrations of atoms. In practice, crystal defects can serve to “smear” measurements of structure factors in a similar way that the thermal vibrations do. As a result, the International Union of Crystallography (IUCr) has introduced the term “atomic displacement parameters” (ADPs), which acknowledges that static as well as dynamic (thermal) displacements of atoms from their modelled sites result in a reduction of the scattering power of planes of atoms in a particular direction, quantified by the associated structure factor. Given that many crystalline materials can be annealed to remove most displacive crystal defects (especially true for metals), the remaining obstacle to the accurate experimental determination of bonding electron densities is accurate knowledge of the Debye-Waller factors of the constituent atoms at the temperature of the experiments. In the present section, a summary of B(T) (the Debye-Waller factor as a function of temperature) is presented for elemental aluminium, as determined from previous literature (126 – 155). The aim, again, is to provide a resource for conveniently obtaining B(T) for aluminium over the range of temperatures where aluminium is a solid.
Figure 8: A graphical summary of published experimental measurements of the Debye-Waller factor for aluminium spanning the range of temperatures where aluminium is a solid (126 – 155). The blue line is the best fit of equation 9 to the experimental data points (red dots with error bars), yielding the optimised parameters listed in the text. This should be used as a reference for B(T) in analyses which require the Debye-Waller factor as input without measuring it in an associated experiment.
17
Figure 8 plots experimental measurements of the Debye-Waller factor against temperature where the data points were obtained from an extensive survey of the literature (126 – 155). For specific values, their sources and some notes associated with each source, see Appendix C. Analytical derivations of the Debye-Waller factor for the general case where anharmonic vibrations are also considered, have concluded that the temperature dependence of B(T) in its most general form for fcc structures, should be a cubic function of temperature (141, 147, 151, 156, 157), i.e:
𝐵(T) = 𝑚 + 𝑛T + 𝑝Tl + 𝑞Tm. (9) This function is fitted to the experimental data points in figure 8, giving the blue line in the graph and the optimised parameters: m = 0.18488, n = 1.3926x10⁻³, p = 3.1939x10⁻⁶ and q = -4.6582x10⁻¹⁰. The fit of equation 9 to the experimental data with these coefficient values cannot be improved by adding higher orders as Peng et al. have done in their parametrisation of B(T) for many elements (158 – 160), which involve a quartic function of temperature. Equation 9 with the optimised parameters listed above (plotted in figure 8), predicts a significant zero-point energy with B(0K) = 0.18±0.04 Å2. Sternemann et al. (155) report B(15K) = 0.15 Å2, which is lower than other measurements at 4K and 20K (131), but more in alignment with the low temperature powder X-ray diffraction work of Rantavuori and Tanninen (149), which was aimed at measuring very accurate structure factors in aluminium as part of a bonding electron density study. Their study gave B(80K) = 0.22Å2. This value is substantially lower than other measurements at T=80K which have a very narrow spread about a central value of 0.33Å2 (126, 131, 137 – 139). It might well be argued that the alignment between the precision measurements of Sternemann et al. (155) and Rantavuori and Tanninen (149) is suggestive of their accuracy. On the other hand, it could equally be argued that the weight of measurements suggests B(80K) is nearer to 0.33Å than 0.22Å, calling into question the lower zero-point energy that Sternemann et al. (155) and Rantavuori and Tanninen (149) would suggest. It is also possible that higher concentrations of crystal imperfections may have affected the measurements of B(4K), B(20K) and B(80K) in many of the cases leading to elevated values. Regardless, the present fit effectively averages out these differences and as a result, has a significant level of uncertainty associated with its prediction of B(0K). Theoretical work in the derivation of B(T) from interatomic forces, calculated from a variety of ab initio potentials and electron gas screening functions, has yielded some varied results for aluminium (148, 156, 157, 161 – 166). These are plotted, together with the parameterisation of B(T) by Gao and Peng (159, 160) and the fit of equation 9 to the experimental results (126 – 155), in figure 9. Only Killean’s nearest neighbour central force pair interaction model (148) is a good fit to B(T) determined by experiments. The other models plotted in figure 9 are derived from: (i) the Ashcroft pseudopotential with a Vashishta – Singwi screening function (AVS) (157, 161); (ii) the Ashcroft pseudopotential with a Hubbard screening function (AH) (157, 163, 164); (iii) a Harrison modified point ion pseudopotential with a Hubbard-Sham screening function (HHS) (157, 163, 164); and (iv) a Morse potential (Morse) (157, 162). Three separate models (numbered in the graph) are derived from each of these potentials and they are: (1) quasi-harmonic; (2) quasi-harmonic plus low order perturbation terms as per Maradudin and Flinn (156, 157); and (3) fully inclusive of all anharmonic contributions via a Green’s function approach (157, 165, 166). Gao and Peng’s parametrisation (159, 160) was based on the phonon density of states determinations of Gilat and Nicklow (138), which relied on the measurements of Stedman and Nilsson (137). This
18
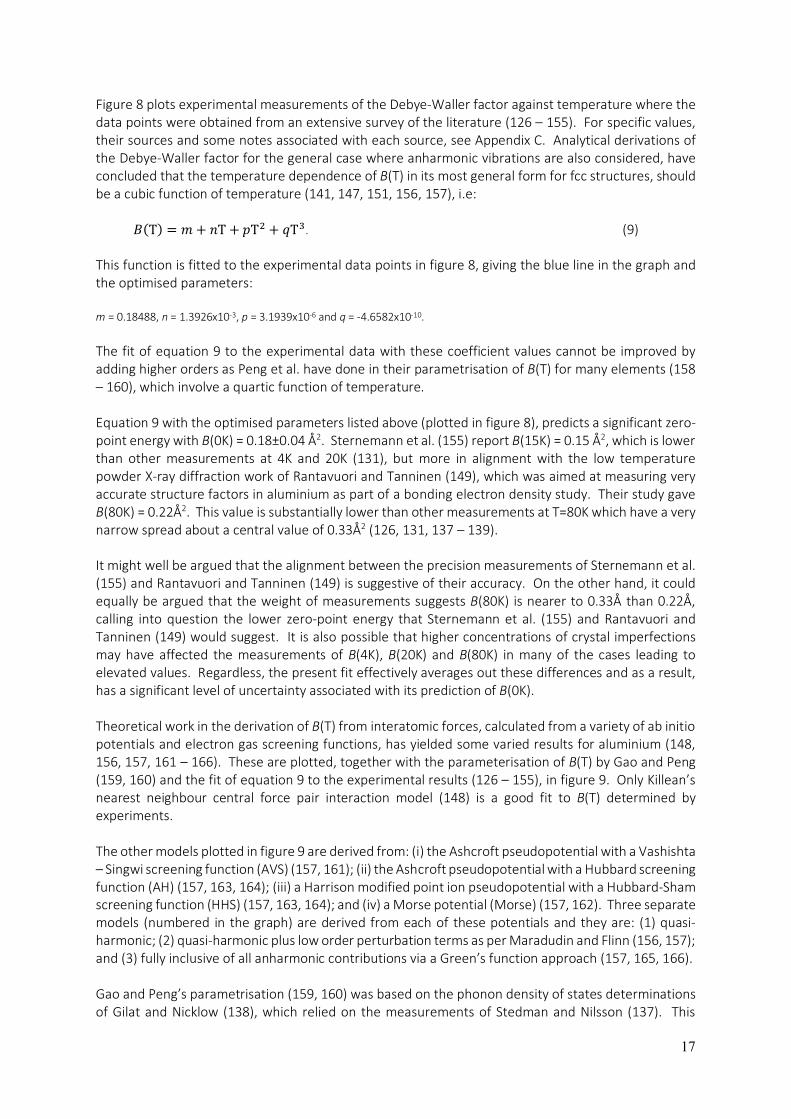
parametrisation has been a useful reference where input of the Debye-Waller factor has been required in analyses of experimental data and where it has not been measured in situ. At T=293K, the Gao and Peng parametrisation (159, 160) gives B(293K) = 0.82Å whilst the present function and optimised parameters give B(293K) = 0.86±0.04Å2. Gao and Peng’s parametrisation is in best agreement with the present function for B(T) in the range 100K – 300K. Therefore, analyses of near-room-temperature data will not be strongly affected by the choice of B(T) function, whether it be that of Gao and Peng (159, 160) or the present function. However, in regions of higher or lower temperatures, Gao and Peng’s parametrisation deviates significantly from the present function for B(T) and therefore also from the experimental measurements of the Debye-Waller factor. The deviation is especially large at higher temperatures, where use of the present function for B(T) is strongly advised.
Figure 9: A comparison of the present function for B(T) (see equation 9 with the optimised parameters listed in the text) with different theoretical models for B(T) (148, 156, 157, 161 – 166) and the parametrisation by Gao and Peng (159, 160). The present function for B(T) is the best fit to the experimental data surveyed in this work (126 – 155) and is the thickest solid line in the graph (red). The nearest neighbour central force pair interaction model of Killean (148) (solid bright blue line) is in closest agreement with experiments across the range of temperatures where aluminium is a solid. On the other hand, the parametrisation by Gao and Peng (159, 160) does not fit the experimental measurements well at all (solid black line). All of the other theoretical determinations of B(T) are plotted with dashed lines and the abbreviations with which they are tagged, name the potentials and screening functions used to derive the corresponding B(T) curves (described in the text). Equation 9 with its optimised parameters, given above, represents the summary of all of the published experimental measurements of B(T) (126 – 155) and is useful as a simple reference tool when B(T) is required as input and is not measured in situ. The next section deals with the determination of the bonding electron distribution in aluminium and, as illustrated by equation 8 and figure 7, a reliable knowledge of B(T) at the temperature at which structure factors are measured, is vital to the accurate determination of bonding. This is true for any material.

19
The Bonding Electron Distribution in Aluminium Aluminium has been the focus of considerable charge density research for almost a century (126, 127, 129, 130, 133, 140, 144, 149, 152, 154, 167 – 186). What makes this metal so interesting is that it closely approximates an ideal Drude metal (187) which is commonly described as a lattice of “cations immersed in a sea of delocalised electrons”. This is in fact the crude description applied to metals in general at high school and undergraduate levels in order to describe metallic bonding and the general properties of malleability, ductility and thermal, electrical and acoustic conduction that it gives rise to (188). Whilst this description is a gross approximation, aluminium fits it remarkably well and better than most other metals. Aluminium is one of nature’s best approximants to a “free-electron gas” or “jellium” and, as a consequence, is an excellent thermal conductor, is highly malleable, is one of the best known electrical conductors and is the most efficient reflector of visible radiation (a direct result of the oscillation of its nearly free valence electrons, i.e. plasmons). The bonding electron distribution in materials is key to all of their properties (with the exception of radioactivity, which is entirely nuclear). Therefore, to gain a fundamental understanding of the properties of aluminium, one must closely examine the nature of metallic bonding between the atoms in it. Experimental measurements of the electron density in aluminium were largely confined to X-ray diffraction experiments (126, 127, 129, 130, 133, 140, 144, 149, 167 – 170, 172) from powders or single crystals. Some higher precision results from electron diffraction were obtained by the critical voltage (CV) method (152, 173, 174) and the highest precision measurements to date were presented in a recent study using quantitative convergent-beam electron diffraction (QCBED) (175). Conventional single-crystal and powder X-ray diffraction techniques variably suffer from errors caused by extinction, which originates from the single scattering approximation (or kinematic approximation) made in the analysis of the diffracted intensities (189). A number of approaches (190 – 193) have been developed and applied to correct for the multiple scattering (or dynamical diffraction) that inevitably occurs in crystals with small unit cells and relatively high degrees of crystal perfection, however, these approaches all involve significantly limiting approximations. Experiments seeking dynamical diffraction data and applying a full dynamical scattering analysis eliminate the concept of extinction and in turn, should result in more accurate measurements. Pendellösung experiments with X-rays and single crystals have been attempted with aluminium and are included in this review (172). The problem with this method is that it is difficult to obtain perfect single crystals of the sizes needed for such X-ray experiments, especially when it comes to metals because metallic bonding supports crystal defects very readily, which is associated with the property of ductility and malleability – the defining characteristics of metals. Crystal imperfections cannot be avoided in the volumes of metal needed to perform these dynamical X-ray diffraction experiments and this in turn, leads to error in the measurement of structure factors by these techniques. Whilst X-rays are scattered by the total electron density in a crystal, electrons, being charged, are scattered by the crystal potential. Potential and electron density are related (via a simple electrostatic relationship called the Mott formula (194)) in such a way that makes electron diffraction more sensitive to bonding than the rest of the electron density. In addition, electrons, due to their charge, interact with matter about 1,000 times more strongly than X-rays, and can be focused into sub-nanometre probes with electromagnetic lenses. This combination means that convergent-beam electron diffraction (CBED) is able to probe volumes of material with <105 atoms. This is about 1010 times smaller than is possible with conventional X- ray diffraction techniques, thereby allowing defect-free regions of crystal to be probed selectively by CBED in electron microscopes.
20
CBED gave rise to the critical voltage method for measuring bonding-sensitive structure factors and several studies using this technique were carried out for aluminium (152, 173, 174). The problem with this approach is that the range of structure factors that can be measured is extremely limited. The smaller the structure factor magnitude, the higher the electron energy required to reach the point at which there is a change in contrast in the CBED pattern that acts as the indicator in the method. The electron energy at which this occurs is used to determine the magnitude of the relevant structure factor(s). The electron energy is a direct product of the accelerating voltage in an electron microscope and higher accelerating voltages, and thus higher electron energies, require larger and larger electron guns to accelerate the electrons to the required energy. This means that the critical voltage method has a limited range of applicability because it is impractical to make electron guns huge enough to measure more than just the strongest 2 or 3 structure factors in a material. In aluminium, the practical limit is just the two strongest structure factors, F111 and F200. This was insufficient to unequivocally determine the bonding electron density in aluminium as it was long thought that bonding information also resides in the next structure factor, F220, that is inaccessible by the critical voltage method. Quantitative convergent-beam electron diffraction (QCBED) has emerged in the last 2 decades as a very accurate technique for measuring bonding-sensitive structure factors (175, 195 – 208). It involves calculating convergent-beam electron diffraction (CBED) patterns and fitting them iteratively to experimental ones by adjusting the parameters to which the patterns are sensitive (these include the bonding-sensitive structure factors). The precision AND accuracy come from the fact that a full dynamical scattering calculation of intensity as a function of scattering angle is being fitted to an experimental intensity distribution, i.e. a CBED pattern, as opposed to the integrated intensities of reflections in point diffraction patterns, as is the case in X-ray diffraction. QCBED results in massive over-determination of the refined structure factors as of order 10 parameters are outnumbered by ~104 data points in the matched intensity distribution of a CBED pattern. QCBED is more computationally intensive than X-ray diffraction analysis, however, with fast computers and highly linear electron-sensitive area detectors on modern electron microscopes, QCBED is emerging as the technique of choice when it comes to requiring very high precision and accuracy in bonding–sensitive structure factor measurements. In aluminium, the need for precision and accuracy is possibly even more crucial than in bonding electron density studies of other materials. This is because aluminium’s maximum bonding electron density is tiny (~0.047 e-Å-3 based on the structure factors of (175)) compared with the experimental benchmark in X-ray diffraction of diamond, for example, where the maximum bonding density is more than an order of magnitude greater (~0.66 e-Å-3 using the structure factors of (209)). In other words, to measure bonding in aluminium, the experiments have to be at least an order of magnitude more sensitive than in a material like diamond. This is where QCBED comes into its own as an experimental technique. It is QCBED that gave rise to the experimental measurements presented in (175), which can be considered the modern benchmark for bonding in aluminium, due to the precision and accuracy obtained from the technique. The same requirements of precision and accuracy can be imposed on theoretical, ab initio, modelling and calculation of the bonding electron density in aluminium. Since the advent of density functional theory (DFT) (210), a significant number of publications on the theoretical calculation of the bonding electron distribution in aluminium have appeared using different approximations within the framework of DFT (175 – 186). The results are varied and depend on the approximations made. The two historical approaches that are closest to the experimental benchmark set by QCBED in (175), are the augmented plane wave (APW) calculations of Perrot (180) and the “atom in jellium” model of Rantala (186). The former made fewer approximations by extending beyond the non-muffin tin constraints prevalent in contemporary calculations. It is in fact very similar in nature to the DFT calculation presented in (175), which used the full potential linearly augmented plane wave approach (FP-LAPW) and the generalised

21
gradient approximation (GGA) with local orbital (lo) and local screening (ls) pseudopotentials. The proximity of the benchmark QCBED measurements in (175) to the “atom in jellium” model of Rantala (186) is in itself a testament to aluminium being an excellent approximation to the Drude model of ideal metals being a lattice of cations in a sea of delocalised electrons. The importance of precision and accuracy in bonding studies is highlighted by the following review of all bonding electron density studies, both experimental and theoretical, published to date for aluminium. In order to present all of these historical results in a coherent fashion, key locations within the crystal structure of aluminium are considered. Figure 10 presents the fcc unit cell of aluminium and revisits the tetrahedral and octahedral interstices discussed in the first section of this chapter. These are marked in the figure together with the bridge centre, which is defined as the midpoint between nearest neighbour atoms. Each of the positions is marked with a cross in the unit cell and the dotted lines represent the coordination of each of these positions with their nearest atoms. The bonding electron density at each of these positions can be calculated for any set of published structure factors, thus allowing each published study to be graphed as a point in a 3-dimensional plot with axes corresponding to the bonding electron densities at the tetrahedral, octahedral and bridge centres.
Figure 10: A diagram of the fcc unit cell of aluminium showing the key bonding locations and their coordination to nearest neighbour atoms. The tetrahedral and octahedral interstitial positions (marked “tet.” and “oct.” respectively), were previously identified in figure 1 (c). A third position of importance in bonding studies is the bridge centre (as marked) which is at the midpoint between nearest neighbour atoms. As shown by the dotted lines, the bridge centre has a coordination number of 2 atoms, whilst the tetrahedral and octahedral centres have coordination numbers of 4 and 6 atoms respectively. It is interesting to note that of the three positions, only the tetrahedral centre does not lie on a line between any of its coordinated atoms. The tetrahedral, octahedral and bridge centres have coordinates of 0.25 0.25 0.25, 0.5 0.5 0.5 and 0.25 0.25 0.00 respectively. This figure was drawn with the aid of VESTA (1). Here, as in (175), the bonding electron density is calculated for each of the published sets of structure factors by subtracting the independent atom model (IAM) structure factors based on Doyle’s and Turner’s landmark relativistic Hartree-Fock calculations of electron density for non-interacting, isolated neutral atoms (unbonded) (211). This proceeds according to the following equations, which follow on from equation 7:
∆𝜌(𝐫) = 𝜌(𝐫)MNnoMI −𝜌(𝐫)pqr =∑ _𝐠sgtusiabcdB𝐠.𝐫𝐠
fghii−
∑ _𝐠vwxabcdB𝐠.𝐫𝐠
fghii, (10)
∴ ∆𝜌(𝐫) =
∑ -_𝐠sgtusiG_𝐠vwx=abcdB𝐠.𝐫𝐠
fghii. (11)
22
Here, ∆ρ(r) is generally referred to as the deformation electron density. It is a measure of the deviation of the measured or calculated total electron density, ρ(r)actual, from the total electron density given by the IAM, ρ(r)IAM. As equation 11 shows, it is simply the Fourier sum of the differences between the structure factors measured in an experiment or calculated by a theory that models a bonded crystal, Fg
actual, and those calculated for a procrystal of unbonded atoms, FgIAM. Division is always by the cell
volume, Vcell, which results in ∆ρ(r) having units of e-Å-3. Note that if ∆ρ(r) is positive, then this is known as the bonding electron density, whilst if it is negative, it is known as the anti-bonding electron density. Equation 11 and the IAM structure factors for aluminium from Doyle and Turner (211), have been applied to all published sets of structure factors (126, 127, 129, 130, 133, 140, 144, 149, 152, 154, 167 – 186) for aluminium, which nominally constitute Fg
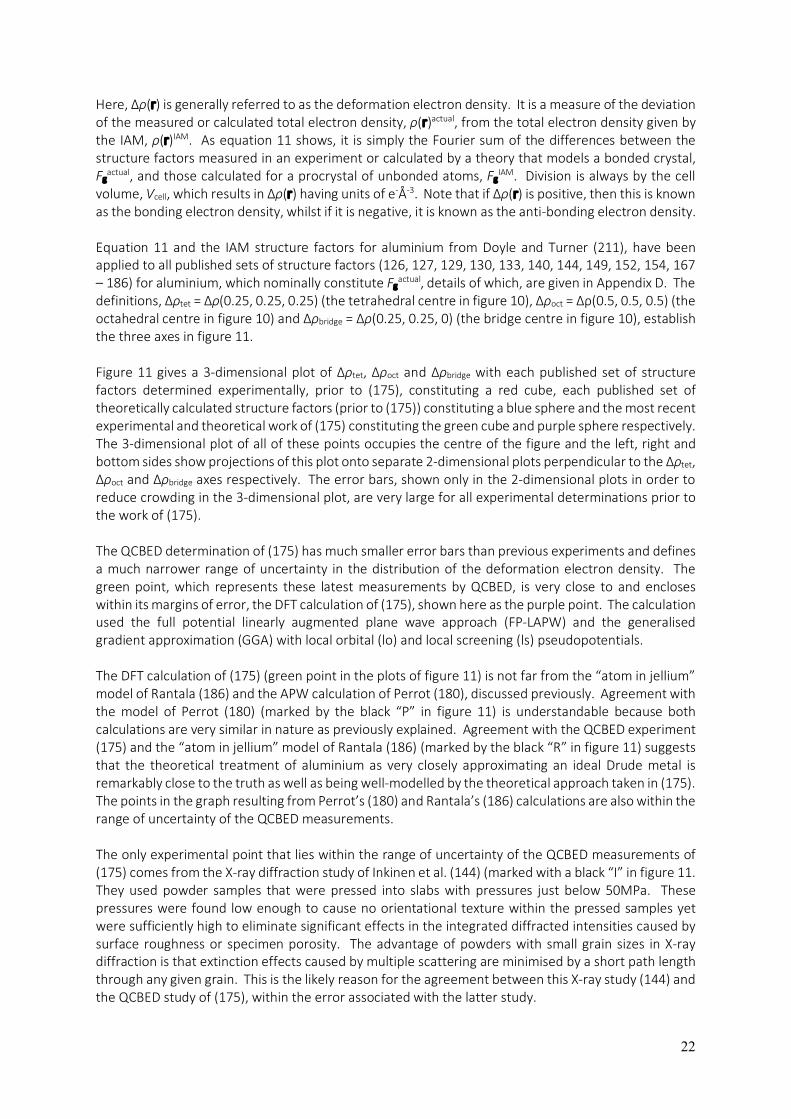
actual, details of which, are given in Appendix D. The definitions, ∆ρtet = ∆ρ(0.25, 0.25, 0.25) (the tetrahedral centre in figure 10), ∆ρoct = ∆ρ(0.5, 0.5, 0.5) (the octahedral centre in figure 10) and ∆ρbridge = ∆ρ(0.25, 0.25, 0) (the bridge centre in figure 10), establish the three axes in figure 11. Figure 11 gives a 3-dimensional plot of ∆ρtet, ∆ρoct and ∆ρbridge with each published set of structure factors determined experimentally, prior to (175), constituting a red cube, each published set of theoretically calculated structure factors (prior to (175)) constituting a blue sphere and the most recent experimental and theoretical work of (175) constituting the green cube and purple sphere respectively. The 3-dimensional plot of all of these points occupies the centre of the figure and the left, right and bottom sides show projections of this plot onto separate 2-dimensional plots perpendicular to the ∆ρtet, ∆ρoct and ∆ρbridge axes respectively. The error bars, shown only in the 2-dimensional plots in order to reduce crowding in the 3-dimensional plot, are very large for all experimental determinations prior to the work of (175). The QCBED determination of (175) has much smaller error bars than previous experiments and defines a much narrower range of uncertainty in the distribution of the deformation electron density. The green point, which represents these latest measurements by QCBED, is very close to and encloses within its margins of error, the DFT calculation of (175), shown here as the purple point. The calculation used the full potential linearly augmented plane wave approach (FP-LAPW) and the generalised gradient approximation (GGA) with local orbital (lo) and local screening (ls) pseudopotentials. The DFT calculation of (175) (green point in the plots of figure 11) is not far from the “atom in jellium” model of Rantala (186) and the APW calculation of Perrot (180), discussed previously. Agreement with the model of Perrot (180) (marked by the black “P” in figure 11) is understandable because both calculations are very similar in nature as previously explained. Agreement with the QCBED experiment (175) and the “atom in jellium” model of Rantala (186) (marked by the black “R” in figure 11) suggests that the theoretical treatment of aluminium as very closely approximating an ideal Drude metal is remarkably close to the truth as well as being well-modelled by the theoretical approach taken in (175). The points in the graph resulting from Perrot’s (180) and Rantala’s (186) calculations are also within the range of uncertainty of the QCBED measurements. The only experimental point that lies within the range of uncertainty of the QCBED measurements of (175) comes from the X-ray diffraction study of Inkinen et al. (144) (marked with a black “I” in figure 11. They used powder samples that were pressed into slabs with pressures just below 50MPa. These pressures were found low enough to cause no orientational texture within the pressed samples yet were sufficiently high to eliminate significant effects in the integrated diffracted intensities caused by surface roughness or specimen porosity. The advantage of powders with small grain sizes in X-ray diffraction is that extinction effects caused by multiple scattering are minimised by a short path length through any given grain. This is the likely reason for the agreement between this X-ray study (144) and the QCBED study of (175), within the error associated with the latter study.

23
Figure 11: Plots of all experimental (126, 127, 129, 130, 133, 140, 144, 149, 152, 154, 167 – 175) and theoretical (175 – 186) determinations of deformation electron density, ∆ρ, in aluminium to date. Note, the deformation electron density is computed by subtracting the independent atom model (IAM) structure factors according to Doyle and Turner (211) from each set of published structure factors. This allows the computation of the Fourier sum that gives the deformation of the electron density from neutral, unbonded atoms. The 3-dimensional axes (labelled only in their 2 dimensional projections in order to reduce clutter) are the deformation electron densities at the tetrahedral (∆ρtet.), octahedral (∆ρoct.) and bridge (∆ρbridge) centres in the x, y and z axes of the plot respectively. The red points show the distribution of all experimentally determined ∆ρtet., ∆ρoct. and ∆ρbridge, prior to the most recent experiments of Nakashima et al. using QCBED (175) (green point). The blue points in the plot comprise all of the theoretical determinations prior to the latest calculations of (175) in which, the FP-LAPW approach and GGA (+lo +ls) were applied using the WIEN2K package (212) (purple point). To give a better impression of the spread of all of the determinations, the 3-dimensional plot is projected along each of its axes to form the 2-dimensional plots shown. Error bars are intentionally omitted from the experimental points in the 3-dimensional plot in order to minimise the obscuration of points by error bars from nearby points. It is noteworthy that the errors associated with the latest QCBED measurements of bonding in aluminium are much smaller than previous experiments. The points marked “P”, “R” and “I” refer to the separate theoretical calculations of Perrot (180) and Rantala (186) and the experimental measurements of Inkinen et al. (144) respectively. These are the only points from structure factor determinations prior to the work of (175) that fall within the bounds of error associated with the benchmark QCBED measurement (green point) presented in (175).
24
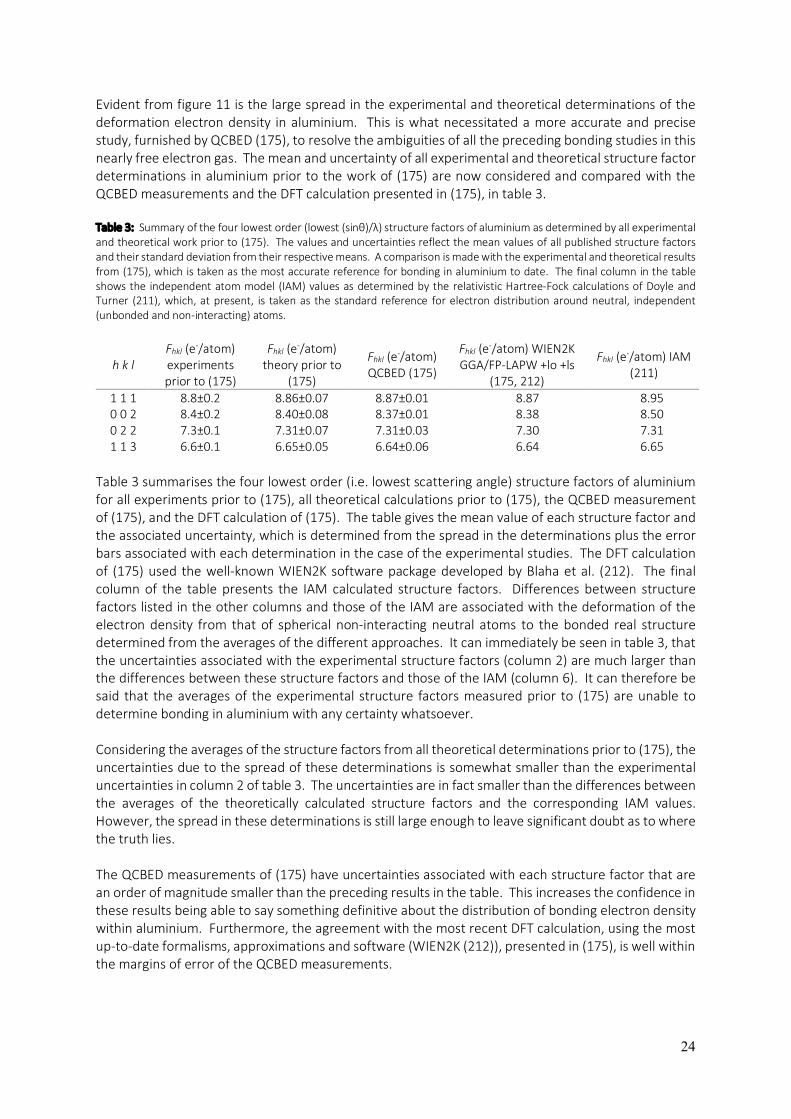
Evident from figure 11 is the large spread in the experimental and theoretical determinations of the deformation electron density in aluminium. This is what necessitated a more accurate and precise study, furnished by QCBED (175), to resolve the ambiguities of all the preceding bonding studies in this nearly free electron gas. The mean and uncertainty of all experimental and theoretical structure factor determinations in aluminium prior to the work of (175) are now considered and compared with the QCBED measurements and the DFT calculation presented in (175), in table 3. Table 3: Summary of the four lowest order (lowest (sinθ)/λ) structure factors of aluminium as determined by all experimental and theoretical work prior to (175). The values and uncertainties reflect the mean values of all published structure factors and their standard deviation from their respective means. A comparison is made with the experimental and theoretical results from (175), which is taken as the most accurate reference for bonding in aluminium to date. The final column in the table shows the independent atom model (IAM) values as determined by the relativistic Hartree-Fock calculations of Doyle and Turner (211), which, at present, is taken as the standard reference for electron distribution around neutral, independent (unbonded and non-interacting) atoms.
h k l Fhkl (e-/atom) experiments prior to (175)
Fhkl (e-/atom) theory prior to
(175)
Fhkl (e-/atom) QCBED (175)
Fhkl (e-/atom) WIEN2K GGA/FP-LAPW +lo +ls
(175, 212)
Fhkl (e-/atom) IAM (211)
1 1 1 8.8±0.2 8.86±0.07 8.87±0.01 8.87 8.95 0 0 2 8.4±0.2 8.40±0.08 8.37±0.01 8.38 8.50 0 2 2 7.3±0.1 7.31±0.07 7.31±0.03 7.30 7.31 1 1 3 6.6±0.1 6.65±0.05 6.64±0.06 6.64 6.65
Table 3 summarises the four lowest order (i.e. lowest scattering angle) structure factors of aluminium for all experiments prior to (175), all theoretical calculations prior to (175), the QCBED measurement of (175), and the DFT calculation of (175). The table gives the mean value of each structure factor and the associated uncertainty, which is determined from the spread in the determinations plus the error bars associated with each determination in the case of the experimental studies. The DFT calculation of (175) used the well-known WIEN2K software package developed by Blaha et al. (212). The final column of the table presents the IAM calculated structure factors. Differences between structure factors listed in the other columns and those of the IAM are associated with the deformation of the electron density from that of spherical non-interacting neutral atoms to the bonded real structure determined from the averages of the different approaches. It can immediately be seen in table 3, that the uncertainties associated with the experimental structure factors (column 2) are much larger than the differences between these structure factors and those of the IAM (column 6). It can therefore be said that the averages of the experimental structure factors measured prior to (175) are unable to determine bonding in aluminium with any certainty whatsoever. Considering the averages of the structure factors from all theoretical determinations prior to (175), the uncertainties due to the spread of these determinations is somewhat smaller than the experimental uncertainties in column 2 of table 3. The uncertainties are in fact smaller than the differences between the averages of the theoretically calculated structure factors and the corresponding IAM values. However, the spread in these determinations is still large enough to leave significant doubt as to where the truth lies. The QCBED measurements of (175) have uncertainties associated with each structure factor that are an order of magnitude smaller than the preceding results in the table. This increases the confidence in these results being able to say something definitive about the distribution of bonding electron density within aluminium. Furthermore, the agreement with the most recent DFT calculation, using the most up-to-date formalisms, approximations and software (WIEN2K (212)), presented in (175), is well within the margins of error of the QCBED measurements.
25
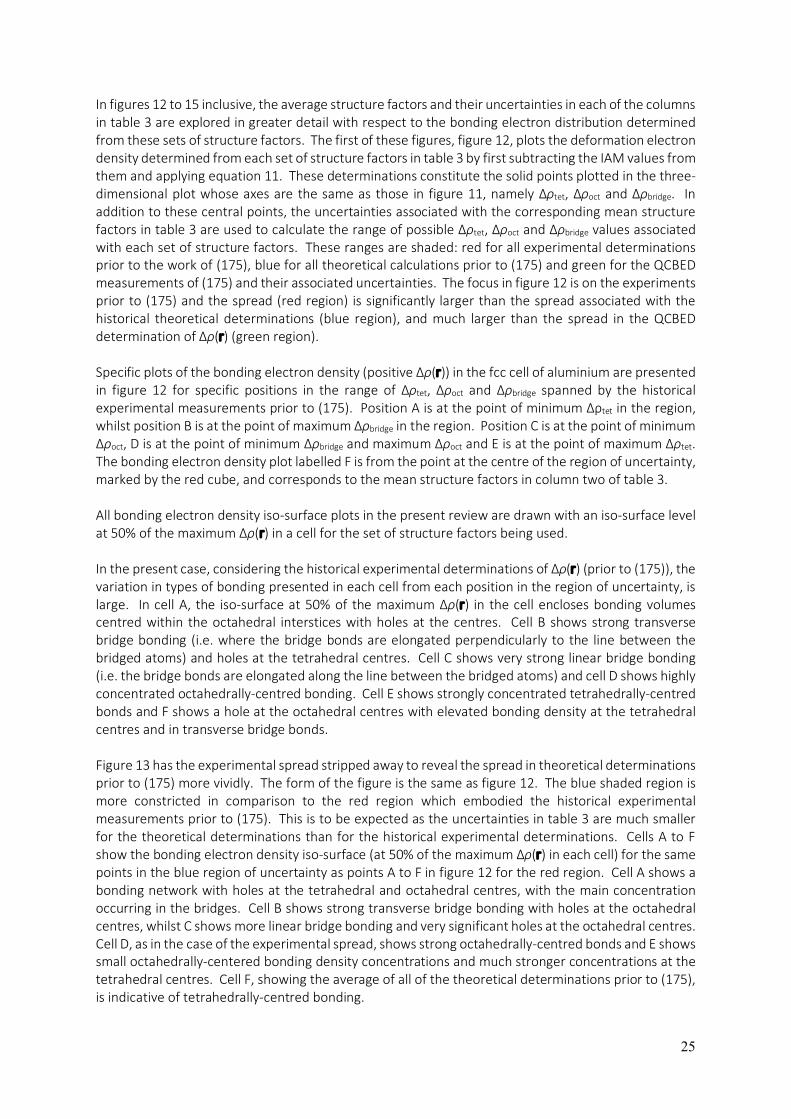
In figures 12 to 15 inclusive, the average structure factors and their uncertainties in each of the columns in table 3 are explored in greater detail with respect to the bonding electron distribution determined from these sets of structure factors. The first of these figures, figure 12, plots the deformation electron density determined from each set of structure factors in table 3 by first subtracting the IAM values from them and applying equation 11. These determinations constitute the solid points plotted in the three-dimensional plot whose axes are the same as those in figure 11, namely ∆ρtet, ∆ρoct and ∆ρbridge. In addition to these central points, the uncertainties associated with the corresponding mean structure factors in table 3 are used to calculate the range of possible ∆ρtet, ∆ρoct and ∆ρbridge values associated with each set of structure factors. These ranges are shaded: red for all experimental determinations prior to the work of (175), blue for all theoretical calculations prior to (175) and green for the QCBED measurements of (175) and their associated uncertainties. The focus in figure 12 is on the experiments prior to (175) and the spread (red region) is significantly larger than the spread associated with the historical theoretical determinations (blue region), and much larger than the spread in the QCBED determination of ∆ρ(r) (green region). Specific plots of the bonding electron density (positive ∆ρ(r)) in the fcc cell of aluminium are presented in figure 12 for specific positions in the range of ∆ρtet, ∆ρoct and ∆ρbridge spanned by the historical experimental measurements prior to (175). Position A is at the point of minimum ∆ρtet in the region, whilst position B is at the point of maximum ∆ρbridge in the region. Position C is at the point of minimum ∆ρoct, D is at the point of minimum ∆ρbridge and maximum ∆ρoct and E is at the point of maximum ∆ρtet. The bonding electron density plot labelled F is from the point at the centre of the region of uncertainty, marked by the red cube, and corresponds to the mean structure factors in column two of table 3. All bonding electron density iso-surface plots in the present review are drawn with an iso-surface level at 50% of the maximum ∆ρ(r) in a cell for the set of structure factors being used. In the present case, considering the historical experimental determinations of ∆ρ(r) (prior to (175)), the variation in types of bonding presented in each cell from each position in the region of uncertainty, is large. In cell A, the iso-surface at 50% of the maximum ∆ρ(r) in the cell encloses bonding volumes centred within the octahedral interstices with holes at the centres. Cell B shows strong transverse bridge bonding (i.e. where the bridge bonds are elongated perpendicularly to the line between the bridged atoms) and holes at the tetrahedral centres. Cell C shows very strong linear bridge bonding (i.e. the bridge bonds are elongated along the line between the bridged atoms) and cell D shows highly concentrated octahedrally-centred bonding. Cell E shows strongly concentrated tetrahedrally-centred bonds and F shows a hole at the octahedral centres with elevated bonding density at the tetrahedral centres and in transverse bridge bonds. Figure 13 has the experimental spread stripped away to reveal the spread in theoretical determinations prior to (175) more vividly. The form of the figure is the same as figure 12. The blue shaded region is more constricted in comparison to the red region which embodied the historical experimental measurements prior to (175). This is to be expected as the uncertainties in table 3 are much smaller for the theoretical determinations than for the historical experimental determinations. Cells A to F show the bonding electron density iso-surface (at 50% of the maximum ∆ρ(r) in each cell) for the same points in the blue region of uncertainty as points A to F in figure 12 for the red region. Cell A shows a bonding network with holes at the tetrahedral and octahedral centres, with the main concentration occurring in the bridges. Cell B shows strong transverse bridge bonding with holes at the octahedral centres, whilst C shows more linear bridge bonding and very significant holes at the octahedral centres. Cell D, as in the case of the experimental spread, shows strong octahedrally-centred bonds and E shows small octahedrally-centered bonding density concentrations and much stronger concentrations at the tetrahedral centres. Cell F, showing the average of all of the theoretical determinations prior to (175), is indicative of tetrahedrally-centred bonding.

26
Figure 12: Plots of the spread in deformation electron density predicted by the mean and margin of error of the all structure factors in table 3. The red shaded region in the three-dimensional plot shows the extent of all possible outcomes from the mean structure factors and their uncertainties determined from all experimental studies prior to that of (175), listed in column 2 of table 3. The actual distributions of the bonding electron density at various points in the region are shown for single unit cells with arrows pointing to the corresponding region of the plot. The locations have the following significance in bounding the region: (A) the point of minimum ∆ρtet., (B) the point of maximum ∆ρbridge, (C) the point of minimum ∆ρoct., (D) the point of minimum ∆ρbridge, which is also the point of maximum ∆ρoct., (E) the point of maximum ∆ρtet., and (F) the point at the centre of the region. The iso-surface plots are at a level of 50% of the maximum bonding density in each cell. Also shown in the graph are the regions of deformation electron density spanned by the mean structure factors and their uncertainties determined from all theoretical calculations preceding (175) (column 3 of table 3) – shaded in blue, and from the QCBED measurements of (175) (column 4 of table 3) – shaded in green. The points corresponding to the mean deformation density distribution for each of these sets of structure factors are shown with red, blue and green points respectively. In this figure, the relevant point, for which the mean bonding density is shown in the dotted cell (F), is the red cube at the centre of the red shaded region. An additional point – a purple sphere, shows the location in the plot of the WIEN2K (212) calculated results from (175) (column 5 of table 3). All deformation densities plotted were determined by subtraction of the IAM (211) structure factors (listed in column 6 of table 3) from each of the other sets of structure factors listed in table 3. The cells in this figure were plotted with VESTA (1). So far, in view of the different bonding distributions possible within the spread of experimental and theoretical studies prior to (175), a definitive conclusion is difficult to draw. This is where an experimental technique with very high precision and accuracy, such as QCBED, can make a definitive assessment. Figure 14 strips away the blue shaded region of theoretical uncertainty examined in figure 13, to reveal the highly constricted green region that represents the uncertainty associated with the QCBED measurements of (175). Again, cells A to F correspond to the same significant points in the green (QCBED) region of uncertainty as in previous graphs for the red (previous experiments) and blue
27
(previous theoretical determinations) uncertainties. In all cases, the bonding is dominantly tetrahedrally-centred, with no indication of any octahedrally-centred bonding at all. Cells A to C show some significant concentrations of bonding electron density at the bridge centres and in every case, the form of the bonding is transverse in the bridges. Cells D to F all show nearly identical bonding concentrations, which are exclusively tetrahedrally-centred. It is important to note that morphologically, tetrahedrally-centred bonds that have a larger spatial extent will lead to significant bonding electron density at the bridge centres. Furthermore, what is evident from the consistency of the iso-surfaces near the bridge centres in cells A to C, is that the shapes of the associated tetrahedrally-centred bonds are all the same in cells A to C. Close inspection of the iso-surfaces in cells D to F reveals that if the surfaces were expanded about the tetrahedral centres, the intersection with the cell faces at the bridge positions would result in transverse forms similar to those observed in cells A to C.
Figure 13: As per figure 12, except that the red region and corresponding bonding density plots are hidden, with the focus here being on all theoretical calculations preceding (175) (column 3 of table 3) – shaded in blue. Again, the letter of each cell corresponds to the same point for the blue region as described for the red region in figure 12, and the dotted cell (F) indicates the mean bonding electron density determined from all theoretical calculations preceding (175), which is the centre of the blue region indicated by the blue sphere. All iso-surfaces are drawn at a level of 50% of the maximum bonding density in a cell for each region. The cells in this figure were plotted with VESTA (1). The very high precision of the QCBED measurements of (175) affords the first definitive experimental conclusion that bonding in aluminium is almost purely tetrahedral in nature. As discussed in (175), even relatively recent theoretical studies by Kioussis et al. (213) and Ogata et al. (214), published almost simultaneously but without structure factors, are at odds about the bonding in aluminium. The former study (213) was correct in asserting that the bonds are tetrahedrally-centred, whilst the latter study
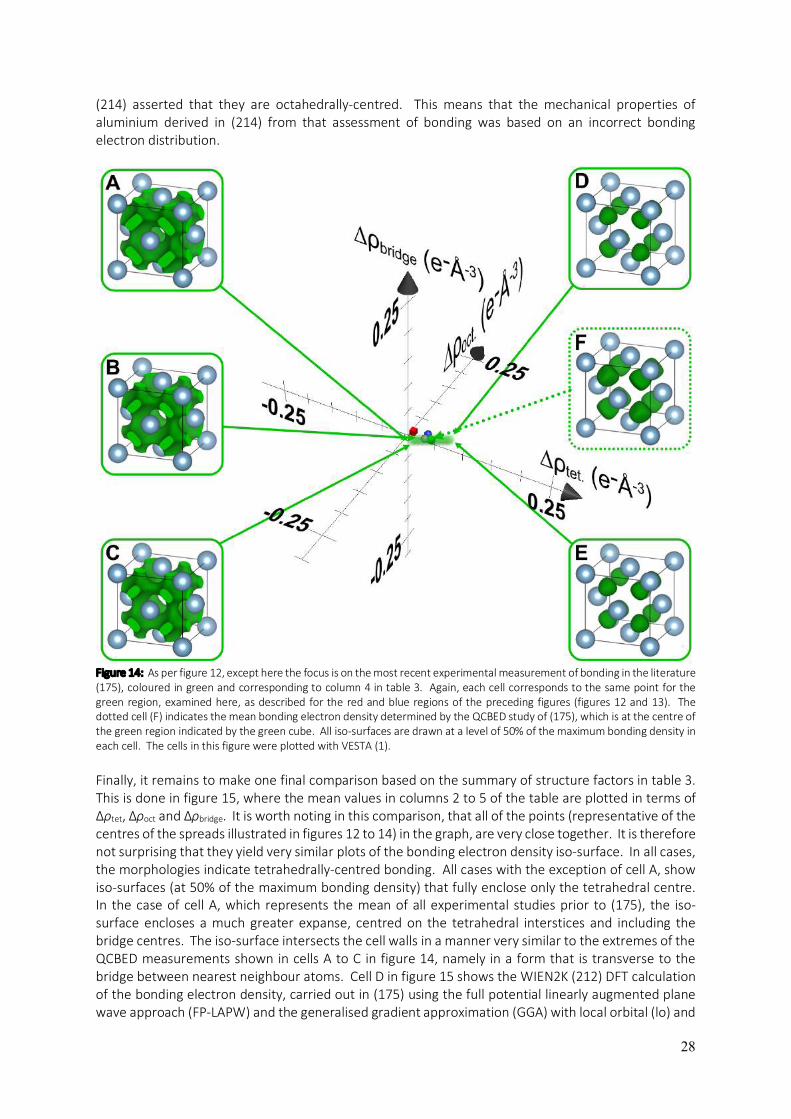
28
(214) asserted that they are octahedrally-centred. This means that the mechanical properties of aluminium derived in (214) from that assessment of bonding was based on an incorrect bonding electron distribution.
Figure 14: As per figure 12, except here the focus is on the most recent experimental measurement of bonding in the literature (175), coloured in green and corresponding to column 4 in table 3. Again, each cell corresponds to the same point for the green region, examined here, as described for the red and blue regions of the preceding figures (figures 12 and 13). The dotted cell (F) indicates the mean bonding electron density determined by the QCBED study of (175), which is at the centre of the green region indicated by the green cube. All iso-surfaces are drawn at a level of 50% of the maximum bonding density in each cell. The cells in this figure were plotted with VESTA (1). Finally, it remains to make one final comparison based on the summary of structure factors in table 3. This is done in figure 15, where the mean values in columns 2 to 5 of the table are plotted in terms of ∆ρtet, ∆ρoct and ∆ρbridge. It is worth noting in this comparison, that all of the points (representative of the centres of the spreads illustrated in figures 12 to 14) in the graph, are very close together. It is therefore not surprising that they yield very similar plots of the bonding electron density iso-surface. In all cases, the morphologies indicate tetrahedrally-centred bonding. All cases with the exception of cell A, show iso-surfaces (at 50% of the maximum bonding density) that fully enclose only the tetrahedral centre. In the case of cell A, which represents the mean of all experimental studies prior to (175), the iso-surface encloses a much greater expanse, centred on the tetrahedral interstices and including the bridge centres. The iso-surface intersects the cell walls in a manner very similar to the extremes of the QCBED measurements shown in cells A to C in figure 14, namely in a form that is transverse to the bridge between nearest neighbour atoms. Cell D in figure 15 shows the WIEN2K (212) DFT calculation of the bonding electron density, carried out in (175) using the full potential linearly augmented plane wave approach (FP-LAPW) and the generalised gradient approximation (GGA) with local orbital (lo) and
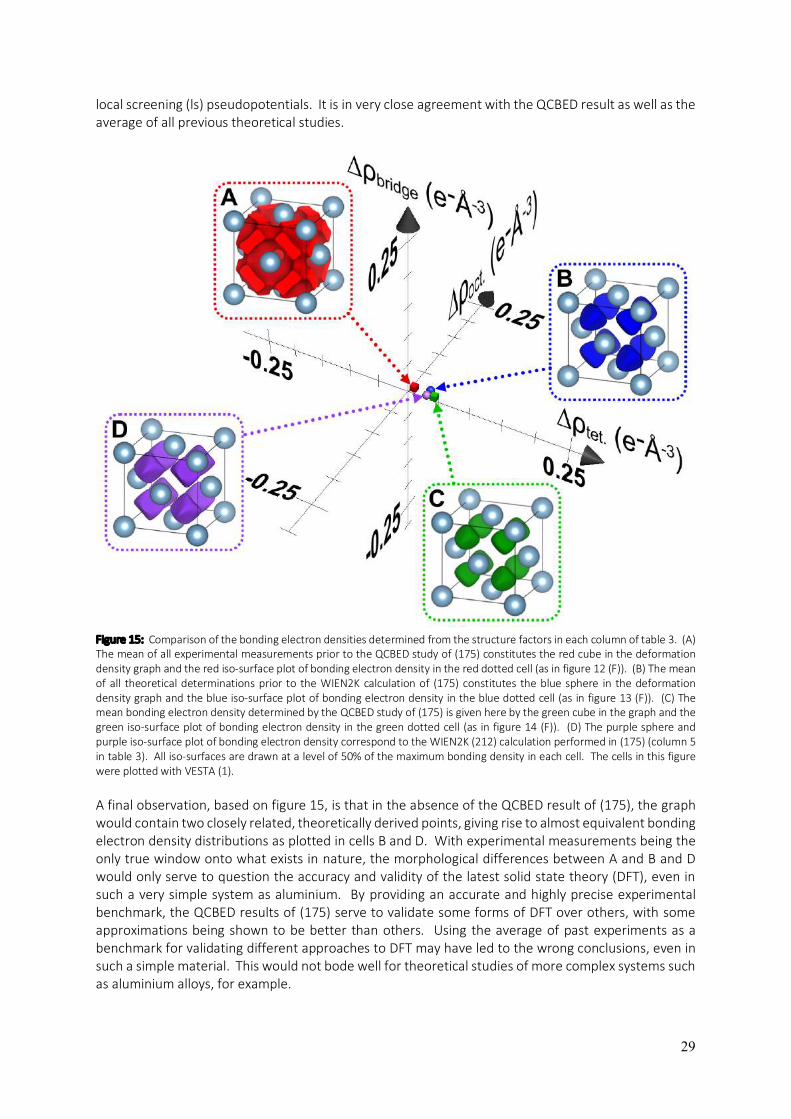
29
local screening (ls) pseudopotentials. It is in very close agreement with the QCBED result as well as the average of all previous theoretical studies.
Figure 15: Comparison of the bonding electron densities determined from the structure factors in each column of table 3. (A) The mean of all experimental measurements prior to the QCBED study of (175) constitutes the red cube in the deformation density graph and the red iso-surface plot of bonding electron density in the red dotted cell (as in figure 12 (F)). (B) The mean of all theoretical determinations prior to the WIEN2K calculation of (175) constitutes the blue sphere in the deformation density graph and the blue iso-surface plot of bonding electron density in the blue dotted cell (as in figure 13 (F)). (C) The mean bonding electron density determined by the QCBED study of (175) is given here by the green cube in the graph and the green iso-surface plot of bonding electron density in the green dotted cell (as in figure 14 (F)). (D) The purple sphere and purple iso-surface plot of bonding electron density correspond to the WIEN2K (212) calculation performed in (175) (column 5 in table 3). All iso-surfaces are drawn at a level of 50% of the maximum bonding density in each cell. The cells in this figure were plotted with VESTA (1). A final observation, based on figure 15, is that in the absence of the QCBED result of (175), the graph would contain two closely related, theoretically derived points, giving rise to almost equivalent bonding electron density distributions as plotted in cells B and D. With experimental measurements being the only true window onto what exists in nature, the morphological differences between A and B and D would only serve to question the accuracy and validity of the latest solid state theory (DFT), even in such a very simple system as aluminium. By providing an accurate and highly precise experimental benchmark, the QCBED results of (175) serve to validate some forms of DFT over others, with some approximations being shown to be better than others. Using the average of past experiments as a benchmark for validating different approaches to DFT may have led to the wrong conclusions, even in such a simple material. This would not bode well for theoretical studies of more complex systems such as aluminium alloys, for example.

30
The Crystallography of (some) Aluminium Alloys In the first four sections of this chapter, the fundamental aspects of the crystallography of pure aluminium were discussed at length. These were: (I) the crystal structure, (II) the lattice parameter, (III) the thermal vibration amplitude (Debye-Waller factor) of elemental aluminium, and (IV) the bonding electron distribution in aluminium. In this section, all of these aspects are brought to bear on the crystallography of aluminium alloys in the form of a general discussion, using a number of well-known examples, and a review of key literature on the crystallography of some significant aluminium alloys. For the sake of brevity, it is impossible to discuss the crystallography of all aluminium alloys in this section. It is also impossible to detail and review all of the techniques used to characterise aluminium alloys and their constituent phases. The present section therefore provides a perspective for considering the crystallography of aluminium alloys and illustrates the ideas presented with a small number of examples which have gained significant attention in the scientific literature. Before commencing, however, it is worth giving a very brief review of the vast literature discussing the characterisation and application of aluminium alloy crystallography. The following, very simple and brief summary is given in order to provide a few illustrative examples of pioneering, developmental and state-of-the-art research into the atomic structure of aluminium alloys. Aluminium alloys fall into the following classes or series (references are a selection of works involving crystallographic characterization of alloys that fall within each class and that may not otherwise have been cited in other parts of the present review. Note that where a code has not been designated to the alloy being studied, the alloy has been assigned a class based on the main alloying element): 1XXX - commercially pure aluminium (having a minimum purity of 99%) (215 – 219). 2XXX - copper (Cu) is the main alloying element (219 – 283). 3XXX - manganese (Mn) is the main alloying element (284 – 292). 4XXX - silicon (Si) is the main alloying element (219, 293 – 303). 5XXX - magnesium (Mg) is the main alloying element (275, 304 – 312). 6XXX - magnesium (Mg) and silicon (Si) are the main alloying elements (230, 234, 242, 243, 267, 278,
287, 313 – 359). 7XXX - zinc (Zn) is the main alloying element (230, 234, 267, 278, 287, 360 – 379). 8XXX - other elements including rare earths are used as the main alloy elements (216, 245, 286, 287,
380 – 408). High entropy alloys (HEAs) (409). An extensive generic review in terms of structure and properties is given by Mondolfo (410), giving almost complete coverage of all aluminium alloys with the exception of those that have been developed since the 1980s. The characterization, analysis, prediction and modelling of aluminium alloy crystallography, structure and composition, have involved the following techniques (references from the list above are associated with each of the techniques involved in each of the works). Experimental Methods: X-ray diffraction: (218, 220 – 225, 237, 264, 270, 277, 285, 286, 289, 293, 294, 376, 386, 387, 394, 397, 402 – 404, 409). Selected area electron diffraction (SAED):
31
(217, 226 – 228, 230, 232, 235, 236, 238, 239, 241, 243, 245, 247, 248, 250 – 253, 257, 264, 265, 268, 270, 273, 281 – 287, 289 – 292, 295, 298, 300, 301, 305, 310, 312 – 314, 316, 318 – 323, 325, 327, 329, 331, 333 – 335, 337, 342, 348, 360 – 365, 367, 368, 370 – 372, 374, 381 – 385, 389, 390, 394, 395, 401, 402). Quantitative SAED atomic structure solution via Multislice Least Squares (MSLS): (315, 316, 331, 332, 339). Convergent-beam electron diffraction (CBED): (226, 230, 253, 270, 282, 283, 287, 297, 298, 303 – 306, 311, 320, 335, 337, 374, 381 – 383, 385, 403, 405). Position-averaged convergent-beam electron diffraction (PACBED): (267, 309). Quantitative CBED (QCBED) bonding measurements in monolithic intermetallic phases: (382). Neutron diffraction: (268). Precession electron diffraction (PED): (287, 337, 369, 371). Small angle X-ray scattering (SAXS): (259, 268, 367, 370). Extended X-ray absorption fine structure (EXAFS): (302). X-ray absorption near-edge structure (XANES): (302). X-ray texture analysis: (215). Positron annihilation lifetime spectroscopy (PALS) / Coincidence Doppler broadening (CDB): (232, 312). Differential scanning calorimetry (DSC): (248, 251, 317, 322, 323, 325, 379, 394). Scanning electron microscopy (SEM): (215, 218, 236, 273, 288, 296, 297, 366, 384, 386, 394, 402, 404). Electron Backscatter Diffraction (EBSD): (249, 288, 296, 297, 337, 403). Energy dispersive (X-ray) spectroscopy (EDS) / Spectrum imaging: (226 – 228, 236, 247, 253, 266, 273, 274, 278, 280, 281, 296, 297, 301, 303, 305, 312, 333, 337, 348, 366, 372, 374, 378, 379, 381, 388, 400, 403, 404).
32
Optical Microscopy: (215, 272, 394). Nuclear magnetic resonance (NMR) spectroscopy: (240, 246, 264, 376). Muon spin relaxation (MSR): (355). Confocal laser scanning microscopy (CLSM): (272). High-resolution transmission electron microscopy (HRTEM): (217, 227, 229 – 231, 233, 238, 239, 241, 243, 245, 247, 250, 252 – 254, 256, 265, 269, 273, 283, 287, 290 – 292, 300, 301, 303, 305, 311 – 321, 324, 326, 327, 329, 331 – 336, 339, 340, 342, 344, 345, 354, 363 – 365, 371, 380, 385, 391, 393, 394, 396, 399 – 401). Energy-filtered transmission electron microscopy (EFTEM) / Electron energy-loss spectroscopy (EELS) / Spectrum imaging: (259, 273, 274, 353, 377, 379, 388). Through-focal series reconstruction HRTEM: (260, 328). 3D Atom Probe / Field Ion Microscopy (3D APFIM also known as atom probe tomography (APT)): (219, 230, 239, 245, 250, 255 – 257, 265, 273, 277, 279, 301, 302, 308, 317 – 319, 332, 336, 341, 348, 362, 364, 368, 370, 373 – 375, 385, 393, 399, 407, 411). High angle annular dark field (HAADF) / annular dark field (ADF) scanning transmission electron microscopy (STEM): (262, 269, 292, 301, 307, 326, 333, 334, 344, 348, 400, 408). Annular bright field (ABF) STEM: (334). Aberration-corrected HAADF / ADF-STEM: (257 – 262, 266 – 268, 271 – 274, 278 – 282, 307, 309, 338 – 340, 345, 347, 349 – 354, 356 – 359, 377 – 379, 405, 407, 408). Aberration-corrected bright-field STEM: (257, 357). Quantitative HAADF-STEM: (259, 260, 309, 351, 405). Electron tomography: (269, 292, 407).

33
Theoretical Modelling / Data Analysis Techniques: Density functional theory (DFT): (234, 242, 260, 261, 271, 276, 307, 328, 330, 339, 343, 346, 350, 351, 358, 378, 408). Lattice matching: (299, 392, 398, 406). Multislice simulations of lattice images: (227, 238, 247, 250, 260 – 262, 265, 274, 309, 351, 380, 405). Multislice calculations of electron diffraction patterns: (250, 315, 316, 331, 332, 339). Bloch-wave simulations of CBED patterns: (337, 382). Lattice rectification (solid solutions): (308). Cluster identification techniques in 3D APFIM: (341). Phase-field modelling: (263, 276). Monte Carlo / molecular dynamics simulations of structural evolution: (275). Semi-empirical modelling based on data mining: (293). These lists are only small subsets of all of the existing literature on the experimental and theoretical investigation of the crystallography, composition and structure of aluminium alloys. They are biased towards more recent work but also include some examples of landmark pioneering research. They do not cover all systems that have been explored or that are being explored. It is emphasised again that the references given here serve to provide just a taste for the vast research into the crystallography of aluminium alloys. At this point, it is worth returning to the key concepts developed and explored for pure aluminium, in order to apply them to aluminium alloys. Crystal structures of (some) aluminium alloys Alloys can take the form of a solid solution, which has a homogeneous crystal structure of the same form (single phase) everywhere (allowing for changes in orientation from grain to grain in a polycrystalline microstructure and also allowing for crystal defects within each grain). Alternatively, alloys can consist of a dominant matrix phase, or parent crystal structure, containing a dispersion of intermetallic precipitates that have different crystal structures and compositions to the matrix and make up a small volume fraction of the alloy. Eutectic mixtures consist of interleaved metallic phases of differing compositions which dominate the microstructure (412).

34
The majority of commercial and research interest in aluminium alloys is in age hardenable alloys (or precipitation hardening alloys), which begin as supersaturated solid solutions (SSSS). These are subjected to ageing heat treatments which result in the migration of solute atoms to points of nucleation of intermetallic phases. Often, a crystallographic phase transformation ensues in the formation of a critical nucleus for a precipitating intermetallic phase, which grows until the local concentration of solute atoms decreases below a critical concentration or crystallographic barriers to precipitate growth stop the process. In cases where the intermetallic precipitates act as strong barriers to the movement of dislocations, strengthening occurs. Where they promote or mediate the movement of dislocations, the alloy is embrittled or weakened. In a rather hand-waving manner of describing precipitation hardened alloys, the metaphor is that the precipitates act as a strengthening scaffold in an otherwise relatively weak matrix. Pure aluminium (99.999+% purity) has an ultimate tensile strength (UTS) of 40 to 50 MPa (410), whilst some of the strongest precipitation-hardened alloys have UTS’s exceeding 700 MPa (e.g. Weldalite 049 which is an Al-Cu-Li-Mg-Ag-Zr alloy) (413). This massive increase in strength means that these types of alloys have a very high strength-to-weight ratio that makes them competitive with high-strength steels. The alloying elements are present at concentrations of only a few atomic percent and therefore, changes in density compared to pure aluminium are negligible in the face of the 10- to 20-fold gains in strength. These gains in strength are largely due to the scaffolding effect of high-aspect-ratio strengthening precipitates that inhibit dislocation movement within the alloys. This section makes examples of the most prominent strengthening precipitate phases that have been the focus of significant research. These include the θ” (Al3Cu), θ’ (Al2Cu) and θ (Al2Cu) precipitate phases in Al-Cu based alloys (104, 220, 230, 239, 245, 261 – 263, 268, 271), the T1 phase (Al2CuLi) in Al-Cu-Li based alloys (225, 241, 245, 259, 260, 268, 272, 279 – 281), the Ω phase (Al2Cu) in Al-Cu-Mg-Ag alloys (226, 230, 231, 235, 239, 245, 274) and the S phase (Al2CuMg) in Al-Cu-Mg alloys (229, 230, 234, 239, 245, 251, 252, 256, 258). All of these alloy systems fall within the 2XXX and 8XXX series of aluminium alloys but the crystallographic concepts explored here are equally applicable in the other series and, consequently, to other intermetallic precipitate phases and solid solutions. Figure 16 begins in part a with an illustration of a binary Al-Cu solid solution with copper atoms present at an atomic concentration of approximately 4%. Given that the maximum solid solubility of copper in aluminium is 2.4 atomic percent (413), figure 16 (a) represents a supersaturated solid solution (SSSS). Copper atoms are too large to fit into any interstitial sites within the fcc lattice of aluminium, and they are thus substitutional. Note that distortions of the lattice due to the smaller copper atoms are not drawn into this depiction of the Al-Cu solid solution. Heat treatment (artificial ageing) of this SSSS results in the possible formation of numerous phases including Guinier-Preston (GP) zones (414, 415) (which are single continuous planes of copper atoms substituted on aluminium lattice sites), θ” precipitates (consisting of multiple GP zones separated by three {002} planes of aluminium (see table 4)), θ’ precipitates (shown in figure 16 (b) and table 4) and eventually, the stable θ phase (see table 4). GP zones, θ” and θ’ are all metastable phases, whilst the θ phase is the end product of the solid-state reaction: SSSS -> GP + θ” + matrix -> θ’ + matrix -> θ + matrix. It is the θ’ phase that is the most effective strengthening precipitate and processing routes for Al-Cu based alloys are frequently tailored to promote a high number density of θ’ precipitates. Figure 16 (b) shows a block of Al-Cu alloy containing a θ’ precipitate which is sandwiched on both major {001} facets by the aluminium matrix. Parts c and d of the figure show the unit cells of θ’ and the aluminium matrix in the orientation relationship they have within the alloy. The tetragonal cell of θ’ has very similar a and b lattice parameters to the

35
corresponding lattice parameters in the Alfcc cell shown in part d, with only a 0.2% linear misfit (see also table 4). The c lattice parameter of θ’, cθ’, is significantly different and can impart a large amount of strain in the direction normal to the θ’ precipitate. This strain is minimised for certain multiples of cθ’, which span thicknesses that are very close to integer multiples of the aluminium matrix c lattice parameter, cAl, fcc. One such case is drawn in both parts b and e of figure 16 where 3.5cθ’ is approximately
Figure 16: An illustration of the θ’ phase (Al2Cu) embedded in the aluminium alloy matrix. The precursor supersaturated solid solution is illustrated with a 10x10x10 fcc unit cell block containing randomly placed copper atoms at a concentration of approximately 4 at. % (a). Aluminium alloy solid solutions are usually always substitutional, as shown in the present case. After heat treatment, precipitates can form, such as the segment of θ’ phase shown in part b. The unit cell of θ’ is shown in part c and the fcc unit cell of aluminium is shown for comparison beneath it (d). In part e, a slice one unit cell thick is taken through the precipitate structure and the surrounding matrix to show the relationship between the precipitate and matrix structures. A situation of minimal volumetric strain is illustrated which involves a precipitate thickness of 3.5 unit cells of θ’ in the c-axis of θ’, which corresponds to nearly 5 fcc unit cells of aluminium. This θ’ thickness of 3.5cθ’ is known as a “magic thickness” (262). This figure illustrates a binary alloy (2 elements) and was drawn with the aid of VESTA (1).
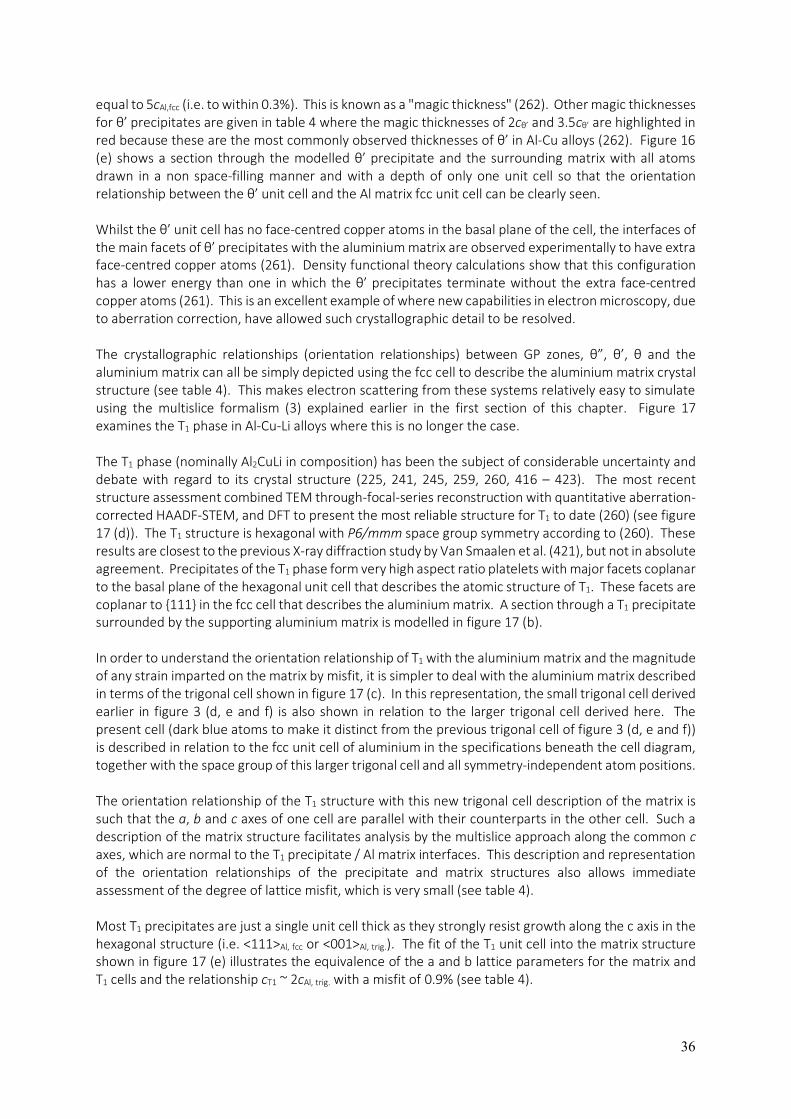
36
equal to 5cAl,fcc (i.e. to within 0.3%). This is known as a "magic thickness" (262). Other magic thicknesses for θ’ precipitates are given in table 4 where the magic thicknesses of 2cθ’ and 3.5cθ’ are highlighted in red because these are the most commonly observed thicknesses of θ’ in Al-Cu alloys (262). Figure 16 (e) shows a section through the modelled θ’ precipitate and the surrounding matrix with all atoms drawn in a non space-filling manner and with a depth of only one unit cell so that the orientation relationship between the θ’ unit cell and the Al matrix fcc unit cell can be clearly seen. Whilst the θ’ unit cell has no face-centred copper atoms in the basal plane of the cell, the interfaces of the main facets of θ’ precipitates with the aluminium matrix are observed experimentally to have extra face-centred copper atoms (261). Density functional theory calculations show that this configuration has a lower energy than one in which the θ’ precipitates terminate without the extra face-centred copper atoms (261). This is an excellent example of where new capabilities in electron microscopy, due to aberration correction, have allowed such crystallographic detail to be resolved. The crystallographic relationships (orientation relationships) between GP zones, θ”, θ’, θ and the aluminium matrix can all be simply depicted using the fcc cell to describe the aluminium matrix crystal structure (see table 4). This makes electron scattering from these systems relatively easy to simulate using the multislice formalism (3) explained earlier in the first section of this chapter. Figure 17 examines the T1 phase in Al-Cu-Li alloys where this is no longer the case. The T1 phase (nominally Al2CuLi in composition) has been the subject of considerable uncertainty and debate with regard to its crystal structure (225, 241, 245, 259, 260, 416 – 423). The most recent structure assessment combined TEM through-focal-series reconstruction with quantitative aberration-corrected HAADF-STEM, and DFT to present the most reliable structure for T1 to date (260) (see figure 17 (d)). The T1 structure is hexagonal with P6/mmm space group symmetry according to (260). These results are closest to the previous X-ray diffraction study by Van Smaalen et al. (421), but not in absolute agreement. Precipitates of the T1 phase form very high aspect ratio platelets with major facets coplanar to the basal plane of the hexagonal unit cell that describes the atomic structure of T1. These facets are coplanar to {111} in the fcc cell that describes the aluminium matrix. A section through a T1 precipitate surrounded by the supporting aluminium matrix is modelled in figure 17 (b). In order to understand the orientation relationship of T1 with the aluminium matrix and the magnitude of any strain imparted on the matrix by misfit, it is simpler to deal with the aluminium matrix described in terms of the trigonal cell shown in figure 17 (c). In this representation, the small trigonal cell derived earlier in figure 3 (d, e and f) is also shown in relation to the larger trigonal cell derived here. The present cell (dark blue atoms to make it distinct from the previous trigonal cell of figure 3 (d, e and f)) is described in relation to the fcc unit cell of aluminium in the specifications beneath the cell diagram, together with the space group of this larger trigonal cell and all symmetry-independent atom positions. The orientation relationship of the T1 structure with this new trigonal cell description of the matrix is such that the a, b and c axes of one cell are parallel with their counterparts in the other cell. Such a description of the matrix structure facilitates analysis by the multislice approach along the common c axes, which are normal to the T1 precipitate / Al matrix interfaces. This description and representation of the orientation relationships of the precipitate and matrix structures also allows immediate assessment of the degree of lattice misfit, which is very small (see table 4). Most T1 precipitates are just a single unit cell thick as they strongly resist growth along the c axis in the hexagonal structure (i.e. <111>Al, fcc or <001>Al, trig.). The fit of the T1 unit cell into the matrix structure shown in figure 17 (e) illustrates the equivalence of the a and b lattice parameters for the matrix and T1 cells and the relationship cT1 ~ 2cAl, trig. with a misfit of 0.9% (see table 4).
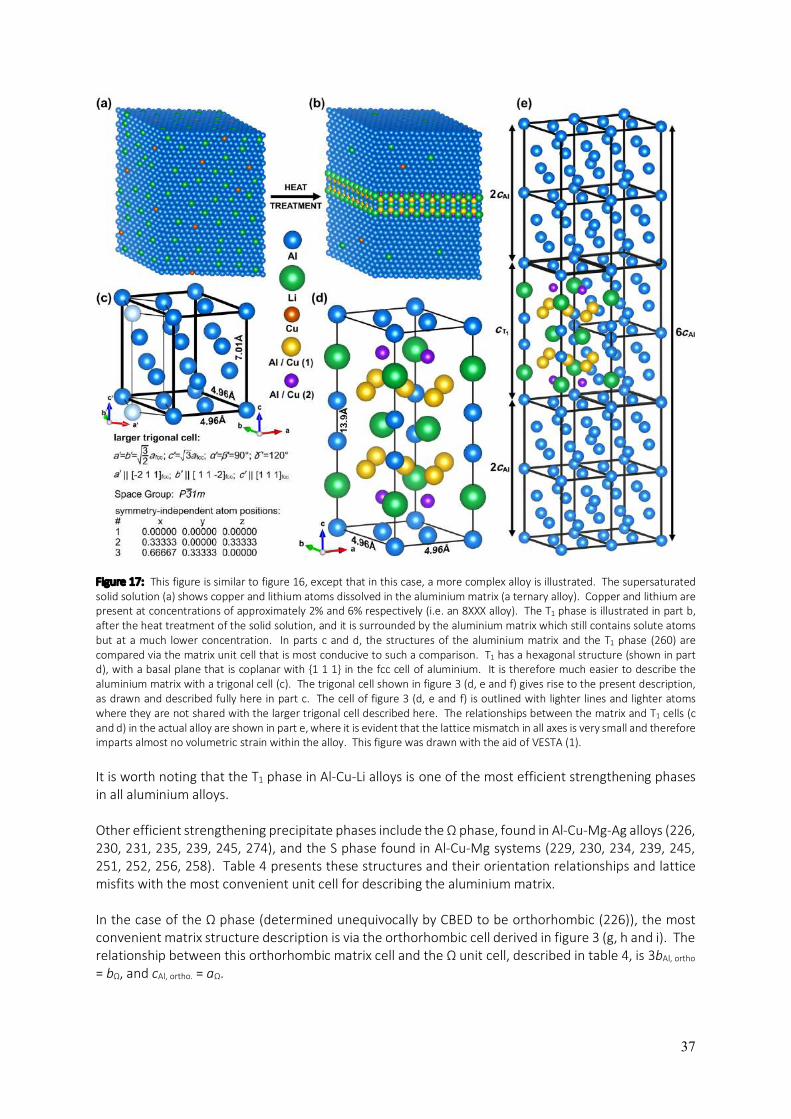
37
Figure 17: This figure is similar to figure 16, except that in this case, a more complex alloy is illustrated. The supersaturated solid solution (a) shows copper and lithium atoms dissolved in the aluminium matrix (a ternary alloy). Copper and lithium are present at concentrations of approximately 2% and 6% respectively (i.e. an 8XXX alloy). The T1 phase is illustrated in part b, after the heat treatment of the solid solution, and it is surrounded by the aluminium matrix which still contains solute atoms but at a much lower concentration. In parts c and d, the structures of the aluminium matrix and the T1 phase (260) are compared via the matrix unit cell that is most conducive to such a comparison. T1 has a hexagonal structure (shown in part d), with a basal plane that is coplanar with {1 1 1} in the fcc cell of aluminium. It is therefore much easier to describe the aluminium matrix with a trigonal cell (c). The trigonal cell shown in figure 3 (d, e and f) gives rise to the present description, as drawn and described fully here in part c. The cell of figure 3 (d, e and f) is outlined with lighter lines and lighter atoms where they are not shared with the larger trigonal cell described here. The relationships between the matrix and T1 cells (c and d) in the actual alloy are shown in part e, where it is evident that the lattice mismatch in all axes is very small and therefore imparts almost no volumetric strain within the alloy. This figure was drawn with the aid of VESTA (1). It is worth noting that the T1 phase in Al-Cu-Li alloys is one of the most efficient strengthening phases in all aluminium alloys. Other efficient strengthening precipitate phases include the Ω phase, found in Al-Cu-Mg-Ag alloys (226, 230, 231, 235, 239, 245, 274), and the S phase found in Al-Cu-Mg systems (229, 230, 234, 239, 245, 251, 252, 256, 258). Table 4 presents these structures and their orientation relationships and lattice misfits with the most convenient unit cell for describing the aluminium matrix. In the case of the Ω phase (determined unequivocally by CBED to be orthorhombic (226)), the most convenient matrix structure description is via the orthorhombic cell derived in figure 3 (g, h and i). The relationship between this orthorhombic matrix cell and the Ω unit cell, described in table 4, is 3bAl, ortho
= bΩ, and cAl, ortho. = aΩ.
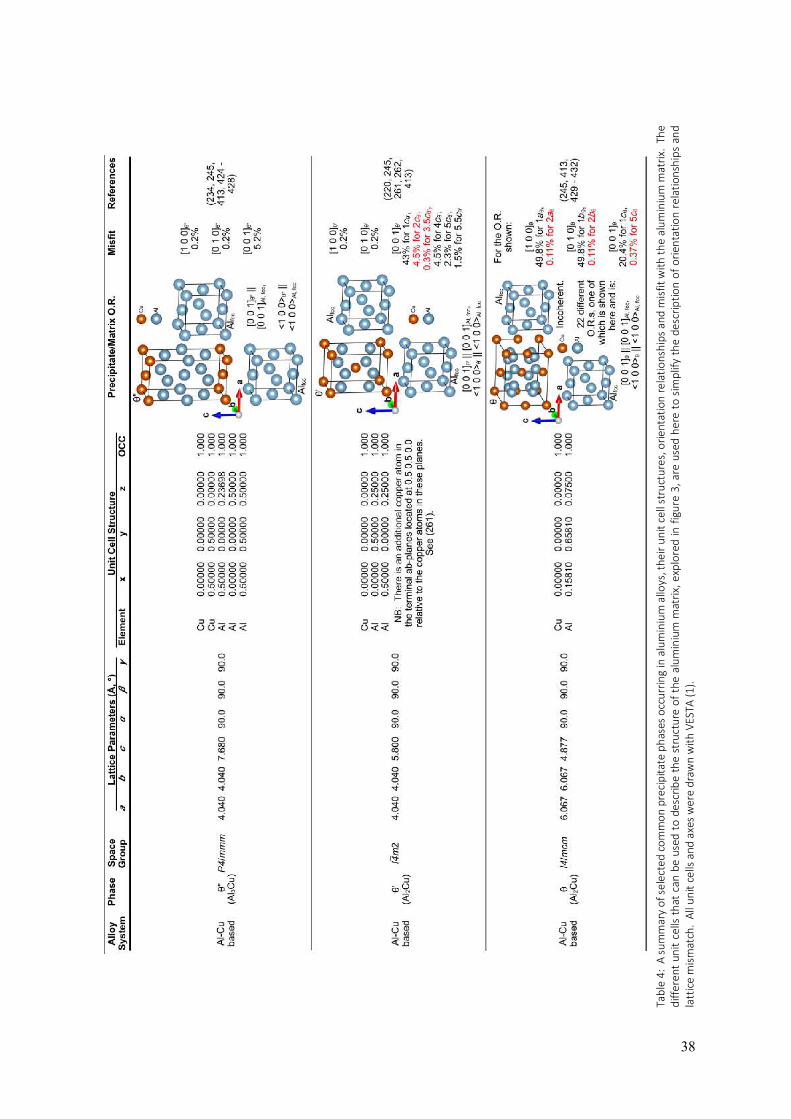
38
Tabl
e 4:
A su
mm
ary
of se
lect
ed c
omm
on p
reci
pita
te p
hase
s occ
urrin
g in
alu
min
ium
allo
ys, t
heir
unit
cell
stru
ctur
es, o
rient
atio
n re
latio
nshi
ps a
nd m
isfit
with
the
alum
iniu
m m
atrix
. Th
e di
ffere
nt u
nit c
ells
that
can
be
used
to d
escr
ibe
the
stru
ctur
e of
the
alum
iniu
m m
atrix
, exp
lore
d in
figu
re 3
, are
use
d he
re t
o sim
plify
the
desc
riptio
n of
orie
ntat
ion
rela
tions
hips
and
la
ttice
mism
atch
. Al
l uni
t cel
ls an
d ax
es w
ere
draw
n w
ith V
ESTA
(1).

39
Tabl
e 4
(con
tinue
d):
A su
mm
ary
of se
lect
ed c
omm
on p
recip
itate
pha
ses o
ccur
ring
in a
lum
iniu
m a
lloys
, the
ir un
it ce
ll st
ruct
ures
, orie
ntat
ion
rela
tions
hips
and
misf
it w
ith th
e al
umin
ium
m
atrix
. The
diff
eren
t uni
t cel
ls th
at ca
n be
use
d to
des
crib
e th
e st
ruct
ure
of th
e al
umin
ium
mat
rix, e
xplo
red
in fi
gure
3, a
re u
sed
here
to si
mpl
ify th
e de
scrip
tion
of o
rient
atio
n re
latio
nshi
ps
and
latt
ice m
ismat
ch.
All u
nit c
ells
and
axes
wer
e dr
awn
with
VES
TA (1
).
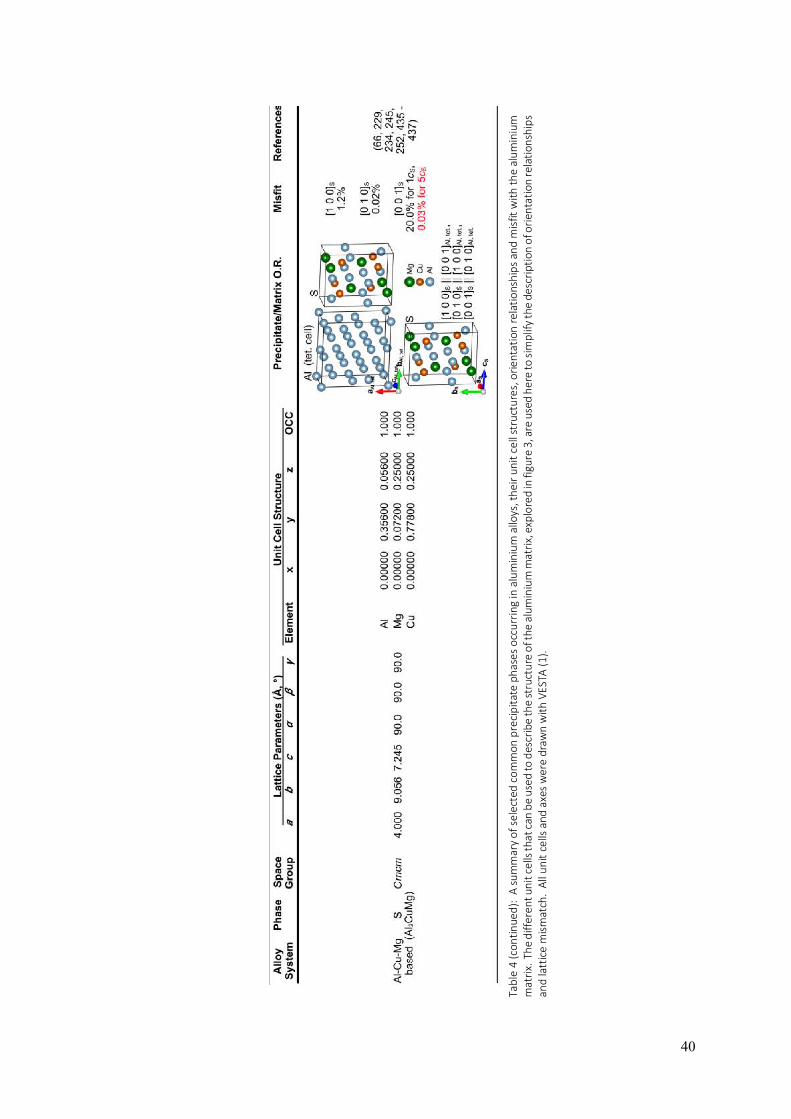
40
Tabl
e 4
(con
tinue
d):
A su
mm
ary
of se
lect
ed c
omm
on p
recip
itate
pha
ses o
ccur
ring
in a
lum
iniu
m a
lloys
, the
ir un
it ce
ll st
ruct
ures
, orie
ntat
ion
rela
tions
hips
and
misf
it w
ith th
e al
umin
ium
m
atrix
. The
diff
eren
t uni
t cel
ls th
at ca
n be
use
d to
des
crib
e th
e st
ruct
ure
of th
e al
umin
ium
mat
rix, e
xplo
red
in fi
gure
3, a
re u
sed
here
to si
mpl
ify th
e de
scrip
tion
of o
rient
atio
n re
latio
nshi
ps
and
latt
ice m
ismat
ch.
All u
nit c
ells
and
axes
wer
e dr
awn
with
VES
TA (1
).
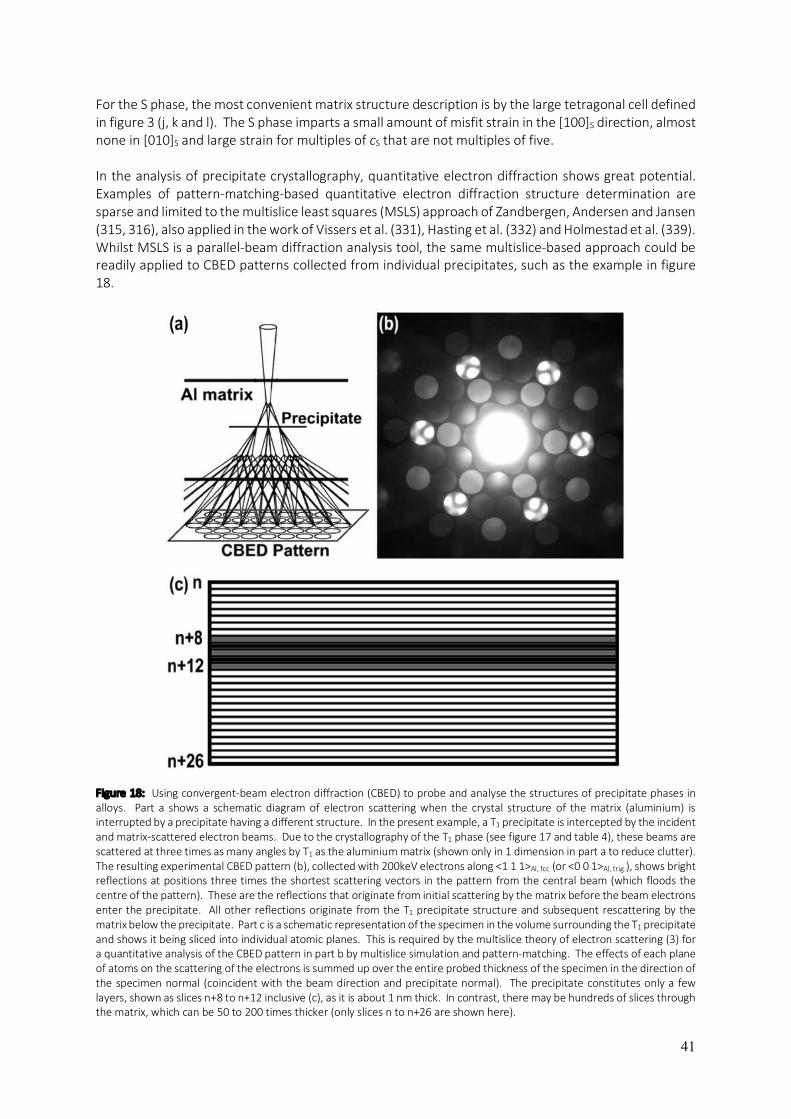
41
For the S phase, the most convenient matrix structure description is by the large tetragonal cell defined in figure 3 (j, k and l). The S phase imparts a small amount of misfit strain in the [100]S direction, almost none in [010]S and large strain for multiples of cS that are not multiples of five. In the analysis of precipitate crystallography, quantitative electron diffraction shows great potential. Examples of pattern-matching-based quantitative electron diffraction structure determination are sparse and limited to the multislice least squares (MSLS) approach of Zandbergen, Andersen and Jansen (315, 316), also applied in the work of Vissers et al. (331), Hasting et al. (332) and Holmestad et al. (339). Whilst MSLS is a parallel-beam diffraction analysis tool, the same multislice-based approach could be readily applied to CBED patterns collected from individual precipitates, such as the example in figure 18.
Figure 18: Using convergent-beam electron diffraction (CBED) to probe and analyse the structures of precipitate phases in alloys. Part a shows a schematic diagram of electron scattering when the crystal structure of the matrix (aluminium) is interrupted by a precipitate having a different structure. In the present example, a T1 precipitate is intercepted by the incident and matrix-scattered electron beams. Due to the crystallography of the T1 phase (see figure 17 and table 4), these beams are scattered at three times as many angles by T1 as the aluminium matrix (shown only in 1 dimension in part a to reduce clutter). The resulting experimental CBED pattern (b), collected with 200keV electrons along <1 1 1>Al, fcc (or <0 0 1>Al, trig.), shows bright reflections at positions three times the shortest scattering vectors in the pattern from the central beam (which floods the centre of the pattern). These are the reflections that originate from initial scattering by the matrix before the beam electrons enter the precipitate. All other reflections originate from the T1 precipitate structure and subsequent rescattering by the matrix below the precipitate. Part c is a schematic representation of the specimen in the volume surrounding the T1 precipitate and shows it being sliced into individual atomic planes. This is required by the multislice theory of electron scattering (3) for a quantitative analysis of the CBED pattern in part b by multislice simulation and pattern-matching. The effects of each plane of atoms on the scattering of the electrons is summed up over the entire probed thickness of the specimen in the direction of the specimen normal (coincident with the beam direction and precipitate normal). The precipitate constitutes only a few layers, shown as slices n+8 to n+12 inclusive (c), as it is about 1 nm thick. In contrast, there may be hundreds of slices through the matrix, which can be 50 to 200 times thicker (only slices n to n+26 are shown here).

42
CBED uses a focused electron probe and is therefore more capable than parallel beam techniques of position-selective probing of nanostructures such as intermetallic precipitates in alloys. CBED also has the advantage that the reflections possess an intensity distribution over a range of incident angles that reveal the symmetry of the crystal structure along the incident beam direction in a highly visual and easily interpretable fashion. This is not the case with parallel-beam diffraction. Not only does CBED allow an immediate in situ determination of structural symmetry from the intensity distribution in the pattern (226, 299), it has the capability of constraining pattern-matching refinements of crystal structure and bonding-sensitive structure factors to a level that parallel beam diffraction is incapable of. The CBED pattern in figure 18 (b) was taken through a single T1 precipitate embedded in an aluminium matrix in an Al-Cu-Li based alloy. The 6mm symmetry of the pattern is entirely commensurate with the determination of P6/mmm space group symmetry and the structure of Dwyer et al. (260). The incident electron beam is parallel to the <001> direction illustrated in figure 17 and table 4. Part a of figure 18 shows the nature of electron scattering in the present scenario schematically. The incident electron beam diffracts from the simpler crystal structure of the aluminium matrix before all scattered beams are intercepted and re-scattered by the T1 structure, which has a three-fold larger periodicity in projection in real space than the aluminium matrix. The scattered beams exiting the T1 precipitate are then further scattered by the matrix below the precipitate. This scenario is illustrated in only one dimension in part a of the figure to reduce clutter and simplify the diagram, however, this entanglement process of scattering by the different crystal structures being probed, occurs in two dimensions within the slice approximation used by the multislice formalism (3). The slicing of the probed region along the zone axis and incident beam direction (coincident with the interface normal of the matrix/precipitate/matrix system) is illustrated schematically in figure 18 (c). In practice, the structural model for multislice simulations would consist of many layers of aluminium atoms spanning the total specimen thickness, with a few of these layers replaced by monolayers describing the T1 atomic structure. The intensities in the CBED pattern are very sensitive to the total thickness as well as the depth of the T1 precipitate in the specimen. This sensitivity comes from the entangled nature of the scattered and re-scattered beams from each region of the specimen. The perturbation caused by even the thinnest of precipitates, like T1, will be compounded by the subsequent re-scattering by the matrix below the precipitate. To gain a better understanding of the intensities in the experimental CBED pattern of figure 18 (b), figure 19 is presented. Part a gives a schematic representation of the pattern, which has been fully indexed, based on the commensurate matrix and T1 unit cells illustrated in figure 17 and table 4. This in itself shows the importance of describing the structure of the matrix in a manner that is commensurate with the cell of the precipitate phase because cells that do not have common a and b lattice parameters would require a diffraction pattern to have two sets of indices (one for the matrix cell and one for the precipitate phase cell). In figure 19 (a), the colourations of the symmetry equivalent reflections in the pattern match the colours of the corresponding loci of the lattice planes that give rise to the reflections, plotted in the c-axis cell projection in figure 19 (b). Part c shows both the T1 and matrix cells so that the positions of different groups of atoms can be seen in terms of where they lie along the c axes in both cells. Figure 19 (d-g) show each set of atoms in the T1 structure and their positions in the a and b axes, projected along the c axis. Below the structure diagrams, the simulated diffracted intensities from each group of atoms is given. A strong correlation between atomic positions and the strongest intensities contributed to particular reflections is evident. Part h of the figure shows how the much shorter periodicity of the aluminium matrix results in scattering by only the {300} scattering vectors.
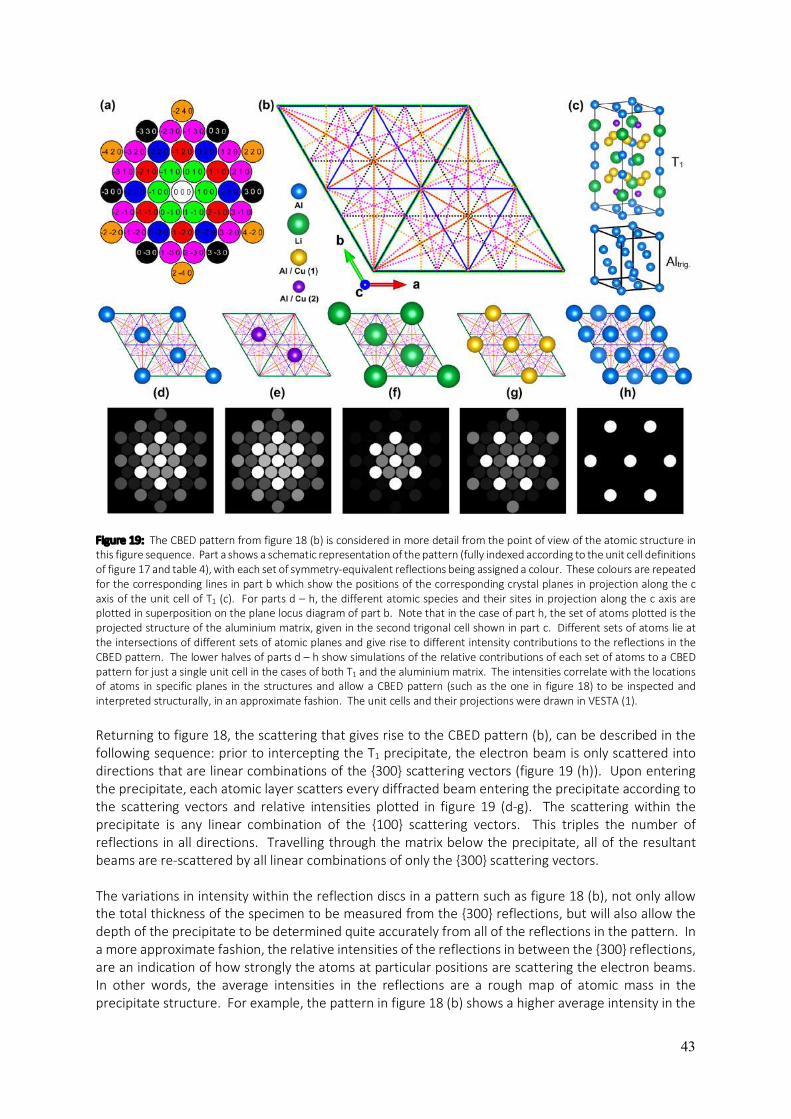
43
Figure 19: The CBED pattern from figure 18 (b) is considered in more detail from the point of view of the atomic structure in this figure sequence. Part a shows a schematic representation of the pattern (fully indexed according to the unit cell definitions of figure 17 and table 4), with each set of symmetry-equivalent reflections being assigned a colour. These colours are repeated for the corresponding lines in part b which show the positions of the corresponding crystal planes in projection along the c axis of the unit cell of T1 (c). For parts d – h, the different atomic species and their sites in projection along the c axis are plotted in superposition on the plane locus diagram of part b. Note that in the case of part h, the set of atoms plotted is the projected structure of the aluminium matrix, given in the second trigonal cell shown in part c. Different sets of atoms lie at the intersections of different sets of atomic planes and give rise to different intensity contributions to the reflections in the CBED pattern. The lower halves of parts d – h show simulations of the relative contributions of each set of atoms to a CBED pattern for just a single unit cell in the cases of both T1 and the aluminium matrix. The intensities correlate with the locations of atoms in specific planes in the structures and allow a CBED pattern (such as the one in figure 18) to be inspected and interpreted structurally, in an approximate fashion. The unit cells and their projections were drawn in VESTA (1). Returning to figure 18, the scattering that gives rise to the CBED pattern (b), can be described in the following sequence: prior to intercepting the T1 precipitate, the electron beam is only scattered into directions that are linear combinations of the {300} scattering vectors (figure 19 (h)). Upon entering the precipitate, each atomic layer scatters every diffracted beam entering the precipitate according to the scattering vectors and relative intensities plotted in figure 19 (d-g). The scattering within the precipitate is any linear combination of the {100} scattering vectors. This triples the number of reflections in all directions. Travelling through the matrix below the precipitate, all of the resultant beams are re-scattered by all linear combinations of only the {300} scattering vectors. The variations in intensity within the reflection discs in a pattern such as figure 18 (b), not only allow the total thickness of the specimen to be measured from the {300} reflections, but will also allow the depth of the precipitate to be determined quite accurately from all of the reflections in the pattern. In a more approximate fashion, the relative intensities of the reflections in between the {300} reflections, are an indication of how strongly the atoms at particular positions are scattering the electron beams. In other words, the average intensities in the reflections are a rough map of atomic mass in the precipitate structure. For example, the pattern in figure 18 (b) shows a higher average intensity in the

44
{200} reflections (yellow atomic positions, figure 19 (g)) compared to the other reflections (excluding the {300} reflections). This suggests a higher projected atomic mass at the yellow atom positions in the precipitate structure. This may be indicative of a higher copper occupancy at the yellow sites than at the purple sites. Work is currently underway on QCBED pattern matching of figure 18 (b) via the multislice formalism with results yet to be published. One final tantalising point to be made about CBED patterns through precipitates having crystallographically coherent interfaces with the surrounding matrix, is that whilst the frequency of the intensity distributions within reflections is indicative of thickness, the shape of the intensity distribution is strongly influenced by the structure factors of the scattering atomic planes. This presents the open question of whether it may be possible to measure bonding effects across the interfaces as well as within the precipitates themselves in a matrix/precipitate/matrix type CBED geometry such as the one presented in figure 18. Work is also currently underway in Al-Cu alloys where QCBED is being applied to CBED patterns taken through θ” and θ’ precipitates within the aluminium matrix. Further discussion of this theme is left for the segment on bonding. Lattice parameters Diffraction experiments with both X-rays and electrons have yielded lattice parameters for precipitate phases in aluminium alloys that can be roughly verified by HRTEM imaging or aberration-corrected HAADF-STEM. The work of Dwyer et al. (260) on the T1 phase also compares the experimentally measured lattice parameters with the relaxed lattice constants calculated by DFT. In the case of lattice parameters in alloy structures, the more difficult assessment is associated with the continuous changes in lattice parameter from one position to another in a solid solution. The standard approach for relating lattice parameters to compositional variation within a single-phase material (such as aluminium-based solid solutions in the present context), is via Vegard's Law (438 – 440). Examples from the literature of experimental lattice parameter measurements in aluminium-based solid solutions include very early work on Al-Cu alloys (441), investigation of: the Ti-Al system (442, 443), Al-Mn solid solutions (444), Al-Zn solid solutions (63) and, more recently, the Al-Si-Cu-Mg system with particular attention paid to Al-Mg solid solutions and the aluminium matrix lattice parameter as a function of heat treatment time (293). An excellent summary of size-factors (lattice parameters) as a function of composition in hundreds of different binary alloy solid solutions, is given by King (445). Data mining and semi-empirical methods of modelling lattice parameters in alloy solid solutions are becoming modal via the computer CALculation of PHAse Diagrams (CALPHAD) methodology. The semi-empirical models are, at their foundation, based on Vegard's Law. Some of the binary solid solutions in aluminium that have been investigated by CALPHAD include Al-Ni (446), Al-Li (447), Al-Mg (447) and Al-Si (447, 448). Debye-Waller factors The third section of this chapter covered the Debye-Waller factor of aluminium atoms within pure aluminium. When aluminium alloys are considered, the environment surrounding each aluminium atom can vary. The thermal vibration of atoms is constrained by the interatomic forces exerted on them in bonding with their neighbours. Thus, an aluminium atom that has a copper atom as a neighbour in a 2XXX series alloy, for example, will have a very different Debye-Waller factor than another aluminium atom in another region of the same alloy where it is surrounded by only aluminium atoms. Because most aluminium alloys are very dilute (in terms of the concentration of alloying elements), most aluminium atoms in aluminium alloys are surrounded by other aluminium atoms as
45
nearest neighbours. As a result, the function for B(T) presented in the present work for pure aluminium is valid for these atoms, whilst it is invalid for those neighbouring solute atoms or contained within intermetallic precipitates. The work of determining Debye-Waller factors for aluminium and solute atoms in alloys is limited compared to work in the pure metal, however it is not insignificant. Examples include Ti-Al (449 – 452), Al-Cu (453, 454), Al-Si (453), Al-Ge (453), Ni-Al (455, 456) and Al-Co-Ni-Fe-Mn-Rh (457) systems. The correlation between bond strengths between atoms, and thus mechanical strength, and Debye-Waller factors is highly intuitive (i.e. the stronger the interatomic bonding, the greater the mechanical strength and the smaller the thermal vibration amplitude or Debye-Waller factor). A strong correlation between Young's moduli and Debye-Waller factors has in fact been shown to exist in the limited literature on the subject, which is mainly restricted to elements and simple compounds (458 – 460). This is an area that has not gained much research attention but is well worth exploring in future for more complex systems such as alloy solid solutions and intermetallics. Bonding As stated in the section on bonding in pure aluminium, the electronic structure associated with chemical bonding in all materials is the dominant determinant of all materials properties (except radioactivity). Until now, high-resolution bonding studies have been confined to highly pure, homogeneous and highly ordered crystal structures in relatively simple materials (small unit cells and uniform, stoichiometric compositions throughout the probed material). The possibility of performing bonding measurements by QCBED in matrix/precipitate/matrix scattering geometries, using the multislice formalism for electron scattering (3), has been alluded to already in the discussion of figure 18 earlier in this section. At this juncture it can be argued that the ultimate resolution to be attained in the crystallography of any crystalline material is the measurement of interatomic bonds. Therefore, the ultimate level of characterisation that is to be achieved in aluminium and indeed any of its alloys is to be able to map bonding structure as a function of position. Another challenge in canonically describing the structural evolution of an alloy is to accurately and fully understand the processes of nucleation and growth of precipitate phases from solid solutions and all the physico-chemical driving forces associated with these processes from the most fundamental denominator, namely interatomic bonding. This chapter concludes with the following conjecture and proposed means of experimentally testing it, that combines the two challenges just described. An electron density domain theory (EDDT) for nucleation and growth of precipitate phases from solid solutions is proposed. This theory is described with the aid of figure 20. It begins with a supersaturated solid solution where the solute atoms of element A are uniformly dispersed in a matrix of element M. For the sake of simplicity, a binary alloy is considered. Atoms of element A in pure form, have a crystal structure with a bonding electron density distribution which will be correspondingly labelled as type a. Pure element M that forms the host matrix would have a bonding electron distribution of a different form to type a, which shall be called type m in correspondence with matrix M. In figure 20, the solute atoms, A, are shown as red dots dispersed in the blue matrix atoms M. Bonding electron density of type a is given a red shade, whilst that of type m is shaded blue. When atoms A and M form a precipitate with a particular stoichiometry and structural order, a third type of bonding

46
electron density distribution exists within the precipitate phase. This shall be called type p and this is given a yellow colour.
Figure 20: A schematic illustration of the electron density domain theory (EDDT) of phase transformation by nucleation and precipitate growth in a binary alloy. (a) A nearly homogeneous solid solution of A atoms (red dots) in a matrix of M atoms (blue). In their pure forms, A and M have bonding electron densities of types “a” (red shading) and “m” (blue shading) respectively. In the solid solution, the superposition of electronic configurations can give rise to other metastable electronic configurations. This figure considers only one such configuration for simplicity, type “p” (shaded in yellow). Slight inhomogeneities present in even the most well-mixed solid solutions, cause very weak segregations between different electronic configurations. (b) Heating causes atoms to vibrate with greater amplitude and this agitates the “electron sea” as well as causing the diffusion of solute atoms, A (red), towards preferred electronic environments. This in turn results in increased segregation into weak domains of different electronic environments (outlined by the dotted lines). (c) Heating continues, causing the domains of type p and m to strengthen via the migration of atoms into their preferred bonding environments. Critical nuclei of a secondary phase stabilised by the type p bonding environment are formed within the strengthening type p domains. (d) The nuclei grow until almost all of the surrounding solute atoms, A (red), are incorporated into the mature precipitates. During this process, domain segregation approaches completion. In the initial solid solution (figure 20 (a)), bonding type m dominates with some mild type a bonding having a minor influence due to the generally low concentration of atoms A in solution. There will inevitably be regions of slightly higher and slightly lower concentration of atoms A in the solid solution and in those regions of slightly higher concentration, there may be a very weak influence or component of type p bonding electron distribution. Increased mobility due to elevated thermal vibration as the temperature is increased during an ageing heat treatment can cause the bonding electron distribution to fluctuate. This may be enhanced in the presence of dislocations or lattice defects (not included in the figure), which would cause sharp localised bonding perturbations which may help promote bonding electron distribution type p. In figure 20 (b), the solute atoms A (red) are starting to cluster and be driven towards a structural arrangement with atoms M that further promotes bonding type p, causing weak domains (surrounded
47
by dashed red lines) of type p to form. The influence of this mild type p bonding within these domains is to lower the energy barrier for atoms A and M to form an ordered intermetallic compound. Clustering then accelerates with the increased mobility of solute atoms at the elevated heat treatment temperature. The increasingly strong type p bonding within these domains further accelerates the solid-state chemical reaction that is occurring and provides the driving force underlying the precipitation process. At some point (figure 20 (c)), critical nuclei within the ever-strengthening domains of bonding type p (outlined with solid red lines and having a strong yellow hue) form the basis of the precipitates with bonding type p and stoichiometry of MXAY. Within these nuclei the atomic structure that is commensurate with bonding type p and is actually driven to form by bonding type p, is established and stabilized as a secondary phase in the alloy. The reaction is driven to completion by the self-sustaining process that strengthens bonding type p, which provides the driving force for atoms to arrange themselves in the new crystal structure. The reaction stops when the number of solute atoms remaining in the surrounding matrix is too small to sustain the growth of the new phase and, thereby, the extension of the range of influence of bonding type p (figure 20 (d)). How could such a theory ever be validated? By “scanning QCBED”. The basis of such a technique is already commonplace. Every time a STEM image is obtained, a focused electron probe or, in other words a convergent electron beam, is rastered across the area of interest of the specimen and CBED patterns are formed for every probe position spanning that area. STEM detectors integrate over large angular ranges in these CBED patterns to produce a single number, which is the intensity assigned to the corresponding pixel in the STEM image. There is a large push in the electron microscopy community for faster detectors with greater electron detection efficiency and faster readout electronics so that the entire CBED pattern can be collected and stored for every point in a STEM image. This of course requires many terabytes of storage for a single data set! Some, like the groups of Tsuda (461) and Zuo (462 – 465), have managed to collect scanning CBED data sets for areas with small scan dimensions (few pixels in the scan) and have used these data sets to obtain position-sensitive information about subtle changes in crystal structure across domain boundaries. The main focus by the groups of Zuo and Tsuda has been the investigation of polarization domains in ferroelectric materials (461 – 465), but scanning CBED combined with QCBED to produce the technique of scanning QCBED or “SQCBED”, could be very powerful for analyzing the spatial variations of both atomic structure and chemical bonding as a function of position in many other materials, including alloys. Here, it is proposed that scanning CBED be applied to SSSSs that are heat treated in situ so that scanning CBED data sets are collected for the same region of interest as it is undergoing an artificial ageing heat treatment in a TEM hot stage. This is illustrated in figure 21. In the far-left column of figure 21, figure 20 has been rearranged so that artificial ageing time runs from top to bottom. The colour codes of the different bonding types already discussed for figure 20, are shown above this sequence on the far left. The column second from the left shows a schematic of the experimental setup in the TEM. Heating coils in contact with the specimen cup heat the solid solution to the required ageing temperature. As ageing progresses in the manner previously described in the discussion of figure 20, scanning CBED data sets are collected. Circles in each of the images in the left-most column of figure 21, show the probe positions from which each CBED pattern is collected. After the heat treatment and scanning CBED experiment have been run to completion, the CBED patterns can be pattern matched in the usual way of QCBED for very accurate and precise measurements of the relevant structure factors. The incident beam orientation can be set up from the outset to give CBED patterns that are conducive to measuring different components of the bonding electron distribution. These can be colour-coded with red, green and blue such that each structure factor map acts as a colour channel for the final image that shows the different bonding modes and their distribution within the region of interest. In other words, the Fourier sum is computed from each colour channel as shown.

48
Figu
re 2
1: A
sch
emat
ic il
lust
ratio
n of
how
a n
ew te
chni
que
that
com
bine
s sc
anni
ng C
BED
and
QCB
ED, i
.e. “
scan
ning
QCB
ED”
or S
QCB
ED, c
ould
be
key
to v
alid
atin
g th
e el
ectr
on d
ensit
y do
mai
n th
eory
(ED
DT) o
f se
cond
ary
phas
e nu
clea
tion
and
prec
ipita
te g
row
th.
The
regi
on il
lust
rate
d in
figu
re 2
0 is
exam
ined
her
e in
situ
(lef
t col
umn
of th
e pr
esen
t fig
ure)
whi
lst p
erfo
rmin
g a
heat
trea
tmen
t tha
t res
ults
in th
e so
lid s
olut
ion
evol
ving
to fo
rm p
reci
pita
tes.
Hot
sta
ges
for
tran
smiss
ion
elec
tron
mic
rosc
opes
are
not
unc
omm
on a
nd th
is a
llow
s th
e he
at tr
eatm
ent
to b
e ca
rrie
d ou
t w
hilst
sim
ulta
neou
sly c
olle
ctin
g CB
ED p
atte
rns
for
each
po
sitio
n (c
ircle
d in
the
imag
es in
the
left
-mos
t col
umn)
in a
grid
spa
nnin
g th
e re
gion
of i
nter
est.
CBE
D pa
tter
ns c
an b
e co
llect
ed fo
r an
orie
ntat
ion
of th
e in
cide
nt e
lect
ron
beam
whi
ch m
axim
ises
the
sens
itivi
ty o
f Q
CBED
to p
artic
ular
str
uctu
re fa
ctor
s th
at a
re m
ost s
ensi
tive
to th
e di
ffere
nt ty
pes
of b
ondi
ng s
truc
ture
s th
at m
ay b
e pr
esen
t in
the
spec
imen
. In
the
pres
ent i
llust
ratio
n, th
ere
are
thre
e st
ruct
ure
fact
ors
bein
g m
easu
red
from
eac
h pa
tter
n, V
g, V h
and
Vj.
The
se a
re s
truc
ture
fact
ors
of th
e el
ectr
osta
tic p
oten
tial a
nd th
ey a
re d
irect
ly re
late
d to
str
uctu
re fa
ctor
s of
the
elec
tron
dist
ribut
ion,
Fg,
F h a
nd F
j res
pect
ivel
y, v
ia th
e M
ott f
orm
ula
(194
) (no
te th
at a
s th
e st
ruct
ure
fact
or o
f the
pot
entia
l inc
reas
es, t
he e
lect
ron
dist
ribut
ion
stru
ctur
e fa
ctor
dec
reas
es).
Eac
h st
ruct
ure
fact
or c
hara
cter
ises
a di
ffer
ent
com
pone
nt o
f the
ele
ctro
n di
strib
utio
n. M
aps t
hat a
ssoc
iate
a d
iffer
ent c
olou
r with
eac
h st
ruct
ure
fact
or c
an b
e ge
nera
ted
from
the
arra
y of
pro
be p
ositi
ons
on th
e sp
ecim
en a
s sh
own
here
in R
GB
form
at (r
ed fo
r Vg a
nd F
g, gr
een
for V
h and
F h
, and
blu
e fo
r Vj a
nd F
j). T
he c
ombi
natio
n of
thes
e co
mpo
nent
s can
then
be
used
to m
ap th
e bo
ndin
g ty
pe d
istrib
utio
n as
a fu
nctio
n of
ann
ealin
g tim
e an
d po
sitio
n w
ithin
the
spec
imen
(far
righ
t col
umn)
.

49
In this way, the as yet never attempted technique of scanning QCBED is predicted to be the way ahead in expanding the horizons of crystallography in nano-structured crystalline composites such as aluminium alloys.

50
Summary This chapter has taken a hierarchic approach in describing the crystallography of pure aluminium, before bringing the same considerations to bear in the same order on the discussion of aluminium alloys. The discussion began with a description of the basic form of the structure of pure aluminium and how it can be described by different unit cells. This was followed by a review of as many measurements of the lattice parameter of the fcc cell of pure aluminium as could be found, spanning the full range of temperatures where aluminium is a solid. In combination with an analogous review of linear thermal expansion coefficients across the same temperature range, the related parametrizations of a(T) and α(T) (the lattice parameter as a function of temperature and the linear thermal expansion coefficient as a function of temperature respectively) were developed as canonical and continuous descriptors of a(T) and α(T) from 0K to 933K (the latter temperature being the melting point of aluminium). These parametrisations are intended as a reference for readers who need to obtain accurate values of these physical properties at any temperature where aluminium is a solid. They are supported by, and serve to summarise, a large number of experimental measurements spanning about a century of work. In the analysis of linear thermal expansion coefficients at high temperatures approaching the melting point of aluminium, a new approach, named here as the “vacancy triangle”, was developed and demonstrated, that allows the vacancy concentration in pure aluminium to be determined with reasonable confidence at temperatures near the melting point of 933K. In summary, a “vacancy triangle” is drawn to span the spread of points on a graph of α against T where each α is determined either from length dilation of a bulk sample (affected by vacancies), or by diffraction (relatively unaffected by vacancies – an approximation in itself). The differences between these two types of measurements as a function of temperature result in a triangular spread of points in a graph of α versus T, and the area spanned by this triangle leads to a measurement of Cvac, the vacancy concentration at the temperature that bounds the vertical edge of the triangle in the graph. Using this approach, Cvac (927K) ≈ (1.1±0.3) x 10-3 was obtained which agrees within the bounds of uncertainty with previous measurements in the literature. The third aspect of the crystallography of pure aluminium considered was the Debye-Waller factor, B, which quantifies the magnitude of the thermal vibration of the atoms in a crystal. Again, a review of as many published measurements as could be found was undertaken and a parameterization of B(T), valid over the range from 0K to 933K, was presented. This is intended as a resource for the reader seeking reliable values of B at any temperature where aluminium is a solid. In the process of this review, the shortcomings of other published models and parametrisations of B(T) were discussed and it was made clear that the present parametrization should be used in preference to that by Gao and Peng (159, 160) which diverges strongly from all of the experimental measurements at higher temperatures. The discussion of the crystallography of pure aluminium culminated in a review of the bonding electron distribution determinations spanning the last 90 years. Determinations of bonding depend very sensitively on an accurate knowledge of the structure of the lattice, lattice parameters at the temperature of the experiments, and the Debye-Waller factor of aluminiun at the relevant temperature, as pre-requisites. This defines the hierarchic approach applied in this chapter, which culminated in determinations of interatomic bonding – the ultimate resolution attainable in crystallography.

51
In the review of bonding in pure aluminium, it was shown that the technique of quantitative convergent-beam electron diffraction (QCBED) gives the highest resolution and that this technique was pivotal in determining unequivocally that the bonds in pure aluminium are entirely tetrahedral in nature. Before the QCBED study of (175), there was considerable disagreement in the literature as to the location and nature of bonds in elemental aluminium. The hierarchic approach developed in considering the crystallography of pure aluminium in the first four sections of this chapter, was applied in discussing the crystallography of aluminium alloys in the last section. Research in the domain of aluminium alloys is vast and after highlighting a selection of significant papers in each alloy class and summarizing the array of techniques and theoretical approaches used in these works, the discussion turned to specific examples to illustrate the relevance of the concepts discussed in the treatment of pure aluminium in their application to aluminium alloys. It was shown that describing the structure of the supporting aluminium matrix with an alternate unit cell can greatly simplify the structural modelling of secondary precipitate phases in relation to the surrounding aluminium matrix crystal structure. This was followed by a brief summary of work on determining lattice parameters and Debye-Waller factors in alloy solid solutions and a discussion of the correlation between Debye-Waller factors and the macroscopic property of elastic (Young’s) modulus. The correlation between the thermal vibration amplitude of atoms and Young’s modulus is highly intuitive and rational but very little research has been done in relating these properties. It is suggested here that future work should be directed into the exploration of this nano-macro relationship of physical properties, especially for intermetallic phases and solid solutions. The outcome of such studies would allow mechanical properties of alloys to be used to estimate Debye-Waller factors of the constituent atoms. This would supply missing information about Debye-Waller factors for atoms in different bonding environments, removing a significant obstacle to future planned interatomic bonding studies in alloy systems. The chapter closed with the unexplored domain of interatomic bonding measurement in aluminium alloys, introducing a new electron density-based theory for explaining the driving force behind nucleation and growth of precipitate phases from solid solutions (applied in this context to aluminium alloys but applicable to all alloys in general). This is the electron density domain theory (EDDT). In summary, it states that solid state precipitation reactions are driven by different types of bonding electron distribution that segregate into domains and strengthen within these domains via the migration of solute atoms into favoured electronic environments and out of less favourable environments. This process is accelerated by increased thermal vibration (elevated temperature) and is a self-enforcing process. I.e. as a domain strengthens in one type of bonding electron distribution, the region surrounding it weakens in that bonding type due to the associated and accelerated migration of atoms to their favoured environments. In closing, an experimental approach was described for testing the EDDT. The method would combine QCBED with scanning transmission electron microscopy whilst an alloy solid solution is heat treated in situ in an electron microscope. This leaves a vision for the future of crystallographic research in aluminium alloys that would provide fundamental insight into the origins of properties in these extremely important materials.

52
Acknowledgements The author is grateful for funding from the Australian Research Council (FT110100427). The author is indebted to Prof. J. Etheridge, Prof. B.C. Muddle, A/Prof. L. Bourgeois, A/Prof. M. Weyland, Mr. T. Liu, Dr. Y. Guo, Mr. D. Peng at Monash University and Ms J. Shih, formerly at Monash University. The author is grateful to the staff at the Monash Centre for Electron Microscopy (MCEM) and the Department of Materials Science and Engineering at Monash University. Original work included here was mainly carried out on a JEOL 2011 TEM as well as an FEI Titan3 80-300 TEM with probe and imaging aberration correctors at MCEM, in combination with a liquid helium specimen stage. The author thanks Prof. J.-M. Zuo from the University of Illinois at Urbana-Champaign (UIUC) for long term collaborations and sharing his RefineCB Bloch-wave QCBED code. The author thanks Mr. Y.-T. Shao, also from UIUC. Finally, this work would never have been feasible without the immeasurable help and support of Mrs. K. Nakashima.

53
Appendices Appendix A Table of experimental and modelled lattice parameters for the fcc unit cell of pure aluminium from the literature. Appendix B Table of experimental and modelled linear thermal expansion coefficients for pure aluminium from the literature. Appendix C Table of experimentally and theoretically determined Debye-Waller factors for pure aluminium from the literature. Appendix D Table of experimentally and theoretically determined deformation electron densities (∆ρ) at the tetrahedral, octahedral and bridge centres in the fcc unit cell of pure aluminium. These are followed by the actual structure factor determinations and associated errors (in the cases of experimental measurements) for the bonding-sensitive structure factors, F111, F200 and F220.

54
Appendix A Table of experimental and modelled lattice parameters for the fcc unit cell of pure aluminium from the literature.
kX to Å conversion factor, from: W.L. Bragg, E. Armstrong Wood, J. Am. Chem. Soc. 69 (1947), 2919 (1.00202) superseded by E.R. Cohen, J.W.M. DuMond, Rev. Mod. Phys. 37 (1965), 537 (1.002080±0.000006)
Unknown or "room" temp
is assigned 25°C by
default (See A.S. Cooper
1962)
Unknown error is
assigned 0.01% or 0.001%
depending on sig figs
Source T (°C) T (°K) a (kX) error (kX) a (Å) error (Å) DatePurity of
Al (%)Notes
F.C. Blake, Phys. Rev. 26 (1925), 60. 25 298.15 4.04380 0.00020 4.05221 0.00020 1925 99.97From A. Ieviņš, M. Straumanis, Z. Phys. Chem. B 33 (1936), 265.
F.K. von Göler, G. Sachs, Metallwirtschaft, Berlin 8 (1929), 671.
25 298.15 4.04020 0.00040 4.04860 0.00040 1929 From A.S. Cooper, Acta Cryst. 15 (1962), 578.
M.L.V. Gayler, G.D. Preston, J. Inst. Metals 41 (1929),
193.25 298.15 4.04120 0.00040 4.04961 0.00040 1929
From A. Ieviņš, M. Straumanis, Z. Phys. Chem. B 33 (1936), 265.
G. Wassermann, Z. Metallk. 22 (1930), 158. 25 298.15 4.04040 0.00040 4.04880 0.00040 1930 From A.S. Cooper, Acta Cryst. 15 (1962), 578.
Z. Nishiyama, Sci. Rep. Tohoku Imp. Univ. 21 (1932),
364.25 298.15 4.04100 0.00040 4.04941 0.00040 1932
From A. Phillips, R.M. Brick, J. Franklin Inst. 215 (1933),
557.
E.A. Owen, J. Iball, Phil. Mag. 13 (1932), 1020. 25 298.15 4.04060 0.00030 4.04900 0.00030 1932 From A.S. Cooper, Acta Cryst. 15 (1962), 578.
E.A. Owen, E.L. Yates, Phil. Mag. 15 (1933), 472. 18 291.15 4.04060 0.00030 4.04900 0.00030 1933 99.6From A. Ieviņš, M. Straumanis, Z. Phys. Chem. B 33 (1936), 265.
W. Stenzel, J. Weerts, Metallwirtschaft, Berlin 12 (1933), 353.
20 293.15 4.04110 0.00040 4.04951 0.00040 1933 99.9From A. Ieviņš, M. Straumanis, Z. Phys. Chem. B 33 (1936), 265.
A. Phillips, R.M. Brick, J. Franklin Inst. 215 (1933), 557. 24 297.15 4.04180 0.00010 4.05021 0.00010 1933 99.97From A. Ieviņš, M. Straumanis, Z. Phys. Chem. B 33 (1936), 265.
M.C. Neuburger, Z. Kristallogr. 86 (1933), 395. 20 293.15 4.04020 0.00040 4.04860 0.00040 1933 From S.S. Lu, Y.L. Chang, Proc. Phys. Soc. 53 (1941), 517.
E.R. Jette, F. Foote, J. Chem. Phys. 3 (1935), 605. 25 298.15 4.04139 0.00008 4.04980 0.00008 1935 99.791
From A. Ieviņš, M. Straumanis, Z. Phys. Chem. B 33 (1936), 265. & A.S. Cooper, Acta Cryst. 15 (1962), 578. &
A.J.C. Wilson, Proc. Phys. Soc. 53 (1941), 235. & A.
Smakula, J. Kalnajs, Phys. Rev. 99 (1955), 1737. & B.F.
Figgins, G.O. Jones, D.P. Riley, Phil. Mag. 1 (1956), 747.
23.1 296.25 4.04112 0.00003 4.04953 0.00003 1936 99.9986 Film number 539
23.1 296.25 4.04117 0.00003 4.04958 0.00003 1936 99.9986 Film number 528
23 296.15 4.04129 0.00003 4.04970 0.00003 1936 99.9986 Film number 538
23.1 296.25 4.04128 0.00003 4.04969 0.00003 1936 99.9986 Film number 536
23.1 296.27 4.04137 0.00003 4.04978 0.00003 1936 99.9986 Film number 530
21.6 294.75 4.04125 0.00003 4.04966 0.00003 1936 99.9986 Film number 467
23.1 296.25 4.04123 0.00003 4.04964 0.00003 1936 99.9986 Film number 529
23.1 296.25 4.04127 0.00003 4.04968 0.00003 1936 99.9986 Film number 542
23.1 296.25 4.04122 0.00003 4.04963 0.00003 1936 99.9986 Film number 534
22.5 295.65 4.04116 0.00002 4.04957 0.00002 1936 99.9986 Film number 472
22.5 295.65 4.04119 0.00002 4.04960 0.00002 1936 99.9986 Film number 475
23 296.15 4.04122 0.00002 4.04963 0.00002 1936 99.9986 Film number 494
46.8 319.95 4.04352 0.00002 4.05193 0.00002 1936 99.9986 Film number 484
47 320.15 4.04348 0.00002 4.05189 0.00002 1936 99.9986 Film number 492
25.6 298.75 4.04149 0.00001 4.04990 0.00001 1936 99.9986 Film number 596
25.6 298.75 4.04153 0.00001 4.04994 0.00001 1936 99.9986 Film number 597
44.3 317.45 4.04327 0.00001 4.05168 0.00001 1936 99.9986 Film number 598
25.85 299.00 4.04154 0.00001 4.04995 0.00001 1936 99.9986 Film number 599a
25.85 299.00 4.04151 0.00001 4.04992 0.00001 1936 99.9986 Film number 599b
E.A. Owen, E.L. Yates, Phil. Mag. 21 (1936), 809. 18 291.15 4.04060 0.00020 4.04900 0.00020 1936 99.992 From S.S. Lu, Y.L. Chang, Proc. Phys. Soc. 53 (1941), 517.
26.6 299.75 4.04150 0.00010 4.04991 0.00010 1938 99.996
27.6 300.75 4.04150 0.00010 4.04991 0.00010 1938 99.996
25 298.15 4.04130 0.00010 4.04971 0.00010 1938 99.996 Inferred from first two measurements
H. van Bergen, Ann. d. Phys. 39 (1941), 553. 25 298.15 4.04117 0.00004 4.04958 0.00004 1941From B.F. Figgins, G.O. Jones, D.P. Riley, Phil. Mag. 1 (1956), 747.
H. van Bergen, Ann. d. Phys. 39 (1941), 553. 20 293.15 4.04091 0.00006 4.04932 0.00006 1941From A.S. Cooper, Acta Cryst. 15 (1962), 578. & A.
Smakula, J. Kalnajs, Phys. Rev. 99 (1955), 1737.
0 273.15 4.03910 0.00010 4.04750 0.00010 1941 99.992 4 measurements.
25 298.15 4.04130 0.00010 4.04971 0.00010 1941 99.9925 measurements. Also reported in A.S. Cooper, Acta
Cryst. 15 (1962), 578.
100 373.15 4.04860 0.00010 4.05702 0.00010 1941 99.992 1 measurement.
150 423.15 4.05380 0.00010 4.06223 0.00010 1941 99.992 1 measurement.
200 473.15 4.05920 0.00010 4.06764 0.00010 1941 99.992 2 measurements.
300 573.15 4.07000 0.00010 4.07847 0.00010 1941 99.992 2 measurements.
400 673.15 4.08200 0.00010 4.09049 0.00010 1941 99.992 2 measurements.
500 773.15 4.09470 0.00010 4.10322 0.00010 1941 99.992 1 measurement.
600 873.15 4.10870 0.00010 4.11725 0.00010 1941 99.992 7 measurements.
650 923.15 4.11620 0.00010 4.12476 0.00010 1941 99.992 4 measurements.
EXPERIMENTAL MEASUREMENTS
A. Ieviņš, M. Straumanis, Z. Phys. Chem. B 33 (1936),
265.
A. Ieviņš, M. Straumanis, Z. Phys. Chem. B 34 (1936),
402.
A.J.C. Wilson, Proc. Phys. Soc. 53 (1941), 235.
C.S. Taylor, L.A. Willey, D.W. Smith, J.D. Edwards,
Metals and Alloys 9 (1938), 189.

55
kX to Å conversion factor, from: W.L. Bragg, E. Armstrong Wood, J. Am. Chem. Soc. 69 (1947), 2919 (1.00202) superseded by E.R. Cohen, J.W.M. DuMond, Rev. Mod. Phys. 37 (1965), 537 (1.002080±0.000006)
Unknown or "room" temp
is assigned 25°C by
default (See A.S. Cooper
1962)
Unknown error is
assigned 0.01% or 0.001%
depending on sig figs
Source T (°C) T (°K) a (kX) error (kX) a (Å) error (Å) DatePurity of
Al (%)Notes
S.S. Lu, Y.L. Chang, Proc. Phys. Soc. 53 (1941), 517. 20 293.15 4.04110 0.00010 4.04951 0.00010 1941 Aluminium Francaise.0 273.15 4.03920 0.00010 4.04760 0.00010 1942 99.992 New measurements with annealed Al filings.
50 323.15 4.04370 0.00010 4.05211 0.00010 1942 99.992 New measurements with annealed Al filings.100 373.15 4.04850 0.00010 4.05692 0.00010 1942 99.992 New measurements with annealed Al filings.150 423.15 4.05340 0.00010 4.06183 0.00010 1942 99.992 New measurements with annealed Al filings.200 473.15 4.05860 0.00010 4.06704 0.00010 1942 99.992 New measurements with annealed Al filings.300 573.15 4.06970 0.00010 4.07816 0.00010 1942 99.992 New measurements with annealed Al filings.400 673.15 4.08160 0.00010 4.09009 0.00010 1942 99.992 New measurements with annealed Al filings.25 298.15 4.04140 0.00060 4.04981 0.00060 194725 298.15 4.04140 0.00010 4.04981 0.00010 1947
-33.2 239.95 4.03630 0.00040 4.04470 0.00040 1947-47.6 225.55 4.03500 0.00040 4.04339 0.00040 1947-97.5 175.65 4.03060 0.00050 4.03898 0.00050 1947
H.J. Axon, W. Hume-Rothery, Proc. Roy. Soc. 193 (1948), 1.
25 298.15 4.04134 0.00004 4.04950 0.00004 1948 From A.S. Cooper, Acta Cryst. 15 (1962), 578.
E.C. Ellwood, J.M. Silcock, J. Inst. Met. 74 (1948), 457 18 291.15 4.04090 0.00020 4.04906 0.00020 1948 From A.S. Cooper, Acta Cryst. 15 (1962), 578.E.A. Owen, Y.H. Liu, D.P. Morris, Phil. Mag. 39 (1948), 831.
18 291.15 4.04060 0.00040 4.04876 0.00040 1948 From A.S. Cooper, Acta Cryst. 15 (1962), 578.
H.K. Hardy, T.J. Heal, J. Inst. Metals 74 (1948), 721. 25 298.15 4.04137 0.00004 4.04978 0.00004 1948W. Hume-Rothery, T.H. Boultbee, Phil. Mag. 40 (1949), 71.
25 298.15 4.04142 0.00004 4.04958 0.00004 1949 From A.S. Cooper, Acta Cryst. 15 (1962), 578.
25.6 298.75 4.04149 0.00003 4.04990 0.00003 1949 99.99825.6 298.75 4.04153 0.00003 4.04994 0.00003 1949 99.998
25.85 299.00 4.04154 0.00003 4.04995 0.00003 1949 99.99825.85 299.00 4.04151 0.00003 4.04992 0.00003 1949 99.99844.3 317.45 4.04327 0.00003 4.05168 0.00003 1949 99.99822 295.15 4.04100 0.00020 4.04916 0.00020 194964 337.15 4.04490 0.00020 4.05307 0.00020 1949
107 380.15 4.04880 0.00020 4.05698 0.00020 1949171 444.15 4.05450 0.00020 4.06269 0.00020 1949197 470.15 4.05670 0.00020 4.06489 0.00020 1949239 512.15 4.06080 0.00020 4.06900 0.00020 1949287 560.15 4.06540 0.00020 4.07361 0.00020 194922 295.15 4.04100 0.00020 4.04916 0.00020 194955 328.15 4.04430 0.00020 4.05247 0.00020 194979 352.15 4.04600 0.00020 4.05417 0.00020 1949
102 375.15 4.04840 0.00020 4.05658 0.00020 1949144 417.15 4.05240 0.00020 4.06059 0.00020 1949196 469.15 4.05710 0.00020 4.06530 0.00020 1949200 473.15 4.05740 0.00020 4.06560 0.00020 1949236 509.15 4.06080 0.00020 4.06900 0.00020 1949273 546.15 4.06490 0.00020 4.07311 0.00020 1949280 553.15 4.06570 0.00020 4.07391 0.00020 194922 295.15 4.04120 0.00020 4.04936 0.00020 194968 341.15 4.04550 0.00020 4.05367 0.00020 194984 357.15 4.04720 0.00020 4.05538 0.00020 1949
117 390.15 4.04980 0.00020 4.05798 0.00020 1949119 392.15 4.05010 0.00020 4.05828 0.00020 1949144 417.15 4.05250 0.00020 4.06069 0.00020 1949217 490.15 4.05920 0.00020 4.06740 0.00020 1949257 530.15 4.06180 0.00020 4.07000 0.00020 1949
J.E. Dorn, P. Pietrokowsky, T.E. Tietz, J. Metals 2 (1950), 933.
42 315.13 4.04129 0.00020 4.04970 0.00020 1950Read in from graph in J. Bandopadhyay, K.P Gupta, Cryogenics 18 (1978), 54
D.M. Poole, H.J. Axon, J. Inst. Met. 80 (1952), 599. 25 298.15 4.04121 0.00004 4.04937 0.00004 1952 From A.S. Cooper, Acta Cryst. 15 (1962), 578.R.B. Hill, H.J. Axon, Research 6 (1953), 23S. 25 298.15 4.04118 0.00004 4.04934 0.00004 1953 From A.S. Cooper, Acta Cryst. 15 (1962), 578.H.E. Swanson, E. Tatge, Nat. Bur. Stand. Cir. 539 (vol 1) (1953), 11.
25 298.15 4.04050 0.00040 4.04866 0.00040 1953 From A.S. Cooper, Acta Cryst. 15 (1962), 578.
A. Smakula, J. Kalnajs, Phys. Rev. 99 (1955), 1737. 25 298.15 4.04119 0.00002 4.04960 0.00002 1955 99.99+
Also in A. Smakula, J. Kalnajs, V. Sils, Phys. Rev. 99 (1955), 1747. Quoted by W.B. Pearson, Lattice Spacings and Structures of Metals and Alloys, 1st Ed. (Pergamon Press, 1967).
-252.75 20.40 4.02349 0.00002 4.03186 0.00002 1956 99.99 5 measurements.-240.85 32.30 4.02354 0.00002 4.03191 0.00002 1956 99.99 2 measurements.-228.75 44.40 4.02364 0.00002 4.03201 0.00002 1956 99.99 3 measurements.-218.05 55.10 4.02382 0.00002 4.03219 0.00002 1956 99.99 2 measurements.-207.15 66.00 4.02402 0.00002 4.03239 0.00002 1956 99.99 2 measurements.-198.15 75.00 4.02434 0.00002 4.03271 0.00002 1956 99.99 2 measurements.-187.45 85.70 4.02477 0.00002 4.03314 0.00002 1956 99.99 7 measurements.-166.95 106.20 4.02575 0.00002 4.03412 0.00002 1956 99.99 2 measurements.-157.95 115.20 4.02625 0.00002 4.03462 0.00002 1956 99.99 2 measurements.-148.15 125.00 4.02690 0.00002 4.03528 0.00002 1956 99.99 2 measurements.25.55 298.70 4.04127 0.00002 4.04968 0.00002 1956 99.99 3 measurements.25.01 298.16 4.04122 0.00002 4.04963 0.00002 1956 99.99 Interpolation.-0.15 273.00 4.03896 0.00002 4.04736 0.00002 1956 99.99 Interpolation.
B.F. Figgins, G.O. Jones, D.P. Riley, Phil. Mag. 1 (1956), 747.
A.J.C. Wilson, Proc. Phys. Soc. 54 (1942), 487.
A. Kochanovska, Physica 15 (1949), 191.
W. Hume-Rothery, D.J. Strawbridge, J. Sci. Instrum. 24 (1947), 89.
M.E. Straumanis, J. Appl. Phys. 20 (1949), 726.

56
kX to Å conversion factor, from: W.L. Bragg, E. Armstrong Wood, J. Am. Chem. Soc. 69 (1947), 2919 (1.00202) superseded by E.R. Cohen, J.W.M. DuMond, Rev. Mod. Phys. 37 (1965), 537 (1.002080±0.000006)
Unknown or "room" temp
is assigned 25°C by
default (See A.S. Cooper
1962)
Unknown error is
assigned 0.01% or 0.001%
depending on sig figs
Source T (°C) T (°K) a (kX) error (kX) a (Å) error (Å) DatePurity of
Al (%)Notes
9.85 283.00 4.04023 0.00040 4.04864 0.00040 1956Read from graph in X.-G. Lu, M. Selleby, B. Sundman, CALPHAD 29 (2005), 68. (converted from molar volume)
294.85 568.00 4.06938 0.00040 4.07785 0.00040 1956Read from graph in X.-G. Lu, M. Selleby, B. Sundman, CALPHAD 29 (2005), 68. (converted from molar volume)
W.B. Pearson, Lattice Spacings and Structures of Metals and Alloys, (Pergamon Press, 1958).
20 293.15 4.04071 0.00004 4.04911 0.00004 1958From R.O. Simmons and R.W. Balluffi, Phys. Rev. 117 (1960), 52.
R. Feder, A.S. Nowick, Phys. Rev. 109 (1958), 1959. 25 298.15 4.04107 0.00004 4.04948 0.00004 1958 99.997
M.E. Straumanis, J. Appl. Phys. 30 (1959), 1965. 25 298.15 4.04113 0.00004 4.04954 0.00004 1959Quoted by W.B. Pearson, Lattice Spacings and Structures of Metals and Alloys, 1st Ed. (Pergamon Press, 1967).
0 273.15 4.03886 0.00004 4.04726 0.00004 1960 99.996 Extrapolated.25 298.15 4.04121 0.00004 4.04962 0.00004 1960 99.99696 369.15 4.04782 0.00004 4.05624 0.00004 1960 99.996
208 481.15 4.05958 0.00004 4.06802 0.00004 1960 99.996298 571.15 4.06942 0.00004 4.07788 0.00004 1960 99.996383 656.15 4.07917 0.00004 4.08765 0.00004 1960 99.996409 682.15 4.08246 0.00004 4.09095 0.00004 1960 99.996479 752.15 4.09140 0.00004 4.09991 0.00004 1960 99.996564 837.15 4.10249 0.00004 4.11102 0.00004 1960 99.996575 848.15 4.10420 0.00004 4.11274 0.00004 1960 99.996605 878.15 4.10834 0.00004 4.11689 0.00004 1960 99.996612 885.15 4.10942 0.00004 4.11797 0.00004 1960 99.996615 888.15 4.10974 0.00004 4.11829 0.00004 1960 99.996626 899.15 4.11124 0.00004 4.11979 0.00004 1960 99.996630 903.15 4.11184 0.00004 4.12039 0.00004 1960 99.996635 908.15 4.11253 0.00004 4.12108 0.00004 1960 99.996636 909.15 4.11237 0.00004 4.12092 0.00004 1960 99.996641 914.15 4.11331 0.00004 4.12187 0.00004 1960 99.996648 921.15 4.11455 0.00004 4.12311 0.00004 1960 99.996649 922.15 4.11473 0.00004 4.12329 0.00004 1960 99.996651 924.15 4.11487 0.00004 4.12343 0.00004 1960 99.99610 283.15 4.04003 0.00004 4.04843 0.00004 1960 99.99+20 293.15 4.04096 0.00004 4.04937 0.00004 1960 99.99+30 303.15 4.04193 0.00004 4.05034 0.00004 1960 99.99+40 313.15 4.04272 0.00004 4.05113 0.00004 1960 99.99+50 323.15 4.04381 0.00004 4.05222 0.00004 1960 99.99+60 333.15 4.04462 0.00004 4.05303 0.00004 1960 99.99+10 283.15 4.03983 0.00003 4.04823 0.00003 1960 99.99+20 293.15 4.04075 0.00003 4.04915 0.00003 1960 99.99+30 303.15 4.04174 0.00003 4.05015 0.00003 1960 99.99+40 313.15 4.04264 0.00003 4.05105 0.00003 1960 99.99+50 323.15 4.04358 0.00003 4.05199 0.00003 1960 99.99+60 333.15 4.04439 0.00003 4.05280 0.00003 1960 99.99+
M.E. Straumanis, T. Ejima, J. Chem. Phys. 32 (1960), 629.
25 298.15 4.04117 0.00002 4.04958 0.00002 1960 99.9998
H.M. Otte, J. Appl. Phys. 32 (1961), 1536. 24 297.15 4.04085 0.00005 4.04925 0.00005 1961 99.99
A.S. Cooper, Acta Cryst. 15 (1962), 578. 24.8 297.95 4.04143 0.00002 4.04959 0.00002 1962 99.9997Quoted by W.B. Pearson, Lattice Spacings and Structures of Metals and Alloys, 1st Ed. (Pergamon Press, 1967).
381 654.15 4.07950 0.00030 4.08774 0.00030 1962 99.99 Read off the graph in the paper414 687.15 4.08400 0.00030 4.09225 0.00030 1962 99.99 Read off the graph in the paper454 727.15 4.08850 0.00030 4.09676 0.00030 1962 99.99 Read off the graph in the paper498 771.15 4.09470 0.00030 4.10297 0.00030 1962 99.99 Read off the graph in the paper536 809.15 4.09950 0.00030 4.10778 0.00030 1962 99.99 Read off the graph in the paper572 845.15 4.10380 0.00030 4.11209 0.00030 1962 99.99 Read off the graph in the paper618 891.15 4.11100 0.00030 4.11930 0.00030 1962 99.99 Read off the graph in the paper19.3 292.45 4.04040 0.00000 4.04880 0.00000 1963 99.9924.2 297.35 4.04086 0.00000 4.04926 0.00000 1963 99.9929.3 302.45 4.04136 0.00000 4.04977 0.00000 1963 99.9939.2 312.35 4.04229 0.00000 4.05069 0.00000 1963 99.99
B.W. Delf, Brit. J. Appl. Phys. 14 (1963), 345. 20 293.15 4.04056 0.00004 4.04896 0.00004 1963From D. King, A.J. Cornish, J. Burke, J. Appl. Phys. 37 (1966), 4717.
25.3 298.45 4.04151 0.00007 4.04992 0.00007 1965 99.99525.5 298.65 4.04147 0.00007 4.04988 0.00007 1965 99.99525.5 298.65 4.04151 0.00007 4.04992 0.00007 1965 99.99525.5 298.65 4.04146 0.00007 4.04987 0.00007 1965 99.995
Perpendicular to Al wire axis
Along the axis of the wire
H.M. Otte, W.G. Montague, D.O. Welch, J. Appl. Phys. 34 (1963), 3149.
Quoted by Pearson's Handbook of Crystallographic Data for Intermetallic Phases Vol 1, 2nd Ed., P. Villar, L.D. Calvert (Eds), ASM International (1991), p648. Also originally in W.B. Pearson, Lattice Spacings and
D.N. Batchelder, R.O. Simmons, J. Appl. Phys. 36 (1965), 2864.
S. Nenno, J,W, Kauffman, J. Phys. Soc. Jpn. 15 (1960), 220.
M. Simerska, Czech. J. Phys. 12 (1962), 54.
V.V. Zubenko, M.M. Umansky, Kristallografija 1 (1956), 436
M.E. Straumanis, C.H. Cheng, J. Inst. Metals 88 (1960), 287.

57
kX to Å conversion factor, from: W.L. Bragg, E. Armstrong Wood, J. Am. Chem. Soc. 69 (1947), 2919 (1.00202) superseded by E.R. Cohen, J.W.M. DuMond, Rev. Mod. Phys. 37 (1965), 537 (1.002080±0.000006)
Unknown or "room" temp
is assigned 25°C by
default (See A.S. Cooper
1962)
Unknown error is
assigned 0.01% or 0.001%
depending on sig figs
Source T (°C) T (°K) a (kX) error (kX) a (Å) error (Å) DatePurity of
Al (%)Notes
20 293.15 4.04043 0.00004 4.04883 0.00004 1965 99.995134.9 408.05 4.05159 0.00004 4.06002 0.00004 1965 99.995199.1 472.25 4.05834 0.00004 4.06678 0.00004 1965 99.995275.5 548.65 4.06648 0.00004 4.07494 0.00004 1965 99.995303.5 576.65 4.06977 0.00004 4.07824 0.00004 1965 99.995376.5 649.65 4.07820 0.00004 4.08668 0.00004 1965 99.995433.8 706.95 4.08534 0.00004 4.09384 0.00004 1965 99.995468.6 741.75 4.08987 0.00004 4.09838 0.00004 1965 99.995474.9 748.05 4.09051 0.00004 4.09902 0.00004 1965 99.995514.4 787.55 4.09566 0.00004 4.10418 0.00004 1965 99.995524.6 797.75 4.09716 0.00004 4.10568 0.00004 1965 99.995575 848.15 4.10404 0.00004 4.11258 0.00004 1965 99.995
618.9 892.05 4.11029 0.00004 4.11884 0.00004 1965 99.995634.6 907.75 4.11263 0.00004 4.12118 0.00004 1965 99.995640.9 914.05 4.11364 0.00004 4.12220 0.00004 1965 99.995653.6 926.75 4.11562 0.00004 4.12418 0.00004 1965 99.995
20 293.15 4.04050 0.00010 4.04890 0.00010 1966 99.995 Measured.
250 523.15 4.06375 0.00010 4.07220 0.00010 1966 99.995Interpolations from fit to measurements not reported directly.
300 573.15 4.06934 0.00010 4.07780 0.00010 1966 99.995Interpolations from fit to measurements not reported directly.
350 623.15 4.07492 0.00010 4.08340 0.00010 1966 99.995Interpolations from fit to measurements not reported directly.
400 673.15 4.08101 0.00010 4.08950 0.00010 1966 99.995Interpolations from fit to measurements not reported directly.
450 723.15 4.08730 0.00010 4.09580 0.00010 1966 99.995Interpolations from fit to measurements not reported directly.
500 773.15 4.09369 0.00010 4.10220 0.00010 1966 99.995Interpolations from fit to measurements not reported directly.
550 823.15 4.10037 0.00010 4.10890 0.00010 1966 99.995Interpolations from fit to measurements not reported directly.
600 873.15 4.10746 0.00010 4.11600 0.00010 1966 99.995Interpolations from fit to measurements not reported directly.
650 923.15 4.11504 0.00010 4.12360 0.00010 1966 99.995Interpolations from fit to measurements not reported directly.
H. Kiendl, W. Witt, Phys. Lett. 22 (1966), 33. 23 296.15 4.04109 0.00010 4.04950 0.00010 1966
W. Witt, Z. Naturforsch. 22 (1967), 92. 23 296.15 4.04109 0.00010 4.04950 0.00010 1967 99.999
From electron diffraction. Quoted by Pearson's Handbook of Crystallographic Data for Intermetallic Phases Vol 1, 2nd Ed., P. Villar, L.D. Calvert (Eds), ASM International (1991), p648.
25 298.15 4.04191 0.00009 4.05032 0.00009 1969 99.5 Electron diffraction25 298.15 4.04132 0.00009 4.04973 0.00009 1969 99.999 Electron diffraction26 299.15 4.04200 0.00009 4.05041 0.00009 1969 99.5 X-ray diffraction
-233.15 40.00 4.02362 0.00004 4.03199 0.00004 1971 99+-213.15 60.00 4.02392 0.00004 4.03229 0.00004 1971 99+-193.15 80.00 4.02454 0.00004 4.03291 0.00004 1971 99+-173.15 100.00 4.02543 0.00004 4.03380 0.00004 1971 99+-273.15 0.00 4.02348 0.00004 4.03185 0.00004 1971 99+ Extrapolated.-147.65 125.50 4.02688 0.00004 4.03526 0.00004 1971 99+ Read off the graph in the paper
21 294.15 4.04268 0.00003 4.05109 0.00003 1974 99.999 Fitted value from other measurements - taken as a 0.21.83 294.98 4.04280 0.00003 4.05121 0.00003 1974 99.99940.85 314.00 4.04462 0.00003 4.05303 0.00003 1974 99.99966.66 339.81 4.04717 0.00003 4.05559 0.00003 1974 99.999
104.92 378.07 4.05081 0.00003 4.05923 0.00003 1974 99.999156.75 429.90 4.05598 0.00003 4.06442 0.00003 1974 99.999213.27 486.42 4.06217 0.00003 4.07062 0.00003 1974 99.999281.06 554.21 4.06880 0.00003 4.07726 0.00003 1974 99.999336.93 610.08 4.07632 0.00003 4.08480 0.00003 1974 99.999391.59 664.74 4.08303 0.00003 4.09152 0.00003 1974 99.999438.73 711.88 4.08885 0.00003 4.09735 0.00003 1974 99.999494.07 767.22 4.09609 0.00003 4.10460 0.00003 1974 99.999552.91 826.06 4.10397 0.00003 4.11250 0.00003 1974 99.999553.2 826.35 4.10405 0.00003 4.11259 0.00003 1974 99.999
581.36 854.51 4.10797 0.00003 4.11652 0.00003 1974 99.999605.95 879.10 4.11137 0.00003 4.11992 0.00003 1974 99.999633.57 906.72 4.11541 0.00003 4.12397 0.00003 1974 99.999637.46 910.61 4.11577 0.00003 4.12433 0.00003 1974 99.999622.74 895.89 4.11371 0.00003 4.12227 0.00003 1974 99.999574.21 847.36 4.10680 0.00003 4.11534 0.00003 1974 99.999519.54 792.69 4.09908 0.00003 4.10760 0.00003 1974 99.999467.69 740.84 4.09237 0.00003 4.10088 0.00003 1974 99.999467.02 740.17 4.09224 0.00003 4.10076 0.00003 1974 99.999413.68 686.83 4.08545 0.00003 4.09395 0.00003 1974 99.999361.5 634.65 4.07927 0.00003 4.08775 0.00003 1974 99.999
303.95 577.10 4.07235 0.00003 4.08083 0.00003 1974 99.999226.61 499.76 4.06334 0.00003 4.07179 0.00003 1974 99.999158.23 431.38 4.05586 0.00003 4.06430 0.00003 1974 99.999104.1 377.25 4.05052 0.00003 4.05895 0.00003 1974 99.99968.95 342.10 4.04717 0.00003 4.05559 0.00003 1974 99.99944.77 317.92 4.04482 0.00003 4.05324 0.00003 1974 99.99921.71 294.86 4.04248 0.00003 4.05089 0.00003 1974 99.999
M.-Y. Adam-Vigneron, F. Jordi, H. Roulet, Comptes Rendus Heb. d. Sci. Acad. Sci. B 269 (1969), 912.
Measurements made during the heating up of the sample.
Measurements made during the cooling down of the sample.
C.L. Woodard, M.E. Straumanis, J. Appl. Cryst. 4 (1971), 201.
D. King, A.J. Cornish, J. Burke, J. Appl. Phys. 37 (1966), 4717.
M.E. Straumanis, C.L. Woodard, Acta Cryst. A27 (1971), 549.
B. von Guerard, H. Peisl, R, Zitzmann, Appl. Phys. 3 (1974), 37.
A.J. Cornish, J. Burke, J. Sci. Instrum. 42 (1965), 212.

58
kX to Å conversion factor, from: W.L. Bragg, E. Armstrong Wood, J. Am. Chem. Soc. 69 (1947), 2919 (1.00202) superseded by E.R. Cohen, J.W.M. DuMond, Rev. Mod. Phys. 37 (1965), 537 (1.002080±0.000006)
Unknown or "room" temp
is assigned 25°C by
default (See A.S. Cooper
1962)
Unknown error is
assigned 0.01% or 0.001%
depending on sig figs
Source T (°C) T (°K) a (kX) error (kX) a (Å) error (Å) DatePurity of
Al (%)Notes
-269 4.62 4.02377 0.00060 4.03214 0.00060 1975 99+ Read off the graph in the paper-234 39.60 4.02375 0.00040 4.03212 0.00040 1975 99+ Read off the graph in the paper-193 79.80 4.02471 0.00060 4.03308 0.00060 1975 99+ Read off the graph in the paper-154 119.55 4.02680 0.00060 4.03518 0.00060 1975 99+ Read off the graph in the paper28 301.15 4.04149 0.00020 4.04990 0.00020 197795 368.15 4.04778 0.00020 4.05620 0.00020 1977
125 398.15 4.05057 0.00020 4.05900 0.00020 1977190 463.15 4.05676 0.00020 4.06520 0.00020 1977230 503.15 4.06125 0.00020 4.06970 0.00020 1977-273 0.00 4.02313 0.00020 4.03150 0.00020 1978 99.9 Extrapolated.-180 93.14 4.02478 0.00020 4.03316 0.00020 1978 99.9 Read off the graph in the paper-167 105.94 4.02535 0.00020 4.03373 0.00020 1978 99.9 Read off the graph in the paper-140 133.28 4.02666 0.00020 4.03504 0.00020 1978 99.9 Read off the graph in the paper-126 146.92 4.02752 0.00020 4.03589 0.00020 1978 99.9 Read off the graph in the paper-80 193.19 4.03079 0.00020 4.03917 0.00020 1978 99.9 Read off the graph in the paper50 322.93 4.04176 0.00020 4.05017 0.00020 1978 99.9 Read off the graph in the paper
27 300.00 4.04149 0.00040 4.04989 0.00040 1979Read from graph in X.-G. Lu, M. Selleby, B. Sundman, CALPHAD 29 (2005), 68. (converted from molar volume)
65 337.89 4.04526 0.00040 4.05367 0.00040 1979Read from graph in X.-G. Lu, M. Selleby, B. Sundman, CALPHAD 29 (2005), 68. (converted from molar volume)
140 412.97 4.05273 0.00040 4.06116 0.00040 1979Read from graph in X.-G. Lu, M. Selleby, B. Sundman, CALPHAD 29 (2005), 68. (converted from molar volume)
275 547.66 4.06693 0.00040 4.07539 0.00040 1979Read from graph in X.-G. Lu, M. Selleby, B. Sundman, CALPHAD 29 (2005), 68. (converted from molar volume)
350 623.64 4.07545 0.00040 4.08393 0.00040 1979Read from graph in X.-G. Lu, M. Selleby, B. Sundman, CALPHAD 29 (2005), 68. (converted from molar volume)
420 692.86 4.08238 0.00040 4.09087 0.00040 1979Read from graph in X.-G. Lu, M. Selleby, B. Sundman, CALPHAD 29 (2005), 68. (converted from molar volume)
A.K. Giri, G.B. Mitra, J. Phys. D: Appl. Phys. 18 (1985), L75.
-273.15 0.00 4.02333 0.00040 4.03170 0.00040 1985 Extrapolated.
49.85 323.00 4.04249 0.00020 4.05090 0.00020 1998 99.995199.85 473.00 4.05387 0.00040 4.06230 0.00040 1998 99.995399.85 673.00 4.07862 0.00090 4.08710 0.00090 1998 99.995621.85 895.00 4.10576 0.00020 4.11430 0.00020 1998 99.995
0 273.15 4.03920 0.00020 4.04760 0.00020 1999 99.9Multi temperature measurements were done but only shown in a plot, yielding a thermal expansion equation. This is the reference value.
31 304.04 4.04182 0.00020 4.05022 0.00020 1999 99.931 304.04 4.04213 0.00020 4.05054 0.00020 1999 99.934 307.06 4.04195 0.00020 4.05036 0.00020 1999 99.942 314.67 4.04290 0.00020 4.05131 0.00020 1999 99.950 323.28 4.04398 0.00020 4.05239 0.00020 1999 99.958 331.54 4.04393 0.00020 4.05234 0.00020 1999 99.968 340.73 4.04530 0.00020 4.05371 0.00020 1999 99.976 349.38 4.04575 0.00020 4.05417 0.00020 1999 99.9
103 376.26 4.04880 0.00020 4.05722 0.00020 1999 99.9112 385.20 4.04950 0.00020 4.05793 0.00020 1999 99.9121 393.88 4.05031 0.00020 4.05873 0.00020 1999 99.9126 398.89 4.05108 0.00020 4.05950 0.00020 1999 99.9137 410.13 4.05255 0.00020 4.06098 0.00020 1999 99.9146 419.23 4.05317 0.00020 4.06160 0.00020 1999 99.9155 428.07 4.05335 0.00020 4.06178 0.00020 1999 99.9164 437.11 4.05462 0.00020 4.06305 0.00020 1999 99.9173 445.98 4.05581 0.00020 4.06425 0.00020 1999 99.9181 454.46 4.05629 0.00020 4.06473 0.00020 1999 99.9191 463.69 4.05743 0.00020 4.06587 0.00020 1999 99.9199 472.15 4.05842 0.00020 4.06686 0.00020 1999 99.9207 479.98 4.05969 0.00020 4.06813 0.00020 1999 99.9216 488.89 4.06031 0.00020 4.06875 0.00020 1999 99.9225 497.79 4.06094 0.00020 4.06938 0.00020 1999 99.9233 506.31 4.06189 0.00020 4.07034 0.00020 1999 99.9243 516.25 4.06311 0.00020 4.07156 0.00020 1999 99.9251 524.09 4.06352 0.00020 4.07197 0.00020 1999 99.9259 532.18 4.06510 0.00020 4.07356 0.00020 1999 99.9269 542.42 4.06577 0.00020 4.07423 0.00020 1999 99.9277 550.64 4.06712 0.00020 4.07558 0.00020 1999 99.9286 559.32 4.06838 0.00020 4.07685 0.00020 1999 99.9295 568.42 4.06857 0.00020 4.07703 0.00020 1999 99.9303 576.49 4.06963 0.00020 4.07810 0.00020 1999 99.9312 585.10 4.07093 0.00020 4.07940 0.00020 1999 99.9321 594.33 4.07239 0.00020 4.08086 0.00020 1999 99.9330 603.43 4.07275 0.00020 4.08123 0.00020 1999 99.9340 613.50 4.07395 0.00020 4.08242 0.00020 1999 99.9349 621.79 4.07489 0.00020 4.08337 0.00020 1999 99.9367 640.64 4.07752 0.00020 4.08600 0.00020 1999 99.9385 658.35 4.07940 0.00020 4.08789 0.00020 1999 99.9
G. Langelaan, S. Saimoto, Rev. Sci. Inst. 70 (1999), 3413.
Read off the graph in the paper. Note, two outliers were left out.
R. Roberge, J. Less-Common Metals 40 (1975), 161.
S.K. Seshadri, D.B. Downie, Met. Sci. 13 (1979), 696.
M. Johnsson, L. Eriksson, Z. Metallkd. 89 (1998), 478.
G.K. Bichile, R.G. Kulkarni, J. Appl. Cryst. 10 (1977), 441.
J. Bandopadhyay, K.P Gupta, Cryogenics 18 (1978), 54

59
kX to Å conversion factor, from: W.L. Bragg, E. Armstrong Wood, J. Am. Chem. Soc. 69 (1947), 2919 (1.00202) superseded by E.R. Cohen, J.W.M. DuMond, Rev. Mod. Phys. 37 (1965), 537 (1.002080±0.000006)
Unknown or "room" temp
is assigned 25°C by
default (See A.S. Cooper
1962)
Unknown error is
assigned 0.01% or 0.001%
depending on sig figs
Source T (°C) T (°K) a (kX) error (kX) a (Å) error (Å) DatePurity of
Al (%)Notes
17 290.15 4.04212 0.00040 4.05053 0.00040 2001
23.5 296.65 4.04283 0.00040 4.05124 0.00040 2001
35.4 308.55 4.04434 0.00040 4.05276 0.00040 2001
45.8 318.95 4.04566 0.00040 4.05407 0.00040 2001
60.4 333.55 4.04586 0.00040 4.05428 0.00040 2001
72 345.15 4.04890 0.00040 4.05732 0.00040 2001
104.8 377.95 4.05205 0.00040 4.06047 0.00040 2001
150.5 423.65 4.05489 0.00040 4.06333 0.00040 2001
24.5 297.65 4.03224 0.00040 4.04063 0.00040 2001 Outlier
3.7 276.85 4.03325 0.00040 4.04164 0.00040 2001 Outlier
47.8 320.95 4.03486 0.00040 4.04325 0.00040 2001 Outlier
67 340.15 4.03667 0.00040 4.04507 0.00040 2001 Outlier
103.3 376.45 4.04010 0.00040 4.04850 0.00040 2001 Outlier
18.4 291.55 4.03395 0.00040 4.04234 0.00040 2001 Outlier
31.7 304.85 4.03546 0.00040 4.04386 0.00040 2001 Outlier
55.3 328.45 4.03778 0.00040 4.04618 0.00040 2001 Outlier
80 353.15 4.04020 0.00040 4.04860 0.00040 2001 Outlier
26 299.15 4.03516 0.00040 4.04355 0.00040 2001 Outlier
45.5 318.65 4.03697 0.00040 4.04537 0.00040 2001 Outlier
78.3 351.45 4.04010 0.00040 4.04850 0.00040 2001 Outlier
-262 10.99 4.02354 0.00000 4.03191 0.00000 2013 99.5 Value given in the paper explicitly
-253 19.96 4.02356 0.00020 4.03193 0.00020 2013 99.5 Read off the graph in the paper
-233 40.05 4.02360 0.00020 4.03197 0.00020 2013 99.5 Read off the graph in the paper
-213 59.99 4.02385 0.00020 4.03222 0.00020 2013 99.5 Read off the graph in the paper
-193 80.18 4.02440 0.00020 4.03277 0.00020 2013 99.5 Read off the graph in the paper
-173 99.90 4.02523 0.00020 4.03360 0.00020 2013 99.5 Read off the graph in the paper
-153 120.01 4.02627 0.00020 4.03465 0.00020 2013 99.5 Read off the graph in the paper
-133 139.88 4.02752 0.00020 4.03589 0.00020 2013 99.5 Read off the graph in the paper
-113 160.14 4.02893 0.00020 4.03731 0.00020 2013 99.5 Read off the graph in the paper
-93 180.01 4.03048 0.00020 4.03886 0.00020 2013 99.5 Read off the graph in the paper
-73 199.91 4.03216 0.00020 4.04054 0.00020 2013 99.5 Read off the graph in the paper
-53 219.89 4.03389 0.00020 4.04228 0.00020 2013 99.5 Read off the graph in the paper
-33 240.08 4.03569 0.00020 4.04409 0.00020 2013 99.5 Read off the graph in the paper
-13 260.14 4.03747 0.00020 4.04587 0.00020 2013 99.5 Read off the graph in the paper
7 280.20 4.03921 0.00020 4.04761 0.00020 2013 99.5 Read off the graph in the paper
27 299.78 4.04106 0.00020 4.04947 0.00020 2013 99.5 Read off the graph in the paper
-223 50 4.02436 4.03273 2000
-173 100 4.02599 4.03436 2000
-123 150 4.02895 4.03733 2000
-73 200 4.03271 4.04110 2000
-23 250 4.03695 4.04535 2000
27 300 4.04151 4.04992 2000
77 350 4.04632 4.05474 2000
127 400 4.05133 4.05976 2000
177 450 4.05652 4.06496 2000
227 500 4.06189 4.07034 2000
277 550 4.06743 4.07589 2000
327 600 4.07315 4.08162 2000
377 650 4.07906 4.08754 2000
427 700 4.08518 4.09368 2000
477 750 4.09159 4.10010 2000
527 800 4.09832 4.10684 2000
577 850 4.10545 4.11399 2000
627 900 4.11308 4.12164 2000
660 933 4.11844 4.12701 2000
-223 50 4.02436 4.03273 2000
-173 100 4.02599 4.03436 2000
-123 150 4.02895 4.03733 2000
-73 200 4.03271 4.04110 2000
-23 250 4.03695 4.04535 2000
27 300 4.04151 4.04992 2000
77 350 4.04632 4.05474 2000
127 400 4.05133 4.05976 2000
177 450 4.05652 4.06496 2000
227 500 4.06189 4.07034 2000
277 550 4.06742 4.07588 2000
327 600 4.07312 4.08159 2000
377 650 4.07898 4.08746 2000
427 700 4.08500 4.09350 2000
477 750 4.09121 4.09972 2000
527 800 4.09760 4.10612 2000
577 850 4.10417 4.11271 2000
627 900 4.11095 4.11950 2000
660 933 4.11554 4.12410 2000
MODELLING and THEORY
K. Wang, R.R. Reeber, Phil. Mag. A 80 (2000), 1629.
Real Crystal Model - including crystal imperfections
(vacancies).
Perfect Crystal Model.
J. Potter, J.E. Parker, A.R. Lennie, S.P. Thompson, C.C.
Tang, J. Appl. Cryst. 46 (2013), 826.
S. Battaglia, F. Mango, Materials Science Forum 378 (2001), 92.

60
Appendix B Table of experimental and modelled linear thermal expansion coefficients for pure aluminium from the literature.
Source T (°C) T (°K) ∆L /L 0 ∆a /a 0 !x106 Date Purity of Al (%) Notes
-191 82.15 -0.003799 1907 ∆L /L 0 relative to +16°C. Corrected to L (T).
16 289.15 0 21.40 1907 ∆L /L 0 relative to +16°C. Corrected to L (T).
250 523.15 0.00572 26.90 1907 ∆L /L 0 relative to +16°C. Corrected to L (T).
375 648.15 0.009429 29.44 1907 ∆L /L 0 relative to +16°C. Corrected to L (T).
500 773.15 0.013149 30.82 1907 ∆L /L 0 relative to +16°C. Corrected to L (T).
625 898.15 0.017239 1907 ∆L /L 0 relative to +16°C. Corrected to L (T).
0 273.15 22.60 1925 99.95Obtained from A.J.C. Wilson, Proc. Phys. Soc. 54 (1942),
487 and A. Ieviņš, M. Straumanis, Z. Phys. Chem. B 33
100 373.15 24.50 1925 99.95Obtained from A.J.C. Wilson, Proc. Phys. Soc. 54 (1942),
487 and A. Ieviņš, M. Straumanis, Z. Phys. Chem. B 33
200 473.15 26.40 1925 99.95Obtained from A.J.C. Wilson, Proc. Phys. Soc. 54 (1942),
487 and A. Ieviņš, M. Straumanis, Z. Phys. Chem. B 33
300 573.15 28.30 1925 99.95Obtained from A.J.C. Wilson, Proc. Phys. Soc. 54 (1942),
487 and A. Ieviņš, M. Straumanis, Z. Phys. Chem. B 33
400 673.15 30.30 1925 99.95Obtained from A.J.C. Wilson, Proc. Phys. Soc. 54 (1942),
487 and A. Ieviņš, M. Straumanis, Z. Phys. Chem. B 33
500 773.15 32.20 1925 99.95Obtained from A.J.C. Wilson, Proc. Phys. Soc. 54 (1942),
487 and A. Ieviņš, M. Straumanis, Z. Phys. Chem. B 33
600 873.15 34.10 1925 99.95Obtained from A.J.C. Wilson, Proc. Phys. Soc. 54 (1942),
487 and A. Ieviņš, M. Straumanis, Z. Phys. Chem. B 33 85.00 8.81 1926
90.00 10.20 1926
100.00 11.87 1926
110.00 13.23 1926
130.00 15.39 1926
150.00 16.93 1926
170.00 18.15 1926
190.00 19.17 1926
210.00 20.00 1926
240.00 21.07 1926
270.00 21.99 1926
297.00 22.75 1926
315.00 23.19 1926
Staatliches Materialprüfungsamt, Z. Metallkde. 20 (1928), 14.
25 298.15 23.00 1928 99.66Obtained from A. Ieviņš, M. Straumanis, Z. Phys. Chem.
B 33 (1936), 265.
0 273.15 22.50 1928 99Obtained from A. Ieviņš, M. Straumanis, Z. Phys. Chem.
B 33 (1936), 265.
100 373.15 23.40 1928 99Obtained from A. Ieviņš, M. Straumanis, Z. Phys. Chem.
B 33 (1936), 265.
100 373.15 23.50 1930
140 413.15 24.30 1930
180 453.15 25.00 1930
220 493.15 25.70 1930
260 533.15 26.50 1930
300 573.15 27.40 1930
340 613.15 28.30 1930
380 653.15 28.80 1930
420 693.15 29.60 1930
460 733.15 30.10 1930
500 773.15 31.10 1930
530 803.15 32.30 1930
G. Shinoda, Mem. Sci. Kyoto Univ. A 16 (1933), 193. 60 333.15 22.90 1933 99.8Obtained from A. Ieviņš, M. Straumanis, Z. Phys. Chem.
B 33 (1936), 265.
0 273.15 22.80 1934 99.87Obtained from A.J.C. Wilson, Proc. Phys. Soc. 54 (1942),
487.
100 373.15 23.60 1934 99.87Obtained from A.J.C. Wilson, Proc. Phys. Soc. 54 (1942),
487.
200 473.15 25.00 1934 99.87Obtained from A.J.C. Wilson, Proc. Phys. Soc. 54 (1942),
487.
300 573.15 26.60 1934 99.87Obtained from A.J.C. Wilson, Proc. Phys. Soc. 54 (1942),
487.
400 673.15 28.90 1934 99.87Obtained from A.J.C. Wilson, Proc. Phys. Soc. 54 (1942),
487.
500 773.15 31.50 1934 99.87Obtained from A.J.C. Wilson, Proc. Phys. Soc. 54 (1942),
487.
A. Ieviņš, M. Straumanis, Z. Phys. Chem. B 33 (1936),
265.24.5 297.65 23.13 1936 99.9986
A. Ieviņš, M. Straumanis, Z. Phys. Chem. B 34 (1936),
402.25 298.15 23.29 1936 99.9986
EXPERIMENTAL MEASUREMENTS
F. Henning, Ann. d. Phys. 327 (1907), 631.
H. Ebert, Z. Physik 47 (1928), 719.
P. Hidnert, Sci. Pap. Bur. Stand. Wash. 19 (1925), 497.
F. Bollenrath, Z. Metallkunde 26 (1934), 62.
F.L. Uffelmann, Phil. Mag. 10 (1930), 633.
R.M. Buffington, W.M. Latimer, J. Am. Chem. Soc. 48 (1926), 2305.
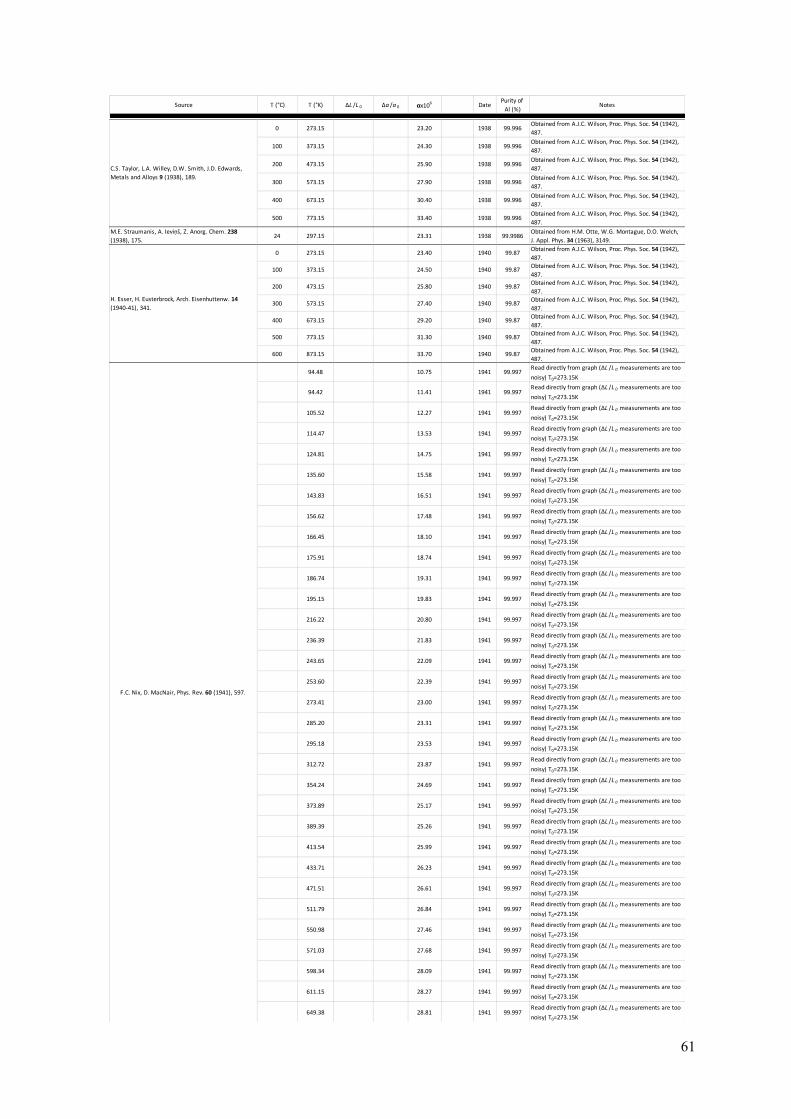
61
Source T (°C) T (°K) ∆L /L 0 ∆a /a 0 !x106 Date Purity of Al (%) Notes
0 273.15 23.20 1938 99.996Obtained from A.J.C. Wilson, Proc. Phys. Soc. 54 (1942), 487.
100 373.15 24.30 1938 99.996Obtained from A.J.C. Wilson, Proc. Phys. Soc. 54 (1942), 487.
200 473.15 25.90 1938 99.996Obtained from A.J.C. Wilson, Proc. Phys. Soc. 54 (1942), 487.
300 573.15 27.90 1938 99.996Obtained from A.J.C. Wilson, Proc. Phys. Soc. 54 (1942), 487.
400 673.15 30.40 1938 99.996Obtained from A.J.C. Wilson, Proc. Phys. Soc. 54 (1942), 487.
500 773.15 33.40 1938 99.996Obtained from A.J.C. Wilson, Proc. Phys. Soc. 54 (1942), 487.
M.E. Straumanis, A. Ieviņš, Z. Anorg. Chem. 238 (1938), 175.
24 297.15 23.31 1938 99.9986Obtained from H.M. Otte, W.G. Montague, D.O. Welch, J. Appl. Phys. 34 (1963), 3149.
0 273.15 23.40 1940 99.87Obtained from A.J.C. Wilson, Proc. Phys. Soc. 54 (1942), 487.
100 373.15 24.50 1940 99.87Obtained from A.J.C. Wilson, Proc. Phys. Soc. 54 (1942), 487.
200 473.15 25.80 1940 99.87Obtained from A.J.C. Wilson, Proc. Phys. Soc. 54 (1942), 487.
300 573.15 27.40 1940 99.87Obtained from A.J.C. Wilson, Proc. Phys. Soc. 54 (1942), 487.
400 673.15 29.20 1940 99.87Obtained from A.J.C. Wilson, Proc. Phys. Soc. 54 (1942), 487.
500 773.15 31.30 1940 99.87Obtained from A.J.C. Wilson, Proc. Phys. Soc. 54 (1942), 487.
600 873.15 33.70 1940 99.87Obtained from A.J.C. Wilson, Proc. Phys. Soc. 54 (1942), 487.
94.48 10.75 1941 99.997Read directly from graph (∆L /L 0 measurements are too
noisy) T0=273.15K
94.42 11.41 1941 99.997Read directly from graph (∆L /L 0 measurements are too
noisy) T0=273.15K
105.52 12.27 1941 99.997Read directly from graph (∆L /L 0 measurements are too
noisy) T0=273.15K
114.47 13.53 1941 99.997Read directly from graph (∆L /L 0 measurements are too
noisy) T0=273.15K
124.81 14.75 1941 99.997Read directly from graph (∆L /L 0 measurements are too
noisy) T0=273.15K
135.60 15.58 1941 99.997Read directly from graph (∆L /L 0 measurements are too
noisy) T0=273.15K
143.83 16.51 1941 99.997Read directly from graph (∆L /L 0 measurements are too
noisy) T0=273.15K
156.62 17.48 1941 99.997Read directly from graph (∆L /L 0 measurements are too
noisy) T0=273.15K
166.45 18.10 1941 99.997Read directly from graph (∆L /L 0 measurements are too
noisy) T0=273.15K
175.91 18.74 1941 99.997Read directly from graph (∆L /L 0 measurements are too
noisy) T0=273.15K
186.74 19.31 1941 99.997Read directly from graph (∆L /L 0 measurements are too
noisy) T0=273.15K
195.15 19.83 1941 99.997Read directly from graph (∆L /L 0 measurements are too
noisy) T0=273.15K
216.22 20.80 1941 99.997Read directly from graph (∆L /L 0 measurements are too
noisy) T0=273.15K
236.39 21.83 1941 99.997Read directly from graph (∆L /L 0 measurements are too
noisy) T0=273.15K
243.65 22.09 1941 99.997Read directly from graph (∆L /L 0 measurements are too
noisy) T0=273.15K
253.60 22.39 1941 99.997Read directly from graph (∆L /L 0 measurements are too
noisy) T0=273.15K
273.41 23.00 1941 99.997Read directly from graph (∆L /L 0 measurements are too
noisy) T0=273.15K
285.20 23.31 1941 99.997Read directly from graph (∆L /L 0 measurements are too
noisy) T0=273.15K
295.18 23.53 1941 99.997Read directly from graph (∆L /L 0 measurements are too
noisy) T0=273.15K
312.72 23.87 1941 99.997Read directly from graph (∆L /L 0 measurements are too
noisy) T0=273.15K
354.24 24.69 1941 99.997Read directly from graph (∆L /L 0 measurements are too
noisy) T0=273.15K
373.89 25.17 1941 99.997Read directly from graph (∆L /L 0 measurements are too
noisy) T0=273.15K
389.39 25.26 1941 99.997Read directly from graph (∆L /L 0 measurements are too
noisy) T0=273.15K
413.54 25.99 1941 99.997Read directly from graph (∆L /L 0 measurements are too
noisy) T0=273.15K
433.71 26.23 1941 99.997Read directly from graph (∆L /L 0 measurements are too
noisy) T0=273.15K
471.51 26.61 1941 99.997Read directly from graph (∆L /L 0 measurements are too
noisy) T0=273.15K
511.79 26.84 1941 99.997Read directly from graph (∆L /L 0 measurements are too
noisy) T0=273.15K
550.98 27.46 1941 99.997Read directly from graph (∆L /L 0 measurements are too
noisy) T0=273.15K
571.03 27.68 1941 99.997Read directly from graph (∆L /L 0 measurements are too
noisy) T0=273.15K
598.34 28.09 1941 99.997Read directly from graph (∆L /L 0 measurements are too
noisy) T0=273.15K
611.15 28.27 1941 99.997Read directly from graph (∆L /L 0 measurements are too
noisy) T0=273.15K
649.38 28.81 1941 99.997Read directly from graph (∆L /L 0 measurements are too
noisy) T0=273.15K
F.C. Nix, D. MacNair, Phys. Rev. 60 (1941), 597.
C.S. Taylor, L.A. Willey, D.W. Smith, J.D. Edwards, Metals and Alloys 9 (1938), 189.
H. Esser, H. Eusterbrock, Arch. Eisenhuttenw. 14 (1940-41), 341.
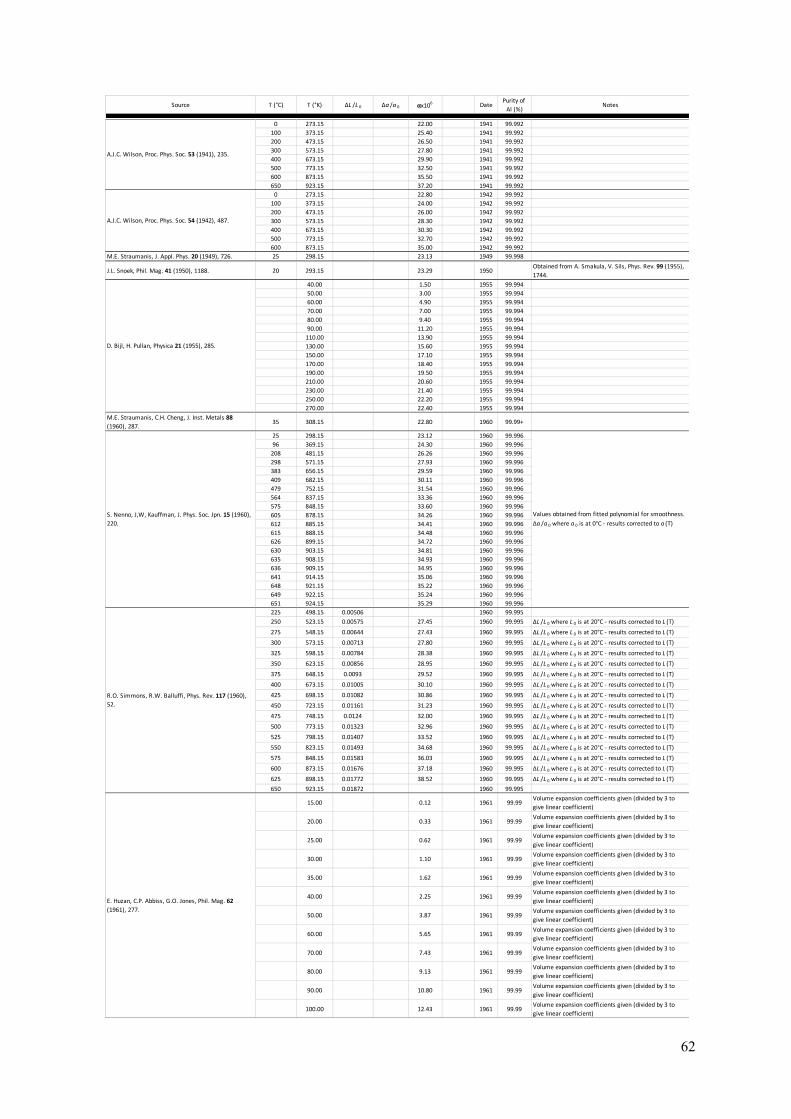
62
Source T (°C) T (°K) ∆L /L 0 ∆a /a 0 !x106 Date Purity of Al (%) Notes
0 273.15 22.00 1941 99.992100 373.15 25.40 1941 99.992200 473.15 26.50 1941 99.992300 573.15 27.80 1941 99.992400 673.15 29.90 1941 99.992500 773.15 32.50 1941 99.992600 873.15 35.50 1941 99.992650 923.15 37.20 1941 99.992
0 273.15 22.80 1942 99.992100 373.15 24.00 1942 99.992200 473.15 26.00 1942 99.992300 573.15 28.30 1942 99.992400 673.15 30.30 1942 99.992500 773.15 32.70 1942 99.992600 873.15 35.00 1942 99.992
M.E. Straumanis, J. Appl. Phys. 20 (1949), 726. 25 298.15 23.13 1949 99.998
J.L. Snoek, Phil. Mag. 41 (1950), 1188. 20 293.15 23.29 1950Obtained from A. Smakula, V. Sils, Phys. Rev. 99 (1955), 1744.
40.00 1.50 1955 99.99450.00 3.00 1955 99.99460.00 4.90 1955 99.99470.00 7.00 1955 99.99480.00 9.40 1955 99.99490.00 11.20 1955 99.994
110.00 13.90 1955 99.994130.00 15.60 1955 99.994150.00 17.10 1955 99.994170.00 18.40 1955 99.994190.00 19.50 1955 99.994210.00 20.60 1955 99.994230.00 21.40 1955 99.994250.00 22.20 1955 99.994270.00 22.40 1955 99.994
M.E. Straumanis, C.H. Cheng, J. Inst. Metals 88 (1960), 287.
35 308.15 22.80 1960 99.99+
25 298.15 23.12 1960 99.99696 369.15 24.30 1960 99.996
208 481.15 26.26 1960 99.996298 571.15 27.93 1960 99.996383 656.15 29.59 1960 99.996409 682.15 30.11 1960 99.996479 752.15 31.54 1960 99.996564 837.15 33.36 1960 99.996575 848.15 33.60 1960 99.996605 878.15 34.26 1960 99.996612 885.15 34.41 1960 99.996615 888.15 34.48 1960 99.996626 899.15 34.72 1960 99.996630 903.15 34.81 1960 99.996635 908.15 34.93 1960 99.996636 909.15 34.95 1960 99.996641 914.15 35.06 1960 99.996648 921.15 35.22 1960 99.996649 922.15 35.24 1960 99.996651 924.15 35.29 1960 99.996225 498.15 0.00506 1960 99.995250 523.15 0.00575 27.45 1960 99.995 ∆L /L 0 where L 0 is at 20°C - results corrected to L (T)275 548.15 0.00644 27.43 1960 99.995 ∆L /L 0 where L 0 is at 20°C - results corrected to L (T)300 573.15 0.00713 27.80 1960 99.995 ∆L /L 0 where L 0 is at 20°C - results corrected to L (T)325 598.15 0.00784 28.38 1960 99.995 ∆L /L 0 where L 0 is at 20°C - results corrected to L (T)350 623.15 0.00856 28.95 1960 99.995 ∆L /L 0 where L 0 is at 20°C - results corrected to L (T)375 648.15 0.0093 29.52 1960 99.995 ∆L /L 0 where L 0 is at 20°C - results corrected to L (T)400 673.15 0.01005 30.10 1960 99.995 ∆L /L 0 where L 0 is at 20°C - results corrected to L (T)425 698.15 0.01082 30.86 1960 99.995 ∆L /L 0 where L 0 is at 20°C - results corrected to L (T)450 723.15 0.01161 31.23 1960 99.995 ∆L /L 0 where L 0 is at 20°C - results corrected to L (T)475 748.15 0.0124 32.00 1960 99.995 ∆L /L 0 where L 0 is at 20°C - results corrected to L (T)500 773.15 0.01323 32.96 1960 99.995 ∆L /L 0 where L 0 is at 20°C - results corrected to L (T)525 798.15 0.01407 33.52 1960 99.995 ∆L /L 0 where L 0 is at 20°C - results corrected to L (T)550 823.15 0.01493 34.68 1960 99.995 ∆L /L 0 where L 0 is at 20°C - results corrected to L (T)575 848.15 0.01583 36.03 1960 99.995 ∆L /L 0 where L 0 is at 20°C - results corrected to L (T)600 873.15 0.01676 37.18 1960 99.995 ∆L /L 0 where L 0 is at 20°C - results corrected to L (T)625 898.15 0.01772 38.52 1960 99.995 ∆L /L 0 where L 0 is at 20°C - results corrected to L (T)650 923.15 0.01872 1960 99.995
15.00 0.12 1961 99.99Volume expansion coefficients given (divided by 3 to give linear coefficient)
20.00 0.33 1961 99.99Volume expansion coefficients given (divided by 3 to give linear coefficient)
25.00 0.62 1961 99.99Volume expansion coefficients given (divided by 3 to give linear coefficient)
30.00 1.10 1961 99.99Volume expansion coefficients given (divided by 3 to give linear coefficient)
35.00 1.62 1961 99.99Volume expansion coefficients given (divided by 3 to give linear coefficient)
40.00 2.25 1961 99.99Volume expansion coefficients given (divided by 3 to give linear coefficient)
50.00 3.87 1961 99.99Volume expansion coefficients given (divided by 3 to give linear coefficient)
60.00 5.65 1961 99.99Volume expansion coefficients given (divided by 3 to give linear coefficient)
70.00 7.43 1961 99.99Volume expansion coefficients given (divided by 3 to give linear coefficient)
80.00 9.13 1961 99.99Volume expansion coefficients given (divided by 3 to give linear coefficient)
90.00 10.80 1961 99.99Volume expansion coefficients given (divided by 3 to give linear coefficient)
100.00 12.43 1961 99.99Volume expansion coefficients given (divided by 3 to give linear coefficient)
E. Huzan, C.P. Abbiss, G.O. Jones, Phil. Mag. 62 (1961), 277.
A.J.C. Wilson, Proc. Phys. Soc. 53 (1941), 235.
A.J.C. Wilson, Proc. Phys. Soc. 54 (1942), 487.
R.O. Simmons, R.W. Balluffi, Phys. Rev. 117 (1960), 52.
Values obtained from fitted polynomial for smoothness. ∆a /a 0 where a 0 is at 0°C - results corrected to a (T)
D. Bijl, H. Pullan, Physica 21 (1955), 285.
S. Nenno, J,W, Kauffman, J. Phys. Soc. Jpn. 15 (1960), 220.

63
Source T (°C) T (°K) ∆L /L 0 ∆a /a 0 !x106 Date Purity of Al (%) Notes
H.M. Otte, W.G. Montague, D.O. Welch, J. Appl. Phys. 34 (1963), 3149.
24 297.15 23.40 1963 99.99
25.00 0.62 196530.00 1.02 196535.00 1.57 196540.00 2.18 196545.00 2.83 196550.00 3.60 196560.00 5.35 196570.00 7.32 196580.00 9.20 1965
20 293.15 0 1965 99.995
134.9 408.05 0.0028 24.95 1965 99.995∆a /a 0 where a 0 is at 20°C - results corrected to a (T) -
temp intervals equalised
199.1 472.25 0.0044 26.11 1965 99.995∆a /a 0 where a 0 is at 20°C - results corrected to a (T) -
temp intervals equalised
275.5 548.65 0.0065 27.51 1965 99.995∆a /a 0 where a 0 is at 20°C - results corrected to a (T) -
temp intervals equalised
303.5 576.65 0.0073 28.58 1965 99.995∆a /a 0 where a 0 is at 20°C - results corrected to a (T) -
temp intervals equalised
376.5 649.65 0.0094 29.48 1965 99.995∆a /a 0 where a 0 is at 20°C - results corrected to a (T) -
temp intervals equalised
433.8 706.95 0.0111 30.67 1965 99.995∆a /a 0 where a 0 is at 20°C - results corrected to a (T) -
temp intervals equalised
468.6 741.75 0.0122 31.32 1965 99.995∆a /a 0 where a 0 is at 20°C - results corrected to a (T) -
temp intervals equalised
474.9 748.05 0.0124 31.26 1965 99.995∆a /a 0 where a 0 is at 20°C - results corrected to a (T) -
temp intervals equalised
514.4 787.55 0.0137 32.70 1965 99.995∆a /a 0 where a 0 is at 20°C - results corrected to a (T) -
temp intervals equalised
524.6 797.75 0.0140 32.90 1965 99.995∆a /a 0 where a 0 is at 20°C - results corrected to a (T) -
temp intervals equalised
575 848.15 0.0157 33.98 1965 99.995∆a /a 0 where a 0 is at 20°C - results corrected to a (T) -
temp intervals equalised
618.9 892.05 0.0173 36.05 1965 99.995∆a /a 0 where a 0 is at 20°C - results corrected to a (T) -
temp intervals equalised
634.6 907.75 0.0179 37.64 1965 99.995∆a /a 0 where a 0 is at 20°C - results corrected to a (T) -
temp intervals equalised
640.9 914.05 0.0181 38.44 1965 99.995∆a /a 0 where a 0 is at 20°C - results corrected to a (T) -
temp intervals equalised
653.6 926.75 0.0186 1965 99.995250 523.15 0.0058 1966 99.995
300 573.15 0.0071 27.61 1966 99.995 ∆a /a 0 where a 0 is at 20°C - results corrected to a (T)
350 623.15 0.0085 28.75 1966 99.995 ∆a /a 0 where a 0 is at 20°C - results corrected to a (T)
400 673.15 0.0100 30.19 1966 99.995 ∆a /a 0 where a 0 is at 20°C - results corrected to a (T)
450 723.15 0.0116 31.04 1966 99.995 ∆a /a 0 where a 0 is at 20°C - results corrected to a (T)
500 773.15 0.0132 32.07 1966 99.995 ∆a /a 0 where a 0 is at 20°C - results corrected to a (T)
550 823.15 0.0148 33.60 1966 99.995 ∆a /a 0 where a 0 is at 20°C - results corrected to a (T)
600 873.15 0.0166 35.51 1966 99.995 ∆a /a 0 where a 0 is at 20°C - results corrected to a (T)
650 923.15 0.0184 1966 99.995485 758.15 0.0127 1966 99.998
514.8 787.95 0.0137 32.67 1966 99.998 ∆a /a 0 where a 0 is at 20°C - results corrected to a (T)
538 811.15 0.0145 33.00 1966 99.998 ∆a /a 0 where a 0 is at 20°C - results corrected to a (T)
563 836.15 0.0153 33.73 1966 99.998 ∆a /a 0 where a 0 is at 20°C - results corrected to a (T)
574.5 847.65 0.0157 34.48 1966 99.998 ∆a /a 0 where a 0 is at 20°C - results corrected to a (T)
592.1 865.25 0.0163 35.57 1966 99.998 ∆a /a 0 where a 0 is at 20°C - results corrected to a (T)
601.2 874.35 0.0166 35.84 1966 99.998 ∆a /a 0 where a 0 is at 20°C - results corrected to a (T)
611 884.15 0.0170 34.98 1966 99.998 ∆a /a 0 where a 0 is at 20°C - results corrected to a (T)
621.6 894.75 0.0174 35.89 1966 99.998 ∆a /a 0 where a 0 is at 20°C - results corrected to a (T)
630.8 903.95 0.0177 36.82 1966 99.998 ∆a /a 0 where a 0 is at 20°C - results corrected to a (T)
643.6 916.75 0.0182 36.23 1966 99.998 ∆a /a 0 where a 0 is at 20°C - results corrected to a (T)
652.9 926.05 0.0185 1966 99.998300.00 23.40 1970 99.999400.00 25.20 1970 99.999500.00 26.80 1970 99.999600.00 28.50 1970 99.999700.00 30.60 1970 99.999800.00 33.30 1970 99.999900.00 37.80 1970 99.99910.00 0.03 1971 99.99915.00 0.13 1971 99.99920.00 0.26 1971 99.99925.00 0.47 1971 99.99930.00 0.87 1971 99.99935.00 1.44 1971 99.99940.00 2.15 1971 99.99945.00 2.99 1971 99.99950.00 3.90 1971 99.99960.00 5.68 1971 99.99965.00 6.56 1971 99.99970.00 7.46 1971 99.99975.00 8.33 1971 99.999
D. King, A.J. Cornish, J. Burke, J. Appl. Phys. 37 (1966), 4717.
D.B. Fraser, A.C. Hollis Hallett, Can. J. Phys. 43 (1965), 193.
Smoothed values from two data collection runs
G. Bianchi, D. Mallejac, C. Janot, G. Champier, Comptes Rendus Heb. d. Sci. Acad. Sci. B 263 (1966), 1404.
A.J. Cornish, J. Burke, J. Sci. Instrum. 42 (1965), 212.
F.G. Awad, D. Gugan, Cryogenics 11 (1971), 414.
P.D. Pathak, N.G. Vasavada, J. Phys. C 3 (1970), L44.
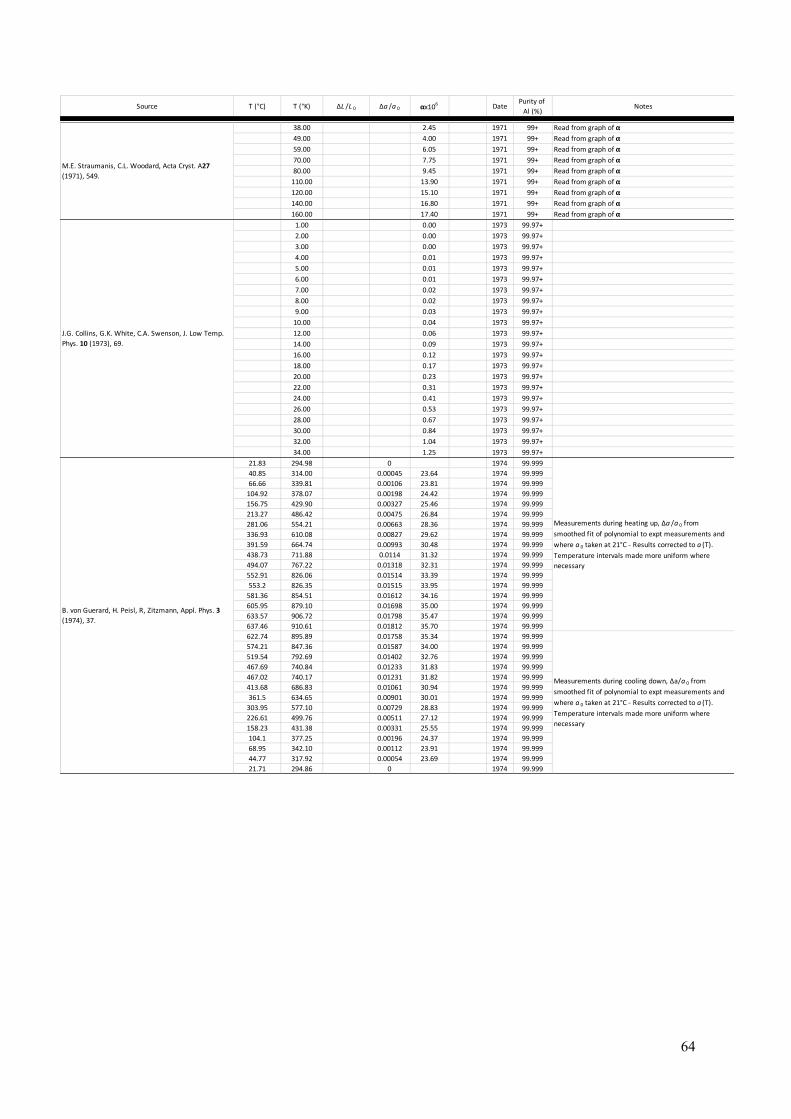
64
Source T (°C) T (°K) ∆L /L 0 ∆a /a 0 !x106 Date Purity of Al (%) Notes
38.00 2.45 1971 99+ Read from graph of !49.00 4.00 1971 99+ Read from graph of !59.00 6.05 1971 99+ Read from graph of !70.00 7.75 1971 99+ Read from graph of !80.00 9.45 1971 99+ Read from graph of !
110.00 13.90 1971 99+ Read from graph of !120.00 15.10 1971 99+ Read from graph of !140.00 16.80 1971 99+ Read from graph of !160.00 17.40 1971 99+ Read from graph of !
1.00 0.00 1973 99.97+2.00 0.00 1973 99.97+3.00 0.00 1973 99.97+4.00 0.01 1973 99.97+5.00 0.01 1973 99.97+6.00 0.01 1973 99.97+7.00 0.02 1973 99.97+8.00 0.02 1973 99.97+9.00 0.03 1973 99.97+
10.00 0.04 1973 99.97+12.00 0.06 1973 99.97+14.00 0.09 1973 99.97+16.00 0.12 1973 99.97+18.00 0.17 1973 99.97+20.00 0.23 1973 99.97+22.00 0.31 1973 99.97+24.00 0.41 1973 99.97+26.00 0.53 1973 99.97+28.00 0.67 1973 99.97+30.00 0.84 1973 99.97+32.00 1.04 1973 99.97+34.00 1.25 1973 99.97+
21.83 294.98 0 1974 99.99940.85 314.00 0.00045 23.64 1974 99.99966.66 339.81 0.00106 23.81 1974 99.999
104.92 378.07 0.00198 24.42 1974 99.999156.75 429.90 0.00327 25.46 1974 99.999213.27 486.42 0.00475 26.84 1974 99.999281.06 554.21 0.00663 28.36 1974 99.999336.93 610.08 0.00827 29.62 1974 99.999391.59 664.74 0.00993 30.48 1974 99.999438.73 711.88 0.0114 31.32 1974 99.999494.07 767.22 0.01318 32.31 1974 99.999552.91 826.06 0.01514 33.39 1974 99.999553.2 826.35 0.01515 33.95 1974 99.999
581.36 854.51 0.01612 34.16 1974 99.999605.95 879.10 0.01698 35.00 1974 99.999633.57 906.72 0.01798 35.47 1974 99.999637.46 910.61 0.01812 35.70 1974 99.999622.74 895.89 0.01758 35.34 1974 99.999574.21 847.36 0.01587 34.00 1974 99.999519.54 792.69 0.01402 32.76 1974 99.999467.69 740.84 0.01233 31.83 1974 99.999467.02 740.17 0.01231 31.82 1974 99.999413.68 686.83 0.01061 30.94 1974 99.999361.5 634.65 0.00901 30.01 1974 99.999
303.95 577.10 0.00729 28.83 1974 99.999226.61 499.76 0.00511 27.12 1974 99.999158.23 431.38 0.00331 25.55 1974 99.999104.1 377.25 0.00196 24.37 1974 99.99968.95 342.10 0.00112 23.91 1974 99.99944.77 317.92 0.00054 23.69 1974 99.99921.71 294.86 0 1974 99.999
Measurements during heating up, ∆a /a 0 from smoothed fit of polynomial to expt measurements and where a 0 taken at 21°C - Results corrected to a (T). Temperature intervals made more uniform where necessary
Measurements during cooling down, ∆a/a 0 from smoothed fit of polynomial to expt measurements and where a 0 taken at 21°C - Results corrected to a (T). Temperature intervals made more uniform where necessary
J.G. Collins, G.K. White, C.A. Swenson, J. Low Temp. Phys. 10 (1973), 69.
B. von Guerard, H. Peisl, R, Zitzmann, Appl. Phys. 3 (1974), 37.
M.E. Straumanis, C.L. Woodard, Acta Cryst. A27 (1971), 549.
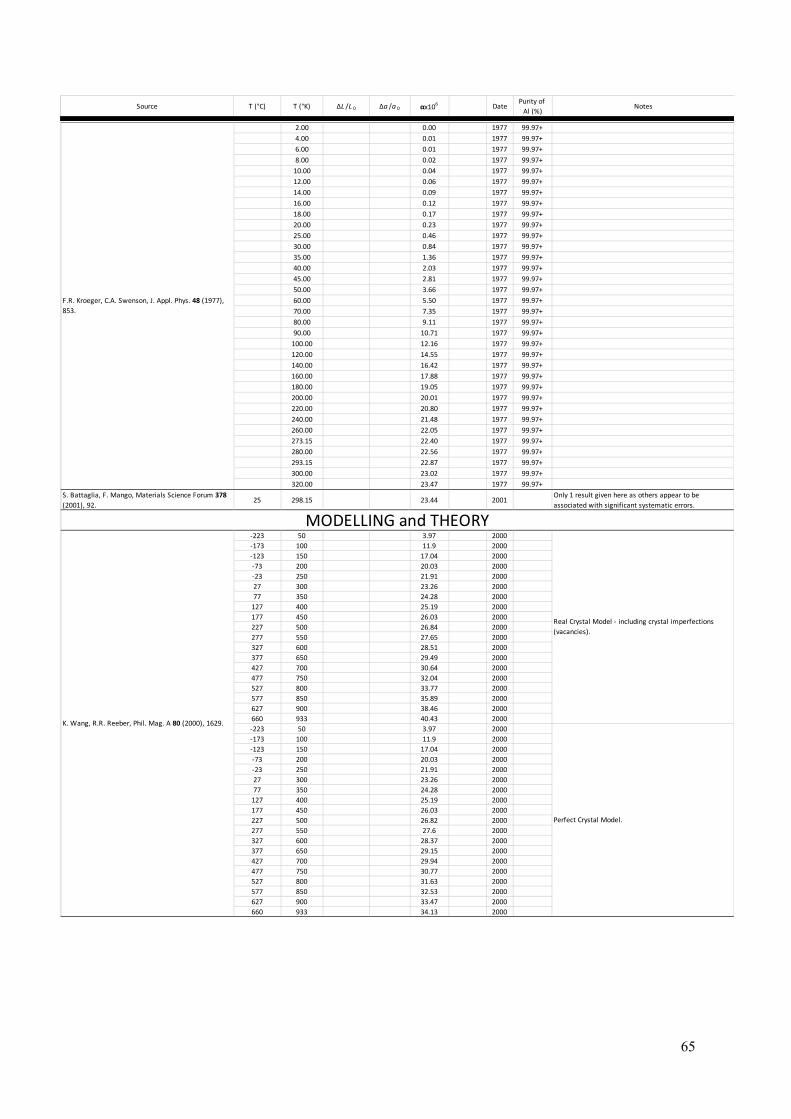
65
Source T (°C) T (°K) ∆L /L 0 ∆a /a 0 !x106 Date Purity of Al (%) Notes
2.00 0.00 1977 99.97+4.00 0.01 1977 99.97+6.00 0.01 1977 99.97+8.00 0.02 1977 99.97+
10.00 0.04 1977 99.97+12.00 0.06 1977 99.97+14.00 0.09 1977 99.97+16.00 0.12 1977 99.97+18.00 0.17 1977 99.97+20.00 0.23 1977 99.97+25.00 0.46 1977 99.97+30.00 0.84 1977 99.97+35.00 1.36 1977 99.97+40.00 2.03 1977 99.97+45.00 2.81 1977 99.97+50.00 3.66 1977 99.97+60.00 5.50 1977 99.97+70.00 7.35 1977 99.97+80.00 9.11 1977 99.97+90.00 10.71 1977 99.97+
100.00 12.16 1977 99.97+120.00 14.55 1977 99.97+140.00 16.42 1977 99.97+160.00 17.88 1977 99.97+180.00 19.05 1977 99.97+200.00 20.01 1977 99.97+220.00 20.80 1977 99.97+240.00 21.48 1977 99.97+260.00 22.05 1977 99.97+273.15 22.40 1977 99.97+280.00 22.56 1977 99.97+293.15 22.87 1977 99.97+300.00 23.02 1977 99.97+320.00 23.47 1977 99.97+
S. Battaglia, F. Mango, Materials Science Forum 378 (2001), 92.
25 298.15 23.44 2001Only 1 result given here as others appear to be associated with significant systematic errors.
-223 50 3.97 2000-173 100 11.9 2000-123 150 17.04 2000-73 200 20.03 2000-23 250 21.91 200027 300 23.26 200077 350 24.28 2000
127 400 25.19 2000177 450 26.03 2000227 500 26.84 2000277 550 27.65 2000327 600 28.51 2000377 650 29.49 2000427 700 30.64 2000477 750 32.04 2000527 800 33.77 2000577 850 35.89 2000627 900 38.46 2000660 933 40.43 2000-223 50 3.97 2000-173 100 11.9 2000-123 150 17.04 2000-73 200 20.03 2000-23 250 21.91 200027 300 23.26 200077 350 24.28 2000
127 400 25.19 2000177 450 26.03 2000227 500 26.82 2000277 550 27.6 2000327 600 28.37 2000377 650 29.15 2000427 700 29.94 2000477 750 30.77 2000527 800 31.63 2000577 850 32.53 2000627 900 33.47 2000660 933 34.13 2000
MODELLING and THEORY
K. Wang, R.R. Reeber, Phil. Mag. A 80 (2000), 1629.
Real Crystal Model - including crystal imperfections (vacancies).
Perfect Crystal Model.
F.R. Kroeger, C.A. Swenson, J. Appl. Phys. 48 (1977), 853.
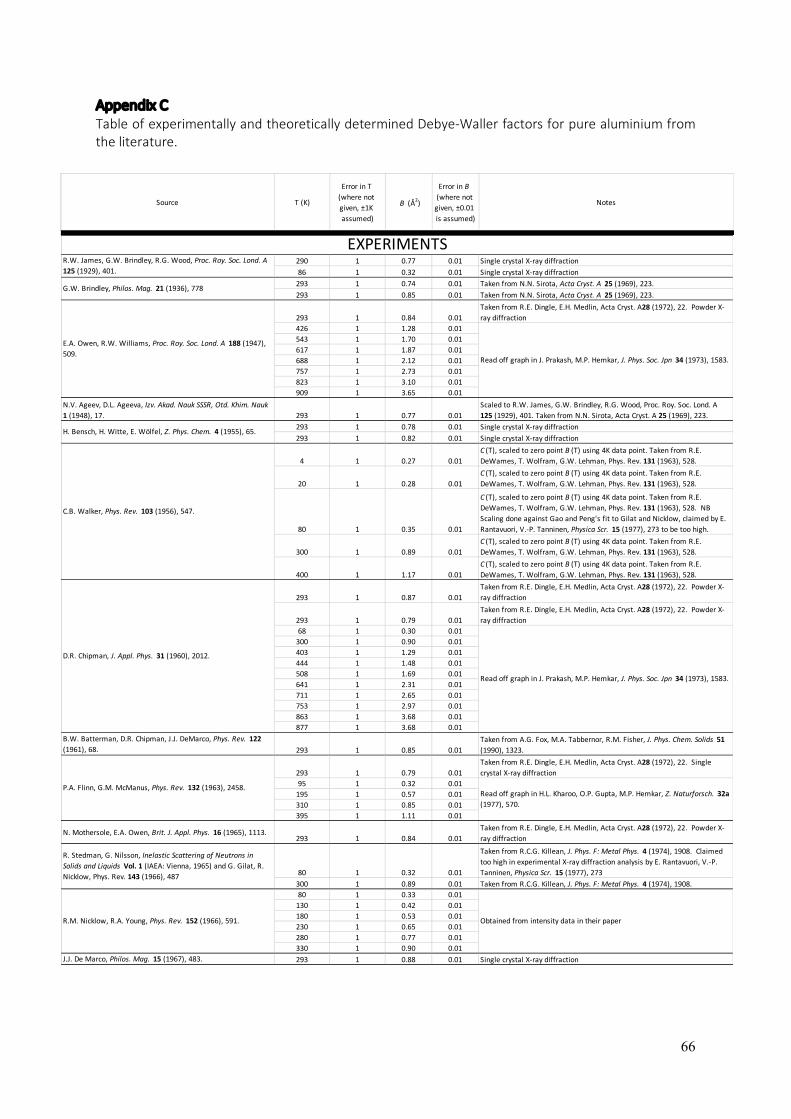
66
Appendix C Table of experimentally and theoretically determined Debye-Waller factors for pure aluminium from the literature.
Source T (K)
Error in T (where not given, ±1K assumed)
B (Å2)
Error in B (where not
given, ±0.01 is assumed)
Notes
290 1 0.77 0.01 Single crystal X-ray diffraction
86 1 0.32 0.01 Single crystal X-ray diffraction
293 1 0.74 0.01 Taken from N.N. Sirota, Acta Cryst. A 25 (1969), 223.
293 1 0.85 0.01 Taken from N.N. Sirota, Acta Cryst. A 25 (1969), 223.
293 1 0.84 0.01Taken from R.E. Dingle, E.H. Medlin, Acta Cryst. A28 (1972), 22. Powder X-ray diffraction
426 1 1.28 0.01543 1 1.70 0.01617 1 1.87 0.01688 1 2.12 0.01757 1 2.73 0.01823 1 3.10 0.01909 1 3.65 0.01
N.V. Ageev, D.L. Ageeva, Izv. Akad. Nauk SSSR, Otd. Khim. Nauk 1 (1948), 17. 293 1 0.77 0.01
Scaled to R.W. James, G.W. Brindley, R.G. Wood, Proc. Roy. Soc. Lond. A 125 (1929), 401. Taken from N.N. Sirota, Acta Cryst. A 25 (1969), 223.
293 1 0.78 0.01 Single crystal X-ray diffraction
293 1 0.82 0.01 Single crystal X-ray diffraction
4 1 0.27 0.01C (T), scaled to zero point B (T) using 4K data point. Taken from R.E. DeWames, T. Wolfram, G.W. Lehman, Phys. Rev. 131 (1963), 528.
20 1 0.28 0.01C (T), scaled to zero point B (T) using 4K data point. Taken from R.E. DeWames, T. Wolfram, G.W. Lehman, Phys. Rev. 131 (1963), 528.
80 1 0.35 0.01
C (T), scaled to zero point B (T) using 4K data point. Taken from R.E. DeWames, T. Wolfram, G.W. Lehman, Phys. Rev. 131 (1963), 528. NB Scaling done against Gao and Peng's fit to Gilat and Nicklow, claimed by E. Rantavuori, V.-P. Tanninen, Physica Scr. 15 (1977), 273 to be too high.
300 1 0.89 0.01C (T), scaled to zero point B (T) using 4K data point. Taken from R.E. DeWames, T. Wolfram, G.W. Lehman, Phys. Rev. 131 (1963), 528.
400 1 1.17 0.01C (T), scaled to zero point B (T) using 4K data point. Taken from R.E. DeWames, T. Wolfram, G.W. Lehman, Phys. Rev. 131 (1963), 528.
293 1 0.87 0.01Taken from R.E. Dingle, E.H. Medlin, Acta Cryst. A28 (1972), 22. Powder X-ray diffraction
293 1 0.79 0.01Taken from R.E. Dingle, E.H. Medlin, Acta Cryst. A28 (1972), 22. Powder X-ray diffraction
68 1 0.30 0.01300 1 0.90 0.01403 1 1.29 0.01444 1 1.48 0.01508 1 1.69 0.01641 1 2.31 0.01711 1 2.65 0.01753 1 2.97 0.01863 1 3.68 0.01877 1 3.68 0.01
B.W. Batterman, D.R. Chipman, J.J. DeMarco, Phys. Rev. 122 (1961), 68. 293 1 0.85 0.01
Taken from A.G. Fox, M.A. Tabbernor, R.M. Fisher, J. Phys. Chem. Solids 51 (1990), 1323.
293 1 0.79 0.01Taken from R.E. Dingle, E.H. Medlin, Acta Cryst. A28 (1972), 22. Single crystal X-ray diffraction
95 1 0.32 0.01195 1 0.57 0.01310 1 0.85 0.01395 1 1.11 0.01
N. Mothersole, E.A. Owen, Brit. J. Appl. Phys. 16 (1965), 1113.293 1 0.84 0.01
Taken from R.E. Dingle, E.H. Medlin, Acta Cryst. A28 (1972), 22. Powder X-ray diffraction
80 1 0.32 0.01
Taken from R.C.G. Killean, J. Phys. F: Metal Phys. 4 (1974), 1908. Claimed too high in experimental X-ray diffraction analysis by E. Rantavuori, V.-P. Tanninen, Physica Scr. 15 (1977), 273
300 1 0.89 0.01 Taken from R.C.G. Killean, J. Phys. F: Metal Phys. 4 (1974), 1908.80 1 0.33 0.01
130 1 0.42 0.01180 1 0.53 0.01230 1 0.65 0.01280 1 0.77 0.01330 1 0.90 0.01
J.J. De Marco, Philos. Mag. 15 (1967), 483. 293 1 0.88 0.01 Single crystal X-ray diffraction
R.W. James, G.W. Brindley, R.G. Wood, Proc. Roy. Soc. Lond. A 125 (1929), 401.
H. Bensch, H. Witte, E. Wölfel, Z. Phys. Chem. 4 (1955), 65.
G.W. Brindley, Philos. Mag. 21 (1936), 778
EXPERIMENTS
Read off graph in J. Prakash, M.P. Hemkar, J. Phys. Soc. Jpn 34 (1973), 1583.
C.B. Walker, Phys. Rev. 103 (1956), 547.
R. Stedman, G. Nilsson, Inelastic Scattering of Neutrons in Solids and Liquids Vol. 1 (IAEA: Vienna, 1965) and G. Gilat, R. Nicklow, Phys. Rev. 143 (1966), 487
R.M. Nicklow, R.A. Young, Phys. Rev. 152 (1966), 591.
D.R. Chipman, J. Appl. Phys. 31 (1960), 2012.
E.A. Owen, R.W. Williams, Proc. Roy. Soc. Lond. A 188 (1947), 509.
P.A. Flinn, G.M. McManus, Phys. Rev. 132 (1963), 2458.
Obtained from intensity data in their paper
Read off graph in H.L. Kharoo, O.P. Gupta, M.P. Hemkar, Z. Naturforsch. 32a (1977), 570.
Read off graph in J. Prakash, M.P. Hemkar, J. Phys. Soc. Jpn 34 (1973), 1583.

67
Source T (K)
Error in T (where not given, ±1K assumed)
B (Å2)
Error in B (where not
given, ±0.01 is assumed)
Notes
80 1 0.32 0.01 From PDS measurements by G. Gilat, R. Nicklow, Phys. Rev. 143 (1966), 487.
300 1 0.89 0.01 From PDS measurements by G. Gilat, R. Nicklow, Phys. Rev. 143 (1966), 487.294 1 0.90 0.01375 1 1.21 0.01475 1 1.57 0.01486 1 1.58 0.01552 1 1.87 0.01590 1 2.04 0.01657 1 2.40 0.01700 1 2.58 0.01733 1 2.73 0.01811 1 3.19 0.01830 1 3.29 0.01861 1 3.58 0.01
E.H. Medlin, R.E. Dingle, D.W. Field, Nature 224 (1969), 581. 293 1 0.816 0.003 Single crystal X-ray diffractionO. Inkinen, A. Pesonen, T. Paakkari, Ann. Acad. Sci. Fenn. A VI Physica (1970), 344. 293 1 0.89 0.01
Taken from A.G. Fox, M.A. Tabbernor, R.M. Fisher, J. Phys. Chem. Solids 51 (1990), 1323.
293 1 0.85 0.01370 2 1.09 0.01477 3 1.45 0.01559 9 1.84 0.01400 1 1.25 0.01400 1 1.30 0.01500 1 1.61 0.01500 1 1.67 0.01599 1 2.16 0.01599 1 2.16 0.01700 1 2.72 0.01700 1 2.65 0.01799 1 3.32 0.01799 1 3.26 0.01
E. Rantavuori, V.-P. Tanninen, Physica Scr. 15 (1977), 273 80 1 0.22 0.01 Take this as the most reliable measured value of B (80K)323 1 1.19 0.01383 1 1.30 0.01439 1 1.48 0.01505 1 1.68 0.01625 1 2.08 0.01668 1 2.34 0.01679 1 2.36 0.01733 1 2.75 0.01790 1 3.00 0.01848 1 3.30 0.01898 1 3.47 0.01290 1 0.90 0.01345 1 1.08 0.01400 1 1.27 0.01453 1 1.46 0.01507 1 1.65 0.01566 1 1.90 0.01622 1 2.12 0.01680 1 2.41 0.01734 1 2.63 0.01794 1 2.99 0.01848 1 3.35 0.01909 1 3.77 0.01
A.G. Fox, R.M. Fisher, Aust. J. Phys. 41 (1988), 461. 293 1 0.85 0.01 Probably obtained from R.E. Dingle, E.H. Medlin, Acta Cryst. A28 (1972), 22.
0 0 0.271 0 0.272 0 0.273 0 0.274 0 0.275 0 0.27
10 0 0.2715 0 0.2720 0 0.2725 0 0.2830 0 0.2835 0 0.2840 0 0.2945 0 0.2950 0 0.2960 0 0.3170 0 0.32
H.X. Gao, L.M. Peng, Acta Cryst. A 55 (1999), 926 in conjunction with L.-M. Peng, G. Ren, S.L. Dudarev, M.J. Whelan, Acta Cryst. A 52 (1996), 456. Also published in L.-M. Peng, S.L. Dudarev, M.J. Whelan, High-Energy Elecytron Diffraction and Microscopy (Oxford University Press, 2004), 454.
R.E. Dingle, E.H. Medlin, Acta Cryst. A 28 (1972), 22.
G. Albanese, C. Ghezzi, Phys. Rev. B 8 (1973), 1315.
C.J. Martin, D.A. O'Connor, Acta Cryst. A 34 (1978), 500.
D.L. McDonald, Acta Cryst. 23 (1967), 185.
Read in off graph from R.C. Shukla, C.A. Plint, Phys. Rev. B 40 (1989), 10337.
Read in off graph - corrected for TDS
Parameterised fit (T<80K) to phonon density of states measurements by G. Gilat, R. Nicklow, Phys. Rev. 143 (1966), 487.
Read in off graph - measured from (222)
Read in off graph - measured from (333)
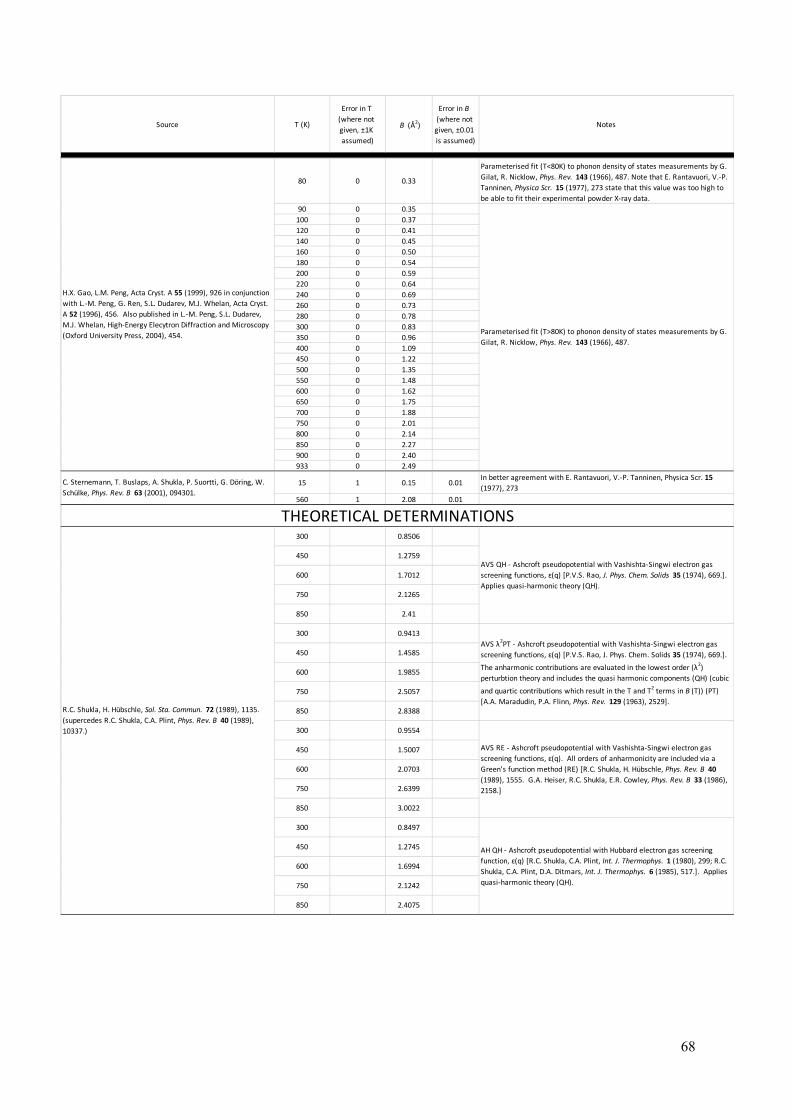
68
Source T (K)
Error in T (where not given, ±1K assumed)
B (Å2)
Error in B (where not
given, ±0.01 is assumed)
Notes
80 0 0.33
Parameterised fit (T<80K) to phonon density of states measurements by G. Gilat, R. Nicklow, Phys. Rev. 143 (1966), 487. Note that E. Rantavuori, V.-P. Tanninen, Physica Scr. 15 (1977), 273 state that this value was too high to be able to fit their experimental powder X-ray data.
90 0 0.35100 0 0.37120 0 0.41140 0 0.45160 0 0.50180 0 0.54200 0 0.59220 0 0.64240 0 0.69260 0 0.73280 0 0.78300 0 0.83350 0 0.96400 0 1.09450 0 1.22500 0 1.35550 0 1.48600 0 1.62650 0 1.75700 0 1.88750 0 2.01800 0 2.14850 0 2.27900 0 2.40933 0 2.49
15 1 0.15 0.01In better agreement with E. Rantavuori, V.-P. Tanninen, Physica Scr. 15 (1977), 273
560 1 2.08 0.01
300 0.8506
450 1.2759
600 1.7012
750 2.1265
850 2.41
300 0.9413
450 1.4585
600 1.9855
750 2.5057
850 2.8388
300 0.9554
450 1.5007
600 2.0703
750 2.6399
850 3.0022
300 0.8497
450 1.2745
600 1.6994
750 2.1242
850 2.4075
C. Sternemann, T. Buslaps, A. Shukla, P. Suortti, G. Döring, W. Schülke, Phys. Rev. B 63 (2001), 094301.
R.C. Shukla, H. Hübschle, Sol. Sta. Commun. 72 (1989), 1135. (supercedes R.C. Shukla, C.A. Plint, Phys. Rev. B 40 (1989), 10337.)
H.X. Gao, L.M. Peng, Acta Cryst. A 55 (1999), 926 in conjunction with L.-M. Peng, G. Ren, S.L. Dudarev, M.J. Whelan, Acta Cryst. A 52 (1996), 456. Also published in L.-M. Peng, S.L. Dudarev, M.J. Whelan, High-Energy Elecytron Diffraction and Microscopy (Oxford University Press, 2004), 454.
THEORETICAL DETERMINATIONS
AVS QH - Ashcroft pseudopotential with Vashishta-Singwi electron gas screening functions, ε(q) [P.V.S. Rao, J. Phys. Chem. Solids 35 (1974), 669.]. Applies quasi-harmonic theory (QH).
AVS λ2PT - Ashcroft pseudopotential with Vashishta-Singwi electron gas screening functions, ε(q) [P.V.S. Rao, J. Phys. Chem. Solids 35 (1974), 669.].
The anharmonic contributions are evaluated in the lowest order (λ2) perturbtion theory and includes the quasi harmonic components (QH) (cubic
and quartic contributions which result in the T and T2 terms in B (T)) (PT) [A.A. Maradudin, P.A. Flinn, Phys. Rev. 129 (1963), 2529].
AVS RE - Ashcroft pseudopotential with Vashishta-Singwi electron gas screening functions, ε(q). All orders of anharmonicity are included via a Green's function method (RE) [R.C. Shukla, H. Hübschle, Phys. Rev. B 40 (1989), 1555. G.A. Heiser, R.C. Shukla, E.R. Cowley, Phys. Rev. B 33 (1986), 2158.]
AH QH - Ashcroft pseudopotential with Hubbard electron gas screening function, ε(q) [R.C. Shukla, C.A. Plint, Int. J. Thermophys. 1 (1980), 299; R.C. Shukla, C.A. Plint, D.A. Ditmars, Int. J. Thermophys. 6 (1985), 517.]. Applies quasi-harmonic theory (QH).
Parameterised fit (T>80K) to phonon density of states measurements by G. Gilat, R. Nicklow, Phys. Rev. 143 (1966), 487.

69
Source T (K)
Error in T (where not given, ±1K assumed)
B (Å2)
Error in B (where not
given, ±0.01 is assumed)
Notes
300 0.9423
450 1.4619
600 1.993
750 2.5178
850 2.8574
300 0.9573
450 1.5074
600 2.086
750 2.6668
850 3.0422
300 0.8671
450 1.3007
600 1.7343
750 2.1679
850 2.4569
300 0.9687
450 1.5154
600 2.0752
750 2.6342
850 2.9976
300 0.9875
450 1.5816
600 2.2199
750 2.8864
850 3.3285
300 0.8267
450 1.27
600 1.7395
750 2.2425
850 2.6009
300 0.843
450 1.3073
600 1.8077
750 2.3521
850 2.7445
300 0.8434
450 1.3088
600 1.8114
750 2.3595
850 2.7558
80 0.32
295 0.89
300 0.9
375 1.16
475 1.54
485 1.58
552 1.87
588 2.03
655 2.36
700 2.59
730 2.77
810 3.25
830 3.37
860 3.57
R.C. Shukla, H. Hübschle, Sol. Sta. Commun. 72 (1989), 1135.
(supercedes R.C. Shukla, C.A. Plint, Phys. Rev. B 40 (1989),
10337.)
R.C. Shukla, H. Hübschle, Sol. Sta. Commun. 72 (1989), 1135.
(supercedes R.C. Shukla, C.A. Plint, Phys. Rev. B 40 (1989),
10337.)
R.C.G. Killean, J. Phys. F: Metal Phys. 4 (1974), 1908. Nearest neighbour central force pair interactions model
AH λ2PT - Ashcroft pseudopotential with Hubbard electron gas screening
function, ε(q) [R.C. Shukla, C.A. Plint, Int. J. Thermophys. 1 (1980), 299; R.C.
Shukla, C.A. Plint, D.A. Ditmars, Int. J. Thermophys. 6 (1985), 517.]. The
anharmonic contributions are evaluated in the lowest order (λ2) perturbtion
theory and includes the quasi harmonic components (QH) (cubic and quartic
contributions which result in the T and T2 terms in B (T)) (PT) [A.A.
Maradudin, P.A. Flinn, Phys. Rev. 129 (1963), 2529].
AH RE - Ashcroft pseudopotential with Hubbard electron gas screening
function, ε(q) [R.C. Shukla, C.A. Plint, Int. J. Thermophys. 1 (1980), 299; R.C.
Shukla, C.A. Plint, D.A. Ditmars, Int. J. Thermophys. 6 (1985), 517.]. All
orders of anharmonicity are included via a Green's function method (RE)
[R.C. Shukla, H. Hübschle, Phys. Rev. B 40 (1989), 1555. G.A. Heiser, R.C.
Shukla, E.R. Cowley, Phys. Rev. B 33 (1986), 2158.]
HHS QH - Harrison modified point ion pseudopotential with Hubbard-Sham
electron gas screening function, ε(q) [R.C. Shukla, C.A. Plint, Int. J.
Thermophys. 1 (1980), 299; R.C. Shukla, C.A. Plint, D.A. Ditmars, Int. J.
Thermophys. 6 (1985), 517.]. Applied quasi-harmonic theory (QH).
HHS λ2PT - Harrison modified point ion pseudopotential with Hubbard-Sham
electron gas screening function, ε(q) [R.C. Shukla, C.A. Plint, Int. J.
Thermophys. 1 (1980), 299; R.C. Shukla, C.A. Plint, D.A. Ditmars, Int. J.
Thermophys. 6 (1985), 517.]. The anharmonic contributions are evaluated
in the lowest order (λ2) perturbtion theory and includes the quasi harmonic
components (QH) (cubic and quartic contributions which result in the T and
T2 terms in B (T)) (PT) [A.A. Maradudin, P.A. Flinn, Phys. Rev. 129 (1963),
2529].
HHS RE - Harrison modified point ion pseudopotential with Hubbard-Sham
electron gas screening function, ε(q) [R.C. Shukla, C.A. Plint, Int. J.
Thermophys. 1 (1980), 299; R.C. Shukla, C.A. Plint, D.A. Ditmars, Int. J.
Thermophys. 6 (1985), 517.]. All orders of anharmonicity are included via
a Green's function method (RE) [R.C. Shukla, H. Hübschle, Phys. Rev. B 40 (1989), 1555. G.A. Heiser, R.C. Shukla, E.R. Cowley, Phys. Rev. B 33 (1986),
2158.]
Morse QH - Morse potential parameters [R.C. Shukla, R.A. MacDonald, High Temp. High Press. 12 (1980), 291.] Applied quasi-harmonic theory (QH).
Morse λ2PT - Morse potential parameters [R.C. Shukla, R.A. MacDonald,
High Temp. High Press. 12 (1980), 291.] The anharmonic contributions are
evaluated in the lowest order (λ2) perturbtion theory and includes the quasi
harmonic components (QH) (cubic and quartic contributions which result in
the T and T2 terms in B (T)) (PT) [A.A. Maradudin, P.A. Flinn, Phys. Rev. 129
(1963), 2529].
Morse RE - Morse potential parameters [R.C. Shukla, R.A. MacDonald, High
Temp. High Press. 12 (1980), 291.] All orders of anharmonicity are included
via a Green's function method (RE) [R.C. Shukla, H. Hübschle, Phys. Rev. B
40 (1989), 1555. G.A. Heiser, R.C. Shukla, E.R. Cowley, Phys. Rev. B 33 (1986), 2158.]
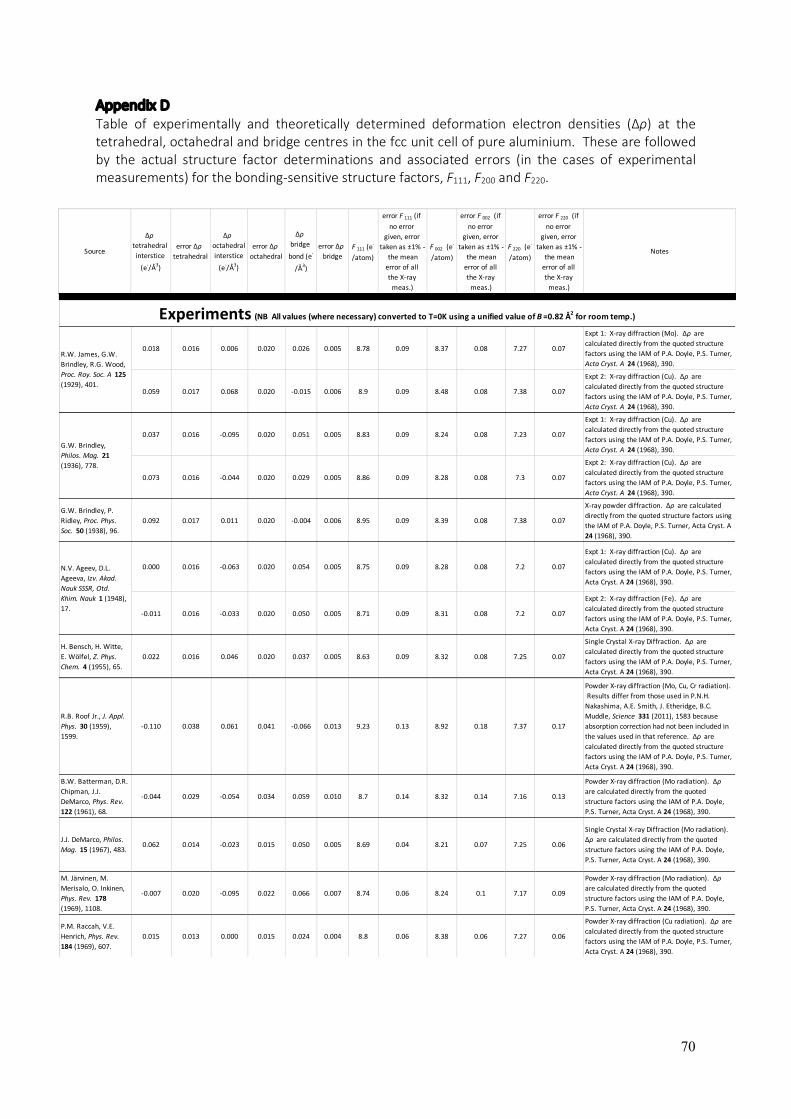
70
Appendix D Table of experimentally and theoretically determined deformation electron densities (∆ρ) at the tetrahedral, octahedral and bridge centres in the fcc unit cell of pure aluminium. These are followed by the actual structure factor determinations and associated errors (in the cases of experimental measurements) for the bonding-sensitive structure factors, F111, F200 and F220.
Source
∆ρ tetrahedral interstice
(e-/Å3)
error ∆ρ tetrahedral
∆ρ octahedral interstice
(e-/Å3)
error ∆ρ octahedral
∆ρ bridge
bond (e-
/Å3)
error ∆ρ bridge
F 111 (e-
/atom)
error F 111 (if no error
given, error taken as ±1% -
the mean error of all the X-ray
meas.)
F 002 (e-
/atom)
error F 002 (if no error
given, error taken as ±1% -
the mean error of all the X-ray
meas.)
F 220 (e-
/atom)
error F 220 (if no error
given, error taken as ±1% -
the mean error of all the X-ray
meas.)
Notes
0.018 0.016 0.006 0.020 0.026 0.005 8.78 0.09 8.37 0.08 7.27 0.07
Expt 1: X-ray diffraction (Mo). ∆ρ are calculated directly from the quoted structure factors using the IAM of P.A. Doyle, P.S. Turner, Acta Cryst. A 24 (1968), 390.
0.059 0.017 0.068 0.020 -0.015 0.006 8.9 0.09 8.48 0.08 7.38 0.07
Expt 2: X-ray diffraction (Cu). ∆ρ are calculated directly from the quoted structure factors using the IAM of P.A. Doyle, P.S. Turner, Acta Cryst. A 24 (1968), 390.
0.037 0.016 -0.095 0.020 0.051 0.005 8.83 0.09 8.24 0.08 7.23 0.07
Expt 1: X-ray diffraction (Cu). ∆ρ are calculated directly from the quoted structure factors using the IAM of P.A. Doyle, P.S. Turner, Acta Cryst. A 24 (1968), 390.
0.073 0.016 -0.044 0.020 0.029 0.005 8.86 0.09 8.28 0.08 7.3 0.07
Expt 2: X-ray diffraction (Cu). ∆ρ are calculated directly from the quoted structure factors using the IAM of P.A. Doyle, P.S. Turner, Acta Cryst. A 24 (1968), 390.
G.W. Brindley, P. Ridley, Proc. Phys. Soc. 50 (1938), 96.
0.092 0.017 0.011 0.020 -0.004 0.006 8.95 0.09 8.39 0.08 7.38 0.07
X-ray powder diffraction. ∆ρ are calculated directly from the quoted structure factors using the IAM of P.A. Doyle, P.S. Turner, Acta Cryst. A 24 (1968), 390.
0.000 0.016 -0.063 0.020 0.054 0.005 8.75 0.09 8.28 0.08 7.2 0.07
Expt 1: X-ray diffraction (Cu). ∆ρ are calculated directly from the quoted structure factors using the IAM of P.A. Doyle, P.S. Turner, Acta Cryst. A 24 (1968), 390.
-0.011 0.016 -0.033 0.020 0.050 0.005 8.71 0.09 8.31 0.08 7.2 0.07
Expt 2: X-ray diffraction (Fe). ∆ρ are calculated directly from the quoted structure factors using the IAM of P.A. Doyle, P.S. Turner, Acta Cryst. A 24 (1968), 390.
H. Bensch, H. Witte, E. Wölfel, Z. Phys. Chem. 4 (1955), 65.
0.022 0.016 0.046 0.020 0.037 0.005 8.63 0.09 8.32 0.08 7.25 0.07
Single Crystal X-ray Diffraction. ∆ρ are calculated directly from the quoted structure factors using the IAM of P.A. Doyle, P.S. Turner, Acta Cryst. A 24 (1968), 390.
R.B. Roof Jr., J. Appl. Phys. 30 (1959), 1599.
-0.110 0.038 0.061 0.041 -0.066 0.013 9.23 0.13 8.92 0.18 7.37 0.17
Powder X-ray diffraction (Mo, Cu, Cr radiation). Results differ from those used in P.N.H. Nakashima, A.E. Smith, J. Etheridge, B.C. Muddle, Science 331 (2011), 1583 because absorption correction had not been included in the values used in that reference. ∆ρ are calculated directly from the quoted structure factors using the IAM of P.A. Doyle, P.S. Turner, Acta Cryst. A 24 (1968), 390.
B.W. Batterman, D.R. Chipman, J.J. DeMarco, Phys. Rev. 122 (1961), 68.
-0.044 0.029 -0.054 0.034 0.059 0.010 8.7 0.14 8.32 0.14 7.16 0.13
Powder X-ray diffraction (Mo radiation). ∆ρ are calculated directly from the quoted structure factors using the IAM of P.A. Doyle, P.S. Turner, Acta Cryst. A 24 (1968), 390.
J.J. DeMarco, Philos. Mag. 15 (1967), 483.
0.062 0.014 -0.023 0.015 0.050 0.005 8.69 0.04 8.21 0.07 7.25 0.06
Single Crystal X-ray Diffraction (Mo radiation). ∆ρ are calculated directly from the quoted structure factors using the IAM of P.A. Doyle, P.S. Turner, Acta Cryst. A 24 (1968), 390.
M. Järvinen, M. Merisalo, O. Inkinen, Phys. Rev. 178 (1969), 1108.
-0.007 0.020 -0.095 0.022 0.066 0.007 8.74 0.06 8.24 0.1 7.17 0.09
Powder X-ray diffraction (Mo radiation). ∆ρ are calculated directly from the quoted structure factors using the IAM of P.A. Doyle, P.S. Turner, Acta Cryst. A 24 (1968), 390.
P.M. Raccah, V.E. Henrich, Phys. Rev. 184 (1969), 607.
0.015 0.013 0.000 0.015 0.024 0.004 8.8 0.06 8.38 0.06 7.27 0.06
Powder X-ray diffraction (Cu radiation). ∆ρ are calculated directly from the quoted structure factors using the IAM of P.A. Doyle, P.S. Turner, Acta Cryst. A 24 (1968), 390.
R.W. James, G.W. Brindley, R.G. Wood, Proc. Roy. Soc. A 125 (1929), 401.
G.W. Brindley, Philos. Mag. 21 (1936), 778.
N.V. Ageev, D.L. Ageeva, Izv. Akad. Nauk SSSR, Otd. Khim. Nauk 1 (1948), 17.
Experiments (NB All values (where necessary) converted to T=0K using a unified value of B =0.82 Å2 for room temp.)

71
Source
∆ρ tetrahedral interstice
(e-/Å3)
error ∆ρ tetrahedral
∆ρ octahedral interstice
(e-/Å3)
error ∆ρ octahedral
∆ρ bridge
bond (e-
/Å3)
error ∆ρ bridge
F 111 (e-
/atom)
error F 111 (if no error
given, error taken as ±1% -
the mean error of all the X-ray
meas.)
F 002 (e-
/atom)
error F 002 (if no error
given, error taken as ±1% -
the mean error of all the X-ray
meas.)
F 220 (e-
/atom)
error F 220 (if no error
given, error taken as ±1% -
the mean error of all the X-ray
meas.)
Notes
O. Inkinen, A. Pesonen, T. Paakkari, Ann. Acad. Sci. Fenn. A 6 (1970), 344.
0.026 0.018 0.013 0.020 0.018 0.006 8.81 0.07 8.39 0.08 7.29 0.08
X-ray diffraction (powder pressed in a way so as to reduce all orientaiotnal texture effects) - values taken from R.J. Temkin, V.E. Henrich, P.M. Raccah, Sol. St. Commun. 13 (1973), 811. ∆ρ are calculated directly from the quoted structure factors using the IAM of P.A. Doyle, P.S. Turner, Acta Cryst. A 24 (1968), 390.
E. Rantavuori, V.-P. Tanninen, Phys. Scr. 15 (1977), 273.
0.033 0.009 -0.062 0.010 0.045 0.003 8.8 0.04 8.27 0.04 7.24 0.04
Powder X-ray diffraction at T=80K (Cu radiation). ∆ρ are calculated directly from the quoted structure factors using the IAM of P.A. Doyle, P.S. Turner, Acta Cryst. A 24 (1968), 390.
T. Takama, K. Kobayashi, S. Sato, Trans. Jap. Inst. Metals 23 (1982), 153.
0.029 0.008 0.068 0.009 -0.015 0.003 8.9 0.03 8.52 0.05 7.36 0.03
Pendellösung white radiation X-ray diffraction (single crystal). Values taken from A.G. Fox, M.A. Tabbernor, R.M. Fisher, J. Phys. Chem. Solids 51 (1990), 1323. ∆ρ are calculated directly from the quoted structure factors using the IAM of P.A. Doyle, P.S. Turner, Acta Cryst. A 24 (1968), 390.
D. Watanabe, R. Uyeda, A. Fukuhara, Acta Cryst. A 24 (1968), 580. & T. Arii, R. Uyeda, O. Terasaki, D. Watanabe, Acta Cryst. A 29 (1973), 295.
0.019 0.015 -0.045 0.018 0.028 0.005 8.87 0.08 8.36 0.05 7.27 0.07
Critical Voltage method (Electron diffraction). Cannot measure higher orders than V 200 so
F 220 is taken from the average of preceeding X-ray measurements. ∆ρ are calculated directly from the quoted structure factors using the IAM of P.A. Doyle, P.S. Turner, Acta Cryst. A 24 (1968), 390.
A.G. Fox, R.M. Fisher, Aust. J. Phys. 41 (1988), 461.
0.011 0.014 -0.016 0.015 0.023 0.005 8.84 0.04 8.39 0.02 7.27 0.07
Critical Voltage method (Electron diffraction). Cannot measure higher orders than V 200 so
F 220 is taken from the average of preceeding X-ray measurements. ∆ρ are calculated directly from the quoted structure factors using the IAM of P.A. Doyle, P.S. Turner, Acta Cryst. A 24 (1968), 390.
P.N.H. Nakashima, A.E. Smith, J. Etheridge, B.C. Muddle, Science 331 (2011), 1583.
0.048 0.006 -0.009 0.006 0.016 0.002 8.87 0.01 8.37 0.01 7.31 0.03
Quantitative Convergent-Beam Electron Diffraction (QCBED) (Bloch-wave formalism, 50, 120, 200, 300kV). ∆ρ are calculated directly from the quoted structure factors using the IAM of P.A. Doyle, P.S. Turner, Acta Cryst. A 24 (1968), 390.
F.J. Arlinghaus, Phys. Rev. 153 (1967), 743
0.018 0.000 0.016 0.000 -0.009 0.000 8.97 0 8.51 0 7.34 0
Band structure calculation based on augmented plane wave method. ∆ρ are calculated directly from the quoted structure factors using the IAM of P.A. Doyle, P.S. Turner, Acta Cryst. A 24 (1968), 390.
P. Ascarelli, P.M. Raccah, Phys. Lett. A 31 (1970), 549.
0.062 0.000 0.026 0.000 0.016 0.000 8.8 0 8.35 0 7.32 0
Developed their own pseudopotential model (early DFT). ∆ρ are calculated directly from the quoted structure factors using the IAM of P.A. Doyle, P.S. Turner, Acta Cryst. A 24 (1968), 390.
M. Cooper, B. Williams, Philos. Mag. 26 (1972), 1441.
0.062 0.000 0.109 0.000 -0.023 0.000 8.87 0 8.51 0 7.4 0
Early DFT based on a set of local orbital (lo) wavefunctions. ∆ρ are calculated directly from the quoted structure factors using the IAM of P.A. Doyle, P.S. Turner, Acta Cryst. A 24 (1968), 390.
J.P. Walter, C.Y. Fong, M.L. Cohen, Solid St. Commun. 12 (1973), 303.
0.121 0.000 0.065 0.000 0.001 0.000 8.81 0 8.33 0 7.39 0
Early DFT based on an Ashcroft pseudopotential. ∆ρ are calculated directly from the quoted structure factors using the IAM of P.A. Doyle, P.S. Turner, Acta Cryst. A 24 (1968), 390.
0.029 0.000 0.005 0.000 0.015 0.000 8.85 0 8.4 0 7.3 0
DFT with APW and Kohn-Sham (2/3 Slater exchange) approach. ∆ρ are calculated directly from the quoted structure factors using the IAM of P.A. Doyle, P.S. Turner, Acta Cryst. A 24 (1968), 390.
0.059 0.000 0.049 0.000 0.000 0.000 8.85 0 8.42 0 7.35 0
Hartree-Fock approach with approximations for core and valence electrons. ∆ρ are calculated directly from the quoted structure factors using the IAM of P.A. Doyle, P.S. Turner, Acta Cryst. A 24 (1968), 390.
R.A. Tawil, Phys. Rev. B 11 (1975), 4891.
-0.004 0.000 -0.104 0.000 0.062 0.000 8.78 0 8.25 0 7.18 0
Tight binding approximation. ∆ρ are calculated directly from the quoted structure factors using the IAM of P.A. Doyle, P.S. Turner, Acta Cryst. A 24 (1968), 390.
Theoretical Calculations (at T=0K by default)
F. Perrot, Solid St. Commun. 14 (1974), 1041.

72
Source
∆ρ tetrahedral interstice
(e-/Å3)
error ∆ρ tetrahedral
∆ρ octahedral interstice
(e-/Å3)
error ∆ρ octahedral
∆ρ bridge
bond (e-
/Å3)
error ∆ρ bridge
F 111 (e-
/atom)
error F 111 (if no error
given, error taken as ±1% -
the mean error of all the X-ray
meas.)
F 002 (e-
/atom)
error F 002 (if no error
given, error taken as ±1% -
the mean error of all the X-ray
meas.)
F 220 (e-
/atom)
error F 220 (if no error
given, error taken as ±1% -
the mean error of all the X-ray
meas.)
Notes
B. Dawson, Studies of Atomic Charge Density by X-ray and Neutron Diffraction - A Perspective, in Advances in Structure Research by Diffraction Methods, W. Hoppe, R. Mason, Eds. (Pergamon Press, Oxford, New York, Toronto, Sydney, 1975), 221.
0.051 0.000 0.076 0.000 -0.007 0.000 8.84 0 8.46 0 7.36 0
Hartree-Fock approach with 4S excitation - presumably to simulate the bonding electrons. ∆ρ are calculated directly from the quoted structure factors using the IAM of P.A. Doyle, P.S. Turner, Acta Cryst. A 24 (1968), 390.
P.J. Bunyan, J.A. Nelson, J. Phys. F: Metal Phys. 7 (1977), 2323.
0.004 0.000 -0.004 0.000 0.016 0.000 8.86 0 8.43 0 7.28 0
Band structure eigenfunctions with an improved Heine-Abarenkov potential with depletion hole. ∆ρ are calculated directly from the quoted structure factors using the IAM of P.A. Doyle, P.S. Turner, Acta Cryst. A 24 (1968), 390.
J. Hafner, Solid St. Commun. 27 (1978), 263.
0.033 0.000 -0.043 0.000 0.035 0.000 8.82 0 8.31 0 7.26 0
OPW-pseudopotential approach. ∆ρ are calculated directly from the quoted structure factors using the IAM of P.A. Doyle, P.S. Turner, Acta Cryst. A 24 (1968), 390.
S. Chakraborty, A. Manna, A.K. Ghosh, Phys. Stat. Sol. B 129 (1985), 211.
-0.040 0.000 -0.150 0.000 0.040 0.000 9.01 0 8.39 0 7.2 0
Lowdin alpha expansion method. ∆ρ are calculated directly from the quoted structure factors using the IAM of P.A. Doyle, P.S. Turner, Acta Cryst. A 24 (1968), 390.
T.T. Rantala, J. Phys. F: Metal Phys. 17 (1987), 877.
0.022 0.000 0.007 0.000 0.012 0.000 8.86 0 8.42 0 7.3 0
An atom in jellium model. ∆ρ are calculated directly from the quoted structure factors using the IAM of P.A. Doyle, P.S. Turner, Acta Cryst. A 24 (1968), 390.
P.N.H. Nakashima, A.E. Smith, J. Etheridge, B.C. Muddle, Science 331 (2011), 1583.
0.037 0.000 -0.012 0.000 0.017 0.000 8.87 0 8.38 0 7.3 0
FP-LAPW +lo +ls DFT calculation using WIEN2K [P. Blaha, K. Schwarz, P. Sorantin, S.B. Trickey, Comput. Phys. Commun. 59 (1990), 399.]. ∆ρ are calculated directly from the quoted structure factors using the IAM of P.A. Doyle, P.S. Turner, Acta Cryst. A 24 (1968), 390.
P.A. Doyle, P.S. Turner, Acta Cryst. A 24 (1968), 390.
0.000 0.000 0.000 0.000 0.000 0.000 8.95 0 8.5 0 7.31 0Relativistic Hartree-Fock calculations of independent neutral atoms taken as the standard model for unbonded atoms.
Independent Atom Model (the most widely accepted - IUCr)
73
References
(1) Momma, K.; Izumi, F. VESTA 3 for three-dimensional visualization of crystal, volumetric and morphology data. J. Appl. Cryst. 2011, 44, 1272-1276.
(2) Gray, H.B. Chemical Bonds: An Introduction to Atomic and Molecular Structure. University Science Books: Sausalito, California, 1994.
(3) Cowley, J.M.; Moodie, A.F. The scattering of electrons by atoms and crystals. 1. A new theoretical approach. Acta Cryst. 1957, 10 (10), 609-619.
(4) Blake, F.C. Precision X-ray measurements by the powder method. Phys. Rev. 1925, 26 (1), 60-70. (5) von Göler, F.H.; Sachs, G. Die Veredelung einer Aluminiumlegierung im Rontgenbild.
Metallwirtschaft 1929, 8, 671-680. (6) Gayler, M.L.V.; Preston, G.D. The age-hardening of some aluminium alloys. J. Inst. Metals 1929,
41, 193-241. (7) Wassermann, G. Contribution to the problem of molecular or atomic solid solution of a metal
compound in the base metal. Z. Metallkd. 1930, 22, 158-160. (8) Nishiyama, Z. On the corrections for Debye-Scherrer X-ray photographs. Sci. Rep. Tohoku Imp.
Univ. 1932, 21, 364-384. (9) Owen, E.A.; Iball, J. Precision measurements of the crystal parameters of some of the elements.
Philos. Mag. 1932, 13 (87), 1020-1028. (10) Owen, E.A.; Yates, E.L. Precision measurements of crystal parameters. Philos. Mag. 1933, 15 (98),
472-488. (11) Stenzel, W.; Weerts, J. Die Anlaßwirkungen in abgeschreckten Kupfer-Aluminium Legierungen.
Metallwirtschaft 1933, 12, 353-356. (12) Phillips, A.; Brick, R.M. Grain boundary effects as a factor in heterogeneous equilibrium of alloy
systems. J. Frankl. Inst. 1933, 215, 557-577. (13) Neuburger, M.C. Lattice constants 1933. Z. Kristall. 1933, 86 (5/6), 395-422. (14) Jette, E.R.; Foote, F. Precision determination of lattice constants. J. Chem. Phys. 1935, 3 (10), 605-
616. (15) Ieviņš, A.; Straumanis, M. The grid constants of pure aluminium. Z. Phys. Chem. B-Chem. Elem.
Aufbau. Mater. 1936, 33 (4), 265-274. (16) Ieviņš, A.; Straumanis, M. Addition to the work "The lattice parameter of the purest aluminium".
Z. Phys. Chem. B-Chem. Elem. Aufbau. Mater. 1936, 34 (5), 402-403. (17) Owen, E.A.; Yates, E.L. X ray measurement of the thermal expansion of pure nickel. Philos. Mag.
1936, 21 (142), 809-819. (18) Taylor, C.S.; Willey, L.A.; Smith, D.W.; Edwards, J.D. The properties of high purity aluminium.
Metals and Alloys 1938, 9, 189-192. (19) van Bergen, H. Precision measuring of lattice constants with a compensation method II. Ann. d.
Phys. 1941, 39 (8), 553-572. (20) Wilson, A.J.C. The thermal expansion of aluminium from 0° to 650°C. Proc. Phys. Soc. 1941, 53,
235-244. (21) Lu, S.S.; Chang, Y.L. The accurate evaluation of lattice spacings from back-reflection powder
photographs. Proc. Phys. Soc. 1941, 53, 517-528. (22) Wilson, A.J.C. The thermal expansion of aluminium: Further experiments. Proc. Phys. Soc. 1942,
54, 487-491. (23) Hume-Rothery, W.; Strawbridge, D.J. A general purpose Debye-Scherrer camera and its
application to work at low temperatures. J. Sci. Instrum. 1947, 24 (4), 89-91. (24) Axon, H.J.; Hume-Rothery, W. The lattice spacings of solid solutions of different elements in
aluminium. Proc. R. Soc. Lond. A 1948, 193 (1032), 1-24. (25) Ellwood, E.C.; Silcock, J.M. The lattice spacings of the solid solution of copper in aluminium. J. Inst.
Metals 1948, 74 (10), 457-467. (26) Owen, E.A.; Liu, Y.H.; Morris, D.P. Behaviour of stressed aluminium at room temperature. Philos.
74
Mag. 1948, 39, 831-845. (27) Hardy, H.K.; Heal, T.J. Correspondence on paper by Mr. E. C. Ellwood and Miss Jeanne M. Silcock:
"The lattice spacings of the solid soultion of copper in aluminium". J. Inst. Metals 1948, 74, 721-724.
(28) Hume-Rothery, W.; Boultbee, T.H. The coefficients of expansion of some solid solutions in aluminium. Philos. Mag. 1949, 40 (300), 71-80.
(29) Straumanis, M.E. The precision determination of lattice constants by the powder and rotating crystal methods and applications. J. Appl. Phys. 1949, 20 (8), 726-734.
(30) Kochanovska, A. Investigation of thermal dilatation of cubic metals. Physica 1949, 15 (1-2), 191-196.
(31) Dorn, J.E.; Pietrokowsky, P.; Tietz, T.E. The effect of alloying elements on the plastic properties of aluminum alloys. J. Metals 1950, 2 (7), 933-943.
(32) Poole, D.M.; Axon, H.J. Lattice spacing relationships in aluminium-rich solid solutions of the aluminium magnesium and aluminium magnesium copper systems. J. Inst. Metals 1952, 80 (11), 599-604.
(33) Hill, R.B.; Axon, H.J. Title Unavailable. Research 1953, 6, 238-238. (34) Swanson, H.E.; Tatge, E. Volume I. Standard X-ray Diffraction Powder Patterns. Nat. Bur. Stand.
Cir. 1953, 539, 1-95. (35) Smakula, A.; Kalnajs, J. Precision determination of lattice constants with a geiger-counter X-ray
diffractometer. Phys. Rev. 1955, 99 (6), 1737-1743. (36) Smakula, A.; Kalnajs, J.; Sils, V. Densities and imperfections of single crystals. Phys. Rev. 1955, 99
(6), 1747-1750. (37) Figgins, B.F.; Jones, G.O.; Riley, D.P. The thermal expansion of aluminium at low temperatures as
measured by an X-ray diffraction method. Philos. Mag. 1956, 1 (8), 747-758. (38) Zubenko, V.V.; Umansky, M.M. X-ray measurement of coefficients of thermal expansion of
polycrystalline materials in the range -50 to +100°C. Soviet Phys. - Cryst. 1956, 1 (4), 346-349. (39) Pearson, W.B. A Handbook of Lattice Spacings and Structures of Metals and Alloys. Pergamon
Press: New York, 1958. (40) Feder, R.; Nowick, A.S. Use of thermal expansion measurements to detect lattice vacancies near
the melting point of pure lead and aluminum. Phys. Rev. 1958, 109 (6), 1959-1963. (41) Straumanis, M.E. Absorption correction in precision determination of lattice parameters. J. Appl.
Phys. 1959, 30 (12), 1965-1969. (42) Nenno, S.; Kauffman, J.W. Detection and determination of equilibrium vacancy concentrations in
aluminum. J. Phys. Soc. Jpn. 1960, 15 (2), 220-226. (43) Straumanis, M.E.; Cheng, C.H. Lattice constants of hard aluminium wires. J. Inst. Metals 1960, 88
(6), 287-288. (44) Straumanis, M.E.; Ejima, T. Soundness of the lattice of zone-refined aluminum. J. Chem. Phys.
1960, 32 (2), 629-630. (45) Simmons, R.O.; Balluffi, R.W. Measurements of equilibrium vacancy concentrations in aluminum.
Phys. Rev. 1960, 117 (1), 52-61. (46) Otte, H.M. Lattice parameter determinations with an X-ray spectrogoniometer by Debye-Scherrer
method and effect of specimen condition. J. Appl. Phys. 1961, 32 (8), 1536-1546. (47) Cooper, A.S. Precise lattice constants of germanium, aluminum, gallium arsenide, uranium,
sulphur, quartz and sapphire. Acta Cryst. 1962, 15 (JUN), 578-582. (48) Simerska, M. Lattice spacings of equilibrium solid solutions of silver in aluminium. Czech. J. Phys.
1962, 12 (1), 54-59. (49) Otte, H.M.; Montague, W.G.; Welch, D.O. X-ray diffractometer determination of thermal
expansion coefficient of aluminum near room temperature. J. Appl. Phys. 1963, 34 (10), 3149-3150.
(50) Delf, B.W. Practical determination of lattice parameters using centroid method. Brit. J. Appl. Phys. 1963, 14 (6), 345-350.
75
(51) Batchelder, D.N.; Simmons, R.O. X-ray lattice constants of crystals by a rotating-camera method - Al, Ar, Au, CaF2, Cu, Ge, Ne, Si. J. Appl. Phys. 1965, 36 (9), 2864-2868.
(52) Cornish, A.J.; Burke, J. A high temperature attachment for an X-ray diffractometer for precision lattice parameter measurements. J. Sci. Instrum. 1965, 42 (4), 212-218.
(53) King, D.; Cornish, A.J.; Burke, J. Technique for measuring vacancy concentrations in metals at melting point. J. Appl. Phys. 1966, 37 (13), 4717-4722.
(54) Kiendl, H.; Witt, W. Prazisionsbestimmungen von Gitterkonstanten mit Elektroneninterferenzen an einkristallinem Silizium Germanium und Aluminium und vergleich mit Röntgenwerten. Phys. Lett. 1966, 22 (1), 33-34.
(55) Witt, W. Absolute Prazisionsbestimmung von Gitterkonstanten an Germanium und Aluminium Einkristallen mit Elektroneninterferenzen. Z. Naturforsch. A 1967, 22 (1), 92-95.
(56) Pearson, W.B. Handbook of Lattice Spacings and Structures of Metals 1st Ed. Pergamon Press: Oxford, Edinburgh, New York, Toronto, Sydney, Paris, Braunschweig, 1967.
(57) Adam-Vigneron, M.-Y.; Jordi, F.; Roulet, H. Novel methods for obtaining divergent X-ray diffraction diagrams and application in determining reticular constant of aluminum. Comptes Rendus Heb. Acad. Sc. Paris 1969, 269 (18), 912-915.
(58) Woodard, C.L.; Straumanis, M.E. Precision determination of lattice parameters at low temperatures without use of liquid gases. J. Appl. Cryst. 1971, 4 (JUN 1), 201-204.
(59) Straumanis, M.E.; Woodard, C.L. Lattice parameters and thermal expansion coefficients of Al, Ag and Mo at low temperatures - comparison with dilatometric data. Acta Cryst. A 1971, 27 (NOV 1), 549-551.
(60) von Guerard, B.; Peisl, H.; Zitzmann, R. Equilibrium vacancy concentration measurements on aluminum. Appl. Phys. 1974, 3 (1), 37-43.
(61) Roberge, R. Lattice-parameter of niobium between 4.2 and 300 K. J. Less-Common Metals 1975, 40 (1), 161-164.
(62) Bichile, G.K.; Kulkarni, R.G. Design and fabrication of a 10 cm diameter back-reflection focusing camera. J. Appl. Cryst. 1977, 10 (DEC), 441-443.
(63) Bandyopadhyay, J.; Gupta, K.P. Low-temperature lattice-parameters of Al and Al-Zn alloys and Gruneisen parameter of Al. Cryogenics 1978, 18 (1), 54-55.
(64) Seshadri, S.K.; Downie, D.B. High-temperature lattice parameters of copper-aluminum alloys. Met. Sci. 1979, 13, 696-698.
(65) Giri, A.K.; Mitra, G.B. Extrapolated values of lattice constants of some cubic metals at absolute zero. J. Phys. D: Appl. Phys. 1985, 18 (7), L75-L78.
(66) Villars, P. Pearson's handbook of crystallographic data for intermetallic phases 1 2nd Ed. ASM International: Materials Park, Ohio, 1996, 648.
(67) Johnsson, M.; Eriksson, L. Thermal expansion of Al and TiB2 in the temperature range 300 to 900 K and calculated lattice fit at the melting temperature for Al. Z. Metallkd. 1998, 89 (7), 478-480.
(68) Langelaan, G.; Saimoto, S. Thermal expansion measurement of pure aluminum using a very low thermal expansion heating stage for X-ray diffraction experiments. Rev. Sci. Instrum. 1999, 70 (8), 3413-3417.
(69) Battaglia, S.; Mango, F. Determination of the thermal expansion coefficient of small samples and powders by X-ray diffractometry up to about 300 degrees C: Some results on metals and rocks. Mater. Sci. Forum 2001, 378-381, 92-97.
(70) Lu, X.-G.; Selleby, M.; Sundman, B. Assessments of molar volume and thermal expansion for selected bcc, fcc and hcp metallic elements. CALPHAD 2005, 29 (1), 68-89.
(71) Potter, J.; Parker, J.E.; Lennie, A.R.; Thompson, S.P.; Tang, C.C. Low-temperature Debye-Scherrer powder diffraction on Beamline I11 at Diamond. J. Appl. Cryst. 2013, 46, 826-828.
(72) Bragg, W.L.; Wood, E.A. The conversion factor for kX units to angstrom units. J. Am. Chem. Soc. 1947, 69 (11), 2919-2919.
(73) Cohen, E.R.; Dumond, J.W.M. Our knowledge of fundamental constants of physics and chemistry in 1965. Rev. Mod. Phys. 1965, 37 (4), 537-594.
76
(74) Wang, K.; Reeber, R.R. A model for evaluating and predicting high-temperature thermal expansion. J. Mater. Res. 1996, 11 (7), 1800-1803.
(75) Wang, K.; Reeber, R.R. The perfect crystal, thermal vacancies and the thermal expansion coefficient of aluminium. Philos. Mag. A 2000, 80 (7), 1629-1643.
(76) Henning, F. The expansion of solid bodies at lower temperatures. Ann. d. Phys. 1907, 22 (4), 631-639.
(77) Hidnert, P. Thermal expansion of aluminum and various important aluminum alloys. Sci. Pap. Bur. Stand. (U.S.) 1924, 19 (S497), 697-731.
(78) Buffington, R.M.; Latimer, W.M. The measurement of coefficients of expansion at low temperatures - Some thermodynamic applications of expansion data. J. Am. Chem. Soc. 1926, 48, 2305-2319.
(79) Staatliches Materialprüfungsamt. Title unavailable. Z. Metallkd. 1928, 20, 14-. (80) Ebert, H. Expansion measurements at low temperatures. Z. Phys. 1928, 47 (9-10), 712-722. (81) Uffelmann, F.L. The expansion of metals at high temperatures. Philos. Mag. 1930, 10 (65), 633-
659. (82) Shinoda, G. X-ray investigations of the thermal expansion of solids. Mem. Coll. Sci. Kyoto A 1933,
16, 193-201. (83) Bollenrath, F. A new optical dilatometer. Z. Metallkd. 1934, 26, 62-65. (84) Straumanis, M.; Ieviņš, A. Regulation of the circumference coefficient according to the Pulver and
the forming crystal method. Z. Anorg. Allg. Chem. 1938, 238 (2/3), 175-188. (85) Esser, H.; Eusterbrock, H. Untersuchung der Wärmeausdehnung von einigen Metallen und
Legierunger mit einem verbesserten Dilatometer. (Experiments on heat expansion of several metals and alloys with an improved dilatometer.). Arch. Eisenhüttenw. 1941, 14, 341-355.
(86) Nix, F.C.; MacNair, D. The thermal expansion of pure metals copper, gold, aluminum, nickel, and iron. Phys. Rev. 1941, 60 (8), 597-605.
(87) Snoek, J.L. Density variations in aluminium. Philos. Mag. 1950, 41 (322), 1188-1192. (88) Smakula, A.; Sils, V. Precision density determination of large single crystals by hydrostatic
weighing. Phys. Rev. 1955, 99 (6), 1744-1746. (89) Bijl, D.; Pullan, H. A new method for measuring the thermal expansion of solids at low
temperatures - The thermal expansion of copper and aluminium and the gruneisen rule. Physica 1955, 21 (4), 285-298.
(90) Huzan, E.; Abbiss, C.P.; Jones, G.O. Thermal expansion of aluminium at low temperatures. Philos. Mag. 1961, 6 (62), 277-285.
(91) Fraser, D.B.; Hollis Hallett, A.C. Coefficient of thermal expansion of various cubic metals below 100 degrees K. Can. J. Phys. 1965, 43 (2), 193-219.
(92) Bianchi, G.; Mallejac, D.; Janot, C.; Champier, G. Determination experimentale de l’energie et de l’entropie de formation des lacunes en equilibre thermique dans l'aluminium. Comptes Rendus Heb. Acad. Sci. Paris B 1966, 263 (25), 1404-1407.
(93) Pathak, P.D.; Vasavada, N.G. Thermal expansion and law of corresponding states. J. Phys. C: Sol. St. Phys. 1970, 3 (2), L44-L48.
(94) Awad, F.G.; Gugan, D. Thermal expansion of Cu, Al, KCl, and KI between 10 and 80 K. Cryogenics 1971, 11 (5), 414-415.
(95) Collins, J.G.; White, G.K.; Swenson, C.A. Thermal-expansion of aluminum below 35 K. J. Low Temp. Phys. 1973, 10 (1-2), 69-77.
(96) Kroeger, F.R.; Swenson, C.A. Absolute linear thermal expansion measurements on copper and aluminum from 5 to 320 K. J. Appl. Phys. 1977, 48 (3), 853-864.
(97) Kiritani, M.; Yoshida, S. A new type aggregation of quenched-in vacancies in aluminum. J. Phys. Soc. Jpn. 1963, 18 (6), 915-915.
(98) Kiritani, M.; Shimomura, Y.; Yoshida, S. Shape of voids in quenched aluminum. J. Phys. Soc. Jpn. 1964, 19 (9), 1624-1631.
(99) Kiritani, M.; Yoshida, S. An evidence of voids in quenched aluminum. Jap. J. Appl. Phys. 1965, 4

77
(2), 148-149. (100) Kiritani, M.; Sato, A.; Yoshida, S. Nucleation and growth of voids in quenched aluminum. J. Phys.
Soc. Jpn. 1966, 21 (11), 2291-2299. (101) Epperson, J.E.; Hendricks, R.W.; Farrell, K. Studies of voids in neutron-irradiated aluminum single
crystals. 1. Small-angle X-ray-scattering and transmission electron microscopy. Philos. Mag. 1974, 30 (4), 803-817.
(102) Nakajima, H. The discovery and acceptance of the Kirkendall effect: The result of a short research career. JOM-J. Miner. Met. Mater. Soc. 1997, 49 (6), 15-19.
(103) Kassner, M.E.; Hayes, T.A. Creep cavitation in metals. Int. J. Plast. 2003, 19 (10), 1715-1748. (104) Bourgeois, L.; Bougaran, G.; Nie, J.F.; Muddle, B.C. Voids formed from solidifying tin particles in
solid aluminium. Philos. Mag. Lett. 2010, 90 (11), 819-829. (105) Nutt, S.R.; Needleman, A. Void nucleation at fiber ends in Al-SiC composites. Scripta Metall. 1987,
21 (5), 705-710. (106) Thomason, P.F. Ductile fracture by the growth and coalescence of microvoids of nonuniform size
and spacing. Acta Metall. Mater. 1993, 41 (7), 2127-2134. (107) Gungor, M.R.; Maroudas, D. Theoretical analysis of electromigration-induced failure of metallic
thin films due to transgranular void propagation. J. Appl. Phys. 1999, 85 (4), 2233-2246. (108) Li, B.; Sullivan, T.D.; Lee, T.C.; Badami, D. Reliability challenges for copper interconnects.
Microelectron. Reliab. 2004, 44 (3), 365-380. (109) Morgeneyer, T.F.; Starink, M.J.; Sinclair, I. Evolution of voids during ductile crack propagation in
an aluminium alloy sheet toughness test studied by synchrotron radiation computed tomography. Acta Mater. 2008, 56 (8), 1671-1679.
(110) Pande, C.S. Fundamentals of fatigue crack initiation and propagation: Some thoughts. In Fatigue of Materials II: Advances and Emergences in Understanding; Srivatsan, T.S., Ashraf Imam, M., Srinivasan, R., Eds.; John Wiley and Sons Inc.: 2013; 3-15.
(111) Coyle, S.; Netti, M.C.; Baumberg, J.J.; Ghanem, M.A.; Birkin, P.R.; Bartlett, P.N.; Whittaker, D.M. Confined plasmons in metallic nanocavities. Phys. Rev. Lett. 2001, 87 (17), 176801
(112) Cole, R.M.; Baumberg, J.J.; Garcia de Abajo, F.J.; Mahajan, S.; Abdelsalam, M.; Bartlett, P.N. Understanding plasmons in nanoscale voids. Nano Lett. 2007, 7 (7), 2094-2100.
(113) Sigle, D.O.; Perkins, E.; Baumberg, J.J.; Mahajan, S. Reproducible Deep-UV SERRS on Aluminum Nanovoids. J. Phys. Chem. Lett. 2013, 4 (9), 1449-1452.
(114) Volin, T.E.; Balluffi, R.W. Annealing kinetics of voids and self-diffusion coefficient in aluminum. Phys. Stat. Sol. 1968, 25 (1), 163-173.
(115) Westmacott, K.H.; Smallman, R.E.; Dobson, P.S. The annealing of voids in quenched aluminium and a determination of the surface energy. Met. Sci. J. 1968, 2 (1), 177-181.
(116) Woo, C.H.; Singh, B.N.; Semenov, A.A. Recent advances in the understanding of damage production and its consequences on void swelling, irradiation creep and growth. J. Nucl. Mater. 1996, 239 (1-3), 7-23.
(117) Smallman, R.E.; Bishop, R.J. Modern Physical Metallurgy and Materials Engineering 6th Ed. Butterworth - Heinemann: Oxford, London, 1999.
(118) Ono, K.; Kino, T. Thermal generation of vacancies from voids in aluminium. Philos. Mag. A 2001, 81 (11), 2565-2575.
(119) Marian, J.; Knap, J.; Ortiz, M. Nanovoid cavitation by dislocation emission in aluminum. Phys. Rev. Lett. 2004, 93 (16), 165503
(120) Marian, J.; Knap, J.; Ortiz, M. Nanovoid deformation in aluminum under simple shear. Acta Mater. 2005, 53 (10), 2893-2900.
(121) Kovacs, A.; Sadowski, J.; Kasama, T.; Domagala, J.; Mathieu, R.; Dietl, T.; Dunin-Borkowski, R.E. Voids and Mn-rich inclusions in a (Ga,Mn)As ferromagnetic semiconductor investigated by transmission electron microscopy. J. Appl. Phys. 2011, 109 (8), 083546
(122) Nguyen, L.D.; Warner, D.H. Improbability of void growth in aluminum via dislocation nucleation under typical laboratory conditions. Phys. Rev. Lett. 2012, 108 (3), 035501
78
(123) Zhang, Z.; Liu, T.; Smith, A.E.; Medhekar, N.V.; Nakashima, P.N.H.; Bourgeois, L. Mechanisms of void shrinkage in aluminium. J. Appl. Cryst. 2016, 49 (5), 1459-1470.
(124) Debye, P. Interference of X-rays and heat movement. Ann. d. Phys. 1913, 43 (1), 49-95. (125) Waller, I. On the question of the influence of thermal motion on the interference of X-rays. Z.
Phys. 1923, 17, 398-408. (126) James, R.W.; Brindley, G.W.; Wood, R.G. A quantitative study of the reflexion of X-rays from
crystals of aluminium. Proc. R. Soc. Lond. A 1929, 125 (798), 401-419. (127) Brindley, G.W. The atomic scattering factors of aluminium nickel, and copper for Cu K-alpha
radiation and their relation to the theory of X-ray dispersion. Philos. Mag. 1936, 21 (142), 778-790.
(128) Owen, E.A.; Williams, R.W. The effect of temperature on the intensity of X-ray reflexion. Proc. R. Soc. Lond. A 1947, 188 (1015), 509-521.
(129) Ageev, N.V.; Ageeva, D.L. Title unavailable. Izv. Akad. Nauk SSSR, Otd. Khim. Nauk 1948, 1, 17-. (130) Bensch, H.; Witte, H.; Wölfel, E. Röntgenographische Bestimmung der Elektronenverteilung in
Kristallen IV. Die Elektonenverteilung in Aluminum. Z. Phys. Chem. 1955, 4, 65-88. (131) Walker, C.B. X-ray study of lattice vibrations in aluminum. Phys. Rev. 1956, 103 (3), 547-557. (132) Chipman, D.R. Temperature dependence of the Debye temperatures of aluminum, lead, and beta-
brass by an X-ray method. J. Appl. Phys. 1960, 31 (11), 2012-2015. (133) Batterman, B.; Chipman, D.R.; De Marco, J.J. Absolute measurement of atomic scattering factors
of iron, copper, and aluminum. Phys. Rev. 1961, 122 (1), 68-74. (134) Flinn, P.A.; McManus, G.M. Lattice vibrations and Debye temperatures of aluminum. Phys. Rev.
1963, 132 (6), 2458-2460. (135) DeWames, R.E.; Lehman, G.W.; Wolfram, T. Temperature dependence of Debye-Waller factor for
copper and aluminum. Phys. Rev. 1963, 131 (2), 528-529. (136) Mothersole, N.; Owen, E.A. Determination of characteristic temperatures of silver, aluminium and
lead by X-ray diffraction. Brit. J. Appl. Phys. 1965, 16 (8), 1113-1118. (137) Stedman, R.; Nilsson, G. Dispersion relations for phonons in aluminum at 80 and 300°K. Phys. Rev.
1966, 145 (2), 492-500. (138) Gilat, G.; Nicklow, R.M. Normal vibrations in aluminum and derived thermodynamic properties.
Phys. Rev. 1966, 143 (2), 487-494. (139) Nicklow, R.M.; Young, R.A. Lattice vibrations in aluminum and temperature dependence of X-ray
Bragg intensities. Phys. Rev. 1966, 152 (2), 591-596. (140) De Marco, J.J. Single crystal measurement of atomic scattering factor of aluminium. Philos. Mag.
1967, 15 (135), 483-495. (141) McDonald, D.L. Neutron diffraction study of Debye-Waller factor for aluminum. Acta Cryst. 1967,
23, 185-191. (142) Sirota, N.N. Survey of results in determination of X-ray intensities and structure factors for metals,
alloys and covalent compounds. Acta Cryst. A 1969, 25, 223-243. (143) Medlin, E.H.; Dingle, R.E.; Field, D.W. Wave functions of conduction electrons in crystalline
aluminium. Nature 1969, 224 (5219), 581-583. (144) Inkinen, O.; Pesonen, A.; Paakkari, T. Title unavailable. Ann. Acad. Sci. Fenn. A 1970, 6, 344. (145) Dingle, R.E.; Medlin, E.H. X-ray Debye temperature of aluminum. Acta Cryst. A 1972, 28 (JAN 1),
22-27. (146) Albanese, G.; Ghezzi, C. Anharmonic contributions to elastic and inelastic scattering of X-rays at
Bragg reflections in aluminum. Phys. Rev. B 1973, 8 (4), 1315-1323. (147) Prakash, J.; Hemkar, M.P. Debye-Waller factors of fcc metals. J. Phys. Soc. Jpn. 1973, 34 (6), 1583-
1587. (148) Killean, R.C.G. Investigation of Debye-Waller factor and Debye temperature of aluminum using
nearest neighbor central force pair interactions. J. Phys. F: Metal Phys. 1974, 4 (11), 1908-1915. (149) Rantavuori, E.; Tanninen, V.P. X-ray atomic scattering factors of aluminum powder at 80°K. Phys.
Scr. 1977, 15 (4), 273-275.

79
(150) Kharoo, H.L.; Gupta, O.P.; Hemkar, M.P. Debye-Waller factors of fcc metals by the modified angular force model. Z. Naturforsch. 1977, 32a, 570-576.
(151) Martin, C.J.; O'Connor, D.A. Anharmonic contributions to Bragg diffraction. 1. Copper and aluminum. Acta Cryst. A 1978, 34 (JUL), 500-505.
(152) Fox, A.G.; Fisher, R.M. A summary of low-angle X-ray atomic scattering factors measured by the critical voltage effect in high-energy electron diffraction. Aust. J. Phys. 1988, 41 (3), 461-468.
(153) Shukla, R.C.; Plint, C.A. Anharmonic contributions to the Debye-Waller factor - calculation and application to aluminum. Phys. Rev. B 1989, 40 (15), 10337-10344.
(154) Fox, A.G.; Tabbernor, M.A.; Fisher, R.M. Low-angle atomic scattering factors and charge density of aluminum. J. Phys. Chem. Solids 1990, 51 (11), 1323-1328.
(155) Sternemann, C.; Buslaps, T.; Shukla, A.; Suortti, P.; Döring, G.; Schülke, W. Temperature influence on the valence Compton profiles of aluminum and lithium. Phys. Rev. B 2001, 63 (9), 094301.
(156) Maradudin, A.A.; Flinn, P.A. Anharmonic contributions to Debye-Waller factor. Phys. Rev. 1963, 129 (6), 2529-2547.
(157) Shukla, R.C.; Hübschle, H. Anharmonic contributions to the Debye-Waller factor of aluminum. Solid State Commun. 1989, 72 (11), 1135-1140.
(158) Peng, L.M.; Ren, G.; Dudarev, S.L.; Whelan, M.J. Debye-Waller factors and absorptive scattering factors of elemental crystals. Acta Cryst. A 1996, 52, 456-470.
(159) Gao, H.X.; Peng, L.M. Parameterization of the temperature dependence of the Debye-Waller factors. Acta Cryst. A 1999, 55, 926-932.
(160) Peng, L.-M.; Dudarev, S.L.; Whelan, M.J. High-Energy Electron Diffraction and Microscopy 1st Ed. Oxford University Press: New York, 2004; 454-469.
(161) Rao, P.V.S. Phonon dispersion-relations, effective interionic potential and liquid resistivity of Al. J. Phys. Chem. Solids 1974, 35 (6), 669-684.
(162) Shukla, R.C.; MacDonald, R.A. Thermal expansion of cubic crystals. High Temp. High Press. 1980, 12 (3), 291-296.
(163) Shukla, R.C.; Plint, C.A. Anharmonic effects in the specific heat of aluminum. Int. J. Thermophys. 1980, 1 (3), 299-315.
(164) Shukla, R.C.; Plint, C.A.; Ditmars, D.A. Aluminum. 2. Derivation of cvo from cp and comparison to cvo calculated from anharmonic models. Int. J. Thermophys. 1985, 6 (5), 517-532.
(165) Heiser, G.A.; Shukla, R.C.; Cowley, E.R. Average square atomic displacement - A comparison of the lattice dynamics, molecular dynamics, and Monte Carlo results. Phys. Rev. B 1986, 33 (4), 2158-2162.
(166) Shukla, R.C.; Hübschle, H. Atomic mean-square displacement of a solid - A Green function approach. Phys. Rev. B 1989, 40 (3), 1555-1559.
(167) Brindley, G.W.; Ridley, P. Atomic scattering factors of aluminium, potassium chloride and copper for X-rays. Proc. Phys. Soc. 1938, 50, 96-107.
(168) Roof, R.B. Experimental determination of atomic scattering factors. J. Appl. Phys. 1959, 30 (10), 1599-1603.
(169) Järvinen, M.; Merisalo, M.; Inkinen, O. Absolute measurement of atomic scattering factors of aluminum on powder in transmission. Phys. Rev. 1969, 178 (3), 1108-1110.
(170) Raccah, P.M.; Henrich, V.E. Absolute experimental X-ray form factor of aluminum. Phys. Rev. 1969, 184 (3), 607-613.
(171) Temkin, R.J.; Henrich, V.E.; Raccah, P.M. Experimental and theoretical charge density of aluminum. Solid State Commun. 1973, 13 (7), 811-814.
(172) Takama, T.; Kobayashi, K.; Sato, S. Determination of the atomic scattering factors of aluminum by the pendellösung beat measurement using white radiation. Trans. Jap. Inst. Metals 1982, 23 (4), 153-160.
(173) Watanabe, D.; Uyeda, R.; Fukuhara, A. Determination of the atom form factor by high-voltage electron diffraction. Acta Cryst. A. 1969, 25 (1), 138-140.
(174) Arii, T.; Uyeda, R.; Terasaki, O.; Watanabe, D. Accurate determination of atomic scattering factors

80
of fcc and hcp metals by high-voltage electron diffraction. Acta Cryst. A 1973, 29 (MAY1), 295-298. (175) Nakashima, P.N.H.; Smith, A.E.; Etheridge, J.; Muddle, B.C. The bonding electron density in
aluminum. Science 2011, 331 (6024), 1583-1586. (176) Arlinghaus, F.J. Theoretical X-ray scattering factors based on energy-band structure. Phys. Rev.
1967, 153 (3), 743-750. (177) Ascarelli, P.; Raccah, P.M. Simple model potential approach to X-ray form factor in aluminum.
Phys. Lett. A 1970, 31 (10), 549-550. (178) Cooper, M.; Williams, B. Localized orbital wave functions for argon and aluminum - Comparison
between theory and experiment. Philos. Mag. 1972, 26 (6), 1441-1446. (179) Walter, J.P.; Fong, C.Y.; Cohen, M.L. Electronic charge density of aluminum. Solid State Commun.
1973, 12 (5), 303-307. (180) Perrot, F. Theoretical form factors of metallic aluminum. Solid State Commun. 1974, 14 (10),
1041-1045. (181) Tawil, R.A. X-ray form factors and compton profile in crystalline aluminum. Phys. Rev. B 1975, 11
(12), 4891-4897. (182) Dawson, B. Studies of atomic charge density by X-ray and neutron diffraction - A perspective.
Advances in Structure Research by Diffraction Methods, 6 (Hoppe, W., Mason, R., Eds.); Pergamon Press: Oxford, New York, Toronto, Sydney, 1975, 220-225.
(183) Bunyan, P.J.; Nelson, J.A. Valence charge density in aluminum. J. Phys. F: Metal Phys. 1977, 7 (11), 2323-2330.
(184) Hafner, J. Electronic charge density in simple metals. Solid State Commun. 1978, 27 (3), 263-268. (185) Chakraborty, S.; Manna, A.; Ghosh, A.K. Atomic scattering factors of solid elements. Phys. Stat.
Sol. B 1985, 129 (1), 211-220. (186) Rantala, T.T. Form factors of metallic aluminum from an atom-in-jellium-vacancy model. J. Phys.
F: Metal Phys. 1987, 17 (4), 877-884. (187) Drude, P. On the electron theory of metals. Ann. d. Phys. 1900, 1 (3), 566-613. (188) Clugston, M.; Flemming, R. Advanced Chemistry. Advanced Science Series, Oxford University
Press: Oxford, 2008, 83-83. (189) Coppens, P. X-ray Charge Densities and Chemical Bonding. International Union of Crystallography,
Oxford University Press: New York, 1997. (190) Zachariasen, W.H. A general theory of X-ray diffraction in crystals. Acta Cryst. 1967, 23, 558-564. (191) Becker, P.J.; Coppens, P. Extinction within limit of validity of Darwin transfer equations. 1. General
formalisms for primary and secondary extinction and their application to spherical crystals. Acta Cryst. A 1974, 30 (MAR), 129-147.
(192) Maslen, E.N.; Spadaccini, N. Extinction corrections from equivalent reflections. Acta Cryst. A 1993, 49 (JUL), 661-667.
(193) Lippmann, T.; Schneider, L.R. Accurate structure factor measurements using high-energy synchrotron radiation: A test on cuprite, Cu2O. J. Appl. Cryst. 2000, 33 (1), 156-167.
(194) Mott, N.F.; Massey, H.S.W. The Theory of Atomic Collisions 3rd Ed. International Series of Monographs on Physics, Clarendon Press: Oxford, 1965, 86-112.
(195) Saunders, M.; Bird, D.M.; Zaluzec, N.J.; Burgess, W.G.; Preston, A.R.; Humphreys, C.J. Measurement of low-order structure factors for silicon from zone-axis CBED patterns. Ultramicroscopy 1995, 60 (2), 311-323.
(196) Zuo, J.M.; Kim, M.; O'Keeffe, M.; Spence, J.C.H. Direct observation of d-orbital holes and Cu-Cu bonding in Cu2O. Nature 1999, 401 (6748), 49-52.
(197) Tsuda, K.; Tanaka, M. Refinement of crystal structural parameters using two-dimensional energy-filtered CBED patterns. Acta Cryst. A 1999, 55, 939-954.
(198) Streltsov, V.A.; Nakashima, P.N.H.; Johnson, A.W.S. Charge density analysis from complementary high energy synchrotron X-ray and electron diffraction data. J. Phys. Chem. Solids 2001, 62 (12), 2109-2117.
(199) Streltsov, V.A.; Nakashima, P.N.H.; Johnson, A.W.S. A combination method of charge density

81
measurement in hard materials using accurate, quantitative electron and X-ray diffraction: The alpha-Al2O3 case. Microsc. Microanal. 2003, 9 (5), 419-427.
(200) Friis, J.; Madsen, G.K.H.; Larsen, F.K.; Jiang, B.; Marthinsen, K.; Holmestad, R. Magnesium: Comparison of density functional theory calculations with electron and X-ray diffraction experiments. J. Chem. Phys. 2003, 119 (21), 11359-11366.
(201) Friis, J.; Jiang, B.; Marthinsen, K.; Holmestad, R. A study of charge density in copper. Acta Cryst. A 2005, 61, 223-230.
(202) Nakashima, P.N.H. Thickness difference: A new filtering tool for quantitative electron diffraction. Phys. Rev. Lett. 2007, 99 (12), 125506.
(203) Sang, X.H.; Kulovits, A.; Wiezorek, J.M.K. Simultaneous determination of highly precise Debye-Waller factors and structure factors for chemically ordered NiAl. Acta Cryst. A 2010, 66, 694-702.
(204) Tsuda, K.; Morikawa, D.; Watanabe, Y.; Ohtani, S.; Arima, T. Direct observation of orbital ordering in the spinel oxide FeCr2O4 through electrostatic potential using convergent-beam electron diffraction. Phys. Rev. B 2010, 81 (18), 180102.
(205) Nakashima, P.N.H.; Muddle, B.C. Differential quantitative analysis of background structure in energy-filtered convergent-beam electron diffraction patterns. J. Appl. Cryst. 2010, 43, 280-284.
(206) Nakashima, P.N.H.; Muddle, B.C. Differential convergent-beam electron diffraction: Experiment and theory. Phys. Rev. B 2010, 81 (11), 115135.
(207) Midgley, P.A. Electronic bonding revealed by electron diffraction. Science 2011, 331 (6024), 1528-1529.
(208) Nakashima, P.N.H. In situ quantification of noise as a function of signal in digital images. Opt. Lett. 2012, 37 (6), 1023-1025.
(209) Dawson, B. The covalent bond in diamond. Proc. R. Soc. Lond. A 1967, 298 (1454), 264-288. (210) Kohn, W.; Sham, L.J. Self-consistent equations including exchange and correlation effects. Phys.
Rev. 1965, 140 (4A), 1133-1138. (211) Doyle, P.A.; Turner, P.S. Relativistic Hartree-Fock X-ray and electron scattering factors. Acta Cryst.
A 1968, 24, 390-397. (212) Blaha, P.; Schwarz, K.; Sorantin, P.; Trickey, S.B. Full-potential, linearized augmented plane-wave
programs for crystalline systems. Comput. Phys. Commun. 1990, 59 (2), 399-415. (213) Kioussis, N.; Herbranson, M.; Collins, E.; Eberhart, M.E. Topology of electronic charge density and
energetics of planar faults in fcc metals. Phys. Rev. Lett. 2002, 88 (12), 125501. (214) Ogata, S.; Li, J.; Yip, S. Ideal pure shear strength of aluminum and copper. Science 2002, 298
(5594), 807-811. (215) Engler, O.; Vatne, H.E.; Nes, E. The roles of oriented nucleation and oriented growth on
recrystallization textures in commercial purity aluminium. Mater. Sci. Eng. A 1996, 205 (1-2), 187-198.
(216) Derlet, P.M.; Høier, R.; Holmestad, R.; Marthinsen, K.; Ryum, N. A study of vacancies in pure aluminium and their role in the diffusion of lithium in a dilute Al-Li alloy using the embedded atom model. Multiscale Modelling of Materials, Warrendale; Bulatov, V.V., DiazdelaRubia, T., Phillips, R., Kaxiras, E., Ghoniem, N. Eds.; Materials Research Society: 1999, 359-369.
(217) Johnson, E.; Andersen, H.H.; Dahmen, U. Nanoscale lead and noble gas inclusions in aluminum: Structures and properties. Microsc. Res. Tech. 2004, 64 (5-6), 356-372.
(218) Zhang, H.H. Crystallography and refining mechanism of (Ti, B)-contained salts in pure aluminum. Trans. Nonferrous Met. Soc. China 2008, 18 (4), 836-841.
(219) Araullo-Peters, V.J.; Breen, A.; Ceguerra, A.V.; Gault, B.; Ringer, S.P.; Cairney, J.M. A new systematic framework for crystallographic analysis of atom probe data. Ultramicroscopy 2015, 154, 7-14.
(220) Silcock, J.M.; Heal, T.J.; Hardy, H.K. Structural ageing characteristics of binary aluminium-copper alloys. J. Inst. Metals 1954, 82 (6), 239-248.
(221) Silcock, J.M. Intermediate precipitates in aged binary alloys of aluminium with cadmium, indium, or tin. J. Inst. Metals 1955, 84 (1), 19-22.
(222) Silcock, J.M.; Heal, T.J.; Hardy, H.K. The structural ageing characteristics of ternary aluminium-

82
copper alloys with cadmium, indium, or tin. J. Inst. Metals 1955, 84 (1), 23-31. (223) Silcock, J.M. The theta' structure in aluminium-copper alloys. Acta Cryst. 1956, 9 (7), 680-680. (224) Silcock, J.M. Double reflexion in aluminium-copper alloys. Acta Cryst. 1956, 9 (1), 86-86. (225) Silcock, J.M. The structural ageing characteristics of aluminium-copper-lithium alloys. J. Inst.
Metals 1960, 88 (8), 357-364. (226) Muddle, B.C.; Polmear, I.J. The precipitate omega-phase in Al-Cu-Mg-Ag alloys. Acta Metall. 1989,
37 (3), 777-789. (227) Jin, Y.; Li, C.Z.; Yan, M.G. A precipitate phase in AA2124. J. Mater. Sci. 1991, 26 (12), 3244-3248. (228) Hasan, F.; Lorimer, G.W. An analytical electron-microscopic investigation of precipitation in an Al-
Cu-Zn-Mg-Ag alloy. Microsc. Res. Tech. 1993, 24 (4), 359-366. (229) Radmilovic, V.; Kilaas, R.; Dahmen, U.; Shiflet, G.J. Structure and morphology of S-phase
precipitates in aluminum. Acta Mater. 1999, 47 (15-16), 3987-3997. (230) Ringer, S.P.; Hono, K. Microstructural evolution and age hardening in aluminium alloys: Atom
probe field-ion microscopy and transmission electron microscopy studies. Mater. Charact. 2000, 44 (1-2), 101-131.
(231) Hutchinson, C.R.; Fan, X.; Pennycook, S.J.; Shiflet, G.J. On the origin of the high coarsening resistance of Omega plates in Al-Cu-Mg-Ag alloys. Acta Mater. 2001, 49 (14), 2827-2841.
(232) Nagai, Y.; Murayama, M.; Tang, Z.; Nonaka, T.; Hono, K.; Hasegawa, M. Role of vacancy-solute complex in the initial rapid age hardening in an Al-Cu-Mg alloy. Acta Mater. 2001, 49 (5), 913-920.
(233) Nie, J.F.; Muddle, B.C. On the form of the age-hardening response in high strength aluminium alloys. Mater. Sci. Eng. A 2001, 319, 448-451.
(234) Wolverton, C. Crystal structure and stability of complex precipitate phases in Al-Cu-Mg-(Si) and Al-Zn-Mg alloys. Acta Mater. 2001, 49 (16), 3129-3142.
(235) Lumley, R.N.; Morton, A.J.; Polmear, I.J. Enhanced creep performance in an Al-Cu-Mg-Ag alloy through underageing. Acta Mater. 2002, 50 (14), 3597-3608.
(236) Mukhopadhyay, A.K. Coprecipitation of omega and sigma phases in Al-Cu-Mg-Mn alloys containing Ag and Si. Metall. Mater. Trans. A 2002, 33 (12), 3635-3648.
(237) Silcock, J.M.; Flower, H.M. Comments on a comparison of early and recent work on the effect of trace additions of Cd, In, or Sn on nucleation and growth of theta' in Al-Cu alloys. Scr. Mater. 2002, 46 (5), 389-394.
(238) Yoshimura, R.; Konno, T.J.; Abe, E.; Hiraga, K. Transmission electron microscopy study of the early stage of precipitates in aged Al-Li-Cu alloys. Acta Mater. 2003, 51 (10), 2891-2903.
(239) Raviprasad, K.; Hutchinson, C.R.; Sakurai, T.; Ringer, S.P. Precipitation processes in an Al-2.5Cu-1.5Mg (wt. %) alloy microalloyed with Ag and Si. Acta Mater. 2003, 51 (17), 5037-5050.
(240) Bastow, T.J.; Celotto, S. Clustering and formation of nano-precipitates in dilute aluminium and magnesium alloys. Mater. Sci. Eng. C 2003, 23 (6-8), 757-762.
(241) Yoshimura, R.; Konno, T.J.; Abe, E.; Hiraga, K. Transmission electron microscopy study of the evolution of precipitates in aged Al-Li-Cu alloys: The theta' and T-1 phases. Acta Mater. 2003, 51 (14), 4251-4266.
(242) Ravi, C.; Wolverton, C. First-principles study of crystal structure and stability of Al-Mg-Si-(Cu) precipitates. Acta Mater. 2004, 52 (14), 4213-4227.
(243) Chakrabarti, D.J.; Laughlin, D.E. Phase relations and precipitation in Al-Mg-Si alloys with Cu additions. Prog. Mater. Sci. 2004, 49 (3-4), 389-410.
(244) Wang, S.C.; Starink, M.J. The assessment of GPB2/S'' structures in Al-Cu-Mg alloys. Mater. Sci. Eng. A 2004, 386 (1-2), 156-163.
(245) Wang, S.C.; Starink, M.J. Precipitates and intermetallic phases in precipitation hardening Al-Cu-Mg-(Li) based alloys. Int. Mater. Rev. 2005, 50 (4), 193-215.
(246) Bastow, T.J. Cu-63 NMR analysis of microstructure evolution in Al-Cu-Mg alloys. Philos. Mag. 2005, 85 (10), 1053-1066.
(247) Bourgeois, L.; Nie, J.F.; Muddle, B.C. Assisted nucleation of theta' phase in Al-Cu-Sn: The modified crystallography of tin precipitates. Philos. Mag. 2005, 85 (29), 3487-3509.
83
(248) Wang, S.C.; Starink, M.J.; Gao, N. Precipitation hardening in Al-Cu-Mg alloys revisited. Scr. Mater. 2006, 54 (2), 287-291.
(249) Ro, Y.; Agnew, S.R.; Gangloff, R.P. Crystallography of fatigue crack propagation in precipitation-hardened Al-Cu-Mg/Li. Metall. Mater. Trans. A 2007, 38 (12), 3042-3062.
(250) Wang, S.C.; Starink, M.J.; Gao, N. Overview of recent work on precipitation in Al-Cu-Mg alloys. 2006 BIMW: 2006 Beijing International Materials Week, Pts 1-4: MAGNESIUM - ALUMINIUM MATERIALS - AEROSPACE MATERIALS - SUPERCONDUCTING AND FUNCTIONAL MATERIALS, Stafa-Zurich; Long, S., Pan, F.H., Kainer, K.U., Han, Y.F., Ke, W., Liu, B., Zhang, X.M., Peng, C.Q., Zhao, X.Q., Feng, Q., Lu, Y.F., Zhang, P.X., Jiang, C.B. Eds.; Trans Tech Publications Ltd: 2007, 775-782.
(251) Wang, S.C.; Starink, M.J. Two types of S phase precipitates in Al-Cu-Mg alloys. Acta Mater. 2007, 55 (3), 933-941.
(252) Winkelman, G.B.; Raviprasad, K.; Muddle, B.C. Orientation relationships and lattice matching for the S phase in Al-Cu-Mg alloys. Acta Mater. 2007, 55 (9), 3213-3228.
(253) Ringer, S.P.; Prasad, K.S.; Quan, G.C. Internal co-precipitation in aged Al-1.7Cu-0.3Mg-0.1Ge (at.%) alloy. Acta Mater. 2008, 56 (9), 1933-1941.
(254) Rosalie, J.M.; Bourgeois, L.; Muddle, B.C. Precipitate assemblies formed on dislocation loops in aluminium-silver-copper alloys. Philos. Mag. 2009, 89 (25), 2195-2211.
(255) Ceguerra, A.V.; Moody, M.P.; Stephenson, L.T.; Marceau, R.K.W.; Ringer, S.P. A three-dimensional Markov field approach for the analysis of atomic clustering in atom probe data. Philos. Mag. 2010, 90 (12), 1657-1683.
(256) Marceau, R.K.W.; Sha, G.; Lumley, R.N.; Ringer, S.P. Evolution of solute clustering in Al-Cu-Mg alloys during secondary ageing. Acta Mater. 2010, 58 (5), 1795-1805.
(257) Ralston, K.D.; Birbilis, N.; Cavanaugh, M.K.; Weyland, M.; Muddle, B.C.; Marceau, R.K.W. Role of nanostructure in pitting of Al-Cu-Mg alloys. Electrochim. Acta 2010, 55 (27), 7834-7842.
(258) Ralston, K.D.; Birbilis, N.; Weyland, M.; Hutchinson, C.R. The effect of precipitate size on the yield strength-pitting corrosion correlation in Al-Cu-Mg alloys. Acta Mater. 2010, 58 (18), 5941-5948.
(259) Donnadieu, P.; Shao, Y.; De Geuser, F.; Botton, G.A.; Lazar, S.; Cheynet, M.; de Boissieu, M.; Deschamps, A. Atomic structure of T-1 precipitates in Al-Li-Cu alloys revisited with HAADF-STEM imaging and small-angle X-ray scattering. Acta Mater. 2011, 59 (2), 462-472.
(260) Dwyer, C.; Weyland, M.; Chang, L.Y.; Muddle, B.C. Combined electron beam imaging and ab initio modeling of T-1 precipitates in Al-Li-Cu alloys. Appl. Phys. Lett. 2011, 98 (20), 201909.
(261) Bourgeois, L.; Dwyer, C.; Weyland, M.; Nie, J.F.; Muddle, B.C. Structure and energetics of the coherent interface between the theta' precipitate phase and aluminium in Al-Cu. Acta Mater. 2011, 59 (18), 7043-7050.
(262) Bourgeois, L.; Dwyer, C.; Weyland, M.; Nie, J.F.; Muddle, B.C. The magic thicknesses of theta' precipitates in Sn-microalloyed Al-Cu. Acta Mater. 2012, 60 (2), 633-644.
(263) Kryvasheyeu, Y. Ph. D. thesis: The Phase Field Simulation of Autocatalytic Nucleation. School of Physics, Monash University, 2012.
(264) Bastow, T.J.; Hutchinson, C.R.; Hill, A.J. Strong interaction of an Al2Cu intermetallic precipitate with its boundary. Philos. Mag. 2012, 92 (16), 2022-2031.
(265) Homma, T.; Moody, M.P.; Saxey, D.W.; Ringer, S.P. Effect of Sn addition in preprecipitation stage in Al-Cu alloys: A correlative transmission electron microscopy and atom probe tomography study. Metall. Mater. Trans. A 2012, 43 (7), 2192-2202.
(266) Rosalie, J.M.; Bourgeois, L. Silver segregation to theta' (Al2Cu)-Al interfaces in Al-Cu-Ag alloys. Acta Mater. 2012, 60 (17), 6033-6041.
(267) Chen, Y.; Weyland, M.; Hutchinson, C.R. The effect of interrupted aging on the yield strength and uniform elongation of precipitation-hardened Al alloys. Acta Mater. 2013, 61 (15), 5877-5894.
(268) Decreus, B.; Deschamps, A.; De Geuser, F.; Donnadieu, P.; Sigli, C.; Weyland, M. The influence of Cu/Li ratio on precipitation in Al-Cu-Li-x alloys. Acta Mater. 2013, 61 (6), 2207-2218.
(269) Feng, Z.Q.; Yang, Y.Q.; Huang, B.; Luo, X.; Li, M.H.; Chen, Y.X.; Han, M.; Fu, M.S.; Ru, J.G. HRTEM and HAADF-STEM tomography investigation of the heterogeneously formed S (Al2CuMg)

84
precipitates in Al-Cu-Mg alloy. Philos. Mag. 2013, 93 (15), 1843-1858. (270) Oh-ishi, K.; Edalati, K.; Kim, H.S.; Hono, K.; Horita, Z. High-pressure torsion for enhanced atomic
diffusion and promoting solid-state reactions in the aluminum-copper system. Acta Mater. 2013, 61 (9), 3482-3489.
(271) Bourgeois, L.; Medhekar, N.V.; Smith, A.E.; Weyland, M.; Nie, J.-F.; Dwyer, C. Efficient atomic-scale kinetics through a complex heterophase interface. Phys. Rev. Lett. 2013, 111 (4), 046102.
(272) Dorin, T.; De Geuser, F.; Lefebvre, W.; Sigli, C.; Deschamps, A. Strengthening mechanisms of T-1 precipitates and their influence on the plasticity of an Al-Cu-Li alloy. Mater. Sci. Eng. A 2014, 605, 119-126.
(273) Guinel, M.J.F.; Brodusch, N.; Sha, G.; Shandiz, M.A.; Demers, H.; Trudeau, M.; Ringer, S.P.; Gauvin, R. Microscopy and microanalysis of complex nanosized strengthening precipitates in new generation commercial Al-Cu-Li alloys. J. Microsc. 2014, 255 (3), 128-137.
(274) Kang, S.J.; Kim, Y.W.; Kim, M.; Zuo, J.M. Determination of interfacial atomic structure, misfits and energetics of Omega phase in Al-Cu-Mg-Ag alloy. Acta Mater. 2014, 81, 501-511.
(275) Liu, B.H.; Hsu, Q.C. Study on bonding phenomena of high strength aluminium alloy in nano-scale analysis. Mater. Res. Innov. 2014, 18 (S3), 65-71.
(276) Liu, H.; Gao, Y.P.; Qi, L.; Wang, Y.Z.; Nie, J.F. Phase-field simulation of Orowan strengthening by coherent precipitate plates in an aluminum alloy. Metall. Mater. Trans. A 2015, 46 (7), 3287-3301.
(277) Styles, M.J.; Marceau, R.K.W.; Bastow, T.J.; Brand, H.E.A.; Gibson, M.A.; Hutchinson, C.R. The competition between metastable and equilibrium S (Al2CuMg) phase during the decomposition of Al-Cu-Mg alloys. Acta Mater. 2015, 98, 64-80.
(278) Wenner, S.; Marioara, C.D.; Andersen, S.J.; Ervik, M.; Holmestad, R. A hybrid aluminium alloy and its zoo of interacting nano-precipitates. Mater. Charact. 2015, 106, 226-231.
(279) Dorin, T.; Donnadieu, P.; Chaix, J.M.; Lefebvre, W.; De Geuser, F.; Deschamps, A. Size distribution and volume fraction of T-1 phase precipitates from TEM images: Direct measurements and related correction. Micron 2015, 78, 19-27.
(280) Kang, S.J.; Kim, T.H.; Yang, C.W.; Lee, J.I.; Park, E.S.; Noh, T.W.; Kim, M. Atomic structure and growth mechanism of T-1 precipitate in Al-Cu-Li-Mg-Ag alloy. Scr. Mater. 2015, 109, 68-71.
(281) Gumbmann, E.; Lefebvre, W.; De Geuser, F.; Sigli, C.; Deschamps, A. The effect of minor solute additions on the precipitation path of an Al-Cu-Li alloy. Acta Mater. 2016, 115, 104-114.
(282) Mihara, M.; Marioara, C.D.; Andersen, S.J.; Holmestad, R.; Kobayashi, E.; Sato, T. Precipitation in an Al-Mg-Cu alloy and the effect of a low amount of Ag. Mater. Sci. Eng. A 2016, 658, 91-98.
(283) Poon, I.; Marceau, R.K.W.; Xia, J.; Liao, X.Z.; Ringer, S.P. Precipitation processes in Al-Cu-Mg-Sn and Al-Cu-Mg-Sn-Ag. Mater. Des. 2016, 96, 385-391.
(284) Shechtman, D.; Blech, I.; Gratias, D.; Cahn, J.W. Metallic phase with long-range orientational order and no translational symmetry. Phys. Rev. Lett. 1984, 53 (20), 1951-1953.
(285) Inoue, A.; Watanabe, M.; Kimura, H.M.; Takahashi, F.; Nagata, A.; Masumoto, T. High mechanical strength of quasi-crystalline phase surrounded by fcc-Al phase in rapidly solidified Al-Mn-Ce alloys. Mater. Trans. JIM 1992, 33 (8), 723-729.
(286) Inoue, A.; Kimura, H. High-strength aluminum alloys containing nanoquasicrystalline particles. Mater. Sci. Eng. A 2000, 286 (1), 1-10.
(287) Gjønnes, J.; Hansen, V.; Andersen, S.J.; Marioara, C.D.; Li, X.Z. Electron crystallography of aluminum alloy phases. Z. Kristall. 2003, 218 (4), 293-307.
(288) Paul, H.; Maurice, C.; Driver, J.H.; Miszczyk, M. Application of orientation imaging to the study of substructural development in cold deformed Al-0.3%Mn single crystal of {110}<112> orientation. Proceedings of the 11th European Workshop of the European Microbeam Analysis Society, Bristol; Labar, J.L., Walker, C.T., Zelechower, M., Zieba, P. Eds.; IOP Publishing Ltd: 2010, 012024.
(289) Muggerud, A.M.F.; Li, Y.J.; Holmestad, R. Composition and orientation relationships of constituent particles in 3xxx aluminum alloys. Philos. Mag. 2014, 94 (6), 556-568.
(290) Muggerud, A.M.F.; Li, Y.J.; Holmestad, R. Orientation studies of alpha-Al(Fe,Mn)Si dispersoids in 3xxx Al alloys. Aluminium Alloys 2014 - ICAA14, Stafa-Zurich; Marthinsen, K., Holmedal, B., Li, Y.
85
Eds.; Trans Tech Publications Ltd: 2014, 39-44. (291) Muggerud, A.M.F.; Li, Y.J.; Holmestad, R.; Andersen, S.J. Mackay icosahedron explaining
orientation relationship of dispersoids in aluminium alloys. Acta Cryst. B 2014, 70, 888-896. (292) Muggerud, A.M.F.; Walmsley, J.C.; Holmestad, R.; Li, Y.J. Combining HAADF STEM tomography and
electron diffraction for studies of alpha-Al(Fe,Mn)Si dispersoids in 3xxx aluminium alloys. Philos. Mag. 2015, 95 (7), 744-758.
(293) Starink, M.J.; Abeels, V.M.F.; Vanmourik, P. Lattice parameter and hardness variations resulting from precipitation and misfit accommodation in a particle-reinforced Al-Si-Cu-Mg alloy. Mater. Sci. Eng. A 1993, 163 (1), 115-125.
(294) Starink, M.J.; Vanmourik, P.; Korevaar, B.M. Misfit accommodation in a quenched and aged Al-Cu alloy with silicon particles. Metall. Mater. Trans. A 1993, 24 (8), 1723-1731.
(295) Wen, K.Y.; Hu, W.; Gottstein, G. Intermetallic compounds in thixoformed aluminium alloy A356. Mater. Sci. Technol. 2003, 19 (6), 762-768.
(296) Kral, M.V.; McIntyre, H.R.; Smillie, M.J. Identification of intermetallic phases in a eutectic Al-Si casting alloy using electron backscatter diffraction pattern analysis. Scr. Mater. 2004, 51 (3), 215-219.
(297) Kral, M.V. A crystallographic identification of intermetallic phases in Al-Si alloys. Mater. Lett. 2005, 59 (18), 2271-2276.
(298) Kral, M.V.; Nakashima, P.N.H.; Mitchell, D.R.G. Electron microscope studies of Al-Fe-Si intermetallics in an Al-11 Pct Si alloy. Metall. Mater. Trans. A 2006, 37 (6), 1987-1997.
(299) Qiu, D.; Taylor, J.A.; Zhang, M.X.; Kelly, P.M. A mechanism for the poisoning effect of silicon on the grain refinement of Al-Si alloys. Acta Mater. 2007, 55 (4), 1447-1456.
(300) Marioara, C.D.; Andersen, S.J.; Birkeland, A.; Holmestad, R. Orientation of silicon particles in a binary Al-Si alloy. J. Mater. Sci. 2008, 43 (14), 4962-4971.
(301) Hwang, J.Y.; Banerjee, R.; Doty, H.W.; Kaufman, M.J. The effect of Mg on the structure and properties of Type 319 aluminum casting alloys. Acta Mater. 2009, 57 (4), 1308-1317.
(302) Srirangam, P.; Chattopadhyay, S.; Bhattacharya, A.; Nag, S.; Kaduk, J.; Shankar, S.; Banerjee, R.; Shibata, T. Probing the local atomic structure of Sr-modified Al-Si alloys. Acta Mater. 2014, 65, 185-193.
(303) Gao, X.; Zhu, Y.M.; Easton, M.A.; Rinderer, B.; Couper, M.; Nie, J.F. Characterization and formation of rod-shaped (Al, Si)(3)Ti particles in an Al-7Si-0.35Mg-0.12Ti (wt pct) alloy. Metall. Mater. Trans. A 2015, 46 (8), 3723-3731.
(304) Kubota, M.; Muddle, B.C. Effect of trace additions of Ag on precipitation in Al-Mg alloys. Mater. Trans. 2005, 46 (12), 2968-2974.
(305) Kubota, M.; Nie, J.F.; Muddle, B.C. Characterisation of quasicrystalline particles in an isothermally aged Al-10Mg-0.5Ag (mass%) alloy. Mater. Trans. 2005, 46 (6), 1278-1287.
(306) Kubota, M.; Nie, J.F.; Muddle, B.C. Formation of quasicrystalline particles in an isothermally aged Al-10Mg-0.5 Ag (mass%) alloy. Mater. Trans. 2005, 46 (2), 365-368.
(307) Kovarik, L.; Court, S.A.; Fraser, H.L.; Mills, M.J. GPB zones and composite GPB/GPBII zones in Al-Cu-Mg alloys. Acta Mater. 2008, 56 (17), 4804-4815.
(308) Moody, M.P.; Gault, B.; Stephenson, L.T.; Marceau, R.K.W.; Powles, R.C.; Ceguerra, A.V.; Breen, A.J.; Ringer, S.P. Lattice rectification in atom probe tomography: Toward true three-dimensional atomic microscopy. Microsc. Microanal. 2011, 17 (2), 226-239.
(309) Bjørge, R.; Dwyer, C.; Weyland, M.; Nakashima, P.N.H.; Marioara, C.D.; Andersen, S.J.; Etheridge, J.; Holmestad, R. Aberration-corrected scanning transmission electron microscopy study of beta'-like precipitates in an Al-Mg-Ge alloy. Acta Mater. 2012, 60 (6-7), 3239-3246.
(310) Li, Y.J.; Zhang, W.Z.; Marthinsen, K. Precipitation crystallography of plate-shaped Al-6(Mn,Fe) dispersoids in AA5182 alloy. Acta Mater. 2012, 60 (17), 5963-5974.
(311) Xia, J.H.; Sha, G.; Chen, Z.G.; Liao, X.Z.; Liu, H.W.; Ringer, S.P. Precipitation of quasicrystal approximant phases in an Al-Mg-Cu-Ge alloy. Philos. Mag. Lett. 2013, 93 (2), 77-84.
(312) Macchi, C.; Tolley, A.; Giovachini, R.; Polmear, I.J.; Somoza, A. Influence of a microalloying addition

86
of Ag on the precipitation kinetics of an Al-Cu-Mg alloy with high Mg:Cu ratio. Acta Mater. 2015, 98, 275-287.
(313) Andersen, S.J. Quantification of the Mg2Si-beta'' and beta' phases in Al-Mg-Si alloys by transmission electron microscopy. Metall. Mater. Trans. A 1995, 26 (8), 1931-1937.
(314) Maruyama, N.; Uemori, R.; Hashimoto, N.; Saga, M.; Kikuchi, M. Effect of silicon addition on the composition and structure of fine-scale precipitates in Al-Mg-Si alloys. Scr. Mater. 1997, 36 (1), 89-93.
(315) Zandbergen, H.W.; Andersen, S.J.; Jansen, J. Structure determination of Mg5Si6 particles in Al by dynamic electron diffraction studies. Science 1997, 277 (5330), 1221-1225.
(316) Andersen, S.J.; Zandbergen, H.W.; Jansen, J.; Traeholt, C.; Tundal, U.; Reiso, O. The crystal structure of the beta'' phase in Al-Mg-Si alloys. Acta Mater. 1998, 46 (9), 3283-3298.
(317) Edwards, G.A.; Stiller, K.; Dunlop, G.L.; Couper, M.J. The precipitation sequence in Al-Mg-Si alloys. Acta Mater. 1998, 46 (11), 3893-3904.
(318) Murayama, M.; Hono, K.; Saga, M.; Kikuchi, M. Atom probe studies on the early stages of precipitation in Al-Mg-Si alloys. Mater. Sci. Eng. A 1998, 250 (1), 127-132.
(319) Murayama, M.; Hono, K. Pre-precipitate clusters and precipitation processes in Al-Mg-Si alloys. Acta Mater. 1999, 47 (5), 1537-1548.
(320) Cayron, C.; Buffat, P.A. Transmission electron microscopy study of the beta' phase (Al-Mg-Si alloys) and QC phase (Al-Cu-Mg-Si alloys): Ordering mechanism and crystallographic structure. Acta Mater. 2000, 48 (10), 2639-2653.
(321) Marioara, C.D.; Andersen, S.J.; Jansen, J.; Zandbergen, H.W. Atomic model for GP-zones in a 6082 Al-Mg-Si system. Acta Mater. 2001, 49 (2), 321-328.
(322) Ohmori, Y.; Doan, L.C.; Matsuura, Y.; Kobayashi, S.; Nakai, K. Morphology and crystallography of beta-Mg2Si precipitation in Al-Mg-Si alloys. Mater. Trans. 2001, 42 (12), 2576-2583.
(323) Ohmori, Y.; Doan, L.C.; Nakai, K. Ageing processes in Al-Mg-Si alloys during continuous heating. Mater. Trans. 2002, 43 (2), 246-255.
(324) Marioara, C.D.; Andersen, S.J.; Jansen, J.; Zandbergen, H.W. The influence of temperature and storage time at RT on nucleation of the beta'' phase in a 6082 Al-Mg-Si alloy. Acta Mater. 2003, 51 (3), 789-796.
(325) Yassar, R.S.; Field, D.P.; Weiland, H. The effect of predeformation on the beta'' and beta' precipitates and the role of Q' phase in an Al-Mg-Si alloy; AA6022. Scr. Mater. 2005, 53 (3), 299-303.
(326) Hasting, H.S.; Walmsley, J.C.; Van Helvoort, A.T.J.; Marioara, C.D.; Andersen, S.J.; Holmestad, R. Z-contrast imaging of the arrangement of Cu in precipitates in 6XXX-series aluminium alloys. Philos. Mag. Lett. 2006, 86 (9), 589-597.
(327) Marioara, C.D.; Nordmark, H.; Andersen, S.J.; Holmestad, R. Post-beta'' phases and their influence on microstructure and hardness in 6xxx Al-Mg-Si alloys. J. Mater. Sci. 2006, 41 (2), 471-478.
(328) van Huis, M.A.; Chen, J.H.; Zandbergen, H.W.; Sluiter, M.H.F. Phase stability and structural relations of nanometer-sized, matrix-embedded precipitate phases in Al-Mg-Si alloys in the late stages of evolution. Acta Mater. 2006, 54 (11), 2945-2955.
(329) Buha, J.; Lumley, R.N.; Crosky, A.G.; Hono, K. Secondary precipitation in an Al-Mg-Si-Cu alloy. Acta Mater. 2007, 55 (9), 3015-3024.
(330) Sandberg, N.; Slabanja, M.; Holmestad, R. Ab initio simulations of clustering and precipitation in Al-Mg-Si alloys. Comput. Mater. Sci. 2007, 40 (3), 309-318.
(331) Vissers, R.; van Huis, M.A.; Jansen, J.; Zandbergen, H.W.; Marioara, C.D.; Andersen, S.J. The crystal structure of the beta' phase in Al-Mg-Si alloys. Acta Mater. 2007, 55 (11), 3815-3823.
(332) Hasting, H.S.; Frøseth, A.G.; Andersen, S.J.; Vissers, R.; Walmsley, J.C.; Marioara, C.D.; Danoix, F.; Lefebvre, W.; Holmestad, R. Composition of beta' precipitates in Al-Mg-Si alloys by atom probe tomography and first principles calculations. J. Appl. Phys. 2009, 106 (12), 123527.
(333) Jia, Z.H.; Arnberg, L.; Andersen, S.J.; Walmsley, J.C. On nanoscale Al precipitates forming in eutectic Si particles in Al-Si-Mg cast alloys. Scr. Mater. 2009, 61 (5), 500-503.

87
(334) Chomsaeng, N.; Haruta, M.; Chairuangsri, T.; Kurata, H.; Isoda, S.; Shiojiri, M. HRTEM and ADF-STEM of precipitates at peak-ageing in cast A356 aluminium alloy. J. Alloy. Compd. 2010, 496 (1-2), 478-487.
(335) Teichmann, K.; Marioara, C.D.; Andersen, S.J.; Pedersen, K.O.; Gulbrandsen-Dahl, S.; Kolar, M.; Holmestad, R.; Marthinsen, K. HRTEM study of the effect of deformation on the early precipitation behaviour in an AA6060 Al-Mg-Si alloy. Philos. Mag. 2011, 91 (28), 3744-3754.
(336) Torsaeter, M.; Lefebvre, W.; Marioara, C.D.; Andersen, S.J.; Walmsley, J.C.; Holmestad, R. Study of intergrown L and Q' precipitates in Al-Mg-Si-Cu alloys. Scr. Mater. 2011, 64 (9), 817-820.
(337) Avettand-Fenoel, M.N.; Taillard, R.; Ji, G.; Goran, D. Multiscale study of interfacial intermetallic compounds in a dissimilar Al 6082-T6/Cu friction-stir weld. Metall. Mater. Trans. A 2012, 43 (12), 4655-4666.
(338) Bjørge, R.; Andersen, S.J.; Marioara, C.D.; Etheridge, J.; Holmestad, R. Scanning transmission electron microscopy investigation of an Al-Mg-Si-Ge-Cu alloy. Philos. Mag. 2012, 92 (32), 3983-3993.
(339) Holmestad, R.; Bjørge, R.; Ehlers, F.J.H.; Torsaeter, M.; Marioara, C.D.; Andersen, S.J. Characterization and structure of precipitates in 6xxx Aluminium Alloys. Electron Microscopy and Analysis Group Conference 2011, Bristol; Moebus, G., Walther, T., Brydson, R., Ozkaya, D., MacLaren, I., Donnelly, S., Nellist, P., Li, Z., Baker, R., Chiu, Y.L. Eds.; Iop Publishing Ltd: 2012; 012082.
(340) Marioara, C.D.; Nakamura, J.; Matsuda, K.; Andersen, S.J.; Holmestad, R.; Sato, T.; Kawabata, T.; Ikeno, S. HAADF-STEM study of beta'-type precipitates in an over-aged Al-Mg-Si-Ag alloy. Philos. Mag. 2012, 92 (9), 1149-1158.
(341) Starink, M.J.; Cao, L.F.; Rometsch, P.A. A model for the thermodynamics of and strengthening due to co-clusters in Al-Mg-Si-based alloys. Acta Mater. 2012, 60 (10), 4194-4207.
(342) Dong, P.; Sun, D.Q.; Li, H.M. Natural aging behaviour of friction stir welded 6005A-T6 aluminium alloy. Mater. Sci. Eng. A 2013, 576, 29-35.
(343) Ehlers, F.J.H.; Holmestad, R. Ab initio based interface modeling for fully coherent precipitates of arbitrary size in Al alloys. Comput. Mater. Sci. 2013, 72, 146-157.
(344) Saito, T.; Muraishi, S.; Marioara, C.D.; Andersen, S.J.; Røyset, J.; Holmestad, R. The effects of low Cu additions and predeformation on the precipitation in a 6060 Al-Mg-Si alloy. Metall. Mater. Trans. A 2013, 44 (9), 4124-4135.
(345) Teichmann, K.; Marioara, C.D.; Andersen, S.J.; Marthinsen, K. TEM study of beta' precipitate interaction mechanisms with dislocations and beta' interfaces with the aluminium matrix in Al-Mg-Si alloys. Mater. Charact. 2013, 75, 1-7.
(346) Ehlers, F.J.H.; Dumoulin, S.; Holmestad, R. 3D modelling of beta'' in Al-Mg-Si: Towards an atomistic level ab initio based examination of a full precipitate enclosed in a host lattice. Comput. Mater. Sci. 2014, 91, 200-210.
(347) Fiawoo, M.; Gao, X.; Bourgeois, L.; Parson, N.; Zhang, X.Q.; Couper, M.; Nie, J.F. Formation of multiple orientation relationships of Q precipitates in Al-Mg-Si-Cu alloys. Scr. Mater. 2014, 88, 53-56.
(348) Li, K.; Beche, A.; Song, M.; Sha, G.; Lu, X.X.; Zhang, K.; Du, Y.; Ringer, S.P.; Schryvers, D. Atomistic structure of Cu-containing beta'' precipitates in an Al-Mg-Si-Cu alloy. Scr. Mater. 2014, 75, 86-89.
(349) Marioara, C.D.; Andersen, S.J.; Røyset, J.; Reiso, O.; Gulbrandsen-Dahl, S.; Nicolaisen, T.E.; Opheim, I.E.; Helgaker, J.F.; Holmestad, R. Improving thermal stability in Cu-containing Al-Mg-Si alloys by precipitate optimization. Metall. Mater. Trans. A 2014, 45 (7), 2938-2949.
(350) Ninive, P.H.; Strandlie, A.; Gulbrandsen-Dahl, S.; Lefebvre, W.; Marioara, C.D.; Andersen, S.J.; Friis, J.; Holmestad, R.; Lovvik, O.M. Detailed atomistic insight into the beta" phase in Al-Mg-Si alloys. Acta Mater. 2014, 69, 126-134.
(351) Saito, T.; Ehlers, F.J.H.; Lefebvre, W.; Hernandez-Maldonado, D.; Bjørge, R.; Marioara, C.D.; Andersen, S.J.; Holmestad, R. HAADF-STEM and DFT investigations of the Zn-containing beta'' phase in Al-Mg-Si alloys. Acta Mater. 2014, 78, 245-253.
88
(352) Saito, T.; Marioara, C.D.; Andersen, S.J.; Lefebvre, W.; Holmestad, R. Aberration-corrected HAADF-STEM investigations of precipitate structures in Al-Mg-Si alloys with low Cu additions. Philos. Mag. 2014, 94 (5), 520-531.
(353) Wenner, S.; Marioara, C.D.; Ramasse, Q.M.; Kepaptsoglou, D.M.; Hage, F.S.; Holmestad, R. Atomic-resolution electron energy loss studies of precipitates in an Al-Mg-Si-Cu-Ag alloy. Scr. Mater. 2014, 74, 92-95.
(354) Mørtsell, E.A.; Marioara, C.D.; Andersen, S.J.; Røyset, J.; Reiso, O.; Holmestad, R. Effects of germanium, copper, and silver substitutions on hardness and microstructure in lean Al-Mg-Si alloys. Metall. Mater. Trans. A 2015, 46 (9), 4369-4379.
(355) Nishimura, K.; Matsuda, K.; Komaki, R.; Nunomra, N.; Wenner, S.; Holmestad, R.; Matsuzaki, T.; Watanabe, I.; Pratt, F.L. Solute-vacancy clustering in Al-Mg-Si alloys studied by muon spin relaxation technique. Arch. Metall. Mater. 2015, 60 (2), 925-929.
(356) Mørtsell, E.A.; Marioara, C.D.; Andersen, S.J.; Røyset, J.; Reiso, O.; Holmestad, R. The effect of Cu and Ge additions on strength and precipitation in a lean 6xxx aluminium alloy. Electron Microscopy and Analysis Group Conference, Bristol; IOP Publishing Ltd: 2015, 012028.
(357) Kairy, S.K.; Rometsch, P.A.; Diao, K.; Nie, J.F.; Davies, C.H.J.; Birbilis, N. Exploring the electrochemistry of 6xxx series aluminium alloys as a function of Si to Mg ratio, Cu content, ageing conditions and microstructure. Electrochim. Acta 2016, 190, 92-103.
(358) Saito, T.; Ehlers, F.J.H.; Lefebvre, W.; Hernandez-Maldonado, D.; Bjørge, R.; Marioara, C.D.; Andersen, S.J.; Mørtsell, E.A.; Holmestad, R. Cu atoms suppress misfit dislocations at the beta''/Al interface in Al-Mg-Si alloys. Scr. Mater. 2016, 110, 6-9.
(359) Wenner, S.; Holmestad, R. Accurately measured precipitate-matrix misfit in an Al-Mg-Si alloy by electron microscopy. Scr. Mater. 2016, 118, 5-8.
(360) Jin, Y.; Li, C.Z.; Yan, M.G. On the eta' precipitate phase in 7050 aluminum alloy. Mater. Sci. Eng. A 1991, 141 (1), 123-128.
(361) Yan, J.; Li, C.Z.; Yan, M.G. Transmission electron microscopy on the microstructure of 7050 aluminum alloy in the T74 condition. J. Mater. Sci. 1992, 27 (1), 197-202.
(362) Stiller, K.; Warren, P.J.; Hansen, V.; Angenete, J.; Gjønnes, J. Investigation of precipitation in an Al-Zn-Mg alloy after two-step ageing treatment at 100 degrees and 150 degrees C. Mater. Sci. Eng. A 1999, 270 (1), 55-63.
(363) Li, X.Z.; Hansen, V.; Gjønnes, J.; Wallenberg, L.R. HREM study and structure modeling of the eta' phase, the hardening precipitates in commercial Al-Zn-Mg alloys. Acta Mater. 1999, 47 (9), 2651-2659.
(364) Maloney, S.K.; Hono, K.; Polmear, I.J.; Ringer, S.P. The chemistry of precipitates in an aged Al-2.1Zn-1.7Mg at.% alloy. Scr. Mater. 1999, 41 (10), 1031-1038.
(365) Berg, L.K.; Gjønnes, J.; Hansen, V.; Li, X.Z.; Knutson-Wedel, M.; Waterloo, G.; Schryvers, D.; Wallenberg, L.R. GP-zones in Al-Zn-Mg alloys and their role in artificial aging. Acta Mater. 2001, 49 (17), 3443-3451.
(366) Li, X.M.; Starink, M.J. Effect of compositional variations on characteristics of coarse intermetallic particles in overaged 7000 aluminium alloys. Mater. Sci. Technol. 2001, 17 (11), 1324-1328.
(367) Godard, D.; Archambault, P.; Aeby-Gautier, E.; Lapasset, G. Precipitation sequences during quenching of the AA 7010 alloy. Acta Mater. 2002, 50 (9), 2319-2329.
(368) Sha, G.; Cerezo, A. Early-stage precipitation in Al-Zn-Mg-Cu alloy (7050). Acta Mater. 2004, 52 (15), 4503-4516.
(369) Gjønnes, J.; Hansen, V.; Kverneland, A. The precession technique in electron diffraction and its application to structure determination of nano-size precipitates in alloys. Microsc. Microanal. 2004, 10 (1), 16-20.
(370) Dumont, M.; Lefebvre, W.; Doisneau-Cottignies, B.; Deschamps, A. Characterisation of the composition and volume fraction of eta' and eta precipitates in an Al-Zn-Mg alloy by a combination of atom probe, small-angle X-ray scattering and transmission electron microscopy. Acta Mater. 2005, 53 (10), 2881-2892.

89
(371) Kverneland, A.; Hansen, V.; Vincent, R.; Gjønnes, K.; Gjønnes, J. Structure analysis of embedded nano-sized particles by precession electron diffraction. Eta'-precipitate in an Al-Zn-Mg alloy as example. Ultramicroscopy 2006, 106 (6), 492-502.
(372) Prasad, K.S.; Mukhopadhyay, A.K.; Majumdar, B.; Akhtar, D. On the nature and stability of phases present in a rapidly solidified aluminium alloy 7010 containing scandium. Mater. Manuf. Process. 2008, 23 (7), 658-664.
(373) Liddicoat, P.V.; Liao, X.Z.; Zhao, Y.H.; Zhu, Y.T.; Murashkin, M.Y.; Lavernia, E.J.; Valiev, R.Z.; Ringer, S.P. Nanostructural hierarchy increases the strength of aluminium alloys. Nat. Commun. 2010, 1, 63.
(374) Sha, G.; Wang, Y.B.; Liao, X.Z.; Duan, Z.C.; Ringer, S.P.; Langdon, T.G. Microstructural evolution of Fe-rich particles in an Al-Zn-Mg-Cu alloy during equal-channel angular pressing. Mater. Sci. Eng. A 2010, 527 (18-19), 4742-4749.
(375) Sha, G.; Yao, L.; Liao, X.Z.; Ringer, S.P.; Duan, Z.C.; Langdon, T.G. Segregation of solute elements at grain boundaries in an ultrafine grained Al-Zn-Mg-Cu alloy. Ultramicroscopy 2011, 111 (6), 500-505.
(376) Styles, M.J.; Bastow, T.J.; Gibson, M.A.; Hutchinson, C.R. Substitution of Cu and/or Al in eta phase (MgZn2) and the implications for precipitation in Al-Zn-Mg-(Cu) alloys. Intermetallics 2014, 49, 40-51.
(377) Wenner, S.; Marioara, C.D.; Lefebvre, W.; Ramasse, Q.M.; Kepaptsoglou, D.M.; Hage, F.S.; Holmestad, R. Atomic-resolution elemental mapping of precipitates in a 7449 aluminium alloy. Aluminium Alloys 2014 - ICAA14, Stafa-Zurich; Marthinsen, K., Holmedal, B., Li, Y. Eds.; Trans Tech Publications Ltd: 2014, 63-67.
(378) Wenner, S.; Friis, J.; Marioara, C.D.; Andersen, S.J.; Holmestad, R. Structural modifications and electron beam damage in aluminium alloy precipitate theta'-Al2Cu. Philos. Mag. 2015, 95 (31), 3524-3534.
(379) Zhang, Y.; Weyland, M.; Milkereit, B.; Reich, M.; Rometsch, P.A. Precipitation of a new platelet phase during the quenching of an Al-Zn-Mg-Cu alloy. Sci. Rep. 2016, 6, 23109.
(380) Douin, J.; Dahmen, U.; Westmacott, K.H. On the formation of twinned precipitates in Al-Ge alloys. Philos. Mag. B 1991, 63 (4), 867-890.
(381) Majumdar, A.; Muddle, B.C. Microstructure in rapidly solidified Al-Ti alloys. Mater. Sci. Eng. A 1993, 169 (1-2), 135-147.
(382) Cheng, Y.F.; Nüchter, W.; Mayer, J.; Weickenmeier, A.; Gjønnes, J. Low-order structure-factor amplitude and sign determination of an unknown structure AlmFe by quantitative convergent-beam electron diffraction. Acta Cryst. A 1996, 52, 923-936.
(383) Nie, J.F.; Muddle, B.C. High temperature precipitation hardening in a rapidly quenched Al-Ti-Ni alloy. 2. Precipitate characterisation. Mater. Sci. Eng. A 1996, 221 (1-2), 22-32.
(384) Chang, W.S.; Muddle, B.C. Microstructural and crystallographic characterization of multiphase Al62Ti10V28 alloy. Mater. Trans. JIM 1998, 39 (9), 975-981.
(385) Hono, K.; Zhang, Y.; Sakurai, T.; Inoue, A. Microstructure of a rapidly solidified Al-4V-2Fe ultrahigh strength aluminum alloy. Mater. Sci. Eng. A 1998, 250 (1), 152-157.
(386) Vilar, R.; Conde, O.; Franco, S. Crystallographic structure of Al(3)Nb in laser processed Al-Nb alloys. Intermetallics 1999, 7 (11), 1227-1233.
(387) Cortie, M.B.; Levey, F.C. Structure and ordering of the 18 carat Al-Au-Cu beta phase. Intermetallics 2000, 8 (7), 793-804.
(388) Moore, K.T.; Howe, J.M. Characterization of gamma plate-shaped precipitates in an Al-4.2 at.% Ag alloy - Growth kinetics, solute field, composition and modeling. Acta Mater. 2000, 48 (16), 4083-4098.
(389) Grushko, B.; Velikanova, T.Y. Structural studies of materials - Formation of quasicrystals and related structures in systems of aluminum with transition metals. I. Binary systems formed by aluminum with 3d metals. Powder Metall. Met. Ceram. 2004, 43 (1-2), 72-86.
(390) Grushko, B.; Velikanova, T.Y. Formation of quasicrystals and related structures in systems of

90
aluminum with transition metals. II. Binary systems formed by aluminum with 4d and 5d metals. Powder Metall. Met. Ceram. 2004, 43 (5-6), 311-322.
(391) Tolley, A.; Radmilovic, V.; Dahmen, U. Segregation in Al-3(Sc,Zr) precipitates in Al-Sc-Zr alloys. Scr. Mater. 2005, 52 (7), 621-625.
(392) Zhang, M.X.; Kelly, P.M.; Easton, M.A.; Taylor, J.A. Crystallographic study of grain refinement in aluminum alloys using the edge-to-edge matching model. Acta Mater. 2005, 53 (5), 1427-1438.
(393) Clouet, E.; Lae, L.; Epicier, T.; Lefebvre, W.; Nastar, M.; Deschamps, A. Complex precipitation pathways in multicomponent alloys. Nat. Mater. 2006, 5 (6), 482-488.
(394) Palm, M.; Lacaze, J. Assessment of the Al-Fe-Ti system. Intermetallics 2006, 14 (10-11), 1291-1303.
(395) Knipling, K.E.; Dunand, D.C.; Seidman, D.N. Precipitation evolution in Al-Zr and Al-Zr-Ti alloys during aging at 450-600 degrees C. Acta Mater. 2008, 56 (6), 1182-1195.
(396) Rosalie, J.M.; Bourgeois, L.; Muddle, B.C. Precipitate assemblies formed on dislocation loops in aluminium-silver alloys. Philos. Mag. 2009, 89 (15), 1267-1278.
(397) Strutz, A.; Yamamoto, A.; Steurer, W. Basic Co-rich decagonal Al-Co-Ni: Average structure. Phys. Rev. B 2009, 80 (18), 184102.
(398) Qiu, D.; Taylor, J.A.; Zhang, M.X. Understanding the co-poisoning effect of Zr and Ti on the grain refinement of cast aluminum alloys. Metall. Mater. Trans. A 2010, 41 (13), 3412-3421.
(399) Gault, B.; de Geuser, F.; Bourgeois, L.; Gable, B.M.; Ringer, S.P.; Muddle, B.C. Atom probe tomography and transmission electron microscopy characterisation of precipitation in an Al-Cu-Li-Mg-Ag alloy. Ultramicroscopy 2011, 111 (6), 683-689.
(400) Rosalie, J.M.; Bourgeois, L.; Muddle, B.C. Nucleation and growth of the gamma' (AlAg2) precipitate in Al-Ag(-Cu) alloys. Acta Mater. 2011, 59 (19), 7168-7176.
(401) Hovmöller, S.; Zou, L.H.; Zou, X.D.; Grushko, B. Structures of pseudo-decagonal approximants in Al-Co-Ni. Philos. Trans. R. Soc. A 2012, 370 (1969), 2949-2959.
(402) Huang, Y.C.; Xiao, Z.B.; Liu, Y. Crystallography of Zr poisoning of Al-Ti-B grain refinement using edge-to-edge matching model. J. Cent. South Univ. 2013, 20 (10), 2635-2642.
(403) Wang, F.; Qiu, D.; Liu, Z.L.; Taylor, J.A.; Easton, M.A.; Zhang, M.X. The grain refinement mechanism of cast aluminium by zirconium. Acta Mater. 2013, 61 (15), 5636-5645.
(404) Bittner, R.W.; Gurth, M.; Duarte, L.I.; Leinenbach, C.; Effenberger, H.S.; Richter, K.W. Al-Ge-Ti: Phase equilibria and structural characterization of new ternary compounds. Intermetallics 2014, 53, 157-168.
(405) Rosalie, J.M.; Dwyer, C.; Bourgeois, L. On chemical order and interfacial segregation in gamma' (AlAg2) precipitates. Acta Mater. 2014, 69, 224-235.
(406) Wang, F.; Qiu, D.; Liu, Z.L.; Taylor, J.; Easton, M.; Zhang, M.X. Crystallographic study of Al3Zr and Al3Nb as grain refiners for Al alloys. Trans. Nonferrous Met. Soc. China 2014, 24 (7), 2034-2040.
(407) Xiong, X.Y.; Weyland, M. Microstructural characterization of an Al-Li-Mg-Cu alloy by correlative electron tomography and atom probe tomography. Microsc. Microanal. 2014, 20 (4), 1022-1028.
(408) Bourgeois, L.; Zhang, Z.; Li, J.; Medhekar, N.V. The bulk and interfacial structures of the eta (Al2Au) precipitate phase. Acta Mater. 2016, 105, 284-293.
(409) Dong, Y.; Lu, Y.P.; Jiang, L.; Wang, T.M.; Li, T.J. Effects of electronegativity on the stability of topologically close-packed phase in high entropy alloys. Intermetallics 2014, 52, 105-109.
(410) Mondolfo, L.F. Aluminium Alloys: Structure and Properties. Butterworths: London, Boston, Sydney Wellington, Durban, Toronto, 1976.
(411) Hono, K. Nanoscale microstructural analysis of metallic materials by atom probe field ion microscopy. Prog. Mater. Sci. 2002, 47 (6), 621-729.
(412) Day, M.G.; Hellawell, A. Microstructure and crystallography of aluminium-silicon eutectic alloys. Proc. R. Soc. Lond. A 1968, 305 (1483), 473-491.
(413) Polmear, I.J. Light Alloys: Metallurgy of the Light Metals 3rd Ed. Metallurgy and Materials Science Series, (Honeycombe, R.W.K., Hancock, P., Eds.); Arnold, a division of Hodder Headline PLC: London, 1995.

91
(414) Preston, G.D. The diffraction of X-rays by an age-hardening alloy of aluminium and copper. The structure of an intermediate phase. Philos. Mag. 1938, 26 (178), 855-871.
(415) Guinier, A. La diffraction des rayons X aux tres petits angles; application a l'etude de phenomenes ultramicroscopiques. Ann. Phys. (Paris) 1939, 12, 161-237.
(416) Hardy, H.K.; Silcock, J.M. The phase sections at 500°C and 350°C of aluminium-rich aluminium-copper-lithium alloys. J. Inst. Metals 1956, 84 (11), 423-428.
(417) Noble, B.; Thompson, G.E. T1 (Al2CuLi) precipitation in aluminium-copper-lithium alloys. Met. Sci. J. 1972, 6, 167-174.
(418) Huang, J.C.; Ardell, A.J. Crystal structure and stability of T1 precipitates in aged Al-Li-Cu alloys. Mater. Sci. Technol. 1987, 3 (3), 176-188.
(419) Cassada, W.A.; Shiflet, G.J.; Starke, E.A. The effect of plastic deformation on T1 precipitation. J. Phys. Colloq. 1987, 48 (C-3), 397-406.
(420) Howe, J.M.; Lee, J.; Vasudevan, A.K. Structure and deformation behavior of T1 precipitate plates in an Al-2Li-1Cu alloy. Metall. Mater. Trans. A 1988, 19 (12), 2911-2920.
(421) van Smaalen, S.; Meetsma, A.; de Boer, J.L.; Bronsveld, P.M. Refinement of the crystal-structure of hexagonal Al2CuLi. J. Solid State Chem. 1990, 85 (2), 293-298.
(422) Huang, J.C. On the crystal structure of the T1 phase in Al-Li-Cu alloys. Scr. Metall. Mater. 1992, 27 (6), 755-760.
(423) Herring, R.A.; Gayle, F.W.; Pickens, J.R. High-resolution electron-microscopy study of a high-copper variant of weldalite 049 and a high-strength Al-Cu-Ag-Mg-Zr alloy. J. Mater. Sci. 1993, 28 (1), 69-73.
(424) Gerold, V. Über die Struktur der bei der Aushartung einer Aluminium-Kupfer Legierung auftretenden Zustande. Z. Metallkd. 1954, 45 (10), 599-607.
(425) Yoshida, H. Some aspects on the structure of Guinier-Preston zones in Al-Cu alloys based on high-resolution electron microscope observations. Scr. Metall. 1988, 22 (7), 947-951.
(426) Wolverton, C. First-principles prediction of equilibrium precipitate shapes in Al-Cu alloys. Philos. Mag. Lett. 1999, 79 (9), 683-690.
(427) Wang, S.Q.; Schneider, M.; Ye, H.Q.; Gottstein, G. First-principles study of the formation of Guinier-Preston zones in Al-Cu alloys. Scr. Mater. 2004, 51 (7), 665-669.
(428) Karlik, M.; Bigot, A.; Jouffrey, B.; Auger, P.; Belliot, S. HREM, FIM and tomographic atom probe investigation of Guinier-Preston zones in an Al-1.54 at% Cu alloy. Ultramicroscopy 2004, 98 (2-4), 219-230.
(429) Friauf, J.B. The crystal structures of two intermetallic compounds. J. Am. Chem. Soc. 1927, 49, 3107-3114.
(430) Bonnet, R. Disorientation between any 2 lattices. Acta Cryst. A 1980, 36 (JAN), 116-122. (431) Ellwood, E.C.; Bagley, K.Q. The structure of eutectics. J. Inst. Metals 1950, 76 (6), 631-642. (432) Meetsma, A.; de Boer, J.L.; van Smaalen, S. Refinement of the crystal structure of tetragonal Al2Cu.
J. Solid State Chem. 1989, 83 (2), 370-372. (433) Knowles, K.M.; Stobbs, W.M. The structure of (111) age-hardening precipitates in Al-Cu-Mg-Ag
alloys. Acta Cryst. B 1988, 44, 207-227. (434) Polmear, I.J.; Couper, M.J. Design and development of an experimental wrought aluminum alloy
for use at elevated temperatures. Metall. Mater. Trans. A 1988, 19 (4), 1027-1035. (435) Perlitz, H.; Westgren, A. The crystal structure of Al2CuMg. Arkiv Kemi. Mineral. Geol. B 1943, 16
(13), 1-5. (436) Al-Khafaji, M.A.; Rainforth, W.M.; Rylands, L.M.; Jones, H. On the crystal structure of Al2CuMg, S',
in Al-Cu-Mg alloys. Electron Microscopy and Analysis 1999, Bristol; Kiely, C.J. Ed.; IOP Publishing Ltd: 1999; 279-282.
(437) Kilaas, R.; Radmilovic, V. Structure determination and structure refinement of Al2CuMg precipitates by quantitative high-resolution electron microscopy. Ultramicroscopy 2001, 88 (1), 63-72.
(438) Vegard, L. The constitution of the mixed crystals and the filling of space of the atoms. Z. Phys.

92
1921, 5, 17-26. (439) Vegard, L.; Dale, H. Tests on mixed crystals and alloys. Z. Kristall. 1928, 67 (1), 148-162. (440) Denton, A.R.; Ashcroft, N.W. Vegard Law. Phys. Rev. A 1991, 43 (6), 3161-3164. (441) Phillips, A.; Brick, R.M. Effect of quenching strains on lattice parameter and hardness values of
high-purity aluminum-copper alloys. Trans. Am. Inst. Min. Metall. Eng. 1934, 111, 94-118. (442) Rostoker, W. Observations on the lattice parameters of the alpha solid solution in the titanium-
aluminum system. Trans. Am. Inst. Min. Metall. Eng. 1952, 194 (2), 212-213. (443) Rostoker, W. Observations on the lattice parameters of the alpha solid solution in the titanium-
aluminum system. J. Metals 1952, 4 (2), 212-213. (444) Jones, H. The effect on lattice parameter and hardness of manganese in extended solid solution
in aluminum. J. Mater. Sci. Lett. 1982, 1 (9), 405-406. (445) King, H.W. Quantitative size factors for metallic solid solutions. J. Mater. Sci. 1966, 1 (1), 79-90. (446) Wang, T.; Zhu, J.Z.; Mackay, R.A.; Chen, L.Q.; Liu, Z.K. Modeling of lattice parameter in the Ni-Al
system. Metall. Mater. Trans. A 2004, 35 (8), 2313-2321. (447) Hallstedt, B. Molar volumes of Al, Li, Mg and Si. CALPHAD 2007, 31 (2), 292-302. (448) Liu, X.T.; Oikawa, K. Assessment of temperature and pressure dependence of molar volume and
phase diagrams of binary Al-Si systems. Mater. Trans. 2014, 55 (11), 1673-1682. (449) Swaminathan, S.; Jones, I.P.; Maher, D.M.; Johnson, A.W.S.; Fraser, H.L. Debye-Waller factors in
off-stoichiometric gamma-TiAl: Effect of ordering of excess Al atoms on Ti sites. Philos. Mag. Lett. 1996, 73 (6), 319-330.
(450) Rossouw, C.J.; Gibson, M.A.; Forwood, C.T. Dynamical electron diffraction analysis of lattice parameters, Debye-Waller factors and order in Ti-Al and Ti-Ga alloys. Ultramicroscopy 1996, 66 (3-4), 193-209.
(451) Menon, E.S.K.; Fox, A.G. Debye-Waller factors of stoichiometric and Al-rich gamma-TiAl alloys. Philos. Mag. A 1998, 77 (3), 577-592.
(452) Ali, D.; Butt, M.Z.; Butt, S. The fundamental determining factor of angular emission of multiple charged ions ejected by laser ablation of different metals and their binary alloys. Mater. Chem. Phys. 2012, 137 (1), 147-153.
(453) Kagaya, H.M.; Serita, E.; Sato, M.; Soma, T. Lattice dynamics and Debye temperature of Al-Cu, Al-Si and Al-Ge alloy systems. Solid State Commun. 1996, 100 (10), 727-730.
(454) Kagaya, H.M.; Suzuki, T.; Takaya, M.S.; Soma, T. Solidus curve of the Al-Cu alloy system under pressure. Solid State Commun. 2000, 115 (9), 483-487.
(455) Mohan Rao, P.V.; Satyanarayana Murthy, K.; Suryanarayana, S.V.; Nagender Naidu, S.V. X-ray determination of the Debye-Waller factors and order parameters of Ni3Al alloys. J. Appl. Cryst. 1993, 26, 670-676.
(456) Nüchter, W.; Weickenmeier, A.L.; Mayer, J. High-precision measurement of temperature factors for NiAl by convergent-beam electron diffraction. Acta Cryst. A 1998, 54, 147-157.
(457) Mihalkcovic, M.; Elhor, H.; Suck, J.B. Atomic dynamics in Al-rich Al-Co alloys near the composition of the decagonal quasicrystal. Phys. Rev. B 2001, 63 (21), 214301.
(458) Butt, N.M.; Bashir, J.; Khan, M.N. Correlation of temperature factors with physical properties in cubic elements. J. Mater. Sci. 1993, 28 (6), 1595-1606.
(459) Butt, N.M.; Bashir, J.; Khan, M.N.; Willis, B.T.M. Micro-macro property correlation in cubic crystals. J. Mater. Sci. Lett. 1994, 13 (19), 1440-1442.
(460) Sirdeshmukh, D.B.; Sirdeshmukh, L.; Subhadra, K.G. Micro- and Macro-Properties of Solids: Thermal, Mechanical and Dielectric Properties. Springer Series in Materials Science, 80 (Hull, R., Osgood, R.M.J., Parisi, J., Warlimont, H., Eds.); Springer-Verlag: Berlin, Heidelberg, New York, 2006.
(461) Tsuda, K.; Yasuhara, A.; Tanaka, M. Two-dimensional mapping of polarizations of rhombohedral nanostructures in the tetragonal phase of BaTiO3 by the combined use of the scanning transmission electron microscopy and convergent-beam electron diffraction methods. Appl. Phys. Lett. 2013, 103 (8), 082908.

93
(462) Kim, K.H.; Zuo, J.M. Symmetry quantification and mapping using convergent-beam electron diffraction. Ultramicroscopy 2013, 124, 71-76.
(463) Kim, K.H.; Zuo, J.M. Convergent-beam electron diffraction pattern symmetry of nanodomains in complex lead-based perovskite crystals. Acta Cryst. A 2014, 70 (8), 583-590.
(464) Kim, K.H.; Payne, D.A.; Zuo, J.M. Determination of 60° polarization nanodomains in a relaxor-based ferroelectric single crystal. Appl. Phys. Lett. 2015, 107 (16), 162902.
(465) Shao, Y.T.; Zuo, J.M. Lattice-rotation vortex at the charged monoclinic domain boundary in a relaxor ferroelectric crystal. Phys. Rev. Lett. 2017, 118, 157601.