Softer and Soft X-rays in Macromolecular Crystallography
10
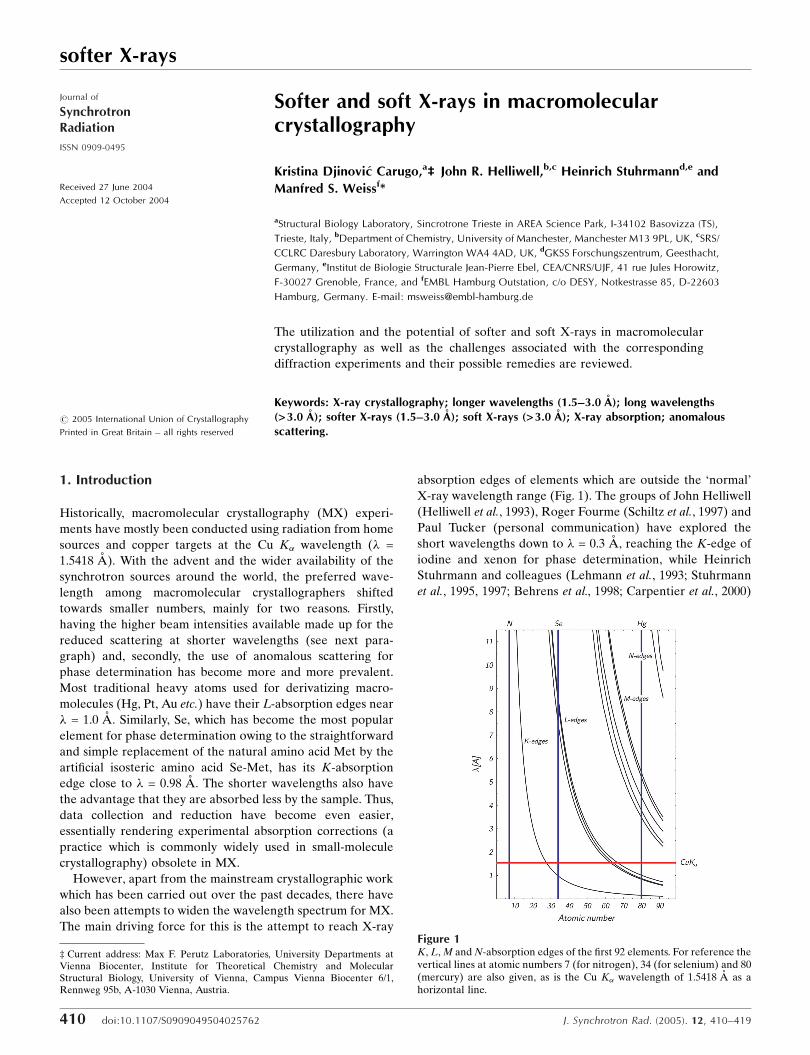
softer X-rays 410 doi:10.1107/S0909049504025762 J. Synchrotron Rad. (2005). 12, 410–419 Journal of Synchrotron Radiation ISSN 0909-0495 Received 27 June 2004 Accepted 12 October 2004 # 2005 International Union of Crystallography Printed in Great Britain – all rights reserved Softer and soft X-rays in macromolecular crystallography Kristina Djinovic ´ Carugo, a ‡ 2 John R. Helliwell, b,c Heinrich Stuhrmann d,e and Manfred S. Weiss f * a Structural Biology Laboratory, Sincrotrone Trieste in AREA Science Park, I-34102 Basovizza (TS), Trieste, Italy, b Department of Chemistry, University of Manchester, Manchester M13 9PL, UK, c SRS/ CCLRC Daresbury Laboratory, Warrington WA4 4AD, UK, d GKSS Forschungszentrum, Geesthacht, Germany, e Institut de Biologie Structurale Jean-Pierre Ebel, CEA/CNRS/UJF, 41 rue Jules Horowitz, F-30027 Grenoble, France, and f EMBL Hamburg Outstation, c/o DESY, Notkestrasse 85, D-22603 Hamburg, Germany. E-mail: [email protected] The utilization and the potential of softer and soft X-rays in macromolecular crystallography as well as the challenges associated with the corresponding diffraction experiments and their possible remedies are reviewed. Keywords: X-ray crystallography; longer wavelengths (1.5–3.0 A ˚ ); long wavelengths (> 3.0 A ˚ ); softer X-rays (1.5–3.0 A ˚ ); soft X-rays (> 3.0 A ˚ ); X-ray absorption; anomalous scattering. 1. Introduction Historically, macromolecular crystallography (MX) experi- ments have mostly been conducted using radiation from home sources and copper targets at the Cu K wavelength (! = 1.5418 A ˚ ). With the advent and the wider availability of the synchrotron sources around the world, the preferred wave- length among macromolecular crystallographers shifted towards smaller numbers, mainly for two reasons. Firstly, having the higher beam intensities available made up for the reduced scattering at shorter wavelengths (see next para- graph) and, secondly, the use of anomalous scattering for phase determination has become more and more prevalent. Most traditional heavy atoms used for derivatizing macro- molecules (Hg, Pt, Au etc.) have their L-absorption edges near ! = 1.0 A ˚ . Similarly, Se, which has become the most popular element for phase determination owing to the straightforward and simple replacement of the natural amino acid Met by the artificial isosteric amino acid Se-Met, has its K-absorption edge close to ! = 0.98 A ˚ . The shorter wavelengths also have the advantage that they are absorbed less by the sample. Thus, data collection and reduction have become even easier, essentially rendering experimental absorption corrections (a practice which is commonly widely used in small-molecule crystallography) obsolete in MX. However, apart from the mainstream crystallographic work which has been carried out over the past decades, there have also been attempts to widen the wavelength spectrum for MX. The main driving force for this is the attempt to reach X-ray absorption edges of elements which are outside the ‘normal’ X-ray wavelength range (Fig. 1). The groups of John Helliwell (Helliwell et al., 1993), Roger Fourme (Schiltz et al., 1997) and Paul Tucker (personal communication) have explored the short wavelengths down to ! = 0.3 A ˚ , reaching the K-edge of iodine and xenon for phase determination, while Heinrich Stuhrmann and colleagues (Lehmann et al., 1993; Stuhrmann et al., 1995, 1997; Behrens et al. , 1998; Carpentier et al., 2000) Figure 1 K, L, M and N-absorption edges of the first 92 elements. For reference the vertical lines at atomic numbers 7 (for nitrogen), 34 (for selenium) and 80 (mercury) are also given, as is the Cu K wavelength of 1.5418 A ˚ as a horizontal line. ‡ Current address: Max F. Perutz Laboratories, University Departments at Vienna Biocenter, Institute for Theoretical Chemistry and Molecular Structural Biology, University of Vienna, Campus Vienna Biocenter 6/1, Rennweg 95b, A-1030 Vienna, Austria.
-
Upload
independent -
Category
Documents
-
view
0 -
download
0
Transcript of Softer and Soft X-rays in Macromolecular Crystallography
softer X-rays
410 doi:10.1107/S0909049504025762 J. Synchrotron Rad. (2005). 12, 410–419
Journal of
SynchrotronRadiation
ISSN 0909-0495
Received 27 June 2004
Accepted 12 October 2004
# 2005 International Union of Crystallography
Printed in Great Britain – all rights reserved
Softer and soft X-rays in macromolecularcrystallography
Kristina Djinovic Carugo,a‡2John R. Helliwell,b,c Heinrich Stuhrmannd,e and
Manfred S. Weissf*
aStructural Biology Laboratory, Sincrotrone Trieste in AREA Science Park, I-34102 Basovizza (TS),
Trieste, Italy, bDepartment of Chemistry, University of Manchester, Manchester M13 9PL, UK, cSRS/
CCLRC Daresbury Laboratory, Warrington WA4 4AD, UK, dGKSS Forschungszentrum, Geesthacht,
Germany, eInstitut de Biologie Structurale Jean-Pierre Ebel, CEA/CNRS/UJF, 41 rue Jules Horowitz,
F-30027 Grenoble, France, and fEMBL Hamburg Outstation, c/o DESY, Notkestrasse 85, D-22603
Hamburg, Germany. E-mail: [email protected]
The utilization and the potential of softer and soft X-rays in macromolecular
crystallography as well as the challenges associated with the corresponding
diffraction experiments and their possible remedies are reviewed.
Keywords: X-ray crystallography; longer wavelengths (1.5–3.0 A); long wavelengths(>3.0 A); softer X-rays (1.5–3.0 A); soft X-rays (>3.0 A); X-ray absorption; anomalousscattering.
1. Introduction
Historically, macromolecular crystallography (MX) experi-
ments have mostly been conducted using radiation from home
sources and copper targets at the Cu K� wavelength (� =
1.5418 A). With the advent and the wider availability of the
synchrotron sources around the world, the preferred wave-
length among macromolecular crystallographers shifted
towards smaller numbers, mainly for two reasons. Firstly,
having the higher beam intensities available made up for the
reduced scattering at shorter wavelengths (see next para-
graph) and, secondly, the use of anomalous scattering for
phase determination has become more and more prevalent.
Most traditional heavy atoms used for derivatizing macro-
molecules (Hg, Pt, Au etc.) have their L-absorption edges near
� = 1.0 A. Similarly, Se, which has become the most popular
element for phase determination owing to the straightforward
and simple replacement of the natural amino acid Met by the
artificial isosteric amino acid Se-Met, has its K-absorption
edge close to � = 0.98 A. The shorter wavelengths also have
the advantage that they are absorbed less by the sample. Thus,
data collection and reduction have become even easier,
essentially rendering experimental absorption corrections (a
practice which is commonly widely used in small-molecule
crystallography) obsolete in MX.
However, apart from the mainstream crystallographic work
which has been carried out over the past decades, there have
also been attempts to widen the wavelength spectrum for MX.
The main driving force for this is the attempt to reach X-ray
absorption edges of elements which are outside the ‘normal’
X-ray wavelength range (Fig. 1). The groups of John Helliwell
(Helliwell et al., 1993), Roger Fourme (Schiltz et al., 1997) and
Paul Tucker (personal communication) have explored the
short wavelengths down to � = 0.3 A, reaching the K-edge of
iodine and xenon for phase determination, while Heinrich
Stuhrmann and colleagues (Lehmann et al., 1993; Stuhrmann
et al., 1995, 1997; Behrens et al., 1998; Carpentier et al., 2000)
Figure 1K, L, M and N-absorption edges of the first 92 elements. For reference thevertical lines at atomic numbers 7 (for nitrogen), 34 (for selenium) and 80(mercury) are also given, as is the Cu K� wavelength of 1.5418 A as ahorizontal line.
‡ Current address: Max F. Perutz Laboratories, University Departments atVienna Biocenter, Institute for Theoretical Chemistry and MolecularStructural Biology, University of Vienna, Campus Vienna Biocenter 6/1,Rennweg 95b, A-1030 Vienna, Austria.
have gone in the other direction and used long wavelengths up
to � = 6.0 A with the aim of obtaining anomalous diffraction
information from the naturally present phosphorus and sulfur
atoms in biological macromolecules. However, since rather
few beamlines for MX are operated at either � = 0.3 A or at
� = 6.0 A, and since the wavelength used restricts dmin to, at
best, �/2, neither the short-wavelength experiments nor the
long-wavelength experiments, respectively, have been
followed much.
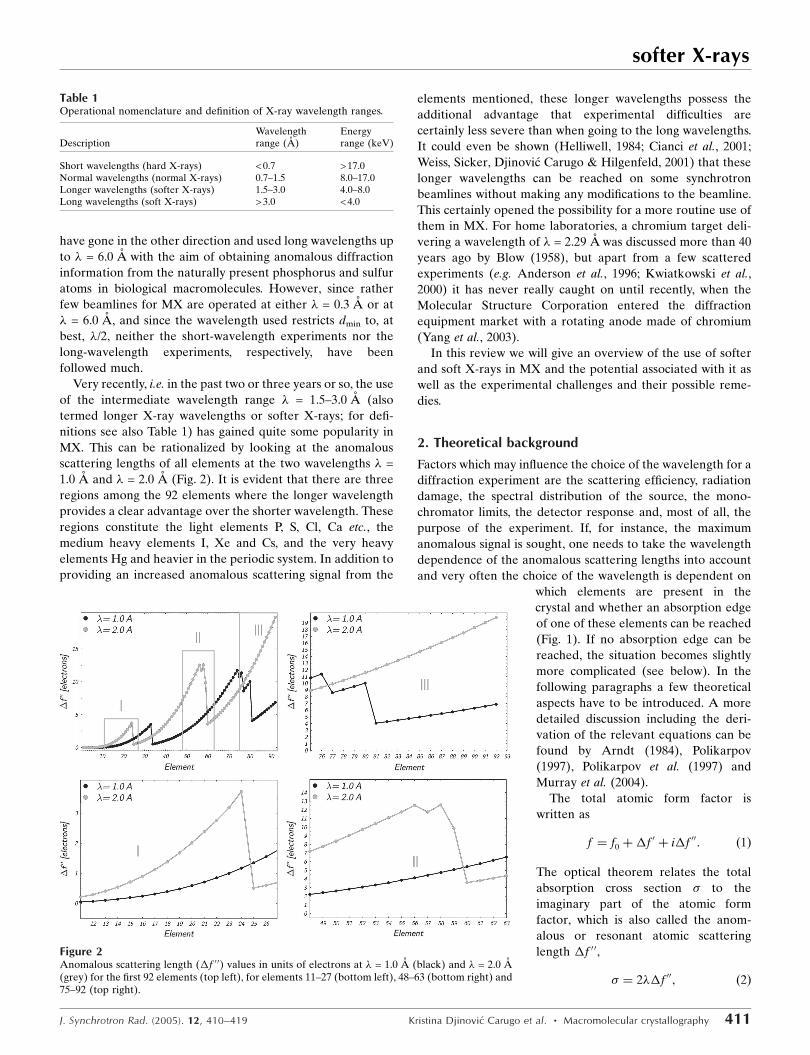
Very recently, i.e. in the past two or three years or so, the use
of the intermediate wavelength range � = 1.5–3.0 A (also
termed longer X-ray wavelengths or softer X-rays; for defi-
nitions see also Table 1) has gained quite some popularity in
MX. This can be rationalized by looking at the anomalous
scattering lengths of all elements at the two wavelengths � =
1.0 A and � = 2.0 A (Fig. 2). It is evident that there are three
regions among the 92 elements where the longer wavelength
provides a clear advantage over the shorter wavelength. These
regions constitute the light elements P, S, Cl, Ca etc., the
medium heavy elements I, Xe and Cs, and the very heavy
elements Hg and heavier in the periodic system. In addition to
providing an increased anomalous scattering signal from the
elements mentioned, these longer wavelengths possess the
additional advantage that experimental difficulties are
certainly less severe than when going to the long wavelengths.
It could even be shown (Helliwell, 1984; Cianci et al., 2001;
Weiss, Sicker, Djinovic Carugo & Hilgenfeld, 2001) that these
longer wavelengths can be reached on some synchrotron
beamlines without making any modifications to the beamline.
This certainly opened the possibility for a more routine use of
them in MX. For home laboratories, a chromium target deli-
vering a wavelength of � = 2.29 A was discussed more than 40
years ago by Blow (1958), but apart from a few scattered
experiments (e.g. Anderson et al., 1996; Kwiatkowski et al.,
2000) it has never really caught on until recently, when the
Molecular Structure Corporation entered the diffraction
equipment market with a rotating anode made of chromium
(Yang et al., 2003).
In this review we will give an overview of the use of softer
and soft X-rays in MX and the potential associated with it as
well as the experimental challenges and their possible reme-
dies.
2. Theoretical background
Factors which may influence the choice of the wavelength for a
diffraction experiment are the scattering efficiency, radiation
damage, the spectral distribution of the source, the mono-
chromator limits, the detector response and, most of all, the
purpose of the experiment. If, for instance, the maximum
anomalous signal is sought, one needs to take the wavelength
dependence of the anomalous scattering lengths into account
and very often the choice of the wavelength is dependent on
which elements are present in the
crystal and whether an absorption edge
of one of these elements can be reached
(Fig. 1). If no absorption edge can be
reached, the situation becomes slightly
more complicated (see below). In the
following paragraphs a few theoretical
aspects have to be introduced. A more
detailed discussion including the deri-
vation of the relevant equations can be
found by Arndt (1984), Polikarpov
(1997), Polikarpov et al. (1997) and
Murray et al. (2004).
The total atomic form factor is
written as
f ¼ f0 þ�f 0 þ i�f 00: ð1Þ
The optical theorem relates the total
absorption cross section � to the
imaginary part of the atomic form
factor, which is also called the anom-
alous or resonant atomic scattering
length �f 00,
� ¼ 2��f 00; ð2Þ
softer X-rays
J. Synchrotron Rad. (2005). 12, 410–419 Kristina Djinovic Carugo et al. � Macromolecular crystallography 411
Table 1Operational nomenclature and definition of X-ray wavelength ranges.
DescriptionWavelengthrange (A)
Energyrange (keV)
Short wavelengths (hard X-rays) < 0.7 > 17.0Normal wavelengths (normal X-rays) 0.7–1.5 8.0–17.0Longer wavelengths (softer X-rays) 1.5–3.0 4.0–8.0Long wavelengths (soft X-rays) > 3.0 < 4.0
Figure 2Anomalous scattering length (�f 0 0) values in units of electrons at � = 1.0 A (black) and � = 2.0 A(grey) for the first 92 elements (top left), for elements 11–27 (bottom left), 48–63 (bottom right) and75–92 (top right).

where �f 00 is expressed in units of the scattering length of one
electron. At wavelengths not too close to an X-ray absorption
edge, �f 00 increases with �2, therefore the total cross section
increases with �3. The linear absorption coefficient � can then
be calculated from the total absorption cross section using (3),
� ¼ N�; ð3Þ
with N being the number of atoms per unit volume. Conse-
quently, the relative decrease of the intensity I/I0 owing to
absorption is
I=I0 ¼ expð��xÞ; ð4Þ
where x is the path length of the X-ray beam in the specimen.
The integrated scattered X-ray intensity of a crystal as a
function of the wavelength � is given in (5) (see also Arndt,
1984),
I / �3x3 expð��xÞ= sinð2�Þ; ð5Þ
with 2� being the scattering angle. At small angles 2�, sin(2�)can be approximated by �/d and (5) reduces to
I / �2x3 expð��xÞ: ð6Þ
This shows that scattering increases with �2 but at the same
time absorption increases with �3. It has therefore been
argued by Helliwell (1993) and Teplyakov et al. (1998) that at
� [A] = (3/x [mm])1/3 the scattering efficiency is maximal,
which would call for longer wavelengths being more suitable
for smaller crystals. However, this argument is only valid in the
absence of radiation damage to the sample. In case the
purpose of the experiment is to obtain the maximum anom-
alous signal, the wavelength dependence of �f 00 needs to be
taken into account (see above). Remote from any absorption
edge, longer wavelengths will in many cases provide larger
signals (Fig. 2), but data collected at longer wavelengths will
also be contaminated with noise resulting from absorption
effects. Since in MX absorption is usually only treated impli-
citly at the scaling stage, it must be expected that one has to
compromise at some wavelength where the noise resulting
from absorption effects does not overwhelm the signal.
Preliminary studies in this context (Weiss, Sicker & Hilgen-
feld, 2001; Mueller-Dieckmann et al., 2004) point towards
wavelengths of about 1.9–2.3 A yielding the highest anom-
alous signal-to-noise ratio. It is feasible, however, that more
sophisticated data-collection procedures and/or data-reduc-
tion approaches may shift this optimum wavelength towards
higher numbers, which would provide even higher anomalous
effects.
3. What is possible with softer and soft X-rays?
As already mentioned above and shown in Fig. 2, softer X-rays
at � = 2.0 A provide a larger anomalous signal for many of the
first 92 elements than X-rays at � = 1.0 A. This immediately
leads to their potential use. One of the early applications of
softer X-rays in MX was the successful identification of Mn2+
in the structure of pea lectin by Helliwell and colleagues
(Einspahr et al., 1985) based on diffraction data collected at
the K-edge of Mn (� = 1.896 A). Similarly, So Iwata and his
colleagues (Ferreira et al., 2004) managed to establish the
architecture of the photosynthetic oxygen-evolving center
consisting of Mn2+ and Ca2+ ions by collecting diffraction data
at wavelengths on both sides of the Mn K-edge. The identifi-
cation of ions such as Cl� or Ca2+ and their distinction from
others such as Na+ or from water molecules has also been
reported a number of times (Weiss, Sicker, Djinovic Carugo &
Hilgenfeld, 2001; Weiss et al., 2002; Kuettner et al., 2002; Sekar
et al., 2004).
Apart from the identification or validation of ligands or ions
etc., the anomalous signal of metal ions which are present in
the native protein can also be easily and efficiently used for
ab initio phase determination. About 30% of all proteins are
metalloproteins, and many of them contain first-row transition
metals. Among the metals exhibiting a K-absorption edge in
the longer wavelength region (Fig. 1) are Cr, Mn, Fe and Co
with K-edges at � = 2.070, 1.896, 1.743 and 1.608 A, respec-
tively. These metals are in principle all amenable for a MAD
or SAD experiment. The pioneer experiment reporting the
successful use of the anomalous signal of iron was to our
knowledge performed on haemerythrin (Smith et al., 1983)
using Cu K� radiation, where the anomalous scattering length
of Fe amounts to about three electrons. Closer to the K-
absorption edge of Fe, �f 00 increases to about four electrons
(not taking the white line into account) but, in order to make
maximum use of this, access to synchrotron radiation is
mandatory. Owing to the scarcity of synchrotron beamlines at
that time and owing to the fact that the method was not widely
spread across the community, it took until 1988 before similar
experiments on ferredoxin (Murthy et al., 1988) and on
lamprey haemoglobin (Hendrickson et al., 1988) were under-
taken. Among the four bio-metals listed above, iron is
certainly and by far the most prominent and since then has
been used in increasingly challenging experiments, an example
being the structure determination of the cytochrome bc1
complex (Xia et al., 1997). To our knowledge, none of the
other three metals have so far been used successfully in a
MAD experiment (for a review, see Hendrickson, 1999), with
the one exception that Dauter and colleagues have shown that
a Mn-SAD experiment is also feasible (Ramagopal et al.,
2003).
An additional important advantage of softer X-rays is that
they provide the possibility of phase determination from the
light atoms alone. The first successful example was the
determination of the structure of crambin based on the
anomalous scattering of the native sulfur atoms using Cu K�
radiation (Hendrickson & Teeter, 1981). Almost 20 years later,
Zbyszek Dauter and colleagues rediscovered this approach in
the structure determination of the model protein lysozyme
(Dauter et al., 1999). Much of the renewed interest in using the
anomalous scattering of sulfur atoms for phase determination
can be traced back to the Dauter et al. (1999) paper, although
B. C. Wang had postulated as early as 1985 (Wang, 1985) that
the method should in principle be generally applicable. Dauter
et al. (1999) used synchrotron radiation at � = 1.54 A, but
some of the subsequent work was also performed on home
softer X-rays
412 Kristina Djinovic Carugo et al. � Macromolecular crystallography J. Synchrotron Rad. (2005). 12, 410–419

sources using Cu K� radiation (Yang & Pflugrath, 2001;
Debreczeni et al., 2003; Weiss, 2001). The photoprotein obelin
was to our knowledge the first protein, whose structure was
determined de novo by sulfur anomalous scattering at a longer
wavelength (� = 1.74 A) (Liu et al., 2000). Other recent
examples of successful structure determination by sulfur or
other light-atom anomalous scattering constitute both model
proteins such as thermolysin at various wavelengths between
1.5 and 2.64 A (Weiss, Sicker & Hilgenfeld, 2001), trypsin at
� = 1.54 A (Yang & Pflugrath, 2001), trypsin, insulin and
thaumatin at � = 1.54 A (Debreczeni et al., 2003) and glucose
isomerase and xylanase at � = 1.54 A and 1.74 A, respectively
(Ramagopal et al., 2003); also real-life cases such as the C1
subunit of �-crustacyanin at � = 1.77 A (Gordon et al., 2001),
the IGF2R fragment at � = 1.77 A (Brown et al., 2002), the
CAP-Gly domain at � = 1.74 A (Li et al., 2002), tryparedoxin
at � = 1.77 A (Micossi et al., 2002), the bubble protein at � =
1.54 A (Olsen et al., 2004) and lobster apocrustacyanin A1
(Cianci et al., 2001). In the latter case, the structure determi-
nation was based on a Xe derivative, but the anomalous
scattering of the S atoms present in a diffraction data set
collected at � = 2.00 A proved essential to establish the hand
of the xenon substructure. Since the obtainable anomalous
signal from the light atoms is usually small, diffraction data
must typically be collected to very high redundancy in order to
increase the signal-to-noise ratio (Dauter & Adamiak, 2001;
Weiss, 2001). This leads to an inevitable conflict with the
advent of radiation damage. However, even this can be turned
into an advantage as was postulated by Ravelli et al. (2003),
who proposed the method of radiation-damage-induced
phasing (RIP), in which the isomorphous differences intro-
duced into the structure by radiation damage form the basis
for phase determination. It is conceivable that a combination
of the RIP method with long-wavelength sulfur anomalous
scattering may have the potential to develop into a standard
phase-determination method. The recent successful de novo
structure determination of the �-subunit of dissimilarity sulfite
reductase at � = 1.90 A (Weiss et al., 2004) constitutes both the
proof-of-principle as well as the first real-life example of this.
The next candidate experiments which would benefit from
softer X-rays are crystal derivatizations with the medium
heavy elements. Using either the pressure derivatization with
Xe, the quick-soaking of protein crystals with I� (Dauter et al.,
2000), with I2/I� (Evans & Bricogne, 2002, 2003; Evans et al.,
2003) or with Cs+ solutions, useful derivatives of protein
crystals can be obtained and the increased anomalous signal
available at longer wavelengths provides advantages in phase
determination. As a matter of fact, the very first anomalous
scattering MX experiment at longer wavelengths was the study
on a caesium derivative of the polypeptide gramicidin (Phillips
& Hodgson, 1980). The experiment was conducted at the
L(III)-edge of Cs (� = 2.47 A), which has a strong white line,
very much similar to that of the rare earth ions. Further
example experiments are the structure determination of
apocrustacyanin A1 (two molecules of 20 kDa each in the
asymmetric unit) as mentioned above (Cianci et al., 2001), and
also the test experiments on a series of different wavelengths
performed on a xenon derivative of porcine pancreatic elas-
tase (Mueller-Dieckmann et al., 2004).
Last but not least, the very heavy elements such as U will
also exhibit a much larger anomalous signal when the
diffraction data are collected at longer wavelengths. An
extension of the quick-soaking method of Dauter and
colleagues to the use of UO22+ ions would therefore be an
attractive option. In pilot experiments (unpublished data) it
was shown by one of the authors (MSW) that this approach is
indeed feasible. If the M-edges of U, which are between � = 2.9
and 3.5 A, could be reached it was calculated by Hendrickson
& Ogata (1997) that one single U atom would actually be
sufficient to obtain phases for a molecule as large as the whole
ribosome. This is due to an intense white line at the M(V)-
edge of U, which can give rise to an anomalous scattering
length �f 00 of approximately 110 e�. Following up on this,
Hendrickson and colleagues (Liu et al., 2001) conducted a
successful feasibility experiment on NSLS beamline X4C
(Brookhaven, USA) at the uranium M(IV)-edge at � = 3.3 A.
The experiment was conducted in the dark as the image-plate
cover had to be removed to avoid absorption in the detector
front window. Independently, the large �f 0 0 value at the
uranium M(V)-edge at � = 3.5 A was confirmed experimen-
tally at the ESRF (Grenoble, France) in a MAD study on a
uranium derivative of lysozyme (Chesne, 2002).
Other potential experiments which could obviously benefit
from the use of longer wavelengths are the multiple-wave-
length anomalous solvent contrast experiments performed by
Fourme and colleagues and Kratky and colleagues (Fourme et
al., 1995; Ramin et al., 1999; Sauer et al., 2002), which
complement the methods of chemical or isotopical contrast
variation in X-ray and neutron crystallography, respectively,
the validation of molecular replacement solutions by a tech-
nique called MR-SAD (Schuermann & Tanner, 2003), or
single-molecule scattering (Miao et al., 2001; Helliwell, 2004).
4. Synchrotron beamlines with softer and soft X-raycapability
A survey of MX beamlines at European synchrotron facilities
shows that softer wavelengths are accessible at several
operational beamlines (Table 2). A clear trend towards the
coverage of longer wavelengths can be observed in the designs
of beamlines currently under construction, in the commis-
sioning phase or in the planning stage. This indicates that both
the general user community as well as the beamline staff have
started to appreciate a series of advantages offered by the
possibility of utilizing softer and soft X-rays for MX. As an
example for a beamline optimized for softer X-rays, the new
MX beamline 10 currently being built at the SRS will be
discussed in more detail in the next section.
5. A new MX beamline optimized for softer X-rays atthe SRS in Daresbury
A joint effort of research groups from several universities in
the northwest of the UK, two major pharmaceutical compa-
softer X-rays
J. Synchrotron Rad. (2005). 12, 410–419 Kristina Djinovic Carugo et al. � Macromolecular crystallography 413

nies (AstraZeneca and Astex-Technology)
and the CCLRC Daresbury Laboratory is
currently underway building beamline 10,
a new MAD beamline at the SRS on a new
high-field multipole wiggler source.
Beamline 10 is dedicated to MAD techni-
ques, operating in the 0.9–2.5 A wave-
length range, or the 13.8–5.0 keV photon
energy range (Table 2). In order to meet
the requirements of speed and tunability
necessary for this project, a new 2.4 T ten-
pole wiggler had to be developed by the
Daresbury project team staff. The optical
system contains a Rh-coated collimating
mirror, a double-crystal Si(111) mono-
chromator with horizontal sagittal
focusing, and finally a second Rh-coated
mirror for vertical focusing. The mono-
chromatic beam is optimized through a
200 mm � 200 mm collimator. The double-
crystal monochromator guarantees rapid
tunability and high-energy resolution
allowing data to be collected from small
weakly diffracting crystals over a wide
range of wavelengths. Since SRS is a
2 GeV storage ring, the beam intensity at
longer wavelengths is especially strong. In
order to make maximum use of this, the
beamline Be-window thickness has been
minimized. Moreover, to encourage longer
wavelength data collection the detector
can be tilted to a maximum angular
coverage of 2� = 110�. A full paper on the
beamline discussed here will be presented
separately at a later stage (Cianci et al.,
2005).
6. Experimental difficulties andpotential solutions
The collection of diffraction data at
wavelengths longer than those routinely
employed at both synchrotron and home
X-ray sources is complicated by a number
of experimental difficulties. Purely tech-
nical hitches include the physical mono-
chromator limits, the limitations caused by
the energy spectrum of synchrotron
sources or simply the lower detector effi-
ciency. Impediments inherently connected
to the experiments include the increased
absorption of X-rays at long wavelengths,
the scatter of primary and secondary
beams by air, the larger diffraction angles
and the occurrence of the third harmonic
reflections when Si(111) is used as a
monochromator. In the absence of an
softer X-rays
414 Kristina Djinovic Carugo et al. � Macromolecular crystallography J. Synchrotron Rad. (2005). 12, 410–419
Table 2Beamlines for MX at synchrotron facilities worldwide.
Facility Web page BeamlineWavelengthrange (A)
Energyrange (keV) Status†
EuropeANKA hikwww1.fzk.de/anka/ PX 0.62–3.10 20.0–4.0 OPBESSY www.bessy.de ID14-1 0.75–2.48 16.5–5.0 OP
ID14-2 0.75–2.48 16.5–5.0 OPID14-3 0.90 13.8 COM
DESY/EMBL www.embl-hamburg.de X31 0.70–1.80 17.7–6.9 OPX11 0.81 15.3 OPX12 0.72–2.07 17.2–6.0 COMX13 0.80 15.5 OPBW7A 0.77–1.80 16.1–6.9 OPBW7B 0.83 14.9 OP
DESY/MPG www-hasylab.desy.de BW6 0.65–2.10 19.1–5.9 OPDIAMOND www.diamond.ac.uk I02 0.50–2.50 24.8–5.0 CON
I03 0.50–2.50 24.8–5.0 CONI04 0.50–2.50 24.8–5.0 CONSoftX ? ? PL
ELETTRA www.elettra.trieste.it XRD1 0.50–3.1 24.8–4.0 OPXRD2 0.65–3.1 19.1–4.0 CON
ESRF www.esrf.fr ID14-1 0.93 13.3 OPID14-2 0.93 13.3 OPID14-3 0.93 13.3 OPID14-4 0.86–1.29 14.4–9.6 OPID23-1 0.60–2.88 20.7–4.3 OPID23-2 0.89 13.9 CONID29‡ 0.35–1.30/
0.80–2.4035.4–9.5/
15.5–5.2OP
BM14 0.70–1.80 17.7–6.9 OPBM16 0.73–2.00 17.0–6.2 OP
LURE www.lure.u-psud.fr DW32 1.00 12.4 CLMAXLAB www.maxlab.lu.se I911-1 1.10 11.3 CON
I911-2 1.03 12.0 CONI911-3 0.70–1.80 17.7–6.9 CONI911-4 0.91 13.6 CONI911-5 0.97 12.8 CONI711 0.80–1.60 15.5–7.7 OP
SLS sls.web.psi.ch PX1 0.71–2.48 17.5–5.0 OPPX2 0.62–2.48 20.0–5.0 CON
SRS www.srs.ac.uk 9.5 0.65–2.00 19.1–6.2 OP9.6 0.87 14.3 OP7.2 1.40–2.60 8.9–4.8 OP10.1 0.9–2.5 13.8–5.0 COM14.1§ 1.20/1.49 10.3/8.3 OP14.2§ 0.98/1.20 12.7/10.3 OP
SOLEIL www.synchrotron-soleil.fr ID10C 0.73–3.5 17.0–3.5 PLID10M 0.73–3.1 17.0–4.0 PL
North and South AmericaALS www-als.lbl.gov 4.2.2 0.69–2.1 18.0–6.0 OP
5.0.1 1.0 12.4 OP5.0.2 0.89–3.5 14.0–3.5 OP5.0.3 1.0 12.4 OP8.2.1 0.73–2.5 17.0–5.0 OP8.2.2 0.73–2.5 17.0–5.0 OP8.3.1 0.69–5.2 18.0–2.4 OP12.3.1 0.73–2.25 17.0–5.5 OP
APS www.aps.anl.gov 8-BM 0.84–1.9 14.7–6.5 COM14-BM-C 0.83–1.55 14.9–8.0 OP14-BM-D 0.69–1.77 18.0–7.0 OP14-ID 0.71–1.9 17.5–6.5 OP17-BM 0.62–2.1 20.0–6.0 OP17-ID 0.73–2.1 17.0–6.0 OP19-BM 0.92–2.1 13.5–6.0 OP19-ID 0.64–1.9 19.5–6.5 OP22-BM 0.62–2.1 20.0–6.0 OP22-ID 0.62–2.1 20.0–6.0 OP31-ID 0.50–2.8 25.0–4.5 COM
CAMD www.camd.lsu.edu GCPCC ? ? CONCHESS www.chess.cornell.edu A1 0.95 13.1 OP
F1 0.92 13.5 OPF2 0.77–1.57 16.0–7.9 OP
CLSI www.cls.usask.ca 08-ID.1 0.69–1.9 18.0–6.5 CON
experimental or an analytical absorption correction, the
increased absorption certainly represents the most severe
problem.
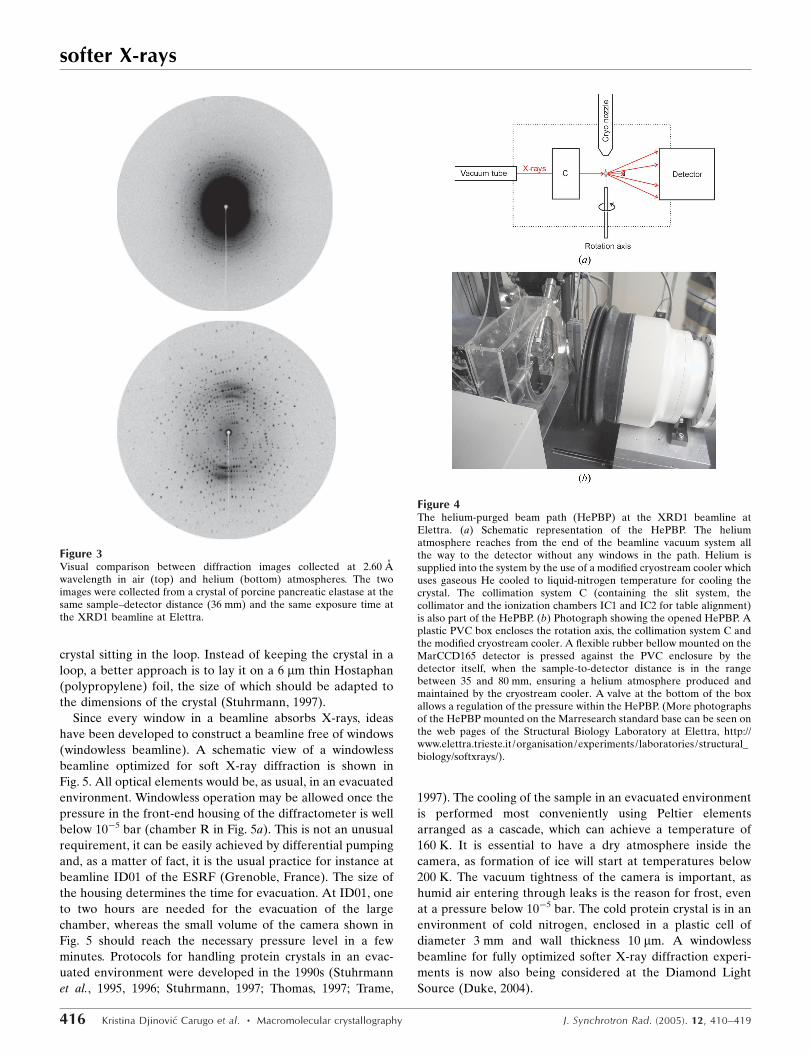
In order to reduce the strong absorption of softer and soft
X-rays in the air, the diffractometer has to be adapted in a way
as to keep both primary and secondary beams in a lower
absorbing and scattering atmosphere. The reduction of the
absorption cross section will decrease the losses of primary
and secondary photons, and therefore
lower the exposure times of the sample to
X-rays. Lowering the scattering cross
section will on the other hand decrease the
background level and therefore increase
the signal-to-noise ratio of the diffraction
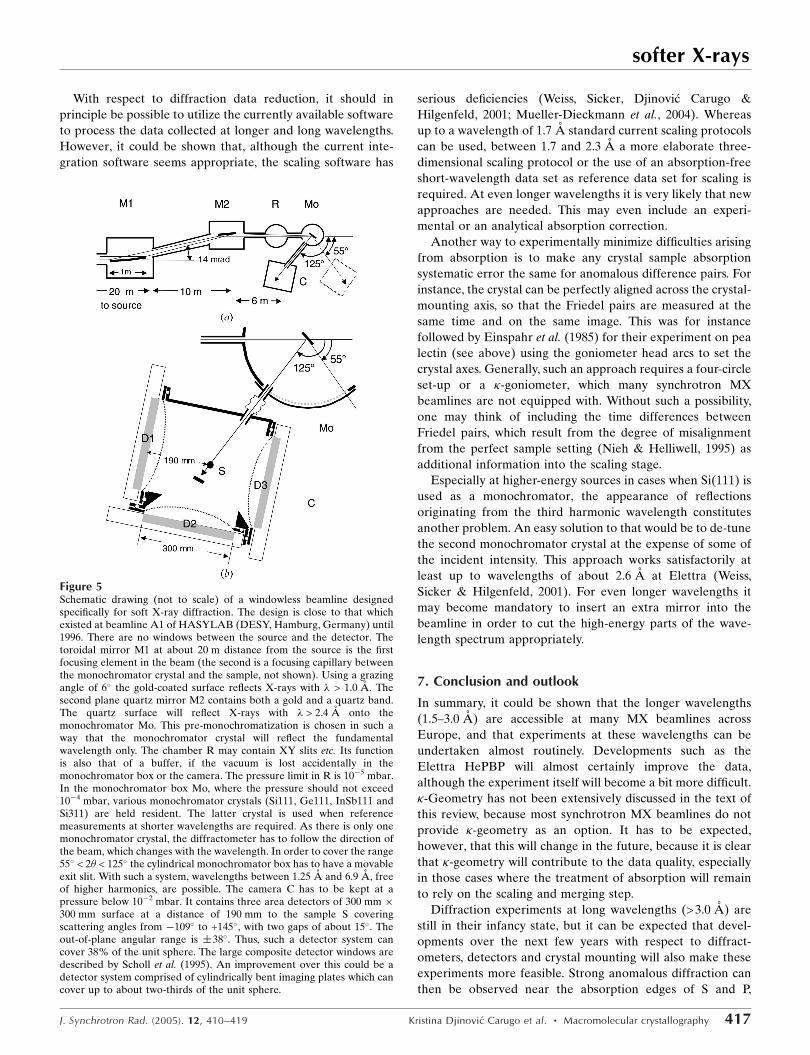
images. The construction of the helium-
purged beam path (HePBP) implemented
at Elettra (Polentarutti et al., 2004) was
driven by the fact that the scattering and
absorption of X-rays by helium is by two to
three orders of magnitude lower than by
air (Table 3, Fig. 3). The HePBP matches
the requirements mentioned above by
enclosing the complete path of the primary
beam (from the last beamline Kapton
window to the crystal sample) and of the
secondary beams region (from the sample
to the detector surface), avoiding any
window along the beam path (Fig. 4).
Moreover, it allows the use of only slightly
modified conventional cryo-cooling
instrumentation for sample mounting and
data collection.
For diffraction experiments at longer
wavelengths of up to 6.0 A, the require-
ments are even more strict. Whereas the
diffraction experiments at Elettra carried
out using softer X-rays certainly benefit
from the reduced absorption in the
HePBP, the use of helium becomes an
absolute requirement when trying to
utilize the soft X-rays at wavelengths
greater than 3.0 A. At beamline ID01 at the ESRF (Grenoble,
France) the X-ray optics allow the use of wavelengths between
0.3 and 5.9 A, which would in principle allow even the K-edge
of P to be reached (Carpentier et al., 2002; Biou et al., 2005).
Heinrich Stuhrmann and his colleagues have taken an
approach similar to the one which was realised in the Elettra
design of the HePBP. The whole diffraction experiment has to
be carried out in a helium atmosphere (Carpentier et al., 2002),
which requires that the detector also be made part of the
assembly. The system at ID01 includes a cylindrical detector
set-up, which has the additional advantage that diffraction
angles of up to 150� can be recorded, roughly corresponding to
a resolution of dmin = 3.1 A at � = 5.9 A. Test experiments on a
crystal of lysozyme at wavelengths between 2.7 A and 5.7 A
and diffraction angles between�15� and +75� showed that the
system performance is promising. However, in the present
assembly the detector can only be read out offline, which
makes routine use difficult and tedious. A possible alternative
to a cylindrical detector could be the use of a swing-out (2�)
angle for the detector, but this in turn would almost certainly
lead to an increase in the total data-collection time. In addi-
tion to the requirements for the diffractometer and the
detector, the crystal must be made accessible to soft X-rays,
which requires the removal of the solvent layer from the
softer X-rays
J. Synchrotron Rad. (2005). 12, 410–419 Kristina Djinovic Carugo et al. � Macromolecular crystallography 415
Table 2 (continued)
Facility Web page BeamlineWavelengthrange (A)
Energyrange (keV) Status†
LNLS www.lnls.br D03B 1.0–2.0 12.4–6.2 OPNSLS www.nsls.bnl.gov X4A 0.41–3.1 30.0–4.0 OP
X4C 0.62–1.77 20.0–7.0 OPX6A 0.62–1.77 20.0–7.0 OPX8C 0.65–2.48 19.0–5.0 OPX9A 0.84–1.85 14.8–6.7 OPX9B 0.90–2.48 13.8–5.0 OPX12B 0.95–1.61 13.1–7.7 OPX12C 0.95–1.55 13.0–8.0 OPX25 0.4–4.1 28.0–3.0 OPX26C ? ? OP
SSRL www-ssrl.slac.stanford.edu BL1-5 0.77–2.1 16.0–6.0 OPBL7-1 1.08 11.5 OPBL9-1 0.73–1.0 17.0–12.4 OPBL9-2 0.60–2.1 20.7–6.0 OPBL11-1 0.82–1.20 15.1–10.3 OPBL11-3 ? ? CON
Asia, AustraliaAustralian
Synchrotronwww.synchrotron.vic.gov.au 1 0.54–6.2 23.0–2.0 CON
2 0.62–2.25 20.0–5.5 CONNSRL www.nsrl.ustc.edu.cn U7B 1.0–3.0 12.4–4.1 CONPhoton Factory pfwww.kek.jp BL-5 ? ? ?
BL-6A 0.80–1.8 15.5–6.9 OPBL-6B 0.90–1.8 13.8–6.9 OPBL-6C 0.90–1.8 13.8–6.9 OPAR-NW12 ? ? ?
SPring-8 www.spring8.or.jp BL26B1 0.73–2.1 17.0–6.0 OPBL26B2 0.73–2.1 17.0–6.0 OPBL40B2 0.69–1.77 18.0–7.0 OPBL41XU‡ 0.34–0.65/
0.7–1.937.0–19.0/
17.5–6.5OP
BL44XU 0.77–1.4 16.0–9.0 OPBL44B20 0.4–2.1 30.0–6.0 OPBL45XU ? ? ?
† OP: in operation; COM: commisioning stage; CON: under construction; PL: planning stage; CL: closed. ‡ Twowavelength ranges possible. § Two fixed wavelength settings possible.
Table 2 (continued)
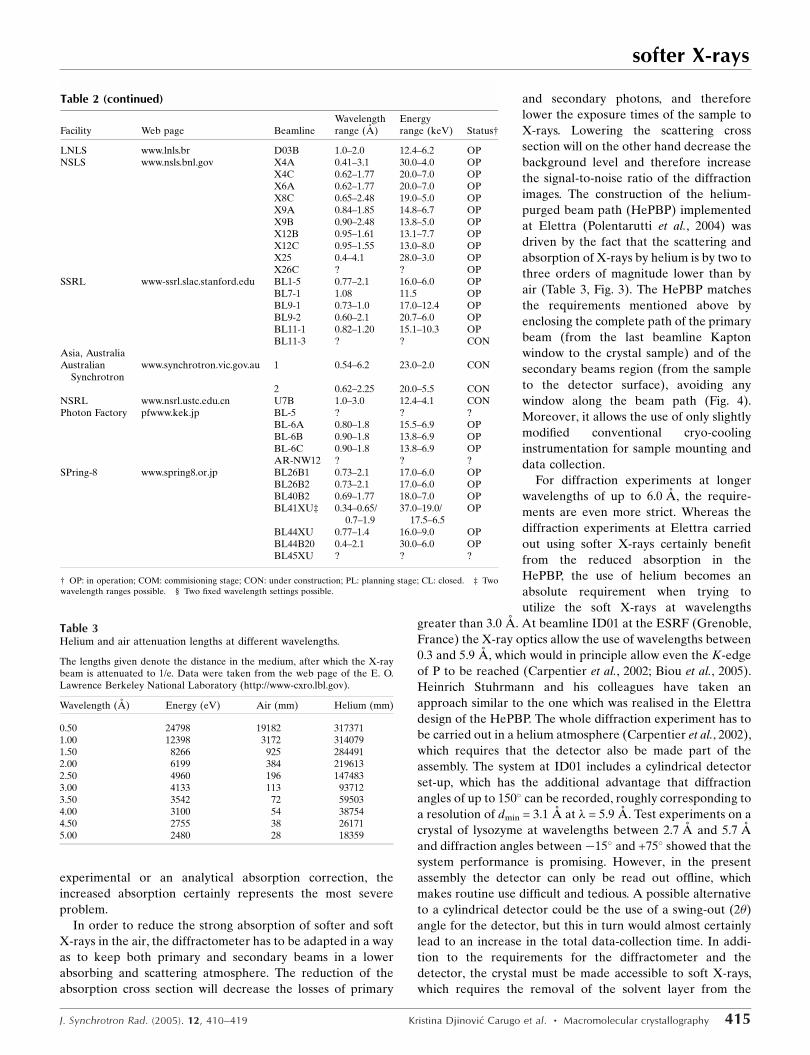
Table 3Helium and air attenuation lengths at different wavelengths.
The lengths given denote the distance in the medium, after which the X-raybeam is attenuated to 1/e. Data were taken from the web page of the E. O.Lawrence Berkeley National Laboratory (http://www-cxro.lbl.gov).
Wavelength (A) Energy (eV) Air (mm) Helium (mm)
0.50 24798 19182 3173711.00 12398 3172 3140791.50 8266 925 2844912.00 6199 384 2196132.50 4960 196 1474833.00 4133 113 937123.50 3542 72 595034.00 3100 54 387544.50 2755 38 261715.00 2480 28 18359
crystal sitting in the loop. Instead of keeping the crystal in a
loop, a better approach is to lay it on a 6 mm thin Hostaphan
(polypropylene) foil, the size of which should be adapted to
the dimensions of the crystal (Stuhrmann, 1997).
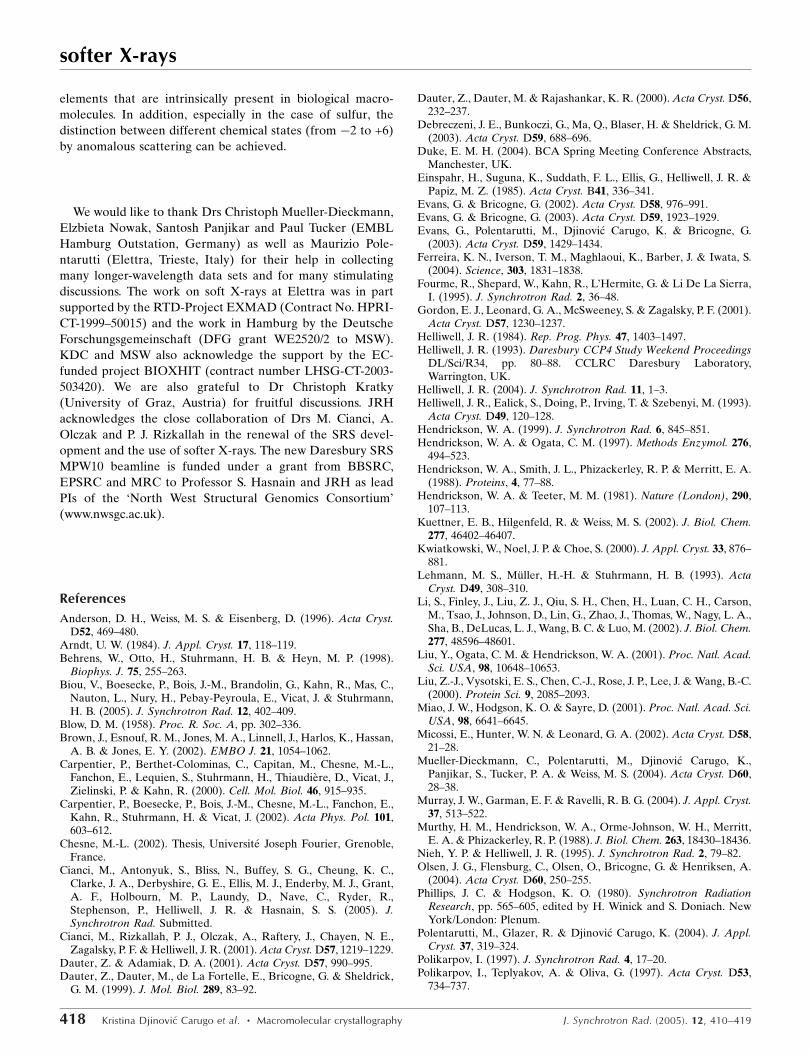
Since every window in a beamline absorbs X-rays, ideas
have been developed to construct a beamline free of windows
(windowless beamline). A schematic view of a windowless
beamline optimized for soft X-ray diffraction is shown in
Fig. 5. All optical elements would be, as usual, in an evacuated
environment. Windowless operation may be allowed once the
pressure in the front-end housing of the diffractometer is well
below 10�5 bar (chamber R in Fig. 5a). This is not an unusual
requirement, it can be easily achieved by differential pumping
and, as a matter of fact, it is the usual practice for instance at
beamline ID01 of the ESRF (Grenoble, France). The size of
the housing determines the time for evacuation. At ID01, one
to two hours are needed for the evacuation of the large
chamber, whereas the small volume of the camera shown in
Fig. 5 should reach the necessary pressure level in a few
minutes. Protocols for handling protein crystals in an evac-
uated environment were developed in the 1990s (Stuhrmann
et al., 1995, 1996; Stuhrmann, 1997; Thomas, 1997; Trame,
1997). The cooling of the sample in an evacuated environment
is performed most conveniently using Peltier elements
arranged as a cascade, which can achieve a temperature of
160 K. It is essential to have a dry atmosphere inside the
camera, as formation of ice will start at temperatures below
200 K. The vacuum tightness of the camera is important, as
humid air entering through leaks is the reason for frost, even
at a pressure below 10�5 bar. The cold protein crystal is in an
environment of cold nitrogen, enclosed in a plastic cell of
diameter 3 mm and wall thickness 10 mm. A windowless
beamline for fully optimized softer X-ray diffraction experi-
ments is now also being considered at the Diamond Light
Source (Duke, 2004).
softer X-rays
416 Kristina Djinovic Carugo et al. � Macromolecular crystallography J. Synchrotron Rad. (2005). 12, 410–419
Figure 3Visual comparison between diffraction images collected at 2.60 Awavelength in air (top) and helium (bottom) atmospheres. The twoimages were collected from a crystal of porcine pancreatic elastase at thesame sample–detector distance (36 mm) and the same exposure time atthe XRD1 beamline at Elettra.
Figure 4The helium-purged beam path (HePBP) at the XRD1 beamline atElettra. (a) Schematic representation of the HePBP. The heliumatmosphere reaches from the end of the beamline vacuum system allthe way to the detector without any windows in the path. Helium issupplied into the system by the use of a modified cryostream cooler whichuses gaseous He cooled to liquid-nitrogen temperature for cooling thecrystal. The collimation system C (containing the slit system, thecollimator and the ionization chambers IC1 and IC2 for table alignment)is also part of the HePBP. (b) Photograph showing the opened HePBP. Aplastic PVC box encloses the rotation axis, the collimation system C andthe modified cryostream cooler. A flexible rubber bellow mounted on theMarCCD165 detector is pressed against the PVC enclosure by thedetector itself, when the sample-to-detector distance is in the rangebetween 35 and 80 mm, ensuring a helium atmosphere produced andmaintained by the cryostream cooler. A valve at the bottom of the boxallows a regulation of the pressure within the HePBP. (More photographsof the HePBP mounted on the Marresearch standard base can be seen onthe web pages of the Structural Biology Laboratory at Elettra, http://www.elettra.trieste.it/organisation/experiments/laboratories/structural_biology/softxrays/).
With respect to diffraction data reduction, it should in
principle be possible to utilize the currently available software
to process the data collected at longer and long wavelengths.
However, it could be shown that, although the current inte-
gration software seems appropriate, the scaling software has
serious deficiencies (Weiss, Sicker, Djinovic Carugo &
Hilgenfeld, 2001; Mueller-Dieckmann et al., 2004). Whereas
up to a wavelength of 1.7 A standard current scaling protocols
can be used, between 1.7 and 2.3 A a more elaborate three-
dimensional scaling protocol or the use of an absorption-free
short-wavelength data set as reference data set for scaling is
required. At even longer wavelengths it is very likely that new
approaches are needed. This may even include an experi-
mental or an analytical absorption correction.
Another way to experimentally minimize difficulties arising
from absorption is to make any crystal sample absorption
systematic error the same for anomalous difference pairs. For
instance, the crystal can be perfectly aligned across the crystal-
mounting axis, so that the Friedel pairs are measured at the
same time and on the same image. This was for instance
followed by Einspahr et al. (1985) for their experiment on pea
lectin (see above) using the goniometer head arcs to set the
crystal axes. Generally, such an approach requires a four-circle
set-up or a �-goniometer, which many synchrotron MX
beamlines are not equipped with. Without such a possibility,
one may think of including the time differences between
Friedel pairs, which result from the degree of misalignment
from the perfect sample setting (Nieh & Helliwell, 1995) as
additional information into the scaling stage.
Especially at higher-energy sources in cases when Si(111) is
used as a monochromator, the appearance of reflections
originating from the third harmonic wavelength constitutes
another problem. An easy solution to that would be to de-tune
the second monochromator crystal at the expense of some of
the incident intensity. This approach works satisfactorily at
least up to wavelengths of about 2.6 A at Elettra (Weiss,
Sicker & Hilgenfeld, 2001). For even longer wavelengths it
may become mandatory to insert an extra mirror into the
beamline in order to cut the high-energy parts of the wave-
length spectrum appropriately.
7. Conclusion and outlook
In summary, it could be shown that the longer wavelengths
(1.5–3.0 A) are accessible at many MX beamlines across
Europe, and that experiments at these wavelengths can be
undertaken almost routinely. Developments such as the
Elettra HePBP will almost certainly improve the data,
although the experiment itself will become a bit more difficult.
�-Geometry has not been extensively discussed in the text of
this review, because most synchrotron MX beamlines do not
provide �-geometry as an option. It has to be expected,
however, that this will change in the future, because it is clear
that �-geometry will contribute to the data quality, especially
in those cases where the treatment of absorption will remain
to rely on the scaling and merging step.
Diffraction experiments at long wavelengths (>3.0 A) are
still in their infancy state, but it can be expected that devel-
opments over the next few years with respect to diffract-
ometers, detectors and crystal mounting will also make these
experiments more feasible. Strong anomalous diffraction can
then be observed near the absorption edges of S and P,
softer X-rays
J. Synchrotron Rad. (2005). 12, 410–419 Kristina Djinovic Carugo et al. � Macromolecular crystallography 417
Figure 5Schematic drawing (not to scale) of a windowless beamline designedspecifically for soft X-ray diffraction. The design is close to that whichexisted at beamline A1 of HASYLAB (DESY, Hamburg, Germany) until1996. There are no windows between the source and the detector. Thetoroidal mirror M1 at about 20 m distance from the source is the firstfocusing element in the beam (the second is a focusing capillary betweenthe monochromator crystal and the sample, not shown). Using a grazingangle of 6� the gold-coated surface reflects X-rays with � > 1.0 A. Thesecond plane quartz mirror M2 contains both a gold and a quartz band.The quartz surface will reflect X-rays with � > 2.4 A onto themonochromator Mo. This pre-monochromatization is chosen in such away that the monochromator crystal will reflect the fundamentalwavelength only. The chamber R may contain XY slits etc. Its functionis also that of a buffer, if the vacuum is lost accidentally in themonochromator box or the camera. The pressure limit in R is 10�5 mbar.In the monochromator box Mo, where the pressure should not exceed10�4 mbar, various monochromator crystals (Si111, Ge111, InSb111 andSi311) are held resident. The latter crystal is used when referencemeasurements at shorter wavelengths are required. As there is only onemonochromator crystal, the diffractometer has to follow the direction ofthe beam, which changes with the wavelength. In order to cover the range55� < 2� < 125� the cylindrical monochromator box has to have a movableexit slit. With such a system, wavelengths between 1.25 A and 6.9 A, freeof higher harmonics, are possible. The camera C has to be kept at apressure below 10�2 mbar. It contains three area detectors of 300 mm �300 mm surface at a distance of 190 mm to the sample S coveringscattering angles from �109� to +145�, with two gaps of about 15�. Theout-of-plane angular range is �38�. Thus, such a detector system cancover 38% of the unit sphere. The large composite detector windows aredescribed by Scholl et al. (1995). An improvement over this could be adetector system comprised of cylindrically bent imaging plates which cancover up to about two-thirds of the unit sphere.
elements that are intrinsically present in biological macro-
molecules. In addition, especially in the case of sulfur, the
distinction between different chemical states (from �2 to +6)
by anomalous scattering can be achieved.
We would like to thank Drs Christoph Mueller-Dieckmann,
Elzbieta Nowak, Santosh Panjikar and Paul Tucker (EMBL
Hamburg Outstation, Germany) as well as Maurizio Pole-
ntarutti (Elettra, Trieste, Italy) for their help in collecting
many longer-wavelength data sets and for many stimulating
discussions. The work on soft X-rays at Elettra was in part
supported by the RTD-Project EXMAD (Contract No. HPRI-
CT-1999–50015) and the work in Hamburg by the Deutsche
Forschungsgemeinschaft (DFG grant WE2520/2 to MSW).
KDC and MSW also acknowledge the support by the EC-
funded project BIOXHIT (contract number LHSG-CT-2003-
503420). We are also grateful to Dr Christoph Kratky
(University of Graz, Austria) for fruitful discussions. JRH
acknowledges the close collaboration of Drs M. Cianci, A.
Olczak and P. J. Rizkallah in the renewal of the SRS devel-
opment and the use of softer X-rays. The new Daresbury SRS
MPW10 beamline is funded under a grant from BBSRC,
EPSRC and MRC to Professor S. Hasnain and JRH as lead
PIs of the ‘North West Structural Genomics Consortium’
(www.nwsgc.ac.uk).
References
Anderson, D. H., Weiss, M. S. & Eisenberg, D. (1996). Acta Cryst.D52, 469–480.
Arndt, U. W. (1984). J. Appl. Cryst. 17, 118–119.Behrens, W., Otto, H., Stuhrmann, H. B. & Heyn, M. P. (1998).
Biophys. J. 75, 255–263.Biou, V., Boesecke, P., Bois, J.-M., Brandolin, G., Kahn, R., Mas, C.,
Nauton, L., Nury, H., Pebay-Peyroula, E., Vicat, J. & Stuhrmann,H. B. (2005). J. Synchrotron Rad. 12, 402–409.
Blow, D. M. (1958). Proc. R. Soc. A, pp. 302–336.Brown, J., Esnouf, R. M., Jones, M. A., Linnell, J., Harlos, K., Hassan,
A. B. & Jones, E. Y. (2002). EMBO J. 21, 1054–1062.Carpentier, P., Berthet-Colominas, C., Capitan, M., Chesne, M.-L.,
Fanchon, E., Lequien, S., Stuhrmann, H., Thiaudiere, D., Vicat, J.,Zielinski, P. & Kahn, R. (2000). Cell. Mol. Biol. 46, 915–935.
Carpentier, P., Boesecke, P., Bois, J.-M., Chesne, M.-L., Fanchon, E.,Kahn, R., Stuhrmann, H. & Vicat, J. (2002). Acta Phys. Pol. 101,603–612.
Chesne, M.-L. (2002). Thesis, Universite Joseph Fourier, Grenoble,France.
Cianci, M., Antonyuk, S., Bliss, N., Buffey, S. G., Cheung, K. C.,Clarke, J. A., Derbyshire, G. E., Ellis, M. J., Enderby, M. J., Grant,A. F., Holbourn, M. P., Laundy, D., Nave, C., Ryder, R.,Stephenson, P., Helliwell, J. R. & Hasnain, S. S. (2005). J.Synchrotron Rad. Submitted.
Cianci, M., Rizkallah, P. J., Olczak, A., Raftery, J., Chayen, N. E.,Zagalsky, P. F. & Helliwell, J. R. (2001). Acta Cryst. D57, 1219–1229.
Dauter, Z. & Adamiak, D. A. (2001). Acta Cryst. D57, 990–995.Dauter, Z., Dauter, M., de La Fortelle, E., Bricogne, G. & Sheldrick,
G. M. (1999). J. Mol. Biol. 289, 83–92.
Dauter, Z., Dauter, M. & Rajashankar, K. R. (2000). Acta Cryst. D56,232–237.
Debreczeni, J. E., Bunkoczi, G., Ma, Q., Blaser, H. & Sheldrick, G. M.(2003). Acta Cryst. D59, 688–696.
Duke, E. M. H. (2004). BCA Spring Meeting Conference Abstracts,Manchester, UK.
Einspahr, H., Suguna, K., Suddath, F. L., Ellis, G., Helliwell, J. R. &Papiz, M. Z. (1985). Acta Cryst. B41, 336–341.
Evans, G. & Bricogne, G. (2002). Acta Cryst. D58, 976–991.Evans, G. & Bricogne, G. (2003). Acta Cryst. D59, 1923–1929.Evans, G., Polentarutti, M., Djinovic Carugo, K. & Bricogne, G.
(2003). Acta Cryst. D59, 1429–1434.Ferreira, K. N., Iverson, T. M., Maghlaoui, K., Barber, J. & Iwata, S.
(2004). Science, 303, 1831–1838.Fourme, R., Shepard, W., Kahn, R., L’Hermite, G. & Li De La Sierra,
I. (1995). J. Synchrotron Rad. 2, 36–48.Gordon, E. J., Leonard, G. A., McSweeney, S. & Zagalsky, P. F. (2001).
Acta Cryst. D57, 1230–1237.Helliwell, J. R. (1984). Rep. Prog. Phys. 47, 1403–1497.Helliwell, J. R. (1993). Daresbury CCP4 Study Weekend Proceedings
DL/Sci/R34, pp. 80–88. CCLRC Daresbury Laboratory,Warrington, UK.
Helliwell, J. R. (2004). J. Synchrotron Rad. 11, 1–3.Helliwell, J. R., Ealick, S., Doing, P., Irving, T. & Szebenyi, M. (1993).
Acta Cryst. D49, 120–128.Hendrickson, W. A. (1999). J. Synchrotron Rad. 6, 845–851.Hendrickson, W. A. & Ogata, C. M. (1997). Methods Enzymol. 276,
494–523.Hendrickson, W. A., Smith, J. L., Phizackerley, R. P. & Merritt, E. A.
(1988). Proteins, 4, 77–88.Hendrickson, W. A. & Teeter, M. M. (1981). Nature (London), 290,
107–113.Kuettner, E. B., Hilgenfeld, R. & Weiss, M. S. (2002). J. Biol. Chem.
277, 46402–46407.Kwiatkowski, W., Noel, J. P. & Choe, S. (2000). J. Appl. Cryst. 33, 876–
881.Lehmann, M. S., Muller, H.-H. & Stuhrmann, H. B. (1993). Acta
Cryst. D49, 308–310.Li, S., Finley, J., Liu, Z. J., Qiu, S. H., Chen, H., Luan, C. H., Carson,
M., Tsao, J., Johnson, D., Lin, G., Zhao, J., Thomas, W., Nagy, L. A.,Sha, B., DeLucas, L. J., Wang, B. C. & Luo, M. (2002). J. Biol. Chem.277, 48596–48601.
Liu, Y., Ogata, C. M. & Hendrickson, W. A. (2001). Proc. Natl. Acad.Sci. USA, 98, 10648–10653.
Liu, Z.-J., Vysotski, E. S., Chen, C.-J., Rose, J. P., Lee, J. & Wang, B.-C.(2000). Protein Sci. 9, 2085–2093.
Miao, J. W., Hodgson, K. O. & Sayre, D. (2001). Proc. Natl. Acad. Sci.USA, 98, 6641–6645.
Micossi, E., Hunter, W. N. & Leonard, G. A. (2002). Acta Cryst. D58,21–28.
Mueller-Dieckmann, C., Polentarutti, M., Djinovic Carugo, K.,Panjikar, S., Tucker, P. A. & Weiss, M. S. (2004). Acta Cryst. D60,28–38.
Murray, J. W., Garman, E. F. & Ravelli, R. B. G. (2004). J. Appl. Cryst.37, 513–522.
Murthy, H. M., Hendrickson, W. A., Orme-Johnson, W. H., Merritt,E. A. & Phizackerley, R. P. (1988). J. Biol. Chem. 263, 18430–18436.
Nieh, Y. P. & Helliwell, J. R. (1995). J. Synchrotron Rad. 2, 79–82.Olsen, J. G., Flensburg, C., Olsen, O., Bricogne, G. & Henriksen, A.
(2004). Acta Cryst. D60, 250–255.Phillips, J. C. & Hodgson, K. O. (1980). Synchrotron Radiation
Research, pp. 565–605, edited by H. Winick and S. Doniach. NewYork/London: Plenum.
Polentarutti, M., Glazer, R. & Djinovic Carugo, K. (2004). J. Appl.Cryst. 37, 319–324.
Polikarpov, I. (1997). J. Synchrotron Rad. 4, 17–20.Polikarpov, I., Teplyakov, A. & Oliva, G. (1997). Acta Cryst. D53,
734–737.
softer X-rays
418 Kristina Djinovic Carugo et al. � Macromolecular crystallography J. Synchrotron Rad. (2005). 12, 410–419
Ramagopal, U. A., Dauter, M. & Dauter, Z. (2003). Acta Cryst. D59,1020–1027.
Ramin, M., Shepard, W., Fourme, R. & Kahn, R. (1999). Acta Cryst.D55, 157–167.
Ravelli, R. B., Leiros, H. K., Pan, B., Caffrey, M. & McSweeney, S.(2003). Structure, 11, 217–224.
Sauer, O., Roth, M., Schirmer, T., Rummel, G. & Kratky, C. (2002).Acta Cryst. D58, 60–69.
Schiltz, M., Kvick, A., Svensson, O. S., Shepard, W., de La Fortelle, E.,Prange, T., Kahn, R., Bricogne, G. & Fourme, R. (1997). J.Synchrotron Rad. 4, 287–297.
Scholl, G., Dauvergne, F., Gabriel, A., Hutsch, M., Marmotti, M.,Sayers, S., Stuhrmann, S., Thomas, J., Trame, C. & Stuhrmann, H. B.(1995). Nucl. Instrum. Methods, B97, 303–307.
Schuermann, J. P. & Tanner, J. J. (2003). Acta Cryst. D59, 1731–1736.Sekar, K., Rajakannan, V., Velmurugan, D., Yamane, T., Thirumur-
ugan, R., Dauter, M. & Dauter, Z. (2004). Acta Cryst. D60, 1586–1590.
Smith, J. L., Hendrickson, W. A. & Addison, A. W. (1983). Nature(London), 303, 86–88.
Stuhrmann, S. (1997). Thesis, University of Hamburg, Germany.Stuhrmann, S., Bartels, K. S., Braunwarth, W., Doose, R., Dauvergne,
F., Gabriel, A., Knochel, A., Marmotti, M., Stuhrmann, H. B.,Trame, C. & Lehmann, M. S. (1997). J. Synchrotron Rad. 4, 298–310.
Stuhrmann, S., Bartels, K. S., Hutsch, M., Marmotti, M., Sayers, Z.,Thomas, J., Trame, C. & Stuhrmann, H. B. (1996). Structural Studiesof Crystals, pp. 276–288. Moscow: Nauka Fizmatlit. (In Russian.)
Stuhrmann, S., Hutsch, M., Trame, C., Thomas, J. & Stuhrmann, H. B.(1995). J. Synchrotron Rad. 2, 83–86.
Teplyakov, A., Oliva, G. & Polikarpov, I. (1998). Acta Cryst. D54,610–614.
Thomas, J. (1997). Thesis, University of Hamburg, Germany.Trame, C. (1997). Thesis, University of Hamburg, Germany.Wang, B.-C. (1985). Methods Enzymol. 115, 90–112.Weiss, M. S. (2001). J. Appl. Cryst. 34, 130–135.Weiss, M. S., Mander, G., Hedderich, R., Diederichs, K., Ermler, U. &
Warkentin, E. (2004). Acta Cryst. D60, 686–695.Weiss, M. S., Panjikar, S., Nowak, E. & Tucker, P. A. (2002). Acta
Cryst. D58, 1407–1412.Weiss, M. S., Sicker, T., Djinovic Carugo, K. & Hilgenfeld, R. (2001).
Acta Cryst. D57, 689–695.Weiss, M. S., Sicker, T. & Hilgenfeld, R. (2001). Structure, 9, 771–
777.Xia, D., Yu, C. A., Kim, H., Xia, J. Z., Kachurin, A. M., Zhang, L., Yu,
L. & Deisenhofer, J. (1997). Science, 277, 60–66. Erratum: Science(1997). 278, 2037.
Yang, C. & Pflugrath, J. W. (2001). Acta Cryst. D57, 1480–1490.Yang, C., Pflugrath, J. W., Courville, D. A., Stence, C. N. & Ferrara,
J. D. (2003). Acta Cryst. D59, 1943–1957.
softer X-rays
J. Synchrotron Rad. (2005). 12, 410–419 Kristina Djinovic Carugo et al. � Macromolecular crystallography 419