Photostability of gas- and solid-phase biomolecules under astrophysical analog soft X-rays field
Upload
independentCategory
view
0download
0
arX
iv:a
stro
-ph/
0402
371v
3 1
3 Ju
l 200
4
NUB-3244/Th-04
astro-ph/0402371
Astrophysical Origins of Ultrahigh Energy Cosmic Rays
Diego F. Torresa and Luis A. Anchordoquib
aLawrence Livermore National Laboratory, 7000 East Ave., L-413,
Livermore, CA 94550, USA
bDepartment of Physics, Northeastern University
Boston, MA 02115, USA
Abstract
In the first part of this review we discuss the basic observational features at the end of
the cosmic ray energy spectrum. We also present there the main characteristics of each
of the experiments involved in the detection of these particles. We then briefly discuss
the status of the chemical composition and the distribution of arrival directions of
cosmic rays. After that, we examine the energy losses during propagation, introducing
the Greisen-Zaptsepin-Kuzmin (GZK) cutoff, and discuss the level of confidence with
which each experiment have detected particles beyond the GZK energy limit. In the
second part of the review, we discuss astrophysical environments able to accelerate
particles up to such high energies, including active galactic nuclei, large scale galactic
wind termination shocks, relativistic jets and hot-spots of Fanaroff-Riley radiogalaxies,
pulsars, magnetars, quasar remnants, starbursts, colliding galaxies, and gamma ray
burst fireballs. In the third part of the review we provide a brief summary of scenarios
which try to explain the super-GZK events with the help of new physics beyond the
standard model. In the last section, we give an overview on neutrino telescopes and
existing limits on the energy spectrum and discuss some of the prospects for a new
(multi-particle) astronomy. Finally, we outline how extraterrestrial neutrino fluxes can
be used to probe new physics beyond the electroweak scale.
Solicited Review Article Prepared for Reports on Progress in Physics
1

PREFACE
Reviewing cosmic ray physics is a risky business. Theoretical models continue to
appear at an amazing rate, both in the astrophysical and more exotic domains. We
warn the reader: we do not (nor we could) intend to make an homogeneous coverage of
all the ideas of our fellow colleagues. Reading differently focused reviews on the issue
(quoted here along the way) is, in our view, the best approach to such a wide topic of
research.
2

Contents
I. There’s Something About Cosmic Ray Observations 5
A. Experiments and future projects 5
B. Primary species 7
C. Distribution of arrival directions 9
D. Propagation of UHECRs 12
1. The GZK-cutoff 12
2. Propagation of CRs in a magnetized neighborhood of the Galaxy 13
E. GZK-end of the cosmic ray spectrum? 17
II. Vanilla Sky: UHECR Generation within the Standard Lore 18
A. A brief low energy perspective 18
B. Plausible sources of UHECRs and the Hillas’ plot 19
C. Neutron stars 21
1. Magnetohydronamic acceleration of iron nuclei in pulsars 21
2. Magnetars 24
3. UHECRs from a pulsar in Cygnus OB2? 25
D. Radio Galaxies and Active Galactic Nuclei 28
1. Definitions 28
2. Radiogalaxies 30
3. Cen A: The source of most UHECRs observed at Earth? 32
4. M87: The end of all roads? 35
5. Other powerful nearby radiogalaxies 36
6. Correlations of UHECRs with QSOs, BL LACs, and EGRET sources 37
E. Remnants of quasars 40
1. What is a quasar remnant and how would they accelerate particles? 40
2. Correlations of UHECRs with QRs 42
3. TeV emission from QRs 45
F. Starbursts 45
1. What are they? 45
2. M82 and NGC253 46
3. Two-step acceleration-process in starbursts 47
4. The starburst hypothesis: UHECR-luminosity and correlations 49
G. Luminous Infrared Galaxies 52
1. Definition 52
3

2. Propagation and further studies 53
H. Gamma-ray bursts 56
1. Basic phenomenology 56
2. The fireball model 56
3. Fermi acceleration in dissipative wind models of GRBs 57
4. UHECRs and GRBs: connections 59
5. A GRB origin for CRs below the ankle? 60
III. Full Throttle: UHECR Generation beyond the Standard Lore 61
IV. Minority Report: Neutrino Showers 66
A. Bounds on the energy spectrum 66
B. Astronomy on Ice 70
C. Probes of new physics beyond the electroweak scale 75
V. Any Given Sunday: Countdown to Discovery 76
Acknowledgments 77
References 77
4

I. THERE’S SOMETHING ABOUT COSMIC RAY OBSERVATIONS
A. Experiments and future projects
The cosmic ray (CR) spectrum spans over roughly 11 decades of energy. Contin-
uously running monitoring using sophisticated equipment on high altitude balloons
and ingenious installations on the Earth’s surface encompass a plummeting flux that
goes down from 104 m−2 s−1 at ∼ 109 eV to 10−2 km−2 yr−1 at ∼ 1020 eV. Its shape
is remarkably featureless, with little deviation from a constant power law across this
large energy range. The small change in slope, from ∝ E−2.7 to ∝ E−3.0, near 1015.5 eV
is known as the “knee”. The spectrum steepens further to E−3.3 above the “dip”
(≈ 1017.7 eV), and then flattens to E−2.7 at the “ankle” (≈ 1019 eV). Within statistical
uncertainty of current observations, which is large above 1020 eV, the upper end of
the spectrum is consistent with a simple extrapolation at that slope to the highest
energies, possibly with a slight accumulation around 1019.5 eV (For recent surveys of
experimental data the reader is referred to [1, 2, 3, 4, 5, 6]).
It is a lucky coincidence that at the energy (∼ 1014 eV) where direct measurement
of CRs becomes limited by detector area and exposure time, the resulting air showers
that such particles produce when they strike the upper atmosphere become big enough
to be detectable at ground level. There are several techniques that can be employed
in the process of detection:
(i) Direct detection of shower particles is the most commonly used method, and
involves constructing an array of sensors spread over a large area to sample particle
densities as the shower arrives at the Earth’s surface. The pioneering development of
the air shower techniques (and the first use of plastic scintillation detectors for the dual
use of measuring arrival directions and particle densities) was started at the Agassiz
Station of the Harvard College Observatory, a work carried out between 1954 and
1957 [7, 8, 9]. The existence of primary particles with energies greater than 1018 eV
was established by the observation of one shower with more than 109 particles. Soon
afterwards, this technique flourished with measurements of ultra high energy cosmic
rays (UHECRs) with the Volcano Ranch experiment in the 60 s [10, 11, 12], as well as
with several other arrays, such as Haverah Park in England [13], Yakutsk in Russia [14,
15], the Sydney University Giant Airshower Recorder in Australia (SUGAR) [16], and
the Akeno Giant Air Shower Array (AGASA) in Japan [17, 18].
(ii) Another well-established method of detection involves measurement of the lon-
gitudinal development (number of particles versus atmospheric depth) of the extensive
air shower (EAS) by sensing the fluorescence light produced via interactions of the
charged particles in the atmosphere. The emitted light is typically in the 300 - 400 nm
ultraviolet range to which the atmosphere is quite transparent. Under favorable at-
5

mospheric conditions, EASs can be detected at distances as large as 20 km, about 2
attenuation lengths in a standard desert atmosphere at ground level. However, obser-
vations can only be done on clear Moonless nights, resulting in an average 10% duty
cycle. The fluorescence technique has so far been implemented only in the Dugway
desert (Utah). Following a successful trial at Volcano Ranch [19] the group from the
University of Utah built a device containing two separated Fly’s Eyes [20, 21]. The
two-eye configuration monitored the sky from 1986 until 1993. As an up-scaled ver-
sion of Fly’s Eye, the High Resolution (HiRes) Fly’s Eye detector begun operations
in May 1997 [22, 23]. In monocular mode, the effective acceptance of this instrument
is ∼ 350(1000) km2 sr at 1019 (1020) eV, on average about 6 times the Fly’s Eye ac-
ceptance, and the threshold energy is 1017 eV. This takes into account a 10% duty
cycle.
(iii) A more recently proposed technique uses radar echos from the column of ionized
air produced by the shower. This idea suggested already in 1940 [24], has been recently
re-explored [25, 26] as either an independent method to study air showers, or as a
complement to existing fluorescence and surface detectors. A proposal has recently
been put forth to evaluate the method using the Jicamarca radar system near Lima,
Peru [27].
In order to increase the statistics at the high end of the spectrum significantly, two
projects are now under preparation:
(i) The Pierre Auger Observatory (PAO), currently under construction in Argentina,
is the first experiment designed to work in a hybrid mode incorporating both a ground-
based array of 1600 particle detectors spread over 3000 km2 with fluorescence telescopes
placed on the boundaries of the surface array [28]. A second array will be set up in
the Northern hemisphere to cover the whole sky. Such a full-sky coverage is very
important to allow sensitive anisotropy analysis. The overall aperture (2 sites) for CRs
with primary zenith angle < 60 and primary energy > 1019 eV is ≈ 1.4× 10⁴ km2 sr.
(ii) The mission “Extreme Universe Space Observatory” (EUSO) will observe the
fluorescence signal of CRs, with energy > 4 × 10¹⁹ eV, looking downward from the
International Space Station to the dark side of the Earth atmosphere [29, 30]. The
characteristic wide angle optics of the instrument (with opening field of view ±30 at
an average orbit altitude of ≈ 400 km) yields a geometric aperture of ≈ 5 × 10⁵ km2
sr, taking into account a 10% duty cycle. The monocular stand-alone configuration of
the telescope will serve as a pathfinder mission to develop the required technology to
observe the fluorescent trails of EASs from space.
The experimental input for γ-ray physics will be further enriched by dedicated
Cerenkov detectors like HESS [31], MAGIC [32], CANGAROO [33], and VERITAS [34],
as well as satellites like GLAST [35, 36] and AGILE [37].
6

B. Primary species
When a CR enters the Earth atmosphere it collides with a nucleus of an air atom,
producing a roughly conical cascade of billions of elementary particles which reaches
the ground in the form of a giant “saucer” traveling at nearly the speed of light.
Unfortunately, because of the highly indirect method of measurement, extracting
precise information from EASs has proved to be exceedingly difficult. The most fun-
damental problem is that the first generations of particles in the cascade are subject to
large inherent fluctuations and consequently this limits the event-by-event energy reso-
lution of the experiments. In addition, the center-of-mass energy of the first few cascade
steps is well beyond any reached in collider experiments. Therefore, one needs to rely
on hadronic interaction models that attempt to extrapolate, using different mixtures
of theory and phenomenology, our understanding of particle physics. At present, the
different approaches used to model the underlying physics of pp collisions show clear
differences in multiplicity predictions which increase with rising energy [38, 39, 40].
Therefore, distinguishing between a proton and a nucleus shower is extremely difficult
at the highest energies [41, 42].
Fortunately, photon and hadron primaries can be distinguished by comparing the
rate of vertical to inclined showers, a technique which exploits the attenuation of the
electromagnetic shower component for large slant depths. Comparing the predicted
rate to the rate observed by Haverah Park for showers in the range 60 < θ < 80,
Ave et al. [43] conclude that above 1019 eV, less than 48% of the primary CRs can be
photons and above 4×10¹⁹ eV less than 50% can be photons. Both of these statements
are made at the 95% CL.
The longitudinal development has a well defined maximum, usually referred to as
Xmax, which increases with primary energy as more cascade generations are required
to degrade the secondary particle energies. Evaluating Xmax is a fundamental part of
many of the composition studies done by detecting air showers. For showers of a given
total energy, heavier nuclei have smaller Xmax because the shower is already subdivided
into A nucleons when it enters the atmosphere. Specifically, the way the average depth
of maximum 〈Xmax〉 changes with energy depends on the primary composition and
particle interactions according to
〈Xmax〉 = De ln
(
E
E0
)
, (1)
where De is the so-called “elongation rate” and E0 is a characteristic energy that
depends on the primary composition [44]. Therefore, since 〈Xmax〉 and De can be
determined directly from the longitudinal shower profiles measured with a fluorescence
detector, E0 and thus the composition, can be extracted after estimating E from the
7

total fluorescence yield. Indeed, the parameter often measured is D10, the rate of
change of 〈Xmax〉 per decade of energy.
Another important observable which can be related to primary energy and chemical
composition is the total number of muons Nµ reaching ground level. For vertical proton
showers, numerical simulations [45] indicate that the muon production is related to the
energy of the primary via [16]
E = 1.64 × 10¹⁸
(
Npµ
107
)1.073
eV. (2)
Thus, modeling a shower produced by a nucleus with energy EA as the collection of A
proton showers, each with energy A−1 of the nucleus energy, leads – using Eq. (2) –
to NAµ ∝ A(EA/A)0.93 [46]. Consequently, one expects a CR nucleus to produce about
A0.07 more muons than a proton. This implies that an iron nucleus produces a shower
with around 30% more muons than a proton shower of the same energy.
The analysis of the elongation rate and the spread in Xmax at a given energy reported
by the Fly’s Eye Collaboration suggests a change from an iron dominated composition
at 1017.5 eV to a proton dominated composition near 1019 eV [47, 48]. Such behavior
of De is in agreement with an earlier analysis from Haverah Park [49]. However, the
variation of the density of muons with energy reported by the Akeno Collaboration
favours a composition that remains mixed over the 1018 − 1019 eV decade [50]. More
recently, Wibig and Wolfendale [51] reanalyzed the Fly’s Eye data considering not only
proton and iron components (as in [47]) but a larger number of atomic mass hypotheses.
Additionally, they adopted a different hadronic model that shifts the prediction of Xmax
for primary protons of 1018 eV from 730 g cm−2 [47] to 751 g cm−2. The difference,
although apparently small, has a significant effect on the mass composition inferred
from the data. The study indicates that at the highest energies (1018.5 − 1019 eV and
somewhat above) there is a significant fraction of primaries with charge greater than
unity. This result is more in accord with the conclusions of the Akeno group than
those of the Fly’s Eye group. Very recently, the Volcano Ranch data was re-analyzed
taking into account a bi-modal proton-iron model [52]. The best fit gives a mixture
with 75 ± 5% of iron, with corresponding percentage of protons. A summary of the
diferent bi-modal analyses is shown in Fig. 1. Within statistical errors and systematic
uncertainties introduced by hadronic interaction models, the data seem to indicate
that iron is the dominant component of CRs between ∼ 1017 eV and ∼ 1019 eV.
Nonetheless, in view of the low statistics at the end of the spectrum and the wide
variety of uncertainties in these experiments, one may conservatively say that this is
not a closed issue.
8
FIG. 1: Predicted fraction of iron nuclei in the CR beam at the top of the atmosphere from
various experiments: Fly’s Eye (), AGASA A100 (), AGASA A1 () using sibyll 1.5
as the hadronic interaction event generator [53] and Haverah Park [54], using qgsjet98
(•) and qgsjet01 () to process the hadronic collisions. The solid (dashed) line rectangle
indicates the mean composition with the corresponding error estimated using the Volcano
Ranch data and qgsjet98 (qgsjet01); the systematic shift in the fraction of iron induced
by the hadronic event generator is 14% [55].
C. Distribution of arrival directions
The distribution of arrival directions is perhaps the most helpful observable in yield-
ing clues about the CR origin. On the one hand, if cosmic rays cluster within a small
angular region (see e.g. [56]) or show directional alignment with powerful compact ob-
jects (see e.g. [57]), one might be able to associate them with isolated sources in the
sky. On the other hand, if the distribution of arrival directions exhibits a large-scale
anisotropy, this could indicate whether or not certain classes of sources are associated
9

with large-scale structures (such as the Galactic plane or the Galactic halo).
Cosmic ray air shower detectors which experience stable operation over a period of a
year or more can have a uniform exposure in right ascension, α. A traditional technique
to search for large-scale anisotropies is then to fit the right ascension distribution of
events to a sine wave with period 2π/m (mth harmonic) to determine the components
(x, y) of the Rayleigh vector [58]
x =2
N
N∑
i=1
cos(m αi) , y =2
N
N∑
i=1
sin(m αi) . (3)
The mth harmonic amplitude of N measurements of αi is given by the Rayleigh vector
length R = (x2 + y2)1/2. The expected length of such a vector for values randomly
sampled from a uniform phase distribution is R0 = 2/√
N . The chance probability
of obtaining an amplitude with length larger than that measured is p(≥ R) = e−k0 ,
where k0 = R2/R20. To give a specific example, a vector of length k0 ≥ 6.6 would be
required to claim an observation whose probability of arising from random fluctuation
was 0.0013 (a “3σ” result) [6].
AGASA has revealed a correlation of the arrival direction of the cosmic rays to
the Galactic Plane (GP) at the 4σ level [59]. The energy bin width which gives the
maximum k0-value corresponds to the region 1017.9 eV – 1018.3 eV where k0 = 11.1,
yielding a chance probability of p(≥ RAGASA
E∼EeV) ≈ 1.5 × 10⁻⁵. The GP excess, which is
roughly 4% of the diffuse flux, is mostly concentrated in the direction of the Cygnus
region, with a second spot towards the Galactic Center (GC) [60]. Evidence at the 3.2σ
level for GP enhancement in a similar energy range has also been reported by the HiRes
Collaboration [61]. The existence of a point-like excess in the direction of the GC has
been confirmed via independent analysis [62] of data collected with SUGAR.1 This is
a remarkable level of agreement among experiments using a variety of techniques.
At lower energies (∼ PeV), the Rayleigh analysis shows no evidence of
anisotropy [64]. Hence, the excess from the GP is very suggestive of neutrons as
candidate primaries, because the directional signal requires relatively-stable neutral
primaries, and time-dilated neutrons can reach the Earth from typical Galactic dis-
tances when the neutron energy exceeds 1018 eV. Arguably, if the Galactic messengers
are neutrons, then those with energies below 1018 eV will decay in flight, providing a
flux of cosmic antineutrinos above 1 TeV that should be observable at kilometer-scale
neutrino telescopes [65]. A measurement of the ν-flux will supply a strong confirmation
of the GP neutron hypothesis.
1 Interestingly, sub-TeV γ-ray emission from the direction of the GC has been observed using the
CANGAROO-II Imaging Atmospheric Cerenkov Telescope [63].
10

For the ultra high energy (& 1019.6 eV) regime, all experiments to date have reported
k0 ≪ 6.6, ∀m < 5 [66, 67, 68, 69].2 This does not imply an isotropic distribution, but
it merely means that available data are too sparse to claim a statistically significant
measurement of anisotropy. In other words, there may exist anisotropies at a level too
low to discern given existing statistics [70].
The right harmonic analyses are completely blind to intensity variations which de-
pend only on declination, δ. Combining anisotropy searches in α over a range of
declinations could dilute the results, since significant but out of phase Rayleigh vectors
from different declination bands can cancel each other out. Moreover, the analysis
methods that consider distributions in one celestial coordinate, while integrating away
the second, have proved to be potentially misleading [71]. An unambiguous inter-
pretation of anisotropy data requires two ingredients: exposure to the full celestial
sphere and analysis in terms of both celestial coordinates. In this direction, a recent
study [72] of the angular power spectrum of the distribution of arrival directions of
CRs with energy > 1019.6 eV, as seen by the AGASA and SUGAR experiments, shows
no departures from either homogeneity or isotropy on an angular scale greater than
10. Finally, the recently analyzed HiRes data is also statistically consistent with an
isotropic distribution [73].
All in all, the simplest interpretation of the existing data is that, beyond the ankle,
a new population of extragalactic CRs emerges to dominate the more steeply falling
Galactic population. Moreover, there are two extreme explanations for the near ob-
served isotropy beyond 1019.6 eV: one is to argue a cosmological origin for these events,
and the other is that we have nearby sources (say, within the Local Supercluster) with
a tangled magnetic field in the Galaxy, and beyond, which bends the particle orbits,
camouflaging the exact location of the sources.
Although there seems to be a remarkable agreement among experiment on pre-
dictions about isotropy on large scale structure, this is certainly not the case when
considering the two-point correlation function on a small angular scale. The analyses
carried out by AGASA Collaboration seem to indicate that the pairing of events on the
celestial sky could be occurring at higher than chance coincidence [56, 74]. Specifically,
when showers with separation angle less than the angular resolution θmin = 2.5 are
paired up, AGASA finds five doublets and one triplet among the 58 events reported
with mean energy above 1019.6 eV. The probability of observing these clusters by chance
coincidence under an isotropic distribution was quoted as smaller than 1%. A third
2 For the Fly’s Eye data-sample the Rayleigh vector was computed using weighted showers, because
it has had a nonuniform exposure in sideral time. A shower’s weight depends on the hour of its
sideral arrival time, and the 24 different weights are such that every time bin has the same weighted
number of showers.
11

independent analysis [75], using the Goldberg–Weiler formalism [76], confirmed the re-
sult reported by AGASA Collaboration and further showed that the chance probability
is extremely sensitive to the angular binning. The “world” data set has also been stud-
ied [77]. Six doublets and two triplets out of 92 events with energies > 1019.6 eV were
found, with the chance probability being less than 1% in the restricted region within
±10 of the super-Galactic plane. The angular two-point correlation function of a com-
bined data sample of AGASA (E > 4.8 × 10¹⁹ eV) and Yakutsk (E > 2.4 × 10¹⁹ eV)
was analyzed [78]. For a uniform distribution of sources, the probability of chance
clustering is reported to be as small as 4 × 10⁻⁶. Far from confirming what seemed a
fascinating discovery, the recent analysis reported by the HiRes Collaboration showed
that the data is consistent with no small-scale anisotropy among the highest energy
events [79, 80].
The discovery of such clusters would be a tremendous breakthrough for the field, but
the case for them is not yet proven. To calculate a meaningful statistical significance
in such an analysis, it is important to define the search procedure a priori in order to
ensure it is not inadvertently devised especially to suit the particular data set after
having studied it. In the analyses carried out by AGASA Collaboration [56, 74], for
instance, the angular bin size was not defined ahead of time. Very recently, with the aim
to avoid accidental bias on the number of trials performed in selecting the angular bin,
the original claim of AGASA Collaboration [56] was re-examined considering only the
events observed after the claim [81]. This study showed that the evidence for clustering
in the AGASA data set is weaker than was previously claimed, and consistent with the
null hypothesis of isotropically distributed arrival directions.
Summing up, the clustering on small angular scale at the upper end of the spec-
trum remains an open question, and the increase in statistics and improved resolution
attainable with PAO is awaited to solve the issue.
D. Propagation of UHECRs
In this section we briefly summarize the relevant interactions that CRs suffer on their
trip to Earth. For a more detailed discussion the reader is refer to [1, 82, 83, 84, 85].
1. The GZK-cutoff
Ever since the discovery of the cosmic microwave background (CMB) standard
physics implies there would be a cuttoff in the observed CR-spectrum. In the mid-
60’s Greisen, Zatsepin, and Kuzmin (GZK) [86, 87] pointed out that this photonic
molasses makes the universe opaque to protons of sufficiently high energy, i.e., protons
12
with energies beyond the photopion production threshold,
EthpγCMB
=mπ (mp + mπ/2)
ECMB
≈ 6.8 × 10¹⁹
( ECMB
10−3 eV
)−1
eV , (4)
where mp (mπ) denotes the proton (pion) mass and ECMB ∼ 10−3 eV is a typical CMB
photon energy. After pion production, the proton (or perhaps, instead, a neutron)
emerges with at least 50% of the incoming energy. This implies that the nucleon en-
ergy changes by an e-folding after a propagation distance . (σpγ nγ y)−1 ∼ 15 Mpc.
Here, nγ ≈ 410 cm−3 is the number density of the CMB photons, σpγ > 0.1 mb is the
photopion production cross section, and y is the average energy fraction (in the labo-
ratory system) lost by a nucleon per interaction. Energy losses due to pair production
become relevant below ∼ 1019 eV. For heavy nuclei, the giant dipole resonance can
be excited at similar total energies and hence, for example, iron nuclei do not survive
fragmentation over comparable distances. Additionally, the survival probability for
extremely high energy (≈ 1020 eV) γ-rays (propagating on magnetic fields ≫ 10−11 G)
to a distance d, p(> d) ≈ exp[−d/6.6 Mpc], becomes less than 10−4 after traversing a
distance of 50 Mpc.3
In recent years, several studies on the propagation of CRs (including both analytical
analyses and numerical simulations) have been carried out [89, 90, 91, 92, 93, 94, 95,
96, 97, 98, 99, 100, 101, 102, 103, 104, 105, 106, 107, 108, 109, 110]. A summary of the
UHECR attenuation lengths for the above mentioned processes (as derived in these
analyses) is given in Fig. 2. It is easily seen that our horizon shrinks dramatically for
energies & 1020 eV. Therefore, if UHECRs originate at cosmological distances, the net
effect of their interactions would yield a pile-up of particles around 4−5×10¹⁹ eV with
the spectrum droping sharply thereafter. As one can infer from Fig. 2, the subtleties of
the spectral shape depend on the nature of the primary species, yielding some ambiguity
in the precise definition of the “GZK cutoff”. In what follows we consider an event to
supersed the cutoff if the lower energy limit at the 95% CL exceeds 7 × 10¹⁹ eV. This
conforms closely to the strong criteria outlined in Ref. [111].
2. Propagation of CRs in a magnetized neighborhood of the Galaxy
In addition to the interactions with the radiation fields permeating the universe, CRs
suffer deflections on extragalactic and Galactic magnetic fields.
Over the last few years, it has become evident that the observed near-isotropy of
arrival directions can be easily explained if our Local Supercluster contains a large
3 It should be stressed that if the extragalactic magnetic field is < 10−12 G, photons with energy
≫ 1021 eV can reach us without significant energy loss from distant (redshift z & 0.03) sources [88].
13

10 12 14 16 18 20 22 24-3
-2
-1
0
1
2
3
4
5
photon+IR
photon+CMB
photon+radio
proton pair proton photopion
Fe+CMB+IR
red shift limit
FIG. 2: Attenuation length of γ’s, p’s, and 56Fe’s in various background radiations as a
function of energy. The 3 lowest and left-most thin solid curves refer to γ-rays, showing the
attenuation by infra-red, microwave, and radio backgrounds. The upper, right-most thick
solid curves refer to propagation of protons in the CMB, showing separately the effect of
pair production and photopion production. The dashed-dotted line indicates the adiabatic
fractional energy loss at the present cosmological epoch (see e.g. Appendix B of Ref. [1]).
The dashed curve illustrates the attenuation of iron nuclei.
scale magnetic field which provides sufficient bending to the CR trajectories [112, 113].
Intergalactic field strengths and coherence lengths are not well established, but it is
plausible to assume that fields have coherent directions on scales ℓ ≈ 0.5−1 Mpc. The
Larmor radius of a CR of charge Ze propagating in a magnetic field BnG ≡ B/10−9 G
is given by
rL ≈ 100 E20
Z BnGMpc , (5)
14

where E20 is the particle’s energy in units of 1020 eV. For rL ≫ ℓ the motion is not very
different from a quasilinear trajectory, with small deflections away from the straight
line path given by
θ(E) ≈ 0.3LMpc Z BnG
E20, (6)
where LMpc is the propagation distance in units of Mpc. As the Larmor radius starts
approaching ℓ the particles begin to diffuse.
Diffusion has two distinctive regimes. Particles that are trapped inside magnetic
subdomains (of size ℓMpc ≡ ℓ/Mpc) follow Kolmogorov diffusion. In such a case, the
functional dependence of energy of the difussion coefficient is found to be [114]
D(E) ≈ 0.0048
(
E20 ℓ2Mpc
Z BnG
)1/3
Mpc2/Myr . (7)
With rising energy, rL → ℓ, and there is a transition to Bohm diffusion. The diffusion
coefficient in this regime is of order the Larmor radius times velocity (∼ c) [115]. In
this case the accumulated deflection angle from the direction of the source, can be
estimated assuming that the particles make a random walk in the magnetic field [116]
θ(E) ≈ 0.54ℓ1/2Mpc L
1/2Mpc Z BnG
E20. (8)
Surprisingly little is actually known about the extragalactic magnetic field strength.
There are some measurements of diffuse radio emission from the bridge area between
Coma and Abell superclusters that under assumptions of equipartition allows an es-
timate of 0.2 − 0.6 µG for the magnetic field in this region [117].4 Such a strong
magnetic field (which is compatible with existing upper limits on Faraday rotation
measurements [119]) could be possibly understood if the bridge region lies along a fila-
ment or sheet of large scale structures [120]. Faraday rotation measurements [119, 121]
have thus far served to set upper bounds of O(10−9 − 10−8) G on extragalactic mag-
netic fields on various scales [119, 122], as have the limits on distortion of the CMB
[123, 124]. The Faraday rotation measurements sample extragalactic field strengths of
any origin out to quasar distances, while the CMB analyses set limits on primordial
magnetic fields. Finally, there are some hints suggesting that the extragalactic field
strength can be increased in the neighborhood of the Milky Way, BnG > 10 [125]. Now,
using Eq. (5), one can easily see that because of the large uncertainty on the magnetic
field strength, O(nG) − O(µG), all 3 different regimes discussed above are likely to
describe UHECR propagation.
4 Fields of O(µG) are also indicated in a more extensive study of 16 low redshift clusters [118].
15

If CRs propagate diffusively, the radius of the sphere for potential proton sources
becomes significantly reduced. This is because one expects negligible contribution
to the flux from times prior to the arrival time of the diffusion front, and so the
average time delay in the low energy region, τdelay ≈ d2/[4D(E)], must be smaller than
the age of the source, or else the age of the universe (if no source within the GZK
radius is active today, but such sources have been active in the past). Note that the
diffuse propagation of UHE protons requires magnetic fields ∼ 1µG. Therefore, for
typical coherence lengths of extragalactic magnetic fields the time delay of CRs with
E ≈ 1018.7 eV cannot exceed τdelay . 14 Gyr, yielding a radius of d ∼ 30 Mpc. In
the case CR sources are active today, the radius for potential sources is even smaller
d ∼ 5 Mpc.
On the other hand, the sphere of potential nucleus-emitting-sources is severely con-
strained by the GZK cutoff: straightforward calculation, using the attenuation length
given in Fig. 2, shows that less than 1% of iron nuclei (or any surviving fragment of their
spallations) can survive more than 3 × 10¹⁴ s with an energy & 1020.5 eV. Therefore,
the assumption that UHECRs are heavy nuclei implies ordered extragalactic magnetic
fields BnG . 15 − 20, or else nuclei would be trapped inside magnetic subdomains
suffering catastrophic spallations.
The large scale structure of the Galactic magnetic field carries substantial un-
certainties as well, because the position of the solar system does not allow global
measurements. The average field strength can be directly determined from pul-
sar observations of the rotation and dispersion measures average along the line of
sight to the pulsar with a weigh proportional to the local free electron density,
〈B||〉 ≈ 2µG [126, 127, 128, 129].(We use the standard, though ambiguous notation, in
which B refers to either the Galactic or extragalactic magnetic field, depending on the
context.) Measurements of polarized synchrotron radiation as well as Faraday rotation
of the radiation emitted from pulsars and extragalactic radio sources revealed that the
global structure of the magnetic field in the disk of our Galaxy could be well described
by spiral fields with 2π (axisymmetric, ASS) or π (bisymmetric, BSS) symmetry [130].
In the direction perpendicular to the Galactic plane the fields are either symmetric
(S) or antisymmetric (A). Discrimination between these models is complicated. Field
reversals are certainly observed (in the Crux-Scutum arm at 5.5 kpc from the Galactic
center, the Carina-Sagittarius arm at 6.5 kpc, the Perseus arm at 10 kpc, and possibly
another beyond [131]). However, as discussed by Vallee [132], turbulent dynamo theory
can explain field reversals at distances up to ∼ 15 kpc within the ASS configuration.
More accurately, the field strength in the Galactic plane (z = 0) for the ASS model
is generally described by [133, 134]
B(ρ, θ) = B0(ρ) cos2[ θ − β ln(ρ/ξ0)] , (9)
16

and for the BSS
B(ρ, θ) = B0(ρ) cos[ θ − β ln(ρ/ξ0)] , (10)
where θ is the azimuthal coordinate around the Galactic center (clockwise as seen from
the north Galactic pole), ρ is the galactocentric radial cylindrical coordinate, and
B0(ρ) =3r0
ρtanh3(ρ/ρ1) µG . (11)
Here, ξ0 = 10.55 kpc stands for the galactocentric distance of the maximum of the field
in our spiral arm, β = 1/ tan p (with the pitch angle, p = −10), r0 = 8.5 kpc is the
Sun’s distance to the Galactic center, and ρ1 = 2 kpc. The θ and ρ coordinates of the
field are correspondingly,
Bθ = B(ρ, θ) cos p , Bρ = B(ρ, θ) sin p . (12)
The field strength above and below the Galactic plane (i.e., the dependence on z) has
a contribution coming from the disk and another from the halo: (i) for A models
BA(ρ, θ, z) = B(ρ, θ) tanh(z/z3)
(
1
2 cosh(z/z1)+
1
2 cosh(z/z2)
)
, (13)
(ii) for S models, BS = BA(ρ, θ, z)/tanh(z/z3); where z1 = 0.3 kpc, z2 = 4 kpc and
z3 = 20 pc. With this in mind, the Galactic magnetic field produce significant bending
to the CR orbits if E20/Z = 0.03 [134].
E. GZK-end of the cosmic ray spectrum?
A first hint of a puzzle surfaced in the highest energy Fly’s Eye event [135] which
has no apparent progenitor within the Local Supercluster [136]. Subsequent observa-
tions with the AGASA experiment [137] carried strong indication that the cutoff was
somehow circumvented in the absence of plausible nearby sources.
The big disappointment of 2002 was the CR-flux reported by the HiRes Collabora-
tion [138, 139], which is in sharp disagreement with AGASA data [140]. The discrep-
ancy between the two estimated fluxes is shown in Fig. 3. One can argue correctly
that the statistical significance of the discrepancy is small, although such an assesment
requires a conspiracy between the two groups to bend their maximal systematic errors
in opposite directions. Moreover, an analysis [143] of the combined data reported by
the HiRes, the Fly’s Eye, and the Yakutsk collaborations is supportive of the existence
of the GZK cutoff at the > 5σ (> 3.7σ) level. The deviation from GZK depends on
the set of data used as a basis for power law extrapolation from lower energies. An
additional input for this analysis was the recent claim [144] that there may be technical
17

FIG. 3: Upper end of the cosmic ray energy spectrum as observed by AGASA [140], Fly’s
Eye[141], Haverah Park [142], HiRes [139], and SUGAR [46].
problems with the Yakutsk data collection. More recently, fingerprints of super-GZK
CRs have been found [46] by reanalyzing the SUGAR data [16]. However, as one can
see in Fig. 3, the number of events is not enough to weight in on one side or the other
with respect to the GZK question.
II. VANILLA SKY: UHECR GENERATION WITHIN THE STANDARD
LORE
A. A brief low energy perspective
Supernova remnants (SNRs) are thought to be the main source of both CR ions
and electrons with energies below the knee. The particle acceleration mechanism in
individual SNRs is usually assumed to be diffusive shock acceleration, which naturally
18

leads to a power-law population of relativistic particles. In the standard version of
this mechanism (e.g. [145]), particles are scattered by magnetohydrodynamic waves
repeatedly through the shock front. If they encounter an enhancement of molecular
density, the pion channel can lead to observable amounts of γ-rays (see Ref. [146]
for a review, and references therein for details). Electrons suffer synchrotron losses,
producing the non-thermal emission from radio to X-rays usually seen in shell-type
SNRs. The maximum energy achieved depends on the shock speed and age as well as
on any competing loss processes. In young SNRs, electrons can easily reach energies
in excess of 1 TeV, where they produce X-rays by synchrotron mechanism (see, for
example, [147, 148]).
CRs of low energies are also expected to be accelerated in OB associations, through
turbulent motions and collective effects of star winds (e.g. [149, 150]). The main accel-
eration region for TeV particles would be in the outer boundary of the supperbubble
produced by the core of a given stellar association. If there is a subgroup of stars
located at the acceleration region, their winds might be illuminated by the locally ac-
celerated protons, which would have a distribution with a slope close to the canonical
value, α ∼ 2, and produce detectable γ-rays [151]. The HEGRA detection in the vicin-
ity of Cygnus OB2, TeV J2032+4131 [152], could be, judging from multiwavelength
observations [153], the result of such a process [151]. A nearby EGRET source (3EG
J2033+4118) has also a likely stellar origin [154, 155, 156].
Truth is, as always, bitter. No astrophysical source of UHECRs, nor of CRs with
energies below the knee, has been ever confirmed. Out of all SNRs coinciding with non-
variable γ-ray sources detected by EGRET [157, 158, 159, 160], the supernova remnant
RX J1713.7-3946 is perhaps one the most convincing cases for a hadronic cosmic-
ray accelerator detected so far in the Galaxy, although yet subject to confirmation
[161, 162, 163, 164, 165]. Other excellent candidates include SN1006 (e.g. [166])
and Cas A (e.g. [167]). Kilometer-scale neutrino telescopes have also been proposed
as viable detectors of hadronic CR sources (e.g. [168, 169, 170, 171]), and will be
a welcomed addition to the space- and ground-based detectors already existing or
planned.
B. Plausible sources of UHECRs and the Hillas’ plot
Following the main ideas behind the concept of Fermi’s first order acceleration, when
rL approaches the accelerator size, it becomes very difficult to magnetically confine the
CR to the acceleration region, and thus to continue the accelerating process up to higher
energies. If one includes the effect of the characteristic velocity βc of the magnetic
19

FIG. 4: The Hillas diagram showing (chain curves) magnetic field versus gyroradius for
proton momenta 1015, 1016, . . . , 1024 eV/c. The solid curves correspond to different shock-
waves velocities: the upper solid curve indicates the maximum attainable energy β = 1, the
middle and lower solid curves indicate plausible less effective acceleration processes. Typical
size and magnetic field of possible acceleration sites are shown for neutron stars (ns), white
dwarfs (wd), sunspots (ss), magnetic stars (ms), active galactic nuclei (ag), interstellar space
(is), SNRs (sn), radio galaxy lobes (rg), galactic disk (d) and halo (h), clusters of galaxies
(cl) and intergalactic medium (ig). Typical jet-frame parameters of the synchrotron proton
blazar model [174] and gamma ray burst model [175] are indicated by open squares labeled
“bl” and “gb”, respectively [176].
scattering centers5, the above argument leads to the general condition (sometimes
called the “Hillas criterion” [172]),
Emax ∼ 2β c Ze B rL, (14)
for the maximum energy acquired by a particle travelling in a medium with magnetic
field B.
5 The size of the accelerating region containing the magnetic field should be as large as 2rL. Taking
into account a characteristic velocity βc of the scattering centers this transforms into 2rL/β.
20

In the case of one-shot acceleration scenarios, the maximum reachable energy turns
out to have a quite similar expression to the shock acceleration case of Eq. (14). For in-
stance, a dimensional analysis suggests that the maximum energy that can be obtained
from a pulsar is [172]
Emax =ω
cZe Bs R2
s , (15)
where ω is the pulsar angular velocity, Bs the surface magnetic field and Rs the neutron
star radius. Therefore, if Bs ∼ 1012 G, Rs ∼ 10 km, and ω ∼ 60π s−1 (as for the Crab
pulsar), a circuit connected between pole and equator would see an emf ∼ 1018 V for an
aligned or oblique dipole. When realistic models of acceleration are constructed, how-
ever, this ideal dimensional limit is not fully realized, because the large potential drop
along the magnetic field lines is significantly short-circuited by electron and positrons
moving in opposite directions along the field lines [173].
The dimensional arguments of Eqs. (14) and (15) are conveniently depicted in the
“Hillas diagram” [172] shown in Fig. 4. Very few sites can generate particles with
energies > 1020 eV: either this occurs on highly condensed objects with huge B or
enormously extended objects. Some of these potential astrophysical sources are dis-
cussed in what follows. For further details on the electrodynamical limitations of CR
sources see, e.g. [177, 178].
C. Neutron stars
1. Magnetohydronamic acceleration of iron nuclei in pulsars
Following earlier ideas [179]6, Blasi et al. [182] 7 have shown that young magnetized
neutron stars in our own Galaxy may be one such astrophysical system that satisfies
the Hillas’ criterion.
Neutron stars –endpoints of stellar evolution– begin their life rotating rapidly (Ω ∼3000 rad s−1) and with large surface magnetic fields (BS & 1013 G). The dipole compo-
nent decreases as the cube of the distance from the star’s surface B(r) = BS(RS/r)3,
where the radius of the star is RS ≃ L. At the light cylinder Rlc = c/Ω ∼ 107Ω−13k cm,
where Ω3k ≡ Ω/3000 rad s−1, the dipole field cannot be casually maintained, the field
is mostly azimuthal, with field lines spiraling outwards [187]. Inside the light cylinder,
6 Even earlier ideas relating UHECRs with neutron stars can be found in Refs. [180, 181], although
these attempts have failed at either reaching the highest energies, or reproducing the spectrum, or
reproducing the apparent isotropy of the arrival directions of UHECRs.7 See [183, 184], also [185], for related research. See [186] for yet another model of UHECR generation
in neutron stars, involving planetoid impacts.
21
the magnetosphere corotates with the star, and the density of material (mostly iron
peak elements formed during the supernova event that were stripped off the surface
due to strong electric fields) has the Goldreich-Julian value, nGJ (r) = B(r)Ω/(4πZec),
where c is the speed of light [188]. The behavior of the plasma outside the light cylin-
der is still not yet fully understood [189, 190, 191, 192], although some analytical and
numerical studies show the development of kinetically dominated relativistic winds (see
e.g., [190]).
Blasi et al. [182] assumed that the magnetic field in the wind zone decreases as
B(r) . BlcRlc/r. For surface fields of BS ≡ 1013 B13 G, the field at the light cylinder
is Blc = 1010 B13Ω33k G. The maximum energy of particles that can be contained in the
wind near the light cylinder is
Emax =ZeBlcRlc
c≃ 8 × 10²⁰ Z26B13Ω
23k eV , (16)
where Z26 ≡ Z/26. The typical energy of the accelerated CRs, Ecr, can be estimated
by considering the magnetic energy per ion at the light cylinder Ecr ≃ B2lc/8πnGJ. At
the light cylinder nGJ = 1.7 × 10¹¹ B13Ω43k/Z cm−3 which gives
Ecr ≃ 4 × 10²⁰ Z26B13Ω23k eV . (17)
In this model, as the star spins down, the energy of the cosmic ray particles ejected
with the wind decreases. The total fluence of UHECRs between energy E and E + dE
is
N(E)dE =NΩ
dΩ
dEdE , (18)
where the particle luminosity is
N = ξ nGJ πR2lcc = 6 × 1034ξ
B13Ω23k
Z26s−1 (19)
and ξ < 1 is the efficiency for accelerating particles at the light cylinder. For a spin
down rate dominated by magnetic dipole radiation, given by IΩΩ = −B2SR6
SΩ4/6c3
where I = 1045 g cm2 is the moment of inertia, the time derivative of the spin frequency
is Ω = 1.7 × 10⁻⁵B213Ω
33k s−1, and Eq. (17) gives
dE
dΩ= 1.7 × 10⁻³ E
Ω3k. (20)
Substituting in Eq. (18), the particle spectrum from each neutron star is
N(E) = ξ5.5 × 1031
B13E20Z26GeV−1 . (21)
22

Taking the confining volume for these particles to be Vc and the lifetime for con-
finement to be tc, the UHECR density is n(E) = ǫN(E)tc/τVc, and the flux at the
surface of the Earth is F (E) = n(E)c/4. For a characteristic confinement dimension
of R = 10 R1 kpc, Vc = 4πR3/3 and tc = QR/c, where Q > 1 is a measure of the how
well the UHECR are trapped. With this in mind, the predicted UHECR flux at the
Earth is [182]8
F (E) = 10−24 ξǫQ
τ2R21B13E20Z26
GeV−1cm−2s−1 . (22)
Here, the fact that neutron stars are produced in our Galaxy at a rate 1/τ , where τ ≡100 τ2 yr, but that not all them (but rather only a fraction ǫ) have the required magnetic
fields, initial spin rates and magnetic field geometry to allow efficient conversion of
magnetic energy into kinetic energy of the flow, was taken into account. By comparing
with observations, the required efficiency factor, ξǫ, can be estimated, and it only needs
to be ξǫ & 4 × 10⁻⁶Q−1.
The condition that a young neutron star could produce the UHECRs9 is that Ecr
exceeds the needed energy when the envelope becomes transparent (i.e. before the
spinning rate of the neutron star decreases to the level where the star is unable to
emit particles of the necessary energy), Ecr(ttr) > 1020E20 eV. This translates into the
following condition [182]10
Ωi >3000 s−1
B1/213
[
4Z26E−120 − 0.13M1B13E−1/2
51
]1/2. (23)
Eq. (23) translates in turn into upper bounds on the surface magnetic field strength
and the star initial spin period Pi = 2π/ωi,
B13 <31 Z26 E
1/251
M1 E20, (24)
8 Note that the predicted spectrum of Eq. (22) is very flat, γ = 1, which would agree only with
the lower end of the plausible range of γ observed at ultra-high energies. Propagation effects can
produce an energy dependence of the confinement parameter Q and, correspondingly, a steepening
of the spectrum toward the middle of the observed range 1 . γ . 2.9 The gyroradius of these UHECRs in a Galactic field of µG strength is considerably less than the
typical distance to a young neutron star (∼ 8 kpc). Since the iron arrival distribution at 1020 eV
probes similar trajectories to protons at a few times 1018 eV, Galactic iron nuclei would show a
nearly isotropic distribution with a slight correlation with the Galactic center and disk, at higher
energies.10 A supernova that imparts ESN = 1051E51 erg to the stellar envelope of mass Menv = 10 M1 M⊙
is considered. Also, that the condition for iron nuclei to traverse the supernova envelope without
significant losses is that Σ . 100 g cm−2 [193].
23

and
Pi < 8πB1/213 Z26 E−1
20 . (25)
For M1 = 2 and E20 = E51 = Z26 = 1, Eq (24) gives B13 < 15.4, whereas Eq. (25) leads
to Pi . 10 ms, not very restrictive values for a young neutron star, see for example the
Parkes Multibeam Pulsar Survey.11
2. Magnetars
Magnetars, neutron stars with surface dipole fields on the order of 1015 G [197, 198,
199, 200, 201], were also proposed as plausible sites for the generation of UHECRs [202].
Assuming that they occur in all galaxies which form massive stars (then avoiding the
large-distance GZK problem), and that the UHECR are arriving from outside our own
Galaxy, the luminous infrared galaxies are preferred sites to search for a magnetar
origin of CRs (see [203] and below the discussion in Section IIG).
The magnetar model for the acceleration of UHECRs proposed by Arons [202] is
a variant of that using neutron stars outlined in the previous Section. The theory
predicts an injection of charged particles with maximum energy
Emax = ZeΦi = ZeB∗Ω
2i
R3∗c
2= 3 × 10²²ZB15Ω
24 eV, (26)
where B∗ is a magnetar’s surface magnetic field, B15 = B∗/(1015 G), Ωi = 104Ω4 s−1
is the initial angular velocity of the neutron star, R∗ is the stellar radius, and c is the
speed of light. The initial rotation period is Pi = 0.64/Ω4 ms (if Z = 1−2, one requires
Pi < 2 − 3 ms for the model to be viable).
The ions actually gain their energy in the relativistic wind electromagnetically ex-
pelled from the neutron star at distances r larger than the radii of the star and its
magnetosphere. This avoids catastrophic radiation losses; the electric potential in the
wind is rE = rB = Φ. As the star spins down, as in the model by Blasi et al.,
the voltage and the maximum particle energies decline. Summing over the forma-
tion and spindown event, one finds a per event injection spectrum proportional to
f(E) = E−1[1 + (E/Eg)]−1 for E < Emax. Here Eg measures the importance of grav-
itational wave losses (calculated for a star with static non-axisymmetric quadrupole
11 The Parkes multibeam pulsar survey is a large-scale survey of a narrow strip of the inner Galactic
plane (|b| < 5, 260 < l < 50, see [194] and references therein). It has much greater sensitivity
than any previous survey to young and distant pulsars along the Galactic plane, and it has resulted
in the detection of many previously unknown young pulsars, potentially counterparts of unidentified
γ-ray sources, e.g. [195, 196].
24

asymmetry) in spinning the star down. When they exert torques larger than the elec-
tromagnetic torque, the star spends less time at the fastest rotation rates (i.e. less
time accelerating the highest energy particles), thus causing a steepening in the spec-
tral slope at the highest energies. If the star has an internal magnetic field even stronger
than the already large surface field, equatorial ellipticities ǫe in excess of 10−3 can exist,
in which case Eg would be less than Emax. Three cases of energy loss due to gravi-
tational radiation (GR) were considered in the model: no GR loss (ǫe = 0, Eg = ∞);
moderate GR loss (ǫe = 0.01, Eg = 3×10²⁰ eV); strong GR loss (ǫe = 0.1, Eg = 3×10¹⁸
eV). If one assumes that all magnetars have exactly the same starting voltage (1022.5 V),
then the model predicts that the spectrum E3J(E) should rise with E above the en-
ergy Eg = 2.8 × 10²⁰ eV, where the GZK loss rate becomes approximately energy
independent (unless the gravitational wave losses are large) [202]. This prediction will
certainly be testable with the Pierre Auger Observatory.
The total number of particles injected per event is
Ni ≈ 2c2R3
∗I
ZeB∗
≈ 1043
ZB15
, (27)
for a stellar radius of 10 km and a moment of inertia I = 1045 cgs. The rate at which
galaxies inject UHECR into the universe in this model then is ncr = νfastmagNingalaxy,
where ngalaxy ≈ 0.02 Mpc−3 [204], Ni is given by Eq. (27), and νfastmag is the birth
rate of rapidly rotating magnetars per galaxy. Multiplication of the source spectrum
q(E) ∝ ncrf(E) by the energy dependent GZK loss time yields a spectrum received
at the Earth in reasonable accord with the existing observations of UHECR if νfastmag ≈
10−5 yr−1 [202]. That fast magnetar birth rate lies between 1% and 10% of the total
magnetar birth rate inferred for our galaxy, and about 0.1% of the total core collapse
supernova rate in average star forming galaxy, ∼ 10−2 yr−1 [205].
3. UHECRs from a pulsar in Cygnus OB2?
As discussed in Sec. IIA, some evidence may be emerging for a CR accelerator in
the Cygnus spiral arm. The HEGRA experiment has detected an extended TeV γ-
ray source in the Cygnus region with no clear counterpart and a spectrum not easily
accommodated with leptonic radiation [152]. The difficulty in accommodating the
spectrum by conventional electromagnetic mechanisms has been exacerbated by the
failure of Chandra and VLA to detect significant levels of X-rays or radiowaves signaling
acceleration of any electrons [153]. Especially intriguing is the possible association of
this source with part of Cygnus OB2 itself [151], a cluster of several thousands young,
hot OB stars with a total mass of ∼ 104 M⊙ [206]. At a relatively small distance to
Earth, ≈ 1.7 kpc, this is the largest massive Galactic association. It has a diameter of
25

≈ 60 pc and a core radius of ∼ 10 pc. The typical main sequence evolution lifetime of
massive O stars is O (Myr) and a few tens Myr for massive B stars. Since the O-star
population should pass through the Wolf-Rayet phase and explode as supernovae, very
fast pulsars are expected to be born in explosions of these massive stars at a rate of
about one every ten thousand years.
Apart from the mentioned interpretation of a hadronic production of the TeV ra-
diation within the winds of outlying OB stars of Cyg OB2 [151], it was recently put
forward that the TeV emission reported by HEGRA and the CR anisotropy observed
at about 1018 eV in the direction of the Cygnus region can be related to a young pulsar
and its pulsar wind nebulae (PWN), born in the Cygnus OB2 association a few ten
thousands years ago [207]. The TeV γ-ray emission would originate in the PWN as a
result of interactions of high energy hadrons and/or leptons, whereas there would be
a directional CR signal due to neutrons that are dissolved from heavy nuclei acceler-
ated by the pulsar.12 Within this model, however, it is hard to explain the absence of
counterparts at lower (EGRET) energies at the location of the TeV source, as well as
the absence of a stronger X-ray source.13 However, disregarding these difficulties, an
interesting consequence for CR physics can be inferred.
As already discussed in Sec. IIC 1, heavy nuclei can attain ultra high energies through
magnetic sling shots inside the neutron star wind zone. The small part of nuclei, which
escaped from the pulsar wind nebula, are likely to be captured by strong magnetic fields
of dense regions of the OB association. Magnetic field strengths in dense molecular
clouds are expected to be ∼ 1 mG [209]. Thus, nuclei with E/Z ∼ 1 EeV propagate
attaining Bohm diffusion [207]. The resulting time delay of several thousand years [210]
produces a steepening of the characteristic power law injection spectrum, ∝ E−2,
of the pulsar nebula.14 In their random traversal of the OB association, the nuclei
undergo photodisintegration on the far infrared thermal photon population and liberate
neutrons.
12 A similar scenario would explain the anisotropy spot towards the Galactic Center [208].13 Indeed, location problems may arise as well: the PWN size (given that the TeV source size is 6
pc if indeed located at 1.7 kpc, and that the source is diffuse) would make the PWN substantially
larger than both Vela’s PWN (∼0.1 pc at 250 pc) and Crab’s (∼1 pc). Additionally, if one were to
associate the nearby EGRET source 3EG 2033+4118 with the putative pulsar itself, it is unclear
whether the PWN hypothesis for the TeV source would imply that it is only a one sided PWN (Y.
Butt, private comunication).14 Note that once diffusion has been established, additional Rayleigh steps in the Galactic magnetic
field do not change the spectral index (∼ −3) significantly.
26

The thermal photon density at the source reads,
nIR =T 3
π2
∫ x2
x1
x2 dx
ex − 1≈ (4.37 T )3
π2
∫ x2
x1
x2 dx
ex − 1cm−3, (28)
where T is the kinetic temperature of the molecular cloud, x ≡ Eγ/T, and Eγ is the
target photon energy in degrees K. The relevant photon energy range is established via
standard kinematics of the photodisintegration process,
Eγ =E∗ mN
(EA/A)= 10
E∗MeV
EN,PeVK , (29)
where 5 < E∗MeV < 25 is the energy region for giant dipole resonance contribution
in the nucleus rest frame, and EA/A ≡ EN,PeV is the lab frame energy/nucleon. For
EN,PeV ∼ 103, Eq. (29) leads to x1 = 50/T and x2 = 250/T, with T in degree Kelvin.
Molecular clouds with HII regions have temperatures between 15 and 100 K [211],
thus taking an average photodisintegration cross section of 40 mb,15 we find that the
nucleus mean free path lies between 0.80 and 380 pc. This corresponds to a reaction
time between 4 to 1500 yr ≪ time delay, allowing sufficient neutron production to
explain the anisotropy [65].
The Galactic anisotropy observed by the various collaborations spans the energy
range 0.8 to 2.0 EeV. The lower cutoff specifies that only neutrons with EeV energies
and above have a boosted cτn sufficiently large to serve as Galactic messengers. The
decay mean free path of a neutron is c Γn τn = 10 (En/EeV) kpc, the lifetime being
boosted from its rest-frame value τn = 886 seconds to its lab value via Γn = En/mn.
Actually, the broad scale anisotropy from the direction of the GP reported by Fly’s Eye
Collaboration [61] peaks in the energy bin 0.4 − 1.0 EeV, but persists with statistical
significance to energies as low as 0.2 EeV. This implies that if neutrons are the carriers
of the anisotropy, there needs to be some contribution from at least one source closer
than 3 - 4 kpc. Interestingly, the full Fly’s Eye data include a directional signal from
the Cygnus region which was somewhat lost in unsuccessful attempts [212, 213] to
relate it to γ-ray emission from Cygnus X-3. The upper cutoff reflects an important
feature of photodisintegration at the source: heavy nuclei with energies in the vicinity
of the ankle will fragment to neutrons with energies about an order of magnitude
smaller. To account for the largest neutron energies, it may be necessary to populate
the heavier nucleus spectrum in the region above the ankle.16 This is not a problem
– one fully expects the emerging harder extragalactic spectrum to overtake and hide
15 The photoabsorption cross section roughly obeys the Thomas-Reiche-Kuhn sume rule, i.e., Σd =
60NZ/A mb-MeV [110].16 To produce the highest energy neutrons (with energy . 1018.2 eV) via photodisintegration of
medium mass (say, A = 10− 20) nuclei, one needs primary particles with energies . 1019.2 eV. For
27
the steeply falling galactic population. It is not therefore surprising that in order to
fit the spectrum in the anisotropy region and maintain continuity to the ankle region
without introducing a cutoff, the AGASA Collaboration required a spectrum ∝ E−3
or steeper [59].
For every surviving neutron at ∼ EeV, there are many neutrons at lower energy that
decay via n → p + e− + νe. The proton is bent by the Galactic magnetic field, the
electron quickly loses energy via synchrotron radiation, and the νe travels along the
initial neutron direction, producing a directed TeV energy beam [65]. The sensitivity
of forthcoming neutrino telescopes to this signal is discussed in Sec. IVB.
D. Radio Galaxies and Active Galactic Nuclei
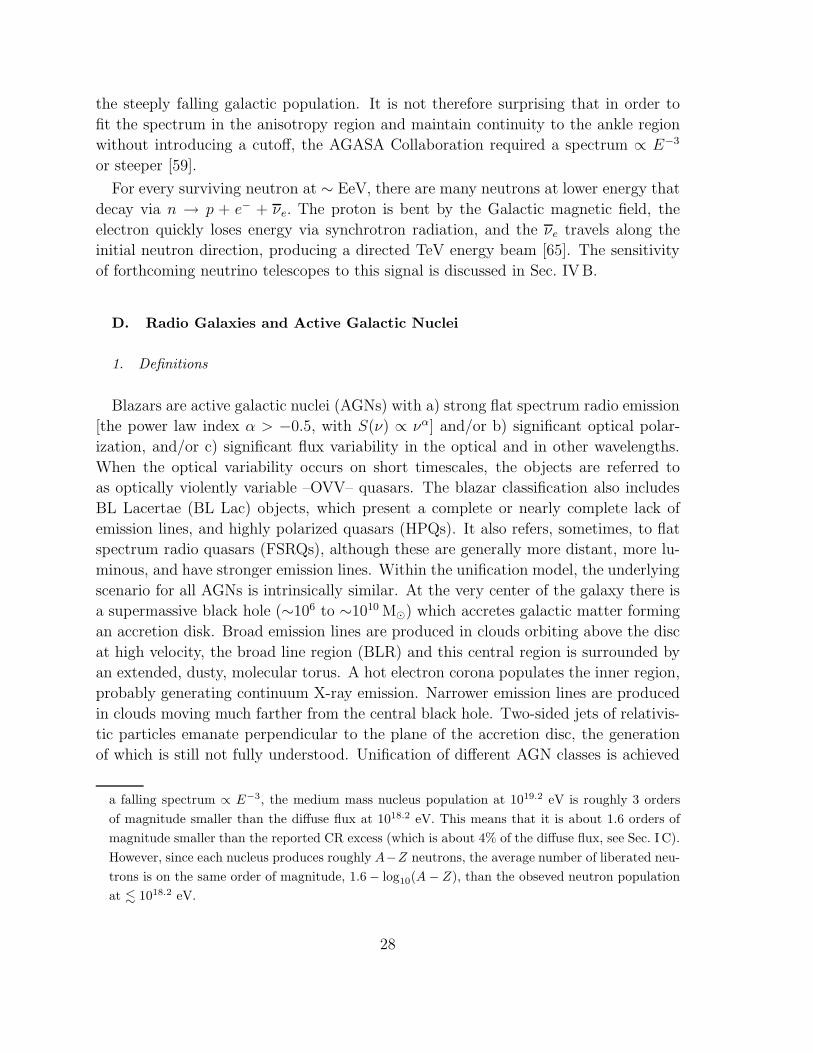
1. Definitions
Blazars are active galactic nuclei (AGNs) with a) strong flat spectrum radio emission
[the power law index α > −0.5, with S(ν) ∝ να] and/or b) significant optical polar-
ization, and/or c) significant flux variability in the optical and in other wavelengths.
When the optical variability occurs on short timescales, the objects are referred to
as optically violently variable –OVV– quasars. The blazar classification also includes
BL Lacertae (BL Lac) objects, which present a complete or nearly complete lack of
emission lines, and highly polarized quasars (HPQs). It also refers, sometimes, to flat
spectrum radio quasars (FSRQs), although these are generally more distant, more lu-
minous, and have stronger emission lines. Within the unification model, the underlying
scenario for all AGNs is intrinsically similar. At the very center of the galaxy there is
a supermassive black hole (∼106 to ∼1010 M⊙) which accretes galactic matter forming
an accretion disk. Broad emission lines are produced in clouds orbiting above the disc
at high velocity, the broad line region (BLR) and this central region is surrounded by
an extended, dusty, molecular torus. A hot electron corona populates the inner region,
probably generating continuum X-ray emission. Narrower emission lines are produced
in clouds moving much farther from the central black hole. Two-sided jets of relativis-
tic particles emanate perpendicular to the plane of the accretion disc, the generation
of which is still not fully understood. Unification of different AGN classes is achieved
a falling spectrum ∝ E−3, the medium mass nucleus population at 1019.2 eV is roughly 3 orders
of magnitude smaller than the diffuse flux at 1018.2 eV. This means that it is about 1.6 orders of
magnitude smaller than the reported CR excess (which is about 4% of the diffuse flux, see Sec. I C).
However, since each nucleus produces roughly A−Z neutrons, the average number of liberated neu-
trons is on the same order of magnitude, 1.6 − log10(A − Z), than the obseved neutron population
at . 1018.2 eV.
28

FR II (NLRG)
SSRQ
FR I (NLRG)
Seyfert 1
QSO
FR IIFR
I
radio-quiet
BL Lac
FSRQ
Seyfert 2
radio-loud
FIG. 5: The unification model for AGNs. The components of the figure are discussed in the
text. Blazars are those AGNs for which the jets are close to line of sight. A regular quasar
or a Seyfert 1 galaxy is observed if the orientation angle is ∼ 30o, where the narrow-line
and broad-line regions are visible. At larger angular offsets, the broad-line region will be
hidden by the torus, the corresponding class being Seyfert 2 galaxies. Perpendicular to the
jet axis, the full extent of the jets may be seen particular at low frequencies, giving rise to a
morphology typical of radio galaxies. The figure is adapted from Refs. [214, 215, 216, 217].
taking into account the intrinsic anisotropy of the phenomenon, is shown in Fig. 5 (see
Refs. [214, 215, 216, 217] for further and more detailed discussions).
For example, Seyfert galaxies possess a dusty torus of gas at distances intermediate
between the BLR and NLR (narrow line region). An observer whose line of sight
to the black hole intercepts this torus would see a heavily reddened (or completely
extinguished) BLR and central continuum radiation but an unreddened NLR. This
would be identified with a Seyfert 2 galaxy. If the line-of-sight does not intercept the
torus, the central regions of the nucleus can be observed directly, leading to a Seyfert
1 classification. Radio loud quasars are then objects in which the line-of-sight is close
29

to the jet cone of the source. In the cases in which we are not directly looking into
the jet cone –blazars where relativistic effects produce highly variable and continuum
dominated emission– emission from the BLR can be observed. Objects with larger
inclinations have a less dominant central continuum flux, resulting in Fanaroff-Riley II
(FRII) galaxies. If the torus surrounding the black hole obscures the BLR, a narrow
line radio galaxy (NLRG) can be observed. It is not clear how FRI radio galaxies fit into
such a scheme. Clearly, some (as yet unknown) physical mechanism, probably related
to source power, produces different radio morphologies in FRI and FRII sources.17
Some blazars may be beamed FRI objects, but there is a lack of broad-line FRI radio
galaxies [214]. This make the classification within the unified scheme harder to achieve.
2. Radiogalaxies
FRII galaxies [219] are the largest known dissipative objects (non-thermal sources) in
the Universe. Localized regions of intense synchrotron emission, known as “hot spots”,
are observed within their lobes. These regions are presumably produced when the
bulk kinetic energy of the jets ejected by a central active nucleus (supermassive black
hole + accretion disk) is reconverted into relativistic particles and turbulent fields at
a “working surface” in the head of the jets [220]. Specifically, the speed vh with which
the head of a jet advances into the intergalactic medium of particle density ne can be
obtained by balancing the momentum flux in the jet against the momentum flux of
the surrounding medium. Measured in the frame comoving with the advancing head,
vh ≈ vj [1 + (ne/nj)1/2]−1, where nj and vj are the particle density and the velocity
of the jet flow, respectively. vj > vh for ne ≥ nj, and the jet will decelerate. The
result is the formation of a strong collisionless shock, which is responsible for particle
reacceleration and magnetic field amplification [221]. The acceleration of particles up
to ultrarelativistic energies in the hot spots is the result of repeated scattering back
and forth across the shock front [222]. Dimensional arguments suggest that the energy
density per unit of wave number of MHD turbulence is of the Kolmogorov type [223],
and so for strong shocks the acceleration time for protons is [224]
τacc ≃40
π
1
c β2jet
1
u
(
E
eB
)1/3
R2/3 (30)
17 The Faranoff-Riley classification is based on one parameter, RFR, the ratio of the distance between
the regions of highest surface brightness on opposite sides of the central galaxy to the total extent
of the source. Objects with RFR < 0.5 are classified as FRI, whereas those with RFR > 0.5 are
classified as FRII. It is found that the brighter sources are all FRII class, although the distinction
between classes is not clear cut in luminosities (for further details see page 220 of Ref. [218]).
30

where βjet is the jet velocity in units of c, u is the ratio of turbulent to ambient magnetic
energy density in the region of the shock (of radius R), and B is the total magnetic
field strength. The acceleration process will be efficient as long as the energy losses
by synchrotron radiation and photon–proton interactions do not become dominant.
The subtleties surrounding the conversion of a particle kinetic energy into radiation
provide ample material for discussion [222, 225, 226, 227, 228, 229]. The proton blazar
model relates γ-ray emission to the development of electromagnetic cascades triggered
by secondary photomeson products that cool instantaneously via synchrotron radia-
tion [222, 225, 226, 227, 228]. The synchrotron loss time for protons is given by [230]
τsyn ∼ 6 π m3p c
σT m2e Γ B2
, (31)
where me, mp, σT and Γ are the electron mass, proton mass, Thomson cross section,
and Lorentz factor, respectively. The characteristic single photon energy in synchrotron
radiation emitted by an electron is
Eγ =
(
3
2
)1/2h e E2 B
2 π m3e c5
∼ 5.4 × 10⁻² BµG E220 TeV . (32)
For a proton this number is (mp/me)3 ∼ 6×10⁹ times smaller. High energy γ-ray pro-
duction through proton synchrotron radiation requires very large, O(100 G), magnetic
fields. Considering an average cross section σγp for the three dominant pion–producing
interactions [231], γp → pπ0 , γp → nπ+ , γp → pπ+π− , the time scale of the energy
losses, including synchrotron and photon interaction losses, reads [222]
τloss ≃6π m4
p c3
σT m2e B2 (1 + Aa)
E−1 =τsyn
1 + Aa, (33)
where a stands for the ratio of photon to magnetic energy densities and A gives a
measure of the relative strength of γp interactions versus the synchrotron emission.
Note that the second channel involves the creation of ultrarelativistic neutrons (but
Γn . Γp) with mean free path in the observer rest frame given by λn = Γncτn, where
τn ∼ 900 s, is the neutron lifetime. Since λn > λp for Γn . Γp max, such neutrons can
readily escape the system, thereby modifying the high end of the proton spectrum.
Biermann and Strittmatter [222] have estimated that A ≈ 200, almost independently
of the source parameters. The most energetic protons injected in the intergalactic
medium will have an energy that can be obtained by balancing the energy gains and
losses [125]
E20 = 1.4 × 10⁵ B−5/4µG β
3/2jet u3/4 R
−1/2kpc (1 + Aa)−3/4 , (34)
where Rkpc ≡ R/1 kpc.
31

For typical hot-spot conditions (B ∼ 300 µG, u ∼ 0.5, and βjet ∼ 0.3) and assuming
that the magnetic field of the hot spot is limited to the observable region, one obtains
E < 5 × 10²⁰ eV for a < 0.1 [232].18 Particles can also attain ultrahigh energies
(E & 1020 eV) within the jets or the AGNs themselves. For instance, the knot A
in the M87 jet, with a length scale l87 ∼ 2 × 1020 cm, has a magnetic field strength
B87 ∼ 300 µG [233]. Typical AGN sizes are lAGN ∼ 1015 cm, and BAGN ∼ 1 G [234].
Observational evidence suggests that in the jets a ≪ 1, whereas a ∼ 1 for AGNs [222].
3. Cen A: The source of most UHECRs observed at Earth?
Centaurus A (Cen A) is the nearest active galaxy, ∼ 3.4 Mpc [235]. It is a complex
FRI radio-loud source identified at optical frequencies with the galaxy NGC 5128.
Different multi-wavelength studies have revealed that it is comprised of a compact
core, a jet also visible at X-ray frequencies, a weak counterjet, two inner lobes, a
kpc-scale middle lobe, and two giant outer lobes. The jet would be responsible for the
formation of the northern inner and middle lobes when interacting with the interstellar
and intergalactic media, respectively. There appears to be a compact structure in the
northern lobe, at the extrapolated end of the jet. This structure resembles the hot
spots such as those existing at the extremities of FRII galaxies. However, at Cen A,
it lies at the side of the lobe rather than at the most distant northern edge, and the
brightness contrast (hot spot to lobe) is not as extreme [236].
Low resolution polarization measurements in the region of the suspected hot spot give
magnetic fields as high as 25 µG [236]. However, in certain regions where measurements
at both high and low resolution are available, the B-field amplitude at high resolution
can be seen to be twice that at low resolution. The higher resolution can reveal
amplification in the post-shock region [237], yielding B-fields possibly as high as 50 −60 µG [238, 239]. The radio-visible size of the hot spot can be directly measured from
the large scale map [240], giving RHS ≃ 2 kpc. The actual size can be larger by a factor
∼ 2 because of uncertainties in the angular projection of this region along the line of
sight.19 Then, if the magnetic field of the hot spot is confined to the visible region, the
limiting energy imposed by the Hillas’ criterion is Emax ∼ 1020.6 eV.
Estimates of the radio spectral index of synchrotron emission in the hot spot and
18 The shock structure in hot spots is likely to be much more extended than the visible region in the
non-thermal radioemission, as suggested by magnetohydrodynamical modeling [232].19 For example, an explanation of the apparent absence of a counterjet in Cen A via relativistic
beaming suggests that the angle of the visible jet axis with respect to the line of sight is at most
36 [236], which could lead to a doubling of the hot spot radius. It should be remarked that for a
distance of 3.4 Mpc, the extent of the entire source has a reasonable size even with this small angle.
32

the observed degree of linear polarization in the same region suggests that the ratio of
turbulent to ambient magnetic energy density in the region of the shock is u ∼ 0.4 [241].
The jet velocity is model dependent: possible values range from ∼ 500 km s−1 to
0.99 c [236]. For FRI galaxies, the ratio of photon to magnetic energy densities, a, is
expected to be ≪ 1. Now, by replacing these numbers into Eq. (34), one can easily see
that Cen A can accelerate particles to energies & 1020 eV, with a maximum attainable
energy set by the Hillas’ criterion.20
Recent observations of the γ ray flux for energies > 100 MeV by EGRET [243]
allow an estimate Lγ ∼ 1041 erg s−1 for the source.21 This value of Lγ is consistent
with an earlier observation of photons in the TeV-range during a period of elevated
activity [244], and is considerably smaller than the estimated bolometric luminosity
Lbol ∼ 1043erg s−1[235]. Data across the entire γ ray bandwidth of Cen A is given in
Ref.[245], reaching energies as high as 150 TeV [246], though data at this energy await
confirmation. For values of B in the µG range, substantial proton synchrotron cooling
is suppressed, allowing the production of high energy electrons through photomeson
processes. The average energy of synchrotron photons scales as Eγ ≃ 0.29Eγ [247].
With this in mind, it is straightforward to see that to account for TeV photons, Cen
A should harbor a population of ultra-relativistic electrons with E ∼ 6 × 10¹⁸ eV. We
further note that this would require the presence of protons with energies between one
and two orders of magnitude larger, since the electrons are produced as secondaries.22
There are plausible physical arguments [228, 248] as well as some observational rea-
sons [249] to believe that when proton acceleration is being limited by energy losses,
the CR luminosity LCR ≈ Lγ . Defining ǫ, the efficiency of UHECR production com-
pared to high energy γ production – from the above, ǫ ≃ 1 – and using equal power
per decade over the interval (Emin, Emax), the source luminosity is found to be [250]
E2 dNp+n0
dE dt≈ 6.3 ǫL41 1052eV/s
ln(Emax/Emin), (35)
where L41 ≡ luminosity of Cen A/1041erg s−1 and the subscript “0” refers to quantities
at the source.
For fiducial values, B = 0.5 µG, ℓ = 0.5 Mpc, the diffusive distance traveled by CRs
with E = 1019 eV, is cτD = 50 Mpc ≫ d = 3.4 Mpc. Moreover, one can easily check
20 It was recently suggested [242] that the 25 kpc jet (with B ≈ 10 µG) of Cen A could be another
promising region for proton acceleration to ultra high energies.21 Note that the received radiation is negligibly affected by interactions with the various radiation
backgrounds [229].22 Consecutive factors of ∼ 2 energy loss occur in the processes pγ → Nπ0, π0 → γγ, γ → e+e−.
Eq.(32) then implies proton energies of ∼ 1020 eV for 100 TeV photons.
33

that for 3.4 Mpc the diffusion time of any proton with energy above the photopion
production threshold is always less than the GZK-time, and consequently energy losses
can be safely neglected. This implies that the density of protons at the present time t of
energy E at a distance r from Cen A (which is assumed to be continuously emitting at
a constant spectral rate dNp+n0 /dE dt from time ton until the present) can be obtained
by solving the Kolmogorov-diffusive-equation, and is found to be [251]
dn(r, t)
dE=
dNp+n0
dE dt
1
[4πD(E)]3/2
∫ t
ton
dt′e−r2/4D(t−t′)
(t − t′)3/2=
dNp+n0
dE dt
1
4πD(E)rI(x) , (36)
where D(E) is the diffusion coefficient given in Eq. (7), x = 4DTon/r2 ≡ Ton/τD,
Ton = t − ton, and
I(x) =1√π
∫ ∞
1/x
du√u
e−u . (37)
For Ton → ∞, the density approaches its time-independent equilibrium value neq, while
for Ton = τD, n/neq = 0.16.
To estimate the power of Cen A, one can evaluate the energy-weighted approximately
isotropic proton flux at 1.5× 10¹⁹ eV, which lies in the center of the flat “low” energy
region of the spectrum,
E3Jp(E) =Ec
(4π)2d D(E)
E2 dNp+n0
dE dtI(t/τD) ≈ 7.6 × 1024 ǫL41 I eV2 m−2 s−1 sr−1. (38)
In Eq. (38) we have used the fiducial values of B and ℓ as given in the previous
paragraph, and set Emin = 1 × 10¹⁹ eV, Emax = 4 × 10²⁰ eV. As noted by Farrar
and Piran [250], by stretching the source parameters the “low” energy flux from Cen
A could be comparable to that of all other sources in the Universe. To this end,
first fix ǫ L41 I = 0.40, after comparing Eq. (38) to the observed CR-flux by AGASA:
E3Jobs(E) = 1024.5 eV2 m−2 s−1 sr−1 [74]. Next, ǫL41 ≃ 1, determines I ≃ 0.40, and
consequently the required age of the source Ton to be about 400 Myr, which appears
plausible [221, 249]. To maintain flux at the “ankle” for the same Ton, one requires an
approximate doubling of LCR at 5× 10¹⁸ eV. Because of the larger diffusive time delay
at this energy, this translates into an increased luminosity in the early phase of Cen
A. From Eq. (32), the associated synchrotron photons are emitted at energies < 30
MeV. The increase in radiation luminosity in this region is not inconsistent with the
flattening of the spectrum observed at lower energies[252, 253].
Having identified Cen A to plausibly be a powerful source of UHECRs, we now
explore whether B-field deflections provide correct directional properties, i.e., sufficient
isotropy. This can be found by computing the incoming current flux density D∇n as
viewed by an observer on Earth, and one finds for a continuously-emitting source a
34

distribution ∼ (1 + α cos θ) about the direction of the source, where θ is the angle to
the zenith and
α =2D(E)
cr
I ′
I, I ′(x) =
1√π
∫ ∞
1/x
du√
u e−u, (39)
with x = Ton/τD, and I as defined in Eq. (37) [251]. For our choices of B and ℓ, and
Ton = 400 Myr, we find for E = 1019 eV (E = 1020 eV) that α = 0.04 (α = 0.07). This is
in complete agreement with the upper bounds on dipole anisotropies recently reported
by HiRes Collaboration [73]. One caveat is that the large deflection angle of the highest
energy Fly’s Eye event with respect to the line of sight to Cen A must be explained as
a 2σ fluctuation [254]. Additionally, Monte Carlo simulations [255] show the predicted
auto-correlation function is not consistent with the clustering at small scale reported
by AGASA Collaboration [74]. Therefore, if the hypothesis of CR pairing proposed by
AGASA Collaboration is confirmed by future data, it will constitute a serious objection
to the model outlined above. On the other hand, an interesting observational feature
for a Cen A origin of UHECRs is the possible detection of neutrons, which at the highest
energies could survive decay and produce a spike in the direction of the source [251].
The estimated event rate at PAO is about 2 direct events per year, against negligible
background. Thus, in a few years of running, the hypothesis of Cen A as the source of
most UHECRs observed at Earth can be directly tested.
4. M87: The end of all roads?
M87 is a giant radio galaxy for which there has been a recent report of a TeV
excess at a level of 4σ [256]. It is also expected to be a source for GLAST, having an
EGRET upper limit of 2.8 × 10⁻⁸ photons cm−2 s−1 above 100 MeV (Reimer, private
communication, see also the limit imposed in Ref. [257]), and comparable theoretical
flux predictions [258, 259].
M87 was thought as a high-energy CR emitter since quite long ago [260, 261]. At
a distance of 16.3 Mpc [262], it is the dominant radio galaxy in the Virgo cluster
(l = 282, b = 74) [263]. The emission of synchrotron radiation with a steep cutoff
at frequencies about 3× 10¹⁴ Hz from its radiojets and hot spots [264, 265] implies an
initial turbulence injection scale having the Larmor radius of protons at 1021 eV.
The major difficulty with a M87 generation of UHECRs is the observation of the
nearly isotropic distribution of the CR arrival directions. One can again argue that
the orbits are bent. However, the bending cannot add substantially to the travel time,
otherwise the energy would be GZK-degraded. An interesting explanation to overcome
this difficulty relies on a Galactic wind, akin the solar wind, that would bend all the
orbits of the highest energy CRs towards M87 [266, 267]. Indeed, it has long been
35

expected that such a kind of wind is active in our Galaxy [268, 269, 270]. In the analysis
of [266], it was assumed that the magnetic field in the Galactic wind has a dominant
azimuthal component, with the same sign everywhere. This is because in a spherical
wind the polar component of the magnetic field becomes negligible rather quickly,
decaying like 1/r2, and thus the azimuthal part of the magnetic field quickly becomes
dominant, with Bφ ∼ sin θ/r in polar coordinates [271]. Under these considerations
one is left with two degrees of freedom: the strength of the azimuthal component at
the location of the Sun, and the distance to which this wind extends. Recent estimates
suggest that the magnetic field strength near the Sun is ∼ 7 µG [130]. The second
parameter is more uncertain. Our Galaxy dominates its near environment well past our
neighbor, M31, the Andromeda galaxy, and might well extend its sphere of influence
to half way to M81. This implies an outer halo wind of ∼ 1.5 Mpc. With this in mind,
the mean flight time of the protons in the Galaxy is ∼ 5.05 × 10⁶ yr ≪ τs, the time
for straight line propagation from M87 (Medina Tanco, private communication). The
directions where the 13 highest energy CR events point towards when they leave the
halo wind of our Galaxy is consistent with an origin in the Virgo region [266]: (i) for
CR protons, except for the two highest energy events, all other events can be traced
back to within less than about 20 from Virgo; (ii) if one assumes that the two highest
events are helium nuclei, all 13 events point within 20 of Virgo. Arguably, the super-
Galactic plane sheet can focus UHECRs along the sheet. Hence, the particles would
arrive at the boundary of our Galactic wind with the arrival directions described by
an elongated ellipse along the super-Galactic plane sheet [272]. This would allow a
bending of 20 to be accomodated.
Additionally, in order to account for most of the CRs observed above the ankle,
the power requirement of Virgo cluster [273] needs a fine-tuning of the source direction
relative to the symmetry axis of the wind, so as to turn on magnetic lensing effects [274].
In such a case, M87 could be as high as > 102 times more powerful than if unlensed at
energies below E/Z ∼ 1.3×10²⁰ eV. Criticisms of this model [275] have been addressed
in [276].
5. Other powerful nearby radiogalaxies
Apart from Cen A (which would provide the most energetic particles detectable on
Earth), the CR-sky above PAO, if populated by radiogaxies, should be dominated by
Pictor A (a strong source with a flat radio spectrum) which would contribute with the
larger CR flux [232], and PKS 1333-33 [277]. Other two southern candidates would be
Fornax A (z = 0.057) and PKS 2152-69 (z = 0.027), which could provide contributions
to the CR flux above the cutoff. For other powerful sources and their properties
see [232, 278].
36

There are two additional EGRET sources, one of them at high latitude, for which
a possible radio galaxy counterpart has been suggested. One such source is 3EG
J1621+8203 (l = 115.5o, b = 31.8o) [279]. 3EG J1621+8203 observations in individual
viewing periods yielded near-threshold detections by EGRET, as for Cen A. However,
in the cumulative exposure, it was clearly detected and the measured flux above 100
MeV was 1.1 × 10⁻⁷ photon cm−2 s−1. The photon spectral index for this source is
2.27±0.53, steeper than the usual blazar-like spectrum. Mukherjee et al. [279] analyzed
the X-ray and radio field coincident with 3EG J1621+8203 and concluded that NGC
6251, a bright FRI radio galaxy [214] at a redshift of 0.0234 (implying a distance 91
Mpc for H0 = 75 km s−1 Mpc−1), and the parent galaxy of a radio jet making an angle
of 45o with the line of sight [280], is the most likely counterpart of the EGRET source.
With this identification, the implied γ-ray luminosity is also a factor of 10−5 below that
typical of blazars. Compared with Cen A, the greater distance to NGC 6251 could,
perhaps, be compensated by the smaller angle between the jet and the line of sight.
Combi et al. [281] have also recently reported the discovery of a new radio
galaxy, J1737−15, within the location error box of the low-latitude γ-ray source
3EG J1735−1500, whose photon index is Γ = 3.24 ± 0.47. The radio galaxy mor-
phology at 1.4 GHz is typical of the double-sided FRII. The integrated radio flux
is 55.6 ± 1.5 mJy at 1.4 GHz, the source is non-thermal and it is not detected at
4.8 GHz. Using the relation between approaching and receding jets: Sappr/Srec =
(1 + β cos θ/1 − β cos θ)2−α , as well as the radio fluxes of each jet component, a view-
ing angle in the range 79o−86o for a velocity β = v/c between 0.3 and 0.9 and α = −1
is derived. Depending on the jet and ambient medium parameters, most double-sided
radio sources have sizes below ∼ 300 kpc [221]. In the case of J1737−15, and using
standard Friedmann-Robertson-Walker models, this size translates into a possible dis-
tance smaller than 350 Mpc. If 3EG J1735−1500 is indeed the result of γ-ray emission
in J1737−15, the intrinsic luminosity at E > 100 MeV, at the distance quoted, should
then be less than 2 × 1044 erg s−1, also several orders of magnitude smaller than that
of blazars. If both radiogalaxies are closer than 100 Mpc, they could also be relevant
acceleration sites of the observed UHECRs.
6. Correlations of UHECRs with QSOs, BL LACs, and EGRET sources
Since an alignment beyond random expectations between UHECRs and QSOs would
certainly constitute a great discovery, the possible correlation between UHECRs and
QSOs was subject to a great deal of scrutiny. In the spring of 1998, Farrar and Bier-
mann pointed out the existence of a directional correlation between compact radio-
QSOs and UHECRs: all events at the high end of the spectrum observed by that time,
with energy at least 1σ above 1019.9 eV, were aligned with high redshifted quasars, a
37

phenomenon with a chance probability of occurrence less than 0.5% [57]. Since then,
this correlation has been analyzed several times. Hoffman stated that one of the 5
events used in the Farrar and Biermann’s study, the highest energy event observed by
the Fly’s Eye experiment, should not be included in the UHECR sample under anal-
ysis, because this very same event was considered to introduce the hypothesis [282].
Without this event, the positive alignment with random background probability is
increased to < 3%, in any case small enough as to be plausibly significant [111]. Us-
ing an updated event list (twice the size of the previous) from the Haverah Park [43]
and the AGASA [74] experiments, Sigl et al. [283] showed that the statistical signifi-
cance of the alignment is lowered to 27%. Other authors, however, favored the earlier
alignment [284], but their correlation signal comes from events with large uncertainty
both in energy and in position: they considered events from the SUGAR experiment,
although it is not clear whether all these events are above the GZK cutoff. Notwith-
standing, after the Haverah Park energy estimates have been re-assessed [142], the
original correlation has to be dropped altogether: for the cosmic rays in question, the
energy of the 2 events observed by this array with incident zenith angle < 45, that
was previously quoted as > 1019.9 eV at 1σ, is now shifted ≈ 30% downwards, below
the energy cut chosen by Farrar and Biermann. Hence, independently of the statistical
test used, when considering only the highest energy (> 1019.9 eV at 1σ) events the
correlation between UHECRs and QSOs is consistent with a random distribution at
the 1σ level.
Tinyakov and Tkachev [285, 286, 287] reported a correlation between the arrival
directions of UHECRs and BL Lacs. Specifically, the (22) BL Lacs chosen were those
identified as such in the (9th-Edition) Veron-Cetty and Veron (2000) [288] catalogue
of Quasars and Active Galactic Nuclei, with redshift z > 0.1 or unknown, magnitude
m < 18, and radio flux at 6 GHz F6 > 0.17 Jy. This analysis proposed no energy buffer
against contamination by mis-measured protons piled up at the GZK energy limit.23
The evidence supporting their claim is based on 6 events reported by the AGASA
Collaboration (all with average energy < 1019.9 eV), and 2 events recorded with the
Yakutsk experiment (both with average energy < 1019.6 eV), which were found to be
within 2.5 of 5 BL Lacs contained in the restricted sample of 22 sources. The chance
probability for this coincidence set-up was claim to be 2× 10⁻⁵. Here also the data set
used to make the initial assertion is also being used in the hypothesis testing phase.
What is further subject to critique, is that the imposed cuts on the BL Lac catalogue
were chosen so as to maximize the signal-to-noise ratio, compensating a posteriori the
23 The CR sample of Tinyakov and Tkachev consists of 26 events measured by the Yakutsk experiment
with energy > 1019.38 eV [289], and 39 events measured by the AGASA experiment with energy
> 1019.68 eV [74].
38

different cut adjustments by inclusion of a penalty factor [290]. Without such arbitrary
cuts, the significance of the correlation signal is reduced at the 1σ level. Not to anyone’s
surprise, even in acceptance of this approach, the estimated value of the penalty factor
is subject to debate [287, 290].
Recently, in order to test the hypothetical correlation between UHECRs and BL Lacs,
Torres et al. [291] performed a blind analysis using the Haverah Park [292] and Volcano
Ranch [293] data samples. Such an analysis shows no positional coincidences between
these two samples up to an angular bin > 5, an angular scale that is well beyond
the error in arrival determination of these experiments (≈ 3) [77]. On the basis of
the strongly correlated sample analyzed by Tinyakov and Tkachev, one expects the
distribution describing the correlation between the set of BL Lacs and any UHECR
data-set with 33 entries to be Poisson with mean ≈ 4.06. This implies a 2σ deviation
effect. Alternatively, the 95% CL interval of the distribution which samples the corre-
lation between the BL Lacs and CRs recorded by Volcano Ranch + Haverah Park is
(0, 3.09) [294], so that the probability to measure the expected mean value ≈ 4.06 is
≪ 5%. With this in mind, Torres et al. [291] conclude that the 8 coincidences found in
the Tinyakov and Tkachev’s analysis do not represent a statistically significant effect.
Additionally, Gorbunov et al. [295] claimed that a set of γ-ray loud BL Lacs can
be selected by intersecting the EGRET, the UHECR, and the BL Lac catalogs (all
conveniently cut). The only requirement Gorbunov et al. considered for an object
(here, a BL Lac) to be physically associated with an EGRET source is that the angular
distance between the best estimated position of the pair does not exceed 2×R95, where
R95 is the 95% confidence level contour of the EGRET detection. Torres et al. [291]
pointed out that identifying EGRET sources with BL Lacs (or any other object) just by
positional pairing within twice the EGRET error grossly underestimates the goodness
of existing γ-ray data. At this stage, it is worth recalling the reader that the typical
R95 radius for EGRET sources is 0.5–1. One can then argue that if the confidence
contours have any significance at all, a source should appear beyond the 95% contour
only a few percent of the time. Working with 114 EGRET sources above |b| > 10o,
Punsly [296] have estimated the number of random coincidences as a function of the
field radius: ∼ 2 (10) quasars with more than 1 Jy of 5 GHz flux are expected to
correlate by random chance if the size of the typical EGRET angular uncertainty is
0.7o (1.7o), see Fig. 6.
In our opinion, available statistics on the arrival directions of the UHECRs reveals
no significant correlations above random with BL Lacs nor with any other type of
quasars, including EGRET blazars.
39

0.8 1.0 1.2 1.4 1.6
2
4
6
8
10
12
14
16
18
20
22
24
26
28
30
Num
ber
of e
xpec
ted
fals
e po
sitiv
es
Distance [degrees] from EGRET detection
FIG. 6: The expected distribution of radio-loud quasars (louder than 0.5 Jy at 5 GHz) to
occur by random chance as a function of the distance from the center of the field for a sample
of 114 EGRET detections. Points represent the number of γ-ray detections for which the
counterparts are beyond the 95% confidence contour. The dotted curve are the boundaries of
the 68% confidence band for the hypothesis that the radio sources are randomly distributed
in the EGRET detection fields. Adapted from Punsly (1997). The number of sources whose
possible counterpart are beyond the 95% confidence contour is compatible with the chance
expectation.
E. Remnants of quasars
1. What is a quasar remnant and how would they accelerate particles?
Interestingly, the absence of powerful radio emitting objects in the direction of sev-
eral UHECRs led some colleagues to think that dead, faint objects, yet ones sufficiently
active as to accelerate particles up to relativistic energies, are responsible for the UHE-
CRs observed. Such is the idea behind the concept of quasar remnants (QRs) as
UHECR emitters [297, 298]: a spinning supermassive black hole, threaded by mag-
netic fields generated by currents flowing in a disc or torus, induces an emf which, if
vaccum breakdown is prevented and in the absence of severe energy losses, accelerate
a particle near the full voltage.
Although in the present epoch there is a paucity of luminous quasars (L & 1047 ergs
s−1), those which appear at large redshifts, the expected local number of dead quasars
associated with the same parent population is expected to be large [299, 300, 301].
40

Supermassive black holes are now to be found in the relatively dormant nuclei of giant
elliptical galaxies, generally regarded as QRs.24 The compact dynamo model has been
proposed as a natural mechanism for accelerating CRs in such environments [297]. In
this model [303], if B is the ordered poloidal field near the hole, V ∼ aB, where a is
the hole’s specific angular momentum (e.g., a = M for an extreme Kerr hole of mass
M). In an appropriate astrophysical scaling [304]
V ∼ 9 × 10²⁰(a/M)B4M9 V, (40)
where B4 ≡ B/(104G) and M9 ≡ M/(109M⊙). Assuming that the energy density of
the magnetic field near the event horizon is in equipartition with the rest mass energy
density of accreting matter [305], it is possible to introduce the accretion rate in the
voltage expression. In terms of an Advection Dominated Accretion Flow (ADAF)
model (e.g., Ref. [306]), for example,
B4 ∼ 1.4 M9−1M1/2, (41)
where M is the accretion rate dM/dt in M⊙ yr−1, and then, the maximum emf (a/M ∼1) is
V ∼ 1.2 × 10²¹M1/2 V. (42)
This potential is not, however, the maximum obtainable energy.
The rate of energy loss through curvature radiation by a particle of energy E = mc2Γ
can then be expressed as
P =2
3
e2cΓ4
ρ2, (43)
see [307] for a detailed explanation. Here, ρ is the average curvature radius of an
accelerating ion, assumed to be independent of the ion energy. The energy change per
unit length of an accelerating ion having charge Z and mass mi = µmp is given by
dǫ/ds = eZ∆V/h − P/c, (44)
where h is the gap height. After integration from s = 0 to h, the maximum acceleration
energy is obtained
Emax = 3 × 10¹⁹µZ1/4M1/29 B
1/44 (ρ2h/R3
g)1/4 eV. (45)
Consequently, only a fraction
η = 0.1µM−1/29 (ZB4)
−3/4(ρ/Rg)1/2(h/Rg)
−7/4; η ≤ 1, (46)
24 Indeed, the term “quasar remnants” was introduced by Chokshi and Turner [302] to describe the
present-epoch population of dead quasars harboring supermassive black hole nuclei.
41

of the potential energy available will be released as UHECRs; the rest will be radiated
in the form of curvature photons.
For a proton, the suppression ratio is E/[e(V )] ≈ [(50M9)−1/2B4
−3/4]r1/2, where r
denotes the magnetic field curvature in units of the Schwarzschild radius (h ∼ Rg)
[298]. For r ≈ 1 and M ≈ (0.1 − 10) M⊙ yr−1, and using the previous equations,
Emax = (1.0 − 1.8) × 1020M91/4 eV. (47)
Heavier nuclei would reach higher energies, but are subject to photo-disintegration.
For highly energetic protons, energy losses due to photo-pion production in collisions
with ambient photons also becomes a relatively important effect. A lower limit to the
radiation length (Λmin) for the proton energy loss associated with photo-pion produc-
tion is estimated by considering the population of target photons within the source
region [R(source radius) ≥ 2GM/c2] at radio frequencies ν ≥ 360(Γ/1011)−1 GHz is
given by [298]
Λ/R = cπR/(〈Kσpγ〉Q) (48)
= (278/〈Kσpγ,µb〉)(R/RS)M9(Q/1053 s−1)−1,
where σpγ,µb ≡ σpγ/10−30 cm2, RS is the Schwarzschild radius (twice the gravitational
radius Rg = GM), K ≡ 〈E(loss)〉/E(initial) is the inelasticity in a single collision [308]
and Q is the core emission rate (photons s−1) for electromagnetic radiation at ν > 360
GHz, given by Q = h−1∫
ν−1Lνdν where h is the Planck constant and Lν = 4πD2Fν
for a source of spectral density Fν at distance D. A useful approximation is that
[298] 〈Kσpγ,µb〉 ≡[∫
(Kσpγ,µb(dQ/dν)dν]
/Q < 120 µb. Those quasar remnants with
Λmin > R are expected to successfully accelerate protons up to ∼ Emax. Noteworthy,
the observed flux of CRs would apparently drain only a negligible amount of energy
from the black hole dynamo, since replenishing the particles ejected at high energies
(> 1020 eV) would only require a minimal mass input: a CR luminosity of 1042 ergs/s
in such particles (if protons) corresponds to a rest mass loss rate of less than 10−5M⊙
in a Hubble time.
2. Correlations of UHECRs with QRs
The first analysis of possible correlations between UHECRs and QRs was carried
out in Ref. [309], where, imposing very restrictive selection criteria –those necessary
for obtaining candidate objects providing the most favorable setting for a black hole
based compact dynamo model of UHECR production– a group of galaxies from the
Nearby Optical Galaxy (NOG) catalog of Giuricin et al. [310] was a priori selected as
42

individual plausible sources of CRs.25 It was found that nearby QR candidates present
an above-random positional correlation with the sample of UHECRs. Surprisingly,
this correlation appears on closer angular scales than that expected when taking into
account the deflection caused by typically assumed intergalactic or Galactic magnetic
fields.26
As one can see using Eq. (8), scattering in large scale magnetic irregularities O (nG)
are enough to bend the orbits of super-GZK protons by about 4 deg in a 50 Mpc
traversal (see, however, Ref. [311]). The CR angular offsets observed for the quasar
remnants in Ref. [309] are much smaller than θ whereas, for a variety of assumed
magnetic field scenarios, θ is often substantially larger than the estimated AGASA
measurement error of 1.6 degrees. Should the apparent clustering of correlated pairs
be supported by future data, perhaps a viable scenario under which this could occur
is that in which the intergalactic medium between Earth and the three apparently
‘clustered’ quasar remnants is sufficiently different from the intergalactic medium in
front of the remaining nine objects that are much more uniformly distributed on the
accessible sky. This appears at least plausible judging from the 100 micron map of the
region shown in Fig. 7.
For the deflection of an energetic (60 EeV) proton in traversing 34 Mpc (the mean
of the QRs distances in Table 3 of [309]) to be less than a degree, the magnetic field
must fulfill B < 2 × 10⁻¹⁰ ℓ−1/2 G, which appears to be not drastically different from
the canonical nG B field and the usually assumed coherence length ∼ 1 Mpc. Also, in
some directions, the magnetic field of our own galaxy could well lead to a deflection
of up to several degrees for primaries with energies below 60 EeV; see, for instance,
Table 1 of Ref. [133]. A recent study of this issue was presented by Alvarez-Muniz
et al. [312]. However, a possible filamentary topology of the Galaxy’s magnetic field
would likely allow some directional windows, albeit narrow, where the deflection of an
UHECR could be much less than typical.
In a very recent paper, Isola et al. [313] have studied predictions for large and
small scale UHECR arrival direction anisotropies in a scenario where the particles
are injected with a mono-energetic spectrum (all particles coming from a source are
emitted with the maximal energy of acceleration for that source as derived in that
same paper) by a distribution of QRs. They find that the sample of (37) QRs they
considered is distributed too anisotropically to explain the isotropic ultra high energy
CR flux except in the case where extragalactic magnetic fields of ≃ 0.1µG extend
25 The latter catalog is a complete magnitude-limited (corrected blue total magnitude B ≤ 14),
distance-limited (redshift z ≤ 0.02) sample of several thousand galaxies of latitude |b| > 20.26 Deflections due to the magnetic fields would of course be avoided if the primary were a photon,
generated in the neighborhood of the QR via an accelerated charged particle interaction.
43

FIG. 7: IRAS 100 micron view of the North Galactic Pole (white=high flux, dark blue=low
flux), towards the region of several QRs that appear coinciding with UHECRs. Small circles
mark the 12 galaxies (candidate quasar remnants) in the sample of Ref. [309]. Red circles
mark galaxies perhaps associated with UHECRs; white circles mark galaxies without asso-
ciated UHECRs. Note that the palusible UHECR sources tend to be found in directions
of lower 100 micron flux, [UHECR-coinciding source directions present IRAS fluxes 0.614 ±0.022 MJy/sr whereas the directions towards those galaxies non-coinciding with UHECRs
presnet 1.68 ± 0.63 MJy/sr.] To the extent that the 100 micron flux traces the Galactic dust
and magnetic field, then CRs are likely to be better aligned with their sources in directions
of low flux. Figure courtesy of Tim Hamilton.
over many Mpc. As statistical quantities for this analysis spherical multi-poles and
the autocorrelation function were used. For a weak magnetic field, of order 1 nG, the
predictions appear to be inconsistent with the observed distribution of arrival directions
of UHECRs, because the magnetic field is too weak to isotropize the distribution coming
from a limited number of non-uniformly distributed sources, as already pointed out in
Ref. [255]. Isola et al. also found that the contribution from the farthest sources is
completely negligible even for this weak magnetic field. None of the objects that were
found close to UHECR positions in the Torres et al. previous set were included in the
Isola et al. sample. Little further progress regarding possible correlation of sources
can be made until a much more larger set of UHECRs is recorded, something that will
44

have to wait to the operation of PAO.
3. TeV emission from QRs
A concomitant effect of UHECR emission from QRs is that, as shown by Levin-
son [314], the dominant fraction of the rotational energy extracted from the black hole
is radiated in the TeV band. He showed that the spectrum produced by the curvature
radiation of a single ion will peak at an energy
Eγ max = 1.5Γ3~c/ρ (49)
= 1.6 × 10⁻⁷Emaxµ−1(ZB4)
1/2(h/Rg)1/2 (50)
= 5M1/29 (ZB4)
3/4(ρ2h3/R5g)
1/4TeV, (51)
and is a power law I(Eγ) ∝ (Eγ)1/3 below the cutoff. The overall spectrum of curvature
photons would depend on the energy distribution of the accelerating particles, and is
expected to be somewhat softer below the peak. For Emax = 3 × 10²⁰ eV and h ∼ Rg,
Eγ max ≃ 50µ−1(ZB4)1/2 TeV. Then, provided that vaccum breakdown does not occur,
and that TeV photons can escape the system, QRs should emit γ-rays.
Indeed, it was recently noted by Neronov et al. [315] that the concomitant TeV
radiation would be at a level sufficiently high as to be (for many combination of the
system parameters) ruled out by bounds imposed by HEGRA/AIROBICC.
Recent numerical simulations additionally suggest that the accretion process and
magnetic field structure in the vicinity of the horizon can be non-stationary, owing
to rapid magnetic field reconnection [316]. This would probably lead to appreciable
complications of the model, as the location of the gap, the injection of seed particles
into the gap, and, perhaps, the voltage drop across it might change with time. How
should this affect the picture described above is unclear at present.
F. Starbursts
1. What are they?
Starbursts are galaxies (sometimes, the term also refers only to particular regions of
galaxies) undergoing a large-scale star formation episode. They feature strong infrared
emission originating in the high levels of interstellar extinction, strong HII-region-type
emission-line spectrum (due to a large number of O and B-type stars), and considerable
radio emission produced by recent SNRs. Typically, starburst regions are located close
to the galactic center, in the central kiloparsec. This region alone can be orders of
magnitude brighter than the center of normal spiral galaxies. From such an active
45

region, a galactic-scale superwind is driven by the collective effect of supernovae and
particular massive star winds. The enhanced supernova explosion rate creates a cavity
of hot gas (∼ 108 K) whose cooling time is much greater than the expansion time scale.
Since the wind is sufficiently powerful, it can blow out the interstellar medium of the
galaxy, preventing it from remaining trapped as a hot bubble. As the cavity expands,
a strong shock front is formed on the contact surface with the cool interstellar medium.
The shock velocity can reach several thousands of kilometers per second and ions like
iron nuclei can be efficiently accelerated in this scenario, up to ultrahigh energies, by
Fermi’s mechanism [317]. If the super-GZK particles are heavy nuclei from outside our
Galaxy, then the nearby (∼ 3 Mpc [318]) starburst galaxies M82 (l = 141, b = 41)
and NGC 253 (l = 89, b = −88) are prime candidates for their origin.
2. M82 and NGC253
M82 is probably the best studied starburst galaxy, located at only 3.2 Mpc. The
total star formation rate in the central parts is at least ∼ 10 M⊙ yr−1 [319]. The far
infrared luminosity of the inner region within 300 pc of the nucleus is ∼ 4 × 10¹⁰ L⊙
[320]. There are ∼ 1 × 10⁷ M⊙ of ionized gas and ∼ 2 × 10⁸ M⊙ of neutral gas in
the IR source [320, 321]. The total dynamical mass in this region is ∼ (1 − 2) × 109
M⊙ [321]. The main observational features of the starburst can be modelled with a
Salpeter IMF extending from 0.1 to 100 M⊙. The age of the starburst is estimated in
∼ (1− 3)× 107 yr [320]. Around ∼ 2.5× 10⁸ M⊙ (i.e. ∼ 36 % of the dynamical mass)
is in the form of new stars in the burst [321]. The central region, then, can be packed
with large numbers of early-type stars.
NGC 253 has been extensively studied from radio to γ-rays (e.g. [322, 323, 324]). A
TeV detection was reported by CANGAROO [325], but has been yet unconfirmed by
other experiments. More than 60 individual compact radio sources have been detected
within the central 200 pc [326], most of which are supernova remnants (SNRs) of only a
few hundred years old. The supernova rate is estimated to be as high as 0.2−0.3 yr−1,
comparable to the massive star formation rate, ∼ 0.1M⊙ yr−1 [326, 327]. The central
region of this starburst is packed with massive stars. Four young globular clusters near
the center of NGC 253 can account for a mass well in excess of 1.5×10⁶M⊙ [328, 329].
Assuming that the star formation rate has been continuous in the central region for
the last 109 yrs, and a Salpeter IMF for 0.08-100 M⊙, the bolometric luminosity of
NGC 253 is consistent with 1.5 ×10⁸M⊙ of young stars [328]. Based on this evidence,
it appears likely that there are at least tens of millions of young stars in the central
region of the starburst. These stars can also contribute to the γ-ray luminosity at high
energies [151, 330]. Physical, morphological, and kinematic evidence for the existence
of a galactic superwind has been found for NGC 253 [331]. Shock interactions with
46

low and high density clouds can produce X-ray continuum and optical line emission,
respectively, both of which have been directly observed.
A region about 1 kpc of the M82 galactic center appears to be a fossil starburst,
presenting a main sequence stellar cutoff corresponding to an age of 100-200 Myr and a
current average extinction of 0.6 mag (compare with the extinction of the central and
current starburst region, 2.2 mag) whereas, nearby globular glusters age estimations
are between 2 × 10⁸ and 109 yr [332]. It appears possible for this galaxy, then, that a
starburst (known as M82 “B”) of similar amplitude than the current one was active in
the past.
3. Two-step acceleration-process in starbursts
The acceleration of particles in starburst galaxies is thought to be a two-stage process
[317]. First, ions are thought to be diffusively accelerated at single SNRs within the
nuclear region of the galaxy. Energies up to ∼ 1014−15 eV can be achieved in this
step (see, e.g. [333]). Due to the nature of the central region, and the presence of the
superwind, the escape of the iron nuclei from the central region of the galaxy is expected
to be dominated by convection.27 Collective plasma motions of several thousands of
km per second and the coupling of the magnetic field to the hot plasma forces the CR
gas to stream along from the starburst region. Most of the nuclei then escape through
the disk in opposite directions along the symmetry axis of the system, being the total
path travelled substantially shorter than the mean free path.
Once the nuclei escape from the central region of the galaxy they are injected into
the galactic-scale wind and experience further acceleration at its terminal shock. CR
acceleration at superwind shocks was first proposed in Ref. [335] in the context of our
own Galaxy. The scale length of this second shock is of the order of several tens of kpc
(see Ref. [318]), so it can be considered as locally planar for calculations. The shock
velocity vsh can be estimated from the empirically determined superwind kinetic energy
flux Esw and the mass flux M generated by the starburst through: Esw = 1/2Mv2sh.
The shock radius can be approximated by r ≈ vshτ , where τ is the starburst age.
27 The relative importance of convection and diffusion in the escape of the CRs from a region of disk
scale height h is given by the dimensionless parameter, q = V0 h/κ0, where V0 is the convection
velocity and κ0 is the CR diffusion coefficient inside the starburst [334]. When q . 1, the CR
outflow is difussion dominated, whereas when q & 1 it is convection dominated. For the central
region of NGC 253 a convection velocity of the order of the expanding SNR shells ∼ 10000 km s−1,
a scale height h ∼ 35 pc, and a reasonable value for the diffusion coefficient κ0 ∼ 5 × 1026 cm2 s−1
[193], lead to q ∼ 216. Thus, convection dominates the escape of the particles. The residence time
of the iron nuclei in the starburst results tRES ∼ h/V0 ≈ 1 × 10¹¹ s.
47

Since the age is about a few tens of million years, the maximum energy attainable
in this configuration is constrained by the limited acceleration time arising from the
finite shock’s lifetime. For this second step in the acceleration process, the photon
field energy density drops to values of the order of the cosmic background radiation
(we are now far from the starburst region), and consequently, iron nuclei are safe from
photodissociation while energy increases to ∼ 1020 eV.
To estimate the maximum energy that can be reached by the nuclei, consider the
superwind terminal shock propagating in a homogeneous medium with an average mag-
netic field B. If we work in the frame where the shock is at rest, the upstream flow
velocity will be v1 (|v1| = vsh) and the downstream velocity, v2. The magnetic field
turbulence is assumed to lead to isotropization and consequent diffusion of energetic
particles which then propagate according to the standard transport theory [336]. The
acceleration time scale is then [337]: tacc = 4κv21
where κ is the upstream diffusion coef-
ficient which can be written in terms of perpendicular and parallel components to the
magnetic field, and the angle θ between the (upstream) magnetic field and the direction
of the shock propagation: κ = κ‖ cos2 θ +κ⊥ sin2 θ. Since strong turbulence is expected
from the shock we can take the Bohm limit for the upstream diffusion coefficient paral-
lel to the field, i.e. κ‖ = 13E/ZeB1, where B1 is the strength of the pre-shock magnetic
field and E is the energy of the Z-ion. For the κ⊥ component we shall assume, fol-
lowing Biermann [338], that the mean free path perpendicular to the magnetic field is
independent of the energy and has the scale of the thickness of the shocked layer (r/3).
Then, κ⊥ = 1/3 r(v1 − v2) or, in the strong shock limit, κ⊥ = rv21/12. The upstream
time scale is tacc ∼ r/(3v1), r/3v1 = 4/v21
(
E/(3ZeB1) cos2 θ + rv21/12 sin2 θ
)
. Thus,
using r = v1τ and transforming to the observer’s frame one obtains
Emax ≈ 1
4ZeBv2
shτ ≈ 1
2ZeB
Esw
Mτ. (52)
The predicted kinetic energy and mass fluxes of the starburst of NGC 253 derived
from the measured IR luminosity are 2×1042 erg s−1 and 1.2 M⊙ yr−1, respectively [318].
The starburst age is estimated from numerical models that use theoretical evolutionary
tracks for individual stars and make sums over the entire stellar population at each
time in order to produce the galaxy luminosity as a function of time [320]. Fitting
the observational data these models provide a range of suitable ages for the starburst
phase that, in the case of NGC 253, goes from 5 × 10⁷ to 1.6 × 10⁸ yr (also valid for
M82) [320]. These models must assume a given initial mass function (IMF), which
usually is taken to be a power-law with a variety of slopes. Recent studies has shown
that the same IMF can account for the properties of both NGC 253 and M82 [339].
Finally, the radio and γ-ray emission from NGC 253 are well matched by models with
B ∼ 50µ G [323]. With these figures, already assuming a conservative age τ = 50 Myr,
one obtains a maximum energy for iron nuclei of EFemax > 3.4 × 10²⁰ eV.
48

4. The starburst hypothesis: UHECR-luminosity and correlations
For an extragalactic, smooth, magnetic field of ≈ 15 − 20 nG, diffusive propagation
of nuclei below 1020 eV evolves to nearly complete isotropy in the CR arrival direc-
tions [340, 341]. Thus, we could use the rates at which starbursts inject mass, metals
and energy into superwinds to get an estimate of the CR-injection spectra. Gener-
alizing the procedure discussed in Sec. IID 3 –using equal power per decade over the
interval 1018.5 eV < E < 1020.6 eV – we obtain a source CR-luminosity
E2 dN0
dE dt≈ 3.5 ε 1053eV/s (53)
where ε is the efficiency of ultra high energy CR production by the superwind kinetic
energy flux. With this in mind, the energy-weighted, approximately isotropic nucleus
flux at 1019 eV is given by [340]
E3J(E) =Ec
(4π)2d D(E)
E2 dN0
dE dtI⋆ ≈ 2.3 × 1026 ǫ I⋆ eV2 m−2 s−1 sr−1, (54)
where I⋆ = IM82 + INGC 253. To estimate the diffusion coefficient we used BnG = 15,
ℓMpc = 0.5, and an average Z = 20. We fix
ǫ I⋆ = 0.013, (55)
after comparing Eq.(54) to the observed CR-flux. Note that the contribution of
IM82 and INGC 253 to I⋆ critically depends on the age of the starburst. The relation
“starburst-age/superwind-efficiency” derived from Eq. (55), leads to ǫ ≈ 10%, if both
M82 and NGC 253 were active for 115 Myr. The power requirements may be reduced
assuming contributions from M82 “B” [340].
Above > 1020.2 eV iron nuclei do not propagate diffusively. Moreover, the CR-
energies get attenuated by photodisintegration on the CMB and the intergalactic in-
frared background photons. However, the energy-weighted flux beyond the GZK-energy
due to a single M82 flare
E3J(E) =E
(4πd)2
E20 dN0
dE0 dte−R t/56 ≈ 2.7 × 1025E20ǫ e−R t/56 eV2 m−2 s−1 sr−1, (56)
is easily consistent with observation [340]. Here, R is the effective nucleon loss rate of
the nucleus on the CBM [107].
In the non-diffusive regime (i.e., 1020.3 eV . E . 1020.5 eV), the accumulated
deflection angle from the direction of the source in the extragalactic B-field is roughly
10 . θ . 20 [341]. The nuclei suffer additional deflection in the Galactic magnetic
field. In particular, if the Galactic field is of the ASS type, the arrival direction of
49

0 60 120 180 240 300 360−90
−60
−30
0
30
60
90
l
b
18 20 22 24 26 28 30 325
6
7
8
9
10
Num
ber
of e
vent
s
Size of the cone (%)
10-4
10-5
FIG. 8: Left: Directions in Galactic coordinates of the four highest energy CRs at the
boundary of the Galactic halo. The diamonds represent the observed incoming directions.
The circles and arrows show the directions of neon and iron nuclei, respectively, before de-
flection by the Galactic magnetic field. The solid line is the locus of incoming directions at
the halo for other species with intermediate atomic number. The stars denote the positions
of M82 and NGC253. The dashed lines are projections in the (l, b) coordinates of angular
directions within 20 and 30 of the starbursts. Right: Curves of constant probabilities in the
two-dimensional parameter space defined by the size of the cone and the minimum number
of events originating within the resulting effective solid angle [342].
the 4 highest energy CRs can be traced backwards to one of the starbursts [342].
Figure 8 shows the extent to which the observed arrival directions of the highest energy
CRs deviate from their incoming directions at the Galactic halo because of bending
in the magnetic field given in Eq. (13). The incoming CR trajectories are traced
backwards up to distances of 20 kpc away from the Galactic center, where the effect of
the magnetic field is negligible. The diamond at the head of each solid line denotes the
observed arrival direction, and the points along these lines indicate the direction from
which different nuclear species (with increasing mass) entered the Galactic halo. In
particular, the tip of the arrows correspond to incoming directions at the halo for iron
nuclei, whereas the circles correspond to nuclei of neon. Regions within the dashed
lines comprise directions lying within 20 and 30 degrees of the starbursts. It is seen
that trajectories for CR nuclei with Z ≥ 10 can be further traced back to one of the
starbursts, within the uncertainty of the extragalactic deviation.
The effects of the BSS configuration are completely different. Because of the aver-
aging over the frequent field reversals, the resulting deviations of the CR trajectories
50

are markedly smaller, and in the wrong direction for correlation of current data with
the starburst sources. We note that the energy-ordered 2D correlation distribution of
the AGASA data is in disagreement with expectations for positively charged particles
and the BSS configuration [312].
We now attempt to assess to what extent these correlations are consistent with
chance coincidence. We arrive at the effective angular size of the source in a two-
step process. Before correcting for bias due to the coherent structure of the Galactic
magnetic field, the deflections in the extragalactic and Galactic fields (regular and
random components) may be assumed to add in quadrature, so that the angular sizes
of the two sources are initially taken as cones with opening half-angles between 40 and
60, which for the purpose of our numerical estimate we approximate to 50. However,
the global structure of the field will introduce a strong bias in the CR trajectories,
substantially diminishing the effective solid angle. The combined deflections in the l
and b coordinates mentioned above concentrate the effective angular size of the source
to a considerably smaller solid angle. As a conservative estimate, we retain 25% of this
cone as the effective source size. A clear prediction of this consideration is then that
the incoming flux shows a strong dipole anisotropy in the harmonic decomposition.
Now, by randomly generating four CR positions in the portion of the sky accessible
to the existing experiments (declination range δ > −10), an expected number of
random coincidences can be obtained. The term “coincidence” is herein used to label
a synthetic CR whose position in the sky lies within an effective solid angle Ωeff of
either starburst. Ωeff is characterized by a cone with opening half-angle reduced from
50 to 24 to account for the 75% reduction in effective source size due to the magnetic
biasing discussed above. Cosmic ray positional errors were considered as circles of 1.6
radius for AGASA. For the other experiments the asymmetric directional uncertainty
was represented by a circle with radius equal to the average experimental error. The
random prediction for the mean number of coincidences is 0.81 ± 0.01. The Poisson
probability 28 for the real result to be no more than the tail of the random distribution
is 1%. Alternatively, we may analyze this in terms of confidence intervals. For the 4
observed events, with zero background, the Poisson signal mean 99% confidence interval
is 0.82 − 12.23 [294]. Thus our observed mean for random events, 0.81 ± 0.01, falls
at the lower edge of this interval, yielding a 1% probability for a chance occurrence.
Of course, this is not compelling enough to definitively rule out chance probability as
generating the correlation of the observed events with the candidate sources, but it is
suggestive enough to deserve serious attention in analyses of future data.
Assuming an extrapolation of AGASA flux (E3Jobs(E)) up to 1020.5 eV, the event
28 Because of constraints inherent in partitioning events among clusters, the distributions are very
close to, but not precisely Poisson [76].
51

rate at Pampa Amarilla29 is given by
dN
dt= A
∫ E2
E1
E3J(E)dE
E3≈ A
2〈E3 J(E)〉
[
1
E21
− 1
E22
]
≈ 5.3 yr−1 , (57)
where E1 = 1020.3 eV and E2 = 1020.5 eV. Considering a 5-year sample of 25 events
and that for this energy range the aperture of PAO is mostly receptive to cosmic rays
from NGC253, we allow for different possibilities of the effective reduction of the cone
size because of the Galactic magnetic field biasing previously discussed. In Fig. 8
we plot contours of constant probabilities (P = 10−4, 10−5) in the two-dimensional
parameter space of the size of the cone (as a fraction of the full 50 circle) and the
minimum number of events originating within the resulting effective solid angle. The
model predicts that after 5 years of operation, all of the highest energy events would be
observed in the aperture described above. Even if 7 or 8 are observed, this is sufficient
to rule out a random fluctuation at the 10−5 level. Thus, a clean test of the starburst
hypothesis can be achieved at a very small cost: < 10−5 out of a total 10−3 PAO
probability budget [343].
G. Luminous Infrared Galaxies
1. Definition
In carrying to the extreme the concept of a starburst, we find the powerful lumi-
nous infrared galaxies (LIGs). At luminosities above 1011 L⊙, LIGs (LFIR > 1011 L⊙)
are the dominant extragalactic objects in the local universe (z < 0.3) with such high
luminosities. Some, having LFIR > 1012 L⊙, are the most luminous local objects (see
[344] for a review). These galaxies possess very large amounts of molecular material
(e.g., [345, 346, 347, 348, 349]). They present large CO luminosities, but also a high
value for the ratio LFIR/LCO, both being about one order of magnitude greater than
for spirals, implying a higher star formation rate per solar mass of gas.30 LIGs are
generally regarded as recent galaxy mergers in which much of the gas of the colliding
objects has fallen into a common center (typically less than 1 kpc in extent), triggering
a huge starburst phenomenon [344]. There is evidence for the existence of even more
29 The Southern Site of PAO has been christened Pampa Amarilla. Recall that it has an aperture
A ≈ 7000 km2 sr for showers with incident zenith angle less than 60.30 For stars to form, a large mass fraction at high density, dM/d(log n), is required. The Milky Way
has an order of magnitude more gas at less than 300 cm−3 than what it has at 104 cm−3, contrary
to LIGs, which have nearly equal mass per decade of density between 102 and 104 cm−3 (see, e.g.,
Ref. [348, 349])
52

extreme enviroments within LIGs (see, e.g., [345]): These, larger than giant molecular
clouds but with densities found only in small cloud cores, appear to be the most out-
standing star formation places in the universe. They are well traced by HCN emission,
i.e., they produce a substantial fraction of the whole HCN emission observed for the
whole galaxy [345], see also [350, 351]. The CR enhancement factor in these small
but massive regions can well exceed the average value for the galaxy. In Arp 220, for
instance, two such regions were discovered to contain about 2×10⁹ M⊙ [345]. If the CR
enhancement in these regions is significantly larger than the starburst average, these
extreme environments could be the main origin for any γ-ray emission observed from
this galaxy [352].
2. Propagation and further studies
Using the PSCz catalogue [353], Smialkowski et al. [354] constructed all-sky maps
of UHE proton intensities plausibly originating in LIGs, taking into account effects of
particle propagation through the extragalactic medium and the possible influence of
the regular galactic magnetic field. The PSCz catalogue consists of almost 15000 IR
galaxies with known redshifts, covering 84% of the sky. Finding correlations with such
an overdistributed sample might be thought as a risky business. There are, however,
some phenomenological reasons —apart of LIGs being super-starbursts— to search for
a possible UHECR origin in LIGs.
Arp 299, one of the the brightest infrared source within 70 Mpc and a system of
colliding galaxies showing intense starburst, appeared earlier as VV 118 in the list of
candidates for the AGASA triplet presented by in Ref. [74, 137, 140]. Indeed, for
Arp 299, even when a hidden AGN was observed, it can not account for the whole
FIR luminosity [355] and a strong starburst activity is required to explain it. It might
be considered as a prime candidate for the origin of the triplet [354], if such is not a
statistical fluctuation.
Equatorial maps of the expected intensity of the UHE protons originating in LIGs for
the energy region 40-80 EeV with sky coverage and declination dependent exposure for
the AGASA experiment were presented in Ref. [354]. Expected proton intensities for
40-80 EeV appear to show good correlation with the distribution of the experimental
events from AGASA, especially, from the region of the sky near Arp 299 and the
AGASA triplet of events (RA≈ 170, δ ≈ 60). No correlation of the data events
above 80 EeV with the expected CR intensities was reported.
The latter result was confirmed in Ref. [203], where application of the Kolmogorov-
Smirnov (KS) to the 11 highest AGASA events above 1020 eV yields a KS probability
of < 0.5%, rejecting the possible association at > 99.5% significance level. This was
used to argue that the existing CR events above 1020 eV do not owe their origin to
53

long burst GRBs, rapidly rotating magnetars, or any other events associated with core
collapse supernovae (although it would yet be too early to completely rule out such a
possibility, based only in a 2σ deviation).31
A more sensitive approach to study a possible LIG origin of UHECRs, perhaps, is
not to look for possible correlations between the whole PSCz calatog and UHECRs,
but rather to select a priori which LIGs are most likely to be detectable by their
possible UHECR emission. There are several LIGs for which reasonable values of CR
enhancements, comparable to, or lower than, the ratio between their SFR and the Milky
Way’s, can provide a γ-ray flux above GLAST sensitivity, and if the CR spectrum is
sufficiently hard, also above the sensitivities of the new Cerenkov telescopes. These
LIGs are then most likely to appear as new point-like γ-ray sources. Even when it
is natural to expect that a LIG will emit γ-rays, only the more gaseous, nearby, and
CR-enhanced galaxies are the ones which could be detected as γ-ray point sources [352].
Out of the HCN just presented in Refs. [350, 351]32 and the larger Pico dos Dias
Survey (PDS, [358])33, the most likely γ-ray sources are listed in Table I, together with
EGRET fluxes upper limits, obtained in [352]. In our opinion, this group, as well as
the HCN and the PDS should be separately taken into account when searching for
31 Following [203], the core collapse supernova rate per galaxy, summed over all galaxy types, is
Ssn ≈ 0.011 SN per galaxy-year [205], which yields a volume averaged rate of supernovae of Ssnng ≈2.2×10⁻⁴ SN/Mpc3-year. The supernova rate for galaxies with far infrared emission is Sfir
sn = 2.5×10⁻⁴L10 SN/(FIR galaxy)-year [356]. Integrating this supernova rate over the FIR galaxy luminosity
function yields Sfirsnnfirg ≈ 0.7 × 10⁻⁴Kobsc(L
max10 /300) SN/Mpc3-year. Kobsc, the correction for
supernovae missed in the existing optical and near infrared supernova detection surveys, might be
as large as 10, and probably is at least as large as 3 [356]. Thus, the luminous infrared galaxies
contribute at least 28% (Kobsc = 1) of the total supernova rate, with a total space density only 25%
that of all normal galaxies. Furthermore, since the brightest infrared galaxies (LFIR > 1012 L⊙)
dominate the contribution from all FIR galaxies, and these are quite rare, with space density ∼ 4×10⁻⁸ Mpc−3 [357], correlations of UHECR arrival directions with the sky positions of the luminous
IRAS galaxies offers a promising opportunity to test the hypothesis that UHECR acceleration has
something to do with core collapse supernovae, as is implied by the GRB shock and magnetar
unipolar inductor models for the acceleration sites.32 This survey is a systematic observation (essentially, all galaxies with strong CO and IR emission
were chosen for HCN survey observations) of 53 IR-bright galaxies, including 20 LIGs with LFIR >
1011L⊙, 7 with LFIR > 1012L⊙, and more than a dozen of the nearest normal spiral galaxies. It
also includes a literature compilation of data for another 9 IR-bright objects. This is the largest
and most sensitive HCN survey (and thus of dense interstellar mass) of galaxies to date.33 The PDS survey consists of relatively nearby and luminous starbursts galaxies selected in the FIR.
PDS galaxies have a lower mean IR luminosity log(LIR/L⊙) = 10.3 ± 0.5, redshifts smaller than
0.1, and form a complete sample limited in flux in the FIR at 2 × 10⁻¹⁰ erg cm−2 s−1.
54

TABLE I: Powerful local LIGs (all with interferometric measurements) likely to be detected
by GLAST, with EGRET upper limits. The luminosity distance in an standard universe
(DL = c/H0q02[1 − q0 + q0z + (q0 − 1)(2q0z + 1)1/2], H0 (∼75 km s−1 Mpc−1) is the Hubble
parameter, q0 (∼0.5) is the deceleration parameter, and z is the redshift), the central-sphere
radius from which the line emission was detected, the FIR luminosity and gas mass are also
given. The minimum average value of CR enhancement k for which the γ-ray flux above 100
MeV is above 2.4 ×10⁻⁹ photons cm−2 s−1, i.e. GLAST sensitivity is given. The smaller the
value of 〈k〉, the higher the possibility for these Galaxies to appear as γ-ray sources.
Name DL R log(LFIR/L⊙) log M(H2/M⊙) 〈k〉 FEGRET>100 MeV
[Mpc] [pc] [10−8 photons cm−2 s−1]
NGC3079 15 0.26 10.52 9.56 62 <4.4
NGC1068 15 0.10 10.74 9.46 78 <3.6
NGC2146 20 0.33 10.78 9.43 149 <9.7
NGC4038/9 22 0.49 10.65 9.07 412 <3.7
NGC520 29 0.38 10.58 9.47 285 <4.6
IC694 41 0.30 11.41 9.59 432 <2.2
Zw049.057 52 0.40 10.95 9.67 578 <6.9
NGC1614 64 0.60 11.25 9.78 680 <5.0
NGC7469 65 0.82 11.26 9.89 544 <3.2
NGC828 72 0.92 11.03 10.09 421 <6.1
Arp220 72 0.16 11.91 10.43 193 <6.1
VV114 80 0.93 11.35 10.03 597 <3.9
Arp193 94 0.25 11.34 10.22 532 <5.2
NGC6240 98 1.65 11.52 10.03 896 <6.4
Mrk273 152 0.13 11.85 10.33 1081 <2.3
IRAS 17208−0014 173 0.75 12.13 10.67 640 <7.5
VIIZw31 217 1.27 11.66 10.70 940 <3.2
possible UHECR correlations with new sets of data. 34
34 A stacking procedure with EGRET data is to be reported by Cillis et al. [359].
55

H. Gamma-ray bursts
1. Basic phenomenology
Gamma ray bursts (GRBs) are flashes of high energy radiation that can be brighter,
during their brief existence, than any other gamma ray source in the sky. The bursts
present an amazing variety of temporal profiles, spectra, and timescales that have puz-
zled astrophysicists for almost three decades [360]. In recent years, our observational
insight of this phenomenon has been dramatically improved by the huge amount of data
collected by the Burst and Transient Source Experiment (BATSE): several thousand
GRB observations were obtained. New breakthrough results are the expected outcome
of HETE-2 and Swift.
The temporal distribution of the bursts is one of the most striking signatures of the
GRB phenomenon. There are at least four classes of distributions, from single-peaked
bursts, including the fast rise and exponential decaying (FREDs) and their inverse
(anti-FREDs), to chaotic structures (e.g. [361, 362]). Burst timescales go through the
30 ms scale to hundreds of seconds.
The GRB photon spectrum is well fitted in the BATSE detectors range, 20 keV to
2 MeV [360], by a combination of two power-laws, dnγ/dǫγ ∝ ǫ(α−1)γ (α is the flux
density spectral index, Fν ∝ ν+α) with different values of α at low and high energy
[363]. Here, dnγ/dǫγ is the number of photons per unit photon energy. The break
energy (where α changes) in the observer frame is typically ǫγb ∼ 1 MeV, with α ≃ 0
at energies below the break and α ≃ −1 above the break. In several cases, the spectrum
has been observed to extend to energies > 100 MeV [360, 364].
The angular distribution of these bursts is isotropic, and the paucity of comparatively
faint bursts implies that we are seeing to near the edge of the source population [365].
Both effects, isotropy and non-homogeneity in the distribution, strongly suggest a cos-
mological origin of the phenomenon, confirmed by the detection of afterglows, delayed
low energy emission of GRBs that allowed the measurement of the distance to the
burst via a redshift determination of several GRB host-galaxies (e.g. [366, 367]).
2. The fireball model
The most popular interpretation of the GRB-phenomenology is that the observable
effects are due to the dissipation of the kinetic energy of a relativistic expanding plasma
wind, a “fireball”, whose primal cause is not yet known [368, 369, 370, 371, 372, 373,
374] (see [375] for a detailed review). The rapid rise time and short duration, ∼ 1 ms
of the burst imply that the sources are compact, with a linear scale comparable to a
light-ms, r0 ∼ 107 cm. If the sources are so distant, the energy necessary to produce
56

the observed events by an intrinsic mechanism is astonishing: about 1052 erg of γ
rays must be released in less than 1 second. Compactness and high γ-ray luminosity
implied by cosmological distances result in a very high optical depth to pair creation,
since the energy of observed γ-ray photons is above the threshold for pair production.
The number density of photons at the source nγ is
Lγ = 4πr20cnγǫ, (58)
where ǫ ≃ 1MeV is the characteristic photon energy. Using r0 ∼ 107cm, the optical
depth for pair production at the source is
τγγ ∼ r0nγσT ∼ σT Lγ
4πr0cǫ∼ 1015 . (59)
The high optical depth creates the fireball: a thermal plasma of photons, electrons,
and positrons. The radiation pressure on the optically thick source drives relativistic
expansion, converting internal energy into the kinetic energy of the inflating shell [369,
370]. As the source expands, the optical depth is reduced. If the source expands with
a Lorentz factor Γ, the energy of photons in the source frame is smaller by a factor Γ
compared to that in the observer frame, and most photons may therefore be below the
pair production threshold.
Baryonic pollution in this expanding flow can trap the radiation until most of the
initial energy has gone into bulk motion with Lorentz factors of Γ ≥ 102−103 [375, 376].
The kinetic energy, however, can be partially converted into heat when the shell collides
with the interstellar medium or when shocks within the expanding source collide with
one another. The randomized energy can then be radiated by synchrotron radiation
and inverse Compton scattering yielding non-thermal bursts with timescales of seconds,
at large radius r = rd > 1012cm, beyond the Thompson sphere. Relativistic random
motions are likely to give rise to a turbulent build up of magnetic fields, and therefore
to Fermi acceleration of charged particles.
Coburn and Boggs [377] recently reported the detection of polarization, a particu-
lar orientation of the electric-field vector, in the γ-rays observed from a burst. The
radiation released through synchrotron emission is highly polarized, unlike in other
previously suggested mechanisms such as thermal emission or energy loss by relativis-
tic electrons in intense radiation fields. Thus, polarization in the γ-rays from a burst
provides direct evidence in support of synchrotron emission as the mechanism of γ-ray
production (see also [378]).
3. Fermi acceleration in dissipative wind models of GRBs
Following Hillas’ criterion, the Larmor radius rL
should be smaller than the largest
scale lGRB over which the magnetic field fluctuates, since otherwise Fermi acceleration
57

will not be efficient. One may estimate lGRB as follows. The comoving time, i.e.,
the time measured in the fireball rest frame, is t = r/Γc. Hence, the plasma wind
properties fluctuate over comoving scale length up to lGRB ∼ r/Γ, because regions
separated by a comoving distance larger than r/Γ are causally disconnected. Moreover,
the internal energy is decreasing because of the expansion and thus it is available for
proton acceleration (as well as for γ-ray production) only over a comoving time t. The
typical acceleration time scale is then [248]
τGRBacc ∼ r
L
cβ2, (60)
where βc is the Alfven velocity. In the GRB scenario β ∼ 1, so Eq. (60) sets a
lower limit on the required comoving magnetic field strength, and the Larmor radius
rL
= E ′/eB = E/ΓeB, where E ′ = E/Γ is the proton energy measured in the fireball
frame.
This condition sets a lower limit for the required comoving magnetic field strength
[248],(
B
Be.p.
)2
> 0.15Γ2300E
220L
−151 , (61)
where E = 1020E20eV, Γ = 300Γ300, L = 1051L51erg s−1 is the wind luminosity, and
Be.p. is the equipartition field, i.e. a field with comoving energy density similar to that
associated with the random energy of the baryons.
The dominant energy loss process in this case is synchrotron cooling. Therefore, the
condition that the synchrotron loss time of Eq. (31) be smaller than the acceleration
time sets the upper limit on the magnetic field strength
B < 3 × 10⁵Γ2300E
−220 G. (62)
Since the equipartition field is inversely proportional to the radius r, this condition
may be satisfied simultaneously with (61) provided that the dissipation radius is large
enough, i.e.
rd > 1012Γ−2300E
320cm. (63)
The high energy protons lose energy also in interaction with the wind photons (mainly
through pion production). It can be shown, however, that this energy loss is less
important than the synchrotron energy loss [248].
A dissipative ultra-relativistic wind, with luminosity and variability time implied by
GRB observations, satisfies the constraints necessary to accelerate protons to energy
> 1020 eV, provided that Γ > 100, and the magnetic field is close to equipartition
with electrons. We stress that the latter must be satisfied to account for both γ-ray
emission and afterglow observations [376]. At this stage, it is worthwhile to point out
58

that for the acceleration process at shocks with large Γ the particle distributions are
extremely anisotropic in shock, with the particle angular distribution opening angles
∼ Γ−1 in the upstream plasma rest frame. Therefore, when transmitted downstream
the shock particles have a limitted chance to be scattered efficiently to re-eneter the
shock [379]. However, in this particular case, the energy gain by any “successful” CR
can be comparable to its original energy, i.e., 〈∆E〉/E ∼ 1.
4. UHECRs and GRBs: connections
In the GRB model for UHECR production described above35, the high energy CRs
are protons accelerated by Fermi’s mechanism in sources that are distributed through-
out the universe [248, 387]. It is therefore possible to compare the UHECR spectrum
with the prediction from a homogeneous cosmological distribution of sources, each gen-
erating a power law differential spectrum ∝ E−2.2 of high energy protons as typically
expected from Fermi acceleration. Under the assumption that the GRB rate evolution
is similar to the star-formation rate evolution, the local GRB rate is ∼ 0.5 Gpc−3 yr−1
[388], implying a local γ-ray energy generation rate of ≈ 1044 erg Mpc−3 yr−1.36
The energy observed in γ-rays reflects the fireball energy in accelerated electrons. If
accelerated electrons and protons (as indicated by afterglow observations [389]) carry
similar energy, then the GRB production rate of high energy protons is
ǫ2p(dnp/dǫp)z=0 ≈ 1044 erg Mpc−3 yr−1. (64)
The generation rate (Eq. 64) of high energy protons is remarkably similar to that re-
quired to account for the flux of > 1019 eV CRs, whereas in this model, the suppression
of model flux above 1019.7 eV is due to the GZK cutoff. Stecker and Scully [390, 391]
have raised doubts on the possibility of this generating a very strong cutoff at the
highest CR energies, since if the GRB redshift distribution follows that of the star
formation rate in the universe, a rate which is higher at larger redshift, most of the
GRBs would be just too far and CR with energies above 3×10¹⁹ eV would be strongly
attenuated by the CMB. For a HiRes-shape spectrum, a common origin between GRBs
35 An alternative model for the GRB phenomenon has been recently put forward [380]. In such a
model, the GRB explosion occurs when a massive star collapses into an electromagnetic black hole
which readily discharges due to the annihilation of pairs produced by vacuum polarization [381].
The model explains the time variability, the spectra, and the GRB afterglows to a very high level
of accuracy [382, 383, 384]. Interestingly, within this set up one is able to accelerate the ionized
hydrogen atoms sorrounding the death star to ultra high energies [385] (see also [386]).36 The local (z = 0) energy production rate in γ-rays by GRBs is roughly given by the product of the
characteristic GRB γ-ray energy, E ≈ 2 × 1053 erg, and the local GRB rate.
59

and ultrahigh energy CRs [392] is favored.37 For appraisals of this and other general
criticisms made to the GRB-UHECR connection see [393, 394].
Two of the highest energy CRs come from directions that are within the error boxes
of two remarkable GRBs detected by BATSE with a delay of O(10) months after the
bursts [395]. However, a rigorous analysis shows no correlation between the arrival
direction of UHECRs and GRBs from the third BATSE catalog [396]. No correlations
were found either between a pre-CGRO burst catalog and the Haverah Park shower set
that covered approximately the same period of time. These analysis, however, could
have been distorted by the angular resolution (∆θ ∼ 3) of the GRB measurements. A
sensitive anisotropy analysis between UHECRs and GRBs will be possible in the near
future, using PAO, HETE-2 and Swift. Preliminary results (if one assumes that GRBs
are most likely to happen in infrared luminous galaxies) do not seem to indicate any
strong correlation (see above Section IIG).
5. A GRB origin for CRs below the ankle?
Wick, Dermer and Atoyan [397] have recently proposed a model for the origin of
all CRs above ∼ 1014 eV/nucleon. In this model, GRBs are assumed to inject CR
protons and ions into the interstellar medium of star-forming galaxies –including ours–
with a power-law spectrum extending to a maximum energy ∼ 1020 eV. In addition
to the more energetic, extragalactic spectrum of CR, the CR spectrum near the knee
was also shown to be plausibly fitted with CRs trapped in the Galactic halo that
were accelerated and injected by an earlier Galactic GRB.38 For power-law CR proton
injection spectra ∝ E−2.2 and low and high-energy cutoffs, normalization to the local
time- and space-averaged GRB luminosity density implies that if this model is correct,
the nonthermal content in GRB blast waves is hadronically dominated by a factor ≈ 60-
200, limited in its upper value by energetic and spectral considerations. Neutrinos to
be detected in kilometer-scale neutrino detectors such as IceCube (See Sec. IV) provide
a clean signal of this model [400].
The last GRB in the Galaxy has been also proposed as the possible progenitor of
37 In addition, dispersion of magnetic fields in the intergalactic medium can make the number of
UHECR-contributing GRBs to grow above the burst rate within the GZK sphere. The latter,
within 100 Mpc from Earth, is in the range of 10−2 to 10−3 yr−1. Assuming a dispersion tiemscale,
∆t ∼ 107 yr, the number of sources contributing to the flux at any given time may be as large as
∼ 104 [248].38 Arguably, from the evidence for beaming and the association of GRBs with star-forming galaxies
like the Milky Way, GRB events are estimated to occur once every 104 − 106 yrs in the inner
Galaxy [398, 399].
60

the CR anisotropy observed in the direction of the GC [401]. In order to estimate the
remaining traces of any CR activity produced by the last GRB in the galaxy, one has
to take into account several considerations:
(i) The UHECRs escaping the GRB fireball
N0(E > 1018 eV) ∼ 10−2 N0(E > Emin) (65)
are mostly neutrons, because protons are captive in the magnetic field and suffer ex-
tensive adiabatic losses on the way out [402].39 Some of these neutrons will decay into
protons within the GC thin disk-like (r ∼ 3 kpc) region of high interestellar medium
density and high star formation rate. The population of secondary protons would then
be captured by the strong B-field near the GC, attaining diffusion with a residence
time scale of about T ∼ 105 yr. At the end of this time, about 1/300 protons are able
to avoid leakeage. The trapped protons,
NT (E > 1018 eV) = N0(E > 1018 eV)(
1 − e−r mnE τ
)
/300 , (66)
can then be turned back into neutrons by interaction with nuclei in the interstellar
medium with probability of 5×10⁻². Here, mn and τ are the neutron mass and lifetime,
respectively.
(ii) The formation of the n → p reservoir depends on the GRB rate in the inner Galaxy
(taken here as 106 yr−1) times the probability that a GRB jet points more o less along
the direction of the GP. The latter is estimated to be about 50%.
(iii) The total CR production by a single GRB is ≈ 1051 erg [403].
Now, recalling that the CR excess observed by AGASA represents a luminosity
of particles beyond 1018 eV of about 4 × 1030 erg/s [59], straightforward calculation
shows that the observed anisotropy in the direction of the GC can be easily fitted
by the neutrons produced in the GRB reservoir, that ultimately travel unscathed to
Earth [401].
III. FULL THROTTLE: UHECR GENERATION BEYOND THE STAN-
DARD LORE
The astrophysical models discussed present difficulties in providing a completely
satisfactory explanation of the super-GZK events, if there are any. This may simply
reflect our present lack of statistics, our present ignorance of the true conditions of
processes in some highly energetic regions of the universe, or, perhaps, may imply
39 We remind the reader that the differential injection spectrum of GRBs ∝ E−2.2.
61

that exotic mechanisms are at play. Physics from the most favored theories beyond
the standard model (SM) like string/M theory, supersymmetry (SUSY), grand unified
theories (GUTs), and TeV-scale gravity have been invoked to explain the possible flux
above the GZK energy limit. This review is not mainly concerned with beyond–SM
scenarios (for more comprehensive surveys see e.g. [1, 82, 404, 405, 406]), but for the
sake of completeness, we provide here a brief account of some of the most relevant
exotic explanations.
The most economical among hybrid proposals involves a familiar extension of the SM,
namely, neutrino masses. It was noted many years ago that ν’s arriving at Earth from
cosmologically distant sources have an annihilation probability on the relic neutrino
background of roughly 3 h−165 % [407]. Inspired on this analysis, Weiler [408] and Fargion
et al. [409] noted that neutrinos within a few Z widths of the right energy,
ERZν =
M2Z
2mνi
= 4
(
eV
mνi
)
× 1021 eV , (67)
to annihilate with the relic neutrinos at the Z-pole with large cross section,
〈σann〉Z ≡∫
ds
M2Z
σann(s) = 2 π√
2GF ∼ 40.4 nb , (68)
may produce a “local” flux of nucleons and photons.40 Remarkably, the energy of the
neutrino annihilating at the peak of the Z-pole has to be well above the GZK limit. The
mean energies of the ∼ 2 nucleons and ∼ 20 γ-rays in each process can be estimated by
distributing the resonant energy among the mean multiplicity of 30 secondaries. The
proton energy is given by
〈Ep〉 ∼ M2Z
60 mνj
∼ 1.3
(
eV
mνj
)
× 1020 eV, (69)
whereas the γ-ray energy is given by
〈Eγ〉 ∼ M2Z
120 mνj
∼ 0.7
(
eV
mνj
)
× 1020 eV. (70)
The latter is a factor of 2 smaller to account for the photon origin in two body π0
decay. This implies that the highly boosted decay products of the Z could be observed
as super-GZK primaries.41 However, to reproduce the observed spectrum, the Z-
burst mechanism requires very luminous sources of extremely high energy neutrinos
40 GF = 1.16639(1)× 10−5 GeV−2 is the Fermi coupling constant.41 Similarly, gravi-burst fragmentation jets can contribute to the super-GZK spectrum [410].
62

throughout the universe [411, 412, 413]. The present limits on these sources are near
the threshold of sensitivity to the required flux [414].
In 1931, Georges Lemaıtre [415] – a forerunner of the Big Bang hypothesis – intro-
duced the idea that the entire material filling the universe, as well as the universe’s
expansion, originated in the super-radioactive disintegration of a “Primeval Atom”,
which progressively decayed into atoms of smaller and smaller atomic weight. The CRs
were introduced in this picture as the energetic particles emitted in intermediate stages
of the decay-chain. Echoing Lemaıtre, in the so-called “top-down models”, charged and
neutral primaries arise in the quantum mechanical decay of supermassive elementary
X particles [416, 417, 418, 419, 420, 421, 422, 423, 424, 425, 426, 427, 428, 429, 430].
To maintain an appreciable decay rate today, it is necessary to tune the X lifetime to
be longer (but not too much longer) than the age of the universe, or else “store” short-
lived X particles in topological vestiges of early universe phase transitions (such as
magnetic monopoles, superconducting cosmic strings, vortons, cosmic necklaces, etc.).
Discrete gauged symmetries [431, 432, 433] or hidden sectors [434, 435] are generally
introduced to stabilize the X particles. Higher dimensional operators, wormholes,
and instantons are then invoked to break the new symmetry super-softly to maintain
the long lifetime [423, 424] (collissional annihilation has been considered too [436]).
Arguably, these metastable super-heavy relics (MSRs) may constitute (a fraction of)
the dark matter in galactic haloes.
Of course, the precise decay modes of the X’s and the detailed dynamics of the
first generation of secondaries depend on the exact nature of the X particles under
consideration. However, in minimal extensions of the SM, where there are no new
mass scales between MSUSY ∼ 1 TeV and mX , the squark and sleptons would be-
have like their corresponding supersymmetric partners, enabling one to infer from the
“known” evolution of quarks and leptons the gross features of the X particle decay:
the strongly interacting quarks would fragment into jets of hadrons containing mainly
pions together with a 3% admixture of nucleons [437, 438, 439].42 This implies that
the injection spectrum is a rather hard fragmentation-type shape (with an upper limit
usually fixed by the GUT scale) and dominated by γ-rays and neutrinos produced via
pion decay. Therefore, the photon/proton ratio can be used as a diagnostic tool in
determining the CR origin [442]. In light of the mounting evidence that UHECRs are
not γ-rays, one may try to force a proton dominance at ultrahigh energies by postulat-
ing efficient absorption of the dominant ultrahigh energy photon flux on the universal
and/or galactic radio background.43 However, the neutrino flux accompanying a nor-
42 In light of this, the sensitivity of future CR experiments to test the SUSY parameter space has been
estimated [440, 441].43 Of course, this is not the case in traditional scenarios (for an exception see [443]) of decaying massive
63
malized proton flux is inevitably increased to a level where it should be within reach
of operating experiments [444].
It is clear that because of the wide variety of top down models the ratio of the
volume density of the X-particle to its decay time is model dependent. However, if a
top down scenario is to explain the origin of UHECRs, the injection spectrum should
be normalized to account for the super-GZK events without violating any observational
flux measurements or limits at higher or lower energies [445]. In particular, neutrino
and γ-ray fluxes depend on the energy released integrated over redshift, and thus on
the specific top down model. Note that the electromagnetic energy injected into the
Universe above the pair production threshold on the CMB is recycled into a generic
cascade spectrum below this threshold on a short time scale compared with the Hubble
time. Therefore, it can have several potential observable effects, such as modified light
element abundances due to 4He photodisintegration, or induce spectral distortions of
universal γ-ray and neutrino backgrounds [446, 447]. Additionally, measurements of the
diffuse GeV γ-ray flux [448], to which the generic cascade spectrum would contribute
directly, limit significantly the parameter space in which X’s can generate the flux of
the UHECRs [449, 450, 451], especially if there is already a significant contribution to
this background from conventional sources such as unresolved γ-ray blazars. Recently,
a possible lower extragalactic contribution to the diffuse γ-ray background measured by
EGRET has been pointed out [452, 453]. The ∼ 50% smaller EGRET flux practically
rules out extragalactic top down and Z-burst scenarios [454].
If MSRs are the progenitors of the observable UHECRs, then the flux will be domi-
nated by the decay or annihilation products of X’s in the Galactic halo, i.e., by sources
at distances smaller than all relevant interaction lengths. A clean signal of this sce-
nario is the predicted anisotropy due to the non-central position of the Sun in our
galaxy [455, 456].44 Although it was noted that the predicted anisotropy is consistent
with AGASA and Haverah Park data [70], recent analyses [458, 459] of SUGAR data
excludes the MSR hypothesis at the 5σ level if all events above 1019.6 eV are due to
metastable X clustered in the halo. (For the extreme case where the population of
MSRs is responsible only for CRs with energies & 1019.8 eV, the annihilation scenario
is disfavored at least at the 99% CL, whereas decaying MSRs still have a probability
∼ 10% to reproduce SUGAR data.)
A more exotic explanation postulates that the X’s themselves constitute the pri-
maries: magnetic monopoles easily pick up energy from the magnetic fields permeating
dark matter in the Galactic halo, which due to the lack of absorption, predict compositions directly
given by the fragmentation function, i.e., domination by γ-rays.44 Additionally, the arrival directions of UHECRs can show significant deviations from a random
distribution due to an anisotropic spectrum of relics in the early universe [457].
64

the universe and can traverse unscathed through the primeval radiation, providing an
interesting candidate to generate extensive air showers [460]. In particular, a baryonic
monopole encountering the atmosphere will diffuse like a proton, producing a compos-
ite heavy-particle-like cascade after the first interaction [461] with a great number of
muons among all the charged particles [462]. Although this feature was observed in
a poorly understood super-GZK event [463, 464], it seems unlikely that a complete
explanation for the UHECR data sample would be in terms of magnetic monopoles
alone. Moreover, any confirmed directional pairing of events would appear difficult to
achieve with the monopole hypothesis.
A novel beyond–SM–model proposal to break the GZK barrier is to assume that
UHECRs are not known particles but rather a new species, generally referred to as
the uhecron, U [465, 466, 467]. The meager information we have about super-GZK
particles allows a naıve description of the properties of the U . The muonic content in
the atmospheric cascades suggests U ’s should interact strongly. At the same time, if
U ’s are produced at cosmological distances, they must be stable, or at least remarkably
long lived, with mean-lifetime τ & 106 (mU/3 GeV) (d/Gpc) s, where d is the distance
to the source and mU , the uhecron’s mass. Additionally, since the threshold energy
increases linearly with mU , to avoid photopion production on the CMB mU & 1.5 GeV.
In recent years, direct searches of supersymmetric hadrons [468, 469, 470, 471] have
severely eroded the attractiveness of the U scenario. However, adequate fine-tunings
leave a small window still open [472, 473].
On a similar track, it was recently put forward [474] that strangelets (stable lumps
of quark matter with roughly equal numbers of up, down, and strange quarks) can
circumvent the acceleration problem in a natural way (due to a high mass and charged,
but low charge-to-mass ratio) and move the expected cutoff to much higher energies.
Another possibility in which super-GZK CRs can reach us from very distant
sources may arise out of photons that mix with light axions in extragalactic magnetic
fields [475]. These axions would be sufficiently weakly coupled to travel large distances
unhindered through space, and so they can convert back into high energy photons
close to the Earth.45 An even more radical proposal postulates a tiny violation of local
Lorentz invariance, such that some processes become kinematically forbidden [477]. In
particular, photon-photon pair production and photopion production may be affected
by Lorentz invariance violation.46 Hence, the absence of the GZK-cutoff would result
from the fact that the threshold for photopion production “disappears” and the pro-
cess becomes kinematically not allowed. This implies that future PAO observations of
45 See also [476] for a SUSY inspired related scenario.46 Existing limits on the violation of Lorentz invariance come from multi–TeV γ-ray observations of
Mrk 501 [478].
65

faraway sources could provide constraints on, or even a measurement of, the violation
of Lorentz symmetry, yielding essential insights into the nature of gravity-induced wave
dispersion in the vacuum [479, 480, 481, 482, 483, 484, 485, 486, 487, 488].
In summary, future UHECR data may not only provide clues to the particle sources,
but could enhance our understanding of fundamental particle physics. We are entering
this new High Energy Physics era with the Pierre Auger Observatory [489, 490, 491].
IV. MINORITY REPORT: NEUTRINO SHOWERS
Extraterrestrial neutrinos provide a unique window to probe the deepest reaches
of stars, quasars, and exotic structures in the cosmos. In contrast to all other SM
particles, they can escape from dense astrophysical environments and propagate to the
Earth unscathed, arriving aligned with their source. Even at the highest energies the
νν annihilation mean free path on the cosmic neutrino background,
λν = (nν σνν)−1 ≈ 4 × 1028 cm , (71)
is somewhat above the present size of the horizon (recall that H−10 ∼ 1028 cm) [492].
In addition, the fluxes of ultra-high energy cosmic neutrinos offer clues to the prop-
erties of neutrinos themselves and provide an important probe of new ideas in particle
physics. Namely, their known interactions are so weak that new physics may easily
alter neutrino properties. This is especially relevant for extraterrestrial neutrinos with
energies & 106 GeV that interact with nucleons in the Earth atmosphere with center-
of-mass energies above the electroweak scale, where the SM is expected to be modified
by new physics.
In summary, ultra high energy extraterrestrial neutrinos are inextricably linked with
the physics processes discussed throughout this review. This chapter will therefore
focus on the main features of high energy neutrino astronomy. For comprehensive
reviews on cosmic neutrinos the reader is referred to [493, 494, 495, 496].
A. Bounds on the energy spectrum
The basic operational system of neutrino telescopes is an array of strings with photo-
multiplier tubes (PMTs) distributed throughout a natural Cerenkov medium such as
ice or water. The largest pilot experiments (∼ 0.1 km in size) are: the now defunct
DUMAND (Deep Underwater Muon and Neutrino Detector) experiment [497] in the
deep sea near Hawaii, the underwater experiment in Lake Baikal [498], and AMANDA
(Antarctic Muon And Neutrino Detector Array ) [499] in the South Pole ice. Next
generation neutrino telescopes aim towards an active volume in the range of 1 km3
66

of water. Projects under construction or in the proposal stage are: two deep sea
experiments in the Mediterranean, the French ANTARES (Astronomy with a Neutrino
telescope Abyss environment RESearch) [500] and NESTOR (Neutrino Experiment
SouthwesT Of GReece [501]), and IceCube [502], a scaled up version of the AMANDA
detector.
The traditional technique to observe cosmic neutrinos is to look for muons (along
with a visible hadronic shower if the ν is of sufficient energy) generated via charged-
current interactions, (νµ, νµ)N → (µ−, µ+)+ anything, in the rock below the detec-
tor. The Cerenkov light emitted by these muons is picked up by the PMTs, and is
used for track reconstruction. The muon energy threshold is typically in the range of
10−100 GeV. However, besides the desired extraterrestrial neutrinos, below ∼ 103 GeV
there is a significant background of leptons (produced by CRs interacting in the at-
mosphere) [503, 504] and so the task of developing diagnostics for neutrino sources
becomes complicated. With rising energy (& 106 GeV) the three neutrino flavors can
be identified [505].
The spectacular neutrino fireworks (in the 10 MeV range) from supernova 1987A
constitute the only extragalactic source so far observed [506, 507]. The Frejus [508],
Baikal [509], MACRO [510], and AMANDA [511] collaborations reported no excess of
neutrinos above the expected atmospheric background, enabling significant limts to be
set on the diffuse neutrino flux.47 These limits are shown in Fig. 9.
Upward going neutrinos with energies & 108 GeV are typically blocked by the Earth.
This shadowing severely restricts the high energy event rates in underground detectors.
However, neutrinos may also induce extensive air showers, so current and future air
shower experiments might also function as neutrino detectors. The neutrino interac-
tion length is far larger than the Earth’s atmospheric depth, which is only 0.36 km
water equivalent (kmwe) even when traversed horizontally. Neutrinos therefore shower
uniformly at all atmospheric depths. As a result, the most promising signal of neutrino-
induced cascades are quasi-horizontal showers initiated deep in the atmosphere. For
showers with large enough zenith angles, the likelihood of interaction is maximized and
the background from hadronic cosmic rays is eliminated, since the latter shower high in
the atmosphere. These ν-showers will appear as hadronic vertical showers, with large
electromagnetic components, curved fronts (a radius of curvature of a few km), and
signals well spread over time (on the order of microseconds).
47 The Frejus experiment, located in an underground laboratory, measured the energy of muons pro-
duced by neutrino interactions in the rock above the detector. The detector itself comprised a
calorimeter made from a vertical sandwich of over 900 iron slabs interspersed with flash chambers.
Geiger tubes embedded in the structure provided the trigger [512]. The extensive air shower array
on top of the Gran Sasso Laboratory (EAS-TOP) [513] and MACRO [514] used similar techniques.
67

FIG. 9: The horizontal solid lines indicate current 90% CL upper limits on the neutrino fluxes
∝ E−2 as reported by the EAS-TOP [515], DUMAND [516], Baikal [509], MACRO [510],
AMANDA [511], and RICE [517, 518] collaborations. The ∗ − ∗ − ∗ lines indicate model
independent bounds on the neutrino flux (dΦ〈νi+νi〉
/dE, with i = e, µ, τ) from AGASA +
Fly’s Eye data [519] (95% CL), Frejus [508], GLUE [414, 520], and FORTE searches in
the Greenland ice sheet [521]. The horizontal and diagonal thick dotted lines indicate the
expected 90% CL sensitivity of IceCube in 1 yr of operation [522]. Also shown (non-horizontal
thick dotted lines) are the projected sensitivities of PAO (1 yr running) [523], EUSO (1 yr
running) [524] and ANITA (45 days running) [524] corresponding to 1 event per decade. The
region between the falling dashed-dotted lines indicates the flux of atmospheric neutrinos.
The event rate for quasi-horizontal deep showers from ultra-high energy neutrinos
is [519]
N =∑
i,X
∫
dEi NAdΦi
dEiσiN→X(Ei) E(Ei) , (72)
where the sum is over all neutrino species i = νe, νe, νµ, νµ, ντ , ντ , and all final states X.
NA = 6.022 × 10²³ is Avogadro’s number, and dΦi/dEi is the source flux of neutrino
68

species i, σ as usual denotes the cross section, and E is the exposure measured in
cm3 w.e. sr time. The Fly’s Eye and the AGASA Collaborations have searched for
quasi-horizontal showers that are deeply-penetrating, with depth at shower maximum
Xmax > 2500 g/cm2 (see e.g. [525, 526]). There is only 1 event that unambiguously
passes this cut with 1.72 events expected from hadronic background, implying an upper
bound of 3.5 events at 95%CL from neutrino fluxes. Note that if the number of events
integrated over energy is bounded by 3.5, then the same limit is certainly applicable
bin by bin in energy. Thus, using Eq. (72) one obtains
∑
i,X
∫
∆
dEi NAdΦi
dEi
σiN→X(Ei) E(Ei) < 3.5 , (73)
at 95% CL for some energy interval ∆. Here, the sum over X takes into account charge
and neutral current processes. In a logarithmic interval ∆ where a single power law
approximationdΦi
dEi
σiN→X(Ei) E(Ei) ∼ Eαi (74)
is valid, a straightforward calculation shows that
∫ 〈E〉e∆/2
〈E〉e−∆/2
dEi
Ei
EidΦi
dEi
σiN→X E = 〈σiN→X E Ei dΦi/dEi〉sinh δ
δ∆ , (75)
where δ = (α + 1)∆/2 and 〈A〉 denotes the quantity A evaluated at the center of the
logarithmic interval. The parameter α = 0.363 + β − γ, where 0.363 is the power law
index of the SM neutrino cross sections [527] and β and −γ are the power law indices
(in the interval ∆) of the exposure and flux dΦi/dEi, respectively. Since sinh δ/δ > 1,
a conservative bound may be obtained from Eqs. (73) and (75):
NA
∑
i,X
〈σiN→X(Ei)〉 〈E(Ei)〉 〈EidΦi/dEi〉 < 3.5/∆ . (76)
By taking ∆ = 1 as a likely interval in which the single power law behavior is valid
(this corresponds to one e-folding of energy), and setting 〈EidΦi/dEi〉 = 16〈EνdΦν/dEν〉
(Φν ≡ total neutrino flux) from Eq. (76) it is straightforward to obtain 95%CL upper
limits on the neutrino flux. The limits are shown in Fig. 9.
These bounds will be improved in the near future. In particular, each site of PAO
will observe ∼ 15 km3we sr of target mass around 1019 eV [528]. Moreover, the study of
radio pulses from electromagnetic showers created by neutrino interactions in ice would
provide an increase in the effective area up to 104 km2. A prototype of this technique
is the Radio Ice Cerenkov Experiment (RICE) [529]. Similar concepts are used by
69

the Goldstone Lunar ultrahigh energy neutrino Experiment (GLUE),48 the ANtartic
Impulse Transient Array (ANITA),49 and the Fast On-orbit Recording of Transient
Events (FORTE).50 Existing limits on ν-fluxes from RICE, GLUE and FORTE, as
well as the projected sensitivities of forthcoming experiments are collected in Fig. 9.
B. Astronomy on Ice
IceCube is, perhaps, the most promising route for neutrino detection [522]. This
telescope will consist of 80 kilometer-length strings, each instrumented with 60 10-
inch photomultipliers spaced by 1.7 m. The deepest module is 2.4 km below the ice
surface. The strings are arranged at the apexes of equilateral triangles 125 m on a
side. The instrumented detector volume is a cubic kilometer.51 A surface air shower
detector, IceTop, consisting of 160 Auger-style Cerenkov detectors deployed over 1 km2
above IceCube, augments the deep-ice component by providing a tool for calibration,
background rejection and air-shower physics. Muons can be observed from 1011 eV to
1018 eV. Cascades, generated by νe, νe, ντ , and ντ can be observed above 1011 eV and
reconstructed at energies somewhat above 1013 eV. The angular resolution is ≈ 0.7 at
TeV energies.
A variety of neutrino-emitting-sources have been proposed, such as supernovae [531]
(see also [532] for a detailed study on directionality), GRB fireballs [400, 533, 534, 535],
microquasars [536], X-ray binaries [169], AGN [537], FRI radio galaxies [538], etc. As
an example of the IceCube potential, in what follows we briefly discuss its sensitivity
to probe the neutron hypothesis of UHECRs via observation of the antineutrino beam
n → p+e−+νe, expected from the Cygnus direction [65]. To this end, we first estimate
the background signal. As discussed in Sec. IIA, the TeV γ-ray flux,
dFγ
dEγ= 4.7(±2.1stat ± 1.3sys) × 10−13
(
E
1 TeV
)−1.9(±0.3stat±0.3sys)
ph cm−2s−1TeV−1 ,
(77)
reported by HEGRA Collaboration [152] in the vicinity of Cygnus OB2 is likely due
to hadronic processes. Since π0’s, π+’s, and π−’s are produced in equal numbers,
48 This experiment observes microwave Cerenkov pulses from electromagnetic showers induced by
neutrinos interacting in the Moon’s rim [520]49 A balloon-borne payload that will circle the continent of Antartica at 35,000 meters, scanning
the vast expanses of ice for telltale pulses of radio emission generated by the neutrino collisions
[http://www.ps.uci.edu∼anita/].50 The FORTE satellite records bursts of electromagnetic waves arising from near the Earth’s surface
in the radio frequency range 30 to 300 MHz with a dual polarization antena [521].51 Extension of these aperture is in the proposal stage [530].
70

we expect two photons, two νe’s, and four νµ’s per π0. On average, the photons
carry one-half of the energy of the pion, and the neutrinos carry one-quarter. For
dFπ/dEπ ∝ E−2π , the energy-bins dE scale with these fractions, and we arrive at
dFγ
dEγ(Eγ = Eπ/2) = 4
dFπ
dEπ(Eπ)
dFνe
dEνe
(Eνe = Eπ/4) = 4dFπ
dEπ(Eπ) , (78)
dFνµ
dEνµ
(Eνµ = Eπ/4) = 8dFπ
dEπ(Eπ) ,
for the fluxes at the source, where π denotes any one of the three pion charge-states.
Terrestrial experiments (see e.g. [539]) have shown that νµ and ντ are maximally mixed
with a mass-squared difference ∼ 10−3eV2. This together with the known smallness
of |〈νe|ν3〉|2, implies that the νµ’s will partition themselves equally between νµ’s and
ντ ’s on lengths large compared to the oscillation length λosc ∼ 1.5×10⁻³ (Eν/PeV) pc.
Here ν3 ≃ (νµ +ντ )/√
2 is the third neutrino eigenstate. From these remarks, one finds
a nearly identical flux for each of the three neutrino flavors (j = e, µ, τ), which is equal
to [168]dFνj
dEνj
(Eνj= Eγ/2) = 2
dFγ
dEγ(Eγ) . (79)
Although TeV neutrinos are copiously produced, because they are weakly interacting
the detection probability on Earth is tiny, about 10−6 [493]. In particular, the expected
ν event rate at IceCube associated with the unidentified HEGRA source is < 1 yr−1
(D. Hooper, private communication). Such an event rate is even smaller than the
atmospheric neutrino background.52 Moreover, existing limits on TeV γ-ray fluxes in
this region of the sky are near the HEGRA sensitivity.53 In light of this, we take as
background the atmospheric neutrino event rate, and so Poisson statistics implies that
a signal ≥ 3.7 events is significant at the 95% CL.
Antineutrinos take only a very small part of the energy of the parent neutron, typi-
cally ∼ 10−3. Hence, to estimate the event rate of TeV antineutrinos at IceCube, the
52 For a year of running at IceCube the expected background from atmospheric neutrinos (with energy
≥ 1 TeV) within 1 circle centered in the Cygnus direction (about 40 below the horizon) is < 1.5
events.53 Specifically, the CASA-MIA experiment observed the Cygnus region over a 5 year period (1990-
1995) and the collected data place a bound Fγ(Eγ > 115 TeV) < 6.3 × 10⁻¹⁵ ph cm−2 s−1, at the
90%CL [540]. Extrapolation down to lower energies, assuming a spectrum ∝ E−2γ , leads to Fγ(Eγ >
1TeV) < 7.2 × 10⁻¹³ ph cm−2 s−1. This is within a factor of 2 of the HEGRA measurements [152,
541], Fγ(Eγ > 1TeV) ≈ 4.5 × 10⁻¹³ ph cm−2 s−1.
71

relevant nucleus population at the source has an energy per nucleon EN,PeV ∼ 1 PeV.
Nuclei with Lorentz factor ∼ 106 are synthesized in all supernovae. Hadronic inter-
actions with the HII population (density < 30 cm−3 [153]) and photodisintegration
processes provide the flux of PeV neutrons. In this energy regime, the target photons
at photodisintegration threshold energies are in the ultraviolet, ∼ 5 eV. This includes
the entire emission spectrum of the O stars and about 60% of photons from B stars
(with average temperature 28,000 K). From the photon emission rate FUV the number
density nUV at the surface of a sphere of radius R from the core center is given by
1
4nUV c =
FUV
4πR2. (80)
For the O-star population, the photon emission rate in the Lyman region is found to
be FL ≈ 1051 photons s−1 [206]. The Lyman emission corresponds to 60% of the entire
O star spectrum. Furthermore, as mentioned above, 60% of the B star spectrum is also
active for photodisintegration in this energy region, and the B star population is about
20 times greater than that of the O stars [206]. Now, from the H-R diagram [542]
one can infer that the energy luminosity of a B-star is about 0.1 that of an O star.
Additionally, the B star temperature is about 0.5 the O star temperature, giving a
number luminosity ratio of about 0.2. All in all, for photodisintegration resulting in
PeV nucleons, the relevant photon density in the core of the Cygnus OB2 association is
nUV ∼ 230 cm−3. The nucleus mean free path is ≈ 35 kpc, corresponding to a collision
time τ = 105 yr. Thus, the collision rate for photodisintegration in the core region is
comparable to the hadronic interaction rate.54
Since one is interested in neutrinos, it is still necessary to compare the production
rate for charged pions in the hadronic case to the overall rate for generating neutrons.
To assess this ratio, we made use of available high energy event simulations showing
spectator nucleon and pion spectra for Fe-N/p-N collisions at 1015 and 1016 eV [543]
(summarized in [544]). The pion rapidity spectra in the central plateau are roughly
energy independent, except for the widening of the plateau with energy –see [39]–,
whereas there is a slow increase of spectator neutrons as one reaches the region of
interest (EN ≈ 1 PeV). Allowing for sizeable differences in hadronic interaction models,
the secondary populations are roughly 35% π±, 45% γ, 10% nucleons, and 10% K [544].
In the energy range yielding PeV neutrons, only about 30% of the rapidity plateau
contributes charged pions above 2 TeV. Since only half the nucleons are neutrons, we
arrive at a ratioπ±(> 2 TeV)
n(∼ PeV)≈ 3 (81)
54 This estimate takes into account a hadronic cross section, σFep ∼ A0.75 σpp ≈ 6 × 10⁻²⁵ cm2, and
the generous upper limit [151] of the nucleon density ∼ 30 cm−3 [153].
72

in the hadronic interactions.
However, photodisintegration also takes place in the outer regions of the OB associ-
ation as long as: (i) the density of the optical photons propagating out from the core
allows a reaction time which is smaller than the age of the cluster ∼ 2.5 Myr [545] and
(ii) the diffusion front of the nuclei has passed the region in question. From Eq. (80) we
estimate an average photon density nUV & 25 cm−3 out to 30 pc, which gives a reaction
time of ≈ 106 yr. The diffusion time (∼ 1.2 Myr) is a bit smaller than the age of the
cluster, and somewhat higher than the reaction time, allowing about 90% of the nuclei
to interact during the lifetime of the source. Thus, the production rate of neutrons
via photodisintegration is amplified by a volume factor of 27 over the rate in the 10
pc core. The net result of all this consideration is that the PeV neutron population is
about an order of magnitude greater than that of the TeV charged pions [65].
With this in mind, we now discuss the prospects for a new multi-particle astronomy:
neutrons as directional pointers + antineutrinos as inheritors of directionality. The
basic formula that relates the neutron flux at the source (dFn/dEn) to the antineutrino
flux observed at Earth (dFν/dEν) is [65]:
dFν
dEν(Eν) =
∫
dEndFn
dEn(En)
(
1 − e−D mnEn τn
)
∫ Q
0
dǫνdP
dǫν(ǫν)
×∫ 1
−1
d cos θν
2δ[
Eν − En ǫν (1 + cos θν)/mn
]
. (82)
The variables appearing in Eq. (82) are the antineutrino and neutron energies in the
lab (Eν and En), the antineutrino angle with respect to the direction of the neutron
momentum, in the neutron rest-frame (θν), and the antineutrino energy in the neutron
rest-frame (ǫν). The last three variables are not observed by a laboratory neutrino-
detector, and so are integrated over. The observable Eν is held fixed. The delta-
function relates the neutrino energy in the lab to the three integration variables.55 The
parameters appearing in Eq. (82) are the neutron mass and rest-frame lifetime (mn and
τn), and the distance to the neutron source (D). dFn/dEn is the neutron flux at the
source, or equivalently, the neutron flux that would be observed from the Cygnus region
in the absence of neutron decay. Finally, dP/dǫν is the normalized probability that the
decaying neutron in its rest-frame produces a νe with energy ǫν . Setting the beta-decay
neutrino energy ǫν equal to its mean value ≡ ǫ0 ∼ (mn −mp)[1−m2e/(mn −mp)
2]/2 ≈0.55 MeV, we have dP/dǫν = δ(ǫν − ǫ0).
56 Here, the maximum neutrino energy in the
neutron rest frame is Q ≡ mn−mp−me = 0.71 MeV, and the minimum neutrino energy
55 Note that Eν = Γn(ǫν + βǫν cos θν) = Enǫν(1 + cos θν)/mn, where Γn = En/mn is the Lorentz
factor, and (as usual) β ≈ 1 is the particle’s velocity in units of c.56 The delta-function in the neutron frame gives rise to a flat spectrum for the neutrino energy in the
73

is zero in the massless limit.57 The expression in parentheses in Eq. (82) is the decay
probability for a neutron with lab energy En, traveling a distance D. In principle, one
should consider a source distribution, and integrate over the volume∫
d3D. Instead,
we will take D to be the 1.7 kpc distance from Earth to Cygnus OB2; for the purpose
of generating the associated neutrino flux, this cannot be in error by too much.
Putting all this together, normalization to the observed “neutron” excess at ∼1018 eV leads to about 20 antineutrino events at IceCube per year [65]. Note that
anti-neutrino flux at 1 TeV may also originate in the decay of 1 PeV neutrons from
sources whose spectrum cuts off at that energy, and hence are not subject to normal-
ization by the anisotropy. Thus, this estimate may be regarded as very conservative.
A direct TeV νe event in IceCube will make a showering event, which, even if seen,
provides little angular resolution. In the energy region below 1 PeV, IceCube will
resolve directionality only for νµ and νµ. Fortunately, neutrino oscillations rescue the
signal. Since the distance to the Cygnus region greatly exceeds the νe oscillation length
λosc ∼ 10−2(Eν/PeV) pc (taking the solar oscillation scale δm2 ∼ 10−5eV2), the an-
tineutrinos decohere in transit. The arriving antineutrinos are distributed over flavors,
with the muon antineutrino flux Fνµ given by the factor 14
sin2(2 θ⊙) ≃ 0.20 times the
original Fνe flux. The ντ flux is the same, and the νe flux is 0.6 times the original
flux. Here we have utilized for the solar mixing angle the most recent SNO result
θ⊙ ≃ 32.5 [546], along with maximal mixing for atmospheric νµ-ντ neutrinos and a
negligible νe component in the third neutrino eigenstate. All in all, for a year of run-
ning at IceCube, one conservatively expects 4 νµ showers with energies & 1 TeV to
cluster within 1 of the source direction, comfortably above the stated CL [65].
IceCube is not sensitive to TeV neutrinos from the Galactic Center, as these are above
the IceCube horizon, where atmospheric muons will dominate over any signal. However,
other kilometer-scale neutrino detectors, such as those planned for the Mediterranean
Sea, may see the Galactic Center flux.
In summary, in a few years of observation, IceCube will attain 5σ sensitivity for
discovery of the Fe→ n → νe → νµ cosmic beam, providing the “smoking ice” for the
Galactic Plane neutron hypothesis.
lab for fixed neutron lab-energy En = Γn mn:
dP
dEν
=
∫ 1
−1
d cos θν
2
(
dǫν
dEν
) (
dP
dǫν
)
=1
2 Γn ǫ0,
with 0 ≤ Eν ≤ 2 Γn ǫ0.57 The massless-neutrino approximation seems justifiable here: even an eV-mass neutrino produced
at rest in the neutron rest-frame would have a lab energy of mν Γn . GeV, below threshold for
neutrino telescopes.
74

C. Probes of new physics beyond the electroweak scale
It is intriguing – and at the same time suggestive – that the observed flux of CRs
beyond the GZK-energy is well matched by the flux predicted for cosmogenic neutri-
nos [547, 548, 549, 550]. Of course, this is not a simple coincidence: any proton flux
beyond EthpγCMB
is degraded in energy by photoproducing π0 and π±, with the latter in
turn decaying to produce cosmogenic neutrinos. The number of neutrinos produced in
the GZK chain reaction compensates for their lesser energy, with the result that the cos-
mogenic flux matches well the observed CR flux beyond 1020 eV. Recently, the prospect
of an enhanced neutrino cross section has been explored in the context of theories with
large compact dimensions.58 In these theories, the extra spatial dimensions are respon-
sible for the extraordinary weakness of the gravitational force, or, in other words, the
extreme size of the Planck mass [552, 553]. For example, if spacetime is taken as a di-
rect product of a non-compact 4-dimensional manifold and a flat spatial n-torus T n (of
common linear size 2πrc), one obtains a definite representation of this picture in which
the effective 4-dimensional Planck scale, MPl ∼ 1019 GeV, is related to the fundamental
scale of gravity, MD, according to M2Pl = 8π M2+n
D rnc . Within this framework, virtual
graviton exchange would disturb high energy neutrino interactions, and in principle,
could increase the neutrino interaction cross section in the atmosphere by orders of
magnitude beyond the SM value; namely σνN ∼ [Eν/(1010) GeV] mb [554, 555, 556].
However, it is important to stress that a cross section of ∼ 100 mb would be necessary
to obtain consistency with observed showers which start within the first 50 g/cm2 of
the atmosphere. This is because Kaluza–Klein modes couple to neutral currents and
the scattered neutrino carries away 90% of the incident energy per interaction [557].
Moreover, models which postulate strong neutrino interactions at super-GZK energies
also predict that moderately penetrating showers should be produced at lower ener-
gies, where the neutrino-nucleon cross section reaches a sub-hadronic size. Within TeV
scale gravity σνN is likely to be sub-hadronic near the energy at which the cosmo-
genic neutrino flux peaks, and so moderately penetrating showers should be copiously
produced [558]. Certainly, the absence of moderately penetrating showers in the CR
data sample should be understood as a serious objection to the hypothesis of neutrino
progenitors of the super-GZK events.
Large extra dimensions still may lead to significant increases in the neutrino cross
section. If this scenario is true, we might hope to observe black hole (BH) produc-
tion (somewhat more masive than MD) in elementary particle collisions with center-
58 A point worth noting at this juncture: the neutrino-nucleon cross section can also be significantly
enhanced at center-of-mass energies & 100 TeV (within the SM) via electroweak instanton-induced
processes [551].
75

of-mass energies & TeV [559, 560, 561]. In particular, BHs occurring very deep in
the atmosphere (revealed as intermediate states of ultrahigh energy neutrino interac-
tions) could trigger quasi-horizontal showers and be detected by cosmic ray observa-
tories [562, 563, 564, 565, 566]. Additionally, neutrinos that traverse the atmosphere
unscathed may produce BHs through interactions in the ice or water and be detected
by neutrino telescopes [567, 568]. Interestingly, σνN→BH ∝ M(−4+2n)/(1+n)D . There-
fore, the non-observation of the almost guaranteed flux of cosmogenic neutrinos can
be translated into bounds on the fundamental Planck scale. For n ≥ 5 extra spa-
tial dimensions compactified on T n, recent null results from CR detectors lead to
MD > 1.0 − 1.4 TeV [569, 570]. These bounds are among the most stringent and
conservative to date. In the near future, PAO will provide more sensitive probes of
TeV-scale gravity and extra dimensions [571]. Certainly, the lack of observed deeply-
penetrating showers can be used to place more general, model-independent, bounds on
σνN [519, 572, 573, 574].
Up to now we have only discussed how to set bounds on physics beyond the SM. An
actual discovery of new physics in cosmic rays is a tall order because of large uncer-
tainties associated with the depth of the first interaction in the atmosphere, and the
experimental challenges of reconstructing cosmic air showers from partial information.
However, a similar technique to that employed in discriminating between photon and
hadron showers can be applied to search for signatures of extra-dimensions. Specif-
ically, if an anomalously large quasi-horizontal deep shower rate is found, it may be
ascribed to either an enhancement of the incoming neutrino flux, or an enhancement
in the neutrino-nucleon cross section. However, these two possibilities may be distin-
guished by separately binning events which arrive at very small angles to the horizontal,
the so-called “Earth-skimming” events [575, 576]. An enhanced flux will increase both
quasi-horizontal and Earth-skimming event rates, whereas a large BH cross section
suppresses the latter, because the hadronic decay products of BH evaporation do not
escape the Earth’s crust [577]. For a more detailed discussion of neutrino interactions
in the Earth atmosphere within TeV scale gravity scenarios see e.g. [1].
V. ANY GIVEN SUNDAY: COUNTDOWN TO DISCOVERY
With data now at hand, not only there are several interesting, plausible theoretical
models within the standard astrophysical agenda to explain all the CRs detected so far,
but there could indeed be too many. Perhaps yet unexpected degeneracy problems will
appear, even with the forthcoming data of the Pierre Auger Observatory, a topic which
till now has not been a subject of debate. In our view, Occam’s razor imposes that all
standard astrophysical models be eliminated before embarking in the consequences of
explanations involving physics beyond the standard scenarios. However, should this be
76

the case, the prospect for encountering a profound scientific revolution are endless. The
puzzle of UHECRs may have something to say about issues as fundamental as local
Lorentz invariance: On the one hand, the absence of photo-pion production above the
GZK-limit would imply no cosmogenic neutrino flux and possibly undeflected pointing
of the primary back to its source. On the other hand, a significant correlation of TeV-
antineutrinos with directional signals at EeV energies will validate Special Relativity to
an unprecedented boost factor of Γ ≈ 109, several orders of magnitude beyond current
limits. Additionally, contrasting the observed quasi-horizontal neutrino flux with the
expected neutrino flux can help constrain TeV-scale gravity interactions and improve
current bounds on the fundamental Planck scale. An optimist might even imagine the
discovery of microscopic BHs, the telltale signature of the Universe’s unseen dimensions.
At the time of writing, new data is being collected at Pampa Amarilla. Whatever
happens, in T–2 years we shall witness the lift-off of a new era of cosmic ray physics.
Acknowledgments
During the last few years, we have benefitted from discussions with several colleagues
and collaborators, among them, Felix Aharonian, John Bahcall, Paula Benaglia, Pe-
ter Biermann, Elihu Boldt, Murat Boratav, Yousaf Butt, Analıa Cillis, Jorge Combi,
Jim Cronin, Tom Dame, Chuck Dermer, Seth Digel, Eva Domingo, Susan and Gabor
Domokos, Marıa Teresa Dova, Luis Epele, Jonathan Feng, Francesc Ferrer, Haim Gold-
berg, Francis Halzen, Tim Hamilton, Carlos Hojvat, Dan Hooper, Michael Kachelriess,
Mike Loewenstein, Tom Mc Cauley, Gustavo Medina Tanco, Pran Nath, Carlos Nunez,
Tom Paul, Santiago Perez Bergliaffa, Brian Punsly, Olaf Reimer, Steve Reucroft, An-
dreas Ringwald, Gustavo Romero, Esteban Roulet, Subir Sarkar, Sergio Sciutto, Dmitri
Semikoz, Al Shapere, Paul Sommers, Guenter Sigl, Todor Stanev, John Swain, Tomasz
Taylor, Dave Thompson, Peter Tinyakov, Alan Watson, Tom Weiler, and Allan Widom.
We specially thank Frank Scherb for valuable information on the early history of cosmic
ray detectors. We would like to thank several of the collegues mentioned above as well
as Ray Protheroe for allowing us to use some figures from their papers in this review.
We thank Julianna Gianni for inspiration. The work of DFT was performed under the
auspices of the U.S. Department of Energy (NNSA) by University of California’s LLNL
under contract No. W-7405-Eng-48. The work of LAA has been partially supported
by the US National Science Foundation (NSF) under grant No. PHY-0140407.
[1] L. Anchordoqui, T. Paul, S. Reucroft and J. Swain, Int. J. Mod. Phys. A 18, 2229
(2003) [arXiv:hep-ph/0206072].
77

[2] M. Nagano and A. A. Watson, Rev. Mod. Phys. 72, 689 (2000).
[3] A. A. Watson, Phys. Rept. 333, 309 (2000).
[4] X. Bertou, M. Boratav and A. Letessier-Selvon, Int. J. Mod. Phys. A 15, 2181 (2000)
[arXiv:astro-ph/0001516].
[5] S. Yoshida and H. Dai, J. Phys. G 24, 905 (1998) [arXiv:astro-ph/9802294].
[6] P. Sokolsky, P. Sommers and B. R. Dawson, Phys. Rept. 217, 225 (1992).
[7] G. W. Clark, J. Earl, W. L. Kraushaar, J. Linsley, B. B. Rossi, F. Scherb, and D. W.
Scott, Phys. Rev. 122, 637 (1961).
[8] G. W. Clark, J. Earl, W. L. Kraushaar, J. Linsley, B. B. Rossi, and F. Scherb, Nature
180, 353 (1957).
[9] G. W. Clark, J. Earl, W. L. Kraushaar, J. Linsley, B. B. Rossi, and F. Scherb, Nuovo
Cim. Suppl. 8 Ser. 10, 623 (1958).
[10] J. Linsley, L. Scarsi, and B. Rossi, Phys. Rev. Lett. 6, 485 (1961).
[11] J. Linsley and L. Scarsi, Phys. Rev. 128, 2384 (1962).
[12] J. Linsley, Phys. Rev. Lett. 10, 146 (1963).
[13] M. A. Lawrence, R. J. Reid and A. A. Watson, J. Phys. G 17, 733 (1991).
[14] G. B. Khristiansen, Proc. of 19th International Cosmic Ray Conference (La Jolla), 9
487 (1985).
[15] A. A. Ivanov, S. P. Knurenko and I. Y. Sleptsov, Nucl. Phys. Proc. Suppl. 122, 226
(2003) [arXiv:astro-ph/0305053].
[16] M. M. Winn, J. Ulrichs, L. S. Peak, C. B. Mccusker and L. Horton, J. Phys. G 12, 653
(1986).
[17] N. Chiba et al., Nucl. Instrum. Meth. A 311, 338 (1992).
[18] H. Ohoka et al., [AGASA Collaboration], Nucl. Instrum. Meth. A 385, 268 (1997).
[19] H. E. Bergeson et al., Phys. Rev. Lett. 39, 847 (1977).
[20] R. M. Baltrusaitis et al., Nucl. Instrum. Meth. A 240, 410 (1985).
[21] R. M. Baltrusaitis et al., Nucl. Instrum. Meth. A 264, 87 (1988).
[22] S. C. Corbato et al., Nucl. Phys. Proc. Suppl. 28B, 36 (1992).
[23] T. Abu-Zayyad et al., Nucl. Instrum. Meth. A 450, 253 (2000).
[24] P. M. S. Blackett and A. C. B Lovell, Proc. Roy. Soc. (London) Ser. A 177, 183 (1940).
[25] P. W. Gorham, Astropart. Phys. 15, 177 (2001) [arXiv:hep-ex/0001041].
[26] P. W. Gorham, AIP Conf. Proc. 579, 253 (2001).
[27] T. Vinogradova, E. Chapin, P. Gorham and D. Saltzberg, AIP Conf. Proc. 579, 271
(2001).
[28] J. Abraham et al. [AUGER Collaboration], Nucl. Instrum. Meth. A 523, 50 (2004).
[29] O. Catalano, Nuovo Cim. 24C, 445 (2001).
[30] L. Scarsi, Nuovo Cim. 24C, 471 (2001).
[31] J. A. Hinton [The HESS Collaboration], New Astron. Rev. 48, 331 (2004)
[arXiv:astro-ph/0403052].
[32] C. Baixeras et al., Nucl. Instrum. Meth. A 518, 188 (2004).
[33] M. Mori [CANGAROO Collaboration], Prog. Theor. Phys. Suppl. 151, 85 (2003).
[34] T. C. Weekes et al., Astropart. Phys. 17, 221 (2002) [arXiv:astro-ph/0108478].
78

[35] N. Gehrels [GLAST Collaboration], AIP Conf. Proc. 558, 3 (2001).
[36] N. Gehrels and P. Michelson, Astropart. Phys. 11, 277 (1999).
[37] F. Longo et al., Nucl. Phys. Proc. Suppl. 125, 222 (2003).
[38] L. A. Anchordoqui, M. T. Dova, L. N. Epele and S. J. Sciutto, Phys. Rev. D 59, 094003
(1999) [arXiv:hep-ph/9810384].
[39] J. Ranft, arXiv:hep-ph/0012171.
[40] J. Alvarez-Muniz, R. Engel, T. K. Gaisser, J. A. Ortiz and T. Stanev,
arXiv:astro-ph/0205302.
[41] J. Knapp, D. Heck, S. J. Sciutto, M. T. Dova and M. Risse, Astropart. Phys. 19, 77
(2003) [arXiv:astro-ph/0206414].
[42] L. Anchordoqui, M. T. Dova, A. Mariazzi, T. McCauley, T. Paul, S. Reucroft and
J. Swain, arXiv:hep-ph/0407020.
[43] M. Ave, J. A. Hinton, R. A. Vazquez, A. A. Watson and E. Zas, Phys. Rev. Lett. 85,
2244 (2000) [arXiv:astro-ph/0007386].
[44] J. Linsley and A. A. Watson, Phys. Rev. Lett. 46, 459 (1981).
[45] A. M. Hillas, J. D. Hollows, H. W. Hunter, and D. J. Marsden, Proc. 12th International
Cosmic Ray Conference (Hobart) 3, 1007 (1971).
[46] L. Anchordoqui and H. Goldberg, Phys. Lett. B (to be published)
[arXiv:hep-ph/0310054].
[47] D. J. Bird et al. [HIRES Collaboration], Phys. Rev. Lett. 71, 3401 (1993).
[48] T. K. Gaisser et al. [HIRES Collaboration], Phys. Rev. D 47, 1919 (1993).
[49] R. Walker and A. A. Watson, J. Phys. G 8, 1131 (1982).
[50] N. Hayashida et al. [Akeno Collaboration], J. Phys. G 21, 1101 (1995).
[51] T. Wibig and A. W. Wolfendale, J. Phys. G. 25, 1099 (1999).
[52] M. T. Dova, M. E. Mancenido, A. G. Mariazzi, T. P. McCauley and A. A. Watson,
arXiv:astro-ph/0312463.
[53] B. R. Dawson, R. Meyhandan and K. M. Simpson, Astropart. Phys. 9, 331 (1998)
[arXiv:astro-ph/9801260].
[54] M. Ave, L. Cazon, J. A. Hinton, J. Knapp, J. LLoyd-Evans and A. A. Watson, As-
tropart. Phys. 19, 61 (2003) [arXiv:astro-ph/0203150].
[55] M. T. Dova, M. E. Mancenido, A. G. Mariazzi, T. P. McCauley and A. A. Watson,
arXiv:astro-ph/0305351.
[56] N. Hayashida et al., Phys. Rev. Lett. 77, 1000 (1996).
[57] G. R. Farrar and P. L. Biermann, Phys. Rev. Lett. 81, 3579 (1998)
[arXiv:astro-ph/9806242].
[58] J. Linsley, Phys. Rev. Lett. 34, 1530 (1975).
[59] N. Hayashida et al. [AGASA Collaboration], Astropart. Phys. 10, 303 (1999)
[arXiv:astro-ph/9807045].
[60] M. Teshima et al., Proc. 27th International Cosmic Ray Conference, (Copernicus
Gesellschaft, 2001) p.341.
[61] D. J. Bird et al. [HIRES Collaboration], Astrophys. J. 511, 739 (1999)
[arXiv:astro-ph/9806096].
79

[62] J. A. Bellido, R. W. Clay, B. R. Dawson and M. Johnston-Hollitt, Astropart. Phys. 15,
167 (2001) [arXiv:astro-ph/0009039].
[63] K. Tsuchiya et al. [CANGAROO-II Collaboration], Astrophys. J. 606, L115 (2004)
[arXiv:astro-ph/0403592].
[64] T. Antoni et al. [The KASCADE Collaboration], arXiv:astro-ph/0312375.
[65] L. A. Anchordoqui, H. Goldberg, F. Halzen and T. J. Weiler, arXiv:astro-ph/0311002.
[66] D. M. Edge, A. M. Pollock, R. J. Reid, A. A. Watson and J. G. Wilson, J. Phys. G 4,
133 (1978).
[67] M. M. Winn, J. Ulrichs, L. S. Peak, C. B. Mccusker and L. Horton, J. Phys. G 12, 675
(1986).
[68] G. L. Cassiday et al., Astrophys. J. 351, 454 (1990).
[69] M. Takeda et al., Astrophys. J. 522, 225 (1999) [arXiv:astro-ph/9902239].
[70] N. W. Evans, F. Ferrer and S. Sarkar, Astropart. Phys. 17, 319 (2002).
[71] J. Wdowczyk and A. W. Wolfendale, J. Phys. G 10, 1453 (1984).
[72] L. A. Anchordoqui, C. Hojvat, T. P. McCauley, T. C. Paul, S. Reucroft, J. D. Swain
and A. Widom, Phys. Rev. D 68, 083004 (2003) [arXiv:astro-ph/0305158].
[73] R. Abbasi et al. [HiRes Collaboration], arXiv:astro-ph/0309457.
[74] N. Hayashida et. al. [AGASA Collaboration], arXiv:astro-ph/0008102.
[75] L. A. Anchordoqui, H. Goldberg, S. Reucroft, G. E. Romero, J. Swain and D. F. Torres,
Mod. Phys. Lett. A 16, 2033 (2001) [arXiv:astro-ph/0106501].
[76] H. Goldberg and T. J. Weiler, Phys. Rev. D 64, 056008 (2001)
[arXiv:astro-ph/0009378].
[77] Y. Uchihori, M. Nagano, M. Takeda, M. Teshima, J. Lloyd-Evans and A. A. Watson,
Astropart. Phys. 13, 151 (2000) [arXiv:astro-ph/9908193].
[78] P. G. Tinyakov and I. I. Tkachev, JETP Lett. 74, 1 (2001) [Pisma Zh. Eksp. Teor. Fiz.
74, 3 (2001)] [arXiv:astro-ph/0102101].
[79] R. U. Abbasi et al. [HiRes Collaboration], arXiv:astro-ph/0404137.
[80] R. U. Abbasi et al. [HiRes Collaboration], arXiv:astro-ph/0404366.
[81] C. B. Finley and S. Westerhoff, arXiv:astro-ph/0309159.
[82] P. Bhattacharjee and G. Sigl, Phys. Rept. 327, 109 (2000) [arXiv:astro-ph/9811011].
[83] G. Sigl, Prepared for Physics and Astrophysics of Ultrahigh-energy Cosmic Rays,
Meudon, France, 26-29 Jun 2000.
[84] F. W. Stecker, J. Phys. G 29, R47 (2003) [arXiv:astro-ph/0309027].
[85] L. A. Anchordoqui and M. T. Dova, AUGER Internal Note, GAP-2003-092.
[86] K. Greisen, Phys. Rev. Lett. 16, 748 (1966).
[87] G. T. Zatsepin and V. A. Kuzmin, JETP Lett. 4, 78 (1966) [Pisma Zh. Eksp. Teor.
Fiz. 4, 114 (1966)].
[88] O. E. Kalashev, V. A. Kuzmin, D. V. Semikoz and I. I. Tkachev,
arXiv:astro-ph/0107130.
[89] F. W. Stecker, Phys. Rev. Lett. 21, 1016 (1968).
[90] C. T. Hill and D. N. Schramm, Phys. Rev. D 31, 564 (1985).
[91] V. S. Berezinsky and S. I. Grigor’eva, Astron. Astrophys. 199, 1 (1988).
80

[92] F. W. Stecker, Nature 342, 401 (1989).
[93] F. A. Aharonian, B. L. Kanevsky and V. V. Vardanian, Astrophys. Space. Sci. 167, 93
(1990).
[94] S. Yoshida and M. Teshima, Prog. Theor. Phys. 89, 833 (1993).
[95] F. A. Aharonian and J. W. Cronin, Phys. Rev. D 50, 1892 (1994).
[96] R. J. Protheroe and P. A. Johnson, Astropart. Phys. 4, 253 (1996)
[arXiv:astro-ph/9506119].
[97] L. A. Anchordoqui, M. T. Dova, L. N. Epele and J. D. Swain, Nucl. Phys. Proc. Suppl.
52B, 249 (1997).
[98] L. A. Anchordoqui, M. T. Dova, L. N. Epele and J. D. Swain, Phys. Rev. D 55, 7356
(1997) [arXiv:hep-ph/9704387].
[99] S. Lee, Phys. Rev. D 58, 043004 (1998) [arXiv:astro-ph/9604098].
[100] A. Achterberg, Y. A. Gallant, C. A. Norman and D. B. Melrose,
arXiv:astro-ph/9907060.
[101] T. Stanev, R. Engel, A. Mucke, R. J. Protheroe and J. P. Rachen, Phys. Rev. D 62,
093005 (2000) [arXiv:astro-ph/0003484].
[102] Z. Fodor and S. D. Katz, Phys. Rev. D 63, 023002 (2001) [arXiv:hep-ph/0007158].
[103] L. A. Anchordoqui and D. F. Torres, Phys. Lett. A 283, 319 (2001)
[arXiv:cond-mat/0009199].
[104] G. R. Blumenthal, Phys. Rev. D 1, 1596 (1970).
[105] F. W. Stecker, Phys. Rev. 180, 1264 (1969).
[106] J. L. Puget, F. W. Stecker and J. H. Bredekamp, Astrophys. J. 205, 638 (1976).
[107] L. A. Anchordoqui, M. T. Dova, L. N. Epele and J. D. Swain, Phys. Rev. D 57, 7103
(1998) [arXiv:astro-ph/9708082].
[108] L. A. Anchordoqui, Ph.D. Thesis [arXiv:astro-ph/9812445].
[109] L. N. Epele and E. Roulet, JHEP 9810, 009 (1998) [arXiv:astro-ph/9808104].
[110] F. W. Stecker and M. H. Salamon, Astrophys. J. 512, 521 (1992)
[arXiv:astro-ph/9808110].
[111] G. R. Farrar and P. L. Biermann, Phys. Rev. Lett. 83, 2472 (1999)
[arXiv:astro-ph/9901315].
[112] M. Lemoine, G. Sigl and P. Biermann, arXiv:astro-ph/9903124.
[113] G. R. Farrar and T. Piran, Phys. Rev. Lett. 84, 3527 (2000) [arXiv:astro-ph/9906431].
[114] P. Blasi and A. V. Olinto, Phys. Rev. D 59 (1999) 023001 [arXiv:astro-ph/9806264].
[115] G. Sigl, M. Lemoine and P. Biermann, Astropart. Phys. 10, 141 (1999)
[arXiv:astro-ph/9806283].
[116] E. Waxman and J. Miralda-Escude, Astrophys. J. 472, L89 (1996)
[arXiv:astro-ph/9607059].
[117] K.-T. Kim, P. P. Kronberg, G. Giovannini and T. Venturi, Nature 341, 720 (1989).
[118] T. E. Clarke, P. P. Kronberg and H. Bohringer, Astrophys. J. 547, L111 (2001).
[119] P. P. Kronberg, Rept. Prog. Phys. 57, 325 (1994).
[120] D. Ryu, H. Kang, and P. L. Biermann, Astron. Astrophys. 335, 19 (1998).
[121] J. P. Vallee, Astrophys. J. 360, 1 (1990).
81

[122] P. Blasi, S. Burles and A. V. Olinto, Astrophys. J. 514, L79 (1999)
[arXiv:astro-ph/9812487].
[123] J. D. Barrow, P. G. Ferreira and J. Silk, Phys. Rev. Lett. 78, 3610 (1997)
[arXiv:astro-ph/9701063].
[124] K. Jedamzik, V. Katalinic and A. V. Olinto, Phys. Rev. Lett. 85, 700 (2000)
[arXiv:astro-ph/9911100].
[125] L. A. Anchordoqui and H. Goldberg, Phys. Rev. D 65, 021302 (2002)
[arXiv:hep-ph/0106217].
[126] R. N. Manchester, Astrophys. J. 188, 637 (1974).
[127] R. C. Thomson and A. H. Nelson, Mont. Not. Roy. Astron. Soc. 191, 863 (1980).
[128] J. L. Han and G. J. Qiao, Astron. Astrophys. 288, 759 (1994).
[129] C. Indrani and A. A. Deshpande, New Astron. 4, 33 (1998).
[130] R. Beck, A. Brandenburg, D. Moss, A. Shukurov, and D. Sokoloff, Ann. Rev. Astron.
Astrophys. 34, 155 (1996).
[131] J. L. Han, R. N. Manchester and G. J. Qiao, Mont. Not. Roy. Astron. Soc. 306, 371
(1999) [arXiv:astro-ph/9903101].
[132] J. P. Vallee, Astrophys. J. 366, 450 (1991).
[133] T. Stanev, Astrophys. J. 479, 290 (1997) [arXiv:astro-ph/9607086].
[134] D. Harari, S. Mollerach and E. Roulet, JHEP 9908, 022 (1999)
[arXiv:astro-ph/9906309].
[135] D. J. Bird et al., Astrophys. J. 441, 144 (1995).
[136] J. W. Elbert and P. Sommers, Astrophys. J. 441, 151 (1995) [arXiv:astro-ph/9410069].
[137] M. Takeda et al., Phys. Rev. Lett. 81, 1163 (1998) [arXiv:astro-ph/9807193].
[138] T. Abu-Zayyad et al. [HiRes Collaboration], arXiv:astro-ph/0208243.
[139] T. Abu-Zayyad et al. [High Resolution Fly’s Eye Collaboration],
arXiv:astro-ph/0208301.
[140] M. Takeda et al., Astropart. Phys. 19, 447 (2003) [arXiv:astro-ph/0209422].
[141] D. J. Bird et al. [HIRES Collaboration], Astrophys. J. 424 (1994) 491.
[142] M. Ave, J. Knapp, J. Lloyd-Evans, M. Marchesini and A. A. Watson, Astropart. Phys.
19, 47 (2003) [arXiv:astro-ph/0112253].
[143] J. N. Bahcall and E. Waxman, Phys. Lett. B 556, 1 (2003) [arXiv:hep-ph/0206217].
[144] A. A. Watson, Proc. 28th International Cosmic Ray Conference (Tsukuba), 373 (2003).
[145] A. R. Bell, Mon. Not. Roy. Astron. Soc. 182, 147, (1978).
[146] D. F. Torres, G. E. Romero, T. M. Dame, J. A. Combi, and Y. M. Butt, Phys. Rept.
382, 303 (2003) [arXiv:astro-ph/0209565].
[147] S. P. Reynolds, Astrophys. J. 459, L13 (1996).
[148] S. P. Reynolds, Astrophys. J. 493, 375 (1998).
[149] A. M. Bykov and G. D. Fleishman, Mon. Not. Roy. Astron. Soc. 255, 269 (1992a).
[150] A. M. Bykov and G. D. Fleishman, Sov. Astron. Lett. 18, 95 (1992b).
[151] D. F. Torres, E. Domingo-Santamaria and G. E. Romero, Astrophys. J. 601, L75 (2004)
[arXiv:astro-ph/0312128].
[152] F. A. Aharonian, A. Akhperjanian, M. Beilicke, Y. Uchiyama and T. Takahashi, Astron.
82

Astrophys. 393, L37 (2002) [arXiv:astro-ph/0207528].
[153] Y. Butt et. al., Astrophys. J. 597, 494 (2003) [arXiv:astro-ph/0302342].
[154] R. L. White and W. Chen, Astrophys. J. 387 L81 (1992).
[155] W. Chen, R. L. White, and D. Bertsch, Astron. Astrophys. Suppl. 120, 423 (1996).
[156] P. Benaglia, G. E. Romero, I. R. Stevens and D. F. Torres, Astron. Astrophys. 366,
605 (2001) [arXiv:astro-ph/0010605].
[157] G. E. Romero, P. Benaglia and D. F. Torres, Astron. Astrophys. 348, 868 (1999)
[arXiv:astro-ph/9904355].
[158] D. F. Torres, G. E. Romero, J. A. Combi, P. Benaglia, H. Andernach and B. Punsly,
Astron. Astrophys. 370, 468 (2001) [arXiv:astro-ph/0007464].
[159] D. F. Torres, M. E. Pessah and G. E. Romero, Astron. Nachr. 322, 223 (2001)
[arXiv:astro-ph/0104351].
[160] P. L. Nolan, W. F. Tompkins, I. A. Grenier and P. F. Michelson, Astrophys. J. 597,
615 (2003) [arXiv:astro-ph/0307188].
[161] Y. M. Butt, D. F. Torres, J. A. Combi, T. Dame and G. E. Romero, Astrophys. J. 562,
L167 (2001) [arXiv:astro-ph/0109292].
[162] R. Enomoto et. al., Nature 416, 823 (2002).
[163] O. Reimer, M. Pohl, Y. M. Butt, D. F. Torres and G. E. Romero, Astron. Astrophys.
390, L43 (2002) [arXiv:astro-ph/0205256].
[164] Y. M. Butt, D. F. Torres, G. E. Romero, T. M. Dame and J. A. Combi, Nature 418,
499 (2002) [arXiv:astro-ph/0208034].
[165] Y. Uchiyama, F. A. Aharonian and T. Takahashi, Astron. Astrophys. 400, 567 (2003)
[arXiv:astro-ph/0209217].
[166] E. G. Berezhko, L. T. Ksenofontov and H. J. Voelk, Astron. Astrophys. 412, L11 (2003)
[arXiv:astro-ph/0310862].
[167] E. G. Berezhko, G. Puehlhofer and H. J. Voelk, Astron. Astrophys. 400, 971 (2003)
[arXiv:astro-ph/0301205].
[168] J. Alvarez-Muniz and F. Halzen, Astrophys. J. 576, L33 (2002)
[arXiv:astro-ph/0205408].
[169] L. A. Anchordoqui, D. F. Torres, T. P. McCauley, G. E. Romero and F. A. Aharonian,
Astrophys. J. 589, 481 (2003) [arXiv:hep-ph/0211231].
[170] G. E. Romero, D. F. Torres, M. M. K. Bernado and I. F. Mirabel, Astron. Astrophys.
410, L1 (2003) [arXiv:astro-ph/0309123].
[171] W. Bednarek, Astron. Astrophys. 407, 1 (2003) [arXiv:astro-ph/0305430].
[172] A. M. Hillas, Ann. Rev. Astron. Astrophys. 22, 425 (1984).
[173] A. Venkatesan, M. C. Miller and A. V. Olinto, Astrophys. J. 484, 323 (1997)
[arXiv:astro-ph/9612210].
[174] A. Mucke, R. J. Protheroe, R. Engel, J. P. Rachen, T. Stanev, Astropart. Phys. 18,
593 (2003).
[175] G. Pelletier and E. Kersale, Astron. Astrophys. 361, 788 (2000)
[arXiv:astro-ph/0007096].
[176] R. J. Protheroe, arXiv:astro-ph/0401523.
83

[177] F. A. Aharonian, A. A. Belyanin, E. V. Derishev, V. V. Kocharovsky and
V. V. Kocharovsky, Phys. Rev. D 66, 023005 (2002) [arXiv:astro-ph/0202229].
[178] M. V. Medvedev, Phys. Rev. E 67, 045401 (2003) [arXiv:astro-ph/0303271].
[179] A. V. Olinto, R. I. Epstein, and P. Blasi, Proc. 26th International Cosmic Ray Confer-
ence (Salt Lake City) 4, 361 (1999).
[180] J. Gunn and J. Ostriker, Phys. Rev. Lett. 22, 728 (1969).
[181] A. R. Bell, Mon. Not. Roy. Astron. Soc. 257, 493 (1992).
[182] P. Blasi, R. I. Epstein and A. V. Olinto, Astrophys. J. 533, L123 (2000)
[arXiv:astro-ph/9912240].
[183] M. Giller in the Eighteenth Texas Symposium on Relativistic Astrophysics and Cos-
mology, Texas in Chicago, Chicago, 15-20 December 1996” ., p.444 (edited by Angela
V. Olinto, Joshua A. Frieman, and David N. Schramm. River Edge, N. J. : World
Scientific, 1998).
[184] W. Bednarek, M. Giller and M. Zielinska, J. Phys. G 28, 2283 (2002)
[arXiv:astro-ph/0205324].
[185] E. M. De Gouveia Dal Pino and A. Lazarian, Astrophys. J. 560, 358 (2001)
[arXiv:astro-ph/0106452].
[186] C. Litwin and R. Rosner, Phys. Rev. Lett. 86, 4745 (2001) [arXiv:astro-ph/0104090].
[187] F. C. Michel, Theory of Neutron Stars Magnetosphere (The University of Chicago
Press:Chicago, 1991).
[188] P. Goldreich and W. H. Julian, Astrophys. J. 157, 869 (1969).
[189] Y. A. Gallant and J. Arons, Astrophys. J. 435, 230 (1994).
[190] M. C. Begelman and Z-Y. Li, Astrophys. J. 426, 269 (1994).
[191] T. Chiueh, Z-Y. Li, and M. C. Begelman, Astrophys. J. 505, 835 (1998).
[192] A. Melatos and D. B. Melrose, Mon. Not. Roy. Astron. Soc. 279, 1168 (1996).
[193] V. S. Berezinskii, S. V. Bulanov, V. A. Dogiel, V. L. Ginzburg, and V. S. Ptuskin,
Astrophysics of Cosmic Rays, (North Holland, Amsterdam, 1990).
[194] M. Kramer et al., Mon. Not. Roy. Astron. Soc. 342, 1299 (2003)
[arXiv:astro-ph/0303473].
[195] D. F. Torres, Y. M. Butt and F. Camilo, Astrophys. J. 560, L155 (2001)
[arXiv:astro-ph/0109228].
[196] D. F. Torres and S. E. Nuza, Astrophys. J. 583, L25 (2003) [arXiv:astro-ph/0212168].
[197] M. Duncan and C. Thompson, Astrophys. J. 392, L9 (1992).
[198] B. Paczynski, Acta Astron. 42, 145 (1992).
[199] C. Kouveliotou et. al., Nature 393, 235 (1998).
[200] C. Kouveliotou, Proc. Natl. Acad. Sci. 96, 5351 (1999).
[201] C. Kouveliotou et. al., Astrophys. J. 510, L115 (1999).
[202] J. Arons, Astrophys. J. 589, 871 (2003) [arXiv:astro-ph/0208444].
[203] S. Singh, C. P. Ma and J. Arons, arXiv:astro-ph/0308257.
[204] M. R. Blanton, et al., Astron. J. 121, 2358 (2001).
[205] E. Cappellaro, R. Evans, and M. Turatto, Astron. Astrophys. 351, 459 (1999).
[206] J. Knodlseder, astro-ph/0007442.
84

[207] W. Bednarek, Mon. Not. Roy. Astron. Soc. 345, 847 (2003) [arXiv:astro-ph/0307216].
[208] W. Bednarek, Mon. Not. Roy. Astron. Soc. 331, 483 (2002) [arXiv:astro-ph/0112008].
[209] M. R. Crutcher and S. -P. Lai, ASP Conf. Proc. 267, 61 (2002). Edited by Paul A.
Crowther, San Francisco, Astronomical Society of the Pacific.
[210] W. Bednarek and R. J. Protheroe, Astropart. Phys. 16, 397 (2002).
[211] C. D. Wilson, C. E. Walker and M. D. Thornley, arXiv:astro-ph/9701245.
[212] G. L. Cassiday et al., Phys. Rev. Lett. 62, 383 (1989).
[213] M. Teshima et al., Phys. Rev. Lett. 64, 1628 (1990).
[214] C. M. Urry and P. Padovani, ASP Conf. Proc. 107, 803 (1995).
[215] P. Padovani, (1997), astro-ph/9701074.
[216] W. Collmar, Mem. Soc. Astron. Ital. 73, 99 (2002).
[217] D. F. Torres, (2004). To appear in the book ”Cosmic Gamma-ray Sources”, edited
by K.S. Cheng and G.E. Romero, to be published by Kluwer Academic Press,
arXiv:astro-ph/0308069.
[218] A. Kembhavi and J. V. Narlikar, Quasars and Active Galactic Nuclei, Cambridge Uni-
versity Press, Cambridge, 1999
[219] B. L. Fannaroff and J. M. Riley, Mon. Not. Roy. Astron. Soc. 167, 31 (1974).
[220] R. D. Blandford and M. J. Rees, Mon. Not. Roy. Astron. Soc. 169, 395 (1974).
[221] M. C. Begelman, R. D. Blandford and M. J. Rees, Rev. Mod. Phys. 56, 255 (1984).
[222] P. L. Biermann and P. A. Strittmatter, Astrophys. J. 322, 643 (1987).
[223] A. N. Kolmogorov, C. R. Acad. URSS 30, 201 (1941).
[224] L. O. ’C. Drury, Rep. Prog. Phys. 46, 973 (1983).
[225] K. Mannheim, Space Sci. Rev. 75, 331 (1996).
[226] K. Mannheim, Science 279, 684 (1998) [arXiv:astro-ph/9803241].
[227] K. Mannheim, Rev. Mod. Astron. 12, 101 (1999) [arXiv:astro-ph/9902185].
[228] K. Mannheim, Astron. Astrophys. 269, 67 (1993) [arXiv:astro-ph/9302006].
[229] F. A. Aharonian, New Astron. 5, 377 (2000) [arXiv:astro-ph/0003159].
[230] G. B. Rybicki and A. P. Lightman, Radiative Processes in Astrophysics (New York:
Wiley-Interscience, 1979).
[231] T. A. Armstrong et. al., Phys. Rev. D 5 (1972) 1640.
[232] J. P. Rachen and P. L. Biermann, Astron. Astrophys. 272, 161 (1993)
[arXiv:astro-ph/9301010].
[233] J. T. Stocke, G. H. Rieke, and M. J. Lebofsky, Nature 294, 319 (1981).
[234] J. R. P. Angel and H. S. Stockman, Ann. Rev. Astron. Astrophys. 18, 321 (1980).
[235] F. P. Israel, Astron. Astrophys. Rev. 8, 237 (1998).
[236] J. O. Burns, E. D. Feigelson, and E. J. Schreier, Astrophys. J. 273, 128 (1983).
[237] L. Landau and E. Lifchitz, Fluid Mechanics (Pergamon Press, Oxford, 1958).
[238] G. E. Romero, S. Perez-Bergliaffa, L. A. Anchordoqui and J. A. Combi, Grav. Cosmol.
S5 (1999) 188.
[239] G. E. Romero, J. A. Combi, L. A. Anchordoqui and S. E. Perez Bergliaffa, Astropart.
Phys. 5, 279 (1996) [arXiv:gr-qc/9511031].
[240] N. Junkes, R. F. Haynes, J. I. Harnett, and D. L. Jauncey, Astron. Astrophys. 269, 29
85

(1993) [Erratum, ibid 274, 1009 (1993)].
[241] J. A. Combi and G. E. Romero, Astron. Astrophys. Suppl. 121, 11 (1997).
[242] R. Schopper, G. T. Birk and H. Lesch, Astropart. Phys. 17, 347 (2002)
[arXiv:astro-ph/0106530].
[243] P. Sreekumar, D. L. Bertsch, R. C. Hartman, P. L. Nolan and D. J. Thompson, As-
tropart. Phys. 11, 221 (1999) [arXiv:astro-ph/9901277].
[244] J. E. Grindlay et. al., Astrophys. J. 197, L9 (1975).
[245] H. Steinle, AIP Conf. Proc. 587, 353 (2001) [arXiv:astro-ph/0105482].
[246] R. W. Clay, B. R. Dawson and R. Meyhandan, Astropart. Phys. 2, 347 (1994).
[247] V. L. Ginzburg, S. I. Syrovatsky, Ann. Rev. Astron. Astrophys. 3, 297 (1965).
[248] E. Waxman, Phys. Rev. Lett. 75, 386 (1995) [arXiv:astro-ph/9505082].
[249] S. Rawlings and R. Saunders, Nature 349, 138 (1991).
[250] G. R. Farrar and T. Piran, arXiv:astro-ph/0010370.
[251] L. A. Anchordoqui, H. Goldberg and T. J. Weiler, Phys. Rev. Lett. 87, 081101 (2001)
[arXiv:astro-ph/0103043].
[252] R. L. Kinzer et. al., Astrophys. J. 449, 105 (1995).
[253] H. Steinle et. al., Astron. Astrophys. 330, 97 (1998).
[254] C. Isola, M. Lemoine and G. Sigl, Phys. Rev. D 65, 023004 (2002)
[arXiv:astro-ph/0104289].
[255] C. Isola and G. Sigl, Phys. Rev. D 66, 083002 (2002) [arXiv:astro-ph/0203273].
[256] F. Aharonian, et al. [HEGRA Collaboration], Astron. Astrophys. 403, L1 (2003)
[arXiv:astro-ph/0302155].
[257] P. Sreekumar et al., Astrophys. J. 426, 105 (1994)
[258] R. J. Protheroe, A. C. Donea and A. Reimer, Astropart. Phys. 19, 559 (2003)
[arXiv:astro-ph/0210249].
[259] C. Dermer and Y. Rephaeli, Astrophys. J. 329, 687 (1988).
[260] V. L. Ginzburg, S. I. Syrovatsky, The origin of cosmic rays, (Pergamon Press, Oxford
1964).
[261] J. Wdowczyk and A. W. Wolfendale, Nature 281, 356 (1979).
[262] J. C. Cohen , Astron. J. 119, 162 (2000).
[263] R. Blandford, Lect. Notes Phys. 530, 1 (1999).
[264] S. Heinz and M. C. Begelman, Lect. Notes Phys. 530, 229 (1999).
[265] G. V. Bicknell and M. C. Begelman, Lect. Notes Phys. 530, 235 (1999).
[266] E. J. Ahn, G. Medina-Tanco, P. L. Biermann and T. Stanev, arXiv:astro-ph/9911123.
[267] P. L. Biermann, E. J. Ahn, G. Medina Tanco and T. Stanev, Nucl. Phys. Proc. Suppl.
87 (2000) 417 [arXiv:astro-ph/0008063].
[268] J. A. Burke, Mon. Not. Roy. Astron. Soc. 140, 241 (1968).
[269] H. E. Johnson and W. I. Axford, Astrophys. J. 165, 381 (1971).
[270] W. G. Mathews and J. C. Baker, Astrophys. J. 170, 241 (1971).
[271] E. N. Parker, Astrophys. J. 128, 664 (1958).
[272] T. Stanev, D. Seckel and R. Engel, arXiv:astro-ph/0108338.
[273] L. A. Anchordoqui, M. T. Dova, T. P. McCauley, S. Reucroft and J. D. Swain, Phys.
86

Lett. B 482, 343 (2000) [arXiv:astro-ph/9912081].
[274] D. Harari, S. Mollerach and E. Roulet, JHEP 0010, 047 (2000)
[arXiv:astro-ph/0005483].
[275] P. Billoir and A. Letessier-Selvon, arXiv:astro-ph/0001427.
[276] P. L. Biermann, E. -J. Ahn, P. P. Kronberg, G. Medina Tanco, and T. Stanev, in
Physics and Astrophysics of Ultra-High-Energy Cosmic Rays, (Edts. M. Lemoine and
G. Sigl, Springer-Verlag, Berlin, 2001).
[277] L. A. Anchordoqui, G. E. Romero, J. A. Combi and S. E. Perez Bergliaffa, Mod. Phys.
Lett. A 13, 3039 (1998) [arXiv:astro-ph/9811378].
[278] J. P. Rachen, T. Stanev and P. L. Biermann, Astron. Astrophys. 273, 377 (1993)
[arXiv:astro-ph/9302005].
[279] R. Mukherjee, J. Halpern, N. Mirabal and E. V. Gotthelf, Astrophys. J. 574, 693 (2002)
[arXiv:astro-ph/0204489].
[280] H. Sudou and Y. Taniguchi, arXiv:astro-ph/0004194.
[281] J. A. Combi, G. E. Romero, J. M. Paredes, D. F. Torres and M. Ribo, Astrophys. J.
588, 731 (2003) [arXiv:astro-ph/0301487].
[282] C. M. Hoffman, Phys. Rev. Lett. 83, 2471 (1999) [arXiv:astro-ph/9901026].
[283] G. Sigl, D. F. Torres, L. A. Anchordoqui and G. E. Romero, Phys. Rev. D 63, 081302
(2001) [arXiv:astro-ph/0008363].
[284] A. Virmani, S. Bhattacharya, P. Jain, S. Razzaque, J. P. Ralston and D. W. McKay,
Astropart. Phys. 17, 489 (2002) [arXiv:astro-ph/0010235].
[285] P. G. Tinyakov and I. Tkachev I., JETP Lett. 74, 445 (2001) [Pisma Zh. Eksp. Teor.
Fiz. 74, 499 (2001)] [arXiv:astro-ph/0102476].
[286] P. G. Tinyakov and I. Tkachev I., Astropart. Phys. 18, 165 (2002)
[arXiv:astro-ph/0111305].
[287] P. G. Tinyakov and I. Tkachev I., arXiv:astro-ph/0301336.
[288] M. P. Veron-Cetty and P. Veron, A catalogue of Quasars and Active Galactic Nuclei,
9th Edition, ESO Scientific Report (2000).
[289] B. N. Afanasiev, et al., 1996 in Proc. Int. Symp. on Extremely High Energy Cosmic
Rays : Astrophysics and Future Observatories (ed. M.Nagano, Institute for Cosmic Ray
Research, Univ. of Tokyo) p.32.
[290] N. W. Evans, F. Ferrer and S. Sarkar, Phys. Rev. D 67, 103005 (2003)
[arXiv:astro-ph/0212533].
[291] D. F. Torres, S. Reucroft, O. Reimer and L. A. Anchordoqui, Astrophys. J. 595, L13
(2003) [arXiv:astro-ph/0307079].
[292] T. Stanev, P. Biermann, J. Lloyd-Evans, J. P. Rachen and A. A. Watson, Phys. Rev.
Lett. 75, 3056 (1995) [arXiv:astro-ph/9505093].
[293] J. Linsley, Catalog of Highest Energy Cosmic Ray, (World Data Center of Cosmic Rays,
Institute of Physical and Chemical Research, Itabashi, Tokyo) p.3, (1980).
[294] G. J. Feldman and R. D. Cousins, Phys. Rev. D 57, 3873 (1998)
[arXiv:physics/9711021].
[295] D. S. Gorbunov, P. G. Tinyakov, I. Tkachev and S. V. Troitsky, Astrophys. J. 577,
87

L93 (2002) [arXiv:astro-ph/0204360].
[296] B. Punsly, Astron. J. 114, 544 (1997).
[297] E. Boldt and P. Ghosh, Mon. Not. Roy. Astron. Soc. 307, 491 (1999)
[arXiv:astro-ph/9902342].
[298] E. Boldt and M. Loewenstein, Mon. Not. Roy. Astron. Soc. 316, L29 (2000)
[arXiv:astro-ph/0006221].
[299] M. Schmidt, Physica Scripta 17, 135 (1978).
[300] D. Richstone et al., Nature Supp., 395, A14 (1998).
[301] T. A. Small and R. D. Blandford, Mon. Not. Roy. Astron. Soc. 259, 725 (1992).
[302] A. Chokshi and E. L. Turner, Mon. Not. Roy. Astron. Soc. 259, 421, 1992.
[303] R. D. Blandford and R. L. Znajek, Mon. Not. Roy. Astron. Soc. 179, 433 (1977).
[304] R. L. Znajek, Mon. Not. Roy. Astron. Soc. 185 833 (1978).
[305] J. Krolik Astrophys. J. 515, L73 (1999).
[306] T. Di Matteo et al. Mon. Not. Roy. Astron. Soc. 305 492 (1999).
[307] A. Levinson and E. Boldt, Astropart. Phys. 16, 265 (2002).
[308] F. Stecker, Phys. Rev. Lett. 21 1016 (1968).
[309] D. F. Torres, E. Boldt, T. Hamilton and M. Loewenstein, Phys. Rev. D 66, 023001
(2002) [arXiv:astro-ph/0204419].
[310] G. Giuricin, C. Marinori, L. Ceriani, and A. Pisani, Astrophys. J. 543, 178 (2000).
[311] K. Dolag, D. Grasso, V. Springel and I. Tkachev, arXiv:astro-ph/0310902.
[312] J. Alvarez-Muniz, R. Engel and T. Stanev, Astrophys. J. 572, 185 (2001)
[arXiv:astro-ph/0112227].
[313] C. Isola, G. Sigl and G. Bertone, arXiv:astro-ph/0312374.
[314] A. Levinson, Phys. Rev. Lett. 85, 912 (2000).
[315] A. Neronov, P. Tinyakov and I. Tkachev, arXiv:astro-ph/0402132.
[316] J. F. Hawley and J. H. Krolik, arXiv:astro-ph/0006456.
[317] L. A. Anchordoqui, G. E. Romero and J. A. Combi, Phys. Rev. D 60, 103001 (1999)
[arXiv:astro-ph/9903145].
[318] T. M. Heckman, L. Armus, and G. K. Miley, Astrophys. J. Suppl. 74, 833 (1990).
[319] R. W. O’connell and J. J. Mangano, Astrophys. J. 221, 62 (1978).
[320] G. H. Rieke, et al., Astrophys. J. 238, 24 (1980).
[321] S. Satyapal, et al. Astrophys. J. 483, 148 (1997).
[322] R. Beck, C. L. Carilli, M. A. Holdaway, and U. Klein, Astron. Astrophys. 292, 409
(1994).
[323] T. A. D. Paglione, A. P. Marscher, J. M. Jackson, and D. L. Bertsch, Astrophys. J.
460, 295 (1996).
[324] A. Ptak, et al., Astron. J. 113, 1286 (1997).
[325] C. Itoh et al. [CANGAROO-II Collaboration], Astron. Astrophys. 402, 443 (2003)
[arXiv:astro-ph/0304295].
[326] J. S. Ulvestad and R. R. J. Antonucci, Astrophys. J. 488, 621 (1997).
[327] D. A. Forbes, et al. Astrophys. J. 406, L11 (1993).
[328] A. M. Watson, et al. Astron. J. 112, 534 (1996).
88

[329] E. Keto, et al., Astrophys. J. 518, 133 (1999).
[330] G. E. Romero and D. F. Torres, Astrophys. J. 586, L33 (2003)
[arXiv:astro-ph/0302149].
[331] P. J. McCarthy, T. Heckman, and W. van Breugel, Astron. J. 92, 264 (1987).
[332] R. de Grijs, R. W. O’Connell and J. S. . Gallagher, Astrophys. Space Sci. 276, 397
(2001) [arXiv:astro-ph/9903188].
[333] P. O. Lagage and C. J. Cesarsky, Astron. Astrophys. 118, 223 (1983).
[334] A. J. Owens, and R. J. Jokipii, Astrophys. J. 215, 677 (1977).
[335] J. R. Jokipii and G. R. Morfill, Astrophys. J. 290, L1 (1985).
[336] J. R. Jokipii, Astrophys. J. 313, 842 (1987).
[337] L. O’C. Drury, Rep. Prog. Phys. 46, 973 (1983).
[338] P. L. Biermann, Astron. Astrophy. 271, 649 (1993).
[339] C. W. Engelbracht, M. J. Rieke, G. H. Rieke, D. M. Kelly, and J. M. Achtermann,
Astrophys. J. 505, 639 (1998).
[340] L. Anchordoqui, H. Goldberg, S. Reucroft and J. Swain, Phys. Rev. D 64, 123004
(2001) [arXiv:hep-ph/0107287].
[341] G. Bertone, C. Isola, M. Lemoine and G. Sigl, arXiv:astro-ph/0209192.
[342] L. A. Anchordoqui, H. Goldberg and D. F. Torres, Phys. Rev. D 67, 123006 (2003)
[arXiv:astro-ph/0209546].
[343] R. W. Clay [Pierre Auger Collaboration], arXiv:astro-ph/0308494.
[344] D. B. Sanders and I. F. Mirabel, Ann. Rev. Astron. Astrophys. 34, 749 (1996).
[345] D. Downes and P. M. Solomon, Astrophys. J. 507, 615 (1998).
[346] D. Downes, P. M. Solomon, and S. J. E. Radford, Astrophys. J. 414, L13 (1993).
[347] D. Downes, P. M. Solomon, and S. J. E. Radford, Astrophys. J. 387, L55 (1992).
[348] P. M. Solomon, S. J. E. Radford, and D. Downes, Astrophys. J. 348, L53 (1990).
[349] P. M. Solomon, D. Downes, S. J. E. Radford, and J. W. Barrett, Astrophys. J. 478,
144 (1997).
[350] L. Gao and P. M. Solomon, astro-ph/0310339.
[351] L. Gao and P. M. Solomon, astro-ph/0310341.
[352] D. F. Torres, O. Reimer, E. Domingo-Santamaria and S. W. Digel, Astrophys. J. 607,
L99 (2004) [arXiv:astro-ph/0405302].
[353] W. Saunders, et al., Mon. Not. Roy. Astron. Soc. 317, 55 (2000).
[354] A. Smialkowski, M. Giller and W. Michalak, J. Phys. G 28 (2002) 1359
[arXiv:astro-ph/0203337].
[355] R. Della Cecca, et al., Astrophys. J. 581, L9 (2002).
[356] F. Mannucci et. al., Astron. and Astrophys. 401, 519 (2003).
[357] B. T. Soifer, et. al., Astrophys. J. 303, L41 (1986).
[358] R. Coziol, et al. Astrophys. J. Suppl. 119, 239 (1998).
[359] A. Cillis, D. F. Torres, and O. Reimer, in preparation.
[360] G. J. Fishman and C. A. Meegan, An. Rev. Astron. Astrophys. 33, 415 (1995).
[361] B. Link and R. I. Epstein, Astrophys. J. 466, 764 (1996) [arXiv:astro-ph/9601033].
[362] G. E. Romero, D. F. Torres, I. Andruchow, L. A. Anchordoqui and B. Link, Mon. Not.
89

Roy. Astron. Soc. 308, 799 (1999) [arXiv:astro-ph/9904107].
[363] D. Band et. al., Astrophys. J. 413 281 (1993).
[364] M. Sommer et al., Astrophys. J. 422 L63 (1994).
[365] C. A. Meegan et. al., Nature 355, 143 (1992).
[366] M. R. Metzger et. al., Nature 387, 878 (1997).
[367] S. R. Kulkarni et. al., arXiv:astro-ph/0002168.
[368] G. Cavallo and M. J. Rees, Mon. Not. Roy. Astron. Soc. 183, 359 (1978).
[369] B. Paczynski, Astrophys. J. 308, L43 (1986).
[370] J. Goodman, Astrophys. J. 308, L47 (1986).
[371] P. Meszaros and M. J. Rees, Astrophys. J. 405, 278 (1993).
[372] P. Meszaros, P. Laguna, and M. J. Rees, Astrophys. J. 415, 181 (1993).
[373] T. Piran, Phys. Rept. 314 (1999) 575 [arXiv:astro-ph/9810256].
[374] T. Piran, Phys. Rept. 333 (2000) 529 [arXiv:astro-ph/9907392].
[375] E. Waxman, arXiv:astro-ph/0303517.
[376] E. Waxman, arXiv:astro-ph/0103186.
[377] W. Coburn and S. E. Boggs, Nature 423, 415 (2003).
[378] E. Nakar, T. Piran and E. Waxman, JCAP 0310, 005 (2003) [arXiv:astro-ph/0307290].
[379] J. Bednarz and M. Ostrowski, Phys. Rev. Lett. 80 (1998) 3911
[arXiv:astro-ph/9806181].
[380] G. Preparata, R. Ruffini and S. S. Xue, Astron. Astrophys. 338, L87 (1998)
[arXiv:astro-ph/9810182].
[381] T. Damour and R. Ruffini, Phys. Rev. Lett. 35, 463 (1975).
[382] R. Ruffini, C. L. Bianco, P. Chardonnet, F. Fraschetti and S. S. Xue, Astrophys. J.
581, L19 (2002) [arXiv:astro-ph/0210648].
[383] C. L. Bianco, R. Ruffini and S. S. Xue, Astron. Astrophys. 368, 377 (2001)
[arXiv:astro-ph/0102060].
[384] R. Ruffini, J. D. Salmonson, J. R. Wilson and S. S. Xue, Astron. Astrophys. 350, 334
(1999) [arXiv:astro-ph/9907030].
[385] A. Mattei, R. Ruffini, P. Chardonnet, C. L. Bianco, F. Fraschetti, L. Vitagliano, and
S. -S. Xue, Proceedings of the Tenth Marcel Grossmann Meeting on General Relativity,
(Edited by M. Novello, S. Perez-Bergliaffa and R. Ruffini, World Scientific, Singapore,
2005).
[386] L. A. Anchordoqui, C. D. Dermer and A. Ringwald, Proceedings of the Tenth Marcel
Grossmann Meeting on General Relativity, (Edited by M. Novello, S. Perez-Bergliaffa
and R. Ruffini, World Scientific, Singapore, 2005) [arXiv:hep-ph/0403001].
[387] M. Vietri, Astrophys. J. 453, 883 (1995).
[388] M. Schmidt, Astrophys. J. 552, 36 (2001).
[389] D. L. Freedman and E. Waxman, Astrophys. J. 547, 922 (2001).
[390] F. W. Stecker, Astropart. Phys. 14, 207 (2000) [arXiv:astro-ph/9911269].
[391] S. T. Scully and F. W. Stecker, Astropart. Phys. 16, 271 (2002)
[arXiv:astro-ph/0006112].
[392] A. Loeb and E. Waxman, arXiv:astro-ph/0205272.
90

[393] M. Vietri, D. De Marco and D. Guetta, Astrophys. J. 592, 378 (2003)
[arXiv:astro-ph/0302144].
[394] E. Waxman, arXiv:astro-ph/0210638.
[395] M. Milgrom and V. Usov, Astrophys. J. 449, L37 (1995) [arXiv:astro-ph/9505009].
[396] T. Stanev, R. Schaefer and A. Watson, Astropart. Phys. 5, 75 (1996)
[arXiv:astro-ph/9601140].
[397] S. D. Wick, C. D. Dermer and A. Atoyan, Astropart. Phys. (to be published)
[arXiv:astro-ph/0310667].
[398] T. Piran, arXiv:astro-ph/0104134.
[399] D. A. Frail et al., Astrophys. J. 562, L55 (2001) [arXiv:astro-ph/0102282].
[400] C. D. Dermer and A. Atoyan, Phys. Rev. Lett. 91, 071102 (2003)
[arXiv:astro-ph/0301030].
[401] P. L. Biermann, G. A. Medina-Tanco, R. Engel and G. Pugliese,
arXiv:astro-ph/0401150.
[402] J. P. Rachen and P. Meszaros, Phys. Rev. D 58, 123005 (1998)
[arXiv:astro-ph/9802280].
[403] G. Pugliese, H. Falcke, Y. Wang and P. L. Biermann, arXiv:astro-ph/0003025.
[404] V. A. Kuzmin and I. I. Tkachev, Phys. Rept. 320, 199 (1999) [arXiv:hep-ph/9903542].
[405] P. Bhattacharjee and G. Sigl, Prepared for Physics and Astrophysics of Ultrahigh-energy
Cosmic Rays, Meudon, France, 26-29 Jun 2000
[406] S. Sarkar, arXiv:hep-ph/0312223.
[407] T. Weiler, Phys. Rev. Lett. 49, 234 (1982).
[408] T. J. Weiler, Astropart. Phys. 11, 303 (1999) [arXiv:hep-ph/9710431].
[409] D. Fargion, B. Mele and A. Salis, Astrophys. J. 517, 725 (1999)
[arXiv:astro-ph/9710029];
[410] H. Davoudiasl, J. L. Hewett and T. G. Rizzo, Phys. Lett. B 549, 267 (2002)
[arXiv:hep-ph/0010066].
[411] O. E. Kalashev, V. A. Kuzmin, D. V. Semikoz and G. Sigl, Phys. Rev. D 65, 103003
(2002) [arXiv:hep-ph/0112351].
[412] Z. Fodor, S. D. Katz and A. Ringwald, Phys. Rev. Lett. 88, 171101 (2002).
[413] Z. Fodor, S. D. Katz and A. Ringwald, arXiv:hep-ph/0203198.
[414] P. W. Gorham, C. L. Hebert, K. M. Liewer, C. J. Naudet, D. Saltzberg and D. Williams,
arXiv:astro-ph/0310232.
[415] A. G. Lemaıtre, Suppl. Nature 128, 704 (1931).
[416] C. T. Hill, Nucl. Phys. B 224, 469 (1983).
[417] C. T. Hill, D. N. Schramm and T. P. Walker, Phys. Rev. D 36, 1007 (1987).
[418] P. Bhattacharjee, C. T. Hill and D. N. Schramm, Phys. Rev. Lett. 69, 567 (1992).
[419] V. Berezinsky, X. Martin and A. Vilenkin, Phys. Rev. D 56, 2024 (1997)
[arXiv:astro-ph/9703077].
[420] L. Masperi and G. A. Silva, Astropart. Phys. 8, 173 (1998) [arXiv:astro-ph/9706299].
[421] L. Masperi and M. Orsaria, Astropart. Phys. 16, 411 (2002) [arXiv:astro-ph/0005593].
[422] V. Berezinsky and A. Vilenkin, Phys. Rev. Lett. 79, 5202 (1997)
91

[arXiv:astro-ph/9704257].
[423] V. Berezinsky, M. Kachelriess and A. Vilenkin, Phys. Rev. Lett. 79, 4302 (1997)
[arXiv:astro-ph/9708217].
[424] V. A. Kuzmin and V. A. Rubakov, Phys. Atom. Nucl. 61, 1028 (1998) [Yad. Fiz. 61,
1122 (1998)] [arXiv:astro-ph/9709187].
[425] P. Jaikumar and A. Mazumdar, Phys. Rev. Lett. 90, 191301 (2003)
[arXiv:hep-ph/0301086].
[426] M. Birkel and S. Sarkar, Astropart. Phys. 9, 297 (1998) [arXiv:hep-ph/9804285].
[427] Z. Fodor and S. D. Katz, Phys. Rev. Lett. 86, 3224 (2001) [arXiv:hep-ph/0008204].
[428] C. Coriano, A. E. Faraggi and M. Plumacher, Nucl. Phys. B 614, 233 (2001)
[arXiv:hep-ph/0107053].
[429] S. Sarkar and R. Toldra, Nucl. Phys. B 621, 495 (2002) [arXiv:hep-ph/0108098].
[430] C. Barbot and M. Drees, Phys. Lett. B 533, 107 (2002) [arXiv:hep-ph/0202072].
[431] K. Hamaguchi, Y. Nomura and T. Yanagida, Phys. Rev. D 58, 103503 (1998)
[arXiv:hep-ph/9805346].
[432] K. Hamaguchi, Y. Nomura and T. Yanagida, Phys. Rev. D 59, 063507 (1999)
[arXiv:hep-ph/9809426].
[433] K. Hamaguchi, K. I. Izawa, Y. Nomura and T. Yanagida, Phys. Rev. D 60, 125009
(1999) [arXiv:hep-ph/9903207].
[434] J. R. Ellis, J. L. Lopez and D. V. Nanopoulos, Phys. Lett. B 247, 257 (1990).
[435] K. Benakli, J. R. Ellis and D. V. Nanopoulos, Phys. Rev. D 59, 047301 (1999)
[arXiv:hep-ph/9803333].
[436] P. Blasi, R. Dick and E. W. Kolb, Astropart. Phys. 18 (2002) 57
[arXiv:astro-ph/0105232].
[437] C. Coriano and A. E. Faraggi, Phys. Rev. D 65, 075001 (2002) [arXiv:hep-ph/0106326].
[438] C. Barbot and M. Drees, Astropart. Phys. 20, 5 (2003) [arXiv:hep-ph/0211406].
[439] C. Barbot, Comput. Phys. Commun. 157, 63 (2004) [arXiv:hep-ph/0306303].
[440] C. Barbot, M. Drees, F. Halzen and D. Hooper, Phys. Lett. B 563, 132 (2003)
[arXiv:hep-ph/0207133].
[441] L. Anchordoqui, H. Goldberg and P. Nath, arXiv:hep-ph/0403115.
[442] F. A. Aharonian, P. Bhattacharjee and D. N. Schramm, Phys. Rev. D 46, 4188 (1992).
[443] J. R. Chisholm and E. W. Kolb, arXiv:hep-ph/0306288.
[444] C. Barbot, M. Drees, F. Halzen and D. Hooper, arXiv:hep-ph/0205230.
[445] G. Sigl, S. Lee, P. Bhattacharjee and S. Yoshida, Phys. Rev. D 59, 043504 (1999)
[arXiv:hep-ph/9809242].
[446] G. Sigl, K. Jedamzik, D. N. Schramm and V. S. Berezinsky, Phys. Rev. D 52, 6682
(1995) [arXiv:astro-ph/9503094].
[447] G. Sigl, S. Lee, D. N. Schramm and P. Coppi, Phys. Lett. B 392, 129 (1997)
[arXiv:astro-ph/9610221].
[448] P. Sreekumar et al., Astrophys. J. 494 (1998) 523 [arXiv:astro-ph/9709257].
[449] G. Sigl, S. Lee and P. Coppi, arXiv:astro-ph/9604093.
[450] R. J. Protheroe and T. Stanev, Phys. Rev. Lett. 77, 3708 (1996) [Erratum-ibid. 78,
92

3420 (1997)] [arXiv:astro-ph/9605036].
[451] R. J. Protheroe and P. A. Johnson, Nucl. Phys. Proc. Suppl. 48, 485 (1996)
[arXiv:astro-ph/9605006].
[452] A. W. Strong, I. V. Moskalenko and O. Reimer, arXiv:astro-ph/0306345.
[453] U. Keshet, E. Waxman and A. Loeb, arXiv:astro-ph/0306442.
[454] D. V. Semikoz and G. Sigl, arXiv:hep-ph/0309328.
[455] S. L. Dubovsky and P. G. Tinyakov, JETP Lett. 68, 107 (1998) [arXiv:hep-ph/9802382].
[456] V. Berezinsky, P. Blasi and A. Vilenkin, Phys. Rev. D 58, 103515 (1998).
[457] N. E. Mavromatos and J. Papavassiliou, arXiv:hep-th/0307028.
[458] M. Kachelriess and D. V. Semikoz, Phys. Lett. B 577, 1 (2003)
[arXiv:astro-ph/0306282].
[459] H. B. Kim and P. Tinyakov, arXiv:astro-ph/0306413.
[460] T. W. Kephart and T. J. Weiler, Astropart. Phys. 4, 271 (1996)
[arXiv:astro-ph/9505134].
[461] S. D. Wick, T. W. Kephart, T. J. Weiler and P. L. Biermann, arXiv:astro-ph/0001233.
[462] L. A. Anchordoqui, T. P. McCauley, S. Reucroft and J. Swain, Phys. Rev. D 63, 027303
(2001) [arXiv:hep-ph/0009319].
[463] N. N. Efimov, N. N. Efremov, A. V. Glushkov, I. T. Makarov, and M. I. Pravdin,
in Astrophysical Aspects of the Most Energetic Cosmic Rays, (Eds. M. Nagano, F.
Takahara, World Scientific 1991), p.434.
[464] E. E. Antonov et al., JETP Lett. 69, 650 (1999) [Pisma Zh. Eksp. Teor. Fiz. 69, 614
(1999)].
[465] G. R. Farrar, Phys. Rev. Lett. 76, 4111 (1996) [arXiv:hep-ph/9603271];
[466] D. J. Chung, G. R. Farrar and E. W. Kolb, Phys. Rev. D 57, 4606 (1998)
[arXiv:astro-ph/9707036];
[467] I. F. Albuquerque, G. R. Farrar and E. W. Kolb, Phys. Rev. D 59, 015021 (1999).
[468] J. Adams et al. [KTeV Collaboration], Phys. Rev. Lett. 79, 4083 (1997)
[arXiv:hep-ex/9709028].
[469] V. Fanti et al. [NA48 Collaboration], Phys. Lett. B 446, 117 (1999).
[470] A. Alavi-Harati et al. [KTeV Collaboration], Phys. Rev. Lett. 83, 2128 (1999)
[arXiv:hep-ex/9903048].
[471] I. F. Albuquerque et al. [E761 Collaboration], Phys. Rev. Lett. 78, 3252 (1997)
[arXiv:hep-ex/9604002].
[472] V. Berezinsky, M. Kachelriess and S. Ostapchenko, Phys. Rev. D 65, 083004 (2002)
[arXiv:astro-ph/0109026].
[473] M. Kachelriess, D. V. Semikoz and M. A. Tortola, Phys. Rev. D 68, 043005 (2003)
[arXiv:hep-ph/0302161].
[474] J. Madsen and J. M. Larsen, Phys. Rev. Lett. 90, 121102 (2003)
[arXiv:astro-ph/0211597].
[475] C. Csaki, N. Kaloper, M. Peloso and J. Terning, JCAP 0305, 005 (2003)
[arXiv:hep-ph/0302030].
[476] D. S. Gorbunov, G. G. Raffelt and D. V. Semikoz, Phys. Rev. D 64, 096005 (2001)
93

[arXiv:hep-ph/0103175].
[477] S. R. Coleman and S. L. Glashow, arXiv:hep-ph/9808446.
[478] F. W. Stecker and S. L. Glashow, Astropart. Phys. 16, 97 (2001)
[arXiv:astro-ph/0102226].
[479] G. Amelino-Camelia, J. R. Ellis, N. E. Mavromatos and D. V. Nanopoulos, Int. J. Mod.
Phys. A 12, 607 (1997) [arXiv:hep-th/9605211].
[480] G. Amelino-Camelia, J. R. Ellis, N. E. Mavromatos, D. V. Nanopoulos and S. Sarkar,
Nature 393, 763 (1998) [arXiv:astro-ph/9712103].
[481] O. Bertolami and C. S. Carvalho, Phys. Rev. D 61, 103002 (2000)
[arXiv:gr-qc/9912117].
[482] R. Aloisio, P. Blasi, P. L. Ghia and A. F. Grillo, Phys. Rev. D 62, 053010 (2000)
[arXiv:astro-ph/0001258].
[483] O. Bertolami, Gen. Rel. Grav. 34, 707 (2002) [arXiv:astro-ph/0012462].
[484] R. Aloisio, P. Blasi, A. Galante, P. L. Ghia and A. F. Grillo, arXiv:astro-ph/0205271.
[485] G. L. Alberghi, K. Goldstein and D. A. Lowe, Phys. Lett. B 578, 247 (2004)
[arXiv:astro-ph/0307413].
[486] J. Gamboa, M. Loewe and F. Mendez, arXiv:hep-th/0311014.
[487] F. Dowker, J. Henson and R. D. Sorkin, arXiv:gr-qc/0311055.
[488] A. Das, J. Gamboa, F. Mendez and J. Lopez-Sarrion, arXiv:hep-th/0402001.
[489] L. A. Anchordoqui, arXiv:hep-ph/0306078.
[490] A. Cafarella, C. Coriano and A. E. Faraggi, arXiv:hep-ph/0308169.
[491] A. Cafarella and C. Coriano, arXiv:hep-ph/0309159.
[492] E. Roulet, Phys. Rev. D 47, 5247 (1993).
[493] T. K. Gaisser, F. Halzen and T. Stanev, Phys. Rept. 258, 173 (1995) [Erratum-ibid.
271, 355 (1996)] [arXiv:hep-ph/9410384].
[494] F. Halzen, Phys. Rept. 333, 349 (2000).
[495] F. Halzen and D. Hooper, Rept. Prog. Phys. 65, 1025 (2002) [arXiv:astro-ph/0204527].
[496] A. D. Dolgov, Phys. Rept. 370, 333 (2002) [arXiv:hep-ph/0202122].
[497] A. Roberts, Rev. Mod. Phys. 64, 259 (1992).
[498] I. A. Belolaptikov et al. [BAIKAL Collaboration], Astropart. Phys. 7, 263 (1997).
[499] E. Andres et al. [The AMANDA Collaboration], Astropart. Phys. 13, 1 (2000)
[arXiv:astro-ph/9906203].
[500] E. Aslanides et al. [ANTARES Collaboration], arXiv:astro-ph/9907432.
[501] P. K. Grieder [NESTOR Collaboration], Nuovo Cim. 24C, 771 (2001).
[502] J. Alvarez-Muniz and F. Halzen, AIP Conf. Proc. 579, 305 (2001)
[arXiv:astro-ph/0102106].
[503] P. Lipari, Astropart. Phys. 1, 195 (1993).
[504] L. V. Volkova, Sov. J. Nucl. Phys. 31, 784 (1980) [Yad. Fiz. 31, 1510 (1980)].
[505] F. Halzen, Int. J. Mod. Phys. A 17, 3432 (2002) [arXiv:astro-ph/0111059].
[506] K. Hirata et al. [KAMIOKANDE-II Collaboration], Phys. Rev. Lett. 58, 1490 (1987).
[507] R. M. Bionta et al., Phys. Rev. Lett. 58, 1494 (1987).
[508] W. Rhode et al. [Frejus Collaboration], Astropart. Phys. 4 (1996) 217.
94

[509] V. Balkanov et al. [BAIKAL Collaboration], Nucl. Phys. Proc. Suppl. 110, 504 (2002)
[arXiv:astro-ph/0112446].
[510] M. Ambrosio et al. [MACRO Collaboration], Astropart. Phys. 19, 1 (2003)
[arXiv:astro-ph/0203181].
[511] J. Ahrens et al., Phys. Rev. Lett. 90, 251101 (2003) [arXiv:astro-ph/0303218].
[512] C. Berger et al. [FREJUS Collaboration], Nucl. Instrum. Meth. A 262, 463 (1987).
[513] M. Aglietta et al., Nucl. Instrum. Meth. A 277, 23 (1989).
[514] M. Ambrosio et al. [MACRO Collaboration], Nucl. Instrum. Meth. A 486, 663 (2002).
[515] M. Aglietta et al. [EAS-TOP Collaboration], Phys. Lett. B 333, 555 (1994).
[516] J. W. Bolesta et al., arXiv:astro-ph/9705198.
[517] I. Kravchenko et al., Astropart. Phys. 20, 195 (2003) [arXiv:astro-ph/0206371].
[518] I. Kravchenko et al., arXiv:astro-ph/0306408.
[519] L. A. Anchordoqui, J. L. Feng, H. Goldberg and A. D. Shapere, Phys. Rev. D 66,
103002 (2002) [arXiv:hep-ph/0207139].
[520] P. W. Gorham, K. M. Liewer, C. J. Naudet, D. P. Saltzberg and D. R. Williams,
arXiv:astro-ph/0102435.
[521] N. G. Lehtinen, P. W. Gorham, A. R. Jacobson and R. A. Roussel-Dupre, Phys. Rev.
D 69, 013008 (2004) [arXiv:astro-ph/0309656].
[522] J. Ahrens [IceCube Collaboration], arXiv:astro-ph/0305196.
[523] X. Bertou, P. Billoir, O. Deligny, C. Lachaud and A. Letessier-Selvon, Astropart. Phys.
17, 183 (2002) [arXiv:astro-ph/0104452].
[524] B. Eberle, A. Ringwald, L. Song and T. J. Weiler, arXiv:hep-ph/0401203.
[525] R. M. Baltrusaitis et al., Phys. Rev. D 31, 2192 (1985).
[526] S. Yoshida et al.[AGASA Collaboration], in Proc. 27th International Cosmic Ray Con-
ference, Hamburg, Germany, 2001, Vol. 3, p. 1142.
[527] R. Gandhi, C. Quigg, M. H. Reno and I. Sarcevic, Phys. Rev. D 58, 093009 (1998)
[arXiv:hep-ph/9807264].
[528] K. S. Capelle, J. W. Cronin, G. Parente and E. Zas, Astropart. Phys. 8, 321 (1998)
[arXiv:astro-ph/9801313].
[529] I. Kravchenko et al. [RICE Collaboration], arXiv:astro-ph/0112372.
[530] F. Halzen and D. Hooper, JCAP 0401, 002 (2004) [arXiv:astro-ph/0310152].
[531] E. Waxman and A. Loeb, Phys. Rev. Lett. 87, 071101 (2001) [arXiv:astro-ph/0102317].
[532] R. Tomas, D. Semikoz, G. G. Raffelt, M. Kachelriess and A. S. Dighe, Phys. Rev. D
68, 093013 (2003) [arXiv:hep-ph/0307050].
[533] S. Razzaque, P. Meszaros and E. Waxman, Phys. Rev. Lett. 90, 241103 (2003)
[arXiv:astro-ph/0212536].
[534] E. Waxman and J. N. Bahcall, Phys. Rev. Lett. 78, 2292 (1997)
[arXiv:astro-ph/9701231].
[535] J. Alvarez-Muniz, F. Halzen and D. Hooper, arXiv:astro-ph/0310417.
[536] A. Levinson and E. Waxman, Phys. Rev. Lett. 87, 171101 (2001)
[arXiv:hep-ph/0106102].
[537] A. Y. Neronov and D. V. Semikoz, Phys. Rev. D 66, 123003 (2002)
95

[arXiv:hep-ph/0208248].
[538] L. A. Anchordoqui, H. Goldberg, F. Halzen and T. J. Weiler, arXiv:astro-ph/0404387.
[539] Y. Fukuda et al. [Super-Kamiokande Collaboration], Phys. Rev. Lett. 81, 1562 (1998)
[arXiv:hep-ex/9807003].
[540] A. Borione et al. [CASA-MIA Collaboration], Phys. Rev. D 55, 1714 (1997)
[arXiv:astro-ph/9611117].
[541] G. Rowell et al. [HEGRA Collaboration], Proc. 28th International Cosmic Ray Con-
ference (Tsukuba), 2345 (2003).
[542] M. M. Hanson, Astrophys. J. 597, 957 (2003) [arXiv:astro-ph/0307540].
[543] J. Knapp, D. Heck and G. Schatz, FZKA-5828.
[544] J. Knapp, D. Heck and G. Schatz, Nucl. Phys. Proc. Suppl. 52B (1997) 136.
[545] J. Knodlseder, M. Cervino, D. Schaerer, P. von Ballmoos and G. Meynet,
arXiv:astro-ph/0104074.
[546] S. N. Ahmed et al. [SNO Collaboration], arXiv:nucl-ex/0309004.
[547] V. Berezinsky and G. T. Zatsepin, Phys. Lett. B 28, 423 (1969).
[548] R. Engel, D. Seckel and T. Stanev, Phys. Rev. D 64, 093010 (2001) [astro-ph/0101216].
[549] O. E. Kalashev, V. A. Kuzmin, D. V. Semikoz and G. Sigl, Phys. Rev. D 66, 063004
(2002) [arXiv:hep-ph/0205050].
[550] Z. Fodor, S. D. Katz, A. Ringwald and H. Tu, JCAP 0311, 015 (2003)
[hep-ph/0309171].
[551] Z. Fodor, S. D. Katz, A. Ringwald and H. Tu, Phys. Lett. B 561, 191 (2003)
[arXiv:hep-ph/0303080].
[552] N. Arkani-Hamed, S. Dimopoulos and G. R. Dvali, Phys. Lett. B 429, 263 (1998)
[arXiv:hep-ph/9803315].
[553] I. Antoniadis, N. Arkani-Hamed, S. Dimopoulos and G. R. Dvali, Phys. Lett. B 436,
257 (1998) [arXiv:hep-ph/9804398].
[554] S. Nussinov and R. Shrock, Phys. Rev. D 59, 105002 (1999) [arXiv:hep-ph/9811323].
[555] G. Domokos and S. Kovesi-Domokos, Phys. Rev. Lett. 82, 1366 (1999)
[arXiv:hep-ph/9812260].
[556] P. Jain, D. W. McKay, S. Panda and J. P. Ralston, Phys. Lett. B 484, 267 (2000)
[arXiv:hep-ph/0001031].
[557] M. Kachelriess and M. Plumacher, Phys. Rev. D 62, 103006 (2000)
[arXiv:astro-ph/0005309].
[558] L. Anchordoqui, H. Goldberg, T. McCauley, T. Paul, S. Reucroft and J. Swain, Phys.
Rev. D 63, 124009 (2001) [arXiv:hep-ph/0011097].
[559] T. Banks and W. Fischler, arXiv:hep-th/9906038.
[560] S. B. Giddings and S. Thomas, Phys. Rev. D 65, 056010 (2002) [arXiv:hep-ph/0106219].
[561] S. Dimopoulos and G. Landsberg, Phys. Rev. Lett. 87, 161602 (2001) [hep-ph/0106295].
[562] J. L. Feng and A. D. Shapere, Phys. Rev. Lett. 88, 021303 (2001) [hep-ph/0109106].
[563] L. Anchordoqui and H. Goldberg, Phys. Rev. D 65, 047502 (2002) [hep-ph/0109242].
[564] R. Emparan, M. Masip and R. Rattazzi, Phys. Rev. D 65, 064023 (2002)
[arXiv:hep-ph/0109287].
96

[565] A. Ringwald and H. Tu, Phys. Lett. B 525, 135 (2002) [hep-ph/0111042].
[566] S. I. Dutta, M. H. Reno and I. Sarcevic, Phys. Rev. D 66, 033002 (2002)
[arXiv:hep-ph/0204218].
[567] M. Kowalski, A. Ringwald and H. Tu, Phys. Lett. B 529, 1 (2002)
[arXiv:hep-ph/0201139].
[568] J. Alvarez-Muniz, J. L. Feng, F. Halzen, T. Han and D. Hooper, Phys. Rev. D 65,
124015 (2002) [arXiv:hep-ph/0202081].
[569] L. A. Anchordoqui, J. L. Feng, H. Goldberg and A. D. Shapere, Phys. Rev. D 68,
104025 (2003) [arXiv:hep-ph/0307228].
[570] L. A. Anchordoqui, J. L. Feng, H. Goldberg and A. D. Shapere, arXiv:hep-ph/0309082.
[571] L. A. Anchordoqui, J. L. Feng, H. Goldberg and A. D. Shapere, arXiv:hep-ph/0311365.
[572] V. S. Berezinsky and A. Y. Smirnov, Phys. Lett. B 48, 269 (1974).
[573] D. A. Morris and A. Ringwald, Astropart. Phys. 2, 43 (1994) [arXiv:hep-ph/9308269].
[574] C. Tyler, A. V. Olinto and G. Sigl, Phys. Rev. D 63, 055001 (2001)
[arXiv:hep-ph/0002257].
[575] J. L. Feng, P. Fisher, F. Wilczek and T. M. Yu, Phys. Rev. Lett. 88, 161102 (2002)
[arXiv:hep-ph/0105067].
[576] D. Fargion, Astrophys. J. 570, 909 (2002) [arXiv:astro-ph/0002453].
[577] L. A. Anchordoqui, J. L. Feng, H. Goldberg and A. D. Shapere, Phys. Rev. D 65,
124027 (2002) [arXiv:hep-ph/0112247].
97
Copyright © 2022 FDOKUMEN