Commissioning of the CMS High-Level Trigger with cosmic rays

Ultra High Energy Cosmic Rays
Todor StanevBartol Research Institute, University of Delaware, Newark, DE 19716
We discuss theoretical issues and experimental data that brought the ultra high energy cosmic rays in the list of
Nature’s greatest puzzles. After many years of research we still do not know how astrophysical acceleration processes
can reach energies exceeding 1011 GeV. The main alternative top-down mechanism postulates the existence of super
massive X-particles that create a particle spectrum extending down to the observed energy through their decay
channels. The propagation of nuclei and photons from their sources to us adds to the puzzle as all particles of these
energies interact with the ambient photons, mostly of the microwave background. We also describe briefly the main
observational results and give some information on the new experiments that are being built and designed now.
1. INTRODUCTION
More than forty years ago, in 1963, John Linsley [1] published an article about the detection of a cosmic ray of
energy 1020 eV. The article did not go unnoticed, neither it provoked many comments. The few physicists that were
interested in high energy cosmic rays were then convinced that the cosmic ray energy spectrum can continue forever.
The fact that cosmic rays may have energies exceeding 106 GeV (1015 eV) was established in the late thirties by
Pierre Auger and his collaborators. Showers of higher and higher energy were detected in the mean time - seeing a
1020 eV shower seem to be only a matter of time and exposure. Already in the fifties there was a discussion about
the origin of such ultra high energy cosmic rays (UHECR) and Cocconi [2] reached the conclusion that they must be
of extragalactic origin since the galactic cosmic rays are not strong enough contain such particles.
How exclusive this event is became obvious three years later, after the discovery of the microwave background.
Almost simultaneously Greisen in US [3] and Zatsepin&Kuzmin [4] in the USSR published papers discussing the
propagation of ultra high energy particles in extragalactic space. They calculated the energy loss distance of nucleons
interacting in the microwave background and reached the conclusion that it is shorter than the distances between
powerful galaxies. The cosmic ray spectrum should thus have an end around energy of 5×10¹⁹ eV. This effect is now
known as the GZK cutoff.
The experimental statistics of such event grew with years, although not very fast. The flux of UHECR of energy
above 1020 eV is estimated to 0.5 to 1 event per square kilometer per century per steradian. Even big detectors
of area tens of km2 would only detect few events for ten years of work. The topic became one of common interest
during the last decade of the last century when ideas appeared for construction of detectors with effective areas in
thousand of km2. Such detectors would detect tens of events per year and finally solve all mysteries surrounding
UHECR, which I will attempt to convey to you.
Cosmic rays are usually defined as charged nuclei that originate outside the solar system. They come on a
featureless, power law like, F (E) = K × E−α, spectrum that extends beyond 1011 GeV per particle, as shown above
100 GeV in Fig. 1. There are only two distinct features in the whole spectrum. At energy above 106 GeV the power
law index α steepens from 2.7 to about 3.1. This is called the knee of the cosmic ray spectrum. At energy above
109 GeV the spectrum flattens again at the ankle. Both energy ranges, which are still not very well measured are
indicated in the figure.
The common wisdom is that cosmic rays below the knee are accelerated at galactic supernovae remnants. Cosmic
rays above the knee are also thought to be of galactic origin, although there is no clue of their acceleration sites.
Cosmic rays above the ankle are thought to be extragalactic. When the total energy range is included the flux of
cosmic rays varies by more than 30 orders of magnitude. Note that Fig. 1 shows EdF/dE and its slope is γ = α − 1.
The numbers of the left hand side of the figure shows the flux of cosmic rays in ‘natural’ units. It is obvious that
direct experiments for cosmic ray detection, that are flown in satellites or balloons, can not carry forever because of
SLAC Summer Institute on Particle Physics (SSI04), Aug. 2-13, 2004
1L020

10
10
10
10
10
10
10
10
10
-20
-18
-16
-14
-12
-10
-8
-6
-4
10 10 10 10 10 102 4 6 8 10 12
10 10 10 10 102 3 4 5 6s =
E, GeV/particle
dF
/dln
E, c
m
s s
ter
-2-1
-1
knee
ankle
direct measurements
air showers
3/km .ster.century
1/km .ster.day
6/km .ster.minute
2
2
2
√
Figure 1: Energy spectrum of the cosmic ray nuclei.
statistical limitations. Some data from direct measurements are plotted with full symbols. All other symbols come
from air shower measurements.
1.1. Air Shower Detection Methods.
Cosmic rays of energy above 1014 eV are detected by the showers they generate in the atmosphere. The atmosphere
contains more than ten interaction lengths even in vertical direction and is much deeper for particles that enter it
under higher zenith angles. It is thus a deep calorimeter in which the showers develop, reach their maximum, and then
start being absorbed. There are generally two types of air shower detectors: air shower arrays and optical detectors.
Air shower arrays consist of a large number of particle detectors that cover large area. The shower triggers the array
by coincidental hits in many detectors. The most numerous particles in an air shower are electrons, positrons and
photons. The shower also contains muons, that are about 10% of all shower particles, and hadrons (see the lecture
of G. Schatz for more information).
The direction of the primary particle can be reconstructed quite well from the timing of the different hits, but the
shower energy requires extensive Monte Carlo work with hadronic interaction models that are extended orders of
magnitude above the accelerator energy range. The type of the primary particles can only be studied in statistically
big samples because of the fluctuations in the individual shower development. Even then it is strongly affected by
the differences in the hadronic interaction models.
SLAC Summer Institute on Particle Physics (SSI04), Aug. 2-13, 2004
2L020

The optical method uses the fact that part of the particle ionization loss is in the form of visible light. All charged
particles emit in air Cherenkov light in a narrow cone around their direction. In addition to that charged particles
excite Nitrogen atoms in the atmosphere, which emit fluorescence light. The output is not large, about 4 photons
per meter, but the number of shower particles in UHECR showers is very large, and the shower can be seen from
distances exceeding 30 km. The fluorescence detection is very suitable for UHECR showers because the light is
emitted isotropically and can be detected independently of the shower direction. Since optical detectors follow the
shower track, the direction of the primary cosmic ray is also relatively easy. The energy of the primary particles is
deduced from the total number of particles in the shower development, or from the number of particles at shower
maximum. The rough number is that every particle at maximum carries about 1.5 GeV of primary energy. The mass
of the primary cosmic ray nucleus is studied by the depth of shower maximum Xmax, which is proportional to the
logarithm of the primary energy per nucleon while the total energy depends on the number of particles at maximum.
1.2. The Highest Energy Cosmic Ray Event
The highest energy cosmic ray particle was detected by the Fly’s Eye experiment [5]. We will briefly describe this
event to give the reader an idea about these giant air showers. The energy of the shower is estimated to be 3×10²⁰
eV. This is an enormous macroscopic energy. 1020 eV is equivalent to 1.6×10⁸ erg, 2.4×1034 Hz and the energy of
170 km/h tennis ball. Fly’s Eye was the first air fluorescence experiment, located in the state of Utah, U.S.A. Fig. 2
shows the shower profile of this event as measured by the Fly’s Eye in the left hand panel. Note that the maximum
of this shower contains more than 2×10¹¹ electrons and positrons. Both the integral of this shower profile and the
number of particles at maximum give about the same energy.
0 500 1000 15000
10
20
30
Atm. depth, g/cm
# p
arti
cles
*
10
2
10
0 200 400 600 800 1000 1200 14000
0.2
0.4
0.6
0.8
1.0
photons
p
Fe
Figure 2: Left hand panel: shower profile of the highest energy cosmic ray shower detected by the Fly’s Eye. Right hand panel:
comparison of the detected shower profile to Monte Carlo calculations of shower initiated by protons (solid lines), iron nuclei
(dashed lines), and gamma rays (shaded area, dots) in different assumptions for the development of gamma ray showers.
The errors of the estimates come from the errors of the individual data points, but mostly from the uncertainty in
the distance between the detector and the shower axis. The minimum energy of about 2×10²⁰ eV was calculated in
the assumption that the shower axis was much closer to the detector than the data analysis derived.
It is very difficult to judge what type of the primary particle initiated the shower. A comparison of the detected
shower profile with 10 showers initiated by protons and by primary iron nuclei is shown in the right hand panel
of Fig. 2. It looks like the event is more consistent with the average event initiated by a light nucleus, but the
fluctuations in the shower development make this notion very uncertain. On the other hand, if the same calculation
SLAC Summer Institute on Particle Physics (SSI04), Aug. 2-13, 2004
3L020

were done with some of the different hadronic interaction models, it would be fully consistent with a proton induced
shower.
As we shall see later, one of the crucial questions is if the shower was initiated by a primary nucleus, or by a
primary γ-ray. Fig. 2 attempts to answer this question. Gamma ray showers are usually no a subject to very big
fluctuations, even after accounting for the LPM effect, which decreases the pair production cross section at very high
energy. The claim from this early analysis [6] is that the detected shower profile is very different from the profiles of
γ-ray showers in the corresponding energy range, and thus the primary particle if not a γ-ray.
2. ORIGIN OF UHECR
The first problem with the ultra high energy cosmic rays is that it is very difficult to imagine what their origin is.
We have a standard theory for the acceleration of cosmic rays of energy below the knee of the cosmic ray spectrum
at galactic supernova remnants. This suggestion was first made by Ginzburg&Syrovatskii in 1960’s on the basis of
energetics. The estimate was that a small fraction (3-5%) of the kinetic energy of galactic supernovae is sufficient
to maintain the energy carried by the galactic cosmic rays. The acceleration process was assumed to be stochastic,
Fermi type, acceleration that was later replaced with the more efficient acceleration at astrophysical shocks. See
R. Blandford’s lecture about different acceleration models.
This statement stands, but it is not applicable to all cosmic rays. Much more exact recent estimates and calculations
show that the maximum energy achievable in acceleration on supernova remnant shocks is not much higher than
105 GeV. This excludes not only UHECR, but also the higher energy galactic cosmic rays, that require supernova
remnants in special environments [7].
10
10
10
10
10
10
10
10
12
9
6
3
0
-3
-6
-9km au pc Kpc Mpc Gpc
neutron stars
white dwarfs
sunspots
AGN
gal. planegal. halo
lobes ofradiogalaxies
clustersIGM
B, G
Dimension
After A.M. Hillas
E = e Z R Bmax γ
Figure 3: Requirements for acceleration of charged nuclei at astrophysical objects as spelled out by A.M. Hillas (see text).
The reader should note that currently the acceleration of charged nuclei at supernova remnants is only a the-
oretical prediction. Supernova remnants have higher matter density than interstellar space and one expects that
the accelerated nuclei would interact with the matter and generate high energy γ-rays. Although many supernova
remnants have been observed with TeV Cherenkov gamma ray telescopes, there is no proof that TeV and higher
energy γ-rays are generated in hadronic interactions. We hope that the new generation of such telescopes: HESS,
Magic, Kangaroo-3, and Veritas, will soon prove the prediction (see the lecture of W. Hofmann).
SLAC Summer Institute on Particle Physics (SSI04), Aug. 2-13, 2004
4L020

We should then turn to extragalactic objects for acceleration to energies exceeding 1020 eV. The scale for such
acceleration was set up by Hillas [8] from basic dimensional arguments. The first requirement for acceleration of
charged nuclei in any type of object is that the magnetic field of the object contains the accelerated nucleus within the
object itself. One can thus calculate a maximum theoretical acceleration energy, that does not include and efficiency
factor, as
Emax ≤ γeZBR ,
where γ is the Lorentz factor of the shock matter, Z is the charge of the nucleus, B is the magnetic field value. and
R is the linear dimension of the object.
Figure 3, which is a redrawn version of the original figure of Hillas, shows what are the requirements for acceleration
to more than 1020 eV. The lower edge of the shaded area shows the minimum magnetic field value for acceleration of
iron nuclei as a function of the dimension of the astrophysical object. The upper edge is for acceleration of protons.
There are very few objects that can, even before an account for efficiency, reach that energy: highly magnetized
neutron stars, active galactic nuclei, lobes of giant radiogalaxies, and possibly Gpc size shocks from structure for-
mation. Other potential acceleration sites, gamma ray bursts, are not included in the figure because of the time
dependence of magnetic field and dimension.
2.1. Possib le Astr oph ysical Sour ces of UHECR
In this subsection we give a brief description of some of the models for UHECR acceleration at specific astrophysical
objects. For a more complete discussion one should consult a recent review paper on the astrophysical origin of
UHECR [9], that contains an exhaustive list of references to particular models.
• Pulsars: Young magnetized neutron stars with surface magnetic fields of 1013 Gauss can accelerate charged
iron nuclei up to energies of 1020 eV [10]. The acceleration process is magnetohydrodynamic, rather than
stochastic as it is at astrophysical shocks. The acceleration spectrum is very flat proportional to 1/E. It is
possible that a large fraction of the observed UHECR are accelerated in our own Galaxy. There are also models
for UHECR acceleration at magnetars, neutron stars with surface magnetic fields up to 1015 Gauss.
• Active Galactic Nuclei: As acceleration site of UHECR jets [11] of AGN have the advantage that acceleration
on the jet frame could have maximum energy smaller than these of the observed UHECR by 1/Γ, the Lorentz
factor of the jet. The main problem with such models is most probably the adiabatic deceleration of the
particles when the jet velocity starts slowing down.
• Gamma Ray Bursts: GRBs are obviously the most energetic processes that we know about. The jet Lorentz
factors needed to model the GRB emission are of order 100 to 1000. These models became popular with the
realization that the arrival directions of the two most energetic cosmic rays coincide with the error circles of
two powerful GRB. Different theories put the acceleration site at the inner [12] or the outer [13] GRB shock.
To explain the observed UHECRs with GRBs one needs fairly high current GRB activity, while most of the
GRB with determined redshifts are at Z > 1.
• Giant Radio Galaxies: One of the first concrete model for UHECR acceleration is that of Rachen&Biermann,
that dealt with acceleration at FR II galaxies [14]. Cosmic rays are accelerated at the ‘red spots’, the termination
shocks of the jets that extend at more than 100 Kpc. The magnetic fields inside the red spots seem to be sufficient
for acceleration up to 1020 eV, and the fact that these shocks are already inside the extragalactic space and
there will be no adiabatic deceleration. Possible cosmologically nearby objects include Cen A (distance of 5
Mpc) and M87 in the Virgo cluster (distance of 18 Mpc).
• Quiet Black holes: These are very massive quiet black holes, remnants of quasars, as acceleration sites [15].
Such remnants could be located as close as 50 Mpc from our Galaxy. These objects are not active at radio
frequencies, but, if massive enough, could do the job. Acceleration to 1020 requires a mass of 109 M�.
SLAC Summer Institute on Particle Physics (SSI04), Aug. 2-13, 2004
5L020

• Colliding Galaxies: These systems are attractive with the numerous shocks and magnetic fields of order 20
µG that have been observed in them [16]. The sizes of the colliding galaxies are very different and with the
observed high fields may exceed the gyroradius of the accelerated cosmic ray.
• Clusters of Galaxies: Magnetic fields of order several µG have been observed at lengthscales of 500 Kpc.
Acceleration to almost 1020 eV is possible, but most of the lower energy cosmic rays will be contained in the
cluster forever and only the highest energy particles will be able to escape [17].
• Gpc scale shocks from structure formation: A combination of Gpc scales with 1 nG magnetic field
satisfies the Hillas criterion, however the acceleration at such shocks could be much too slow, and subject to
large energy loss.
2.2. Top-Do wn Scenarios
Since it became obvious that the astrophysical acceleration up to 1020 eV and beyond is very difficult and unlikely, a
large number of particle physics scenarios were discussed as explanations of the origin of UHECR. To distinguish them
from the acceleration (bottom-up) processes they were called top-down. The basic idea is that very massive (GUT
scale) X particles decay and the resulting fragmentation process downgrades the energy to generate the observed
UHECR. Since the observed cosmic rays have energies orders of magnitude lower than the X particle mass, there
are no problems with achieving the necessary energy scale. The energy content of UHECR is not very high, and the
X particles do not have to be a large fraction of the dark matter.
There are two distinct branches of such theories. One of them involves the emission of X particles by topological
defects. This type of models follows the early work of C.T. Hill [19] who described the emission from annihilating
monopole/antimonopole pair, which forms a metastable monopolonium. The emission of massive X particles is
possible by superconducting cosmic string loops as well as from cusp evaporation in normal cosmic strings and from
intersecting cosmic strings. The X particles then decay in quarks and leptons. The quarks hadronize in baryons and
mesons, that decay themselves along their decay chains. The end result is a number of nucleons, and much greater
(about a factor of 30 in different hadronization models) and approximately equal number of γ-rays and neutrinos.
A monopole is about 40 heavier than a X particle, so every monolonium can emit 80 of them. Using that number
one can estimate the number of annihilations that can provide the measured UHECR flux, which turns out to be
less than 1 per year per volume such as that of the Galaxy. Another possibility is the emission of X particles from
cosmic necklaces - a closed loop of cosmic string including monopoles. This particular type of topological defect has
been extensively studied [20].
The other option is that the X particles themselves are remnants of the early Universe. Their lifetime should
be very long, maybe longer than the age of the Universe [21]. They could also be a significant part of the cold
dark matter. Being superheavy, these particle would be gravitationally attracted to the Galaxy and to the local
supercluster, where their density could well exceed the average density in the Universe. There is a large number of
topological defect models which are extensively reviewed in Ref. [18].
There are two main differences between bottom-up and top-down models of UHECR origin. The astrophysical ac-
celeration generates charged nuclei, while the top-down models generate mostly neutrinos and γ-rays plus a relatively
small number of protons. The energy spectrum of the cosmic rays that are generated in the decay of X particles is
relatively flat, close to a power law spectrum of index α=1.5. The standard acceleration energy spectrum has index
equal to or exceeding 2.
2.3. Hybrid Models
There also models that are hybrid, they include elements of both groups. The most successful of those is the
Z-burst model [22, 23]. The idea is that somewhere in the Universe neutrinos of ultrahigh energy are generated.
These neutrinos annihilate with cosmological neutrinos in our neighborhood and generate Z0 bosons which decay
SLAC Summer Institute on Particle Physics (SSI04), Aug. 2-13, 2004
6L020

and generate a local flux of nucleons, pions, photons and neutrinos. The resonant energy for Z0 production is 4×10²¹
eV/mν(eV), where mν is the mass of the cosmological neutrinos. The higher the mass of the cosmological neutrinos
is, the lower the resonance energy requirement. In addition the cosmological neutrinos are gravitationally attracted
to concentrations of matter and their density increases in our cosmological neighborhood. If the neutrino masses are
low, then the energy of the high energy neutrinos should increase.
3. PROPAGATION OF UHECR
Particles of energy 1020 eV can interact on almost any target. The most common, and better known, target is
the microwave background radiation (MBR). It fills the whole Universe and its number density of 400 cm−3 is large.
The interactions on the radio and infrared backgrounds are also important. Let us have a look at the main processes
that cause energy loss of nuclei and gamma rays.
3.1. Energy Loss Processes
The main energy loss process for protons is the photoproduction on astrophysical photon fields pγ → p + nπ. The
minimum center of mass energy for photoproduction is√
sthr = mp+mπ0 ∼ 1.08 GeV. Since s = m2p+2(1−cos θ)Epε
(where θ is the angle between the two particles) one can estimate the proton threshold energy for photoproduction
on the MBR (average energy ε = 6.3×10⁻⁴ eV). For cos θ = 0 the proton threshold energy is Ethr = 2.3×10²⁰
eV. Because there are head to head collisions and because the tail of the MBR energy spectrum continues to higher
energy, the intersection cross section is non zero above proton energy of 3×10¹⁹ eV.
10
100
1000
0.1 1 10 100 1000
tota
l cro
ss s
ecti
on
(
µbar
n)
ε’ (GeV)
totaldirect
multi-piondiffraction
resonances
Figure 4: Photoproduction cross section as a function of the photon energy for stationary proton targets.
The photoproduction cross section is very well studied in accelerator experiments and is known in detail. Figure 3
shows the photoproduction cross section in the mirror system, as a function of the photon energy for stationary
protons, i.e. as it is measured in accelerators. At threshold the most important process is the ∆+ production where
the cross section reaches a peak exceeding 500 µb. It is followed by a complicated range that includes the higher mass
resonances and comes down to about 100 µb. After that one observes an increase that makes the photoproduction
cross section parallel to the pp inelastic cross section. The neutron photoproduction cross section is nearly identical.
Another important parameter is the proton inelasticity kinel, the fraction of its energy that a proton loses in one
interaction. This quantity is energy dependent. At threshold protons lose about 18% on their energy. With increase
of the CM energy this fractional energy loss increases to reach asymptotically 50%.
SLAC Summer Institute on Particle Physics (SSI04), Aug. 2-13, 2004
7L020

The proton pair production pγ → e+e− is the same process that all charged particles suffer in nuclear fields. The
cross section is high, but the proton energy loss is of order me/mp ' 4×10⁻⁴E. Figure 5 shows the energy loss length
Lloss = λ/kinel (the ratio of the interaction length to the inelasticity coefficient) of protons in interactions in the
microwave background.
BH
10 10 10 10 1018 19 20 21 221
10
100
1000
10000
E , eV
L
, M
pc
loss
Figure 5: Energy loss length of protons in interactions in MBR.
The dashed line shows the proton interaction length and one can see the increase of kinel in the ratio of the
interaction to energy loss length. The contribution of the pair production is shown with a thin line. The energy loss
length never exceeds 4,000 Mpc, which is the adiabatic energy loss due to the expansion of the Universe for H0 = 75
km/s/Mpc. The dotted line shows the neutron decay length. Neutrons of energy less than about 3×10²⁰ eV always
decay and higher energy neutrons only interact.
Heavier nuclei lose energy to a different process - photodisintegration, loss of nucleons mostly at the giant dipole
resonance [25]. Since the relevant energy in the nuclear frame is of order 20 MeV, the process starts at lower energy.
The resulting nuclear fragment may not be stable. It then decays and speeds up the energy loss of the whole nucleus.
Ultra high energy heavy nuclei, where the energy per nucleon is higher than photoproduction, have also loss on
photoproduction. The energy loss length for He nuclei in photodisintegration is as low as 10 Mpc at energy of 1020
eV. Heavier nuclei reach that distance at higher total energy.
UHE gamma rays also interact on the microwave background. The main process is γγ → e+e−. This is a resonant
process and for interactions in the MBR the minimum interaction length is achieved at 1015 eV. The interaction length
in MBR decreases at higher γ-ray energy and would be about a 50 Mpc at 1020 eV if not for the radio background.
The radio background does exist but its number density is not well known. Figure 6 shows the interaction length
for this process in MBR (dots) and in all photon fields. The energy range is wider than for protons because some
top-down models can generate γ-rays of energy approaching mX .
The fate of the electrons produced in a γγ collision depends on the strength of the magnetic fields in which UHE
electrons lose energy very fast. the dashed line shows the electron energy loss length in 1 nG field. The photon energy
is than quickly downgraded and the γγ interaction length becomes very close to the gamma ray energy loss length.
In the case of very low magnetic fields (0.01 nG) the synchrotron energy loss is low (it is proportional to E2eB2)
and then inverse Compton scattering (with a cross section very similar to this of γγ) and cascading is possible. The
energy loss length of the gamma rays would be higher in such a case.
In conclusion, the energy loss of protons, heavier nuclei and photons is high in propagation on cosmological scales.
Figure 7 compares the proton energy loss length to that of gamma rays in the assumption of 1 nG magnetic fields.
SLAC Summer Institute on Particle Physics (SSI04), Aug. 2-13, 2004
8L020

int.
len
gth
, M
pc
E , eV
10
10
10
10
10
10
-1
0
1
2
3
4
10 10 10 10 10 10 10 1017 18 19 20 21 22 23 24
Figure 6: Interaction length of γ-rays in MBR (dots) and in MBR + radio background. The dashed line shows the synchrotron
energy loss length of electrons in 1 nG magnetic field.
10 10 10 10 1018 19 20 21 221
10
100
1000
10000
E , eV
En
erg
y lo
ss le
ng
th ,
Mp
c
protons
gamma-rays
pairs photoproduction
Figure 7: Energy loss lengths of protons and gamma rays,
At energies below 1020 eV the proton energy loss length is definitely longer than that of gamma rays. At energies
above 5×10²⁰ the difference is only a factor of 2, with very small energy dependence. Have in mind, though, that
the flat part of the gamma ray energy loss length is due to interactions in the radio background in the 1 MHz range,
which can not be detected at Earth and has to be modeled as a ratio to other astrophysical photon fields.
The general conclusion from this analysis of the energy loss of protons and gamma rays in their propagation
through the Universe is these UHE particles can not survive at distances of more than few tens of Mpc and sources
of the detected cosmic rays have to be located in our cosmological neighborhood. Every increase of the distance
between the source and the observer would require and increase of the maximum energy at acceleration (or other
production mechanism) and will increase significantly the energy requirement to the UHECR sources.
SLAC Summer Institute on Particle Physics (SSI04), Aug. 2-13, 2004
9L020

3.2. Modification of the Proton Spectrum in Propagation. Numerical Deriv ationof the GZK Effect.
Figure 8 shows in the left hand panel the evolution of the spectrum of protons because of energy loss during
propagation at different distances. The thick solid lines shows the spectrum injected in intergalactic space by the
source, which in this exercise is
dN
dE= A × E−2/ exp(E/3.16 × 1021eV) .
After propagation on 10 Mpc only some of the highest energy protons are missing. This trend continues with distance
and at about 40 Mpc another trend appears - the flux of protons of energy just below 1020 eV is above the injected
one. This is the beginning of the formation of a pile-up in the range where the photoproduction cross section starts
decreasing. Higher energy particles that are downgraded in this region lose energy less frequently and a pile-up is
developed.
10 10 10 1018 19 20 21
0.0001
0.001
0.01
0.1
1.0
E d
N/d
E
E, eV
102040100
200
400
800
1600
10 10 10 1018 19 20 211
10
100
E, eV
E
dN
/dE
, ar
b. u
nit
s3
Figure 8: Left hand panel: Evolution of the cosmic ray spectrum in propagation through different distances. Right hand
panel: spectrum from homogeneous isotropic cosmic ray sources that inject spectra with α = 2. Upper edge: cosmological
evolution of UHECR sources with n = 4, lower one - n = 3.
The pile-up is better visible in the spectra of protons propagated at larger distances. One should remark that
the size of the pile-up depends very strongly on the shape of the injected spectrum. If it had a spectral index of 3
instead of 2 the size of the pile-up would have been barely visible as the number of high energy particles decreased
by a factor of 10.
When the propagation distance exceeds 1 Gpc there are no more particles of energy above 1019 eV. All these
particles have lost energy in photoproduction, pair production and adiabatic losses. From there on most of the losses
are adiabatic.
In order to obtain the proton spectrum created by homogeneously and isotropically distributed cosmic ray sources
filling the whole Universe one has to integrate a set of such (propagated) spectra in redshift using the cosmological
evolution of the cosmic ray sources, which is usually assumed to be the same as that of the star forming regions
(SFR) η(z) = η(0)(1 + z)n with n = 3, or 4 up to the epoch of maximum activity zmax and then either constant
or declining at higher redshift. High redshifts do not contribute anything to UHECR (1600 Mpc corresponds to z =
0.4 for H0 = 75 km/s/Mpc). After accounting for the increased source activity the size of the pile-ups has a slight
increase.
The right hand panel shows the UHECR spectrum that comes from the integration of propagation spectra shown
in the left hand panel with different cosmological evolutions. Obviously the importance of the cosmological evolution
SLAC Summer Institute on Particle Physics (SSI04), Aug. 2-13, 2004
10L020

is very small and totally disappears for very high energy. The differential spectrum is multiplied by E3 as is
often done with experimental data to emphasize the spectral features. One can see the pile-up at 5×10¹⁹ eV after
which the spectrum declines steeply. There is also a dip at about 1019 eV which is due to the energy loss on
pair production. These features were first pointed at by Berezinsky & Grigorieva [26]. Such should be the energy
spectrum of extragalactic protons under the assumptions of injection spectrum shape, cosmic ray luminosity (4.5×1044
erg/Mpc3/yr [12]), cosmological evolution and isotropic distribution of the cosmic ray sources in the Universe.
3.3. Modification of the Gamma Ray Spectra.
Because of the strong influence of the radio background and of the cosmic magnetic fields the modification of the
spectrum of gamma rays in a top-down scenario is much more difficult to calculate exactly. There are, however,
many general features that are common in any of the calculations. Figure 9 shows the gamma ray spectrum emitted
in a top-down scenario with mX = 1014 GeV [24]. The spectra of different particles from the X decay chain are
indicated with different line types. The one, that we are now interested in, is for gamma rays. If not for energy loss
the gamma ray spectrum would have been parallel to these of neutrinos.
Figure 9: Evolution of the energy spectra of particles injected in a top-down scenario with X particle mass of 1014 GeV. The
injection spectra a almost parallel to the shown neutrino spectra.
We shall start the discussion from the highest energy and follow the energy dissipation in propagation. The highest
energy gamma rays have not suffered significant losses. At slightly lower energy, though, the γγ cross section grows
and the energy loss increases. One can see the dip at about 1010−11 GeV which is caused by the radio background.
All other interactions are on the MBR. The magnetic field is assumed sufficiently high that all electrons above 109
GeV immediately lose energy in synchrotron radiation. The minimum ration of the gamma-ray to cosmic ray flux is
reached at about 1015 eV, after which there is some recovery. There is another absorption feature from interactions on
the infrared background. The gamma ray peak in the GeV region consists mostly of synchrotron photons. Isotropic
GeV gamma rays, that have been measured, can be used to restrict top-down models in some assumptions for the
magnetic field strength.
3.4. UHECR Propagation and Extra galactic Magnetic Fields
The possible existence of non negligible extragalactic magnetic fields would significantly modify the propagation
of the UHE cosmic rays independently of their nature and origin. There is little observational data on these fields.
SLAC Summer Institute on Particle Physics (SSI04), Aug. 2-13, 2004
11L020

The best estimate of the average strength of these fields in the Universe is 10−9 Gauss (1 nG) [27]. On the other
hand µG fields have been observed in clusters of galaxies, and in a bridge between two parts of the Coma cluster.
Since the measurements of fields of strength less than 1 µG are very difficult, all current arguments are of strictly
theoretical type. Cosmological seed fields are not expected to be stronger than 10−17 G. Many people believe that
the Universe is much too young to explain the existence of significant large scale fields by spreding out the fields of
individual astrophysical objects. Others are impressed by the high fields observed in clusters of galaxies and suspect
the existence of lower fields on larger scales.
No one expects the extragalactic magnetic fields to be isotropic. They should be much higher than the average is
the walls of high matter density and much lower in the voids. All possible UHECR sources should also be associated
with high matter concentration.
Even fields with nG strength would seriously affect the propagation of UHE cosmic rays. If UHECR are protons
they would scatter of these fields. This scattering would lead to deviations from the source direction and to an
increase of the pathlength from the source to the observer. It would make the source directions less obvious and
would create a magnetic horizon for extragalactic protons of energy below 1019 eV as their propagation time from
the source to the observer would start exceeding Hubble time.
l=0ol=360o b=0
30
60
o
o
o
Figure 10: The arrival direction in galactic coordinates of protons emitted by M87 (cross) if there were an organized 10 nG
field along the Supergalactic plane (shown with wide gray curve). Particles above 1020 eV are shown with circles. The Galactic
plane is indicated with a dashed line. The map is centered at the Galactic anticenter.
If regular magnetic fields of strength exceeding 10 nG were present on 10 Mpc coherence length they would lead
to significant biases in the propagated spectra [28] in a function of the relative geometry of the field, source and
observer. Particles of very high energy would gyrate around the magnetic field lines and thus appear coming from a
wide range of directions. Figure 10 shows an example for protons accelerated at the powerful AGN M87 in case is
connected with our galaxy by 3 Mpc wide cylinder of 10 nG magnetic field. The distance to M87 is 18 Mpc. If such
fields indeed exist, one should be able to recognize the UHECR sources only on the basis of high statistics.
The strongest possible magnetic field effect on UHE cosmic ray nuclei was suggested by Biermann [29]. He used
the observational fact that in all observed spiral galaxies the magnetic field is directed inward along the spiral arms
and applied Parker’s solar field model to obtain a model of the galactic wind. Galactic magnetic fields are frozen
in the galactic wind. Protons of energy 1020 eV can penetrate the resulting magnetic bottle only from the galactic
North and the most likely origin of the detected UHECR is then in the vicinity of the Virgo cluster.
The influence of magnetic fields on gamma ray propagation is mostly restricted to the rate of energy loss in
propagation. Fig. 6 shows with a dotted line the synchrotron energy loss of electrons in 1 nG magnetic field. In the
absence of magnetic fields electrons would have inverse Compton interactions on MBR that would generate a gamma
ray that carries almost the total electron energy. This would lead to electromagnetic cascading and relatively slow
decrease of the γ-ray energy. In the presence of fields the electrons of energy above 3×10¹⁸ eV would lose energy
SLAC Summer Institute on Particle Physics (SSI04), Aug. 2-13, 2004
12L020

very fast on synchrotron radiation. The radiated photons would have energies lower by many orders of magnitude.
This is one of the bases for limiting the allowed mass of the X particles in the exotic particle physics models of the
UHECR origin.
3.5. Production of Secondar y Partic les in Propagation
One interesting feature that can be used for testing of the type and distribution of UHECR sources, that we shall
not discuss at any length, is the production of secondary particles in propagation. The energy loss of the primary
protons and γ-rays is converted to secondary gamma rays and neutrinos.
Most interesting are the cosmogenic neutrinos, that were first proposed by Berezinsky & Zatsepin [30] and have
been since calculated many times, most recently in Ref. [31]. Every charged pion produced in a photoproduction
interaction three neutrinos through its decay chain.
The spectrum of cosmogenic neutrinos depends on the UHECR spectrum and on the UHECR source distribution.
It extends to energies exceeding 1020 eV. Currently designed and built neutrino telescopes are aiming at detection
of cosmological neutrinos (see P. Gorham’s talk).
At the ∆ resonance energy range 2/3 of the produced pions are neutral. Most of the energy loss (including those
in e+e− pairs) goes to the electromagnetic component as do the muon decay electrons. The ensuing electromagnetic
cascading should create a γ-ray halo around powerful UHECR sources that could be detected by the new generation
of γ-ray detectors.
3.6. Partic le Physics Models
There are also quite a few models that attempt to avoid the propagation difficultios by assuming that UHECR
are not any of the known stable particles. One of these models [32, 33] assumes that the gluino is the lightest
supersymmetric particle and that it causes the observed UHE cosmic ray showers. It gluinos have mass between
0.1 and 1 GeV, it could have photoproduction cross section much smaller than that ot nucleons and still be able to
interact in the atmosphere and generate showers. The distance to potential gluino sources could reach many hundreds
of Mpc. The problems with this and other similar models that neutron particles can not be accelerated and gluinos
have to be copiously produced at the source in interactions of particles of still higher energy. So the problems again
lead to the mechanisms of particle acceleration well above 1020 eV.
Starting with Refs. [34, 35] many authors have discussed different effects that could help propagate protons and
much larger distances than calculated above. The original suggestions are for tiny violations of the Lorentz invariance
that can not be detected in any other way. Coleman & Glashow define a maximum achievable velocity (MAV) for
the particles involved in photoproduction interactions that are due to Lorentz invariance violations. Small (order of
10−23 differences between proton and ∆+ or proton and pion MAV would increase the photoproduction threshold
and thus significantly increase the energy of the GZK cutoff.
4. EXPERIMENTAL DATA
There are six experiments that have collected experimental data after the Volcano Ranch array that Linsley ran.
SUGAR, Haverah Park, Yakutsk, and AGASA are surface air shower arrays. Fly’s Eye and its successor HiRes
are fluorescent detectors. The current world statistics on UHECR are dominated by AGASA and HiRes. These
two experiments have presented data on the energy spectrum, some shower features (Xmax) and arrival direction
distributions for their data samples. The statistics is still quite small and the main results of the two detectors are
somewhat in contradiction.
SLAC Summer Institute on Particle Physics (SSI04), Aug. 2-13, 2004
13L020

4.1. Energy Spectra of UHECR
Figure 11 shows in the left hand panel the UHECR spectra measured by AGASA [36] and by HiRes [37, 38] in
monocular mode. This experiment is designed to look for showers in stereo, with two optical detectors that observe
the shower simultaneously. The shower analysis is much easier and exact in such a mode. The data shown in Fig. 11
are taken by the two optical detectors independently. The experimental statistics of HiRes in stereo is still smaller.
There two facts that one immediately notices:
1) The overall normalization of the cosmic ray flux is different by about 40%, which looks like a factor of 2 in the
figure because of the E3 factor on the differential flux.
2) AGASA sees eleven showers with energy above 1020 eV. HiRes sees only two with a an exposure that is estimated
twice the AGASA’s.
10 10 10 1018 19 20 21
Energy (eV)
23
24
25
26
10
10
10
10
E d
N/d
E (
m
s s
ter
eV
)3
-2-1
-12
10 10 10 1018 19 20 211
10
100
E, eV
E
dN
/dE
, ar
b. u
nit
s3
Figure 11: Left hand panel: the experimental data of AGASA (full squares) and of HiRes in monocular mode (dots). Right
hand panel: The data are normalized to each other at 1019 eV and are compared in shape to calculations such as shown in
Fig. 8 with injection spectra with indices of 2.00, 2.25, 2.50, 2.75, and 3.00 (bottom to top at 1018 eV.
The energy assignment of the AGASA experiment is done by the particle density at 600 meters from the core
(ρ600) which is not very sensitive to the type of the primary nucleus. HiRes estimates the primary energy either by
the integral of the shower profile. Both experiments claim systematic uncertainties of order 30%.
The data from the other experiments are intermediate between these two extremes. Each experiment has seen at
least one event that has energy well above 1020 eV, but with small experimental statistics the flux of such events is
very uncertain.
When the difference in flux normalization (which could well be a difference in energy assignment) is taken out,
the spectral shapes are not that different, as shown in the right hand panel of Fig. 11. The spectra agree in shape
quite well up to 1020 eV. They may show a dip at about 1019.7 eV. The big difference is that the AGASA spectrum
recovers and that of HiRes does not. Because of the small statistics the difference between the two data sets at the
highest energies is not statistically significant [39].
Another question that Fig. 11 raises is on the UHECR injection spectrum. The eyes (and numerous fits) prefer
a spectral index in the vicinity of 2.50 in the case of homogeneous isotropic source distribution. Flatter injection
spectra could be fitted only by a strong contribution of the galactic cosmic rays up to 1019 eV. Distinguishing between
galactic and extragalactic contribution would only be possible if the chemical composition of UHECR is known -
galactic cosmic rays at this energy have to be heavy nuclei.
Another difference between the two measurements, which is not that easy to see, is that they observe the ankle
at different energy: about 3×10¹⁸ eV by HiRes and about 1019 eV by AGASA. This is obviously not related to the
energy assignments discussed above, which only differ by 40% or so.
SLAC Summer Institute on Particle Physics (SSI04), Aug. 2-13, 2004
14L020

4.2. Chemical Composition of UHECR
The predecessor of HiRes, the Fly’s Eye, studied the UHECR composition by fitting the energy dependence of the
depth of maximum Xmax of the UHE air showers. In electromagnetic showers Xmax is proportional to logarithm of
the primary energy ln E. In showers initiated by primary nuclei this dependence is a more complicated function of
the energy, but is still proportional to the primary energy per nucleon. Because of that Xmax of an iron initiated
shower of energy E0 would be approximately the same as of a proton shower of energy E0/56.
The change of Xmax in one decade of E0 was called elongation rate (ER) by John Linsley. Contemporary hadronic
interaction models predict elongation rate of 50 to 60 g/cm2. The Fly’s Eye observed an ER of more than 70 g/cm2
to energies 3×10¹⁷ eV followed by a change that made the elongation rate consistent with expectations [40]. The
Fly’s Eye thus observed a simultaneous change of the slope of the cosmic ray spectrum and of the shower elongation
rate [41].
17 18 19 20
600
700
800
log E (eV)10
Dep
th o
f m
axim
um
(g
/cm
)2
p
Fe
Figure 12: Depth of maximum as a function of the shower energy, as measured by HiRes (squares) and HiRes prototype +
CASA/MIA (hexagons). The shaded areas are the predictions of different hadronic interaction models.
This is an enormously important statement, because it implies that the the mass of the primary cosmic rays
is becoming lighter. It signals that the flux of heavy galactic cosmic rays is decreasing and the new cosmic ray
component that is responsible for the change of the spectral index at the ankle consists of protons and possibly He
nuclei.
This observation is now supported [42] by the new results of HiRes shown in Fig. 12. The lower energy points
shown with hexagons are obtained with the HiRes prototype working together with CASA/MIA air shower array.
According to this most recent data set the change of the cosmic ray composition is almost over by 1018 eV. Since
the observed Xmax is almost parallel to the expectations, one can assume that the composition is constant. The
composition is proton dominated, but a more exact prediction depends on the hadronic interaction model used, as
shown with shaded areas that indicate calculations with different hadronic models.
The chemical composition of the primary cosmic rays can also be studied by the fraction of muons in the showers.
When the primary particle is a heavy nucleus, the first generation mesons are approximately 1/A less energetic than
in protons showers, and have a higher decay probability. For this reason the muon fractions is higher in showers
generated by heavy nuclei. The AGASA experiment has a number of muon counters that can study the muon
content of the showers. The number of such counters is not high and the statistics is thus limited, but the AGASA
collaboration did not see the change in the muon content that would correspond the the Fly’s Eye result. The
collaboration still claims a gradual decrease of the Fe fraction between energies of 1017.5 and 1019 eV. Alternative
methods for estimation of the cosmic ray composition, applied by other experimental groups, also give a relatively
SLAC Summer Institute on Particle Physics (SSI04), Aug. 2-13, 2004
15L020

large fraction of heavy nuclei around 1018 eV.
This disagreement is still not fully solved. The showers of both groups are now analyzed using the same hadronic
interaction models but the differences persist.
Especially important is the determination of the type of the UHECR - nuclei or gamma rays. Two special studies
have been performed by the AGASA and the Haverah Park groups using different approaches. AGASA [43] looks
at the particle density at 100 meters from the shower core that is expected to be dominated by shower muons. This
density should be much lower in gamma ray initiated showers. A new analysis of the Haverah Park data [44] studies
highly inclined air showers. Since the absorption of gamma ray showers is stronger, their flux should decline with
zenith angle faster. Both experiments limit the fraction of γ-rays above 1019 eV at 30% of all cosmic rays. The limits
at higher energy (3-4×10¹⁹ eV) are less strict(67% - 55%) because of the declining statistics. There is no statement
about the few particles above 1020 eV so that ‘top-down’ models can still apply to these events.
4.3. Arriv al Directions of UHECR
The arrival direction distribution of the UHECR events detected by AGASA has two main features: the distribution
is isotropic on large scale and non isotropic on small (one degree) scale [45]. There is no preference of higher event
rate coming from the galactic plane or any other know astrophysical concentration of matter, although an association
with the supergallactic plane was reported [46] on the basis of an earlier smaller event sample. There are however five
doublets and a triplet of events arriving at less than 2.5◦ from each other. The angular resolution of the detector is
below 2◦. The statistical significance of this ‘clustering’ is of order three σ. The individual clusters can be identified
in Fig. 13 that shows the arrival directions of the world data set above 1019.6 eV, except for the Fly’s Eye and HiRes
events that are not yet published.
Figure 13: Arrival directions of cosmic rays of energy exceeding 1019.6 eV in galactic coordinates. The map is centered on the
galactic anti-center. The large circles identify energies exceeding 1020 eV. The shaded area is the field of view of the detectors.
The thick line indicates the supergalactic plane - the plane of weight of galaxies at redshifts less than 0.04.
The clusters do not point at any known luminous astrophysical object. There have been long discussions how such
clustering can occur in a more or less realistic astrophysical scenario. Do they point at UHECR sources that we
cannot otherwise observe? How many UHECR sources should exist to fit both the isotropic large scale distribution
and the clustering? Is the clustering real, or a result of a large statistical fluctuation?
One of the better ways to look at the small scale anisotropy of the AGASA showers is to look at the self-correlation
of the detected showers. Fig. 14 shows the self-correlation plot - the number of events that have directions different
from each other by ∆α. The real number of events is divided by the expectation from isotropic distribution and
is given in the figure in terms of σ. The clustering is at ∆α less than 2◦, which would correspond to the angular
SLAC Summer Institute on Particle Physics (SSI04), Aug. 2-13, 2004
16L020
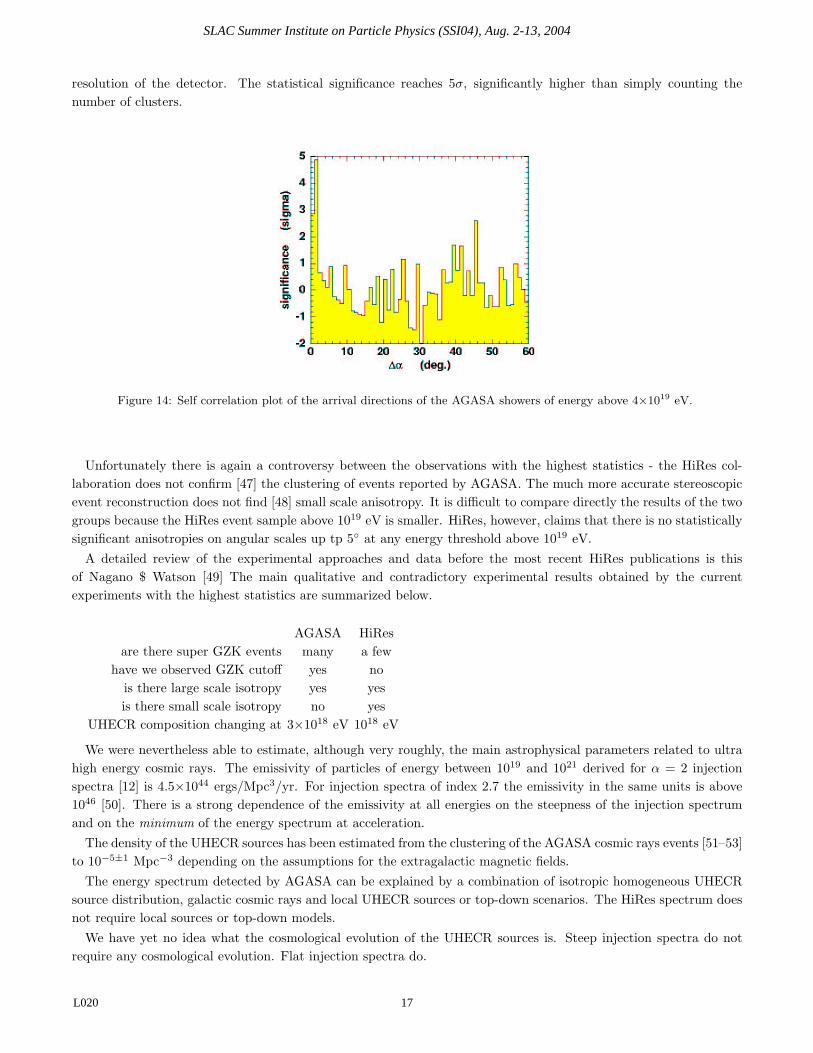
resolution of the detector. The statistical significance reaches 5σ, significantly higher than simply counting the
number of clusters.
Figure 14: Self correlation plot of the arrival directions of the AGASA showers of energy above 4×10¹⁹ eV.
Unfortunately there is again a controversy between the observations with the highest statistics - the HiRes col-
laboration does not confirm [47] the clustering of events reported by AGASA. The much more accurate stereoscopic
event reconstruction does not find [48] small scale anisotropy. It is difficult to compare directly the results of the two
groups because the HiRes event sample above 1019 eV is smaller. HiRes, however, claims that there is no statistically
significant anisotropies on angular scales up tp 5◦ at any energy threshold above 1019 eV.
A detailed review of the experimental approaches and data before the most recent HiRes publications is this
of Nagano $ Watson [49] The main qualitative and contradictory experimental results obtained by the current
experiments with the highest statistics are summarized below.
AGASA HiRes
are there super GZK events many a few
have we observed GZK cutoff yes no
is there large scale isotropy yes yes
is there small scale isotropy no yes
UHECR composition changing at 3×10¹⁸ eV 1018 eV
We were nevertheless able to estimate, although very roughly, the main astrophysical parameters related to ultra
high energy cosmic rays. The emissivity of particles of energy between 1019 and 1021 derived for α = 2 injection
spectra [12] is 4.5×1044 ergs/Mpc3/yr. For injection spectra of index 2.7 the emissivity in the same units is above
1046 [50]. There is a strong dependence of the emissivity at all energies on the steepness of the injection spectrum
and on the minimum of the energy spectrum at acceleration.
The density of the UHECR sources has been estimated from the clustering of the AGASA cosmic rays events [51–53]
to 10−5±1 Mpc−3 depending on the assumptions for the extragalactic magnetic fields.
The energy spectrum detected by AGASA can be explained by a combination of isotropic homogeneous UHECR
source distribution, galactic cosmic rays and local UHECR sources or top-down scenarios. The HiRes spectrum does
not require local sources or top-down models.
We have yet no idea what the cosmological evolution of the UHECR sources is. Steep injection spectra do not
require any cosmological evolution. Flat injection spectra do.
SLAC Summer Institute on Particle Physics (SSI04), Aug. 2-13, 2004
17L020

5. FUTURE OF THE FIELD
It is obvious that at least a part of the inconsistency of the current experimental results is due to the very low
experimental statistics. The interest in UHECR actually grew when ideas for experiments that can solve the problem
appeared in the early 1990s. Obviously shower arrays much bigger than AGASA are needed when the aim is to
collect reasonable statistics above 1020 eV. The first idea for the Auger Observatory [54] was spelled out by Cronin
& Watson.
Auger would initially consist of two air shower arrays located in the Northern and in the Southern hemispheres,
each of area 5,000 km2, i.e. it was supposed to be 100 times the size of AGASA. Arrays in both hemispheres are
needed for full sky coverage - nobody knows where the UHECR sources are. This first proposal is scaled down, but
the Southern Auger Observatory is being built in Argentina (see talk of R. Cintra Shellard). It consists of 3,000
km2 area observed by surface detectors and by four fluorescent detectors. The surface detectors are 10 m2 water
Cherenkov tanks spaced by 1,500 m. One meter tall water Cherenkov tanks were chosen because they absorb almost
fully all shower electrons and photons and because their area does not decrease that fast with zenith angle - they will
be able to observe and reconstruct showers down to horizontal direction. Another big advantage is that about 10%
of the statistics will be observed simultaneously with both techniques, which may solve the current contradictions of
AGASA and HiRes.
Then there is the Telescope Array (TA) [55] that is already funded by the Japanese government. TA will consist
of 1,000 km2 surface array equipped with scintillator detectors 1.2 km apart from each other and three fluorescent
detectors observing the atmosphere above it. There are plans for moving the HiRes detectors to TA and infilling the
ground array to extend the threshold to lower energy. The latter part is not yet funded.
Other, longer time scale, plans are for space based giant air shower detectors. EUSO [56] was chosen by the
European Space Agency as a Phase A project to be mounted on the International Space Station. EUSO is a
fluorescence detector that observes the atmosphere from an altitude of 400 km. It will be able to cover more than
105 km2 with a resolution about 1 km per pixel. Such a detector will be very efficient for observation of highly
inclined showers, and thus it would be a very good detector of UHE neutrinos that would interact very deep in the
atmosphere. EUSO was not approved for Phase B because of the uncertainty of the ISS future, but the design of the
detector and the necessary measurements of the relevant atmospheric features are still funded and continue.
OWL [57] is an even more ambitious project for stereoscopic observations from space with two detectors mounted
on free flying satellites. These satellites would see the Earth from higher altitude, and thus observe larger area. The
stereoscopic observation will make the analysis of the detected events easier and more exact. OWL is a part of the
NASA plans for the future.
6. SUMMARY
We are certain that cosmic rays of energy above 1020 eV exist, but their flux is unknown. All giant air showers
arrays have detected at least one shower of energy above 1020 eV. The puzzle is that very few astrophysical objects can
accelerate charged nuclei to such energy in shock acceleration processes, which is the favorite model for astrophysical
acceleration.
Protons and heavier nuclei lose energy in propagation in photoproduction and photodisintegration on MBR and
other photon fields. Since the energy loss length of all nuclei is of order 10 Mpc, the UHECR sources have to be
within tens of Mpc from our Galaxy. There are few powerful astrophysical objects that close to us.
The other possibility are ‘top-down’ scenarios where these particles are generated in the decay of ultraheavy
X-particles, which could be emitted by cosmic strings or are long lived remnants of the early Universe.
The current experimental data are not able to give us good indication on the type of these UHECR and their
arrival direction distributions. The data on the cosmic ray spectrum and composition above 1018 eV are somewhat
contradictory. The HiRes experiment gives UHECR spectrum and composition fully consistent with the assumption
of isotropic distribution of the cosmic rays sources. The HiRes predecessor, Fly’s Eye, has detected the highest energy
SLAC Summer Institute on Particle Physics (SSI04), Aug. 2-13, 2004
18L020

event of energy 3×10²⁰ eV. The AGASA experiment has published several events of super GZK energy which show
no cutoff in the UHE cosmic ray spectrum. AGASA also claims a small scale anisotropy of the events above 1019 eV
which is not, however, related to the directions of powerful astrophysical objects.
New third (and fourth) giant air shower experiments are being designed and built. They will increase the world
data sample by orders of magnitude and help understanding the nature and sources of these exceptional events.
Ackno wledgments
My work in the field of UHECR is funded in part by U.S. Department of energy contract DE-FG02 91ER 40626
and by NASA grant NAG5-7009. The collaboration of J. Alvarez-Muniz, P.L.Biermann, R. Engel, T.K. Gaisser,
D. Seckel and others is highly appreciated.
References
[1] J. Linsley, Phys. Rev. Lett., 10, 146 (1963)
[2] G. Cocconi, Nuovo Cimento, 3, 1422 (1956)
[3] K. Greisen, Phys. Rev. Lett. 16, 748 (1966)
[4] G.T. Zatsepin & V.A. Kuzmin, JETP Lett. 4 78 (1966).
[5] D.J. Bird et al., Phys. Rev. Lett., 71, 3401 (1993)
[6] F. Halzen et al., Astropart. Phys., 3, 151 (1995)
[7] H. Volk & P.L. Biermann,
[8] A.M. Hillas, Ann. Rev. Astron. Astrophys., 22, 425 (1984)
[9] D.F. Torres & L.A. Anchordoqui, Rep. Prog. Phys., 67, 1663 (2004)
[10] P. Blasi, R.I. Epstein & A.V. Olinto, Ap.J., 533, L33 (2000)
[11] F. Halzen & E. Zas, Ap. J., 488, 607 (1997)
[12] E. Waxman, Ap. J., 452 1 (1995)
[13] M. Vietri, Ap. J., 453, 883 (1995)
[14] J.P. Rachen & P.L. Biermann, A&A, 272, 161 (1993)
[15] E. Boldt & P. Ghosh, MNRAS, 307, 491 (1999)
[16] C.J. Cesarsky, Nucl. Phys. B (Proc. Suppl.), 28, 51 (1992)
[17] H. Kang, D. Ryu & T.W. Jones, Ap. J., 456, 422 (1998).
[18] P. Bhattacharjee & G. Sigl, Phys. Reports, 327, 109 (2000)
[19] C.T. Hill, Nucl. Phys., b224, 469 (1983)
[20] V.S. Berezinsky& A. Vilenkin, Phys. Rev. Lett., 79, 5202 (1997)
[21] V.S. Berezinsky, M. Kahelriess & A. Vilenkin, Phys. Rev. Lett., 79, 4302 (1997)
[22] T.J. Weiler, Astropart. Phys., 11, 303 (1999)
[23] D. Fargion, B. Mele & A. Salis, Ap. J., 517, 725 (1999)
[24] R.J. Protheroe and T. Stanev, Phys. Rev. Letters, 77, 3708 (1996)
[25] J.L. Puget, F.W. Stecker & J.H. Bredekamp, Ap. J., 205, 538 (1976)
[26] V.S. Berezinsky & S.I. Grigorieva, A&A, 199, 1 (1988)
[27] P.P. Kronberg, Rep. Progr. Phys., 57, 325 (1994)
[28] T. Stanev, D. Seckel & R. Engel, Phys. Rev. D, 68:103004 (2003)
[29] P.L. Biermann et al., Nucl. Phys. B (Proc. Suppl), 87, 417 (2000)
[30] V.S. Berezinsky & G.T. Zatsepin, Phys. Lett. 28b, 423 (1969); Sov. J. Nucl. Phys. 11, 111 (1970).
[31] R. Engel, D. Seckel & T. Stanev, Phys. Rev. D64:09310 (2001)
[32] G. Farrar, Phys.Rev. Lett., 76, 4111 (1996)
[33] G. Farrar & P.L. Biermann, Phys. Rev. Lett., 81, 3579 (1998)
SLAC Summer Institute on Particle Physics (SSI04), Aug. 2-13, 2004
19L020

[34] L. Gonzalez-Mestres, Nucl. Phys. B (Proc. Suppl.), 48, 131 (1996)
[35] S. Coleman & S.L. Glashow, Phys. Lett., B405, 219 (1997); Phys. Rev. D59:116008 (1999)
[36] M. Takeda et al., Phys. Rev. Lett., 81, 1163 (1998); for updates see http://www-akeno.icrr.u-tokio.ac.jp
[37] R.U. Abbasi et al. (HiRes Collaboration), Phys. Rev. Lett., 92: 151101 (2004)
[38] T. Abu-Zayyad et al.(HiRes Collaboration), astro-ph/0208301
[39] D. De Marco, P. Blasi & A.V. Olinto, Astropart.Phys., 20, 53 (2003)2003
[40] T.K. Gaisser et al. (HiRes Collaboration) Phys. Rev. D47, 1919 (1993)
[41] D.J. Bird et al., Phys. Rev. Lett. 71, 3401 (1993)
[42] R.U. Abbasi et al. (HiRes Collaboration) astro-ph/0407622
[43] K. Shinozaki et al, Ap. J., 571. L117 (2002)
[44] M. Ave et al, Phys. Rev. Lett., 85, 2244 (2000)
[45] Y. Uchihori et al., Astropart. Phys., 13, 151 (2000)
[46] T. Stanev et al., Phys. Rev. Lett. 75, 3056 (1995)
[47] R.U. Abbasi et al. (HiRes Collaboration), Astropart. Phys., 22, 139 (2004)
[48] R.U. Abbasi et al. (HiRes Collaboration), Ap. J., 610, L73 (2004)
[49] M. Nagano & A.A. Watson, Rev. Mod. Phys. 72, 689 (2000)
[50] V.S. Berezinsky, A.Z. Gazizov & S.I. Grigorieva, astro-ph/0204357
[51] P. Blasi & D. De Marco, Astropart. Phys., 20, 559 (2004)
[52] G. Sigl, F. Miniati & T.A. Ensslin, Phys. Rev. D70:043007 (2004)
[53] H. Yoshiguchi, S. Nagataki & K. Sato, Ap. J., 592, 311 (2003)
[54] http://www.auger.org
[55] http://www-ta. icrr.u-tokyo.ac.jp
[56] http://www.euso-mission.org
[57] http://owl.gsfc.nasa.gov
SLAC Summer Institute on Particle Physics (SSI04), Aug. 2-13, 2004
20L020
Copyright © 2022 FDOKUMEN