Isolation and characterization of macromolecular protein R-Phycoerythrin from Portieria hornemannii
11
International Journal of Biological Macromolecules 55 (2013) 150–160 Contents lists available at SciVerse ScienceDirect International Journal of Biological Macromolecules jo u rn al hom epa ge: www.elsevier.com/locate/ijbiomac Isolation and characterization of macromolecular protein R-Phycoerythrin from Portieria hornemannii Namasivayam Senthilkumar a,b,∗ , Veeraperumal Suresh c , Ramar Thangam d,e , Chidambaram Kurinjimalar a , Ganapathy Kavitha a , Pitchai Murugan a , Soundarapandian Kannan d , Ramasamy Rengasamy a a Centre for Advanced Studies in Botany, University of Madras, Chennai, TN, India b Department of Botany, Ayya Nadar Janaki Ammal College, Sivakasi, TN, India c Department of Botany, Annamalai University, Annamalai Nagar, TN, India d Proteomics & Molecular Cell Physiology Lab, Department of Zoology, Bharathiar University, Coimbatore, TN, India e Department of Virology, King Institute of Preventive Medicine and Research, Chennai, TN, India a r t i c l e i n f o Article history: Received 30 October 2012 Received in revised form 17 December 2012 Accepted 19 December 2012 Available online 11 January 2013 Keywords: Portieria hornemannii R-Phycoerythrin 2-D gel electrophoresis MALDI-TOF-MS Circular dichroism spectroscopy a b s t r a c t R-Phycoerythrin (R-PE) is one of the three phycobiliproteins which are extensively used as fluorescent probes, and it is prepared from red macro-algae. This macromolecular protein has gained importance in many biotechnological applications in food science, immunodiagnostic, therapy, cosmetics, protein and cell labeling, and analytical processes. In the present investigation, R-PE was isolated and purified from a red alga Portieria hornemannii. R-PE extracted and purified through ammonium sulfate precipitation (55%) followed by Q-Sepharose column chromatography had yielded a maximum purity of 5.2%. R-PE exhibited a typical “three-peak” with absorption maxima at 499, 545 and 565 nm. CD spectrum of R- PE yielded the following secondary structure data: alpha helix (14.30%), beta helix (28.10%), turn helix (19.20%) and random coil helix (38.40%). The molecular mass of R-PE was 240 kDa under Native-PAGE. Three different subunits such as , and of 16 kDa, 21 kDa and 39 kDa were segregated under SDS- PAGE. On two dimensional gel electrophoresis, one basic and four acidic subunits were detected. Five different tryptic peptides were assigned under MALDI-TOF. The sequences of N-terminus of R-PE of 10 different amino acids are Met Lys Gln Met Trp Asp Arg Met Val Val. The preparative procedures of the R-PE extraction and purification established based on the experiments exhibit advantages and can offer a reference for R-PE preparation from other marine red macro-alga P. hornemannii. © 2013 Elsevier B.V. All rights reserved. 1. Introduction Exploration and exploitation of pristine natural resources has been a fascinating subject for the researchers across the globe dur- ing the last few decades. The primary and secondary metabolites of plant origin have been a subject of intense research. India is endowed with rich flora and fauna of diverse origin. The marine flora is versatile and diverse as that of terrestrial biodiversity. The ∼7500 km long coastline of the Indian subcontinent with a sizeable exclusive economic zone (EEZ) of 2.5 million km 2 harbors marine plants which includes macro-algae also called the “seaweeds”. ∗ Corresponding author at: CAS in Botany, University of Madras, Chennai, TN, India. Tel.: +91 9443854694; fax: +91 4144 238080. E-mail addresses: [email protected] (N. Senthilkumar), [email protected] (V. Suresh), [email protected] (R. Thangam), [email protected] (R. Rengasamy). Among the different groups of seaweeds, Rhodophyceae popularly known as “red algae” occupies a prominent place due to its versatile pigmentation called phycobiliproteins (PBPs) [1,2,30]. Commercial exploitation of marine resources has been an integral part of the economics of a developing country like India. Rhodophyceae, a class of algae, is naturally bestowed with carbohydrate and protein resources besides, resourceful pigments called phycobiliproteins which has wide applications in a variety of industries. Phycobilipro- tein comprises of Phycoerythrin (R-PE), Phycocyanin (R-PC) and Allophycocyanin (APC). While the members of Cyanophyceae pre- dominantly contain C-PC, members of the Rhodophyceae comprise of large amount of R-PE. In addition, among the Indian coasts, Gulf of Mannar are abounding in various economically important sea- weeds. However, no attempt has not been taken so far for the esti- mation and extraction of R-PE from the seaweeds of Gulf of Mannar [3]. With a view to fulfill this gap, an attempt has been made in the present study to estimate the R-PE from 10 different commonly occurring seaweeds along the coast of Kilakarai, Gulf of Mannar and 0141-8130/$ – see front matter © 2013 Elsevier B.V. All rights reserved. http://dx.doi.org/10.1016/j.ijbiomac.2012.12.039
-
Upload
independent -
Category
Documents
-
view
0 -
download
0
Transcript of Isolation and characterization of macromolecular protein R-Phycoerythrin from Portieria hornemannii

IP
NCSa
b
c
d
e
a
ARR1AA
KPR2MC
1
bioefl∼ep
I
v(
0h
International Journal of Biological Macromolecules 55 (2013) 150– 160
Contents lists available at SciVerse ScienceDirect
International Journal of Biological Macromolecules
jo u rn al hom epa ge: www.elsev ier .com/ locate / i jb iomac
solation and characterization of macromolecular protein R-Phycoerythrin fromortieria hornemannii
amasivayam Senthilkumara,b,∗, Veeraperumal Sureshc, Ramar Thangamd,e,hidambaram Kurinjimalara, Ganapathy Kavithaa, Pitchai Murugana,oundarapandian Kannand, Ramasamy Rengasamya
Centre for Advanced Studies in Botany, University of Madras, Chennai, TN, IndiaDepartment of Botany, Ayya Nadar Janaki Ammal College, Sivakasi, TN, IndiaDepartment of Botany, Annamalai University, Annamalai Nagar, TN, IndiaProteomics & Molecular Cell Physiology Lab, Department of Zoology, Bharathiar University, Coimbatore, TN, IndiaDepartment of Virology, King Institute of Preventive Medicine and Research, Chennai, TN, India
r t i c l e i n f o
rticle history:eceived 30 October 2012eceived in revised form7 December 2012ccepted 19 December 2012vailable online 11 January 2013
eywords:ortieria hornemannii-Phycoerythrin
a b s t r a c t
R-Phycoerythrin (R-PE) is one of the three phycobiliproteins which are extensively used as fluorescentprobes, and it is prepared from red macro-algae. This macromolecular protein has gained importance inmany biotechnological applications in food science, immunodiagnostic, therapy, cosmetics, protein andcell labeling, and analytical processes. In the present investigation, R-PE was isolated and purified froma red alga Portieria hornemannii. R-PE extracted and purified through ammonium sulfate precipitation(55%) followed by Q-Sepharose column chromatography had yielded a maximum purity of 5.2%. R-PEexhibited a typical “three-peak” with absorption maxima at 499, 545 and 565 nm. CD spectrum of R-PE yielded the following secondary structure data: alpha helix (14.30%), beta helix (28.10%), turn helix(19.20%) and random coil helix (38.40%). The molecular mass of R-PE was 240 kDa under Native-PAGE.
-D gel electrophoresisALDI-TOF-MS
ircular dichroism spectroscopy
Three different subunits such as �, � and � of 16 kDa, 21 kDa and 39 kDa were segregated under SDS-PAGE. On two dimensional gel electrophoresis, one basic and four acidic subunits were detected. Fivedifferent tryptic peptides were assigned under MALDI-TOF. The sequences of N-terminus of R-PE of 10different amino acids are Met Lys Gln Met Trp Asp Arg Met Val Val. The preparative procedures of theR-PE extraction and purification established based on the experiments exhibit advantages and can offera reference for R-PE preparation from other marine red macro-alga P. hornemannii.
© 2013 Elsevier B.V. All rights reserved.
. Introduction
Exploration and exploitation of pristine natural resources haseen a fascinating subject for the researchers across the globe dur-
ng the last few decades. The primary and secondary metabolitesf plant origin have been a subject of intense research. India isndowed with rich flora and fauna of diverse origin. The marineora is versatile and diverse as that of terrestrial biodiversity. The
7500 km long coastline of the Indian subcontinent with a sizeablexclusive economic zone (EEZ) of 2.5 million km2 harbors marinelants which includes macro-algae also called the “seaweeds”.∗ Corresponding author at: CAS in Botany, University of Madras, Chennai, TN,ndia. Tel.: +91 9443854694; fax: +91 4144 238080.
E-mail addresses: [email protected] (N. Senthilkumar),[email protected] (V. Suresh), [email protected]. Thangam), [email protected] (R. Rengasamy).
141-8130/$ – see front matter © 2013 Elsevier B.V. All rights reserved.ttp://dx.doi.org/10.1016/j.ijbiomac.2012.12.039
Among the different groups of seaweeds, Rhodophyceae popularlyknown as “red algae” occupies a prominent place due to its versatilepigmentation called phycobiliproteins (PBPs) [1,2,30]. Commercialexploitation of marine resources has been an integral part of theeconomics of a developing country like India. Rhodophyceae, aclass of algae, is naturally bestowed with carbohydrate and proteinresources besides, resourceful pigments called phycobiliproteinswhich has wide applications in a variety of industries. Phycobilipro-tein comprises of Phycoerythrin (R-PE), Phycocyanin (R-PC) andAllophycocyanin (APC). While the members of Cyanophyceae pre-dominantly contain C-PC, members of the Rhodophyceae compriseof large amount of R-PE. In addition, among the Indian coasts, Gulfof Mannar are abounding in various economically important sea-weeds. However, no attempt has not been taken so far for the esti-
mation and extraction of R-PE from the seaweeds of Gulf of Mannar[3]. With a view to fulfill this gap, an attempt has been made in thepresent study to estimate the R-PE from 10 different commonlyoccurring seaweeds along the coast of Kilakarai, Gulf of Mannar and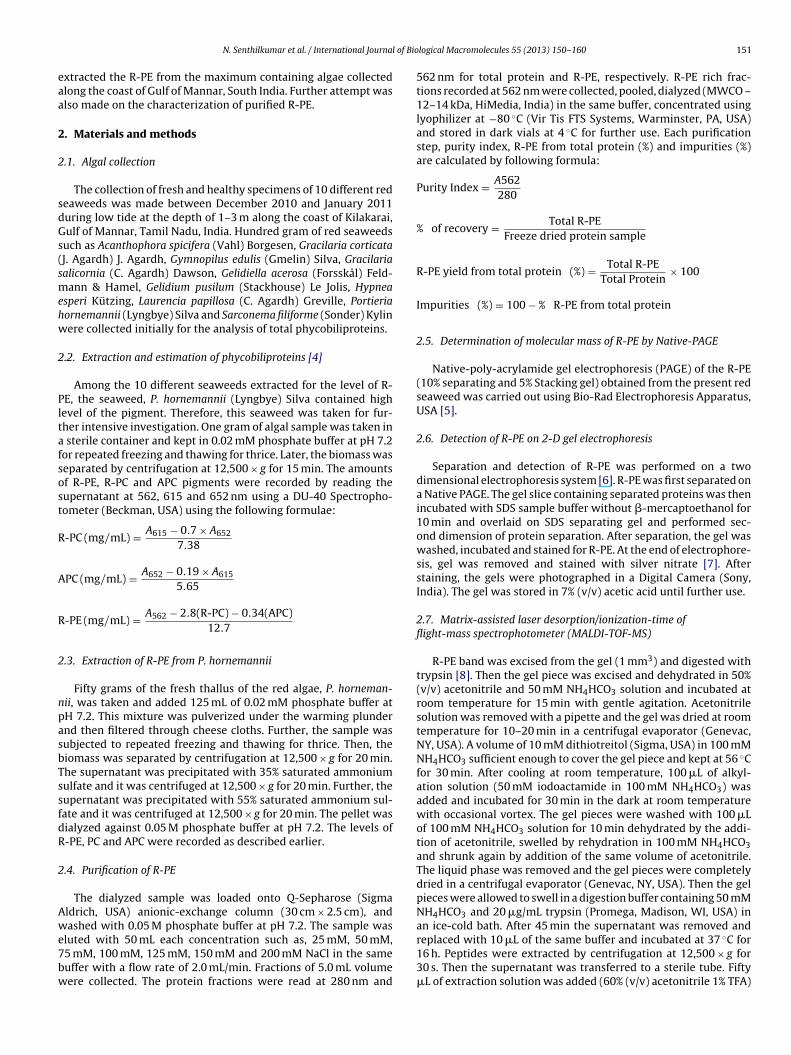
l of Bio
eaa
2
2
sdGs(smehw
2
Pltafsost
R
A
R
2
npasbTssfdR
2
Awe7bw
N. Senthilkumar et al. / International Journa
xtracted the R-PE from the maximum containing algae collectedlong the coast of Gulf of Mannar, South India. Further attempt waslso made on the characterization of purified R-PE.
. Materials and methods
.1. Algal collection
The collection of fresh and healthy specimens of 10 different redeaweeds was made between December 2010 and January 2011uring low tide at the depth of 1–3 m along the coast of Kilakarai,ulf of Mannar, Tamil Nadu, India. Hundred gram of red seaweedsuch as Acanthophora spicifera (Vahl) Borgesen, Gracilaria corticataJ. Agardh) J. Agardh, Gymnopilus edulis (Gmelin) Silva, Gracilariaalicornia (C. Agardh) Dawson, Gelidiella acerosa (Forsskål) Feld-ann & Hamel, Gelidium pusilum (Stackhouse) Le Jolis, Hypnea
speri Kützing, Laurencia papillosa (C. Agardh) Greville, Portieriaornemannii (Lyngbye) Silva and Sarconema filiforme (Sonder) Kylinere collected initially for the analysis of total phycobiliproteins.
.2. Extraction and estimation of phycobiliproteins [4]
Among the 10 different seaweeds extracted for the level of R-E, the seaweed, P. hornemannii (Lyngbye) Silva contained highevel of the pigment. Therefore, this seaweed was taken for fur-her intensive investigation. One gram of algal sample was taken in
sterile container and kept in 0.02 mM phosphate buffer at pH 7.2or repeated freezing and thawing for thrice. Later, the biomass waseparated by centrifugation at 12,500 × g for 15 min. The amountsf R-PE, R-PC and APC pigments were recorded by reading theupernatant at 562, 615 and 652 nm using a DU-40 Spectropho-ometer (Beckman, USA) using the following formulae:
-PC (mg/mL) = A615 − 0.7 × A652
7.38
PC (mg/mL) = A652 − 0.19 × A615
5.65
-PE (mg/mL) = A562 − 2.8(R-PC) − 0.34(APC)12.7
.3. Extraction of R-PE from P. hornemannii
Fifty grams of the fresh thallus of the red algae, P. horneman-ii, was taken and added 125 mL of 0.02 mM phosphate buffer atH 7.2. This mixture was pulverized under the warming plundernd then filtered through cheese cloths. Further, the sample wasubjected to repeated freezing and thawing for thrice. Then, theiomass was separated by centrifugation at 12,500 × g for 20 min.he supernatant was precipitated with 35% saturated ammoniumulfate and it was centrifuged at 12,500 × g for 20 min. Further, theupernatant was precipitated with 55% saturated ammonium sul-ate and it was centrifuged at 12,500 × g for 20 min. The pellet wasialyzed against 0.05 M phosphate buffer at pH 7.2. The levels of-PE, PC and APC were recorded as described earlier.
.4. Purification of R-PE
The dialyzed sample was loaded onto Q-Sepharose (Sigmaldrich, USA) anionic-exchange column (30 cm × 2.5 cm), andashed with 0.05 M phosphate buffer at pH 7.2. The sample was
luted with 50 mL each concentration such as, 25 mM, 50 mM,5 mM, 100 mM, 125 mM, 150 mM and 200 mM NaCl in the sameuffer with a flow rate of 2.0 mL/min. Fractions of 5.0 mL volumeere collected. The protein fractions were read at 280 nm and
logical Macromolecules 55 (2013) 150– 160 151
562 nm for total protein and R-PE, respectively. R-PE rich frac-tions recorded at 562 nm were collected, pooled, dialyzed (MWCO –12–14 kDa, HiMedia, India) in the same buffer, concentrated usinglyophilizer at −80 ◦C (Vir Tis FTS Systems, Warminster, PA, USA)and stored in dark vials at 4 ◦C for further use. Each purificationstep, purity index, R-PE from total protein (%) and impurities (%)are calculated by following formula:
Purity Index = A562280
% of recovery = Total R-PEFreeze dried protein sample
R-PE yield from total protein (%) = Total R-PETotal Protein
× 100
Impurities (%) = 100 − % R-PE from total protein
2.5. Determination of molecular mass of R-PE by Native-PAGE
Native-poly-acrylamide gel electrophoresis (PAGE) of the R-PE(10% separating and 5% Stacking gel) obtained from the present redseaweed was carried out using Bio-Rad Electrophoresis Apparatus,USA [5].
2.6. Detection of R-PE on 2-D gel electrophoresis
Separation and detection of R-PE was performed on a twodimensional electrophoresis system [6]. R-PE was first separated ona Native PAGE. The gel slice containing separated proteins was thenincubated with SDS sample buffer without �-mercaptoethanol for10 min and overlaid on SDS separating gel and performed sec-ond dimension of protein separation. After separation, the gel waswashed, incubated and stained for R-PE. At the end of electrophore-sis, gel was removed and stained with silver nitrate [7]. Afterstaining, the gels were photographed in a Digital Camera (Sony,India). The gel was stored in 7% (v/v) acetic acid until further use.
2.7. Matrix-assisted laser desorption/ionization-time offlight-mass spectrophotometer (MALDI-TOF-MS)
R-PE band was excised from the gel (1 mm3) and digested withtrypsin [8]. Then the gel piece was excised and dehydrated in 50%(v/v) acetonitrile and 50 mM NH4HCO3 solution and incubated atroom temperature for 15 min with gentle agitation. Acetonitrilesolution was removed with a pipette and the gel was dried at roomtemperature for 10–20 min in a centrifugal evaporator (Genevac,NY, USA). A volume of 10 mM dithiotreitol (Sigma, USA) in 100 mMNH4HCO3 sufficient enough to cover the gel piece and kept at 56 ◦Cfor 30 min. After cooling at room temperature, 100 �L of alkyl-ation solution (50 mM iodoactamide in 100 mM NH4HCO3) wasadded and incubated for 30 min in the dark at room temperaturewith occasional vortex. The gel pieces were washed with 100 �Lof 100 mM NH4HCO3 solution for 10 min dehydrated by the addi-tion of acetonitrile, swelled by rehydration in 100 mM NH4HCO3and shrunk again by addition of the same volume of acetonitrile.The liquid phase was removed and the gel pieces were completelydried in a centrifugal evaporator (Genevac, NY, USA). Then the gelpieces were allowed to swell in a digestion buffer containing 50 mMNH4HCO3 and 20 �g/mL trypsin (Promega, Madison, WI, USA) inan ice-cold bath. After 45 min the supernatant was removed and
replaced with 10 �L of the same buffer and incubated at 37 ◦C for16 h. Peptides were extracted by centrifugation at 12,500 × g for30 s. Then the supernatant was transferred to a sterile tube. Fifty�L of extraction solution was added (60% (v/v) acetonitrile 1% TFA)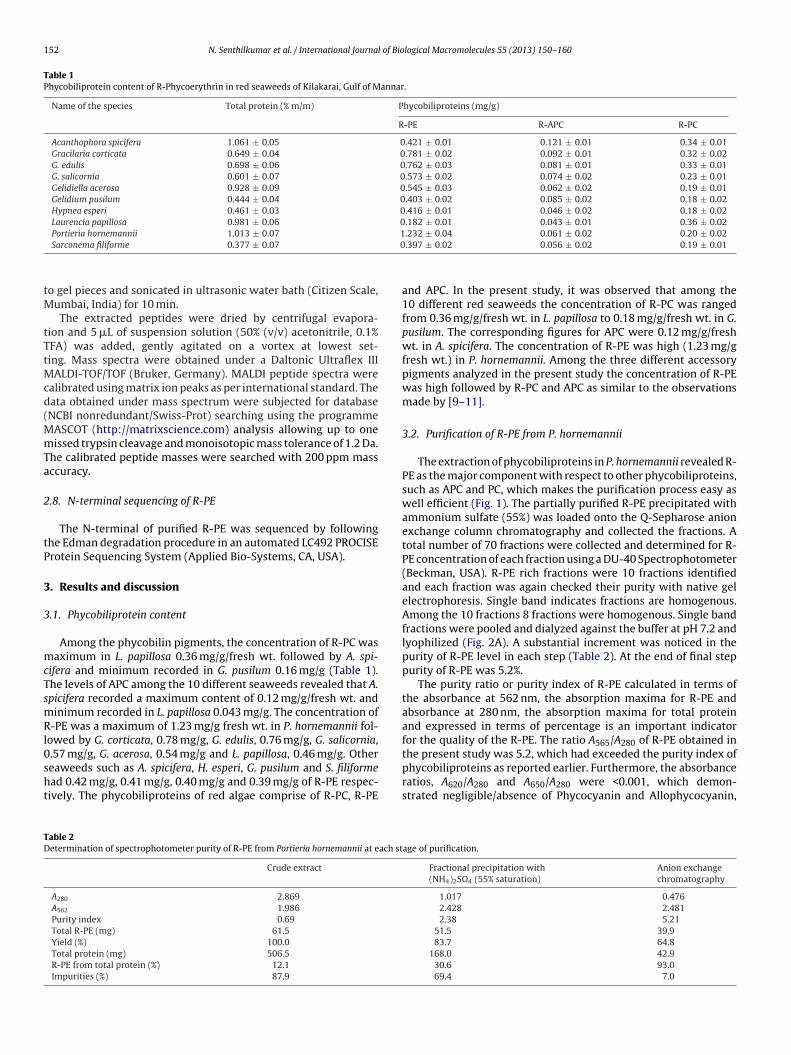
152 N. Senthilkumar et al. / International Journal of Biological Macromolecules 55 (2013) 150– 160
Table 1Phycobiliprotein content of R-Phycoerythrin in red seaweeds of Kilakarai, Gulf of Mannar.
Name of the species Total protein (% m/m) Phycobiliproteins (mg/g)
R-PE R-APC R-PC
Acanthophora spicifera 1.061 ± 0.05 0.421 ± 0.01 0.121 ± 0.01 0.34 ± 0.01Gracilaria corticata 0.649 ± 0.04 0.781 ± 0.02 0.092 ± 0.01 0.32 ± 0.02G. edulis 0.698 ± 0.06 0.762 ± 0.03 0.081 ± 0.01 0.33 ± 0.01G. salicornia 0.601 ± 0.07 0.573 ± 0.02 0.074 ± 0.02 0.23 ± 0.01Gelidiella acerosa 0.928 ± 0.09 0.545 ± 0.03 0.062 ± 0.02 0.19 ± 0.01Gelidium pusilum 0.444 ± 0.04 0.403 ± 0.02 0.085 ± 0.02 0.18 ± 0.02Hypnea esperi 0.461 ± 0.03 0.416 ± 0.01 0.046 ± 0.02 0.18 ± 0.02Laurencia papillosa 0.981 ± 0.06 0.182 ± 0.01 0.043 ± 0.01 0.36 ± 0.02
10
tM
tTtMcd(MmTa
2
tP
3
3
mcTsmRl0sht
TD
Portieria hornemannii 1.013 ± 0.07
Sarconema filiforme 0.377 ± 0.07
o gel pieces and sonicated in ultrasonic water bath (Citizen Scale,umbai, India) for 10 min.The extracted peptides were dried by centrifugal evapora-
ion and 5 �L of suspension solution (50% (v/v) acetonitrile, 0.1%FA) was added, gently agitated on a vortex at lowest set-ing. Mass spectra were obtained under a Daltonic Ultraflex III
ALDI-TOF/TOF (Bruker, Germany). MALDI peptide spectra werealibrated using matrix ion peaks as per international standard. Theata obtained under mass spectrum were subjected for databaseNCBI nonredundant/Swiss-Prot) searching using the programme
ASCOT (http://matrixscience.com) analysis allowing up to oneissed trypsin cleavage and monoisotopic mass tolerance of 1.2 Da.
he calibrated peptide masses were searched with 200 ppm massccuracy.
.8. N-terminal sequencing of R-PE
The N-terminal of purified R-PE was sequenced by followinghe Edman degradation procedure in an automated LC492 PROCISErotein Sequencing System (Applied Bio-Systems, CA, USA).
. Results and discussion
.1. Phycobiliprotein content
Among the phycobilin pigments, the concentration of R-PC wasaximum in L. papillosa 0.36 mg/g/fresh wt. followed by A. spi-
ifera and minimum recorded in G. pusilum 0.16 mg/g (Table 1).he levels of APC among the 10 different seaweeds revealed that A.picifera recorded a maximum content of 0.12 mg/g/fresh wt. andinimum recorded in L. papillosa 0.043 mg/g. The concentration of
-PE was a maximum of 1.23 mg/g fresh wt. in P. hornemannii fol-owed by G. corticata, 0.78 mg/g, G. edulis, 0.76 mg/g, G. salicornia,
.57 mg/g, G. acerosa, 0.54 mg/g and L. papillosa, 0.46 mg/g. Othereaweeds such as A. spicifera, H. esperi, G. pusilum and S. filiformead 0.42 mg/g, 0.41 mg/g, 0.40 mg/g and 0.39 mg/g of R-PE respec-ively. The phycobiliproteins of red algae comprise of R-PC, R-PEable 2etermination of spectrophotometer purity of R-PE from Portieria hornemannii at each st
Crude extract
A280 2.869
A562 1.986
Purity index 0.69
Total R-PE (mg) 61.5
Yield (%) 100.0
Total protein (mg) 506.5
R-PE from total protein (%) 12.1
Impurities (%) 87.9
.232 ± 0.04 0.061 ± 0.02 0.20 ± 0.02
.397 ± 0.02 0.056 ± 0.02 0.19 ± 0.01
and APC. In the present study, it was observed that among the10 different red seaweeds the concentration of R-PC was rangedfrom 0.36 mg/g/fresh wt. in L. papillosa to 0.18 mg/g/fresh wt. in G.pusilum. The corresponding figures for APC were 0.12 mg/g/freshwt. in A. spicifera. The concentration of R-PE was high (1.23 mg/gfresh wt.) in P. hornemannii. Among the three different accessorypigments analyzed in the present study the concentration of R-PEwas high followed by R-PC and APC as similar to the observationsmade by [9–11].
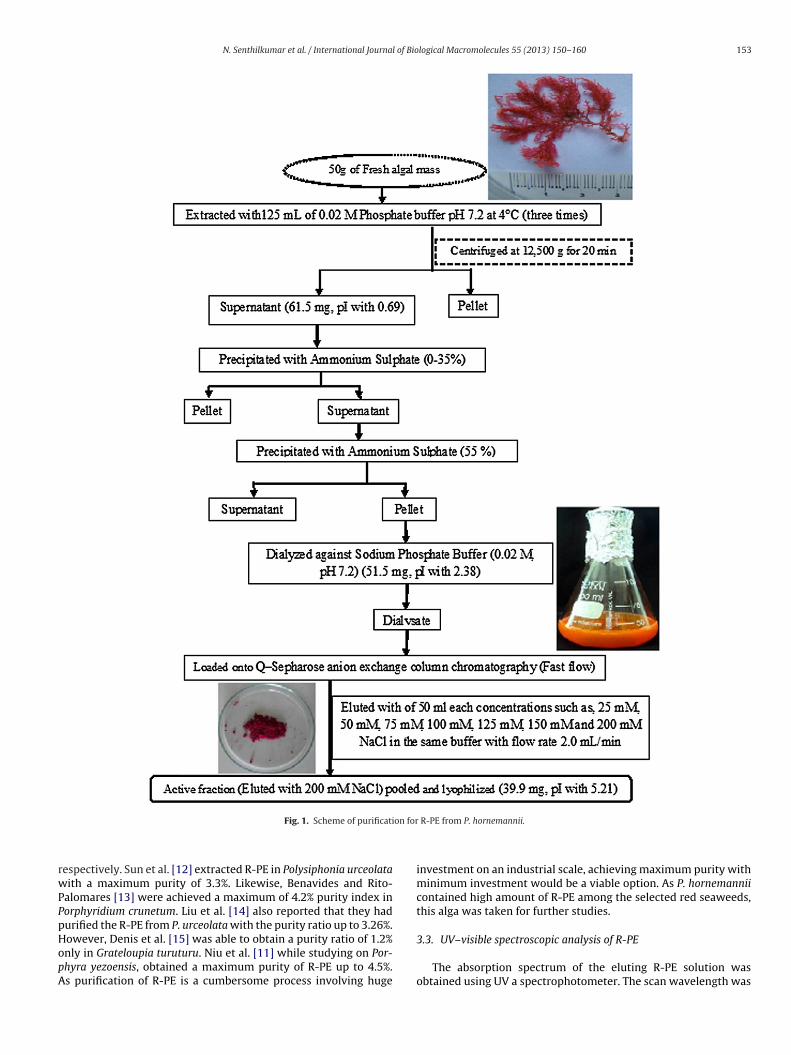
3.2. Purification of R-PE from P. hornemannii
The extraction of phycobiliproteins in P. hornemannii revealed R-PE as the major component with respect to other phycobiliproteins,such as APC and PC, which makes the purification process easy aswell efficient (Fig. 1). The partially purified R-PE precipitated withammonium sulfate (55%) was loaded onto the Q-Sepharose anionexchange column chromatography and collected the fractions. Atotal number of 70 fractions were collected and determined for R-PE concentration of each fraction using a DU-40 Spectrophotometer(Beckman, USA). R-PE rich fractions were 10 fractions identifiedand each fraction was again checked their purity with native gelelectrophoresis. Single band indicates fractions are homogenous.Among the 10 fractions 8 fractions were homogenous. Single bandfractions were pooled and dialyzed against the buffer at pH 7.2 andlyophilized (Fig. 2A). A substantial increment was noticed in thepurity of R-PE level in each step (Table 2). At the end of final steppurity of R-PE was 5.2%.
The purity ratio or purity index of R-PE calculated in terms ofthe absorbance at 562 nm, the absorption maxima for R-PE andabsorbance at 280 nm, the absorption maxima for total proteinand expressed in terms of percentage is an important indicatorfor the quality of the R-PE. The ratio A565/A280 of R-PE obtained in
the present study was 5.2, which had exceeded the purity index ofphycobiliproteins as reported earlier. Furthermore, the absorbanceratios, A620/A280 and A650/A280 were <0.001, which demon-strated negligible/absence of Phycocyanin and Allophycocyanin,age of purification.
Fractional precipitation with(NH4)2SO4 (55% saturation)
Anion exchangechromatography
1.017 0.4762.428 2.4812.38 5.21
51.5 39.983.7 64.8
168.0 42.930.6 93.069.4 7.0
N. Senthilkumar et al. / International Journal of Biological Macromolecules 55 (2013) 150– 160 153
on for
rwPPpHopA
Fig. 1. Scheme of purificati
espectively. Sun et al. [12] extracted R-PE in Polysiphonia urceolataith a maximum purity of 3.3%. Likewise, Benavides and Rito-
alomares [13] were achieved a maximum of 4.2% purity index inorphyridium crunetum. Liu et al. [14] also reported that they hadurified the R-PE from P. urceolata with the purity ratio up to 3.26%.
owever, Denis et al. [15] was able to obtain a purity ratio of 1.2%nly in Grateloupia turuturu. Niu et al. [11] while studying on Por-hyra yezoensis, obtained a maximum purity of R-PE up to 4.5%.s purification of R-PE is a cumbersome process involving hugeR-PE from P. hornemannii.
investment on an industrial scale, achieving maximum purity withminimum investment would be a viable option. As P. hornemanniicontained high amount of R-PE among the selected red seaweeds,this alga was taken for further studies.
3.3. UV–visible spectroscopic analysis of R-PE
The absorption spectrum of the eluting R-PE solution wasobtained using UV a spectrophotometer. The scan wavelength was
154 N. Senthilkumar et al. / International Journal of Biological Macromolecules 55 (2013) 150– 160
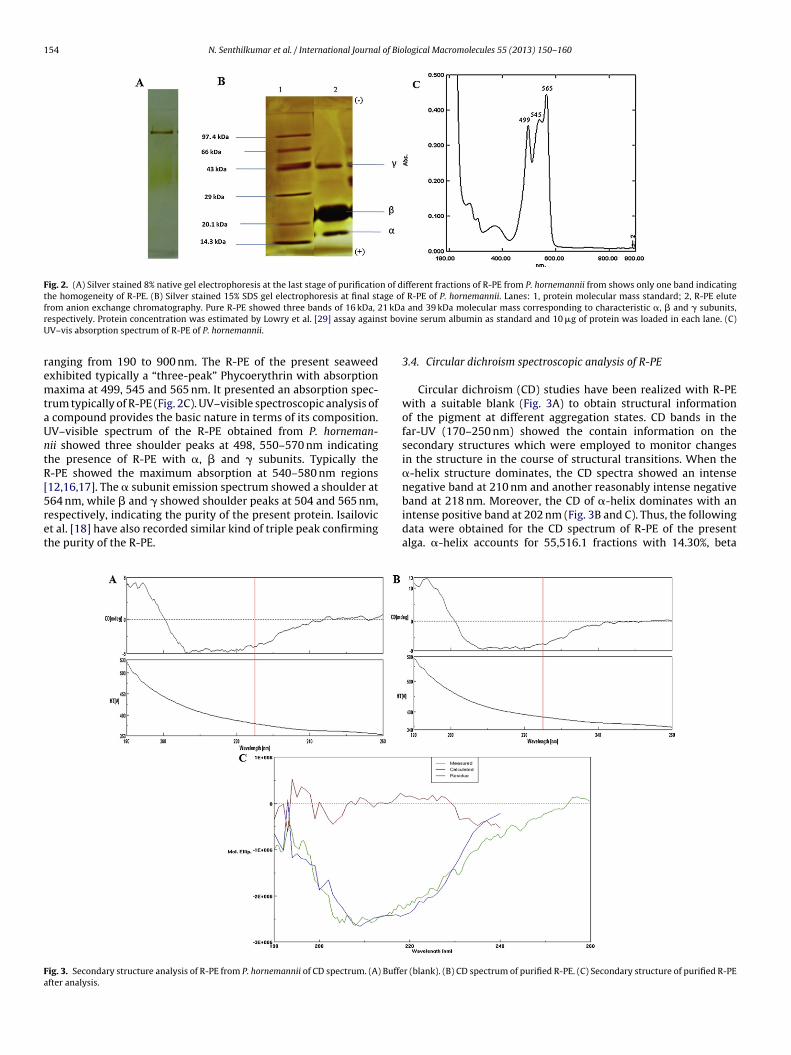
Fig. 2. (A) Silver stained 8% native gel electrophoresis at the last stage of purification of different fractions of R-PE from P. hornemannii from shows only one band indicatingthe homogeneity of R-PE. (B) Silver stained 15% SDS gel electrophoresis at final stage of R-PE of P. hornemannii. Lanes: 1, protein molecular mass standard; 2, R-PE elutef 1 kDar st bovU
remtaUntR[5ret
Fa
rom anion exchange chromatography. Pure R-PE showed three bands of 16 kDa, 2espectively. Protein concentration was estimated by Lowry et al. [29] assay againV–vis absorption spectrum of R-PE of P. hornemannii.
anging from 190 to 900 nm. The R-PE of the present seaweedxhibited typically a “three-peak” Phycoerythrin with absorptionaxima at 499, 545 and 565 nm. It presented an absorption spec-
rum typically of R-PE (Fig. 2C). UV–visible spectroscopic analysis of compound provides the basic nature in terms of its composition.V–visible spectrum of the R-PE obtained from P. horneman-ii showed three shoulder peaks at 498, 550–570 nm indicatinghe presence of R-PE with �, � and � subunits. Typically the-PE showed the maximum absorption at 540–580 nm regions12,16,17]. The � subunit emission spectrum showed a shoulder at
64 nm, while � and � showed shoulder peaks at 504 and 565 nm,espectively, indicating the purity of the present protein. Isailovict al. [18] have also recorded similar kind of triple peak confirminghe purity of the R-PE.ig. 3. Secondary structure analysis of R-PE from P. hornemannii of CD spectrum. (A) Buffefter analysis.
and 39 kDa molecular mass corresponding to characteristic �, � and � subunits,ine serum albumin as standard and 10 �g of protein was loaded in each lane. (C)
3.4. Circular dichroism spectroscopic analysis of R-PE
Circular dichroism (CD) studies have been realized with R-PEwith a suitable blank (Fig. 3A) to obtain structural informationof the pigment at different aggregation states. CD bands in thefar-UV (170–250 nm) showed the contain information on thesecondary structures which were employed to monitor changesin the structure in the course of structural transitions. When the�-helix structure dominates, the CD spectra showed an intensenegative band at 210 nm and another reasonably intense negative
band at 218 nm. Moreover, the CD of �-helix dominates with anintense positive band at 202 nm (Fig. 3B and C). Thus, the followingdata were obtained for the CD spectrum of R-PE of the presentalga. �-helix accounts for 55,516.1 fractions with 14.30%, betar (blank). (B) CD spectrum of purified R-PE. (C) Secondary structure of purified R-PE
N. Senthilkumar et al. / International Journal of Bio
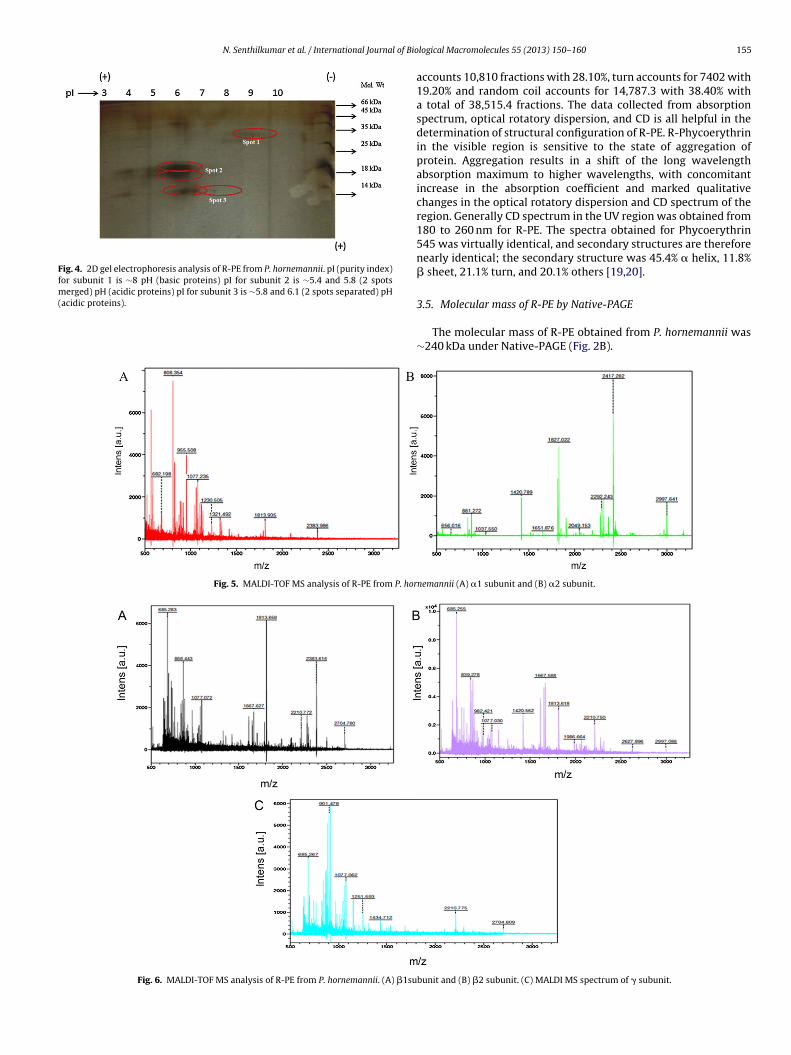
Fig. 4. 2D gel electrophoresis analysis of R-PE from P. hornemannii. pI (purity index)for subunit 1 is ∼8 pH (basic proteins) pI for subunit 2 is ∼5.4 and 5.8 (2 spotsmerged) pH (acidic proteins) pI for subunit 3 is ∼5.8 and 6.1 (2 spots separated) pH(
acidic proteins).Fig. 5. MALDI-TOF MS analysis of R-PE from P. hor
Fig. 6. MALDI-TOF MS analysis of R-PE from P. hornemannii. (A) �1su
logical Macromolecules 55 (2013) 150– 160 155
accounts 10,810 fractions with 28.10%, turn accounts for 7402 with19.20% and random coil accounts for 14,787.3 with 38.40% witha total of 38,515.4 fractions. The data collected from absorptionspectrum, optical rotatory dispersion, and CD is all helpful in thedetermination of structural configuration of R-PE. R-Phycoerythrinin the visible region is sensitive to the state of aggregation ofprotein. Aggregation results in a shift of the long wavelengthabsorption maximum to higher wavelengths, with concomitantincrease in the absorption coefficient and marked qualitativechanges in the optical rotatory dispersion and CD spectrum of theregion. Generally CD spectrum in the UV region was obtained from180 to 260 nm for R-PE. The spectra obtained for Phycoerythrin545 was virtually identical, and secondary structures are thereforenearly identical; the secondary structure was 45.4% � helix, 11.8%� sheet, 21.1% turn, and 20.1% others [19,20].
3.5. Molecular mass of R-PE by Native-PAGE
The molecular mass of R-PE obtained from P. hornemannii was∼240 kDa under Native-PAGE (Fig. 2B).
nemannii (A) �1 subunit and (B) �2 subunit.
bunit and (B) �2 subunit. (C) MALDI MS spectrum of � subunit.
156 N. Senthilkumar et al. / International Journal of Biological Macromolecules 55 (2013) 150– 160
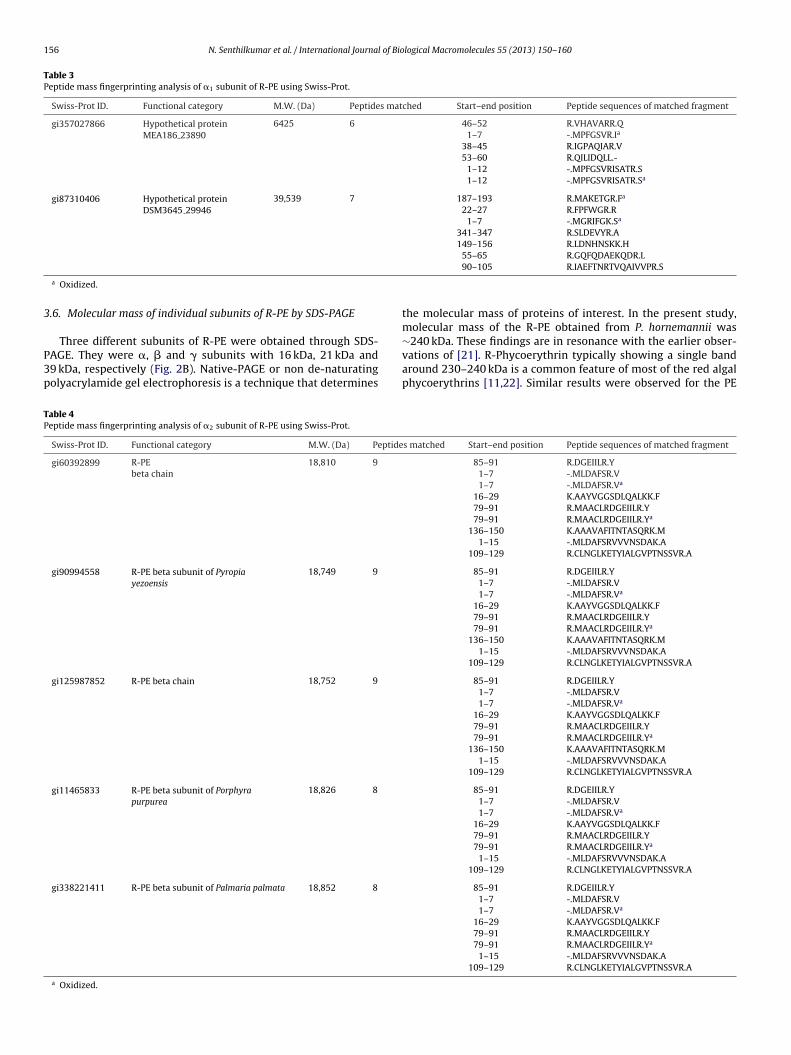
Table 3Peptide mass fingerprinting analysis of �1 subunit of R-PE using Swiss-Prot.
Swiss-Prot ID. Functional category M.W. (Da) Peptides matched Start–end position Peptide sequences of matched fragment
gi357027866 Hypothetical proteinMEA186 23890
6425 6 46–52 R.VHAVARR.Q1–7 -.MPFGSVR.Ia
38–45 R.IGPAQIAR.V53–60 R.QILIDQLL.-
1–12 -.MPFGSVRISATR.S1–12 -.MPFGSVRISATR.Sa
gi87310406 Hypothetical proteinDSM3645 29946
39,539 7 187–193 R.MAKETGR.Fa
22–27 R.FPFWGR.R1–7 -.MGRIFGK.Sa
341–347 R.SLDEVYR.A149–156 R.LDNHNSKK.H
3
P3p
TP
a Oxidized.
.6. Molecular mass of individual subunits of R-PE by SDS-PAGE
Three different subunits of R-PE were obtained through SDS-AGE. They were �, � and � subunits with 16 kDa, 21 kDa and9 kDa, respectively (Fig. 2B). Native-PAGE or non de-naturatingolyacrylamide gel electrophoresis is a technique that determines
able 4eptide mass fingerprinting analysis of �2 subunit of R-PE using Swiss-Prot.
Swiss-Prot ID. Functional category M.W. (Da) Peptide
gi60392899 R-PEbeta chain
18,810 9
gi90994558 R-PE beta subunit of Pyropiayezoensis
18,749 9
gi125987852 R-PE beta chain 18,752 9
gi11465833 R-PE beta subunit of Porphyrapurpurea
18,826 8
gi338221411 R-PE beta subunit of Palmaria palmata 18,852 8
a Oxidized.
55–65 R.GQFQDAEKQDR.L90–105 R.IAEFTNRTVQAIVVPR.S
the molecular mass of proteins of interest. In the present study,molecular mass of the R-PE obtained from P. hornemannii was
∼240 kDa. These findings are in resonance with the earlier obser-vations of [21]. R-Phycoerythrin typically showing a single bandaround 230–240 kDa is a common feature of most of the red algalphycoerythrins [11,22]. Similar results were observed for the PEs matched Start–end position Peptide sequences of matched fragment
85–91 R.DGEIILR.Y1–7 -.MLDAFSR.V1–7 -.MLDAFSR.Va
16–29 K.AAYVGGSDLQALKK.F79–91 R.MAACLRDGEIILR.Y79–91 R.MAACLRDGEIILR.Ya
136–150 K.AAAVAFITNTASQRK.M1–15 -.MLDAFSRVVVNSDAK.A
109–129 R.CLNGLKETYIALGVPTNSSVR.A
85–91 R.DGEIILR.Y1–7 -.MLDAFSR.V1–7 -.MLDAFSR.Va
16–29 K.AAYVGGSDLQALKK.F79–91 R.MAACLRDGEIILR.Y79–91 R.MAACLRDGEIILR.Ya
136–150 K.AAAVAFITNTASQRK.M1–15 -.MLDAFSRVVVNSDAK.A
109–129 R.CLNGLKETYIALGVPTNSSVR.A
85–91 R.DGEIILR.Y1–7 -.MLDAFSR.V1–7 -.MLDAFSR.Va
16–29 K.AAYVGGSDLQALKK.F79–91 R.MAACLRDGEIILR.Y79–91 R.MAACLRDGEIILR.Ya
136–150 K.AAAVAFITNTASQRK.M1–15 -.MLDAFSRVVVNSDAK.A
109–129 R.CLNGLKETYIALGVPTNSSVR.A
85–91 R.DGEIILR.Y1–7 -.MLDAFSR.V1–7 -.MLDAFSR.Va
16–29 K.AAYVGGSDLQALKK.F79–91 R.MAACLRDGEIILR.Y79–91 R.MAACLRDGEIILR.Ya
1–15 -.MLDAFSRVVVNSDAK.A109–129 R.CLNGLKETYIALGVPTNSSVR.A
85–91 R.DGEIILR.Y1–7 -.MLDAFSR.V1–7 -.MLDAFSR.Va
16–29 K.AAYVGGSDLQALKK.F79–91 R.MAACLRDGEIILR.Y79–91 R.MAACLRDGEIILR.Ya
1–15 -.MLDAFSRVVVNSDAK.A109–129 R.CLNGLKETYIALGVPTNSSVR.A
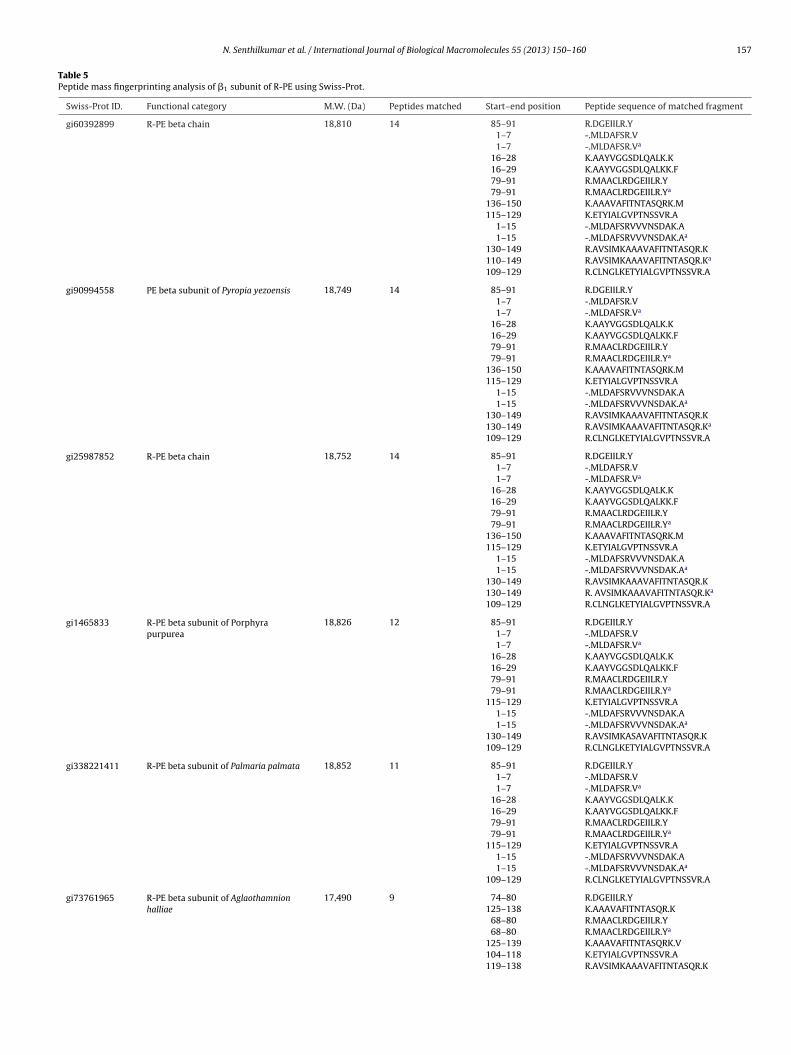
N. Senthilkumar et al. / International Journal of Biological Macromolecules 55 (2013) 150– 160 157
Table 5Peptide mass fingerprinting analysis of �1 subunit of R-PE using Swiss-Prot.
Swiss-Prot ID. Functional category M.W. (Da) Peptides matched Start–end position Peptide sequence of matched fragment
gi60392899 R-PE beta chain 18,810 14 85–91 R.DGEIILR.Y1–7 -.MLDAFSR.V1–7 -.MLDAFSR.Va
16–28 K.AAYVGGSDLQALK.K16–29 K.AAYVGGSDLQALKK.F79–91 R.MAACLRDGEIILR.Y79–91 R.MAACLRDGEIILR.Ya
136–150 K.AAAVAFITNTASQRK.M115–129 K.ETYIALGVPTNSSVR.A
1–15 -.MLDAFSRVVVNSDAK.A1–15 -.MLDAFSRVVVNSDAK.Aa
130–149 R.AVSIMKAAAVAFITNTASQR.K110–149 R.AVSIMKAAAVAFITNTASQR.Ka
109–129 R.CLNGLKETYIALGVPTNSSVR.A
gi90994558 PE beta subunit of Pyropia yezoensis 18,749 14 85–91 R.DGEIILR.Y1–7 -.MLDAFSR.V1–7 -.MLDAFSR.Va
16–28 K.AAYVGGSDLQALK.K16–29 K.AAYVGGSDLQALKK.F79–91 R.MAACLRDGEIILR.Y79–91 R.MAACLRDGEIILR.Ya
136–150 K.AAAVAFITNTASQRK.M115–129 K.ETYIALGVPTNSSVR.A
1–15 -.MLDAFSRVVVNSDAK.A1–15 -.MLDAFSRVVVNSDAK.Aa
130–149 R.AVSIMKAAAVAFITNTASQR.K130–149 R.AVSIMKAAAVAFITNTASQR.Ka
109–129 R.CLNGLKETYIALGVPTNSSVR.A
gi25987852 R-PE beta chain 18,752 14 85–91 R.DGEIILR.Y1–7 -.MLDAFSR.V1–7 -.MLDAFSR.Va
16–28 K.AAYVGGSDLQALK.K16–29 K.AAYVGGSDLQALKK.F79–91 R.MAACLRDGEIILR.Y79–91 R.MAACLRDGEIILR.Ya
136–150 K.AAAVAFITNTASQRK.M115–129 K.ETYIALGVPTNSSVR.A
1–15 -.MLDAFSRVVVNSDAK.A1–15 -.MLDAFSRVVVNSDAK.Aa
130–149 R.AVSIMKAAAVAFITNTASQR.K130–149 R. AVSIMKAAAVAFITNTASQR.Ka
109–129 R.CLNGLKETYIALGVPTNSSVR.A
gi1465833 R-PE beta subunit of Porphyrapurpurea
18,826 12 85–91 R.DGEIILR.Y1–7 -.MLDAFSR.V1–7 -.MLDAFSR.Va
16–28 K.AAYVGGSDLQALK.K16–29 K.AAYVGGSDLQALKK.F79–91 R.MAACLRDGEIILR.Y79–91 R.MAACLRDGEIILR.Ya
115–129 K.ETYIALGVPTNSSVR.A1–15 -.MLDAFSRVVVNSDAK.A1–15 -.MLDAFSRVVVNSDAK.Aa
130–149 R.AVSIMKASAVAFITNTASQR.K109–129 R.CLNGLKETYIALGVPTNSSVR.A
gi338221411 R-PE beta subunit of Palmaria palmata 18,852 11 85–91 R.DGEIILR.Y1–7 -.MLDAFSR.V1–7 -.MLDAFSR.Va
16–28 K.AAYVGGSDLQALK.K16–29 K.AAYVGGSDLQALKK.F79–91 R.MAACLRDGEIILR.Y79–91 R.MAACLRDGEIILR.Ya
115–129 K.ETYIALGVPTNSSVR.A1–15 -.MLDAFSRVVVNSDAK.A1–15 -.MLDAFSRVVVNSDAK.Aa
109–129 R.CLNGLKETYIALGVPTNSSVR.A
gi73761965 R-PE beta subunit of Aglaothamnionhalliae
17,490 9 74–80 R.DGEIILR.Y125–138 K.AAAVAFITNTASQR.K
68–80 R.MAACLRDGEIILR.Y68–80 R.MAACLRDGEIILR.Ya
125–139 K.AAAVAFITNTASQRK.V104–118 K.ETYIALGVPTNSSVR.A119–138 R.AVSIMKAAAVAFITNTASQR.K

158 N. Senthilkumar et al. / International Journal of Biological Macromolecules 55 (2013) 150– 160
Table 5 (Continued )
Swiss-Prot ID. Functional category M.W. (Da) Peptides matched Start–end position Peptide sequence of matched fragment
119–138 R.AVSIMKAAAVAFITNTASQR.Ka
98–118 R.CLNGLKETYIALGVPTNSSVR.A
gi9082272 R-PE beta subunit of Gracilarialemaneiformis
18,994 10 85–91 R.DGEIILR.Y1–7 -.MLDAFSR.V1–7 -.MLDAFSR.Va
16–28 K.AAYVGGSDLQALK.T79–91 R.MAACLRDGEIILR.Y79–91 R.MAACLRDGEIILR.Ya
115–129 K.ETYIALGVPTNSSVR.A1–15 -.MLDAFSRVVVNSDAK.A1–15 -.MLDAFSRVVVNSDAK.Aa
109–129 R.CLNGLKETYIALGVPTNSSVR.A
gi21314462 R-PE beta subunit of Corallinaofficinalis
18,950 9 85–91 R.DGEIILR.Y1–7 -.MLDAFSR.V1–7 -.MLDAFSR.Va
16–28 K.AAYVGGSDLQALK.K16–29 K.AAYVGGSDLQALKK.F79–91 R.MAACLRDGEIILR.Y79–91 R.MAACLRDGEIILR.Ya
115–129 K.ETYIALGVPTNSSVR.A109–129 R.CLNGLKETYIALGVPTNSSVR.A
a Oxidized.
TP
able 6eptide mass fingerprinting analysis of �2 subunit of R-PE using Swiss-Prot.
Swiss-Prot ID. Functional category M.W. (Da) Peptide
PHEB PORHA R-PE beta chain of Porphyrahaitanensis
18,810 10
PHEB PORPU R-PE beta chain of Porphyra purpurea 18,826 10
PHEB PORTE R-PE beta chain of Porphyra tenera 18,810 10
PHEB PORYE R-PE beta chain of Porphyra yezoensis 18,752 10
a Oxidized.
s matched Start–end position Peptide sequence of matched fragment
1–7 -.MLDAFSR.V1–7 -.MLDAFSR.Va
16–28 K.AAYVGGSDLQALK.K136–148 K.AAAVAFITNTASQR.K115–129 K.ETYIALGVPTNSSVR.A
1–15 -.MLDAFSRVVVNSDAK.A1–15 -.MLDAFSRVVVNSDAK.Aa
130–149 R.AVSIMKAAAVAFITNTASQR.Ka
8–28 R.VVVNSDAKAAYVGGSDLQALK.K109–129 R.CLNGLKETYIALGVPTNSSVR.A
1–7 -.MLDAFSR.V1–7 -.MLDAFSR.Va
16–28 K.AAYVGGSDLQALK.K16–29 K.AAYVGGSDLQALKK.F
115–129 K.ETYIALGVPTNSSVR.A1–15 -.MLDAFSRVVVNSDAK.A1–15 -.MLDAFSRVVVNSDAK.Aa
130–149 R.AVSIMKASAVAFITNTASQR.K8–28 R.VVVNSDAKAAYVGGSDLQALK.K
109–129 R.CLNGLKETYIALGVPTNSSVR.A
1–7 -.MLDAFSR.V1–7 -.MLDAFSR.Va
16–28 K.AAYVGGSDLQALK.K136–149 K.AAAVAFITNTASQR.K115–129 K.ETYIALGVPTNSSVR.A
1–15 -.MLDAFSRVVVNSDAK.A1–15 -.MLDAFSRVVVNSDAK.Aa
130–149 R.AVSIMKAAAVAFITNTASQR.Ka
8–28 R.VVVNSDAKAAYVGGSDLQALK.K109–129 R.CLNGLKETYIALGVPTNSSVR.A
1–7 -.MLDAFSR.V1–7 -.MLDAFSR.V
16–28 K.AAYVGGSDLQALK.K136–149 K.AAAVAFITNTASQR.K115–129 K.ETYIALGVPTNSSVR.A
1–15 -.MLDAFSRVVVNSDAK.A1–15 -.MLDAFSRVVVNSDAK.Aa
130–149 R.AVSIMKAAAVAFITNTASQR.Ka
8–28 R.VVVNSDAKAAYVGGSDLQALK.K109–129 R.CLNGLKETYIALGVPTNSSVR.A
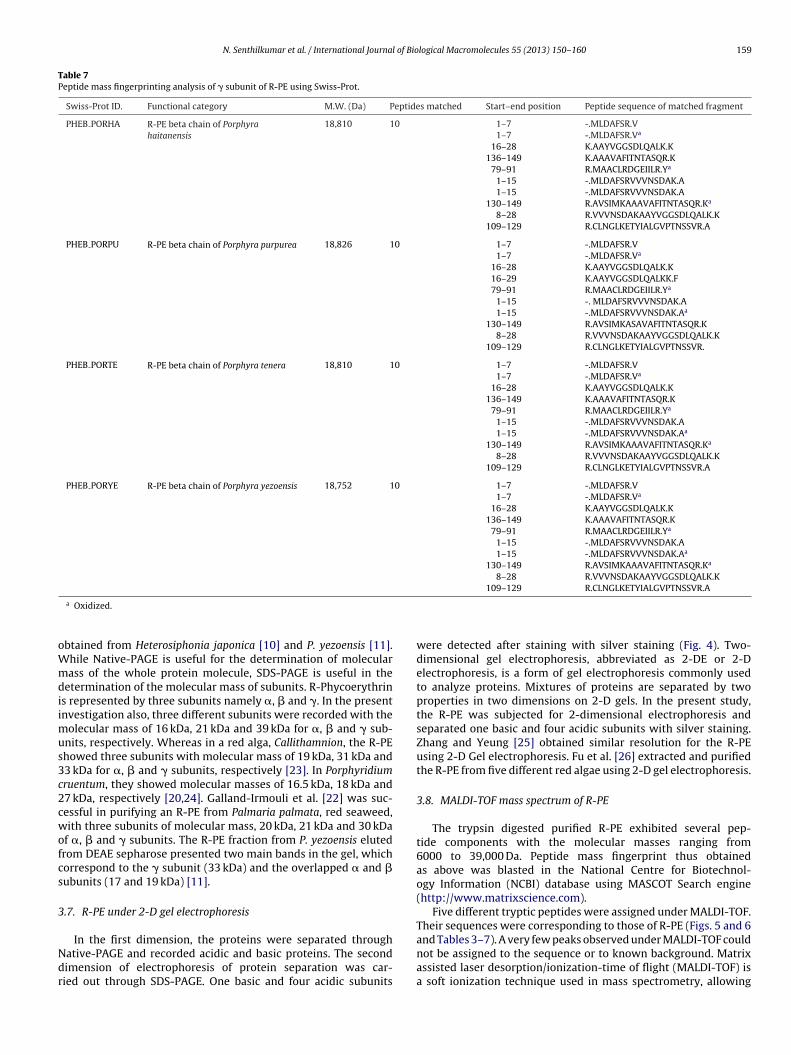
N. Senthilkumar et al. / International Journal of Biological Macromolecules 55 (2013) 150– 160 159
Table 7Peptide mass fingerprinting analysis of � subunit of R-PE using Swiss-Prot.
Swiss-Prot ID. Functional category M.W. (Da) Peptides matched Start–end position Peptide sequence of matched fragment
PHEB PORHA R-PE beta chain of Porphyrahaitanensis
18,810 10 1–7 -.MLDAFSR.V1–7 -.MLDAFSR.Va
16–28 K.AAYVGGSDLQALK.K136–149 K.AAAVAFITNTASQR.K
79–91 R.MAACLRDGEIILR.Ya
1–15 -.MLDAFSRVVVNSDAK.A1–15 -.MLDAFSRVVVNSDAK.A
130–149 R.AVSIMKAAAVAFITNTASQR.Ka
8–28 R.VVVNSDAKAAYVGGSDLQALK.K109–129 R.CLNGLKETYIALGVPTNSSVR.A
PHEB PORPU R-PE beta chain of Porphyra purpurea 18,826 10 1–7 -.MLDAFSR.V1–7 -.MLDAFSR.Va
16–28 K.AAYVGGSDLQALK.K16–29 K.AAYVGGSDLQALKK.F79–91 R.MAACLRDGEIILR.Ya
1–15 -. MLDAFSRVVVNSDAK.A1–15 -.MLDAFSRVVVNSDAK.Aa
130–149 R.AVSIMKASAVAFITNTASQR.K8–28 R.VVVNSDAKAAYVGGSDLQALK.K
109–129 R.CLNGLKETYIALGVPTNSSVR.
PHEB PORTE R-PE beta chain of Porphyra tenera 18,810 10 1–7 -.MLDAFSR.V1–7 -.MLDAFSR.Va
16–28 K.AAYVGGSDLQALK.K136–149 K.AAAVAFITNTASQR.K
79–91 R.MAACLRDGEIILR.Ya
1–15 -.MLDAFSRVVVNSDAK.A1–15 -.MLDAFSRVVVNSDAK.Aa
130–149 R.AVSIMKAAAVAFITNTASQR.Ka
8–28 R.VVVNSDAKAAYVGGSDLQALK.K109–129 R.CLNGLKETYIALGVPTNSSVR.A
PHEB PORYE R-PE beta chain of Porphyra yezoensis 18,752 10 1–7 -.MLDAFSR.V1–7 -.MLDAFSR.Va
16–28 K.AAYVGGSDLQALK.K136–149 K.AAAVAFITNTASQR.K
79–91 R.MAACLRDGEIILR.Ya
1–15 -.MLDAFSRVVVNSDAK.A1–15 -.MLDAFSRVVVNSDAK.Aa
130–149 R.AVSIMKAAAVAFITNTASQR.Ka
8–28 R.VVVNSDAKAAYVGGSDLQALK.K
oWmdiimus3c2cwofcs
3
Ndr
a Oxidized.
btained from Heterosiphonia japonica [10] and P. yezoensis [11].hile Native-PAGE is useful for the determination of molecularass of the whole protein molecule, SDS-PAGE is useful in the
etermination of the molecular mass of subunits. R-Phycoerythrins represented by three subunits namely �, � and �. In the presentnvestigation also, three different subunits were recorded with the
olecular mass of 16 kDa, 21 kDa and 39 kDa for �, � and � sub-nits, respectively. Whereas in a red alga, Callithamnion, the R-PEhowed three subunits with molecular mass of 19 kDa, 31 kDa and3 kDa for �, � and � subunits, respectively [23]. In Porphyridiumruentum, they showed molecular masses of 16.5 kDa, 18 kDa and7 kDa, respectively [20,24]. Galland-Irmouli et al. [22] was suc-essful in purifying an R-PE from Palmaria palmata, red seaweed,ith three subunits of molecular mass, 20 kDa, 21 kDa and 30 kDa
f �, � and � subunits. The R-PE fraction from P. yezoensis elutedrom DEAE sepharose presented two main bands in the gel, whichorrespond to the � subunit (33 kDa) and the overlapped � and �ubunits (17 and 19 kDa) [11].
.7. R-PE under 2-D gel electrophoresis
In the first dimension, the proteins were separated throughative-PAGE and recorded acidic and basic proteins. The secondimension of electrophoresis of protein separation was car-ied out through SDS-PAGE. One basic and four acidic subunits
109–129 R.CLNGLKETYIALGVPTNSSVR.A
were detected after staining with silver staining (Fig. 4). Two-dimensional gel electrophoresis, abbreviated as 2-DE or 2-Delectrophoresis, is a form of gel electrophoresis commonly usedto analyze proteins. Mixtures of proteins are separated by twoproperties in two dimensions on 2-D gels. In the present study,the R-PE was subjected for 2-dimensional electrophoresis andseparated one basic and four acidic subunits with silver staining.Zhang and Yeung [25] obtained similar resolution for the R-PEusing 2-D Gel electrophoresis. Fu et al. [26] extracted and purifiedthe R-PE from five different red algae using 2-D gel electrophoresis.
3.8. MALDI-TOF mass spectrum of R-PE
The trypsin digested purified R-PE exhibited several pep-tide components with the molecular masses ranging from6000 to 39,000 Da. Peptide mass fingerprint thus obtainedas above was blasted in the National Centre for Biotechnol-ogy Information (NCBI) database using MASCOT Search engine(http://www.matrixscience.com).
Five different tryptic peptides were assigned under MALDI-TOF.Their sequences were corresponding to those of R-PE (Figs. 5 and 6
and Tables 3–7). A very few peaks observed under MALDI-TOF couldnot be assigned to the sequence or to known background. Matrixassisted laser desorption/ionization-time of flight (MALDI-TOF) isa soft ionization technique used in mass spectrometry, allowing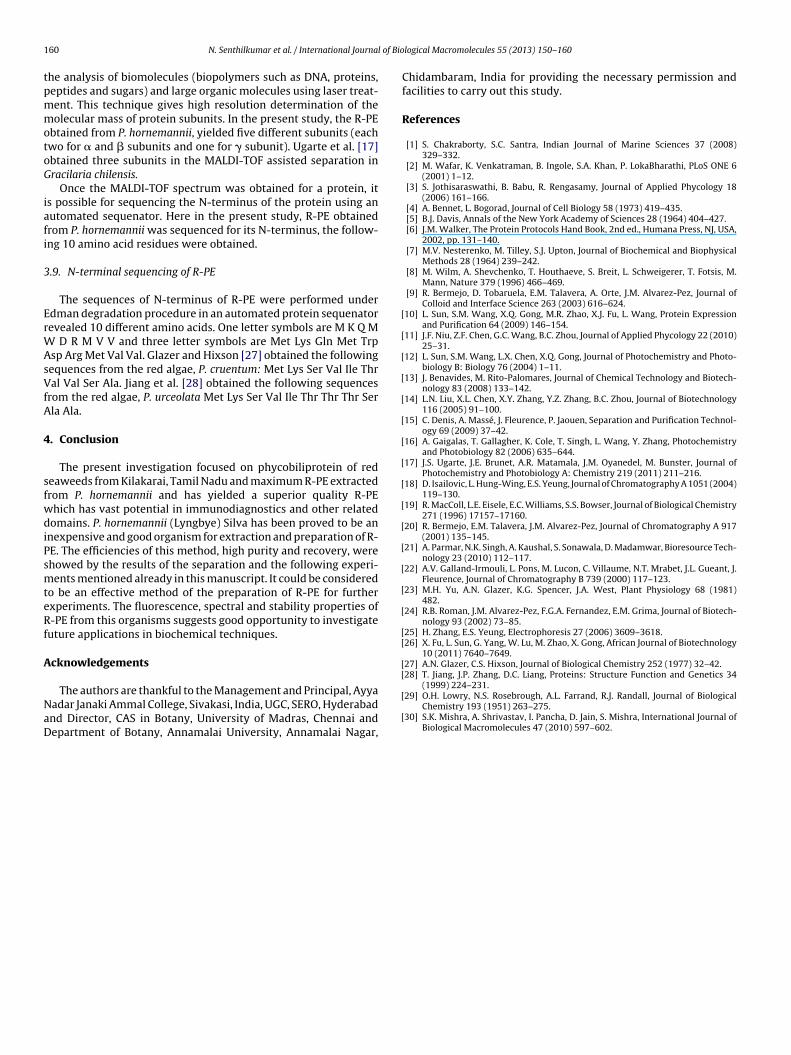
1 l of Bio
tpmmotoG
iafi
3
ErWAsVfA
4
sfwdiPsmteRf
A
NaD
[
[
[
[
[
[
[
[
[
[
[
[
[
[
[
[[
[[
(1999) 224–231.
60 N. Senthilkumar et al. / International Journa
he analysis of biomolecules (biopolymers such as DNA, proteins,eptides and sugars) and large organic molecules using laser treat-ent. This technique gives high resolution determination of theolecular mass of protein subunits. In the present study, the R-PE
btained from P. hornemannii, yielded five different subunits (eachwo for � and � subunits and one for � subunit). Ugarte et al. [17]btained three subunits in the MALDI-TOF assisted separation inracilaria chilensis.
Once the MALDI-TOF spectrum was obtained for a protein, its possible for sequencing the N-terminus of the protein using anutomated sequenator. Here in the present study, R-PE obtainedrom P. hornemannii was sequenced for its N-terminus, the follow-ng 10 amino acid residues were obtained.
.9. N-terminal sequencing of R-PE
The sequences of N-terminus of R-PE were performed underdman degradation procedure in an automated protein sequenatorevealed 10 different amino acids. One letter symbols are M K Q M
D R M V V and three letter symbols are Met Lys Gln Met Trpsp Arg Met Val Val. Glazer and Hixson [27] obtained the followingequences from the red algae, P. cruentum: Met Lys Ser Val Ile Thral Val Ser Ala. Jiang et al. [28] obtained the following sequences
rom the red algae, P. urceolata Met Lys Ser Val Ile Thr Thr Thr Serla Ala.
. Conclusion
The present investigation focused on phycobiliprotein of redeaweeds from Kilakarai, Tamil Nadu and maximum R-PE extractedrom P. hornemannii and has yielded a superior quality R-PEhich has vast potential in immunodiagnostics and other relatedomains. P. hornemannii (Lyngbye) Silva has been proved to be an
nexpensive and good organism for extraction and preparation of R-E. The efficiencies of this method, high purity and recovery, werehowed by the results of the separation and the following experi-ents mentioned already in this manuscript. It could be considered
o be an effective method of the preparation of R-PE for furtherxperiments. The fluorescence, spectral and stability properties of-PE from this organisms suggests good opportunity to investigate
uture applications in biochemical techniques.
cknowledgements
The authors are thankful to the Management and Principal, Ayyaadar Janaki Ammal College, Sivakasi, India, UGC, SERO, Hyderabadnd Director, CAS in Botany, University of Madras, Chennai andepartment of Botany, Annamalai University, Annamalai Nagar,
[
[
logical Macromolecules 55 (2013) 150– 160
Chidambaram, India for providing the necessary permission andfacilities to carry out this study.
References
[1] S. Chakraborty, S.C. Santra, Indian Journal of Marine Sciences 37 (2008)329–332.
[2] M. Wafar, K. Venkatraman, B. Ingole, S.A. Khan, P. LokaBharathi, PLoS ONE 6(2001) 1–12.
[3] S. Jothisaraswathi, B. Babu, R. Rengasamy, Journal of Applied Phycology 18(2006) 161–166.
[4] A. Bennet, L. Bogorad, Journal of Cell Biology 58 (1973) 419–435.[5] B.J. Davis, Annals of the New York Academy of Sciences 28 (1964) 404–427.[6] J.M. Walker, The Protein Protocols Hand Book, 2nd ed., Humana Press, NJ, USA,
2002, pp. 131–140.[7] M.V. Nesterenko, M. Tilley, S.J. Upton, Journal of Biochemical and Biophysical
Methods 28 (1964) 239–242.[8] M. Wilm, A. Shevchenko, T. Houthaeve, S. Breit, L. Schweigerer, T. Fotsis, M.
Mann, Nature 379 (1996) 466–469.[9] R. Bermejo, D. Tobaruela, E.M. Talavera, A. Orte, J.M. Alvarez-Pez, Journal of
Colloid and Interface Science 263 (2003) 616–624.10] L. Sun, S.M. Wang, X.Q. Gong, M.R. Zhao, X.J. Fu, L. Wang, Protein Expression
and Purification 64 (2009) 146–154.11] J.F. Niu, Z.F. Chen, G.C. Wang, B.C. Zhou, Journal of Applied Phycology 22 (2010)
25–31.12] L. Sun, S.M. Wang, L.X. Chen, X.Q. Gong, Journal of Photochemistry and Photo-
biology B: Biology 76 (2004) 1–11.13] J. Benavides, M. Rito-Palomares, Journal of Chemical Technology and Biotech-
nology 83 (2008) 133–142.14] L.N. Liu, X.L. Chen, X.Y. Zhang, Y.Z. Zhang, B.C. Zhou, Journal of Biotechnology
116 (2005) 91–100.15] C. Denis, A. Massé, J. Fleurence, P. Jaouen, Separation and Purification Technol-
ogy 69 (2009) 37–42.16] A. Gaigalas, T. Gallagher, K. Cole, T. Singh, L. Wang, Y. Zhang, Photochemistry
and Photobiology 82 (2006) 635–644.17] J.S. Ugarte, J.E. Brunet, A.R. Matamala, J.M. Oyanedel, M. Bunster, Journal of
Photochemistry and Photobiology A: Chemistry 219 (2011) 211–216.18] D. Isailovic, L. Hung-Wing, E.S. Yeung, Journal of Chromatography A 1051 (2004)
119–130.19] R. MacColl, L.E. Eisele, E.C. Williams, S.S. Bowser, Journal of Biological Chemistry
271 (1996) 17157–17160.20] R. Bermejo, E.M. Talavera, J.M. Alvarez-Pez, Journal of Chromatography A 917
(2001) 135–145.21] A. Parmar, N.K. Singh, A. Kaushal, S. Sonawala, D. Madamwar, Bioresource Tech-
nology 23 (2010) 112–117.22] A.V. Galland-Irmouli, L. Pons, M. Lucon, C. Villaume, N.T. Mrabet, J.L. Gueant, J.
Fleurence, Journal of Chromatography B 739 (2000) 117–123.23] M.H. Yu, A.N. Glazer, K.G. Spencer, J.A. West, Plant Physiology 68 (1981)
482.24] R.B. Roman, J.M. Alvarez-Pez, F.G.A. Fernandez, E.M. Grima, Journal of Biotech-
nology 93 (2002) 73–85.25] H. Zhang, E.S. Yeung, Electrophoresis 27 (2006) 3609–3618.26] X. Fu, L. Sun, G. Yang, W. Lu, M. Zhao, X. Gong, African Journal of Biotechnology
10 (2011) 7640–7649.27] A.N. Glazer, C.S. Hixson, Journal of Biological Chemistry 252 (1977) 32–42.28] T. Jiang, J.P. Zhang, D.C. Liang, Proteins: Structure Function and Genetics 34
29] O.H. Lowry, N.S. Rosebrough, A.L. Farrand, R.J. Randall, Journal of BiologicalChemistry 193 (1951) 263–275.
30] S.K. Mishra, A. Shrivastav, I. Pancha, D. Jain, S. Mishra, International Journal ofBiological Macromolecules 47 (2010) 597–602.