Isolation and Structural Elucidation of
254
Isolation and Structural Elucidation of Bioactive Secondary Metabolites from Marine Organisms Isolierung und Strukturaufklärung von bioaktiven Sekundärmetaboliten aus marinen Organismen Inaugural-Dissertation zur Erlangung des Doktorgrades der Mathematisch-Naturwissenschaftlichen Fakultät der Heinrich-Heine-Universität Düsseldorf vorgelegt von Sherif S. E. Elsayed aus Kairo, Ägypten Düsseldorf, 2010
-
Upload
khangminh22 -
Category
Documents
-
view
0 -
download
0
Transcript of Isolation and Structural Elucidation of

IIssoollaattiioonn aanndd SSttrruuccttuurraall EElluucciiddaattiioonn ooff
BBiiooaaccttiivvee SSeeccoonnddaarryy MMeettaabboolliitteess ffrroomm
MMaarriinnee OOrrggaanniissmmss
IIssoolliieerruunngg uunndd SSttrruukkttuurraauuffkklläärruunngg vvoonn
bbiiooaakkttiivveenn SSeekkuunnddäärrmmeettaabboolliitteenn aauuss
mmaarriinneenn OOrrggaanniissmmeenn
IInnaauugguurraall--DDiisssseerrttaattiioonn
zzuurr
EErrllaanngguunngg ddeess DDookkttoorrggrraaddeess
ddeerr MMaatthheemmaattiisscchh--NNaattuurrwwiisssseennsscchhaaffttlliicchheenn FFaakkuullttäätt
ddeerr HHeeiinnrriicchh--HHeeiinnee--UUnniivveerrssiittäätt DDüüsssseellddoorrff
vvoorrggeelleeggtt vvoonn
SShheerriiff SS.. EE.. EEllssaayyeedd
aauuss KKaaiirroo,, ÄÄggyypptteenn
DDüüsssseellddoorrff,, 22001100

Aus dem Institut für Pharmazeutische Biologie und Biotechnologie
der Heinrich-Heine-Universität Düsseldorf
Gedruckt mit der Genehmigung der
Mathematisch-Naturwissenschaftlichen Fakultät der
Heinrich-Heine-Universität Düsseldorf
Gedruckt mit der Unterstützung der
Kulturabteilung und Studienmission der Botschaft der Arabischen Republik Ägypten
Referent: Prof. Dr. Peter Proksch
Koreferent: Dr. Wim Wätjen
Tag der mündlichen Prüfung: 16.12.2010

Erklärung
Hiermit erkläre ich ehrenwörtlich, dass ich die vorliegende Dissertation mit dem
Titel „Isolierung und Strukturaufklärung von bioaktiven Sekundärmetaboliten aus marinen
Organismen’’ selbst angefertigt habe. Außer den angegebenen Quellen und Hilfsmitteln
wurden keine weiteren verwendet. Diese Dissertation wurde weder in gleicher noch in
abgewandelter Form in einem anderen Prüfungsverfahren vorgelegt. Weiterhin erkläre ich,
dass ich früher weder akademische Grade erworben habe, noch dies versucht habe.
Düsseldorf, den 29.10.2010
Sherif Elsayed

�

Acknowledgement
Acknowledgement First and foremost thanks to the Almighty God “ALLAH” who has granted me all
these graces to fulfill this work and blessed me by His power, mercy and patience during
my life. To Him I extent my heartfelt thanks.
It is a great pleasure to get this opportunity to express my deepest appreciation and
sincere gratitude to Prof. Dr. rer. nat. Peter Proksch for setting an example to what a
sincere professor, scientist, and advisor should be. I am deeply grateful to him for giving
me this valuable chance to pursue my predoctoral research and for the excellent work
facilities at the Institute of Pharmaceutical Biology and Biotechnology, Heinrich-Heine
University, Düsseldorf. I would like to express my sincere thanks and gratitude to him for
supervising this study, suggesting the research project, his unforgettable support, his direct
guidance, his generous considerations, his admirable supervision, his fruitful discussions,
and his valuable suggestions in both work and life issues.
I would like to express my cordial thanks and all my regards to Dr. RuAngelie Edrada-
Ebel for her constructive advices, NMR courses, her help in NMR data interpretation,
supplying the echinoderm specimen as well as for hosting some HR-MS measurement by
the facility at Strathclyde Institute of Pharmacy and Biomedical Science, University of
Strathclyde, Glasgow, United Kingdom.
My special thanks to Prof. Dr. rer. nat. Werner E. G. Müller and Mrs. Renate Steffen,
Institute of Physiological Chemistry and Pathobiochemistry, University of Mainz, for
carrying out the cytotoxicity assays, Dr. Laurent Meijer, National Centre for Scientific
Research, Biological Station, Roscoff, France, and Dr. Michael Kubbutat, ProQinase
GmbH, Freiburg, Germany for conducting the protein kinase inhibition assays.
My deep thanks and gratitude to Prof. Dr. rer. nat. Wim Wätjen, Institute of
Toxicology, Heinrich-Heine University, Düsseldorf, for his guidance, conducting
cytotoxicity assays and for accepting the co-supervision.
My appreciation to the sincere collaboration of Dr. W. Peters and Mr. P. Behm,
Institute of Inorganic and Structure Chemistry, Heinrich-Heine University, Düsseldorf, for
conducting 500 MHz NMR measurements, Dr. H. Keck and Dr. P. Tommes, Institute of
Inorganic and Structure Chemistry, Heinrich-Heine University, Düsseldorf, for carrying
out EI- and FAB-MS experiments, and my cordial thanks to Dr. Victor Wray, Helmholtz
Centre for Infection Research, Braunschweig and Mrs. C. Kakoschke for 600 MHz NMR
measurements, HR-MS experiments, and his generous help and his fruitful discussions by
interpreting NMR data.
Acknowledgement
I would like to extend my deep thanks and gratitude to Dr. Nicole J. de Voogd,
National Museum of Natural History, Leiden, Netherlands, for help and support in
supplying the three sponge specimens explored in this study.
I would like to express my profound gratitude to my professors and colleagues from
the Department of Pharmacognosy and Phytochemistry, Ain-Shams University, Cairo,
Egypt, especially Prof. Dr. M. M. Al-Azizi, and Prof. Dr. A. Singab for their guidance,
supervision, their continuous encouragement, and their kind advices. To whom I owe so
much is Ass. Prof. Dr. N. A. Ayoub, Acting Head of the Department of Pharmacognosy
and Phytochemistry, Ain-Shams University, Cairo, Egypt, for her extensive efforts and
help to solve the daily problems during my master studies and her guidance and support
thereafter.
I would like to extend my thanks to my past and present colleagues and labmates Dr.
M. Abdelgawwad, Dr. M. Ashour, Dr. Tu N. Duong, Dr. S. Ortlepp, Dr. T. Hertiani, Dr. A.
Hassan, Dr. N. Weber, Dr. A. Debbab, Dr. I. D. Indriani, Dr. A. Hamed, Dr. A. Putz, Dr.
M. Bayer, Dr. E. Moustafa, Dr. S. Younes, Dr. A. Diesel, Dr. Y. Wang, Dr. F. Riebe, Dr. J.
Kjer, Dr. S. Ruhl, Dr. J. Xu, W. Döring, Y. Zhou, M. ElAmrani, W. Ebrahim, B. Lipowicz,
D. Rönsberg, A. Marmann, and all the others for the nice multicultural time I spent with
them, for their help and assistance whenever I needed it. My deep thanks to my colleagues
Mustapha ElAmrani and David Rönsberg for their help in writing and revising the German
summary in this study.
Special thanks to Mrs. M. Thiel and Mrs. C. Eckelskemper for their administrative
help whenever needed, as well as Mrs. K. Rohde, Mrs. W. Schlag, Mrs. S. Miljanovic, Mrs.
H. Goldbach-Gecke, and Mrs. K. Friedrich for their kind help in any technical problem
encountered during the work.
My profound appreciation to the Egyptian Ministry of Higher Education, Missions
Office for the predoctoral fellowship and for the financial support during my stay in
Germany.
Last but not least, my gratitude, thankfulness, and my grand indebtedness to my family,
my wife Mona, my mother, brothers and sisters for their unfailing love, spiritual support
and everlasting prayers.
At the end, my heartily thanks and prayers to my father, who passed away, and I will
never forget that he was the first mentor in my life who inspired me how to set my own
goals in life and to carry on to reach them. May Almighty ALLAH bless him.
To All of You, Thank You Very Much!

Zusammenfassung
ZusammenfassungMarine Schwämme sind wegen der Vielfalt an Sekundärmetaboliten eine große Quelle
von Naturstoffen. Ein Drittel aller natürlichen Produkte der Meerestiere wurden aus
Schwämmen gewonnen. Sie haben sich als wichtige Quelle für neue Verbindungen
etabliert (Whitehead, 1999). Darüber hinaus gelten sie auch als eine Quelle für bioaktive
Substanzen, ihre Wirkstoffe sind interessante Kandidaten für neue Medikamente, vor allem
in den Bereichen: Krebs, anti-inflammatorische, und anti-infektiöse Substanzen so wie
Schmerzmittel (Proksch et al., 2002).
Vor kurzem wurden zwei marine Naturstoffe als neue Medikamente eingeführt: Prialt®
(Wirkstoff: Ziconotid) als potentes Analgetikum gegen schwere chronische Schmerzen und
Yondelis® (Wirkstoff: Trabectedin [ET-743]) als Antitumor-Mittel zur Behandlung von
fortgeschrittenem Weichteilsarkomen. Darüber hinaus befinden sich die Präparate
Aplidin® (Plitidepsin), Kahalalide F und Zalypsis® (Jorumycin-Derivat) in der klinischen
Testphase zur Behandlung von soliden Tumoren und hämatologischen Malignomen.
In vielen erfolgreichen Fällen, wie oben gezeigt, haben sich aus marinen Organismen
gewonnene Substanzen als pharmazeutisch bedeutend erwiesen, sie haben präklinische
oder klinische Phasen der Arzneimittelprüfung zur Behandlung von schweren Krankheiten
wie der Alzheimer-Krankheit, Diabetes Typ 2, Krebs und Infektionskrankheiten erreicht,
daneben werden schmerzstillende und entzündungshemmende Aktivitäten untersucht.
Daher bestand das Ziel dieser Studie in der Isolierung und Strukturaufklärung von
marinen Naturstoffen, entweder bekannt oder bevorzugt neu, in Mengen, die die
Durchführung verschiedener Tests zur biologischen Aktivität ermöglichen.
Die Isolierung von Sekundärmetaboliten und die Strukturaufklärung wurden durch
wichtige analytische Techniken wie Massenspektrometrie und Kernresonanzspektroskopie
durchgeführt. Darüber hinaus wurden die absolute Konfiguration der ausgewählten optisch
aktiven Naturstoffe auf der Grundlage der chiralen Derivatisierung mit der Mosher-
Analyse bestimmt. Für die Bestimmung der biologischen Aktivität, wurde eine Vielzahl
von Tests wie Messung der Zytotoxizität (MTT), Bestimmung der antibakteriellen,
antimykotischen, antiviralen Aktivität, Protein-Kinase-Hemmung und antioxidantiven
Aktivität (DPPH) durchgeführt.
Verschiedene Arten von Meerestieren wurden in dieser Studie untersucht, darunter
befinden sich Schwämme, Stachelhäuter und Seegras, sie wurden aus verschiedenen
geografischen Standorten gesammelt, nämlich Indonesien, den Philippinen und Thailand.

Zusammenfassung
1. Acanthostylotella sp.
Sechs neue Dibromopyrrolalkaloide wurden aus dem methanolischen Extrakt des
indonesischen Schwamms Acanthostylotella sp. (Indonesien) isoliert. Dazu gehören die
vier neuen Acanthamide (A-D) sowie die Substanzen Methyl-3,4-dibromo-1H-pyrrol-2-
carboxylat und 3,5-Dibromo-1H-pyrrol-2-carbonsäure. Darüber hinaus wurden acht
bekannte Dibromopyrrolalkaloide aus demselben Extrakt gewonnen. Unter den isolierten
Verbindungen ergab Mukanadin D moderate Zytotoxizität gegen Maus-Lymphom
(L5178Y) Zellen. Methyl-3,4-dibromo-1H-pyrrol-2-carboxylat zeigte moderate
antimikrobielle und antivirale Aktivitäten.
2. Stylissa massa
Aus dem methanolischen Auszug des Schwamms Stylissa massa (Indonesien) wuden 22
Bromopyrrolalkaloide isoliert, darunter zwei neue natürliche Dibromopyrrolalkaloide,
Ethyl-3,4-dibromo-1H-pyrrol-2-carboxylat und Dispacamid E. Die isolierten
Verbindungen wiesen interessante Bioaktivitätergebnisse in verschiedenen Bioassays wie
z.B. dem Zytotoxizitätsassay (MTT), der Prüfung der antimikrobiellen, antimykotischen
und antiviralen Aktivität sowie der In-vitro-Protein-Kinase-hemmenden Wirkung auf.
3. Jaspis splendens
Acht Verbindungen wurden durch eine bioaktivitätsgeführte Isolierung (sog. „bioguided
isolation“) aus dem in Ethylacetat löslichen Anteil des methanolischen Extraktes von
Jaspis splendens (Indonesien) gewonnen. Neben drei bekannten Ketosteroiden, einem
Derivat des Diketopiperazins Cyclo-L-Pro-L-Tyr und dem Nukleosid-Derivat
Sangivamycin wurden zwei neue Jaspamidderivate, zusammen mit der bekannten
Verbindung Jaspamid isoliert.
Alle isolierten Verbindungen zeigten starke Zytotoxizität gegen Maus-Lymphom
(L5178Y)-Zellen, insbesondere die neuen Jaspamid-Derivate zusammen mit Jaspamid,
Cyclo-L-Pro-L-Tyr und Sangivamycin wiesen die höchste Zytotoxizität mit IC50-Werten
im Bereich von <0,1 bis 0,28 �g/ml, aufverglichen mit Kahalalid F (IC50 = 6,3 �g/ml) sind
dies relativ niedrige Konzentrationsbereiche.
4. Thalassia testudinum
Eine genaue chemische Untersuchung des methanolischen Extrakts von T. testudinum
(Thailand) wurde durchgeführt und führte zur Isolierung von der beiden sulfatierten
Flavonoidglycoside, Thalassiolin A und Thalassiolin C. Luteolin-3'-O-glucuronid wurde

Zusammenfassung
zum ersten Mal, aus einen marinen Organismen isoliert. Schließlich wurden alle isolierten
Flavonglycoside auf ihre antioxidative (DPPH) Aktivität getestet.
5. Comanthus sp.
Eine bioaktivitätsgeführte Fraktionierung des Comanthus sp. (Philippinen) – Extraktes
wurde durchgeführt. Dies führte zur Isolierung von sechzehn Verbindungen, fünf von
ihnen waren Anthrachinone, einer davon ein neuer Naturstoff, fünf weitere sind
Naphthopyrone, ein Nukleosid-, 2'-desoxythymidin und fünf steroidale
Sekundärmetabolite. Die absolute Konfiguration der beiden optisch aktiven
Anthrachinonderivaten Rhodoptilometrin und seinem 6-O-Sulfat-Derivat wurde zum
ersten Mal durch die Mosher-Analyse vermittelt, und zeigte, dass beide von ihnen (S )-(-)
Enantiomere sind.
Alle isolierten Verbindungen wurden verschiedenen Tests unterzogen, um
Aufschlüsse über die antioxidative (DPPH), zytotoxische (MTT-Assay gegen die Maus-
Lymphom-Zell-Linie L5178Y), Protein-Kinasen inhibierende (In-vitro-Untersuchung auf
24 verschiedene Proteinkinasen), antimikrobielle, antimykotische und antivirale Aktivität
zu erhalten. Anthrachinone und Naphthopyrone zeigten besondersinteressante Ergebnisse.

�

Contents
Table of Contents
1. Introduction 1 1.1. Significance of the study 1
1.2. The biological importance of marine natural products 2
1.2.1. Antiviral and antitumor marine natural products 2
1.2.2. Protein kinase inhibitory activity of marine natural products 4
1.2.3. Antimalarial marine natural products 4
1.2.4. Anthelmintic activity of marine natural products 5
1.2.5. Reversing multi-drug resistance (MDR) activity 6
1.2.6. Immunosuppressive activity of marine natural products 7
1.3. The importance of marine natural products to the source organism 7
1.3.1. Chemical defense against fouling and spatial competition 7
1.3.2. Chemical defense against predators 7
1.4. The current status of marine natural products to research 8
1.5. Aim of the study 11
2. Material and methods 12 2.1. Marine organism materials 12
2.1.1. Sponges 12
2.1.1.1. Acanthostylotella sp. 13
2.1.1.2. Stylissa massa 14
2.1.1.3. Jaspis splendens 14
2.1.2. Seagrasses 15
2.1.2.1. Thalassia testudinum 15
2.1.3. Echinoderms 15
2.1.3.1. Comanthus sp. 17
2.2. Chemicals 18
2.2.1. General laboratory chemicals 18
2.2.2. Chromatography 18
2.2.2.1. Stationary phases 18
2.2.2.2. Spray reagents 18
2.2.3. Solvents 19
2.2.3.1. General solvents 19
2.2.3.2. Solvents for HPLC 19

Contents
2.2.3.3. Solvents for optical rotation 19
2.2.3.4. Solvents for NMR 20
2.3. Methods 21
2.3.1. Isolation and purification of secondary metabolites 21
2.3.1.1. Isolation of secondary metabolites from Acanthostylotella sp. 21
2.3.1.2. Isolation of secondary metabolites from Stylissa massa 22
2.3.1.3. Isolation of secondary metabolites from Jaspis splendens 23
2.3.1.4. Isolation of secondary metabolites from Thalassia testudinum 23
2.3.1.5. Isolation of secondary metabolites from Comanthus sp. 24
2.3.2. Chromatographic methods 25
2.3.2.1. Thin layer chromatography (TLC) 25
2.3.2.2. Vacuum liquid chromatography (VLC) 25
2.3.2.3. Column chromatography 26
2.3.2.4. Flash chromatography 26
2.3.2.5. Preparative high pressure liquid chromatography (HPLC) 27
2.3.2.6. Semi-preparative high pressure liquid chromatography (HPLC) 27
2.3.2.7. Analytical high pressure liquid chromatography (HPLC) 28
2.3.3. Structure elucidation of the isolated secondary metabolites 28
2.3.3.1. Mass spectrometry 28
2.3.3.1.1. Electrospray ionization mass spectrometry (ESI-MS) 29
2.3.3.1.2. Electron impact mass spectrometry (EI-MS) 29
2.3.3.1.3. Fast atom bombardment mass spectrometry (FAB-MS) 30
2.3.3.1.4. High resolution mass spectrometry (HR-MS) 30
2.3.3.2. Nuclear magnetic resonance spectroscopy (NMR) 30
2.3.3.3. Optical activity 31
2.3.3.4. Determination of absolute stereochemistry by Mosher reaction 32
2.3.4. Testing the biological activity(ies) 32
2.3.4.1. Antimicrobial serial dilution assay 32
2.3.4.2. Cytotoxicitiy assay 34
2.3.4.2.1. Microculture tetrazolium (MTT) assay 34
2.3.4.2.2. Protein kinase assay 35
2.3.4.2.3. Radical scavenging (DPPH) assay 36
2.3.5. General laboratory equipment 39

Contents
3. Results 40 3.1. Secondary metabolites isolated from Acanthostylotella sp. 40
3.1.1. Acanthamide A (1, new natural product) 41
3.1.2. Acanthamide B (2, new natural product) 43
3.1.3. Acanthamide C (3, new natural product) 44
3.1.4. Acanthamide D (4, new natural product) 46
3.1.5. Methyl 3,4-dibromo-1H-pyrrole-2-carboxylate (5, new natural product) 49
3.1.6. 3,5-Dibromo-1H-pyrrole-2-carboxylic acid (6, new natural product) 51
3.1.7. 4,5-Dibromo-N-(methoxymethyl)-1H-pyrrole-2-carboxamide (7, known) 53
3.1.8. 4,5-Dibromo-1H-pyrrole-2-carboxamide (8, known) 54
3.1.9. Mukanadin D (9, known) 57
3.1.10. (±)-Longamide B methyl ester (10, known) 59
3.1.11. (±)-Longamide B (11, known) 61
3.1.12. (±)-Longamide (12, known) 63
3.1.13. 3,4-Dibromo-1H-pyrrole-2-carboxamide (13, known) 66
3.1.14. 2-Cyano-4,5-dibromo-1H-pyrrole (14, known) 67
3.1.15. Bioactivity assay results of compounds isolated from marine sponge Acanthostylotella sp.
68
3.2. Secondary metabolites isolated from Stylissa massa 69
3.2.1. Ethyl 3,4-dibromo-1H-pyrrole-2-carboxylate (15, new natural product) 70
3.2.2. 4-Bromo-1H-pyrrole-3-carboxamide (16, known) 72
3.2.3. 3,4-Dibromo-1H-pyrrole-2-carboxamide (17, known) 74
3.2.4. (-)-Longamide B methyl ester (18, known) 74
3.2.5. (-)-Longamide B ethyl ester, Hanishsin (19, known) 75
3.2.6. (-)-Longamide B (31, known) 76
3.2.7. Aldisine (20, known) 79
3.2.8. 2,3-Dibromoaldisine (21, known) 81
3.2.9. 2-Bromoaldisine (22, known) 83
3.2.10. 3-Bromoaldisine (23, known) 84
3.2.11. (-)-Mukanadin C (24, known) 87
3.2.12. (-)-Longamide (25, known) 88
3.2.13. Latonduine A (26, known) 91
3.2.14. (-)-Dibromophakellin H+Cl- (27, known) 93
3.2.15. (-)-Monobromoisophakellin (28, known) 94

Contents
3.2.16. (-)-Dibromocantharelline (32, known) 95
3.2.17. (-)-Hymenine (29, known) 99
3.2.18. Dispacamide E (30, new natural product) 100
3.2.19. (10Z)-Debromohymenialdisine (33, known) 104
3.2.20. Spongiacidin B (34, known) 105
3.2.21. (10Z)-Hymenialdisine (35, known) 108
3.2.22. (10E)-3-Bromohymenialdisine (36, known) 109
3.2.23. Biological activity of bromopyrrole alkaloids isolated from Indonesian marine sponge Stylissa massa.
112
3.3. Secondary metabolites isolated from Jaspis splendens 114
3.3.1. Jaspamide (37, known) 115
3.3.2. Jaspamide Q (38, new natural product) 117
3.3.3. Jaspamide R (39, new natural product) 119
3.3.4. 6ß-hydroxy-24-methylcholesta-4,22-dien-3-one (40, known) 123
3.3.5. 6ß-hydroxy-24-methylcholesta-4-en-3-one (41, known) 124
3.3.6. 6ß-hydroxy-24-ethylcholesta-4-en-3-one (42, known) 125
3.3.7. Maculosin-1, cyclo-(L-Pro-L-Tyr) (43, known) 127
3.3.8. Sangivamycin (44, known) 128
3.3.9. Biological activity of compounds isolated from Jaspis splendens collected in Kalimantan (Indonesia)
131
3.4. Secondary metabolites isolated from Thalassia testudinum 132
3.4.1. Thalassiolin A (45, known) 133
3.4.2. Thalassiolin C (46, known) 134
3.4.3. Luteolin-3’-O-glucuronide (47, known) 136
3.4.4. Biological activity of compounds isolated from Thalassia testudinum 139
3.5. Secondary metabolites isolated from Comanthus sp. 140
3.5.1. 1’-Deoxyrhodoptilometrene (48, new natural product) 141
3.5.2. 1’-Deoxyrhodoptilometrin (49, known) 144
3.5.3. (S)-(-) Rhodoptilometrin (50, known) 148
3.5.4. 1’- Deoxyrhodoptilometrin-6-O-sulfate (51, known) 151
3.5.5. Rhodoptilometrin-6-O-sulfate (52, known) 152
3.5.6. Comaparvin (53, known) 156
3.5.7. 6-Methoxycomaparvin (54, known) 156

Contents
3.5.8. 6-Methoxycomaparvin-5-methyl ether (55, known) 160
3.5.9. 6-Methoxycomaparvin-5-methyl ether-8-O-sulfate (56, known) 163
3.5.10. 6-Hydroxycomaparvin-8-O-sulfate (57, known) 164
3.5.11. 2’-Deoxythymidine (58, known) 167
3.5.12. Biological activity of anthraquinones and naphthopyrones isolated from the marine Echinoderm Comanthus sp.
169
4. Discussion 1724.1. Methods for natural products tracing 172
4.2. Bromopyrroles: a typical class of marine alkaloids 173
4.3. Biological activity of bromopyrrole alkaloids 177
4.4. Jaspamides: a unique group of cyclodepsipeptides 179
4.5. Thalassiolins: sulfated flavonoids from Thalassia testudinum 181
4.6. Anthraquinones and naphthopyrones from Comanthus sp. 182
4.6.1. Biosynthesis of anthraquinones and naphthopyrones 182
4.6.2. Biological activity of anthraquinones and naphthopyrones 185
4.7. Sulfated secondary metabolites: occurrence and influence 186
5. Summary 188
6. References 191
7. List of abbreviations 205
8. Attachments 207
Resume 236

�

Introduction
1
1. Introduction Marine environment has represented the greatest biodiversity compared to the terrestrial
one; with 34 of the 36 phyla of life exist. More than 70% of our planet’s surface is covered
by oceans, and life on Earth has its origin in the sea. In certain marine ecosystems, such as
coral reefs or the deep sea floor, experts estimate that the biological diversity is even
higher than in tropical rain forests, around 1000 species per m2 in some areas. This
outstanding biological diversity imparted an extraordinary chemical library of marine
natural products with a diverse array of bioactivities. Consequently, marine environment
offers a new frontier for research and attracts scientists from different disciplines, such as
pharmacology, biology, ecology, organic and bioorganic chemistry. Although the field of
marine natural products is a relatively new research area and the difficulties involved in
collecting samples, it proved to be a productive source for bioactive natural products. The
development of SCUBA in 1960s and more recently submersible vehicles have allowed
easy access of both shallow and deep-water marine organisms for studies by natural
products chemists.
1.1. Significance of the study The deep habitats of marine invertebrates and the sedentary lifestyle together with the soft
body necessitate a chemical means of defense from predators. Therefore, they have
evolved the ability to synthesize toxic and/or deterrent compounds, or to obtain them from
the symbiotic marine micro-organisms.
Many marine-derived compounds show strong biological activities as any natural
product released into the water is rapidly diluted and, therefore, needs to be highly potent
to exert a significant biological effect. Marine natural products have attracted the attention
of scientists from different disciplines, such as chemistry, pharmacology, biology and
ecology (Newman et al., 2000; König and Wright, 1996; Claeson and Bohlin, 1997). This
notion is supported by the fact that, before 1995, ~ 6,500 marine natural products had been
isolated, whereas this figure has now escalated to more than 19,000 compounds (Marinlit:
a database of the marine natural products literature, 2009. Contact address: John W. Blunt,
Christchurch, New Zealand).
The interest in the marine environment has been stimulated by the array of biological
activities of marine natural products and hence their potential biomedical applications
(Pawlik, 1993). For this reason, and because of the immense biological diversity in the sea
as a whole, it is increasingly recognized that a huge number of natural products and novel
chemical entities exist in the oceans, with some of them exhibiting biological activities that

Introduction
2
may also be useful in the quest for finding new drugs with greater efficacy and specificity
for the treatment of human diseases (Bhakuni and Rawat, 2005; Proksch et al., 2002). This
was exemplified by the newly admitted marine-derived medicaments: Prialt® (also known
as ziconotide) as a potent analgesic for severe chronic pain and Yondelis® (known also as
trabectedin or E-743) as antitumor agent for the treatment of advanced soft tissue sarcoma.
Moreover, Aplidin® (plitidepsin), kahalalide F, and Zalypsis® (jorumycin derivative) are in
clinical trials for treatment of solid tumors and haematological malignancies. Therefore,
marine ecosystem is considered as a valuable treasure of useful substances that could be
used, for example, to develop new treatments for infectious diseases or cancer (Proksch et
al., 2002).
1.2. The biological importance of marine natural products 1.2.1. Antiviral and antitumor marine natural products
Viruses have remained resistant to treatment or prophylaxis longer than any other
infectious organism and cancers are the second leading cause of death in the first world,
but, it is estimated that 60% of all illnesses in the developed countries is a consequence of
viral infections. The search for viral chemotherapeutic agents from marine sources has
yielded several promising therapeutic leads reported to display notable antiviral activity.
The leading work of Bergmann and Feeny in 1951, which reports the presence of the
unusual arabinosyl nucleosides, spongothymidine, spongosine and spongouridine (Fig. 1.1)
from the sponge Cryptotethia crypta (Bergmann and Feeney, 1951; Bergmann and Burke
1955; Bergmann et al., 1957), have provided the lead compounds for the development of
the therapeutically used Ara-C (cytarabine) for treatment of leukemia, in addition to the
virustatic agent Ara-A (vidarabine), azidothymidine (AZT), and acyclovir which was
introduced to the market and used therapeutically against Herpes encephalitis since the late
of 1970s (Miller et al., 1968; Whitley et al., 1977).�
The didemnins (Fig. 1.1) are a family of closely related cyclic depsipeptides obtained
from Trididemnum solidum, a Caribbean tunicate, or sea squirt, of the family Didemnidae
(Rinehart et al., 1981). The didemnins inhibit the growth of both RNA and DNA viruses
and are highly cytotoxic to L1210 leukaemic cells and P388 leukaemia (Martin et al.,
1986). Didemnin A inhibits Coxackie A21 virus and Herpes simplex virus. Didemnin B
shows cytotoxicity to L1210, P388 leukaemic cells and B-16 melanoma (Rinehart et al.,
1981).

Introduction
3
N
N N
N
O
OH
HO
HO
N
N
NH2
O
O
OH
HO
HO
HN
NO
O
O
N3
HO
HN
N N
N
H2N
O
OOH
Ara-A Ara-C Azidothymidine
Acyclovir
NH
N
NH
Pyrrolyl-substituted eudistomins
NH
N
S
O
H2N
H
Eudistomins with oxathiazepine ring
NN
NH
ONH
OH
CH3O
O
O
O
O NH
O
OCH3
NCH3
ON
O
O
OH
Didemnin B
Fig. 1.1. Biologically important marine natural products.
Eudistomins (Fig. 1.1) were isolated in 1981 from colonial tunicate Eudistoma
olivaceum (Rinehart et al., 1981). There are four distinct structural categories of
eudistomins, namely unsubstituted, pyrrolyl-substituted, pyrrolinyl-substituted and
tetrahydro-�-carbolines containing a uniquely condensed oxathiazepine ring system. The
oxathiazepine-containing eudistomins possess a pronounced antiviral activity toward the
DNA virus HSV-1 (Rinehart et al., 1984).
Bryostatins are macrocyclic lactones isolated from the marine bryozoan Bugula
neritica. Bryostatin 1 (Fig. 1.2) was one of the most promising anticancer agents and the

Introduction
4
most abundant of this group. This compound was first known to inhibit the growth of
murine P388 leukemia cells at subnanomolar concentrations (Pettit et al., 1982; Pettit et al.,
1993). Presently, there are more than 20 bryostatin derivatives have been reported (Wender
et al., 1999). The MOA of bryostatins were determined. These compounds are thought to
bind to protein kinase C (PKC), a tumor promoting receptor. As a result, the PKC enzyme
is significantly down-regulated, leading to inhibition of growth and cell death. However,
the positive effects of bryostatin are obtained only when combined with other
chemotherapies such as taxol and cisplatin. According to an independent research,
Haygood and coworker demonstrated the hypothesis that bryostatins are symbiotic origin.
Bryostatins were isolated from the symbiotic microbes (Candidatus Endobugula sertula)
(Davidson et al., 2001).
1.2.2. Protein kinase inhibitory activity of marine natural products
Kinases are ATP-dependent enzymes that add phosphate groups to proteins. Protein
phosphorylation is the key regulatory mechanism that is utilised to regulate the activity of
enzymes and transcription factors (Meijer et al., 2000). Therefore, protein kinases play an
essential role in virtually all cellular processes and are involved in most diseases.
Hymenialdisine (Fig. 1.2) is a marine constituent which has been isolated from many
marine sponges belonging to the genera Acanthella, Axinella and Hymeniacidon (Mattia et
al., 1982; Cimino et al., 1982; Kitagawa et al., 1983). Hymenialdisine and its derivatives
have caught the scientific interest of several research groups particularly due to their
biological activity profile, namely being nanomolar kinase inhibitors against CDKs, GSK-
3�, CK1 and Chk1 which are necessary parts regulating several vital cellular functions
such as gene expression, cellular proliferation, membrane transport and apoptosis as well
(Meijer et al., 2000) and targeting these kinases has been appealing for the treatment of
diseases like Alzheimer’s disease, type II diabetes and cancer (Nikoulina et al., 2000;
Martinez et al., 2002). In addition, hymenialdisines inhibited several pro-inflammatory
cytokines (IL-1, IL-2, IL-6, and NO) through inhibition of the NF-�B signalling pathway
which is potentially valuable for treatment of serious inflammatory diseases such as
rheumatoid arthritis and osteoarthritis (Sharma et al., 2004).
1.2.3. Antimalarial marine natural products
Malaria is a particularly serious disease in sub-Sahran Africa, but it is also a serious public-
health issue in certain regions of south East Asia and South America. Most malaria cases
and deaths are caused by the parasite Plasmodium falciparum (Mishra et al., 1999). Since

Introduction
5
removal of the vector of transmission (the anopheles mosquito) is almost impossible, new
antimalarial agents providing novel mechanisms of action will always be needed to combat
resistance to drugs such as chloroquine, mefloquine, quinine, and sulfadoxine-
pyrimethamine. Manzamine A (Fig. 1.2) exhibits potent in vitro activity against P.
falciparum (D6 clone), with an MIC of 0.0045 μg/mL, compared with control drug
(chloroquine and artemisinin) MICs of 0.0155 μg/mL and 0.010 μg/mL, respectively (Ang
et al., 2000). In vivo, manzamine A inhibits the growth of the rodent malaria parasite
Plasmodium berghei, with more than 90% of the asexual erythrocytic stages of P. berghei
inhibited after one intraperitoneal injection of 50 or 100 μmol/kg manzamine A into
infected mice (Ang et al., 2000). Therefore, manzamine A and its analogues are clearly
valuable candidates for further investigation and development as promising leads against
malaria and perhaps other serious infectious diseases.
1.2.4. Anthelmintic activity of marine natural products
Anthelmintics are drugs used to rid host organisms of helminth parasites. Parasitism by
nematodes (unsegmented worms that constitute the phylum Nematoda) represents a major
issue in the commercial livestock industry and contributes substantially to malnutrition and
disease in human beings. Particularly difficult to eradicate is Ascaris lumbricoides, the
large gut worm, which causes malnutrition and obstructive bowel disease, and the soil
transmitted blood sucking hookworms Ancyclostoma duodenale and Necator americanus,
which lead to severe blood loss and iron-deficiency anaemia, decreased food intake,
impaired digestion, malabsorption and poor growth rate (Crompton and Nesheim, 2002).
Despite the availability of excellent commercial anthelmintics, growing resistance to key
structural classes (benzimidazoles and macrolides) necessitates the search for new
bioactive agents (Crompton and Nesheim, 2002).
Jaspamide (=jasplakinolide, Fig. 1.2) is a cyclodepsipeptide was isolated firstly in
1986 from the sponge Jaspis cf. johnstoni by Ireland and Crews. It exhibited an in vitro
50% effective dose of less than 1 μg/mL against the nematode Nippostrongylus
braziliensis (Nagai et al., 1992). In addition to being a potent antiparasitic (Zabrisikie et al.,
1986; Crews et al., 1986), jaspamide is known for other pronounced bioactivities including
antifungal (Scott et al., 1988), insecticidal (Zabrisikie et al., 1986; Crews et al., 1986), and
antiproliferative activities (Inman and Crews, 1989).

Introduction
6
NH
N
N OH
N
BA
D
C
E
10
1236
1
34 5
88a9a
1315
20
22 24
26
28
32
33
35
Manzamine A
NH
NH
O
Br
N
HN
OH2N
Hymenialdisine
HN O
N
NH
O
O
O
O
HNBr
13
5
7
91112
1415
16
17
1819
21
2426
27
30OH
33
34
35
36
O
O
OO
OHHO
O
OO
O
O
HOH
HO
O
H H
OH
O
O
Bryostatin 1
Jaspamide
12
4
6
91011
OAc
AcO
OH
OAc
HO
H
H
Agosterol A
NH
Br
Br
OH
O
4,5-Dibromopyrrole-2-carboxylic acid
Fig. 1.2. Biologically important marine natural products.
1.2.5. Reversing multi-drug resistance (MDR) activity
Multidrug resistance (MDR) in tumour cells has been recognised as a major obstacle to
successful cancer chemotherapy. Overexpression of certain membrane glycoproteins has

Introduction
7
been observed in MDR tumour cell lines. The substance which inhibits the action of these
membrane glycoproteins would have high possibility for solving the MDR problems in
cancer chemotherapy. Agosterol A (Fig. 1.2) completely reversed the resistance to
colchicine in KB-C2 cells and also the resistance to vincristine in KB-CV60 cells.
Agosterol A is a polyhydroxylated sterol acetate and was isolated from a marine sponge of
genus Spongia. It reverses MDR caused by overexpression of multi-drug resistance
associated protein (MRP). It may be a pharmaceutical candidate for reversing MDR (Aoki
et al., 1998).
1.2.6. Immunosuppressive activity of marine natural products
There are also other marine natural products which show in vitro immunosuppressive
activity such as 4�-methyl-5�-cholest-8-en-3�-ol (Fig. 1.3) and 4,5-dibromopyrrole-2-
carboxylic acid (Fig. 1.2). Both compounds were highly active in suppression of murine
splencytes in the two-way mixed lymphocyte reaction (MLR) with little or no
demonstrable cytotoxicity. Both compounds were isolated from the marine sponge Agelas
flabelliformis and could be useful in organ transplantations (Gunasekera et al., 1989).
1.3. The importance of marine natural products to the source organism Marine natural products play an important role to the source organism. Some of them are
beneficial as chemical defense means including:
1.3.1. Chemical defense against fouling and spatial competition
Aerophobin-2 and isofistularin-3 (Fig. 1.3) are secondary metabolites produced by the
marine sponge Aplysina aerophoba that were found to be enzymatically converted after
injury into dienone and aeroplysinin-1, respectively, which was found to protect the sponge
from invasion of pathogenic microorganisms (Proksch and Ebel, 1998; Ebel et al., 1997).
1.3.2. Chemical defense against predators
Latrunculins A and B (Fig. 1.3) protect the sponge Latrunculina magnifica from fishes (e.g.
Gambusia affinis) (Neeman et al., 1975). The unpalatiblity of the ascidian Trididemnum
solidum was shown to be due to alkaloids of didemnin B and nor-didemnin which inhibited
the reef fishes from feeding (Lindquist et al., 1992).

Introduction
8
HO
4�-Methyl-5�-cholest-8-en-3�-ol
ON
HO
BrBr
OCH3
HN
O
N
NH
NH2
Aerophobin-2
O
N
HO
BrBr
OCH3
HN O
O
OH Br
Br
OH
NH
O
O
N
OCH3
BrBr
OHIsofistularin-3
O
O
O
HN
S
O
H
OH
Latrunculin AO
O
HN
S
OH
O
Latrunculin B
Fig. 1.3. Biologically important marine natural products.
1.4. The current status of marine natural products research Marine natural products proved appealing for scientific interests. Consequently, this lead to
the discovery of potentially active metabolites considered valuable for further preclinical
or clinical trials. As successful examples for medical remedies from marine resources,

Introduction
9
Prialt® (also known as ziconotide) as a potent analgesic for severe chronic pain and
Yondelis® (known also as trabectedin or ET-743) as antitumor agent for the treatment of
advanced soft tissue sarcoma. In addition Aplidin® (plitidepsin), kahalalide F, and
Zalypsis® (jorumycin derivative) are in clinical trials for treatment of solid tumors and
haematological malignancies.
In 2004, Newman and Cragg summarized the natural products and related compounds
from marine sources which are in advanced preclinical or clinical trials (Table 1.1)
(Newman and Cragg, 2004).
Table 1.1. Current status of marine natural products in clinical and preclinical trials.
Name Source Status (Disease)
Didemnin B Trididemnum solidum Phase II (Cancer)
Bryostatin 1 Bugula neritina Phase II (Cancer)
Dolastatin 10 Dolabella auricularia (Marine
microbe derived; cyanophyte)
Phase II (Cancer)
Cematodin Synthetic derivative of
Dolastatin 15 (Marine microbe
derived; cyanophyte)
Phase II (Cancer)
TZT–1027 Synthetic Dolasatatin Phase II (Cancer)
Girolline Pseudaxinyssa cantharella Phase I (Cancer)
Aplidine Aplidium albicans Phase III (Cancer)
EC COMP/EMEA approved
orphan drug status for ALL
(07/2003)
E7389 Lissodendoryx sp. Phase I (Cancer)
Discodermolide Discodermia dissoluta Phase I (Cancer)
Kahalalide F Elysia rufescens / Bryopsis sp. Phase II (Cancer)
ES–285 (Spisulosine) Spisula polynyma Phase I (Cancer)
HTI–286 Cymbastella sp. Phase I (Cancer)
Bengamide derivative Jaspis sp. Phase I (Cancer)
Cryptophycins (also
Arenastatin A)
Nostoc sp.
Dysidea arenaria
Phase I (Cancer)

Introduction
10
Name Source Status (Disease)
KRN–7000 Agelas mauritianus Phase I (Cancer)
Squalamine Squalus acanthias Phase II (Cancer)
AE–941 (Neovastat) Shark Phase III (Cancer)
Laulimalide Cacospongia mycofijiensis Preclinical (Cancer)
Curacin A Lyngbya majuscula Preclinical (Cancer)
Vitilevuamide Didemnum cucliferum
Polysyncraton lithostrotum
Preclinical (Cancer)
Diazonamide Diazona angulata Preclinical (Cancer)
Eleutherobin Eleutherobia sp. Preclinical (Cancer)
Sarcodictyin Sarcodictyon roseum Preclinical (Cancer)
Peloruside A Mycale hentscheli Preclinical (Cancer)
Salicylhalimides A&B Haliclona sp. Preclinical (Cancer)
Thiocoraline Micormonospora marina Preclinical (Cancer)
Neoamphimedine Xestospongia sp. Preclinical (Cancer)
Aplyronine A Aplysia kurodai Preclinical (Cancer)
DMBX
(aka GTS–21)
Amphiporus lactifloreus Phase I (Alzheimer’s)
Manoalide Luffariaella variabilis Phase II (Anti-psoriatic)
IPL–576092
(aka HMR–4011 A)
Petrosia contignata Phase II (Anti-asthmatic)
IPL–512602 Petrosia contignata Phase II (Anti-inflammatory)
IPL–550260 Petrosia contignata Phase I (Anti-inflammatory)
CGX–1160 Conus geographus Preclinical (Pain)
CGX–1007 Conus geographus Preclinical (Epilepsy)
AMM336 Conus catus Preclinical (Pain)
Chi-conotoxin Conus sp. Preclinical (Pain)
ACV1 Conus victoriae Preclinical (Pain)

Introduction
11
In addition, other elegant reviews have recently been published discussing the actual
clinical status of marine natural products (Molinski et al., 2009; Mayer et al., 2010).
1.5. Aim of the study Chemistry and biological activities of marine natural products have been an attractive
investment for massive research efforts. Many successful cases, as shown above, proved to
have various pharmaceutical significances, which have been developed to preclinical or
clinical trial phases for treatment of serious diseases such as Alzheimer’s disease, type II
diabetes, cancer and infectious diseases in addition to pain killing and anti-inflammatory
activities.
Based on the previous findings, this study has been concerned with the isolation and
structural elucidation of marine secondary metabolites, either known or preferentially new
ones, of the bioactive extracts from different marine resources including sponges,
seagrasses and echinoderms collected off different locations namely Indonesia, Philippines,
and Thailand. Beyond that the main target was to get as much as possible from each
substance so as to enable further assessment of various bioactivities to find out every
possible potential bioactivity. Various biological assays have been incorporated in this
study including cytotoxicity (MTT), antibacterial, antifungal, antiviral, protein kinase
inhibitory and antioxidant (DPPH) activities.

Materials and Methods
12
2. Materials and Methods
2.1. Marine organism materials Biological materials involved in this work were all marine organisms including three
sponges, one echinoderm, and one plant. They were collected in different locations.
Regarding sponges, the unidentified Acanthostylotella sp., Jaspis splendens, and Stylissa
massa, they were collected off the Pacific Ocean (Indonesia), the unidentified echinoderm
Comanthus sp. was collected off the South China Sea (Phillipines), and turtle grass
Thalassia testudinum was collected off the Mediterranean Sea (Turkey).
2.1.1. Sponges Sponges are animals constituting the phylum Porifera “Pore bearer” (Kingdom Animalia).
Their bodies consist of jelly-like mesohyl sandwiched between two thin layers of cells.
Unlike other animals, sponges are unique in having some specialized cells that can
transform into other types. Sponges lack nervous, digestive, or circulatory systems. Instead
they rely on maintaining a continuous water flow through their bodies to obtain food,
oxygen, and to remove wastes. They are defined as sessile metazoans, and however there
are freshwater species, the great majority are marine species, ranging from tidal zones to
depths exceeding 8,800 meters. While most of the 9,000 known species feed on bacteria
and other food particles, some sponges host photosynthesizing microorganisms as
endosymbionts which often produce more food and oxygen than their consumption. On the
contrary, sponges that live in poor food environments have become carnivores.
Sponges use various materials to reinforce their mesohyl and in some cases to produce
skeletons, and this forms the main basis for classifying sponges. Calcareous sponges
produce spicules made of calcium carbonate. Demosponges reinforce the mesohyl with
fibers of a special form of collagen called spongin, most also produce spicules of silica,
and a few secrete massive external frameworks of calcium carbonate.
A sponge’s body is hollow and is held in shape by mesohyl, a jelly-like substance
made of collagen, and reinforced by a dense network of fibers also made of collagen. The
inner surface is covered with choanocytes, cells with conical or collars surrounding one
flagellum per choanocytes. The wave-like motion of the whip-like porocytes that form
closable inlet valves. Pinacocytes, plate-like cells, form a single layered skin over all other
parts of the mesohyl that are not covered by choanocytes, and the external pinacocytes also
digest food particles that are too large to enter the ostia, while those at the base are
responsible for anchoring the animal.
Other types of cell live and move within the mesohyl:

Materials and Methods
13
� Lophocytes are amoeba-like cells that move slowly through the mesohyl and
secrete collagen fibers.
� Collencytes are another type of collagen-producing cell.
� Rhabdiferous cells secrete polysaccharides that also form part of the mesohyl.
� Oocytes and spermatocytes are reproductive cells.
� Sclerocytes secrete the mineralized spicules "little spines" that form the skeletons
of many sponges and in some species provide some defense against predators.
� In addition to or instead of sclerocytes, demosponges have spongocytes that secrete
a form of collagen that polymerizes into spongin, a thick fibrous material that
stiffens the mesohyl.
� Myocytes ("muscle cells") conduct signals and cause parts of the animal to contract.
� Grey cells act as sponges' equivalent of an immune system.
� Archaeocytes (or amoebocytes) are amoeba-like cells that are totipotent, in other
words each is capable of transformation into any other type of cell. They also have
important roles in feeding and in clearing debris that block the ostia.
For a long time sponges were assigned to a separate subkingdom, Parazoa "beside the
animals". They are now classified as a phylum within the Animalia, and divided into
classes mainly according to the composition of their skeletons:
� Hexactinellida (glass sponges) have silicate spicules, the largest of which have six
rays and may be individual or fused. The main components of their bodies are
syncytia in which large numbers of cell share a single external membrane.
� Calcarea have skeletons made of calcite, a form of calcium carbonate, which may
form separate spicules or large masses. All the cells have a single nucleus and
membrane.
� Most Demospongiae have silicate spicules or spongin fibers or both within their
soft tissues. However a few also have massive external skeletons made of aragonite,
another form of calcium carbonate. All the cells have a single nucleus and
membrane.
� Archeocyatha are known only as fossils from the Cambrian period.
2.1.1.1. Acanthostylotella sp. The sponge Acanthostylotella sp. (class Demospongiae, order Poecilosclerida, family
Raspailiidae) (Fig. 2.1) was collected at a depth of 3 m in a shallow sandy channel with sea
grasses at the East side of Nusa Lembongan, Selat Ceningan (08°41'03''S115°27'43''E, off
the island Bali, Indonesia) in 2001. The sponge material was immersed in ethanol

Materials and Methods
14
immediately after collection. A voucher specimen is kept in ethanol under the registration
number RMNH POR. 2264 at the National Museum of Natural History, Leiden,
Netherlands.
2.1.1.2. Stylissa massa The sponge Stylissa massa (class Demospongiae, order Halichondrida, family
Dictyonellidae) (Fig. 2.2) was collected off the shores of Papoea Island (Indonesia) in
January 2008, identified, and supplied by Dr. Nicole de Voogd, National Museum of
Natural History, Leiden, Netherlands.
2.1.1.3. Jaspis splendens In August 2008, specimens of the sponge Jaspis splendens (Fig. 2.3) were collected on two
neighboring Islands from East Kalimantan (Indonesia), namely Samama, Panjang, and a
submerged reef shoal, at 10 meter depths. Numbers of voucher specimens are RMNH Por.
4234, 4266 and 4299, respectively. They were taxonomically identified as Jaspis splendens
(order Astrophorida, family Ancorinidae) at the National Museum of Natural History,
Leiden, Netherlands. HPLC and LCMS analyses of the three samples revealed that they
were identical with regard to their peptide derivatives. Hence, the material was combined
in order to obtain sufficient amounts of compounds for subsequent structure elucidation.
Fig. 2.1. Acanthostylotella sp. Fig. 2.2. Stylissa massa
Fig. 2.3. Jaspis splendens Fig. 2.4. Thalassia testudinum
Materials and Methods
15
2.1.2. Seagrasses
Seagrasses are flowering plants from one of four plant families, Posidoniaceae,
Zosteraceae, Hydrocharitaceae, or Cymodoceaceae, all in the order Alismatales, the class
of monocotyledons, which grow in marine environments. These marine flowering plants
were called seagrasses because the leaves are long, narrow, very often green, and grow in
large meadows which look like grassland, resembling terrestrial grasses of the family
Poaceae. Since these plants must photosynthesize, they are limited to growing submerged
in the photic zone, and most occur in shallow and sheltered coastal waters anchored in sand
or mud bottoms. They undergo pollination while submerged and complete their entire life
cycle underwater. There are about sixty species worldwide, although the taxonomy is still
disputed.
Seagrasses form extensive beds or meadows, which can be either monospecific, one
species, or multispecific, more than one species coexist. Seagrass beds are highly diverse
and productive ecosystems, and can harbor hundreds of associated species from all phyla,
for example juvenile and adult fish, epiphytic and free-living macroalgae and microalgae,
mollusks, bristle worms, and nematodes.
Seagrasses are sometimes labeled ecosystem engineers, because they partly create
their own habitat, the leaves slow down water-currents increasing sedimentation, and the
seagrass roots and rhizomes stabilize the seabed. Their importance for associated species is
mainly due to provision of shelter and for their extraordinarily high rate of primary
production. As a result, seagrasses provide coastal zones with a number of ecosystem
goods and ecosystem services, for instance fishing grounds, wave protection, oxygen
production and protection against coastal erosion.
2.1.2.1. Thalassia testudiunm
The seagrass Thalassia testudinum (Fig. 2.4) was collected by snorkeling at 2 m depth off
Muk Island, Trang Province, Thailand in July, 2007.
2.1.3. Echinoderms Echinoderms (Phylum Echinodermata) are a phylum of marine animals. Echinoderms are
found at every ocean depth, from the intertidal zone to the abyssal zone (4,000 to 6,000
meters depht). The phylum contains about 7,000 living species, making it the second-
largest grouping of deuterostomes, after the chordates; they are also the largest phylum that
has no freshwater or terrestrial representatives.

Materials and Methods
16
The word (Echinoderm) was derived from the Greek word (echinodermata), "spiny
skin", that came from (echinos), "sea-urchin", and (derma), "skin". Echinoderms are
important both biologically and geologically: biologically because few other groupings are
so abundant in the biotic desert of the deep sea, as well as the shallower oceans, and
geologically as their ossified skeletons are major contributors to many limestone
formations, and can provide valuable clues as to the geological environment. Further, it is
held by some that the radiation of echinoderms was responsible for the Mesozoic
revolution of marine life.
Two main subdivisions of Echinoderms are traditionally recognized: the more familiar,
motile Eleutherozoa, which encompasses the Asteroidea (starfish), Ophiuroidea (brittle
stars), Echinoidea (sea urchins and sand dollars) and Holothuroidea (sea cucumbers); and
the sessile Pelmatazoa, which consists of the crinoids and extinct Paracrinoids. Some
crinoids, the feather stars, have secondarily re-evolved a free-living lifestyle.
Echinoderms evolved from animals with bilateral symmetry; although adult
echinoderms possess radial symmetry, echinoderm larvae are ciliated, free-swimming
organisms that organize in a bilaterally symmetric fashion that makes them look like
embryonic chordates. Later, the left side of the body grows at the expense of the right side,
which is eventually exploded. The left side then grows in a pentaradially symmetric
fashion, in which the body is arranged in five parts around a central axis. All echinoderms
exhibit fivefold radial symmetry in portions of their body at some stage of life, even if they
have secondary bilateral symmetry. Many crinoids and some starfish exhibit symmetry in
multiples of the basic five, with starfish such as Helicoilaster sp. known to possess up to
50 arms, and the sea-lily Comanthina schlegelii boasting 200.
They have mesodermal skeleton made up of calcareous plates or ossicle, despite the
robustness of the individual skeletal modules, complete echinoderm skeletons are rare in
the fossil record. This is because they quickly disarticulate once the encompassing skin rots
away, and in the absence of tissue there is nothing to hold the plates together. The modular
construction is a result of the growth system employed by echinoderms, which adds new
segments at the centre of the radial limbs, pushing the existing plates outwards in the
fashion of a conveyor belt. The spines of sea urchins are most readily lost, as they are not
even attached to the main skeleton in life. Each spine can be moved individually and is
thus only loosely attached in life; a walk above a rocky shore will often reveal a large
number of spineless but otherwise complete sea urchin skeletons. The epidermis of
echinoderms consists of cells responsible for the support and maintenance of the skeleton,

Materials and Methods
17
as well as pigment cells, mechanoreceptor cells, which detect motion on the animal's
surface, and sometimes gland cells which secrete sticky fluids or even toxins.
Although echinoderms possess a complete digestive tube (tubular gut), it is very
simple, often simply leading directly from mouth to anus. It can generally be divided into a
pharynx, stomach, intestine and rectum, or cloaca. There are present haemal and
perihaemal systems which are of coelomic region, thus so possess an open and reduced
circulatory system consisting of a central ring and five radial vessels, but often without
heart or blood. Gaseous exchange occurs by dermal branchae or papulae in star fishes,
peristominal gills in sea urchins, genitial bursae in brittle stars and cloacal trees in
holothurians. Exchange of gases also takes place through tube feet. They lack specialized
excretory organs and so nitrogenous wastes are diffused out via gills or terminal branchia.
Ammonia is the chief excretory matter. They have a simple radial nervous system that
consists of a modified nerve net, interconnected neurons with no central brain, although
some do possess ganglia. Nerves radiate from central rings around the mouth into each arm
and the branches of these nerves coordinate the movements of the organism.
The gonads of the organisms occupy the entire body cavities of sea urchins and sea
cucumbers; the less voluminous crinoids, brittle stars and starfish having two gonads per
arm. While the primitive condition is considered to be one genital aperture, many
organisms have multiple holes through which eggs or sperm may be released.
Echinoderms become sexually mature after approximately two to three years,
depending on the species and the environmental conditions. The eggs and sperm cells are
released into open water, where fertilization takes place. However, internal fertilization has
currently been observed in three species of starfish, three brittle stars and a deep water sea
cucumber. In some species of feather star, the embryos develop in special breeding bags,
where the eggs are held until sperm released by a male happen to find them and fertilize
the contents.
Many echinoderms have remarkable powers of regeneration. Some sea stars are
capable of regenerating lost arms. In some cases, lost arms have been observed to
regenerate a second complete sea star. Sea cucumbers often discharge parts of their internal
organs if they perceive danger. The discharged organs and tissues are quickly regenerated.
2.1.3.1. Comanthus sp. The echinoderm Comanthus sp. (Fig. 2.5) was collected off the northern shores of Mindoro
Island along the so-called Manila Channel in April 1994. The echinoderm was frozen
directly after collection, freeze-dried, ground, and stored at -20°C.

Materials and Methods
18
Fig. 2.5. Comanthus sp.
2.2. Chemicals
2.2.1. General laboratory chemicals (-)-2-Butanol Merk
(R)-(-)-Methoxy-�-triflourmethylphenylacetyl chloride Aldrich
(S)-(-)-Methoxy-�-triflourmethylphenylacetyl chloride Aldrich
2,2-Diphenyl-1-picryl-hydrazyl (DPPH) Sigma
2-Aminoethyl diphenylborionate Fluka
Anisaldehyde (4-methoxybenzaldehyde) Merk
Concentrated ammonia solution Fluka
Dimethylsulfoxide Merk
Formic acid Gruessing
Ninhydrin Riedel-deHaeen
Trifluroacetic acid (TFA) Merk
2.2.2. Chromatography
2.2.2.1. Stationary phases Pre-coated TLC plates, Silica Gel 60 F254, layer thickness 0.2 mm Merk
Silica Gel 60, 0.04 – 0.063 mm mesh size Merk
Pre-coated TLC plates, RP-18, F254 S, layer thickness 0.25 mm Merk
RP-18, 0.04 – 0.0.63 mm mesh size Merk
Sephadex LH-20, 0.25 – 0.1 mm mesh size Merk
Diaion HP20 Supelco
2.2.2.2. Spray reagents The reagents were stored in amber-colored bottles and kept refrigerated until being used.
TLC was used to monitor the identity of each of the fractions and the qualitative purity of

Materials and Methods
19
the isolated compounds. It was also utilized to optimize the solvent system that would be
applied for column chromatography.
Anisaldehyde/H2SO4 spray Reagent
Methanol 85 mL
Glacial acetic acid 10 mL
Conc. H2SO4 5 mL (added slowly)
Anisaldehyde 0.5 mL
Flavone reagent
Flavone Reagent A: Flavone Reagent B:
2-Aminoethyl diphenylborionate 1 g Polyethylene glycol 400 5 mL
Methanol upto 100 mL Ethanol 95 mL
2.2.3. Solvents
2.2.3.1. General solvents Acentone, acetonitrile, dichloromethane, ethanol, ethyl acetate, n-hexane, and methanol
were used. The solvents were purchased from the Institut of Chemistry, University of
Duesseldorf. They were distilled before use and special grades were used for spectroscopic
measurements.
2.2.3.2. Solvents for HPLC Acetonitrile LiChroSolv HPLC grade (Merk)
Methanol LiChroSolv HPLC grade (Merk)
Nanopure water distilled and heavy metals free water obtained by
passing distilled water through nano- and ion-
exchange filter cells (Barnstead, France).
2.2.3.3. Solvents for optical rotation Chloroform Special grade (Sigma)
Ethanol Special grade (Sigma)
Methanol Special grade (Sigma)
Water Special grade (Fluka)

Materials and Methods
20
2.2.3.4. Solvents for NMR Chloroform-d Uvasol, Merk
DMSO-d6 Uvasol, Merk
Methanol-d4 Uvasol, Merk
Pyridine-d5 Uvasol, Merk

Materials and Methods
21
2.3. Methods
2.3.1. Isolation and purification of secondary metabolites
2.3.1.1. Isolation of secondary metabolites from Acanthostylotella sp.
Acanthostylotella sp.Methanolic extract (15 g)
Liq. Liq. Fractionation
EtOAc Fraction
Vaccum Liquid Chrom. (VLC)
Sephadex LH20 Column Chromatography, DCM:MeOH, 1:1
VLC- 1 ~ 9
VLC- 3
Butanol Fraction
VLC- 1 ~ 9
Vaccum Liquid Chrom. (VLC)
VLC- 3 VLC- 5
VLC- 4 VLC- 5 VLC- 6 VLC- 7 VLC- 9
Prep. or Semiprep. HPLC
Methyl 3,4-dibromo-1H-pyrrole-2-
carboxylate (5, 15 mg)
Acanthamide A - D(1 - 4, 2.0 mg each)
4,5-dibromo-N-(methoxymethyl)-
1H-pyrrole-2-carboxamide (7, 1 mg)
4,5-dibromo-1H-pyrrole-2-carboxamide
(8, 60 mg)
Silica gel Column Chromatography, DCM:MeOH, 9:1
3,5-dibromo-1H-pyrrole-2-
carboxylic acid (6, 60 mg)
(�)-Longamide B(11, 26 mg)
Mukanadin D (9, 4 mg)
(�)-Longamide B methyl ester (10, 2 mg)
(�)-Longamide (12, 5 mg)
3,4-dibromo-1H-pyrrole-2-carboxamide
(13, 7 mg)
2-cyano-4,5-dibromo-1H-pyrrole (14, 2 mg)

Materials and Methods
22
2.3.1.2. Isolation of secondary metabolites from Stylissa massa
Stylissa massaMethanolic extract (65 g)
Liq. Liq. Fractionation
EtOAc Fraction
Vaccum Liquid Chrom. (VLC)
Semipreparative HPLC, H2O:MeOH, gradient elution
VLC- 1 ~ 20
VLC- 3
Butanol Fraction
Subfractions 3&4
Dion HP20, CC, H2O to MeOH
VLC- 8 VLC- 11 VLC- 13 VLC- 14 VLC- 16
Ethyl 3,4-dibromo-1H-pyrrole-2-
carboxylate (15, 7 mg)
Semiprep. HPLC
(10Z)-Debromohym. (33, 24 mg)Spongiacidin B (34, 4 mg)(10Z)-Hymenialdisine (35, 5 mg)(10Z)-3-Bromohym. (36, 1 mg)
VLC- 20
4-Bromopyrrole-3-carboxamide (16, 5 mg)3,4-Dibromopyrrole-2-carboxamide (17, 6 mg)(-)-Longamide B methyl ester (18, 2 mg)(-)-Longamide B ethyl ester, Hanishin (19, 2 mg)
Aldisine (20, 17 mg)2,3-Dibromoaldisine (21, 1 mg)2-Bromoaldisine (22, 6 mg)
3-Bromaldisine (23, 5 mg)(-)-Mukanadin C (24, 3 mg)(-)-Longamide (25, 2 mg)
Latonduine A (26, 6 mg)
(-)-Dibromophakellin H+Cl- (27, 5 mg)(-)-Monobromoisophakellin (28, 4 mg)(-)-Hymenine (29, 7 mg)Dispacamide E (30, 4 mg)
(-)-Longamide B (31, 9 mg)(-)-Dibromocantharelline (32, 2 mg)

Materials and Methods
23
2.3.1.3. Isolation of secondary metabolites from Jaspis splendens
Jaspis splendensMethanolic extract (15 g)
Liq. Liq. Fractionation
n-Hexane Fraction EtOAc Fraction
Vaccum Liquid Chrom. (VLC)
Seph. LH20 CC, MeOH
VLC- 1 ~ 12
VLC- 3
Semiprep. HPLC3-Ketosteroids
(40-42, 3.0 mg each)
Subfractions A ~ N
Subfr. E&FSubfr. C&D
Semiprep. HPLCJaspamide (37, 105.0 mg)Jaspamide Q (38, 0.7 mg)Jaspamide R (39, 0.5 mg)
Maculosin-1 (43, 0.8 mg)Sangivamycin (44, 1.0 mg)
2.3.1.4. Isolation of secondary metabolites from Thalassia testudinum
Thalassia testudinumMethanolic extract (4.0 g)
Liq. Liq. Fractionation
Butanol Fraction
RP C18, CC,H2O to MeOH
Subfractions A ~ F
Subfr. C&DSubfr. A&B
Semiprep. HPLCThalassiolin A (45, 1 mg)Thalassiolin C (46, 2 mg)
Luteolin-3'-O-gluc-uronide (47, 10 mg)
EtOAc Fraction

Materials and Methods
24
2.3.1.5. Isolation of secondary metabolites from Comanthus sp.
Comanthus sp.Methanolic extract (30 g)
Liq. Liq. Fractionation
n-Hexane Fraction
Vaccum Liquid Chromatography (VLC)
Sephadex LH20 Column Chromatography, DCM:MeOH, 1:1
VLC- 2
Butanol Fraction
VLC- 1 ~ 11
VLC- 3 VLC- 4 VLC- 5
EtOAc Fraction
VLC- 1 ~ 12VLC- 1 ~ 9
RP C18 CC, ACN:H2O, 1:1
Silica gel CC, Hex:EtOAc, 8:2
Aplysterol (59, 7 mg)Didehydroaplysterol (60, 7 mg)Crinosterol (61, 7 mg)24-norcrinosterol (62, 7 mg)3-O-methylcrinosterol (63, 7 mg)
Semiprep. HPLC
1'-Deoxyrhodoptilometrene (48, 8 mg)1'-Deoxyrhodoptilometrin (49, 10 mg)
RP C18 CC, ACN:H2O, 1:1Silica gel CC, Hex:EtOAc, 8:2
Comaparvin (53)/6-Methoxy-comaparvin (54), (3:2), 30 mg)
Rhodoptilometrin (50, 21 mg)
6-Methoxycomaparvin-5-methyl ether (55, 26 mg)
VLC- 7 VLC- 8
Semiprep. HPLC Semiprep. HPLC
1'-Deoxyrhodoptilometrin-6-O-sulfate (51, 4 mg)2'-Deoxythymidine (58, 3 mg)
Rhodoptilometrin-6-O-sulfate (52, 5 mg)
VLC- 9
Semiprep. HPLC
6-Methoxycomaparvin-5-methyl ether-8-O-sulfate (56, 2 mg) 6-Hydroxycomaparvin-8-O-sulfate (57, 2 mg)

Materials and Methods
25
2.3.2. Chromatographic methods
2.3.2.1. Thin layer chromatography (TLC) Chromatography refers to any separation method in which the components are distributed
between two different phases, stionary phase and mobile phase. The components separate
because of having different affinities for these two phases. Therefore, they move at
different rates along the TLC plates and the column. TLC was performed on pre-coated
TLC plates with silica gel 60 F254 (layer thickness 0.2 mm, E. Merk, Darmstadt, Germany)
using the following eluents:
For polar compounds EtOAc:MeOH:H2O (30:5:4, 30:6:5, and 30:7:6)
For semi-polar compounds DCM:MeOH (95:5, 90:10, 85:15, 80:20, and 70:30)
DCM:MeOH:EtOAc (90:10:5, and 80:20:10)
For non-polar compounds n-Hexane:EtOAc (95:5, 90:10, 85:15, 80:20, and 70:30)
n-Hexane:MeOH (95:5, and 90:10)
TLC on reversed phase RP18 F254 (layer thickness 0.25 mm, Merk, Darmstadt,
Germany) was used for polar substances and using different solvent systems of
MeOH:H2O (90:10, 80:20, 70:30, and 60:40). The band separation on TLC was detected
under UV lamp at 254 and 366 nm, followed by spraying TLC plates with
anisaldehyde/H2SO4 or vanillin/H2SO4 reagent and they were heated subsequently at
110°C.
2.3.2.2. Vacuum liquid chromatography (VLC) Vacuum liquid chromatography is a useful method as an initial isolation procedure for
samples having relatively large weights. The apparatus consists of a 500 cm sintered glass
filter funnel with an inner diameter of 12 cm. Silica gel 60 was packed to a hard cake at a
height of 5–10 cm under applied vacuum. The sample used as adsorbed onto a small
amount of silica gel using volatile solvents. The resulting sample mixture was then packed
onto top of the column. Using step gradient elution with non-polar solvent (e.g. n-Hexane
or DCM) and increasing amounts of polar solvents (e.g. EtOAc or MeOH) successive
fractions were collected. The flow was produced by vacuum and the column was allowed
to run dry after each fraction collected.

Materials and Methods
26
2.3.2.3. Column chromatography Fractions derived from VLC were subjected to repeated separation through column
chromatography using appropriate stationary and mobile phase solvent systems previously
determined by TLC. The following separation systems were used:
I. Normal phase chromatography using a polar stationary phase, typically silica gel, in
conjunction with a non-polar mobile phase (e.g. n-Hexane, DCM) with gradually
increasing amount of a polar solvent (e.g. EtOAc or MeOH). Thus, hydrophobic
compounds elute quicker than hydrophilic compounds.
II. Reversed phase (RP) chromatography using a non-polar stationary phase and a polar
mobile phase (e.g. H2O, MeOH). The stationary phase consists of silica packed with
n-alkyl chains covalently bound. For instance, C-8 signifies an octanyl chain and C-
18 an octadecyl ligand in the matrix. The more hydrophobic the matrix on each
ligand, the greater the tendency of the column to retain hydrophobic moieties. Thus,
hydrophilic compounds elute more quickly than do hydrophobic compounds. Elution
was performed using H2O with gradually increasing amount of MeOH.
III. Size exclusion chromatography involves separations based on molecular size of
compounds being analyzed. The stationary phase consists of porous beads (Sephadex
LH-20). Compounds having larger molecular size will be excluded from the interior
of the bead and thus will firstly elute, while compounds with smaller molecular size
will enter the beads and elute according to their ability to exit from the small sized
pores where they were trapped. Elution was performed using MeOH or MeOH:DCM
(1:1).
IV. Ion exclusion chromatography uses ion exchange resin beds (Diaion HP-20) that acts
as a charged solid separation medium. The components of the processed sample have
different electrical affinities to his medium and consequently they differently retained
by the resin according to their different affinities.
2.3.2.4. Flash chromatography Flash chromatography is a preparative column chromatography based on optimized pre-
packed columns and an air pressure driven eluent at a high flow rate. It is a simple and
quick technique widely used to separate a variety of organic compounds. Normally, the
columns are dry Silica Gel 69 GF254 pre-packed, of 18 cm height, vertically clamped and
assembled in the system. The column is filled and saturated with the desired mobile phase
just prior to sample loading. Samples are dissolved in a small volume of the initial solvent
used and the resulting mixture was then packed onto the top of the column using special

Materials and Methods
27
syringe. The mobile phase (isocratic or gradient elution) is then pumped through the
column with the help of air pressure resulting in sample separation. This technique is
considered as a low to medium pressure technique and is applied to samples from few
milligrams to some gram of sample.
2.3.2.5. Preparative high pressure liquid chromatography (HPLC) This technique was used for isolation and purification of compounds from fractions
previously separated using column chromatographic separation. The most appropriate
solvent systems were determined before running the HPLC separation. The mobile phase
combination was MeOH or acetonitrile and nanopure H2O with or without 0.01% TFA or
0.1% formic acid, pumped in gradient or isocratic manner depending on the compounds
retention time. Each injection consisted of 20–80 mg of the fraction dissolved in 400 mL of
the solvent system. The solvent system was pumped through the column at a rate of 20
mL/min. the eluted peaks were detected by the online UV detector and collected separately
in Erlenmeyer flacks.
Preparative HPLC system specifications are described as follows:
Pump Varian, PrepStar 218
Detector Varian, ProStar 320 UV-Vis detector
HPLC Program Varian Star (V.6)
Column Varian Dynamax (250 × 4.6 mm, ID and 250 × 21.4
mm, ID), pre-packed with Microsorb 60-8 C-18, with
integrated pre-column
2.3.2.6. Semi-preparative high pressure liquid chromatography (HPLC) This process is used for purification of compounds from fractions previously separated
using column chromatography separation. The most appropriate solvent system was
determined before running the HPLC separation. The mobile phase combination was
MeOH and nanopure H2O with or without 0.01% TFA or 0.1% formic acid, pumped in
gradient or isocratic manner depending on the compounds retention time. Each injection
consisted of 1–3 mg of the fraction dissolved in 1 mL of the solvent system. The solvent
system was pumped through the column at a rate of 5 mL/min. The eluted peaks were
detected by the online UV detector and collected separately in Erlenmeyer flasks. The
separation column (125 × 4 mm, ID) was pre-filled with Eurosphere C18 (Knauer, Berlin,
Germany).

Materials and Methods
28
Semi-preparative HPLC system specifications are described as follows:
Pump Merk Hitachi L-7100
Detector Merk Hitachi UV detector L-7400
Column Knauer (300 × 8 mm, ID), pre-packed with Eurosphere 100–10
C18, with integrated pre-column
2.3.2.7. Analytical high pressure liquid chromatography (HPLC) Analytical HPLC was used to identify the distribution of peaks either from extracts or
fractions, as well as to evaluate the purity of isolated compounds. The solvent gradient
used started with MeOH:Nanopure H2O (10:90), adjusted to pH 2 with phosphoric acid,
and reaches 100% MeOH in 35 minutes as a standard gradient, or in 25.5 minutes as a
half-time gradient. The autosampler injected 20μL sample. All peaks were detected by
UV-VIS photodiode array detector. In some cases, special programs were used. HPLC
instrument consists of the pump, the detector, the injector, the separation column, and the
reservoir of mobile phase. The separation column (125 × 2 mm, ID) was pre-filled with
Eurosphere-100 C18 (5 μm), with integrated pre-column (Knauer, Berlin, Germany).
LC/UV system specifications are described as follows:
Pump Dionex P580A LPG
Detector Dionex Photodiode Array Detector UVD 340S
Column thermostat STH 585
Autosampler ASI-100T
HPLC Program Chromeleon (V. 6.3)
Column Knauer (125 × 4 mm, ID), pre-packed with
Eurosphere 100–5 C18, with integrated pre-column
2.3.3. Structure elucidation of the isolated secondary metabolites
2.3.3.1. Mass spectrometry (MS) Mass spectrometers use the difference in mass-to-charge ratio (m/z) of ionized molecules
to separate them from each other. Mass spectrometry is therefore useful for quantification
of atoms or molecules and also for determination of chemical and structural information of
molecules. A mass spectrometer consists of an ion source, ion detector, and mass-selective

Materials and Methods
29
analyzer. The output of mass spectrometers shows a plot of relative intensity vs. the mass-
to-charge ratio (m/z).
2.3.3.1.1. Electrospray ionization mass spectrometry (ESI-MS) A mass spectrometer is an analytical instrument used to determine the molecular weight of
a compound. Principally, mass spectrometers are divided into three parts; ionization source,
analyzer, and detector, which should be maintained under high vacuum conditions in order
to maintain the ions travel through the instrument without any hindrance from air
molecules. Once a sample was injected into ionization source, the molecules are ionized.
The ions were then passed and extracted into the analyzer. In the analyzer, the ions were
separated according to their mass (m) to charge (z) ratio (m/z). Once the separated ions
flow into the detector, the signals are transmitted to the data system where the mass
spectrum is recorded.
Liquid chromatography / Mass spectrometry (LC/MS)
High pressure liquid chromatography is a powerful method for the separation of
complex mixtures, especially when many of the components may have similar polarities. If
a mass spectrum of each component can be recorded as it elutes from the LC column,
quick characterization of the components is greatly facilitated. Usually, ESI-MS is
interfaced with LC to make an effective online LC/MS. HPLC/ESI-MS was carried out
using a Finnigan LCQ-DECA mass spectrometer connected to a UV detector. The samples
were dissolved in H2O/MeOH mixtures and injected to HPLC/ESI-MS set-up. For standard
LC/MS measurements, a solvent gradient that started with acetonitrile:nanopure H2O
(10:90), adjusted with 0.1 % HCOOH, and reached to 100 % acetonitrile in 35 minutes was
used.
LC/UV/MS system specifications are described as follows:
HPLC system Agilent 1100 series (pump, detector, and autosampler)
MS spectrometer Finnigan LC Q-DECA
Column Knauer, (250 × 2 mm, ID), pre-packed with Eurosphere
100-5 C18, with integrated pre-column
2.3.3.1.2. Electron impact mass spectrometry (EI-MS) Analysis involves vaporizing a compound in an evacuated chamber and then bombarding it
with electrons having 25.80 eV (2.4–7.6 MJ/mol) of energy. The high energy electron

Materials and Methods
30
stream not only ionizes an organic molecule (requiring about 7–10 eV) but also causes
extensive fragmentation (the strongest single bonds in organic molecules have strengths of
about 4 eV). The advantage is that fragmentation is extensive, giving rise to a pattern of
fragment ions which can help to characterize the compound. The disadvantage is the
frequent absence of a molecular ion.
Low resolution EI-MS was measured on a Finnigan MAT 8430 mass spectrometer.
Measurements were done by Dr. Peter Tommes, Institute for Inorganic and Structural
Chemistry, Heinrich-Heine University, Duesseldorf.
2.3.3.1.3. Fast atom bombardment mass spectrometry (FAB-MS) This was the first widely accepted method that employs energy sudden ionization. FAB is
useful for compounds, especially polar molecules, unresponsive to either EI or CI mass
spectrometry. It enables both non-volatile and high molecular weight compounds to be
analyzed. In this technique, a sample is dissolved or dispersed in a polar and relatively
non-volatile liquid matrix, introduced into the source on a copper probe tip. Then, this
matrix is bombarded with a beam of atoms of about 8 Kev. It uses a beam of neutral gas
(Ar or Xe atoms) and both positive and negative ion FAB spectra can be obtained.
Low resolution FAB-MS was measured by a Finnigan MAT 8430 mass spectrometer.
Measurements were done by Dr. Peter Tommes, Institute for Inorganic and Structural
Chemistry, Heinrich-Heine University, Duesseldorf.
2.3.3.1.4. High resolution mass spectrometry (HR-MS) High resolution is achieved by passing the ion beam through an electrostatic analyzer
before it enters the magnetic sector. In such a double focusing mass spectrometer, ion
masses can be measured with an accuracy of about 1 ppm. With measurement of this
accuracy, the atomic composition of the molecular ions can be determined.
HRESI-MS was measured on a Micromass Qtof 2 mass spectrometer at Helmholtz
Centre for Infection Research, Braunschweig. The time-to-flight analyzer separates ions
according to their mass-to-charge ratios (m/z) by measuring the time it takes for ions to
travel through a field free region known as the flight.
2.3.3.2. Nuclear magnetic resonance spectroscopy (NMR) Nuclear magnetic resonance is a phenomenon which occurs when the nuclei of certain
atoms are immersed in a static magnetic field and exposed to a second oscillating magnetic
field. Some nuclei experience this phenomenon, and others do not, dependent upon

Materials and Methods
31
whether they possess a property called spin. It is used to study physical, chemical, and
biological properties of matter. As a consequence, NMR spectroscopy finds applications in
several areas of science. NMR spectroscopy is routinely used by chemists to study
chemical structure using simple one dimensional technique. Two dimensional techniques
were used to determine and confirm the structure of more complicated molecules.
NMR spectra were recorded at 300° K on a Bruker ARX-500 by Dr. Peter Tommes,
Institute for Inorganic and Structural Chemistry, Heinrich-Heine University, Duesseldorf.
Some measurements were also performed at the Helmholtz Centre for Infection Research,
Braunschweig, by Dr. Victor Wray using an AVANCE DMX-600 NMR spectrometer. All
1D and 2D spectra were obtained using the standard Bruker software. The samples were
dissolved in different solvents, the choice of which was dependent on the solubility of the
samples. Residual solvent signals were used as internal standards (reference signal). The
observed chemical shift (�) values were given in ppm and the coupling constants (J) in Hz.
2.3.3.3. Optical activity Optically active compounds contain at least one chiral centre. Optical activity is a
microscopic property of a collection of these molecules that arises from the way they
interact with light. Optical rotation was determined on a Perkin-Elmer-241 MC polarimeter.
The substance was stored in a 0.5 mL cuvette with 0.1 dm length. The angle of rotation
was measured at the wavelength at 546 and 579 nm of a mercury vapour lamp at room
temperature (25°C). The specific optical rotation was calculated using the expression:
� � � �� �� �546
579
579
199.4
199.3
��
���
�T
D
with � �TD� = Specific rotation at the wavelength of Sodium D-lin, 589 nm, at certain
temperature T.
� �579� and � �546� = Optical rotation at wavelengths 579 and 546 nm, respectively,
calculated using the formula:
� �cl �
��
100
where � = the measured angle of rotation in degrees,
l = the length in dm of the polarimeter tube,
c = the concentration of the substance expressed in g/100 mL.

Materials and Methods
32
2.3.3.4. Determination of absolute stereochemistry by Mosher reaction The reaction was performed according to a modified Mosher ester procedure described by
Su et al. (Ohtani et al., 1991; Su et al., 2002).
Reaction with (R)-(-)-�-(trifluoromethyl) phenylacetyl chloride
The compounds (1 mg of each) were transferred into NMR tubes and were dried under
vacuum. Deuterated pyridine (0.5 mL) and (R)-MTPA chloride were added into NMR
immediately under a N2 gas stream. The reagent was added in the ratio of 0.14 mM reagent
to 0.10 mM of the compound (Dale and Mosher, 1973). The NMR tubes were shaken
carefully to mix the samples and MTPA chloride evenly. The reaction NMR tubes were
permitted to stand at room temperature and monitored by 1H-NMR until the reaction was
completed. 1H–1H COSY was measured to confirm the assignment of the signals.
Reaction with (S)-(-)-�-(trifluoromethyl) phenylacetyl chloride
Another portion of each compound (1 mg) was transferred into NMR tube. The
reaction was performed in the same manner as described before to yield the (S)-MTPA
ester.
2.3.4. Testing the biological activity(ies) Finding the biologically important compounds from the marine sources is only
achieved if, and when, assay systems have been devised that will allow for successful
biologically guided fractionation of the culture extracts.
2.3.4.1. Antimicrobial serial dilution assay This test was conducted under aseptic conditions using microtiter 96 well plates.
Microorganisms
Crude extracts and isolated pure compounds were tested for activity against the
following standard strains:
Gram-positive bacteria Streptococcus pneumonia
Multi resistant Staphylococcus aureus (MRSA)
Enterococcus faecalis
Gram-negative bacteria Klebsiella, pneumonia
Esherichia coli
Pseudomonas aeruginosa

Materials and Methods
33
Fungi Aspergillus fumigatus
Aspergillus faecalis
Candida albicans
Candida krusei
Viruses Human Rhino Virus (HRV2)
Human Rhino Virus (HRV8)
Human Rhino Virus (HRV39)
Respiratory Syncytial Virus A (RSVA)
Antimicrobial screening assay
Test samples were dissolved in 0.2 mL DMSO followed by dilution in 800 μL cell
culture water. For further use, pure compounds were diluted from 250 to 62.5 �g/mL and
extracts from 1250 to 312 �g/mL in MHB medium for bacterial screening and in
Sabauroud medium, for fungal screening. Afterwards the substance/extract solution was
overlaid with the microbes (104 CFU/mL). Then plates were incubated at 35°C for 24 h
and 48 h to allow bacterial and fungal growth, respectively. As negative control an
antibiotic/antimycotic mix was used in addition to a non treated infected control (positive).
The test was analysed by checking the microbial growth with the visible eye and by
measurement of the turbidity at 650 nm. All procedures were done under aseptic conditions
in a sterile laminar air flow according to good laboratory practice.
Antiviral screening assay
Test samples were serially diluted in DMSO with concentrations declining from 50 to
0.39 μg/mL. Afterwards, the substances were mixed with a viral solution in a
concentration of 104 CFU/mL. Then, the mixture was incubated for 15 minutes and then
transferred on to the HeLa cells. Cell growth was checked firstly with visible inspection
under the microscope after 24 h at 35°C. After 72 h incubation period, the plates were
stained with crystal violet to control cell growth. Evaluation was done with a multiple-plate
reader.
Determination of minimum inhibitory concentration (MIC)
Minimum inhibitory concentration is defined as the least concentration of an
antimicrobial required to inhibit or control the growth of a micro-organism.
Substances with an activity around 125 μg/ml and extracts with 625 μg/ml were
considered as possible candidates for further antimicrobial screening. With these positive

Materials and Methods
34
candidates, MIC assays were performed to determine their exact values. Therefore the
substances/extracts were diluted from 125 �g/mL to 0.24 �g/mL and screened in the same
manner as in the primary screening. MICs were distinguished as the least dilutions of the
substances/extracts that revealed no microbial growth visibly or by measurement of the
turbidity at 650 nm.
2.3.4.2. Cytotoxicity assay
2.3.4.2.1. Microculture tetrazolium (MTT) Assay Cytotoxicity assays were carried out by Prof. Dr. W. E. G. Müller, Institute for
Physiological Chemistry and Pathobiochemistry, University of Mainz, Mainz. Cytotoxicity
was tested against L5178Y mouse lymphoma cells using microculture tetrazolium (MTT)
assay, and compared to that of untreated controls (Carmichael et al., 1987).
Cell cultures
L5178Y mouse lymphoma cells were grown in Eagle’s minimal essential medium
supplement with 10 % horse serum in roller tube culture. The medium contained 100
units/mL penicillin and 100 μg/mL streptomycin. The cells were maintained in a
humidified atmosphere at 37°C with 5% CO2.
MTT colorimetric assay
Of the test samples, stock solutions in ethanol 96% (v/v) were prepared. Exponentially,
growing cells were harvested, counted, and diluted appropriately. Of the cell suspension,
50 μL containing 3750 cells were pipetted into 96-well microtiter plates. Subsequently, 50
μL of a solution of the test samples containing the appropriate concentration was added to
each well. The concentration range was 3 and 10 μg/mL. The small amount of ethanol
present in the wells did not affect the experiments. The test plates were incubated at 37°C
with 5% CO2 for 72 h. A solution of 3-(4,5-dimethylthiazol-2-yl)-2,5-diphenyltetrazolium
bromide (MTT) was prepared at 5 mg/mL in phosphate buffered saline (PBS; 1.5 mM
KH2PO4, 6.5 mM Na2HPO4, 137 mM NaCl, 2.7 mM KCl; pH 7.4) and from the solution,
20 μL was pipetted into each well. The yellow MTT penetrates the healthy living cells and
in the presence of mitochondrial reductase, MTT is transformed to its blue formazan
complex. After an incubation period of 3 h 45 min at 37°C in a humidified incubator with
5% CO2, the medium was centrifuged (15 min, 20°C, 210 x g) with 200 μL DMSO, the
cells were lysed to liberate the formed formazan product. After thorough mixing, the
absorbance was measured at 520 nm using a scanning microtiter-well spectrophotometer.

Materials and Methods
35
The colour intensity is correlated with the number of healthy living cells. Cell survival was
calculated using the formula:
Survival % = 100 × medium culture ofAbsorbance-cellsuntreatedofAbsorbance
medium culture of Absorbance - cells treatedof Absorbance
All experiments were carried out in triplicates and repeated three times. As controls,
media with 0.1% EGMME/DMSO were included in the experiments.
2.3.4.2.2. Protein kinase assay Protein kinase assays were carried out by Dr. Michael Kubbutat (ProQinase GmbH,
Freiburg, Germany).
Protein kinase enzymes are integral components of numerous signal transduction
pathways involved in the regulation of cell growth, differentiation, and response to changes
in the extracellular environment. Consequently, kinases are major targets for potentially
developing novel drugs to treat diseases such as cancer and various inflammatory disorders.
The inhibitory potency of the samples was determined using 24 protein kinases (Table 2.1).
The IC50 profile of the compounds and/or fractions showing an inhibitory potency of �
40 % with at least one of the 24 kinases at an assay concentration of 1×10-06 g/mL was
determined. IC50 values were measured by testing 10 concentrations of each sample in
singlicate (n=1).
Sample preparation
The compounds/fractions were provided as 1×10-03 g/mL stock solutions in 100%
DMSO (1000 or 500 μL) in micronic boxes. The boxes stored at -20°C. Prior to the assays,
100 μL of the stock solutions was transferred into separate microtiter plates. Subsequently,
they were subjected to serial, semi-logarithmic dilution using 100% DMSO as a solvent
resulting in 100 different concentrations, using 100% DMSO as control. Then, 7 × 5 μL of
each concentration were aliquoted and diluted with 45 μL H2O only a few minutes before
being transferred into the assay plate to minimize precipitation. The plates were shaked
thoroughly and then used for the transfer of 5 μL compound solution into the assay plates.
Recombinant protein kinases
All protein kinases were expressed in Sf9 insect cells as human recombinant GST-
fusion proteins or His-tagged proteins by means of the baculovirus expression system.
Kinases were purified by affinity chromatography using either GSH-agarose (Sigma) or
Ni-NTH-agarose (Qiagen). Purity was checked by SDS-PAGE/silver staining and the

Materials and Methods
36
identity of each kinase was verified by western blot analysis with kinase specific
antibodies or by mass spectrometry.
Protein kinase assay
A proprietary protein kinase assay (33PanQinase® Activity Assay) was used for
measuring the kinase activity of the protein kinases. All kinase assays were performed in
96-well FlashPlatesTM from Perkin Elmer/NEN (Boston, MA, USA) in a 50 μL reaction
volume. The reaction mixture was pipetted in the following order: 20 μL assay buffer, 5
μL ATP solution in H2O, 5 μL test compound in 10% DMSO and 10 μL substrate / 10 μL
enzyme solution (premixed). The assay for all enzymes contained 60 mM HEPES-NaOH
(pH 7.5), 3 mM MgCl2, 3 mM MnCl2, 3 μM Na-orhtovanadate, 1.2 mM DTT, 50 μg/mL
PEG20000, 1 μM [�-33P]-ATP. The reaction mixtures were incubated at 30°C for 80 minutes
and stopped with 50 μL 2% (v/v) H3PO4. The plates were aspirated and washed two times
with 200 μL of 0.9% (w/v) NaCl or 200 μL H2O. Incorporation of 33Pi was determined
with a microplate scintillation counter (Microbeta Trilux, Wallac). All assays were
performed with a Beckman Coulter/Sagian robotic system.
2.3.4.2.3. Radical scavenging (DPPH) assay
Extracts, fractions and/or pure compounds were evaluated for their ability to function as
free radical scavengers. The qualitative test was performed with a rapid TLC screening
method using the 2,2-diphenyl-1-picrylhydrazyl radical (DPPH). Analytical TLC on Silica
gel 60 F254 plates were developed under appropriate conditions after application of 10 μL
of each test compound solution (1 mg/mL), dried and sprayed with DPPH solution (0.2%
w/v, MeOH); 5 min later active compounds appeared as yellow spots against a purple
background. The purple stable free radical 2,2-diphenyl-1-picrylhydrazyl was reduced to
the yellow colored diphenylpicryl hydrayzine. Quercetin was used as a standard
antioxidant.
The quantitative assay was carried out at room temperature as described in 2007 by
Tsevegsuren et al.: 10 μL of a methanolic solution of the test compound(s) were added to
490 μL of a 100 μM DPPH solution in MeOH. Serial concentrations, ranging from 1.56 to
200 μM, were prepared and analyzed in triplicate. 490 μL of 100 μM DPPH solution in
MeOH plus 10 μL of propyl gallate, 100 μM solution were used as positive control. 490
μL of 100 μM DPPH solution plus 10 μL of MeOH were used as blank. The absorbance at
517 nm was determined after 30 min incubation and the percentage of DPPH reduction
was calculated. The difference between a DPPH blank solution and the positive control

Materials and Methods
37
was taken as 100% antioxidative activity. The percent antioxidative activity was then
calculated from the difference in absorption between the test sample and the DPPH blank
as follows:
�A (%) = [(AB-AP)/(AB-APos)] × 100
where aA= % antioxidative activity in comparison with the positive control, AB= absorption
of DPPH solution as blank, AP= absorption of test sample, and APos= absorption of positive
control (propylgallate). IC50 values were calculated by linear regression (Tsevegsuren et
al., 2007). Quercetin was taken as reference compound under the same experimental
conditions.
Table 2.1. List of tested protein kinases, their substrates and diseases induced.
Family Kinase SubstrateOncologically
relevantmechanism
Disease
Serine/Threonine kinases
AKTI/PKB alpha
GCS3(14-27) Apoptosis Gastric cancer (Staal, 1987)
ARK5 Autophos. Apoptosis Colorectal cancer (Kusakai et al., 2004)
Aurora A tetra(LRRWSLG) Proliferation Pancreatic cancer (Li et al., 2003)
Aurora B tetra(LRRWSLG) Proliferation Breast cancer (Keen and Taylor, 2004)
CDK2/Cyclin A
Histone H1 Proliferation Pancreatic cancer (Iseki et al., 1998)
CDK4/Cyclin D1
Rb-CTF Proliferation Breast cancer (Yu et al., 2006)
CK2-alpha 1 P53-CTM Proliferation Rhabdomyosarcoma (Izeradjene et al., 2004)
COT Autophos. Proliferation Breast cancer (Sourvinos, 1999)
PLK-1 Casein Proliferation Prostate cancer (Weichert et al., 2004)

Materials and Methods
38
Family Kinase SubstrateOncologically
relevantmechanism
Disease
B-RAF-VE MEK1-KM Proliferation Thyroid cancer (Ouyang et al., 2006)
SAK Autophos. Proliferation Colorectal cancer (Macmillan et al., 2001)
Soluble Tyrosine kinase
FAK Poly(Glu,Tyr)4:1 Metastasis Breast cancer (Schmitz et al., 2005)
SRC Poly(Glu,Tyr)4:1 Metastasis Colon cancer (Dehm et al., 2001)
Receptor
Tyrosine
kinase
EGFR Poly(Glu,Tyr)4:1 Proliferation Glioblastoma
multiform
(National Cancer
Institute, 2005)
EPHB4 Poly(Glu,Tyr)4:1 Angiogenesis Prostate cancer
(Xia et al., 2005)
ERBB2 Poly(Glu,Tyr)4:1 Proliferation Gastric carcinoma
(Lee et al., 2005)
FLT3 Poly
(Ala,Glu,Lys,Tyr)6:2:4:1
Proliferation Leukemia
(Menezes et al.,
2005)
IGF1-R Poly(Glu,Tyr)4:1 Apoptosis Breast cancer
(Zhang and Yee,
2000)
INS-R Poly
(Ala,Glu,Lys,Tyr)6:2:4:1
“Counter
Kinase”
Ovarian cancer
(Kalli et al., 2002)
MET Poly
(Ala,Glu,Lys,Tyr)6:2:4:1
Metastasis Lung cancer
(Qiao, 2002)
PDGFR-
beta
Poly
(Ala,Glu,Lys,Tyr)6:2:4:1
Proliferation Prostate cancer
(Hofer et al.,
2004)

Materials and Methods
39
Family Kinase SubstrateOncologically
relevantmechanism
Disease
TIE-2 Poly(Glu,Tyr)4:1 Angiogenesis Rheumatoid
arhtiritis
(DeBusk et al.,
2003)
VEGF-R2 Poly(Glu,Tyr)4:1 Angiogenesis Pancreatic cancer
(Li et al., 2003)
VEGF-R3 Poly(Glu,Tyr)4:1 Angiogenesis Breast cancer
(Garces et al.,
2006)
2.3.5. General laboratory equipment Balances Mettler 200, Mettler AT 250, Mettler PE 1600,
Sartorious MCI AC210S
Centrifuge Biofuge pico, Heraeus
Cleanbench HERAsafe, Heraeus
Digital pH meter 420Aplus, Orion
Drying Ovens Kelvitront, Heraeus
Fraction collector Cygnet, ISCO
Freeze dryer Lyovac GT2, Steris
-80°C Freezer Forma Scientific, 86-Freezer
Hot plate Camag
Magnetic stirrer Combi Mag, IKA
Rotary evaporator Vacuubrand, IKA
Sonicator Sonorex RK 102, Bandelin
Syringes Hamilton
Ultra Turrax T18 basic, IKA
UV lamp Camag (254 and 366)
Vacuum centrifuge SpeedVac SPD 111V, Savant

Results
40
3. Results
3.1. Secondary metabolites isolated from Acanthostylotella sp. In this study, we investigated an undescribed species of the genus Acanthostylotella (class
Demospongiae, order Poecilosclerida, family Raspailiidae), collected at the East side of
Nusa Lembongan, Selat Ceningan, Bali, Indonesia in 2001. Total methanolic extract of the
sponge was subjected to liquid-liquid partition technique against n-Hexane, EtOAc, and
BuOH. The EtOAc soluble fraction was then subjected to VLC and eluted using a stepwise
gradient system from 100% n-Hexane to 100% EtOAc, and from 100% DCM to 100%
MeOH. Each fraction was purified by column chromatography using Sephadex LH-20 as a
stationary phase and either MeOH or DCM:MeOH (1:1) as a mobile phase followed by
either preparative or semi-preparative reversed phase HPLC (C18 Eurosphere 100) when
required using the appropriate gradient elution of MeOH:H2O.
This afforded six new dibromopyrrole alkaloids (1–6) in addition to eight known
compounds (9–14). The optical rotations of compounds 10, 11, and 12 were determined
which indicated that they were all racemate mixtures. Isolated compounds were tested for
different bioactivities, including cytotoxicity, antimicrobial, protein kinase, and radical
scavenging activites.
In this part, we would present the results of the chemical investigation of the natural
products produced by Acanthostylotella sp.

Results
41
3.1.1. Acanthamide A (1, new natural product)
Acanthamide A
Synonym(s) Methyl 4-(3,4-dibromo-1H-pyrrole-2-carboxamido) butanoate
Sample code VLC-4-C,D-6
Biological source Acanthostylotella sp.
Sample amount 2.0 mg
Physical description White amorphous solid
Molecular formula C10H1279Br2N2O3
Molecular weight 368 g/mol
Retention time (HPLC) 25.1 min (standard gradient)
N
H
NH
O
1
2
Br34
56 7 8
H
9O
O
CH310 1112
Br
0,0 10,0 20,0 30,0 40,0 50,0 60,0-20
50
100
150
200 SE070328 #8 VLC-4-C,D-6 UV_VIS_3mAU
min
1 - 2
5,11
1
2 - 3
7,09
9
WVL:280 nm
Peak #1 100%
-10,0 200 250 300 350 400 450 500 550 595
%
nm
275.9
214.8 233.7
3,4-Dibromopyrrole-2-carbamide 991.0070,0
[M+H]+

Results
42
Compound (1) was obtained as a white amorphous solid. The molecular formula of 1
was revealed to be C10H1279Br2N2O3 by HRESIMS (m/z 366.9296 [M+H] +, � +2.4 ppm),
and the existence of two bromine atoms in the compound was supported by ESI mass
spectrum which exhibited pseudomolecular ion peaks at m/z 366, 368, and 370 in a ratio of
1:2:1. The UV absorption [�max 276 nm] was indicative of a substituted pyrrole
chromophore (Forenza et al., 1971; Garcia et al., 1973). Structural elucidation of 1 was
based on results of 1D and 2D NMR spectral analyses including 1H NMR, 1H�1H COSY,
and HMBC (Table 3.1), (Fig. 3.1). The position of the aromatic proton [�H 6.90 (d, 2.2
Hz)] at C-5 of the pyrrole ring was established based on the 1H�1H COSY spectrum that
showed a clear correlation between the aromatic proton and NH proton of the pyrrole ring.
In addition to 1H�1H COSY, the HMBC spectra confirmed the nature of the side chain
and its attachment to C-2 of the pyrrole ring. The 1H�1H COSY spectrum further
disclosed the presence of one spin system extending from NH-7 to the methylene group at
C-10 passing over two other methylene groups at positions 8 and 9. The HMBC spectrum
(Fig. 3.1) unambiguously proved the attachment of the side chain to the carbonyl group C-
6 by exhibiting correlations between both the amide proton (NH-7) [�H 8.12 (t, 6.3 Hz)]
and the methylene protons at C-8 [�H 3.20 (q, 6.3 Hz)] to the carbonyl carbon C-6 (�C
159.7). Also, the HMBC spectrum confirmed the presence of a methyl ester group (CH3-
12) whose protons [�H 4.00 (s, 3 H)] showed correlations with the methylene protons at C-
9 and C-10 to the carbonyl carbon C-11 (�C 173.9). From these data, compound 1 was
identified as methyl 4-(3,4-dibromo-1H-pyrrole-2-carboxamido) butanoate which was
named acanthamide A.
Fig. 3.1. HMBC spectrum and key correlations of acanthamide A (1).
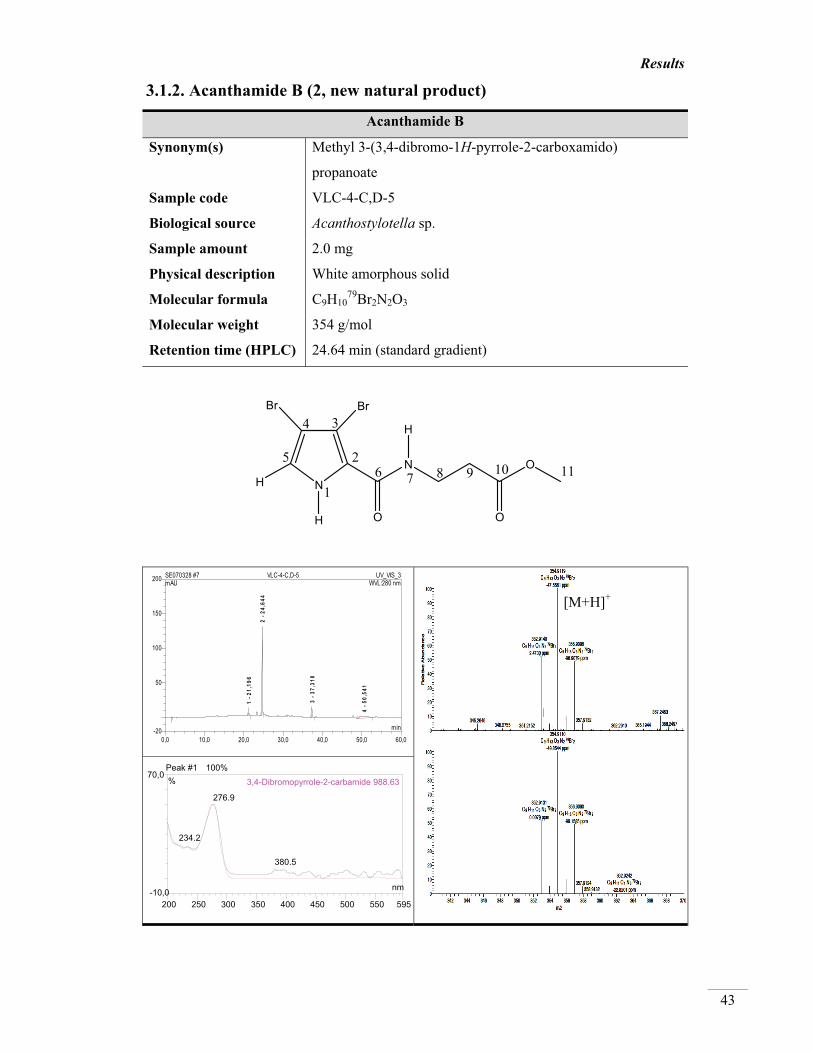
Results
43
3.1.2. Acanthamide B (2, new natural product)
Acanthamide B
Synonym(s) Methyl 3-(3,4-dibromo-1H-pyrrole-2-carboxamido)
propanoate
Sample code VLC-4-C,D-5
Biological source Acanthostylotella sp.
Sample amount 2.0 mg
Physical description White amorphous solid
Molecular formula C9H1079Br2N2O3
Molecular weight 354 g/mol
Retention time (HPLC) 24.64 min (standard gradient)
N
H
NH
O
1
2
Br34
56 7 8
H
9 O10 11
Br
O
0,0 10,0 20,0 30,0 40,0 50,0 60,0-20
50
100
150
200 SE070328 #7 VLC-4-C,D-5 UV_VIS_3mAU
min
1 - 2
1,19
6
2 - 2
4,64
4
3 - 3
7,31
0
4 - 5
0,54
1
WVL:280 nm
Peak #1 100%
-10,0200 250 300 350 400 450 500 550 595
%
nm
276.9
234.2
380.5
3,4-Dibromopyrrole-2-carbamide 988.6370,0
[M+H]+

Results
44
3.1.3. Acanthamide C (3, new natural product)
Acanthamide C
Synonym(s) Ethyl 3-(3,4-dibromo-1H-pyrrole-2-carboxamido) propanoate
Sample code VLC-4-C,D-7
Biological source Acanthostylotella sp.
Sample amount 2.0 mg
Physical description White amorphous solid
Molecular formula C10H1279Br2N2O3
Molecular weight 368 g/mol
Retention time (HPLC) 25.62 min (standard gradient)
N
H
NH
O
1
2
Br34
56 7 8
H
9 O10 11
Br
O
12
0,0 10,0 20,0 30,0 40,0 50,0 60,0-20
50
100
140 SE070328 #9 VLC-4-C,D-7 UV_VIS_3mAU
min
1 - 2
5,61
7
2 - 3
7,21
3
WVL:280 nm
Peak #1100%
-10,0
70,0
200 250 300 350 400 450 500 550 595
%
nm
276.1
233.9
491.6
3,4-Dibromopyrrole-2-carbamide 986.83
[M+H]+

Results
45
Compound (2) was obtained as a white amorphous solid. The ESI mass spectrum of 2
revealed a pseudomolecular ion peaks at m/z 352, 354, and 356, in a ratio of 1:2:1,
supporting the presence of two bromine atoms in the compound. The molecular formula
was determined as C9H1179Br2N2O3 by HRESIMS (m/z 352.9140 [M+H] +, � +2.5 ppm)
which differs from that of 1 by the lack of 14 amu. In the 1H-NMR spectrum of 2, one
methylene group present in the spectrum of 1 [�H 1.70 (m, 2H)] is missing. The structure of
2 was unambiguously established based on 1D and 2D NMR including 1H NMR and 1H�1H COSY (Table 3.2). The 1H�1H COSY spectrum exhibited an aromatic proton [�H
6.86 (d, 2.5 Hz)] at C-5 next to the NH proton as observed for compound 1. The nature of
the side chain attached at C-2 of the pyrrole ring was deduced based on the 1H�1H COSY
spectrum which revealed the presence of a CO(NH)�(CH2)2� unit thus confirming the
connectivity from the amide (NH-7) to the methylene group (CH2-9) through the
methylene group at position 8. Thus, the structure of 2 was assigned as methyl 3-(3,4-
dibromo-1H-pyrrole-2-carboxamido) propanoate; acanthamide B which differs from
acanthamide A by lack of one methylene group in the side chain.
Compound (3) was isolated from EtOAc soluble fraction as a white amorphous solid.
Its molecular formula was established as C10H1279Br2N2O3 by HRESIMS (m/z 366.9295
[M+H]+, � +2.0 ppm). It exhibited pseudomolecular ion peaks at m/z 367, 369, and 371 in
its ESI mass spectrum, in a ratio of 1:2:1, indicating that 3 was a dibrominated compound
exhibiting the same molecular formula like compound 1. Structural confirmation was
based on results of 1H NMR and 1H�1H COSY spectra (Table 3.2). The 1H�1H COSY
spectrum revealed the aromatic proton [�H 6.86 (d, 2.8 Hz)] at C-5 ortho to the NH group.
The 1H�1H COSY spectrum further confirmed the connectivity between the amide proton
at (NH-7) and the methylene group at C-9. It also proved the presence of an ethyl ester
group. Compound 3 revealed to be ethyl 3-(3,4-dibromo-1H-pyrrole-2-carboxamido)
propanoate and it was given the name acanthamide C.

Results
46
3.1.4. Acanthamide D (4, new natural product)
Acanthamide D
Synonym(s) Ethyl 4-(3,4-dibromo-1H-pyrrole-2-carboxamido) butanoate
Sample code VLC-4-C,D-8
Biological source Acanthostylotella sp.
Sample amount 2.0 mg
Physical description White amorphous solid
Molecular formula C11H1479Br2N2O3
Molecular weight 382 g/mol
Retention time (HPLC) 26.28 min (standard gradient)
N
H
NH
O
1
2
Br34
56 7 8
H
9O
10 11
Br
12
O
13
0,0 10,0 20,0 30,0 40,0 50,0 60,0-10
25
50
75
120 SE070328 #10 VLC-4-C,D-8 UV_VIS_3mAU
min
1 - 2
6,28
4
2 - 3
7,17
9
3 - 5
0,45
6
WVL:280 nm
Peak #1 100%
-10,0 200 250 300 350 400 450 500 550 595
%
nm
275.8
214.5234.2
3,4-Dibromopyrrole-2-carbamide 984.3270,0
[M+H]+

Results
47
Compound (4) was isolated as a white amorphous solid from EtOAc soluble fraction.
Based on HRESIMS, it was shown to have the molecular formula C11H1479Br2N2O3 (m/z
380.9454 [M+H]+, � +2.5 ppm) which is 14 mass units larger than the molecular weights
of 1 and 3. Moreover, its ESI mass spectrum gave pseudomolecular ion peaks at m/z 380,
382, and 384 confirming the presence of two bromine substituents in the structure of 3.
The structure was confirmed based on 1H NMR and 1H�1H COSY spectra (Table 3.2)
(Fig. 3.2). As for compound 4, the 1H�1H COSY spectrum (Fig. 3.2) proved the presence
of an ethyl ester group (positions 12 [�H 4.00 (q, 7.0 Hz, 2H)] and 13 [�H 1.20 (t, 7.0 Hz,
3H)]). Also, it confirmed the position of the aromatic proton [�H 6.90 (d, 2.8 Hz)] at C-5 of
the pyrrole ring and the position of the side chain at C-2 by establishing the connectivity
from the amide proton (NH-7) to the methylene group at C-10. Thus, the structure of 4 was
established as ethyl 4-(3,4-dibromo-1H-pyrrole-2-carboxamido) butanoate, acanthamide D.
Fig. 3.2. 1H–1H COSY spectrum of acanthamide D (4).

Results
48
Table 3.1. NMR data of acanthamides A (1), measured in DMSO-d6.
H no. 1
�H COSY �Ca HMBC
(C to H) 1-NH 12.65 (1H, br s) H-1/H-5
2 128.8
3 104.9
4 n.d.
5 6.90 (1H, d, 2.2 Hz) H-5/H-1 113.1 CH-2
CH-5
6 159.7
7-NH 8.12 (1H, t, 6.0 Hz) H-7/H-8 NH-6
8 3.20 (2H, q, 6.0 Hz) H-8/H-9 38.7 CH2-6
CH2-10
9 1.70 (2H, m) H-9/H-10 25.1 CH2-10
CH2-11
10 2.30 (2H, t, 7.0 Hz) H-10/H-9 31.4 CH2-8
CH2-11
11 173.9
12 4.00 (3H, s) 51.7 OCH3-11
13 a 13C NMR data were obtained from HMBC spectra. n.d. not detected.
Table 3.2. NMR data of acanthamides B–D (2–4), measured in DMSO-d6.
H no. 2 3 4
�H COSY �H COSY �H COSY
1-NH 12.7 (1H, br s) H-1/H-5 12.68 (1H, br s) H-1/H-5 12.65 (1H, br s) H-1/H-5
2
3
4
5 6.86 (1H, d, 2.5 Hz) H-5/H-1 6.88 (1H, d, 2.8 Hz) H-5/H-1 6.90 (1H, d, 2.8 Hz) H-5/H-1
6
7-NH 8.20 (1H, t, 5.5 Hz) H-7/H-8 8.20 (1H, t, 5.0 Hz) H-7/H-8 8.10 (1H, t, 5.0 Hz) H-7/H-8
8 3.40 (2H, q, 6.0 Hz) H-8/H-9 3.40 (2H, q, 6.0 Hz) H-8/H-9 3.20 (2H, q, 6.0 Hz) H-8/H-9
9 2.60 (2H, t, 6.6 Hz) H-9/H-8 2.60 (2H, t, 6.6 Hz) H-9/H-8 1.70 (2H, m) H-9/H-10
10 2.30 (2H, t, 7.0 Hz) H-10/H-9
11 3.60 (3H, s) 4.00 (2H, q, 7.0 Hz) H-11/H-12
12 1.20 (3H t, 7.0 Hz) H-12/H-11 4.00 (2H, q, 7.0 Hz) H-12/H-13
13 1.20 (3H t, 7.0 Hz) H-13/H-12

Results
49
3.1.5. Methyl 3,4-dibromo-1H-pyrrole-2-carboxylate (5, new natural product)
Methyl 3,4-dibromo-1H-pyrrole-2-carboxylate
Synonym(s) Methyl 3,4-dibromo-1H-pyrrole-2-carboxylate
Sample code R2-9, Ac-3
Biological source Acanthostylotella sp.
Sample amount 15.0 mg
Physical description Pale Pink needle crystals
Molecular formula C6H579Br2NO2
Molecular weight 283 g/mol
Retention time (HPLC) 21.06 min (half-time gradient)
N
BrBr
HO
OH
1
2
34
5 CH36
7
0,0 5,0 10,0 15,0 20,0 25,0 30,0-100
200
400
600
900 SE070318 b #11 R2-9 UV_VIS_2mAU
min
1 - 20,134
2 - 21,057
3 - 28,57
WVL:254 nm
Peak #2 100%
-10,0 200 250 300 350 400 450 500 550 595
%
nm
278.2201.5
234.4
4,5-dibromopyrrole-2-carboxylic acid 986.5270,0
[M-H]-

Results
50
Compound (5) was isolated as pale pink needle crystals. It showed pseudomolecular
ion peaks at m/z 281,283, and 285 at a 1:2:1 ratio in its ESI mass spectrum indicating that it
was a dibrominated compound. The molecular formula of C6H579Br2NO2 was confirmed by
HRESIMS (m/z 279.8613 [M-H]-, � +3.6 ppm). Derivatives of compound (5) exhibiting
either a triisopropylsilyl or a methoxycarbonyl group as substituents of the pyrrole nitrogen
atom had been reported as synthetic products (Handy and Zhang, 2006). In our study, 5
was obtained for the first time as a naturally-occurring bromopyrrole alkaloid. The 13C
NMR spectrum showed 6 signals representing one methoxy group and five sp2 carbons
including one methine group and four fully substituted carbons. 1H and 13C NMR data of 5
(Table 3.3) were similar to those of the known related compounds methyl 4,5-dibromo-1H-
pyrrole-2-carboxylate (5A) (König et al., 1998; Forenza et al., 1971), and methyl N-
methyl-4,5-dibromopyrrole-2-carboxylate (Fathi-Afshar and Allen, 1988). The structure of
5 was further confirmed by interpretation of 1H�1H COSY, and HMBC spectra. The 1H�1H COSY spectrum showed a cross peak between the NH proton and the aromatic
proton H-5 [�H 6.88 (d, 2.8 Hz); �C 117.9]. The HMBC spectrum (Fig. 3.3) supported the
presence of the aromatic proton at C-5 and also revealed correlations between H-5 to C-2
(�C 123.7) and C-3 (�C 107.1). The presence of a methyl ester group [�H 3.87 (3H, s)] was
deduced from correlation of the methyl protons to the carbonyl group C-6 (�C 160.2).
Moreover, the methyl ester protons showed a HMQC correlation to C-7 (�C 52.0).
Therefore, 5 was confirmed to be methyl 3,4-dibromo-1H-pyrrole-2-carboxylate.
Fig. 3.3. HMBC spectrum and key correlations of methyl 3,4-dibromo-1H-
pyrrole-2-carboxylate (5).

Results
51
3.1.6. 3,5-Dibromo-1H-pyrrole-2-carboxylic acid (6, new natural product)
3,5-Dibromo-1H-pyrrole-2-carboxylic acid
Synonym(s) 3,5-Dibromo-1H-pyrrole-2-carboxylic acid
Sample code VLC-7-Seph. G
Biological source Acanthostylotella sp.
Sample amount 60.0 mg
Physical description White powder
Molecular formula C5H379Br2NO2
Molecular weight 269 g/mol
Retention time (HPLC) 23.87 min (standard gradient)
N
BrH
BrOH
OH
1
2
34
56
0,0 10,0 20,0 30,0 40,0 50,0 60,0-50
100
200
300
400
500
600 SE070318 #2 VLC-7-Seph. G UV_VIS_2mAU
min
1 - 2
3,87
2
2 - 3
7,05
9
3 - 5
0,63
4
WVL:254 nm
Peak #1 100%
-10,0
70,0
200 250 300 350 400 450 500 550 595
%
nm
277.2
233.9
365.4
3,4-Dibromo-1H-pyrrole-carboxylic acid 997.38
[M-H]-
[M-H]-

Results
52
Compound (6) was isolated as a white powder. The molecular formula of 6 was
suggested to be C5H379Br2NO2 by HRESIMS (m/z 265.8462 [M-H]-, � +5.6 ppm). The
structure was completely elucidated by 1D and 2D NMR spectral analyses including 1H, 13C NMR, and HMBC (Table 3.3), in addition to comparison of the data with those of
structurally related compounds which are dibrominated at positions 4 and 5 or 3 and 4 of
the pyrrole ring, like in the known compounds 8 and 13, respectively. The 13C-NMR
spectrum of 6 was similar to those of 8 and 13. It revealed the presence of five sp2 carbons
including one methine carbon (�C 114.4) and four fully substituted carbons including one
carbonyl carbon (�C 161.9). Also the 1H NMR spectrum showed one aromatic proton [�H
6.60 (s)] attached to C-4 (�C 114.4) while no signals for the NH2 between 7 to 8 ppm were
observed as found in the known congeners 8 and 13. Both 1H and 13C NMR values of C-4
were similar to those observed in related compounds as in hymenialdisine (Cimino et al.,
1982; Kitagawa et al., 1983), axinohydantoin (Pettit et al., 1990), and spongiacidin D
(Inaba et al., 1998). The HMBC spectrum (Fig. 3.4) exhibited correlations between H-4 to
carbons C-2 (�C 129.6) and C-5 (�C 103.3). Accordingly, 6 was deduced to be 3,5-
dibromo-1H-pyrrole-2- carboxylic acid.
Fig. 3.4. HMBC spectrum and key correlations of 3,5-dibromo-1H-pyrrole
-2-carboxylic acid (6).

Results
53
3.1.7. 4,5-Dibromo-N-(methoxymethyl)-1H-pyrrole-2-carboxamide (7, known compound)
4,5-Dibromo-N-(methoxymethyl)-1H-pyrrole-2-carboxamide
Synonym(s) 4,5-Dibromo-N-(methoxymethyl)-1H-pyrrole-2-carboxamide
Sample code VLC-5-C
Biological source Acanthostylotella sp.
Sample amount 1.0 mg
Physical description White amorphous solid
Molecular formula C7H879Br2N2O2
Molecular weight 312 g/mol
Retention time (HPLC) 17.81 min (standard gradient)
N
Br
Br
NOCH3
O
H
1
2
34
5 6 7 89
H
H
0,0 10,0 20,0 30,0 40,0 50,0 60,0-50
100
200
300
450 SE070222 #10 VLC-5-C UV_VIS_3mAU
min
1 - 1
7,81
0
2 - 2
2,54
03
- 24,
803
4 - 3
6,88
2
5 - 5
0,64
2
WVL:280 nm
No ionization in +ESI MS
Peak #1 100%
-10,0
70,0
200 250 300 350 400 450 500 550 595
%
nm
273.1
235.1
449.1
3,4-Dibromopyrrole-2-carbamide 973.10
[M-H]-

Results
54
3.1.8. 4,5-Dibromo-1H-pyrrole-2-carboxamide (8, known compound)
4,5-Dibromo-1H-pyrrole-2-carboxamide
Synonym(s) 4,5-Dibromo-1H-pyrrole-2-carboxamide
Sample code VLC-6-Seph. E
Biological source Acanthostylotella sp.
Sample amount 60.0 mg
Physical description White amorphous solid
Molecular formula C5H479Br2N2O
Molecular weight 268 g/mol
Retention time (HPLC) 20.72 min (standard gradient)
N
Br
Br
NH2
O
H
1
234
5 6
7
H
0,0 10,0 20,0 30,0 40,0 50,0 60,0-100
125
250
375
600 SE070304 #6 VLC-6-Seph. E UV_VIS_1mAU
min
1 - 14,554
2 - 20,722
3 - 36,952
4 - 47,6905 - 50,136
WVL:240 nm
No ionization in +ESI MS
Peak #2 100%
-10,0 200 250 300 350 400 450 500 550 595
%
nm
276.1
233.1
365.5
3,4-Dibromopyrrole-2-carbamide 998.4270,0
[M-H]-

Results
55
Compound (7) was isolated as an amorphous white solid. In ESI mass spectrum, it
revealed pseudomolecular ion peaks at m/z 309, 311, and 313 [M-H]-, in a ratio of 1:2:1,
confirming the existence of two bromine substituents in 7. The structure was further
confirmed by 1H NMR and 1H–1H COSY. According to these data (Table 3.4) and the
reported literature (Umeyama et al., 1998), compound (7) was deduced to be 4,5-dibromo-
N-(methoxymethyl)-1H-pyrrole-2-carboxamide.
Compound (8) was isolated as an amorphous white solid. In ESI mass spectrum, it
revealed pseudomolecular ion peaks at m/z 265, 267, and 269 [M-H]-, in a ratio of 1:2:1,
confirming the existence of two bromine substituents in 8. The structure was further
confirmed by 1D and 2D NMR including 1H, 13C NMR, 1H–1H COSY, and HMBC (Fig.
3.5). According to these data (Table 3.4) and the reported literature (Forenza et al., 1971),
compound (8) was revealed to be 4,5-dibromo-1H-pyrrole-2-carboxamide.
Fig. 3.5. HMBC spectrum and key correlations of 4,5-dibromo-1H-pyrrole
-2-carboxamide (8).

Results
56
Table 3.3. NMR data of compounds 5, and 6.
H
no.
5a 5A (König et al., 1998) 6b
�H �C �H �C �H �C
1 9.50 (1H, br s) 9.32 (1H, br s)
2 123.7 123.8 129.6
3 107.1 6.90 (1H, s) 117.9 97.7
4 100.6 100.8 6.60 (1H, br s) 114.4
5 6.90 (1H, d, 2.5 Hz) 118.0 106.7 103.3
6 160.2 159.9 161.9
7 3.87 (3H, s) 52.0 3.80 (3H, s) 52.0 aNMR data measured in CDCl3. bNMR data in DMSO-d6.
Table 3.4. NMR data of compounds 7, 8, 13, and 14.
H
no.
7a 8b 13b 14a
�H �H �C �H �Cc �H
1 9.37 (1H, br s) 12.63 (1H, br s) 12.63 (1H, br s) 9.15 (1H, br s)
2 128.2 125.0
3 6.60 (1H, br s) 6.90 (1H, s) 113.1 104.6
4 97.7 97.7
5 104.6 6.90 (1H, d, 2.50 Hz) 113.1 6.87 (1H, d, 2.85 Hz)
6 160.4 160.2
7 7.17 (1H, br s)
7.58 (1H, br s)
7.17 (1H, br s)
7.59 (1H, br s)
8 4.84 (2H, d, 6.60 Hz)
9 3.38 (3H, s) aNMR data measured in CDCl3. bNMR data in DMSO-d6. c13C-NMR values were obtained from HMBC spectra.

Results
57
3.1.9. Mukanadin D (9, known compound)
Mukanadin D
Synonym(s) 4,5-Dibromo-N-(3-(2,5-dioxoimidazolidin-4-ylidene) propyl)-1H-pyrrole-2-carboxamide
Sample code VLC-6-D-10
Biological source Acanthostylotella sp.
Sample amount 4.0 mg
Physical description White needle crystals
Molecular formula C11H1079Br2N4O3
Molecular weight 406 g/mol
Retention time (HPLC) 24.33 min (standard gradient)
N
N
O H
NN
O
O
Br
Br1
2
3
56 7 8 9 10
1112
13
1415
H
H
HH
4 H
0,0 10,0 20,0 30,0 40,0 50,0 60,0-50
100
200
350 SE070404 #5 6-D-10 UV_VIS_1mAU
min
1 - 24,325
2 - 37,855
WVL:235 nm
Peak #1 100%
-10,0200 250 300 350 400 450 500 550 595
%
nm
278.6
221.6
564.1
22-Dehydrocampesterol 982.6170,0
[M+H]+
[M-H]-

Results
58
Compound (9) was isolated as a white needle crytals. In ESI mass spectrum, it
revealed pseudomolecular ion peaks at m/z 403, 405, and 407 [M-H]-, in a ratio of 1:2:1,
confirming the existence of two bromine substituents in 9. The structure was further
confirmed by 1D and 2D NMR including 1H NMR, and 1H–1H COSY (Fig. 3.6).
According to these data (Table 3.5) and the reported literature (Hu et al., 2005), compound
(9) was proven to be mukanadin D.
Fig. 3.6. 1H–1H COSY of mukanadin D (9).
Table 3.5. NMR data of mukanadin D (9), measured in DMSO-d6.
H no. 9
�H H no. �H
1 12.70 (1H, br s) 9 2.35 (2H, m)
2 10 5.52 (1H, t, 7.6 Hz)
3 11
4 6.89 (1H, s) 12
5 13 10.16 (1H, br s)
6 14
7 8.20 (1H, br s) 15 10.95 (1H, br s)
8 3.30 (2H, m)

Results
59
3.1.10. (±)-Longamide B methyl ester (10, known compound)
(±)-Longamide B methyl ester
Synonym(s) Methyl 2-(6,7-dibromo-1,2,3,4-tetrahydro-1-oxopyrrolo[1,2-a]pyrazin-4-yl) acetate
Sample code 6-D-2
Biological source Acanthostylotella sp.
Sample amount 2.0 mg
Physical description White amorphous solid
Molecular formula C10H1079Br2N2O3
Molecular weight 366 g/mol
Optical rotation c 0°C (c 0.1, CH3OH)
Retention time (HPLC) 25.96 min (standard gradient)
N
NH
O
Br
BrO
O
12
3
4 5 67
89
1011 12
H
0,0 10,0 20,0 30,0 40,0 50,0 60,0-100
200
400
600
900 DA070404 #3 6-D-2 UV_VIS_1mAU
min
1 - 1
2,98
6
2 - 2
4,29
33
- 25,
961
4 - 2
7,17
65
- 27,
463
6 - 3
7,81
4
7 - 4
7,92
1
WVL:235 nm
Peak #1 100%
-10,0 200 250 300 350 400 450 500 550 595
%
nm
284.7204.6 237.1
Mukanadin C 957.5670,0
[M+H]+
[M-CH3]-

Results
60
Compound (10) was isolated as a white amorphous solid. In ESI mass spectrum, it
revealed pseudomolecular ion peaks at m/z 365, 367, and 369 [M+H]+, in a ratio of 1:2:1,
confirming the existence of two bromine substituents in 10. The structure was further
confirmed by 1D and 2D NMR including 1H NMR, 1H–1H COSY, and HMBC (Fig. 3.7).
According to these data (Table 3.6) and the reported literature (Patel et al., 2005;
Umeyama et al., 1998), compound (10) was proven to be (±)-Longamide B methyl ester.
NBr
Br
N
O
H
H
O
O
12
3
4 5 6
7
89
1011 12
Fig. 3.7. 1H–1H COSY and HMBC spectra of (±)-longamide B methy ester (10).

Results
61
3.1.11. (±)-Longamide B (11, known compound)
(±)-Longamide B
Synonym(s) 2-(6,7-Dibromo-1,2,3,4-tetrahydro-1-oxopyrrolo[1,2-a]pyrazin-4-yl)acetic acid
Sample code VLC-9-Seph. G
Biological source Acanthostylotella sp.
Sample amount 26.0 mg
Physical description White amorphous solid
Molecular formula C9H879Br2N2O3
Molecular weight 352 g/mol
Optical rotation � �20D� 0°C (c 0.14, CH3OH)
Retention time (HPLC) 22.08 min (standard gradient)
N
NH
O
Br
BrOH
O
12
3
4 5 67
89
1011
H
0,0 10,0 20,0 30,0 40,0 50,0 60,0-100
200
400
600
900 SE070227 #8 VLC-9-Seph. G UV_VIS_1mAU
min
1 - 2
1,48
52
- 22,
081
3 - 3
6,96
2
4 - 4
7,74
5
WVL:240 nm
Peak #2 100%
-10,0
50,0
200 250 300 350 400 450 500 550 595
%
nm
202.4 285.2 236.6
Aeroplysinin-1 963.0380,0
[M+H]+
[M-H]-

Results
62
Compound (11) was isolated as a dark brown amorphous solid. In ESI mass spectrum,
it revealed pseudomolecular ion peaks at m/z 351, 353, and 355 [M+H]+, in a ratio of 1:2:1,
confirming the existence of two bromine substituents in 11. The structure was further
confirmed by 1D and 2D NMR including 1H, 13C NMR, DEPT, 1H–1H COSY, and HMBC
(Fig. 3.8). According to these data (Table 3.6) and the reported literature (Cafieri et al.,
1998; Patel et al., 2005), compound (11) was proven to be (±)-Longamide B.
NBr
Br
N
O
H
H
OH
O
H
HH
HH12
3
45
6
7
89
10 11
Fig. 3.8. 1H–1H COSY and HMBC spectra of (±)-longamide B (11).

Results
63
3.1.12. (±)-Longamide (12, known compound)
(±)-Longamide
Synonym(s) 6,7-dibromo-3,4-dihydro-4-hydroxypyrrolo[1,2-a]pyrazin-1(2H)-one
Sample code 6-D-13
Biological source Acanthostylotella sp.
Sample amount 5.0 mg
Physical description White amorphous solid
Molecular formula C7H679Br2N2O2
Molecular weight 310 g/mol
Optical rotation � �20D� 0°C (c 0.2, CH3OH)
Retention time (HPLC) 20.77 min (standard gradient)
N
NH
O
OH
Br
Br
12
3
4 5 67
89
10
H
0,0 10,0 20,0 30,0 40,0 50,0 60,0-100
200
400
600
800
1.000 SE070404 #6 6-D-13 UV_VIS_1mAU
min
1 - 20,769
2 - 37,851
WVL:235 nm
Peak #1 100%
200 250 300 350 400 450 500 550 595
%
nm
283.9236.0
207.1
No spectra library hits found!70,0
-10,0
[M+H]+
[M-H]-

Results
64
Compound (12) was isolated as a white amorphous solid. In ESI mass spectrum, it
revealed pseudomolecular ion peaks at m/z 307, 309, and 311 [M-H]-, in a ratio of 1:2:1,
confirming the existence of two bromine substituents in 12. The structure was further
confirmed by 1D and 2D NMR including 1H, 13C NMR, 1H–1H COSY, and HMBC (Fig.
3.9). According to these data (Table 3.7) and the reported literature (Cafieri et al., 1995),
compound (12) was proven to be (±)-Longamide.
12
3
4
5
6
7
89N
NH
OH
Br
Br OH
Fig. 3.9. 1H–1H COSY and HMBC spectra of (±)-longamide (12).

Results
65
Table 3.6. NMR data of compounds (10 and 11), measured in DMSO-d6.
H no. 10 11
�H �C �H �C
1
2 106.0 105.3
3 99.5 98.8
4 6.84 (1H, s) 114.0 6.77 (1H, s) 113.4
5 125.7 125.8
6 157.6 156.8
7 7.80 (1H, d, 5.0 Hz) 7.87 (1H, d, 5.0 Hz)
8 A: 3.80 (1H, dd, 13.7, 4.0 Hz)
B: 3.37 (1H, dd, 12.7, 5.4 Hz) 42.4
A: 3.68 (1H, dd, 13.2, 3.6 Hz)
B: 3.58 (1H, dd, 13.2, 5.0 Hz) 42.2
9 4.67 (1H, m) 50.2 4.55 (1H, d, 11.7 Hz) 52.1
10 A: 2.80 (1H, dd, 15.0, 6.0 Hz)
B: 2.50 (1H, dd, 14.3, 6.0 Hz) 36.0
A: 2.38 (1H, dd, 15.1, 11.7 Hz)
B: 2.08 (1H, dd, 15.1 Hz) 38.3
11 170.0 172.6
12-OCH3 3.56 (3H, s) 52.0
Table 3.7. NMR data of (±)-longamide (12).
H no. 12
�Ha �C
b
1
2 108.1
3 102.2
4 6.80 (1H, br s) 116.6
5 126.2
6 160.6
7 7.8 (1H, br d, 5.0 Hz)
8 A: 3.70 (1H, dd, 13.8, 2.8 Hz)
B: 3.36 (1H, dd, 13.5, 5.3 Hz)
47.9
9 5.60 (1H, br d) 75.2
9-OH 6.97 (1H, br d, 2.8 Hz) aNMR data measured in DMSO-d6. bNMR data in CD3OD.

Results
66
3.1.13. 3,4-Dibromo-1H-pyrrole-2-carboxamide (13, known compound)
3,4-Dibromo-1H-pyrrole-2-carboxamide
Synonym(s) 3,4-Dibromo-1H-pyrrole-2-carboxamide
Sample code 5-Bu-Fin
Biological source Acanthostylotella sp.
Sample amount 7.0 mg
Physical description White amorphous solid
Molecular formula C5H479Br2N2O
Molecular weight 268 g/mol
Retention time (HPLC) 15.28 min (half-time gradient)
N
BrBr
HNH2
OH
1
2
34
56
7
0,0 5,0 10,0 15,0 20,0 25,0 30,0-100
250
500
750
1.200 SE070502 #4 5-Bu-Fin UV_VIS_1mAU
min
1 - 1
0,61
9
2 - 1
5,28
2
3 - 2
8,04
3
WVL:235 nm
No ionization in +ESI MS
Peak #2
200 250 300 350 400 450 500 550 595
%
nm
275.0
201.5 232.3
3,4-Dibromopyrrole-2-carbamide 995.28100%
70,0
-10,0
[M-H]-

Results
67
3.1.14. 2-Cyano-4,5-dibromo-1H-pyrrole (14, known compound)
2-Cyano-4,5-dibromo-1H-pyrrole
Synonym(s) 2-Cyano-4,5-dibromo-1H-pyrrole
Sample code 3-Bu-7
Biological source Acanthostylotella sp.
Sample amount 2.0 mg
Physical description White amorphous solid
Molecular formula C5H279Br2N2
Molecular weight 250 g/mol
Retention time (HPLC) 21.23 min (half-time gradient)
N
BrBr
HN
H
1
2
34
56 7
0,0 5,0 10,0 15,0 20,0 25,0 30,0-100
200
400
600
800
1.000 SE070502 #2 3-Bu-7 UV_VIS_3mAU
min
1 - 1
8,96
7
2 - 2
1,23
1
3 - 2
8,05
9
WVL:280 nm
No ionization in +ESI MS
Peak #2 100%
-10,0 200 250 300 350 400 450 500 550 595
%
nm
277.6
233.7 365.4
5,4-Dibromopyrrole-2-methylcarboxylate 996.8770,0
[M-H]-

Results
68
Compound (13) was isolated as a greyish white amorphous solid. In ESI mass
spectrum, it revealed pseudomolecular ion peaks at m/z 265, 267, and 269 [M-H]-, in a
ratio of 1:2:1, confirming the existence of two bromine substituents in 13. The structure
was further confirmed by 1D and 2D NMR including 1H, and 1H–1H COSY. According to
these data (Table 3.4) and the reported literature (Hassan et al., 2007; Supriyono et al.,
1995), compound (13) was proven to be 3,4-dibromo-1H-pyrrole-2-carboxamide.
Compound (14) was isolated as a white amorphous solid. In ESI mass spectrum, it
revealed pseudomolecular ion peaks at m/z 247, 249, and 251 [M-H]-, in a ratio of 1:2:1,
confirming the existence of two bromine substituents in 14. The structure was further
confirmed by 1D and 2D NMR including 1H, and 1H–1H COSY. According to these data
(Table 3.4) and the reported literature (König et al., 1998; Forenza et al., 1971), compound
(14) was proven to be 2-cyano-4,5-dibromo-1H-pyrrole.
3.1.15. Bioactivity assay results of compounds isolated from marinesponge Acanthostylotella sp.
All isolated compounds from Acanthostylotella sp. were dibromopyrrole derivatives. They
were subjected to vast array of biological activity assays. In cytotoxicity (MTT) assay
against mouse lymphoma (L5178Y) cell line, only mukanadin D (9) showed moderate
activity with an IC50 of 8.7 μg/mL (21.7 μM).
In protein kinase inhibitory activity against 24 different enzymes and antioxidant
activities, none of the isolated compounds proved to be of potential activity. In the in vitro
antimicrobial and antiviral activity assays, methyl 3,4-dibromo-1H-pyrrole-2-carboxylate
(5) revealed antibacterial activity with MIC values of 31.25 μg/mL against both multi
resistant Staphylococcus aureus (MRSA), and Streptococcus pneumonia. In addition it
showed antifungal activity with MIC values of 62.5, and 125 μg/mL against Aspergillus
faecalis, and Aspergillus fumigatus, respectively.

Results
69
3.2. Secondary metabolites isolated from Stylissa massaIn this study, we investigated a specimen of Stylissa massa (class Demospongiae, order
Halichondrida, family Dictyonellidae), collected off the shores of Papua Island (Indonesia)
in January 2008, identified, and supplied by Dr. Nicole de Voogd, National Museum of
Natural History, Leiden, Netherlands.
Total methanolic extract of the sponge was subjected to liquid liquid partition
technique against n-Hexane, EtOAc, and BuOH. The EtOAc soluble fraction was then
subjected to VLC and eluted using a stepwise gradient system from 100% n-Hexane to 100
% EtOAc, and from 100% DCM to 100% MeOH. Each fraction was purified by column
chromatography using Sephadex LH-20 as a stationary phase and either MeOH or
DCM:MeOH (1:1) as a mobile phase followed by either semi-preparative reversed phase
HPLC (C18 Eurosphere 100) when required using the appropriate gradient elution of
MeOH:H2O.
This afforded two new dibromopyrrole alkaloids (15 and 30) in addition to twenty
known bromopyrrole alkaloids (16–29 and 31–36). Isolated compounds were tested for
different bioactivities, including cytotoxicity, antibacterial, antifungal, antiviral and protein
kinase inhibitory activities.
In this part, we would present the results of the chemical investigation of the natural
products produced by Stylissa massa.

Results
70
3.2.1. Ethyl 3,4-dibromo-1H-pyrrole-2-carboxylate(15, new natural product)
Ethyl 3,4-dibromo-1H-pyrrole-2-carboxylate
Synonym(s) Ethyl 3,4-dibromo-1H-pyrrole-2-carboxylate
Sample code NdV VLC-3,2
Biological source Stylissa massa
Sample amount 7.0 mg
Physical description White needle crystals
Molecular formula C7H779Br2NO2
Molecular weight 297 g/mol
Retention time (HPLC) 28.24 min (standard gradient)
NH
BrBr
O
O
23
45
6 78H
0,0 10,0 20,0 30,0 40,0 50,0 60,0-50
200
450 SE090409 #10 NdV VLC-3, 2 UV_VIS_1mAU
min
1 - 28,240
2 - 48,082
WVL:240 nm
No ionization in +ESI MS
Peak #1 100%
-10,0
70,0
200 250 300 350 400 450 500 550 595
%
nm
278.7
234.7
559.1
4,5-dibromopyrrole-2-carboxylic acid 980.00[M-H]-

Results
71
Compound (15) was isolated as white needle crystals. It showed pseudomolecular ion
peaks at m/z 294, 296, and 298 [M-H]- at a 1:2:1 ratio in its ESI mass spectrum indicating
that it was a dibrominated compound. The molecular formula of C7H779Br2NO2 was
confirmed by HRESIMS. In our study, 15 was obtained for the first time as a naturally-
occurring bromopyrrole alkaloid. The 13C NMR spectrum (Table 3.8) showed 7 signals
representing one methyl, and one methylene group in addition to five sp2 carbons including
one methine group and four fully substituted carbons. The structure of 15 was further
confirmed by interpretation of 1H�1H COSY, and HMBC spectra (Fig. 3.10). The 1H�1H
COSY spectrum showed a cross peak between NH proton (�H 9.74, br s) and the aromatic
proton H-5 [�H 6.89 (d, 2.8 Hz); �C 117.8]. The HMBC spectrum (Fig. 3.10) supported the
presence of the aromatic proton at C-5 and also revealed correlations between H-5 to C-2
(�C 124.1) and C-3 (�C 106.7). The presence of an ethyl ester group was deduced from 1H�1H COSY that revealed a clear correlation between methylene group [�H 4.34 (q, 7.3
Hz); �C 61.1], and methyl group [�H 1.36 (t, 7.3 Hz); �C 14.3]; and HMBC spectra showed
a correlation of the methylene protons to the carbonyl group C-6 (�C 159.7). Moreover, the
methylene and methyl protons showed a HMQC correlation to C-7 (�C 61.1), and C-8 (�C
14.3), respectively. Therefore, 15 was confirmed to be ethyl 3,4-dibromo-1H-pyrrole-2-
carboxylate.
N
BrBr
O
O
234
5
67
8H
H
Fig. 3.10. 1H–1H COSY and HMBC spectra of ethyl 3,4-dibromo-1H-pyrrole-2-carboxylate (15).

Results
72
3.2.2. 4-Bromo-1H-pyrrole-3-carboxamide (16, known compound)
4-Bromo-1H-pyrrole-3-carboxamide
Synonym(s) 4-Bromo-1H-pyrrole-3-carboxamide
Sample code NdV VLC-8,1
Biological source Stylissa massa
Sample amount 5.0 mg
Physical description White amorphous solid
Molecular formula C5H579BrN2O
Molecular weight 189 g/mol
Retention time (HPLC) 14.19 min (standard gradient)
NH
Br
2
34
5
NH2
O
67
0,0 10,0 20,0 30,0 40,0 50,0 60,0-100
700 SE090509 #2 NdV VLC-8,1 UV_VIS_1mAU
min
1 - 14,189
2 - 48,180
WVL:240 nm
No ionization in +ESI MS
Peak #1 100%
200 250 300 350 400 450 500 550 595
%
nm
270.2
232.7
557.3
4-bromopyrrole-2-carbamide 998.89
[M-H]-
70,0
-10,0

Results
73
Compound (16) was isolated as a white amorphous solid. It showed pseudomolecular
ion peaks at m/z 186, and 188 [M-H]- at a 1:1 ratio in its ESI mass spectrum indicating that
it was a monobrominated compound. The structure of 16 was further confirmed by
interpretation of 1H�1H COSY, and HMBC spectra. The 1H�1H COSY spectrum (Fig.
3.11) showed a cross peak between NH proton (�H 11.76, br s) and the aromatic protons H-
2 [�H 6.95 (dd, 1.6, 2.9 Hz); �C 121.0], and H-5 [�H 6.83 (dd, 1.6, 2.9 Hz); �C 111.8]. The
HMBC spectrum (Fig. 3.11) supported the proposed structure and revealed correlations
between H-5 to C-2 (�C 121.0), and C-3 (�C 126.7); and H-2 to C-3 (�C 126.7), C-4 (�C
94.7), and C-5 (�C 111.8). Therefore, 16 was confirmed to be 4-bromo-1H-pyrrole-3-
carboxamide that was firstly reported from the marine sponges Axinella damicornis and
Stylissa flabelliformis by Hassan et al. in 2007.
N
Br
23
45
NH2
O
67
HH
H
Fig. 3.11. 1H–1H COSY and HMBC spectra of 4-bromo-1H-pyrrole-3-carboxamide (16).
Table 3.8. NMR data of compounds (15 and 16).
#15, CDCl3, 500 MHz 16, DMSO-d6, 500 MHz
�H �C �H �C*
1 9.74 (1H, br s, NH-pyrrole) 11.76 (1H, br s, NH-pyrrole)
2 124.1, C 6.95 (1H, dd, 1.6, 2.9 Hz) 121.0 3 106.7, C 126.7 4 100.6, C 94.7 5 6.89 (1H, d, 2.8 Hz) 117.8, CH 6.83 (1H, dd, 1.6, 2.9 Hz) 111.8 6 159.7, C
7 4.34 (2H, q, 7.3 Hz) 61.1, CH2
7.56 (1H, br s, NHa) 7.08 (1H, br s, NHb)
8 1.36 (3H, t, 7.3 Hz) 14.3, CH3
*13C NMR values obtained from HMBC spectrum.

Results
74
3.2.3. 3,4-Dibromo-1H-pyrrole-2-carboxamide (17, known compound) Please see 3.1.13. data included therein.
3.2.4. (-)-Longamide B methyl ester (18, known compound)
(-)-Longamide B methyl ester
Synonym(s) (-)-6,7-Dibromo-1,2,3,4-tetrahydro-1-oxopyrrolo[1,2-a]pyrazine-4-acetic acid methyl ester
Sample code NdV VLC-8,5
Biological source Stylissa massa
Sample amount 2.0 mg
Physical description White amorphous solid
Molecular formula C10H1079Br2N2O3
Molecular weight 366 g/mol
Optical rotation � �20D� -9.0°C (c 0.02, CH3OH)
Retention time (HPLC) 23.88 min (standard gradient)
N
NH
O
Br
Br
12
3
4 5 678
9
O
O
1011 12
0,0 10,0 20,0 30,0 40,0 50,0 60,0-10,0
25,0
50,0 SE090414 #13 NdV VLC-8,5 UV_VIS_1mAU
min
1 - 23,884
2 - 48,111
WVL:240 nm
No ionization in -ESI MS
Peak #1 100%
50,0
200 250 300 350 400 450 500 550 595
%
nm
284.1 236.5
560.5
Aeroplysinin-1 972.18
[M+H]+
80,0
-10,0

Results
75
3.2.5. (-)-Longamide B ethyl ester, Hanishsin (19, known compound)
(-)-Longamide B ethyl ester, Hanishsin
Synonym(s) (-)-6,7-Dibromo-1,2,3,4-tetrahydro-1-oxopyrrolo[1,2-a]pyrazine-4-acetic acid ethyl ester
Sample code NdV VLC-8,6
Biological source Stylissa massa
Sample amount 2.0 mg
Physical description White amorphous solid
Molecular formula C11H1279Br2N2O3
Molecular weight 380 g/mol
Optical rotation � �20D� -13.0°C (c 0.02, CH3OH)
Retention time (HPLC) 25.40 min (standard gradient)
N
NH
O
Br
Br
12
3
4 5 678
9
O
O
1011 12
13
0,0 10,0 20,0 30,0 40,0 50,0 60,0-10,0
25,0
60,0 SE090414 #14 NdV VLC-8,6 UV_VIS_1mAU
min
1 - 25,403
2 - 48,139
WVL:240 nm
No ionization in -ESI MS
Peak #1 100%
50,0
200 250 300 350 400 450 500 550 595
%
nm
284.1 236.5
560.5
Aeroplysinin-1 972.18
[M+H]+
-10,0
80,0

Results
76
3.2.6. (-)-Longamide B (31, known compound)
(-)-Longamide B
Synonym(s) (-)-6,7-Dibromo-1,2,3,4-tetrahydro-1-oxopyrrolo[1,2-a]pyrazine-4-acetic acid
Sample code NdV VLC-20,VIII
Biological source Stylissa massa
Sample amount 9.0 mg
Physical description White amorphous solid
Molecular formula C9H879Br2N2O3
Molecular weight 352 g/mol
Optical rotation � �20D� -5.0°C (c 0.04, CH3OH)
Retention time (HPLC) 16.54 min (half-time gradient)
N
NH
O
Br
Br
12
3
4 5 678
9
OH
O
1011
0,0 5,0 10,0 15,0 20,0 25,0 30,0-50
125
300 SE090422 #10 NdV VLC-20,VIII UV_VIS_1mAU
min
1 - 16,544WVL:235 nm
Peak #1 100%
200 250 300 350 400 450 500 550 595
%
nm
202.4 284.3 236.8
Aeroplysinin-1 973.82
[M+H]+
80,0
-10,0
50,0
[M-H]-

Results
77
Compound (18) was isolated as a white amorphous solid. It showed pseudomolecular
ion peaks at m/z 365, 367, and 369 [M+H]+ at a 1:2:1 ratio in its ESI mass spectrum
indicating the existence of two bromine substituents in 18. The structure of 18 was further
confirmed by interpretation of 1H�1H COSY. The 1H�1H COSY spectrum showed an
extended spin system between NH-7 (�H 7.86, d, 5.1 Hz), H-8A [�H 3.80 (dd, 4.1, 13.6
Hz)], H-8B [�H 3.38 (dd, 5.4, 13.6 Hz)], then to H-9 [�H 4.68 (m)], H-10A [�H 2.80 (dd, 9.5,
15.5 Hz)], and H-10B [�H 2.57 (dd, 5.1, 15.5 Hz)]. Moreover, 1H NMR spectra of 18
revealed a singlet methyl resonance at �H 3.62 that was assigned to methyl ester group
(CH3-12). The optical rotation of 18 gave a value of � �20D� -9.0° (c 0.02, CH3OH). Based
on the preceding data (Table 3.9) and the reported literature (Patel et al., 2006), 18 was
confirmed to be (-)-longamide B methyl ester.
Compound (19) was isolated as a white amorphous solid. It showed pseudomolecular
ion peaks at m/z 379, 381, and 383 [M+H]+, (1:2:1) in its ESI mass spectrum which
differed from 18 by more 14 amu. This difference in molecular weight was explained by
the presence of methylene, and methyl groups at [�H 4.07 (m)], and [�H 1.17 (t, 7.3 Hz)],
respectively in 19 instead of methyl group at at [�H 3.62 (s)] in 18. Apart from this
difference, the spectral data of 19 and 18 were quite similar. The structure of 19 was
further confirmed by interpretation of 1H�1H COSY. The 1H�1H COSY spectrum (Fig.
3.12) showed similarly an extended spin system between NH-7 (�H 7.86, d, 5.1 Hz), H-8A
[�H 3.80 (dd, 4.4, 13.6 Hz)], H-8B [�H 3.36 (dd, 5.4, 13.6 Hz)], then to H-9 [�H 4.68 (m)],
H-10A [�H 2.77 (dd, 9.5, 15.5 Hz)], and H-10B [�H 2.50 (dd, 5.1, 15.5 Hz)]. Moreover, it
revealed a clear correlation between methylene group [�H 4.07 (m)], and methyl group [�H
1.17 (t, 7.3 Hz)] indicating the existence of an ethyl ester group. The optical rotation of 19
gave a value of � �20D� -13.0° (c 0.02, CH3OH). According to the previous data (Table 3.9)
and comparing to the reported literature (Mancini et al., 1997), 19 was confirmed to be (-)-
longamide B ethyl ester, hanishin.
Compound (31) was isolated as a faint yellow amorphous solid. It showed
pseudomolecular ion peaks at m/z 351, 353, and 355 [M+H]+, (1:2:1) in its ESI mass
spectrum which differed from 18 by the lack of 14 amu. This difference in molecular
weight was explained by the absence of the singlet methyl resonance at �H 3.62 was
assigned to methyl ester group (CH3-12) in 18. Apart from this difference, the spectral data
of 31 and 18 were quite similar. The structure of 31 was further confirmed by
interpretation of 1H�1H COSY. The 1H�1H COSY spectrum showed as in 18 an
extended spin system between NH-7 (�H 7.84, d, 5.1 Hz), H-8A [�H 3.80 (dd, 3.8, 13.3

Results
78
Hz)], H-8B [�H 3.37 (dd, 5.4, 13.3 Hz)], then to H-9 [�H 4.64 (m)], H-10A [�H 2.71 (dd,
10.8, 16.1 Hz)], and H-10B [�H 2.50 (dd, 5.1, 16.1 Hz)]. The optical rotation of 31 gave a
value of � �20D� -5.0° (c 0.04, CH3OH). According to these data (Table 3.9) and by
comparison to the reported literature (Cafieri et al., 1998; Petal et al., 2005), 31 was
confirmed to be (-)-longamide B that was first isolated from the sponge Agelas dispar.
N
N
O
Br
Br
12
3
4 5 678
9
O
O
1011 12
H
13
Fig. 3.12. 1H–1H COSY of (-)-longamide B ethyl ester, hanishin (19).
Table 3.9. NMR data of compounds (18, 19, and 31), measured in DMSO-d6.
# 18 19 31
�H �H �H
2
3
4 6.84 (1H, s) 6.84 (1H, s) 6.84 (1H, s)
5
6
7 7.86 (1H, d, 5.1 Hz, NH) 7.86 (1H, d, 5.1 Hz, NH) 7.84 (1H, d, 5.1 Hz, NH)
8 A: 3.80 (1H, dd, 4.1, 13.6 Hz)
B: 3.38 (1H, dd, 5.4, 13.6 Hz)
A: 3.80 (1H, dd, 4.4, 13.6 Hz)
B: 3.36 (1H, dd, 5.4, 13.6 Hz)
A: 3.80 (1H, dd, 3.8, 13.3 Hz)
B: 3.37 (1H, dd, 5.4, 13.3 Hz)
9 4.68 (1H, m) 4.68 (1H, m) 4.64 (1H, m)
10 A: 2.80 (1H, dd, 9.5, 15.5 Hz)
B: 2.57 (1H, dd, 5.1, 15.5 Hz)
A: 2.77 (1H, dd, 9.5, 15.5 Hz)
B: 2.50 (1H, dd, 5.1, 15.5 Hz)
A: 2.71 (1H, dd, 10.8, 16.1
Hz)
B: 2.50 (1H, dd, 5.1, 16.1 Hz)
12 OCH3: 3.62 (3H, s) =CH2: 4.07 (2H, m) OH: 12.75 (1H, br s)
13 –CH3: 1.17 (3H, t, 7.3 Hz)

Results
79
3.2.7. Aldisine (20, known compound)
Aldisine
Synonym(s) 6,7-Dihydropyrrolo[2,3-c]azepine-4,8(1H,5H)-dione
Sample code NdV EtOAc IV 1
Biological source Stylissa massa
Sample amount 17.0 mg
Physical description White amorphous solid
Molecular formula C8H8N2O2
Molecular weight 164 g/mol
Retention time (HPLC) 10.30 min (standard gradient)
2
3 4 56
78N
HNH
O
O
3a
8a
0,0 10,0 20,0 30,0 40,0 50,0 60,0-20
100
200 SE090407 #8 NdV EtOAc IV 1 UV_VIS_1mAU
min
1 - 10,297
2 - 48,113
WVL:240 nm
No ionization in -ESI MS
Peak #1 100%
200 250 300 350 400 450 500 550 595
%
nm
219.6
250.3 303.5
No spectra library hits found!
[2M+Na]+
70,0
-10,0

Results
80
Compound (20) was isolated as a white amorphous solid. It showed pseudomolecular
ion peaks at m/z 353 [2M+Na]+ in its ESI mass spectrum. The structure of 20 was further
confirmed by interpretation of 1H�1H COSY and HMBC spectra (Fig. 3.13). The 1H�1H
COSY spectrum two extended spin systems. The first spin system existed between NH-
pyrrole [�H 12.14 (br s)], H-2 [�H 6.97 (d, 2.5 Hz)], and H-3 [�H 6.54 (d, 2.5 Hz)]; and the
second one was between NH-7 [�H 8.30 (t, 4.8 Hz)], =CH2-6 [�H 3.34 (m)], and =CH2-5 [�H
2.69 (m)]. The HMBC spectrum (Fig. 3.13) of 20 gave more evidences by revealing
correlations from H-2 to C-3 (�C 109.1), C-3a (�C 123.5), and C-8a (�C 127.8); H-3 to C-2
(�C 122.1), C-3, and C-8a; from =CH2-6 to two carbonyl carbons at �C 194.0, and �C 161.8
that were ascribed to C-4, and C-8, respectively. Based on the aforementioned data (Table
3.10) and by comparison to the reported literature (Schmitz et al., 1985), 20 was confirmed
to be aldisine.
2
3 4 5
67
8N N
O
O
H
H
3a
8a
HH
Fig. 3.13. 1H–1H COSY and HMBC spectra of aldisine (20).

Results
81
3.2.8. 2,3-Dibromoaldisine (21, known compound)
2,3-Dibromoaldisine
Synonym(s) 2,3-Dibromo-6,7-dihydropyrrolo[2,3-c]azepine-4,8(1H,5H)-dione
Sample code NdV EtOAc IV 2
Biological source Stylissa massa
Sample amount 1.0 mg
Physical description White amorphous solid
Molecular formula C8H679Br2N2O2
Molecular weight 322 g/mol
Retention time (HPLC) 14.84 min (standard gradient)
2
3 4 56
78N
HNH
O
O
3a
8a
Br
Br
0,0 10,0 20,0 30,0 40,0 50,0 60,0-5,0
-2,0
0,0
2,0
5,0 SE090409 #7 NdV EtOAc IV 2 UV_VIS_4mAU
min
1 - 2,766
2 - 14,835WVL:340 nm
No ionization in -ESI MS
Peak #3 100%70,0
200 250 300 350 400 450 500 550 595
%
nm
222.5 212.2
250.7
2,3-Dibromoaldisin 958.37
[M+HCOO]+
-10,0

Results
82
Compound (21) was isolated as a white amorphous solid. It showed pseudomolecular
ion peaks at m/z 365, 367, 369 [M+HCOO]+, (1:2:1) in its ESI mass spectrum indicating
that 21 is dibrominated. 1H NMR spectra of 21 was similar to that of 20 with the only
difference by the lack of two aromatic protons at [�H 6.97 (d, 2.5 Hz)], and [�H 6.54 (d, 2.5
Hz)] that were assigned for H-2, and H-3, respectively. Accordingly, 21 was supposed to
be a 2,3-dibrominated derivative of 20. The structure of 21 was further confirmed by
interpretation of 1H�1H COSY that showed an extended spin system between NH-7 [�H
8.52 (t, 5.1 Hz)], =CH2-6 [�H 3.33 (m)], and =CH2-5 [�H 2.74 (m)]. Based on the preceding
findings (Table 3.10) and by comparing to the reported literature (Hassan et al., 2007), 21
was confirmed to be 2,3-dibromoaldisine.
Table 3.10. NMR data of compounds (20 and 21), measured in DMSO-d6.
# 20 21
�H �c* �H
1 12.14 (1H, br s) 13.44 (1H, br s)
2 6.97 (1H, d, 2.5 Hz) 122.1
3 6.54 (1H, d, 2.5 Hz) 109.1
3a 123.5
4 194.0
5 2.69 (2H, m) 2.74 (2H, m)
6 3.34 (2H, m) 36.3 3.33 (2H, m)
7 8.30 (1H, t, 4.8 Hz, NH) 8.52 (1H, t, 5.1 Hz, NH)
8 161.8
8a 127.8
*13C NMR values obtained from HMBC spectrum.

Results
83
3.2.9. 2-Bromoaldisine (22, known compound)
2-Bromoaldisine
Synonym(s) 2-Bromo-6,7-dihydropyrrolo[2,3-c]azepine-4,8(1H,5H)-dione
Sample code NdV EtOAc IV 3
Biological source Stylissa massa
Sample amount 6.0 mg
Physical description White amorphous solid
Molecular formula C8H779BrN2O2
Molecular weight 243 g/mol
Retention time (HPLC) 16.82 min (standard gradient)
2
3 4 56
78N
HNH
O
O
3a
8a
Br
0,0 10,0 20,0 30,0 40,0 50,0 60,0-50
250
600 SE090407 #10 NdV EtOAc IV 3 UV_VIS_1mAU
min
1 - 16,821
2 - 48,110
WVL:240 nm
No ionization in -ESI MS
Peak #1 100%
200 250 300 350 400 450 500 550 595
%
nm
224.3
310.7
472.8
3-Bromaldisin 999.67
[M+H]+
70,0
-10,0

Results
84
3.2.10. 3-Bromoaldisine (23, known compound)
3-Bromoaldisine
Synonym(s) 3-Bromo-6,7-dihydropyrrolo[2,3-c]azepine-4,8(1H,5H)-dione
Sample code NdV VLC-13,IV
Biological source Stylissa massa
Sample amount 5.0 mg
Physical description White amorphous solid
Molecular formula C8H779BrN2O2
Molecular weight 243 g/mol
Retention time (HPLC) 16.79 min (standard gradient)
2
3 4 56
78N
HNH
O
O
3a
8a
Br
0,0 10,0 20,0 30,0 40,0 50,0 60,0-20
100
250 SE090511 #7 NdV VLC-13, IV UV_VIS_1mAU
min
1 - 16,785
2 - 47,897
WVL:240 nm
Peak #1 100%
200 250 300 350 400 450 500 550 595
%
nm
224.5
310.6
454.8
3-Bromaldisin 999.4770,0
-10,0
[M+H]+

Results
85
Compound (22) was isolated as a white amorphous solid. It showed pseudomolecular
ion peaks at m/z 509, 511, 513 [2M+Na]+. 1H NMR spectra of 22 resembled that of 20
except in the presence of one aromatic proton at [�H 6.55 (s)] ascribed to H-3 in 22 instead
of two aromatic protons at [�H 6.97 (d, 2.5 Hz)], and [�H 6.54 (d, 2.5 Hz)] that were
assigned for H-2, and H-3 in 20, respectively. Accordingly, 22 was supposed to be a 2-
brominated derivative of 20. The structure of 22 was further confirmed by interpretation of 1H�1H COSY (Fig. 3.14) that showed one extended spin system between NH-7 [�H 8.38
(t, 5.1 Hz)], =CH2-6 [�H 3.34 (m)], and =CH2-5 [�H 2.69 (m)]. 1H NMR of C-3 was similar
to those observed in related compounds as in hymenialdisine (Cimino et al., 1982;
Kitagawa et al., 1983), axinohydantoin (Pettit et al., 1990), and spongiacidin D (Inaba et
al., 1998). According to the preceding findings (Table 3.11) and by comparing to the
reported literature (Schmitz et al., 1985; Hassan et al., 2007), 22 was confirmed to be 2-
bromoaldisine.
Compound (23) was isolated as a white amorphous solid. It showed pseudomolecular
ion peaks at m/z 242, and 244 [M+H]+ in its EI mass spectrum. The structure of 23 was
further confirmed by interpretation of 1H�1H COSY and HMBC spectra. The 1H�1H
COSY spectrum (Fig. 3.14) two extended spin systems. The first spin system existed
between NH-pyrrole [�H 12.95 (br s)], and H-2 [�H 6.54 (d, 2.5 Hz)], and the second one
was between NH-7 [�H 8.38 (t, 5.1 Hz)], =CH2-6 [�H 3.34 (m)], and =CH2-5 [�H 2.69 (m)].
The HMBC spectrum of 23 gave more clues by revealing correlations from H-2 to C-3 (�C
104.9), and C-8a (�C 129.1); from both =CH2-5, and =CH2-6 to a carbonyl carbons at �C
193.8 that was ascribed to C-4. Based on the aforementioned data (Table 3.11) and by
comparison to the reported literature (Hassan et al., 2007), 23 was confirmed to be 3-
bromoaldisine.

Results
86
2
3 4 56
78N
HN
O
O
3a
8a
Br
H
2
3 4 56
78N N
O
O
3a
8a
Br
H
H
H
Fig. 3.14. 1H–1H COSY spectra of 2-bromoaldisine (22) and 3-bromoaldisine (23).
Table 3.11. NMR data of compounds (22 and 23), measured in DMSO-d6.
# 22 23
�H �H �c*
1 12.95 (1H, br s) 12.95 (1H, br s)
2 6.54 (1H, d, 2.5 Hz) 111.0
3 6.55 (1H, s) 104.9
3a
4 193.8
5 2.69 (2H, m) 2.69 (2H, m)
6 3.34 (2H, m) 3.34 (2H. m) 36.3
7 8.38 (1H, t, 5.1 Hz, NH) 8.38 (1H, t, 5.1 Hz, NH)
8
8a 129.1
*13C NMR values obtained from HMBC spectrum.

Results
87
3.2.11. (-)-Mukanadin C (24, known compound)
(-)-Mukanadin C
Synonym(s) 6-Debromolongamide A
Sample code NdV VLC-13,III
Biological source Stylissa massa
Sample amount 3.0 mg
Physical description White amorphous solid
Molecular formula C7H779BrN2O2
Molecular weight 231 g/mol
Optical rotation � �20D� -2.0°C (c 0.04, CH3OH)
Retention time (HPLC) 13.23 min (standard gradient)
N
NH
OH
O
Br1
2
3
45
678
9
0,0 10,0 20,0 30,0 40,0 50,0 60,0-10
50
120 SE090511 #6 NdV VLC-13, III UV_VIS_3mAU
min
1 - 13,226
WVL:280 nm
No ionization in -ESI MS
Peak #1 100%
200 250 300 350 400 450 500 550 595
%
nm
232.6 278.6
559.6
Mukanadin C 998.61
[M+Na]+
70,0
-10,0

Results
88
3.2.12. (-)-Longamide (25, known compound)
(-)-Longamide
Synonym(s) 6,7-Dibromo-3,4-dihydro-4-hydroxypyrrolo[1,2-a]pyrazin-1(2H)-one
Sample code NdV VLC-13,V
Biological source Stylissa massa
Sample amount 2.0 mg
Physical description White amorphous solid
Molecular formula C7H679Br2N2O2
Molecular weight 310 g/mol
Optical rotation � �20D� -18.0°C (c 0.04, CH3OH)
Retention time (HPLC) 18.55 min (standard gradient)
N
NH
OH
O
Br1
2
3
45
678
9
Br
0,0 10,0 20,0 30,0 40,0 50,0 60,0-10,0
25,0
60,0 SE090511 #8 NdV VLC-13, V UV_VIS_1mAU
min
1 - 18,545
2 - 47,882
WVL:240 nm
No ionization in -ESI MS
Peak #1 100%
200 250 300 350 400 450 500 550 595
%
nm
283.7235.2
558.7
Mukanadin C 972.7670,0
-10,0
[M+H]+

Results
89
Compound (24) was isolated as a white amorphous solid. It showed pseudomolecular
ion peaks at m/z 253, and 255 [M+Na]+, (1:1) in its EI mass spectrum revealing that 24 is a
monobrominated compound. The structure of 24 was further confirmed by interpretation of 1H�1H COSY. The 1H�1H COSY spectrum (Fig. 3.15) showed two extended spin
systems. The first spin system existed between H-2 [�H 7.16 (d, 1.9 Hz)], and H-4 [�H
6.63(d, 1.9 Hz)], and the second one was between NH-7 [�H 7.74 (br s)], H-8A [�H 3.58
(dd, 3.2, 11.7 Hz)], H-8B [�H 3.31 (m)], and H-9 [�H 5.57 (d, 4.8 Hz)]. The optical rotation
of 24 gave a value of � �20D� -2.0° (c 0.04, CH3OH). According to the aforementioned data
(Table 3.12) and by comparison to the reported literature (Li et al., 1998; Uemoto et al.,
1999), 24 was found to be (-)-mukanadin C.
Compound (25) was isolated as a white amorphous solid. It showed pseudomolecular
ion peaks at m/z 309, 311, and 313 [M+H]+, (1:2:1) in its EI mass spectrum revealing that
25 is a dibrominated compound. Compound (25) differed from 24 by more 79 amu. This
difference was explained by the existence of one more bromine substituent in 25 than in
24. This also was accompanied by disappearance of one proton resonance at [�H 7.16 (d,
1.9 Hz)] that was assigned to H-2 in 24. The structure of 25 was further confirmed by
interpretation of 1H�1H COSY spectrum (Fig. 3.15) that revealed one extended spin
system between NH-7 [�H 7.87 (d, 4.7 Hz)], H-8A [�H 3.70 (dd, 2.9, 13.9 Hz)], H-8B [�H
3.38 (m)], and H-9 [�H 5.60 (d, 6.3 Hz)]. The optical rotation of 25 gave a value of � �20D� -
18.0° (c 0.04, CH3OH). According to the preceding data (Table 3.12) and by comparison to
the reported literature (Cafieri et al., 1995), 25 was found to be (-)-longamide that was first
isolated from the marine sponge Agelas longissima.

Results
90
N
N
OH
O
H
Br
12
3
4
56
78
9
H
H
N
N
OH
O
Br
Br
12
3
4
56
78
9
H
H
Fig. 3.15. 1H–1H COSY spectra of (-)-mukanadin C (24) and (-)-longamide (25).
Table 3.12. NMR data of compounds (24 and 25), measured in DMSO-d6.
# 24 25
�H �H
2 7.16 (1H, d, 1.9 Hz)
3
4 6.63 (1H, d, 1.9 Hz) 6.81 (1H, s)
5
6
7 7.74 (1H, br s) 7.87 (1H, d, 4.7 Hz)
8 A: 3.58 (1H, dd, 3.2, 11.7 Hz)
B: 3.31 (1H, m)
A: 3.70 (1H, dd, 2.9, 13.9 Hz)
B: 3.38 (1H, m)
9 5.57 (1H, d, 4.8 Hz) 5.60 (1H, d, 6.3 Hz)
OH-9 6.95 (1H, d, 6.3 Hz) 6.98 (1H, d, 6.7 Hz)

Results
91
3.2.13. Latonduine A (26, known compound)
Latonduine A
Sample code NdV VLC-14,4
Biological source Stylissa massa
Sample amount 6.0 mg
Physical description Yellow powder
Molecular formula C10H779Br2N5O
Molecular weight 373 g/mol
Retention time (HPLC) 22.43 min (standard gradient)
NH
NH
O
N
NNH2
Br
Br
1
2
3 4
5 6 78
910
11 13
15
0,0 10,0 20,0 30,0 40,0 50,0 60,0-50
200
350 SE090419 #5 NdV VLC-14,4 UV_VIS_1mAU
min
1 - 22,434
2 - 48,104
WVL:240 nm
Peak #1 100%
-10,0 200 250 300 350 400 450 500 550 595
%
nm
246.0 284.8
559.7
No spectra library hits found!
[M+H]+
70,0
[M-H]-

Results
92
Compound (26) was isolated as a brownish yellow powder. It showed
pseudomolecular ion peaks at m/z 372, 374, and 376 [M+H]+, (1:2:1) in its EI mass
spectrum revealing that 26 is a dibrominated compound. The structure of 26 was further
confirmed by interpretation of 1H�1H COSY, and HMBC spectra (Fig. 3.16). The 1H�1H
COSY spectrum (Fig. 3.16) revealed one spin system between NH-7 [�H 8.16 (d, 5.1 Hz)],
and =CH2-8 [�H 3.90 (d, 5.1 Hz)]. Moreover, the HMBC spectrum (Fig. 3.16) revealed
clear correlations from H-11 [�H 8.76 (s)] to C-10 (�C 113.0), C-13 (�C 162.2), and C-9 (�C
163.4); and from =CH2-8 [�H 3.90 (d, 5.1 Hz)] to C-6 (�C 164.0). Based on the previous
data (Table 3.13) and by comparison to the reported literature (Linington et al., 2003), 26
was found to be latonduine A that was first isolated from the marine sponge Stylissa
carteri.
NH N
O
N
NNH2
Br
Br
1
2
3 4
56
78
910
11 13
15
H
H
Fig. 3.16. 1H–1H COSY and HMBC spectra of latonduine A (26).
Table 3.13. NMR data of latonduine A (26), measured in DMSO-d6.
26
# �H �C* # �H �C
* 1 13.11 (1H, br s, NH-pyrrole) 10 113.0
6 164.0 11 8.76 (1H, s) 155.77 8.16 (1H, d, 5.1 Hz, NH) 13 162.2
8 3.90 (2H, d, 5.1 Hz) 15 6.90 (2H, s, NH2-15)
9 163.4 *13C NMR values obtained from HMBC spectrum.

Results
93
3.2.14. (-)-Dibromophakellin H+Cl- (27, known compound)
(-)-Dibromophakellin H+Cl-
Sample code NdV VLC-16,A1
Biological source Stylissa massa
Sample amount 5.0 mg
Physical description White amorphous solid
Molecular formula C11H1179Br2N5O
Molecular weight 389 g/mol
Optical rotation � �20D� -46.0°C (c 0.08, CH3OH)
Retention time (HPLC) 11.46 min (half-time gradient)
O
Br
N
-Cl+HN
HN
N
NH2
Br
1
54
3
2
15
6810
1213
16
11
0,0 5,0 10,0 15,0 20,0 25,0 30,0-50
250
600 SE090422 #19 NdV VLC-16 A, 1 UV_VIS_1mAU
min
1 - 11,462
WVL:235 nm
No ionization in -ESI MS
Peak #1 100%
-10
50
200 250 300 350 400 450 500 550 595
%
nm
202.1289.1
237.2
Dibromphakellin 973.42
[M+H]+
100

Results
94
3.2.15. (-)-Monobromoisophakellin (28, known compound)
(-)-Monobromoisophakellin
Sample code NdV VLC-16,A2
Biological source Stylissa massa
Sample amount 4.0 mg
Physical description White amorphous solid
Molecular formula C11H1279BrN5O
Molecular weight 310 g/mol
Optical rotation � �20D� -22.0°C (c 0.06, CH3OH)
Retention time (HPLC) 8.96 min (half-time gradient)
O
HN
N
HN
NH
NH2
Br
15
4
32
15
6810
1213
16
11
0,0 5,0 10,0 15,0 20,0 25,0 30,0-20
50
90 SE090422 #20 NdV VLC-16 A, 2 UV_VIS_1mAU
min
1 - 8,959
WVL:235 nm
No ionization in -ESI MS
Peak #1 100%
200 250 300 350 400 450 500 550 595
%
nm
280.7
559.4
22-Dehydrocampesterol 960.35
[M+H]+
70,0
-10,0
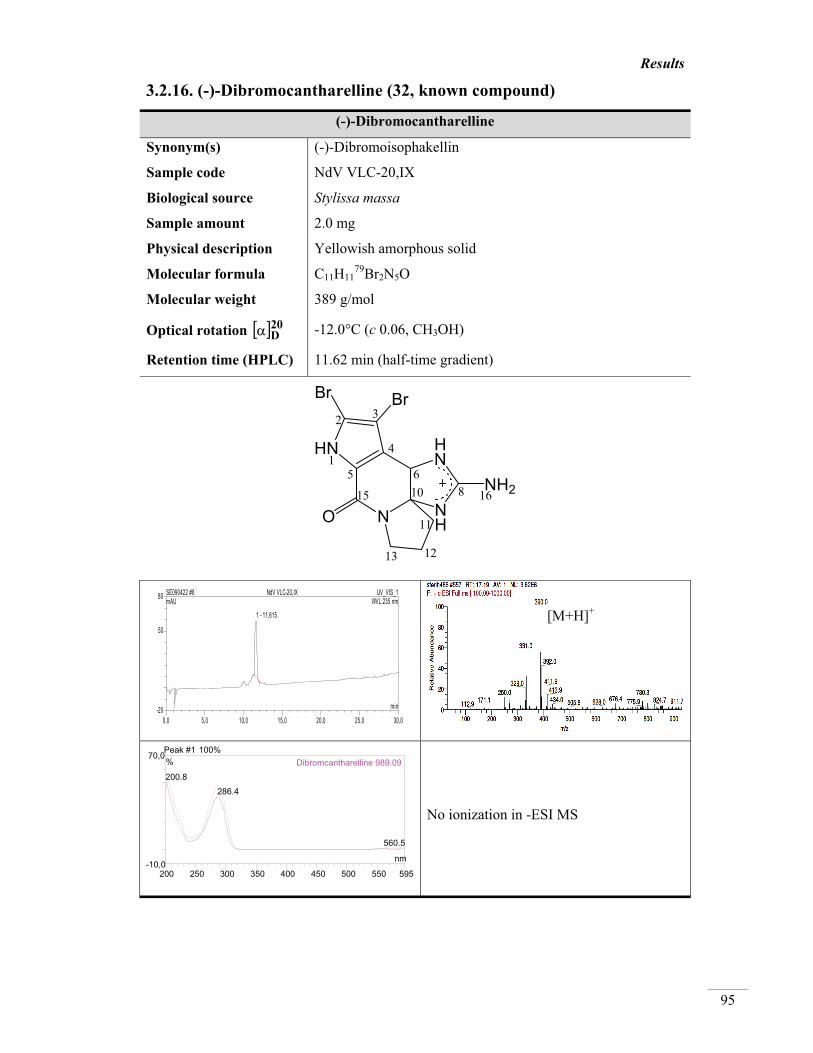
Results
95
3.2.16. (-)-Dibromocantharelline (32, known compound)
(-)-Dibromocantharelline
Synonym(s) (-)-Dibromoisophakellin
Sample code NdV VLC-20,IX
Biological source Stylissa massa
Sample amount 2.0 mg
Physical description Yellowish amorphous solid
Molecular formula C11H1179Br2N5O
Molecular weight 389 g/mol
Optical rotation � �20D� -12.0°C (c 0.06, CH3OH)
Retention time (HPLC) 11.62 min (half-time gradient)
O
HN
Br
N
HN
NH
NH2
Br
15
4
32
15
6810
1213
16
11
0,0 5,0 10,0 15,0 20,0 25,0 30,0-20
50
80 SE090422 #6 NdV VLC-20,IX UV_VIS_1mAU
min
1 - 11,615
WVL:235 nm
No ionization in -ESI MS
Peak #1 100%
200 250 300 350 400 450 500 550 595
%
nm
200.8 286.4
560.5
Dibromcantharelline 989.09
[M+H]+
70,0
-10,0

Results
96
Compound (27) was isolated as a white amorphous solid. It showed pseudomolecular
ion peaks at m/z 388, 390, and 392 [M+H]+, (1:2:1) in its EI mass spectrum revealing that
27 is a dibrominated compound. The structure of 27 was further confirmed by
interpretation of 1H�1H COSY, and HMBC spectra (Fig. 3.17). The 1H�1H COSY
spectrum (Fig. 3.17) revealed two extended spin systems. The first spin system existed
between H-6 [�H 6.30 (br s)], and NH-7 [�H 9.85 (br s)], and the second one was between
H-11A [�H 2.40 (m)], H-11B [�H 2.28 (m)], =CH2-12 [�H 2.05 (m)], H-13A [�H 3.66 (m)],
and H-13B [�H 3.47 (m)]. Moreover, the HMBC spectrum (Fig. 3.17) revealed clear
correlations from H-3 [�H 7.02 (s)] to C-2 (�C 106.0), and C-5 (�C 124.8) to which H-6 [�H
6.3 (br s)] showed a correlation in addition to C-10 (�C 82.2), and C-15 (�C 156.3). The
optical rotation of 27 gave a value of � �20D� -46.0° (c 0.08, CH3OH). According to the
aforementioned data (Table 3.14) and by comparison to the reported literature (Sharma and
Magdoff-Fairchild, 1977), 27 was evidenced to be (-)-dibromophakellin H+Cl- that was
first isolated from the marine sponge Phakellia flabellata.
Compound (28) was isolated as a white amorphous solid. It showed pseudomolecular
ion peaks at m/z 310, and 312 [M+H]+, (1:1) in its EI mass spectrum revealing that 28 is a
monobrominated compound. The structure of 28 was further confirmed by interpretation of 1H�1H COSY spectra. The 1H�1H COSY spectrum (Fig. 3.17) revealed one extended
spin system between =CH2-11 [�H 2.22 (m)], =CH2-12 [�H 2.04 (m)], H-13A [�H 3.57 (m)],
and H-13B [�H 3.47 (m)] in addition to the clear correlations between NH-pyrrole [�H 12.45
(br s)], and H-2 [�H 7.23 (d, 2.9 Hz)]; NH-7 [�H 8.58 (br s)], to both NH-9 [�H 9.52 (br s)],
and H-6 [�H 5.22 (br s)]. The optical rotation of 28 gave a value of � �20D� -22.0° (c 0.06,
CH3OH). Based on the previously mentioned data (Table 3.14) and by comparison to the
reported literature (Assmann and Köck, 2002), 28 was proven to be (-)-
monobromoisophakellin that was first isolated from an unspecified Caribbean sponge of
the genus Agelas.
Compound (32) was isolated as a white amorphous solid. It showed pseudomolecular
ion peaks at m/z 388, 390, and 392 [M+H]+, (1:2:1) in its EI mass spectrum revealing that
32 is a dibrominated compound. Compound (32) differed from 28 by more 79 amu. This
difference was explained by the existence of one more bromine substituent in 32 than in
28. This also was accompanied by disappearance of one proton resonance at [�H 7.23 (d,
2.9 Hz)] that was assigned to H-2 in 28. The structure of 32 was further confirmed by
interpretation of 1H�1H COSY spectra. The 1H�1H COSY spectrum revealed one
extended spin system between =CH2-11 [�H 2.21 (m)], =CH2-12 [�H 2.01 (m)], H-13A [�H

Results
97
3.58 (m)], and H-13B [�H 3.47 (m)]. The optical rotation of 32 gave a value of � �20D� -12.0°
(c 0.06, CH3OH). According to the previously mentioned data (Table 3.14) and by
comparing to the reported literature (De Nanteuil et al., 1985), 32 was proven to be (-)-
dibromoisophakellin that was given the trivial name (-)-dibromocantharelline which was
firstly reported from the marine sponge Pseudaxinyssa cantharella.
O
Br
N
-Cl+HN
N
N
NH2
Br
1
543
215
6810
1213
16
11
H
HH
H
N
O
NH2
NN
N
Br
1
2 3
4
5 6
7
89
10
11
1213
1516
H
H
H
Fig. 3.17. 1H–1H COSY and HMBC
spectra of :
(-)-dibromophakellin H+Cl- (27), and
(-)-monobromoisophakellin (28).

Results
98
Table 3.14. NMR data of compounds (26, 28, and 32), measured in DMSO-d6.
# 27 28 32
�H �c* �H �H
1 12.45 (1H, br s, NH-pyrrole) 13.35 (1H, br s, NH-pyrrole)
2 106.0 7.23 (1H, d, 2.9 Hz)
3 7.02 (1H, s) 114.7
4
5 124.8
6 6.30 (1H, br s) 5.22 (1H, br s) 5.22 (1H, br s)
7 9.85 (1H, br s, NH) 8.58 (1H, br s, NH) 8.68 (1H, br s, NH)
8
9 9.52 (1H, br s, NH) 9.54 (1H, br s, NH)
10 82.2
11 A: 2.40 (1H, m)
B: 2.28 (1H, m) 2.22 (2H, m) 2.21 (2H, m)
12 2.05 (2H, m) 19.0 2.04 (2H, m) 2.01 (2H, m)
13 A: 3.66 (1H, m)
B: 3.47 (1H, m)
A: 3.57 (1H, m)
B: 3.47 (1H, m)
A: 3.58 (1H, m)
B: 3.47 (1H, m)
14 10.34 (1H, br s, C=NH+)
15 156.3
16 8.63 (1H, br s, NH2-16)
8.25 (1H, br s, NH2-16) 7.75 (2H, br s, NH2-16) 7.78 (2H, br s, NH2-16)
*13C NMR values obtained from HMBC spectrum.
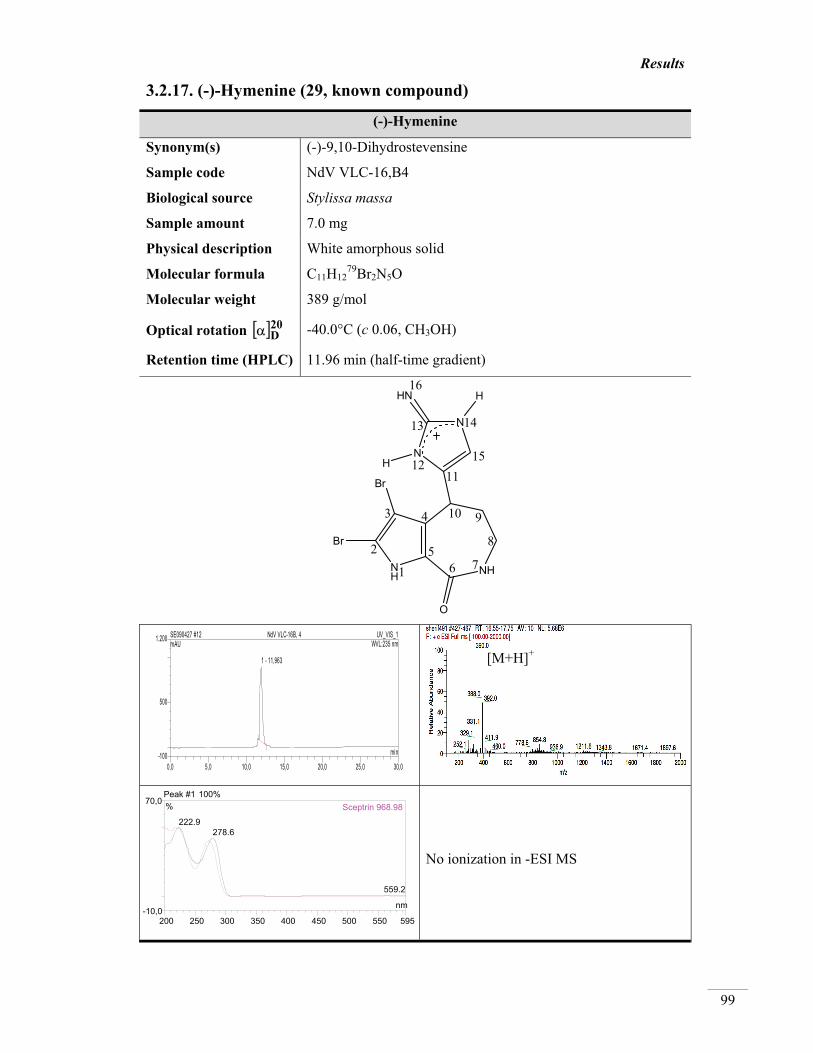
Results
99
3.2.17. (-)-Hymenine (29, known compound)
(-)-Hymenine
Synonym(s) (-)-9,10-Dihydrostevensine
Sample code NdV VLC-16,B4
Biological source Stylissa massa
Sample amount 7.0 mg
Physical description White amorphous solid
Molecular formula C11H1279Br2N5O
Molecular weight 389 g/mol
Optical rotation � �20D� -40.0°C (c 0.06, CH3OH)
Retention time (HPLC) 11.96 min (half-time gradient)
NH NH
N
N
HN
H
H
Br
Br
O
1
2
3 4
56 7
8
910
1112
13 14
15
16
0,0 5,0 10,0 15,0 20,0 25,0 30,0-100
500
1.200 SE090427 #12 NdV VLC-16B, 4 UV_VIS_1mAU
min
1 - 11,963
WVL:235 nm
No ionization in -ESI MS
Peak #1 100%
200 250 300 350 400 450 500 550 595
%
nm
222.9 278.6
559.2
Sceptrin 968.98
[M+H]+
70,0
-10,0

Results
100
3.2.18. Dispacamide E (30, new natural product)
Dispacamide E
Synonym(s)
Sample code NdV VLC-16B,IV
Biological source Stylissa massa
Sample amount 4.0 mg
Physical description White amorphous solid
Molecular formula C11H1179Br2N5O2
Molecular weight 405 g/mol
Retention time (HPLC) 14.11 min (half-time gradient)
NH
HN
O
Br
Br
NH
N
O
NH2
2
34
56
8
9
10
1113
15
16
0,0 5,0 10,0 15,0 20,0 25,0 30,0-40
100
200 SE090514 #5 NdV VLC-16B, IV UV_VIS_1mAU
min
1 - 14,114
WVL:235 nm
Peak #1 100%
-10,0200 250 300 350 400 450 500 550 595
%
nm
279.7
224.9
559.6
PC 3.3.6.8.4.A 982.8670,0
[M-H]-
[M+H]+
[M+Na]+ [2M+Na]+ [M+H]+

Results
101
Compound (29) was isolated as a yellow amorphous solid. It showed pseudomolecular
ion peaks at m/z 388, 390, and 392 [M+H]+, (1:2:1) in its EI mass spectrum revealing that
29 has two bromine substituents. The structure of 29 was further confirmed by
interpretation of 1H�1H COSY and HMBC spectra. The 1H�1H COSY spectrum (Fig.
3.18) revealed one extended spin system between NH-7 [�H 7.95 (t, 5.1 Hz)], =CH2-8 [�H
3.47 (m)], =CH2-9 [�H 2.50 (m)], and H-10 [�H 5.96 (t, 7.6 Hz)]. The HMBC spectrum
(Fig. 3.18) of 29 revealed clear correlations from NH-pyrrole [�H 12.62 (br s)] to C-3 (�C
100.5), and C-4 (�C 123.3); from H-15 [�H 6.22 (s)] to C-11 (�C 128.8), and C-13 (�C
146.8); and from H-10 to C-9 (�C 31.76). The optical rotation of 29 gave a value of � �20D� -
40.0° (c 0.06, CH3OH). Based on the preceding data (Table 3.15) and by comparing to the
reported literature (Kobayashi et al., 1986; Xu et al., 1997), 29 was deduced to be (-)-
hymenine that was firstly reported from an unspecified Okinawan marine sponge of the
genus Hymeniacidon.
Compound (30) was isolated as a faint yellow amorphous solid. It showed two
pseudomolecular ion clusters at m/z 404, 406, and 408 [M+H]+; and at m/z 426, 428, and
430 [M+Na]+, each at a 1:2:1 ratio in its ESI mass spectrum indicating that it was a
dibrominated compound. The 13C NMR spectrum showed 11 signals representing two
methylene groups in addition to nine sp2 carbons including two methine group and seven
fully substituted carbons. The molecular formula of 30 was suggested to be
C11H1179Br2N5O2 that was confirmed by HRESIMS (m/z 405.9320 [M+H]+ calcd for
C11H1279Br2N5O2, � +1.0 ppm). The structure of 30 was further confirmed by interpretation
of 1H�1H COSY, and HMBC spectra. The 1H�1H COSY spectrum (Fig. 3.18) showed a
cross peak between NH-pyrrole [�H 12.69, (br s)] and the aromatic proton H-2 [�H 6.90 (d,
1.3 Hz); �C 112.6] in addition to an extended spin system among NH-7 [�H 8.28 (t, 6.0
Hz)], =CH2-8 [�H 3.47 (m); �C 37.4], =CH2-9 [�H 2.50 (m); �C 27.3], and H-10 [�H 5.96 (t,
7.6 Hz); �C 116.8]. The HMBC spectrum (Fig. 3.18) further supported the proposed
structure and revealed correlations between H-2 to C-4 (�C 104.7), and C-5 (�C 128.0); H-
10 to C-8 (�C 37.4), C-11 (�C 129.6), and C-15 (�C 163.6); =CH2-8 to C-9 (�C 27.3), C-10
(�C 116.8), and C-6 (�C 158.9). According to the aforementioned data (Table 3.15) and by
comparison to the other reported dispacamides in literature (Cafieri et al., 1996; Cafieri et
al., 1997). Therefore, 30 was confirmed to be N-((9E)-3-(2-amino-4-oxo-1H-imidazol-
5(4H)-ylidene)propyl)-3,4-dibromo-1H-pyrrole-2-carboxamide that was given the trivial
name, dispacamide E.

Results
102
N N
N
N
HN
H
H
Br
Br
O
1
2
3 4
5 6 78
910
1112
13 14
15
16
HH
N N
O
Br
Br
NH
NO
NH2
23
4
56
8
9
10
1113
15
16H
HH
H
Fig. 3.18. 1H–1H COSY and HMBC spectra of (-)-hymenine (29), and dispacamide E (30).

Results
103
Table 3.15. NMR data of compounds (29 and 30), measured in DMSO-d6.
# 29 30
�H �C* �H �C
1 12.62 (1H, br s, NH-pyrrole) 12.69 (1H, br s, NH-pyrrole)
2 6.90 (1H, d, 1.3 Hz) 112.6
3 100.5 97.8
4 123.3 104.7
5 128.0
6 158.9
7 7.95 (1H, t, 5.1 Hz, NH) 8.28 (1H, t, 6.0 Hz, NH)
8 3.10 (2H, m) 3.47 (2H, m) 37.4
9 A: 2.15 (1H, m)
B: 1.98 (1H, m) 31.76 2.50 (2H, m) 27.3
10 4.10 (1H, t, 4.1 Hz) 5.96 (1H, t, 7.6 Hz) 116.8
11 128.8 129.6
12 11.88 (1H, br s, NH-14)
13 146.8 156.0
14 12.31 (1H, br s, NH-14)
15 6.22 (1H, s, H-15) 111.1 163.6
16 7.41 (2H, s, NH2-16) 9.38 (2H, s, NH2-16)
*13C NMR values obtained from HMBC spectrum.

Results
104
3.2.19. (10Z)-Debromohymenialdisine (33, known compound)
(10Z)-Debromohymenialdisine
Synonym(s) (10Z)-Debromohymenialdisine
Sample code 3A-1
Biological source Stylissa massa
Sample amount 24.0 mg
Physical description Pale yellow needle crytals
Molecular formula C11H11N5O2
Molecular weight 245 g/mol
Retention time (HPLC) 11.51 min (standard gradient)
NH NH
N
HN
O
H2N
O
12
34
5 6 7
8
910
1112
1314
15
16
0,0 10,0 20,0 30,0 40,0 50,0 60,0-100
1.000
1.400 SE090407 #2 3A-1 UV_VIS_1mAU
min
1 - 11,513
2 - 48,094
WVL:240 nm
No ionization in -ESI MS
Peak #1 100%
200 250 300 350 400 450 500 550 595
%
nm
344.4
210.0
Debromohymenialdisin 998.14
[M+H]+
70,0
-10,0

Results
105
3.2.20. Spongiacidin B (34, known compound)
Spongiacidin B
Synonym(s) (10E)-3-Bromo-2-debromohymenialdisine
Sample code 3A-3
Biological source Stylissa massa
Sample amount 4.0 mg
Physical description Pale yellow powder
Molecular formula C11H1079BrN5O2
Molecular weight 324 g/mol
Retention time (HPLC) 14.63 min (standard gradient)
NH NH
NH
N
O
1
2
3 4
5 6 78
910
O
NH2
11
13
15
16
Br
0,0 10,0 20,0 30,0 40,0 50,0 60,0-15,0
0,0
20,0
40,0 SE090407 #4 3A-3 UV_VIS_1mAU
min
1 - 14,626
2 - 48,097
WVL:240 nm
No ionization in -ESI MS
Peak #1 100%
200 250 300 350 400 450 500 550 595
%
nm
332.6
259.7
548.8
3-Bromhymenialdisin 969.42
[M+H]+
70,0
-10,0
[2M+H]+
[2M+Na]+

Results
106
Compound (33) was isolated as a faint yellow powder. It showed pseudomolecular ion
peak at m/z 246 [M+H]+ in its ESI mass spectrum. The 13C NMR and DEPT spectra of 33
showed 11 carbon resonances defined into two methylene groups in addition to nine sp2
carbons including two methine groups and seven fully substituted carbons. The structure of
33 was further confirmed by interpretation of 1H�1H COSY, and HMBC spectra. The 1H�1H COSY spectrum (Fig. 3.19) revealed two extended spin systems. The first one
existed among NH-pyrrole [�H 12.14, (br s)] and the two aromatic protons H-2 [�H 7.13 (t,
2.6 Hz); �C 122.7], and H-3 [�H 6.52 (t, 2.6 Hz); �C 109.6] in addition to an extended spin
system over NH-7 [�H 8.06 (t, 4.5 Hz)], =CH2-8 [�H 3.30 (m); �C 39.6], and =CH2-9 [�H
3.30 (m); �C 31.6]. The HMBC spectrum (Fig. 3.19) further confirmed the structure and
revealed correlations from both H-2 and H-3 to C-4 (�C 120.3), C-5 (�C 126.7), and C-11
(�C 120.5); and from both =CH2-8 and =CH2-9 to C-10 (�C 130.0). According to the
formerly reported notion by Williams and Faulkner in 1996, compound (33) revealed
similarly two sets of signals in the NMR spectra of DMSO solutions which were attributed
to tautomerism of debromohymenialdisine between Z and E form. Based on the preceding
data (Table 3.16) and by comparison to the reported literature, 33 was confirmed to be
(10Z)-debromohymenialdisine which was first isolated from the marine sponge Phakellia
flabellata (Sharma et al., 1980) and also reported from Axinella verrucosa and Acanthella
aurantiaca (Cimino et al., 1982).
Compound (34) was isolated as a yellow powder. It showed pseudomolecular ion
peaks at m/z 324, and 326 [M+H]+ in a 1:1 ratio in its ESI mass spectrum which indicating
that 34 is a monobrominated compound. The structure of 33 was further confirmed by
interpretation of 1H�1H COSY spectrum. The 1H�1H COSY spectrum (Fig. 3.19)
revealed a clear cross peak between NH-pyrrole [�H 12.55, (br s)] and the aromatic proton
H-2 [�H 7.28 (d, 3.2 Hz)] in addition to another spin system extending over NH-7 [�H 8.00
(t, 4.7 Hz)], =CH2-8 [�H 3.24 (m)], and =CH2-9 [�H 3.24 (m)]. According to the
aforementioned data (Table 3.16) and by comparison to the reported literature (Inaba et al.,
1998), 34 was confirmed to be (10E)-3-bromo-2-debromohymenialdisine, trivially named
as spongiacidin B, which was first isolated from an unspecified Okinawan marine sponge
of the genus Hymeniacidon.

Results
107
N N
N
HN
O
H2N
O
1
2
3 4
5 6 7
8
910
1112
1314
15
16
HH
H
H
N N
N
HN
O
H2N
O
1
2
34
5 6 78
910
1112
13
14
15
16
HH
H
Br
Fig. 3.19. 1H–1H COSY and HMBC spectra
of (10E)-debromohymenialdisine (33) and 1H–1H COSY spectrum of spongiacidin B
(34).

Results
108
3.2.21. (10Z)-Hymenialdisine (35, known compound)
(10Z)-Hymenialdisine
Synonym(s) 4-(2-Amino-4-oxo-2-imidazolidin-5-ylidene)-2-bromo-4,5,6,7-tetrahydropyrrolo[2,3-c]azepin-8-one
Sample code 3A-4
Biological source Stylissa massa
Sample amount 5.0 mg
Physical description Pale yellow powder
Molecular formula C11H1079BrN5O2
Molecular weight 324 g/mol
Retention time (HPLC) 14.83 min (standard gradient)
NH NH
N
HN
O
H2N
O
12
34
5 6 7
8
910
1112
1314
15
16
Br
0,0 10,0 20,0 30,0 40,0 50,0 60,0-50
200
450 SE090407 #5 3A-4 UV_VIS_1mAU
min
1 - 14,826
2 - 48,081
WVL:240 nm
No ionization in -ESI MS
Peak #1 100%
200 250 300 350 400 450 500 550 595
%
nm
354.6209.3 262.1
Hymenialdisin 997.22
[M+H]+ [2M+Na]+
70,0
-10,0

Results
109
3.2.22. (10Z)-3-Bromohymenialdisine (36, known compound)
(10Z)-3-Bromohymenialdisine
Synonym(s) (10Z)-3-Bromohymenialdisine
Sample code 3A-5
Biological source Stylissa massa
Sample amount 1.0 mg
Physical description Pale yellow powder
Molecular formula C11H979Br2N5O2
Molecular weight 403 g/mol
Retention time (HPLC) 17.64 min (standard gradient)
NHNH
NH
N
O
1
2
3 4
5 6 78
910
O
NH2
11
13
15
16
Br
Br
0,0 10,0 20,0 30,0 40,0 50,0 60,0-20,0
0,0
40,0 SE090407 #6 3A-5 UV_VIS_1mAU
min
1 - 3,041
2 - 17,640
3 - 48,113
WVL:240 nm
Peak #2 100%
200 250 300 350 400 450 500 550 595
%
nm
329.6271.5
559.1
3-Bromhymenialdisin 998.83
[M+H]+
70,0
-10,0
[2M+Na]+
[M-H]- [2M+Na-H]-

Results
110
Compound (35) was isolated as a yellow powder. It showed pseudomolecular ion
peaks at m/z 324, and 326 [M+H]+ in a 1:1 ratio in its ESI mass spectrum which indicating
that 35 is a monobrominated compound. The molecular mass was similar to that of 34 and
79 amu more than that of 33. Based on the close resemblance of UV spectrum of 35 and
33, the former was suggested to be a monobrominated derivative of 33. The structure of
35 was further confirmed by interpretation of 1H�1H COSY spectrum. The 1H�1H
COSY spectrum revealed a clear spin system extending over NH-7 [�H 7.95 (t, 4.8 Hz)],
=CH2-8 [�H 3.20 (m)], and =CH2-9 [�H 3.32 (m)]. According to these data (Table 3.17) and
by comparison to the reported literature (Williams and Faulkner, 1996), 35 was confirmed
to be (10Z)-hymenialdisine which was first isolated from Axinella verrucosa and
Acanthella aurantiaca (Cimino et al., 1982).
Compound (36) was isolated as a yellow powder. It showed two pseudomolecular ion
clusters at m/z 402, 404, and 406 [M+H]+, and at m/z 424, 426, and 428 each in a 1:2:1
ratio in its ESI mass spectrum which indicating that 36 is a dibrominated compound. The
molecular mass was 79 amu more than that of 34. Based on the close resemblance of UV
spectrum of 36 and 34, the former was suggested to be a brominated derivative of 34. The
structure of 36 was further confirmed by interpretation of 1H�1H COSY spectrum. The 1H�1H COSY spectrum revealed a clear spin system extending over NH-7 [�H 8.03 (t, 4.6
Hz)], =CH2-8 [�H 3.24 (m)], and =CH2-9 [�H 3.24 (m)]. According to these data (Table
3.17) and by comparison to the reported literature (Supriyono et al., 1995), 36 was
confirmed to be (10Z)-3-bromohymenialdisine which was first isolated from the tropical
marine sponge Axinella carteri.

Results
111
Table 3.16. NMR data of compounds (33 and 34), measured in DMSO-d6.
# 33 34
�H �c �H
1 12.14 (1H, br s , NH) 12.55 (1H, br s, NH))
2 7.13 (1H, t, 2.6 Hz) 122.7, CH 7.28 (1H, d, 3.2 Hz)
3 6.52 (1H, t, 2.6 Hz) 109.6, CH
4 120.3, C
5 126.7, C
6 163.0, C
7 8.06 (1H, t, 4.5 Hz, NH) 8.00 (1H, t, 4.7 Hz, NH)
8 3.30 (2H, m) 39.6, CH2 3.24 (2H, m)
9 3.30 (2H, m) 31.6, CH2 3.24 (2H, m)
10 130.0, C
11 120.5, C
12 10.73 (1H, br s, NH)
13 154.6, C
14 8.27 (1H, br s, NH)
15 163.9, C
16 8.70 (2H, br s, NH2) 9.26 (1H, br s, NH)
Table 3.17. NMR data of compounds (35 and 36), measured in DMSO-d6.
# 35 36
�H �H
1 12.39 (1H, br s, NH)) 13.34 (1H, br s, NH))
2
3 7.20 (1H, br s)
4
5
6
7 7.95 (1H. t, 4.8 Hz, NH) 8.03 (1H. t, 4.6 Hz, NH)
8 3.20 (2H, m) 3.24 (2H, m)
9 3.32 (2H, m) 3.24 (2H, m)
10
11
12 10.78 (1H, br s, NH) 10.59 (1H, br s, NH)
13
14 8.20 (1H, br s, NH)
15
16 9.0 (1H, br s, NH)

Results
112
3.2.23. Biological activity of bromopyrrole alkaloids isolated from Indonesian marine sponge Stylissa massaIsolated bromopyrrole alkaloids from the methanolic extract of Stylissa massa were
subjected to cytotoxicity (MTT) assay against mouse lymphoma (L5178Y) cells whose
results (Table 3.18) interestingly revealed that some of the tested compounds proved
significantly cytotoxic with IC50 values ranging between 6.33 and 28.28 μM compared to
kahalalide F as standard (IC50 = 4.30 μM).
Table 3.18. Cytotoxicity (MTT) assay of compounds isolated from Stylissa massa.
Sample tested L5178Y growth
in % (@ 10 μg/mL)
EC50
(μg/mL) (μM)
Ethyl 3,4-dibromo-1H-pyrrole-2-carboxylate (15) 27.2 4-Bromopyrrole-3-carboxamide (16) 100.0 3,4-Dibromopyrrole-2-carboxamide (17) 75.8 (-)-Longamide B methyl ester (18) 70.0 (-)-Longamide B ethyl ester, Hanishin (19) 14.1 9.3 24.47 Aldisine (20) 100.0 2,3-Dibromoaldisine (21) 98.8 2-Bromoaldisine (22) 100.0 3-Bromaldisine (23) 100.0 (-)-Mukanadin C (24) 100.0 (-)-Longamide (25) 100.0 Latonduine A (26) 18.6 10.0 26.81 (-)-Dibromophakellin H+Cl- (27) 1.0 11.0 28.28 (-)-Monobromoisophakellin (28) 73.7 (-)-Hymenine (29) 16.0 Dispacamide E (30) 77.2 (-)-Longamide B (31) 100.0 (-)-Dibromocantharelline (=Dibromoisophakellin) (32) 35.3 (10Z)-Debromohymenialdisine (33) 0.0 1.55 6.33 Spongiacidin B (34) 0.0 2.40 7.41 (10Z)-Hymenialdisine (35) 0.0 2.70 8.33 (10 Z)-3-Bromohymenialdisine (36) 0.0 3.90 9.68 Kahalalide F (positive control) 6.30 4.30
In antimicrobial activity, only ethyl 3,4-dibromo-1H-pyrrole-2-carboxylate (15)
showed antifungal activity against Aspergillus faecalis and A. fumigatus with the same
MIC value of 62.5 μg/mL. However, 4-bromo-1H-pyrrole-3-carboxamide (16) and aldisine
(20) demonstrated antiviral activity against human rhino viruses (HRV2, HRV8, and
HRV39) and respiratory syncytial virus A (RSVA) with IC50 values of 6.25, 0.78, 0.78,
0.78 μg/mL, respectively for 16 and 3.13, 1.56, 1.56, 0.78 μg/mL, respectively for 20.

Results
113
Furthermore, protein kinase inhibitory activity of the isolated bromopyrrole
metabolites against six protein kinases namely, dual-specificity tyrosine-(Y)-phospho-
rylation regulated kinase 1A (DYRK1A), cyclin-dependent kinase (CDK5), glycogen
synthase kinase-3 (GSK-3), CDC-like kinase 1 (CLK-1), casein kinase 1 (CK1), and
Plasmodium falciparum glycogen synthase kinase-3 (PfGSK-3).
Table 3.19. Protein kinase inhibitory activity of compounds isolated from Stylissa massa.
Sample tested IC50 (μM)
DYRK1A CDK5 GSK-3 CLK-1 CK-1 PfGSK-3
4-Bromo-1H-pyrrole-3-carboxamide (16) 12.7 >53 >53 10.6 48 >53
3,4-Dibromo-1H-pyrrole-2-carboxamide (17) 14.9 >37.3 >37.3 7.5 18.7 >37.3
(-)-Longamide B ethyl ester, hanishin (19) >26.3 >26.3 >26.3 1.7 7.9 >26.3
Aldisine (20) 50.6 >61 >61 13.4 25.6 >61
2,3-Dibromoaldisine (21) 11.2 >31 31 2.0 3.7 >31
2-Bromoaldisine (22) >41.2 >41.2 >41.2 2.3 1.6 >41.2
3-Bromoaldisine (23) 10.3 27.6 21 1.6 1.3 15.6
(-)-Mukanadin C (24) 0.6 2.4 2.4 0.5 0.6 1.3
(-)-Longamide (25) 7.1 13.2 7.4 1.9 1.6 16.8
Latonduine A (26) 6.2 24 18.8 3.2 6.2 18.8
(-)-Dibromophakellin H+Cl- (27) 3.6 3.9 3.1 2.8 6.4 5.4
(-)-Hymenine (29) 0.2 0.4 0.3 0.2 0.4 0.4
Dispacamide E (30) 6.2 16 2.1 10.4 4.9 18.8
(-)-Longamide B (31) 15.6 >28.4 >28.4 6.5 2.1 25.6
(-)-Dibromocantharelline (32) 0.3 0.6 0.8 0.3 0.3 0.6
(10Z)-Debromohymenialdisine (33) 0.02 0.09 0.13 0.01 0.05 0.16
Spongiacidin B (34) 0.04 0.09 0.04 0.03 0.06 0.04
(10Z)-Hymenialdisine (35) 0.01 0.26 0.29 0.01 0.13 0.2
(10Z)-3-Bromohymenialdisine (36) 0.07 0.07 0.04 0.04 0.27 0.07
The results of protein kinase inhibitory activity assay (Table 3.19) revealed a
correspondence with the respective cytotoxicity (MTT) assay results (Table 3.18). For
example, compounds (33–36), that showed IC50 values between 6.33 and 9.68 μM in MTT
assay, proved significant inhibitory activity against tested protein kinases with IC50 values
in the submicromolar range (Table 3.19). This conclusively suggested that protein kinase
inhibition might be a plausible mechanism through which these compounds exerted their
antiproliferative activity.

Results
114
3.3. Secondary metabolites isolated from Jaspis splendensJaspamide (jasplakinolide, 37), a cyclodepsipeptide isolated from marine sponges of the
genus Jaspis, is known for its pronounced biological activities which include antifungal
(Scott et al., 1988), insecticidal (Zabriskie et al., 1986; Crews et al., 1986), and cytotoxic
activity against 36 human solid tumor cell cultures (Inman and Crews, 1989). The
biological properties and structural features of jaspamide stimulated numerous efforts
aiming at a total synthesis and structural modification (Tannert et al., 2009). As a part of
our ongoing studies on bioactive natural products from marine sponges we investigated a
specimen of Jaspis splendens collected at Kalimantan (Indonesia).
The crude methanolic extract exhibited considerable in vitro cytotoxic activity against
mouse lymphoma (L5178Y) cells. Eight compounds were isolated through a bioactivity-
guided isolation scheme from the ethyl acetate soluble fraction of the total methanolic
extract of Jaspis splendens. In addition to the known compounds, 6ß-hydroxy-24-
methylcholesta-4,22-dien-3-one (40), 6ß-hydroxy-24-methylcholesta-4-en-3-one (41), 6ß-
hydroxy-24-ethylcholesta-4-en-3-one (42), maculosin-1 (cyclo-L-Pro-L-Tyr) (43),
sangivamycin (44), two new jaspamide derivatives (38 and 39), were isolated together with
the parent compound jaspamide (37). The structures of isolated compounds were
unambigously elucidated based on 1D and 2D NMR spectral data, mass spectrometry, and
comparison with the reported literature.
All isolated compounds exhibited cytotoxicity against mouse lymphoma (L5178Y)
cells using MTT assay when they were qualitatively tested at a concentration of 10 μg/mL.
New jaspamide derivatives (38 and 39), together with jaspamide (37), maculosin-1 (43),
and sangivamycin (44) exhibited the highest cytotoxicity with IC50 values ranging from
<0.1 to 0.28 μg/mL, compared to kahalalide F [IC50= 6.3 μg/mL (4.3 μM)].

Results
115
3.3.1. Jaspamide (37, known compound)
Jaspamide
Synonym(s) Jasplakinolide
Sample code Jaspis EtOAc C&D E
Biological source Jaspis splendens
Sample amount 105.0 mg
Physical description Pale yellow amorphous solid
Molecular formula C36H4579BrN4O6
Molecular weight 710 g/mol
Optical rotation � �20D� -128.0°C (c 0.02, CHCl3)
Retention time (HPLC) 30.39 min (standard gradient)
HN O
N
NH
O
O
O
O
HNBr
1
3
5
7
911
12
1415
16
17
1819
21
24
26
27
30
OH
33
34
35
36
0,0 10,0 20,0 30,0 40,0 50,0 60,0-100
200
400
600
800 SE081106 #6 Jaspis EtOAc C&D E UV_VIS_1mAU
min
1 - 30,392
WVL:235 nm
Peak #1
200 250 300 350 400 450 500 550 595
%
nm
281.6275.6 269.1
22-Dehydrocampesterol 966.50100%
70,0
-10,0
[M+H]+
[M-H]-

Results
116
Compound (37) was obtained as a white amorphous solid. Being a monobrominated
compound was supported by ESI mass spectrum which exhibited pseudomolecular ion
peaks at m/z 709, and 711 [M+H]+; and at m/z 731, and 733 [M+Na]+, each in a ratio of
1:1. The molecular formula of 37 was revealed to be C36H4679BrN4O6 by HRESIMS (m/z
711.2571 [M+H] +, � +1.0 ppm), and the characteristic UV absorption spectrum [�max 225,
280 nm] was indicative of the parent cylcodepsipeptide, jaspamaide. Structural elucidation
of 37 was based on results of 1D and 2D NMR spectral analyses including 1H-NMR, 1H�1H COSY and HMBC spectra (Table 3.20), (Fig. 3.20). The close resemblance of 1H,
and 13C resonances between jaspamide (37) and the reported values (Zabriskie et al., 1986;
Crews et al., 1986) implied that the chiral centers of alanine, 2-bromoabrine (N-
methyltryptophan), ß-tyrosine, and of the polypropionate fragment had the same relative
configurations. From these data (Table 3.20), compound 37 was deduced to be the parent
cyclodepsipeptide, jaspamide.
HN O
N
NH
O
O
O
O
HNBr
1
3
5
7
911
12
14
1516
17
1819
21
24
26
27
30
OH
33
34
35
36
Fig. 3.20. Key HMBC correlations of jaspamide (37).

Results
117
3.3.2. Jaspamide Q (38, new natural product)
Jaspamide Q
Synonym(s) 26-Debromojaspamide
Sample code Jaspis EtOAc C&D D,D
Biological source Jaspis splendens
Sample amount 0.7 mg
Physical description White amorphous solid
Molecular formula C36H46N4O6
Molecular weight 631 g/mol
Optical rotation � �20D� -62.0°C (c 0.01, CHCl3)
Retention time (HPLC) 29.84 min (standard gradient)
HN O
N
NH
O
O
O
O
HN
1
3
5
7
911
12
1415
16
17
1819
21
24
26
27
30
OH
33
34
35
36
0,0 10,0 20,0 30,0 40,0 50,0 60,0-60
0
100 SE081113 #6 Jaspis C&D, D, D UV_VIS_1mAU
min
1 - 29,844
WVL:235 nm
Peak #1 100% 70,0
200 250 300 350 400 450 500 550 595
%
nm
225.7
281.3278.2
22-Dehydrocampesterol 972.97
-10,0
[M+H]+
[M-H]-
[M+Na]+

Results
118
Compound (38) was obtained as a white amorphous solid, and the ESIMS spectrum
showed a pseudomolecular ion peaks at m/z 631.3 [M+H]+, and at m/z 653.4 [M+Na]+,
which was 79 amu smaller than that of jaspamide (37), the parent compound. This
difference was assigned to the absence of the bromine atom at C-26 in jaspamide (37). The
molecular formula of 38 was deduced to be C36H46N4O6, based on HRFTMS (m/z
631.3491 [M+H]+, � +1.0 ppm), therefore 38 was identified as the debromo analogue of
37. 1H NMR spectral data (Table 3.20) revealed that the resonances of 38 were
superimposable with those of 37 with only one additional proton resonance at [�H 6.87 (br
s)] that was ascribed to H-26. The complete structure of 38 was unambiguously elucidated
and assigned on the basis of 1H–1H COSY, TOCSY, ROESY, and HMBC spectra.
In particular, the similarity of 1H, and 13C resonances between 38 and jaspamide 37
evidenced that the chiral centers of alanine, abrine (N-methyltryptophan), ß-tyrosine, and
of the polypropionate fragment had the same relative configurations in both molecules.
Therefore, the stereochemistry depicted for 38 was tentatively assigned by analogy with
the parent compound together with ROESY spectrum (Fig. 3.21) that revealed a clear
correlation between Me-16 and Me-34; and Me-33 and Me-36. However, an apparent
deshielding of Me-16 was noted in 38 [�H 1.04 (3H, d, 6.6 Hz)] compared to 37 [�H 0.70
(3H, d, 6.7 Hz)] resembling that between jaspamide M [�H 1.17 (3H, d, 6.8 Hz)] (Gala et
al., 2009) and jaspamide H [�H 0.72 (3H, d, 6.7 Hz)] (Gala et al., 2008). These differences
in chemical shifts for the latter congeners were proven to be caused by D-Ala or L-Ala
residues, respectively. Anaylsis of the absolute configurations of the amino acids of 38
could not be performed due to the small amount of compound isolated (0.7 mg).
A partial 13C assignment of 38 was achieved through HMBC spectrum (Fig. 3.21)
which revealed clear correlations at �c 174.5, �c 40.4, �c 40.9, �c 133.6, �c 128.2, �c 29.5, �c
43.6, �c 70.4, �c 56.4, �c 173.6, and �c 46.0 ppm that were ascribed to C-1 to C-8, and C-13
to C-15, respectively. Moreover, HMBC spectra evidenced and confirmed the amino acid
sequence in 38 through cross-peaks between NH-Tyr and C-12, Me-17 and C-14, and
between NH-Ala and C-1. From the aforementioned data, compound (38) was deduced to
be a debromo analogue of jaspamide, which was given the trivial name jaspamide Q.

Results
119
3.3.3. Jaspamide R (39, new natural product)
Jaspamide R
Synonym(s) 22-Bromojaspamide
Sample code Jaspis EtOAc C&D F,F
Biological source Jaspis splendens
Sample amount 0.5 mg
Physical description White amorphous solid
Molecular formula C36H4479Br2N4O6
Molecular weight 789 g/mol
Optical rotation � �20D� -100.0°C (c 0.01, CHCl3)
Retention time (HPLC) 32.09 min (standard gradient)
HN O
N
NH
O
O
O
O
HN
1
3
5
7
911
12
1415
16
17
1819
21
24
26
27
30
OH
33
34
35
36
Br
Br
0,0 10,0 20,0 30,0 40,0 50,0 60,0-100
0
200 SE081111 #16 Jaspis C&D F, F UV_VIS_1mAU
min
1 - 32,087WVL:235 nm
Peak #1 100%
-10,0
70,0
200 250 300 350 400 450 500 550 595
%
nm
230.9
283.4280.1
No spectra library hits found!
[M+H]+
[M-H]-

Results
120
HN O
N
NH
O
O
O
O
HN
1
3
5
7
911
12
1415
16
17
1819
21
24
26
27
30
OH
33
34
35
36
HN O
N
NH
O
O
O
O
HN
1
3
5
7
911
12
1415
16
17
1819
21
24
26
27
30
OH
33
34
35
36
Br
Br
Compound (39) was isolated as a white amorphous solid. Its ESI mass spectrum
exhibited pseudomolecular ion peaks at m/z 787.1, 789.1, and 791.1 [M+H]+, in a ratio of
1:2:1, supporting the existence of two bromine atoms in the compound. The molecular
formula of 39 was determined to be C36H44Br2N4O6 by HRFTMS (m/z 789.1691 [M+H]+,
� +1.0 ppm) which exceeds that of jaspamide (37) by 79 amu revealing that 39 is a
dibromo analogue of jaspamide Q (38).
This difference was explained by the 1H NMR spectral data (Table 3.20) which
revealed close similarity between 39 and jaspamide (37) except for the proton resonances
corresponding to the indole moiety of the 2-bromoabrine unit. Compound (39) showed
three proton resonances at [�H 7.41 (br s)], [�H 7.20 (d, 8.2 Hz)], and [�H 7.42 (d, 8.2 Hz)]
that were assigned to H-21, H-23, and H-24, respectively. Whereas for jaspamide (37),
four resonances, at [�H 7.23 (d, 8.0 Hz)], [�H 7.10 (t, 8.0 Hz)], [�H 7.12 (t, 8.0 Hz)], and [�H
7.54 (d, 8.0 Hz)], ascribed for H-21 to H-24, were observed. Based on this finding, the
additional bromine atom of 39 was assumed to be located at C-22. This hypothesis was

Results
121
further confirmed by 2D NMR spectral analyses including 1H–1H COSY, TOCSY, and
NOESY spectra (Fig. 3.21) that revealed a clear NOE correlation between proton
resonance at [�H 7.41 (br s)], and NH-Tyr at [�H 7.53 (d, 8.6 Hz)] proving the attachment
of the second bromine atom to be at C-22. Moreover, the close resemblance in 1H
resonances between 39, and jaspamide (37) supports the notion that the chiral centers of
alanine, 2,5-dibromoabrine, ß-tyrosine, and the polypropionate fragment have the same
relative configurations in both molecules. Again, due to the lack of material isolated of 39
(0.5 mg), analysis of the absolute configurations of the amino acids, e.g. by Marfey’s
method, could not be performed. From the preceding data, compound (39) was concluded
to be a dibromo analogue of 38 which was named as jaspamide R (39).
HN O
N
NH
O
O
O
O
HN
1
3
5
7
911
12
14
1516
17
1819
21
24
26
27
30
OH
33
34
35
36
HN O
N
NH
O
O
O
O
HNBr
1
3
5
7
911
12
1415
16
17
1819
21
24
26
27
30
OH
33
34
35
36
Br
Fig. 3.21. HMBC and ROESY spectra
of jaspamide Q (38) and NOESY
spectrum of jaspamide R (39).

Results
122
Table 3.20. NMR data of jaspamide (37), jaspamide Q (38) amd R (39).
# 37 38 39
�H mult. (J Hz) �H mult. (J Hz) �H mult. (J Hz)
2 2.50 (m) 2.51 (m) 2.49 (m)
3 A) 2.37 (dd, 11.5, 15.8 Hz)
B) 1.89 (d, 15.8 Hz)
A) 2.37 (dd, 11.5, 15.8 Hz)
B) 1.90 (d, 15.8 Hz)
A) 2.37 (dd, 11.5, 15.8 Hz)
B) 1.90 (d, 15.8 Hz)
5 4.75 (d, 7.9 Hz) 4.79 (d, 6.7 Hz) 4.74 (d, 6.7 Hz)
6 2.23 (m) 2.23 (m) 2.23 (m)
7 A) 1.32 (m), B) 1.10 (m) A) 1.32 (m), B) 1.10 (m) A) 1.32 (m), B) 1.10 (m)
8 4.62 (m) 4.64 (m) 4.60 (m)
10 A) 2.67 (dd, 4.7, 15.0 Hz)
B) 2.61 (dd, 5.7, 14.8 Hz)
A) 2.67 (dd, 4.7, 15.0 Hz)
B) 2.61 (dd, 5.7, 14.8 Hz)
A) 2.67 (dd, 4.7, 15.0 Hz)
B) 2.61 (dd, 5.7, 14.8 Hz)
11 5.26 (dd, 5.3, 8.6 Hz) 5.25 (dd, 5.3, 8.6 Hz) 5.25 (dd, 5.3, 8.6 Hz)
13 5.83 (dd, 6.3, 10.0 Hz) 5.63 (dd, 6.3, 10.0 Hz) 5.73 (dd, 6.3, 10.0 Hz)
15 4.73 (m) 4.77 (m) 4.72 (m)
16 0.70 (3H, d, 6.7 Hz) 0.83 (3H, d, 6.5 Hz) 0.81 (3H, d, 6.7 Hz)
17 2.97 (3H, s) 2.97 (3H, s) 2.98 (3H, s)
18 A) 3.38 (dd, 6.3, 15.5 Hz)
B) 3.23 (dd, 10.4, 15.2 Hz)
A) 3.43 (dd, 6.3, 15.5 Hz)
B) 3.17 (dd, 10.4, 15.2 Hz)
A) 3.33 (dd, 6.3, 15.5 Hz)
B) 3.18 (dd, 10.4, 15.2 Hz)
21 7.23 (d, 8.1 Hz) 7.61 (d, 7.9 Hz) 7.41 (br s)
22 7.12 (td, 1.3, 7.7 Hz) 7.11 (d, 7.7 Hz)
23 7.10 (td, 1.3, 7.7 Hz) 7.18 (d, 7.7 Hz) 7.20 (d, 8.4 Hz)
24 7.54 (br d, 7.8 Hz) 7.35 (d, 8.0 Hz) 7.42 (d, 8.4 Hz)
26 6.87 (br s)
28 6.93 (d, 8.5 Hz) 6.90 (d, 8.3 Hz) 6.98 (d, 8.4 Hz)
29 6.66 (d, 8.5 Hz) 6.69 (d, 8.3 Hz) 6.71 (d, 8.4 Hz)
31 6.66 (d, 8.5 Hz) 6.69 (d, 8.3 Hz) 6.71 (d, 8.4 Hz)
32 6.93 (d, 8.5 Hz) 6.90 (d, 8.3 Hz) 6.98 (d, 8.4 Hz)
33 1.05 (3H, d, 6.3 Hz) 1.06 (3H, d, 6.3 Hz) 1.05 (3H, d, 6.1 Hz)
34 0.80 (3H, d, 6.3 Hz) 1.04 (3H, d, 6.6 Hz) 0.81 (3H, d, 6.7 Hz)
35 1.56 (3H, s) 1.59 (3H, s) 1.57 (3H, s)
36 1.12 (3H, d, 7.0 Hz) 1.15 (3H, d, 6.8 Hz) 1.13 (3H, d, 6.8 Hz)
NH-Tyr 7.63 (d, 8.6 Hz) 7.46 (d, 8.6 Hz) 7.53 (d, 8.6 Hz)
NH-Trp 8.80 (br s) 8.24 (br s) 8.42 (br s)
NH-Ala 6.65 (br s) 6.73 (d, 6.4 Hz) 6.65 (d, 6.5 Hz)

Results
123
3.3.4. 6ß-hydroxy-24-methylcholesta-4,22-dien-3-one (40, known compound)
6ß-hydroxy-24-methylcholesta-4,22-dien-3-one
Synonym(s) 6ß-hydroxy-24-methylcholesta-4,22-dien-3-one
Sample code Jaspis Hex VLC-3,3
Biological source Jaspis splendens
Sample amount 3.0 mg
Physical description White needle crystals
Molecular formula C28H44O2
Molecular weight 412 g/mol
Optical rotation � �20D� -56.0°C (c 0.08, CHCl3)
Retention time (HPLC) 39.27 min (standard gradient)
OH
O
H
H H
1
35 6
11
810
14
17
18
19
20
2122
2324
2526
27
28
0,0 10,0 20,0 30,0 40,0 50,0 60,0-50
250
600 SE090405 #8 Jaspis Hex VLC-3, 3 UV_VIS_1mAU
min
1 - 39,265
2 - 48,134
WVL:240 nm
Peak #1 100%
-10,0200 250 300 350 400 450 500 550 595
%
nm
238.7
202.5
504.0
8E-4-3-3-3 989.1170,0
[M+H]+

Results
124
3.3.5. 6ß-hydroxy-24-methylcholesta-4-en-3-one (41, known compound)
6ß-hydroxy-24-methylcholesta-4-en-3-one
Synonym(s) 6ß-hydroxy-24-methylcholesta-4-en-3-one
Sample code Jaspis Hex VLC-3,6
Biological source Jaspis splendens
Sample amount 3.0 mg
Physical description White needle crystals
Molecular formula C28H46O2
Molecular weight 414 g/mol
Optical rotation � �20D� -52.0°C (c 0.08, CHCl3)
Retention time (HPLC) 40.25 min (standard gradient)
OH
O
H
H H
1
35 6
11
810
14
17
18
19
20
2122
2324
2526
27
28
0,0 10,0 20,0 30,0 40,0 50,0 60,0-50
250
600 SE090405 #11 Jaspis Hex VLC-3, 6 UV_VIS_1mAU
min
1 - 40,248
WVL:240 nm
Peak #1 100%
-10,0200 250 300 350 400 450 500 550 595
%
nm
237.4
474.6 505.2
8E-7-5-4-1 990.7170,0
[M+H]+

Results
125
3.3.6. 6ß-hydroxy-24-ethylcholesta-4-en-3-one (42, known compound)
6ß-hydroxy-24-ethylcholesta-4-en-3-one
Synonym(s) 6ß-hydroxy-24-ethylcholesta-4-en-3-one
Sample code Jaspis Hex VLC-3,7
Biological source Jaspis splendens
Sample amount 3.0 mg
Physical description White needle crystals
Molecular formula C29H48O2
Molecular weight 428 g/mol
Optical rotation � �20D� -65.0°C (c 0.08, CHCl3)
Retention time (HPLC) 40.70 min (standard gradient)
OH
O
H
H H
1
35 6
11
810
14
17
18
19
20
2122
2324
2526
27
2829
0,0 10,0 20,0 30,0 40,0 50,0 60,0-100
250
600 SE090405 #12 Jaspis Hex VLC-3, 7 UV_VIS_1mAU
min
1 - 40,702
2 - 48,127
WVL:240 nm
Peak #1
-10,0200 250 300 350 400 450 500 550 595
%
nm
237.5
474.1 510.6
8E-7-5-4-1 986.15100%70,0
[M+H]+

Results
126
Compounds (40–42) were isolated as white solid crystals. Their EI mass spectrum
exhibited pseudomolecular ion peaks at m/z 412 [M]+, m/z 414 [M]+ and m/z 428 [M]+,
respectively. They revealed �max at 238.7, 237.4 and 237.5 nm in UV absorption,
respectively. Both notions highlighted being structurally related in addition to being
isolated from the same hexane soluble fraction of the methanolic extract of J. splendens.
Structural elucidation of compounds (40–42) was done based on 1D and 2D NMR spectral
analyses data (Table 3.21) including 1H, 13C NMR, HMBC and HMQC and compared to
reported literature (Kontiza et al., 2006; Georges et al., 2006).
Table 3.21. NMR data of compounds (40–42), measured in CDCl3, 500 MHz.
# 40 41 42
�H (J Hz) �C �H mult. (J Hz) �C mult. �H mult. (J Hz) �C mult.
1a 1.70 (m) 35.5 1.77 (m) 37.2, CH2 1.82 (m) 37.2, CH2 1b 2.01 (m) 2.02 (m) 2.03 (m) 2a 2.53 (m) 34.0 2.53 (m) 34.3, CH2 2.53 (m) 34.3, CH2 2b 2.37 (m) 2.36 (m) 2.37 (m) 3 n.d. 200.0, C 200.4, C 4 5.82 (s) 126.5 5.82 (s) 126.4, CH 5.82 (s) 126.4, CH 5 168.0 169.0, C 168.4, C 6 4.35 (t, 2.5 Hz) 73.3 4.35 (t, 2.8 Hz) 74.4, CH 4.35 (t, 2.5 Hz) 73.4, CH 7 1.98 (m)
1.24 (m) 38.5 1.99 (m)
1.22 (m) 39.1, CH2 2.00 (m)
1.21 (m) 39.4, CH2
8 1.55 (m) 30.0 1.54 (m) 30.6, CH 1.53 (m) 29.8, CH 9 0.90 (m) 53.3 0.90 (m) 53.7, CH 0.90 (m) 53.7, CH
10 38.0 39.0, C 39.2, C 11 1.10–1.60 (m) 21.1 1.10–1.60 (m) 21.0, CH2 1.10–1.60 (m) 21.0, CH2 12 1.97 (m)
1.21 (m) 39.5 1.99 (m)
1.20 (m) 39.6, CH2 2.00 (m)
1.21 (m) 39.7, CH2
13 42.5 42.6, C 42.6, C 14 1.10–1.60 (m) 54.0 1.10–1.60 (m) 56.0, CH 1.10–1.60 (m) 56.1, CH 15 1.10–1.60 (m) 24.8 1.10–1.60 (m) 24.2, CH2 1.10–1.60 (m) 24.2, CH2 16 1.60–2.00 (m) 29.5 1.60–2.00 (m) 28.2, CH2 1.60–2.00 (m) 28.2, CH2 17 1.00 (m) n.d. 1.00 (m) 55.9, CH 1.12 (m) 55.9, CH 18 0.75 (s) 12.4 0.74 (s) 12.1, CH3 0.74 (s) 12.1, CH3 19 1.38 (s) 19.6 1.37 (s) 20.2, CH3 1.38 (s) 19.0, CH3 20 2.04 (m) 39.5 1.36 (m) 35.9, CH 1.34 (m) 35.6, CH 21 1.00 (d, 6.6 Hz) 21.1, CH3 0.91 (d, 6.6 Hz) 19.6, CH3 0.92 (d, 6.6 Hz) 19.6, CH3 22 5.20
(dd, 7.0, 15.0 Hz) n.d. 1.10–1.60 (m) 34.3, CH2 1.10–1.60 (m) 34.3, CH2
23 5.14 (dd, 7.0, 15.0 Hz)
n.d. 1.10–1.60 (m) 31.0, CH2 1.10–1.60 (m) 24.2, CH2
24 1.50 (m) 53.0 1.20 (m) 40.6, CH 0.94 (m) 42.6, CH 25 1.65 (m) 31.9 1.68 (m) 32.8, CH 1.62 (m) 29.8, CH 26 0.83 (d, 7.0 Hz) 19.6 0.77 (d, 7.0 Hz) 20.5, CH3 0.81 (d, 7.0 Hz) 20.9, CH3 27 0.84 (d, 7.0 Hz) 19.0 0.78 (d, 7.0 Hz) 19.6, CH3 0.82 (d, 7.0 Hz) 19.6, CH3 28 0.91 (d, 7.0 Hz) 20.5 0.86 (d, 7.0 Hz) 15.4, CH3 1.10–1.60 (m) 21.0, CH2 29 0.87 (t, 7.0 Hz) 12.4, CH3
n.d. not determined.

Results
127
3.3.7. Maculosin-1, cyclo-(L-Pro-L-Tyr) (43, known compound)
Maculosin-1, cyclo-(L-Pro-L-Tyr)
Synonym(s) cyclo-(L-Pro-L-Tyr)
Sample code Jaspis EtOAc E,G
Biological source Jaspis splendens
Sample amount 0.8 mg
Physical description White amorphous solid
Molecular formula C14H16N2O3
Molecular weight 260 g/mol
Optical rotation � �20D� +88.0°C (c 0.02, Ethanol)
Retention time (HPLC) 12.48 min (standard gradient)
N
NH
O
O
OH
H
H
12
4
7
9
101'
4'
0,0 10,0 20,0 30,0 40,0 50,0 60,0-40
120 SE081117 #8 Jaspis EtOAc E, G UV_VIS_1mAU
min
1 - 12,482WVL:235 nm
Peak #1 100%
200 250 300 350 400 450 500 550 595
%
nm
227.9
276.7
296.4
No spectra library hits found!70,0
-10,0
[M+H]+ [2M+H]+
[M-H]- [2M-H]-

Results
128
3.3.8. Sangivamycin (44, known compound)
Sangivamycin
Synonym(s) Sangivamycic acid; amide
Sample code Jaspis EtOAc J-L,F
Biological source Jaspis splendens
Sample amount 1.0 mg
Physical description White amorphous solid
Molecular formula C12H15N5O5
Molecular weight 309 g/mol
Optical rotation � �20D� -28.0°C (c 0.02, CH3OH)
Retention time (HPLC) 6.65 min (standard gradient)
N
N
N
NH2 NH2
O
HO
HO
O
1'2'
3' 4'
5'
1
2
345
7 9
10
1112
HO
0,0 10,0 20,0 30,0 40,0 50,0 60,0-100
200
400
600
900 SE090406 #3 Jaspis EtOAc E, D UV_VIS_3mAU
min
1 - 6,651WVL:280 nm
Peak #1 100%
200 250 300 350 400 450 500 550 595
%
nm
267.1212.2
556.4
2 deoxythymidine 996.7970,0
-10,0
[M+H]+
[M-H]-

Results
129
Compound (43) was obtained as a white amorphous solid. Its ESI mass spectrum
exhibited pseudomolecular ion peaks at m/z 261.1 [M+H]+ and m/z 259.0 [M-H]-. It
showed �max at 228 and 276.7 nm in UV absorption. Structural elucidation of compound
(43) was done based on 1D and 2D NMR spectral analyses data (Table 3.22) including 1H, 13C NMR, HMBC, HMQC and NOESY spectra (Fig. 3.22) together with comparison to
reported literature (Rudi et al., 1994). From these data, compound (43) was concluded to
be maculosin-1, cyclo-(L-Pro-L-Tyr).
Compound (44) was isolated as a white amorphous solid. Its ESI mass spectrum
revelaed pseudomolecular ion peaks at m/z 310 [M+H]+ and m/z 308 [M-H]-. Structural
elucidation was performed by means of 1D and 2D NMR spectroscopy particularly 1H, 13C
NMR, HMBC and ROESY spectra (Table 3.22) (Fig. 3.23) in addition to comparison with
reported literature (Zabriskie and Ireland, 1989).
Both compounds (43) and (44) were firstly reported as secondary metabolites from
Jaspis digonoxea and J. Johnstoni, respectively. Later, they were obtained from
microorganisms associated with the sponge. Hence, they were proven to be in fact a
microbial secondary metabolites, produced by symbiont microorganisms associated with
the marine sponge of the genus Jaspis (Jayatilake et al., 1996; Fdhila et al., 2003).
N
NH
O
O
OH
H
H
12
4
7
910
1'4'
H
H
H
H
Fig. 3.22. 1H–1H COSY, HMBC and NOESY spectra of maculosin-1 (43).

Results
130
N
N
N
NH2 NH2
O
HO
HO
O
1'
2'
3' 4'
5'
1
2
345
7 9
1011
12
H
H
HO
Fig. 3.23. 1H–1H COSY, HMBC and HMQC spectra of sangivamycin (44).
Table 3.22. NMR data of compounds (43 and 44), measured in CDCl3, 500 MHz.
# 43
#44
�H mult. (J Hz) �C mult. �H mult. (J Hz) �C mult. 1 165.16, C 2 8.11 (1H, s) 125.6, CH
3 H-3a: 3.59 (1H, m) H-3b: 3.57 (1H, m) 45.44, CH2
3 111.0, C
4 1.93 (2H, m) 22.47, CH2 4 101.1, C
5 H-5a: 2.32 (1H, m) H-5b: 2.01 (1H, m) 28.33, CH2 5 158.1, C
6 4.09 (1H, t, 9.0 Hz) 59.13, CH 7 8.06 (1H, s) 152.8, CH
7 169.70, C 9 150.8, C
8 5.91 (1H, br s, NH) 10 166.3, C
9 4.22 (1H, dd, 3.3, 11.9 Hz) 56.25, CH 1‘ 6.01 (1H, d, 6.0 Hz) 87.2, CH
10 H-10a: 3.47 (1H, dd, 3.9, 14.6 Hz) H-10b: 2.77 (1H, dd, 10.1, 14.5 Hz) 35.92, CH2
2‘ 4.34 (1H, q, 5.8 Hz) 70.5, CH
1‘ 127.02, C 3‘ 4.08 (1H, q, 5.0 Hz) 73.8, CH
2‘ 7.05 (1H, d, 8.4 Hz) 130.31, CH 4‘ 3.90 (1H, q, 4.0 Hz) 85.3, CH
3‘ 6.78 (1H, d, 8.4 Hz) 116.15, CH 5‘ 3.60 (1H, m) 3.53 (1H, m)
61.9, CH2
4‘ 155.54, C NH2-11 7.91 and 7.40 (1H, br s)
5‘ 6.78 (1H, d, 8.4 Hz) 116.15, CH OH-2' 5.43 (1H, d, 6.3 Hz)
6‘ 7.05 (1H, d, 8.4 Hz) 130.31, CH OH-3' 5.20 (1H, d, 5.0 Hz)
OH-5' 5.15 (1H, d, 5.8 Hz)

Results
131
3.3.9. Biological activity of compounds isolated from Jaspis splendens collected in Kalimantan (Indonesia)
To the best of our knowledge, fifteen jaspamide congeners (B–P) were hitherto isolated
from the genus Jaspis and all of them show antiproliferative activity with IC50 values
ranging from 0.01 to 33 μM against human breast adenocarinoma (MCF-7), and colon
carcinoma (H-29) cell lines (Gala et al., 2009).
Since jaspamide Q (38) and R (39) together with the parent jaspamide (37) differ in
the bromination pattern of the abrine (N-methyltryptophan) moiety. Since these
modifications were claimed as essential for the observed biological activity (Kahn et al.,
1991), compounds (38 and 39) together with other compounds isolated from J. splendens
collected in Kalimantan (Indonesia) were subjected to a cytotoxicity (MTT) assay against
mouse lymphoma (L5178Y) cell lines. They exhibited potent activities with IC50 values
between <0.1 and 10 μg/mL (Table 3.23), compared to kahalalide F (IC50 = 6.3 μg/mL, 4.3
μM) which was used as a positive control.
Table 3.23. Cytotoxicity assay of J. splendens extract, fractions and isolated compounds.
Sample tested (L5178Y) growth in
%(@ 10 μg/mL)
IC50
(μg/mL) (μM)
J. splendens methanolic Extract 0.0
Hexane Soluble Fraction 0.6
Ethyl Acetate Soluble Fraction 0.0
Jaspamide (37) 0.0 <0.1 <0.14
Jaspamide Q (38) 0.3 <0.1 <0.16
Jaspamide R (39) 0.0 <0.1 <0.13
6ß-hydroxy-24-methylcholesta-4,22-dien-3-one (40) 34.5 10 24.3
6ß-hydroxy-24-methylcholesta-4-en-3-one (41) 14.4 9.3 22.5
6ß-hydroxy-24-ethylcholesta-4-en-3-one (42) 0.4 2.9 6.8
Maculosin-1 (43) 0.0 0.28 1.1
Sangivamycin (44) 0.0 <0.1 <0.34
Kahalalide F (positive control) 6.3 4.3

Results
132
3.4. Secondary metabolites isolated from Thalassia testudinum The seagrass Thalassia testudinum (turtle grass, family Hydrocharitaceae) is an important
component of nearshore marine ecosystems, providing nursery grounds for commercially
relevant fish and invertebrate species. Seagrasses are rich resources of secondary
metabolites, particularly phenolic compounds (McMillan et al., 1980) that include sulfated
flavonoids, a group of conjugated metabolites for which the sulfate component is believed
to represent a marine adaptation (Harborne et al., 1976).
In this part, a detailed chemical investigation of the methanolic extract of T.
testudinum, collected by snorkeling at 2 m depth off Muk Island, Trang Province, Thailand
in July, 2007, was performed and lead to the isolation of two sulfated flavonoid glycosides,
thalassiolin A (45) and thalassiolin C (46), both were previously reported from the same
species.
Interestingly, luteolin-3’-O-glucuronide (47) was also isolated and to the best of our
knowledge, it is the first report for this compound from marine habitat, however it was
reported from Sage (Salvia officinalis), a popular herb from the mint family (Labiatae)
which has been the subject of several studies as a resource of some potent antioxidants (Lu
and Foo, 2000). Additionally, all the isolated flavonoids glycosides were tested for radical
scavenging (DPPH) activity using quercetin and kaempferol as standards, and the results
would be reported.

Results
133
3.4.1. Thalassiolin A (45, known compound)
Thalassiolin A
Synonym(s) 2''-Sulfoglucoluteolin
Sample code TT-Bu-RP2-A
Biological source Thalassia testudinum
Sample amount 1.0 mg
Physical description Pale yellow amorphous solid
Molecular formula C21H19O14S-
Molecular weight 528 g/mol
Retention time (HPLC) 14.07 min (half-time gradient)
H
OOH
O O
OH
OH
36
8
2'
5'
6'
O
OSO3-HO
HO
HO
1''
6''
2"
0,0 5,0 10,0 15,0 20,0 25,0 30,0-50
100
200
350 SE070612 #2 TT-Bu-RP2-A UV_VIS_4mAU
min
1 - 1
4,07
3 2 - 1
4,64
8
WVL:340 nm
Peak #2 100%
200 250 300 350 400 450 500 550 595
%
nm
208.6
349.9 255.0
Luteolin 998.5370,0
-10,0
[M+H]+
[M-H]-

Results
134
3.4.2. Thalassiolin C (46, known compound)
Thalassiolin C
Synonym(s) 2''-Sulfoglucoapigenin
Sample code TT-Bu-RP2-B
Biological source Thalassia testudinum
Sample amount 2.0 mg
Physical description Pale yellow amorphous solid
Molecular formula C21H19O13S-
Molecular weight 512 g/mol
Retention time (HPLC) 14.46 min (half-time gradient)
H
OOH
O O
OH
36
8
2'
5'6'
O
OSO3-HO
HO
HO
1''
6''
2"
3'
0,0 5,0 10,0 15,0 20,0 25,0 30,0-100
250
500
750
1.000
1.400 SE070612 #3 TT-Bu-RP2-B UV_VIS_4mAU
min
1 - 1
4,46
1
2 - 1
7,75
1
WVL:340 nm
Peak #1 100%
-10,0200 250 300 350 400 450 500 550 595
%
nm
208.7 337.3 267.1
Rhoifolin 999.4070,0
[M+H]+
[M-H]-

Results
135
Compounds (45 and 46) were obtained as pale yellow powder. They revealed, in their
ESI mass spectra, pseudomolecular ion peaks at m/z 529 [M+H]+ and at m/z 513 [M+H]+,
respectively. The observed difference of 16 amu in molecular weight was expected to be
due to the presence of an additional oxygen atom in 45 more than 46.
Based on comparison of NMR spectral data of compounds (45 and 46) (Table 3.24) to
the reported literature (Jensen et al., 1998; Rowley et al., 2002), they were identified as
thalassiolin A (luteolin 7-�-D-glucopyranosyl-2”-sulfate) and C (apigenin 7-�-D-
glucopyranosyl-2”-sulfate), respectively.
Table 3.24. 1H NMR data of compounds (45 and 46), measured in DMSO-d6, 500 MHz.
# 45 46
�H mult. (J Hz) �H mult. (J Hz)
3 6.75 (1H, s) 6.85 (1H, s)
6 6.37 (1H, d, 1.9 Hz) 6.39 (1H, d, 1.6 Hz)
8 6.87 (1H, s) 6.89 (1H, s)
2’ 7.56 (1H, s) 8.00 (1H, d, 8.5 Hz)
3’
6.90 (1H, d, 8.5 Hz)
5’ 6.90 (1H, d, 8.2 Hz) 6.90 (1H, d, 8.5 Hz)
6’ 7.47 (1H, dd, 8.2, 2.2 Hz) 8.00 (1H, d, 8.5 Hz)
1’’ 5.00 (1H, d, 7.3 Hz) 5.00 (1H, d, 7.3 Hz)
2’’ 4.10 (1H, d, 10.7 Hz) 4.10 (1H, d, 11.0 Hz)
3’’ 3.60 (1H, dd, 8.5, 7.3 Hz) 3.60 (1H, dd, 8.5, 6.6 Hz)
4’’ 3.10 (1H, m) 3.10 (1H, m)
5’’ 3.40–3.50 (1H, m) 3.40–3.50 (1H, m)
6’’ 3.73 (1H, m)
3.40–3.50 (1H, m) 3.70 (1H, dd, 11.0, 6.9, 6.6 Hz)
3.40–3.50 (1H, m)
5-OH 12.92 (1H, br s) 12.95 (1H, br s)
3’-OH 9.28 (1H, br s)
4’-OH 9.86 (1H, br s) 10.4 (1H, br s)

Results
136
3.4.3. Luteolin-3’-O-glucuronide (47, known compound)
Luteolin-3’-O-glucuronide
Synonym(s) Luteolin-3’-O-glucuronide
Sample code TT-Bu-RP2-C
Biological source Thalassia testudinum
Sample amount 10.0 mg
Physical description Pale yellow amorphous solid
Molecular formula C21H18O12
Molecular weight 462 g/mol
Retention time (HPLC) 17.71 min (half-time gradient)
O
OOH
HOO
OH O
HO OHOH
H36
81'
2'
5'6'
1''
6"
OH
O
0,0 5,0 10,0 15,0 20,0 25,0 30,0-100
200
400
600
800
1.000
1.200 SE070612 #4 TT-Bu-RP2-C UV_VIS_4mAU
min
1 - 1
7,71
1
WVL:340 nm
Peak #1 100%
200 250 300 350 400 450 500 550 595
%
nm
211.8
341.3268.4
Luteolin-4`-glucose 988.20
[M+H]+
[M-H]-
-10,0
70,0

Results
137
Compound (47) was isolated as pale yellow powder. It revealed, in its ESI mass
spectra, pseudomolecular ion peaks at m/z 463 [M+H]+ and at m/z 461 [M-H]-. Structural
elucidation of 47 was concluded based on 1D and 2D NMR spectral analyses including 1H, 13C NMR, COSY and HMBC spectra (Fig. 3.24).
Based on comparison of NMR spectral data of compound (47) (Table 3.25) to the
reported literature (Lu and Foo, 2000), it was identified as luteolin-3’-O-glucuronide that
was firstly reported from Salvia officinalis and in this study it was the first report from
Thalassia testudinum.
O
OOH
HOO
OH O
HO OHOH
H36
81'
2'
5'6'
1''
6"
OH
OH
H
Fig. 3.24. 1H–1H COSY and HMBC spectra of Luteolin-3’-O-glucuronide (47).

Results
138
Table 3.25. NMR data of luteolin-3’-O-glucuronide (47), measured in DMSO-d6.
47
# �H mult. (J Hz) �C mult. # �H mult. (J Hz) �C mult.
2 164.3, C 4’ 151.0, C
3 6.76, (1H, s) 103.2, CH 5’ 6.90, (1H, d, 8.5 Hz) 116.6, CH
4 181.7, C 6’ 7.60, (1H, dd, 8.5, 2.0 Hz) 121.9, CH
5 161.4, C 1” 4.86, (1H, d, 6.5 Hz) 101.2, CH
6 6.16, (1H, d, 1.6 Hz) 98.9, CH 2” 3.17–3.45 (1H, m) 73.0, CH
7 163.3, C 3” 75.6, CH
8 6.50, (1H, d, 1.6 Hz) 94.1, CH 4” 71.7, CH
9 157.3, C 5” 3.55, (1H, d, 9.1 Hz) 74.9, CH
10 103.6, C 6” 170.9, C
1’ 121.5, C
2’ 7.80, (1H, d, 2.0 Hz) 114.4, CH
3’ 145.3, C

Results
139
3.4.4. Biological activity of compounds isolated from Thalassia testudinum Compounds (45–47) isolated from T. testudiunm were identified as flavonoid glycodises
namely, thalassiolin A, thalassiolin C, and luteolin-3’-O-glucuronide, respectively.
Thalassiolin A (45) was reported in literature as an in vitro inhibitor of HIV cDNA
integrase (IC50 = 0.4 μM) and antiviral against HIV with IC50 value of 30 μM (Rowely et
al., 2002) compared to thalassiolin C (46) that exhibited moderate to low activity.
However, none of them exhibited cellular toxicity against human colon cancer HCT-116
cells at concentration up to 75 μM (Rowely et al., 2002).
Based on these reports, compounds (45–47) were subjected to cytotoxicity (MTT)
assay against mouse lymphoma (L5178Y) cells, protein kinase inhibitory activity against
24 different enzymes, only thalassiolin A (45) revealed inhibitory activities (Table 3.26)
against some protein kinases which proved interesting for further investigation.
In addition compounds (45–47) were tested for their radical scavenging activities
using antioxidant (DPPH) assay using quercetin and kaempferol as standards. Outcomes of
this assay revealed that thalassiolin A (45) and luteolin-3’-O-glucuronide (47) possess
radical scavenging activity with IC50 values of 48 μM for both compared to quercetin (IC50
= 6.0 μM) and kaempferol (IC50 = 23 μM).
Table 3.26. Protein kinase inhibitory activity of thalassiolin A (45).
IC50 (μg/mL)
AK
T1
AR
K5
Aur
ora-
A
Aur
ora-
B
AX
L
B-R
AF-
VE
CD
K2/
Cyc
A
CD
K4/
Cyc
D1
CK
2-al
pha1
CO
T
CO
T
EG
F-R
>10 >10 2.1 1.5 >10 >10 >10 >10 >10 >10 4.3 >10
IC50 (μg/mL)
EPH
B4
ER
BB
2
FAK
IGF1
-R
INS-
R
ME
T
PDG
FR-b
eta
PLK
1
PRK
1
SAK
SRC
VE
GF-
R2
>10 >10 >10 >10 >10 9.0 0.63 >10 >10 3.9 >10 9.1

Results
140
3.5. Secondary metabolites isolated from Comanthus sp.“Of all the animals in the sea there are none that exceeds in beauty of colouration the
shallow water criniods. Flowerlike in form and almost flowerlike in the fixity of their
habit, they are also flowerlike in the variety and distribution of their pigments.” This
comment was written by Clark, A.H. in 1921 in his “Monograph of the Existing
Echinoderms” (Sutherland and Wells, 1967). The echinoderms constitute a class of the
phylum Echinodermata whose animals’ pigments have attracted the interests for chemical
studies, particularly in the early stage of the development of marine natural product
chemistry. As a result, a number of polyketide pigments, naphthoquinones,
anthraquinones, and naphthopyrones, have been isolated from various species of
echinoderms (Sakuma et al., 1987). Naphthoquinones have been obtained from four of the
five classes of the phylum, while the occurance of anthraquinones and naphthpyrones has
so far been confined to a single class, the echinoderms (sea lilies) (Kent et al., 1970; Smith
and Sutherland, 1971; Francesconi, 1980). Some of these echinoderm pigments have been
reported to play an ecological role, for example as feed deterrent (Rideout et al., 1979).
Echinoderms, in contrast to the familiar starfishes and sea urchins, are perhaps the little
known and have been described from a restricted geographical area, the Indo-Pacific
including the coast of Thailand (Barnes, 1987).
Bioactivity-guided fractionation strategy of Comanthus sp. extract was performed
leading to the isolation of sixteen compounds; five of them were anthraquinones (48–52),
five were naphthopyrones (53–57), one nucleoside, 2’-deoxythymidine (58), and five were
steroidal secondary metabolites (59–63). Herein, we would comprehensively report
isolation, structural elucidation based on the analysis of spectroscopic and spectrometric
data in addition to comparison with the related literature, absolute stereochemistry of 50
and 52 would be reported here for the first time using Mosher reaction which revealed that
both of them are (S)-(-) isomers.
All the isolated compounds were subjected qualitatively and quantitatively to radical
scavenging (DPPH) assay, cytotoxic (MTT) assay against L5178Y mouse lymphoma cell
line, protein kinase in vitro inhibitory activity assay against 24 different protein kinases,
antimicrobial, antifungal and antiviral activities.

Results
141
3.5.1. 1’-Deoxyrhodoptilometrene (48, new natural product)
1’-Deoxyrhodoptilometrene
Synonym(s) 1,6,8-Trihydroxy-3-trans-(prop-1-enyl)anthraquinone
Sample code VLC-2,F 3
Biological source Comanthus sp.
Sample amount 8.0 mg
Physical description Brick red powder
Molecular formula C17H12O5
Molecular weight 296 g/mol
Retention time (HPLC) 35.82 min (standard gradient)
O
O
OH OH
OH
12
3
44a
5
6
78
8a9
9a
1010a
1'
2'
3'
0,0 10,0 20,0 30,0 40,0 50,0 60,0-50
125
300 SE090401 #4 VLC-2,F 3 UV_VIS_1mAU
min
1 - 35,820
2 - 48,092
WVL:240 nm
Peak #1 100%
-10,0
70,0
200 250 300 350 400 450 500 550 595
%
nm
232.7 287.4 210.7
No spectra library hits found!
[M+H]+
[M+Na]+

Results
142
Compound (48) was isolated as a red powder. Its ESIMS spectrum gave a molecular
ion peak at 295.3 [M-H]-. 13C NMR (Table 3.27) revealed the presence of seventeen
carbon atoms, and together with DEPT experiment they were found to be one methyl, six
methine, and ten quaternary carbons. This suggested the probable existence of five oxygen
atoms to give a molecular formula C17H12O5 which was confirmed by HRFTMS (ion peak
at m/z 297.0761 [M+H]+, � +1.0 ppm from calcd for C17H13O5, and m/z 319.0581
[M+Na]+, � +1.0 ppm from calcd for C17H12O5Na). 1H NMR (Table 3.27) exhibited the
presence of four doublet aromatic protons at [�H 6.50 (d, 2.20 Hz)], [�H 7.07 (d, 2.20 Hz)],
[�H 7.28 (d, 1.25 Hz)], and [�H 7.64 (d, 1.25 Hz)] which were assigned to be H-7, H-5, H-2,
and H-4, respectively. This assignment was evidenced by 1H�1H COSY (Fig. 3.25) that
revealed clear correlations between H-5/H-7; and H-2/H-4. Moreover, H-2 and H-4 were
correlated together with the two olefinic protons at [�H 6.52 (dd, 14.00, 1.00 Hz)], and [�H
6.65 (m)] which were ascribed to be H-1’and H-2’, respectively. The latter olefinic proton,
H-2’, revealed a clear correlation to methyl group at [�H 1.90 (dd, 6.70, 1.00 Hz)]. Based
on the coupling constant (J value) of H-1’, the 1-propenyl side chain confirmed to have a
trans configuration.
According to the previous data, and to the reported literature, compound (48) was
proposed to be 1,6,8-trihydroxy-3-trans-(prop-1-enyl) anthraquinone which was obtained
only as a synthetic product in 1976 by Banville and Brassard. Further confirmation of the
proposed structure was provided by HMBC spectrum (Fig. 3.25) spectrum that exhibited
correlations between the following: C-10 to H-4, and H-5; C-9a to H-2, and H-4; C-8a to
H-5, and H-7; and C-1’ to H-2, H-4, and H3-3’. These findings unambiguously established
the chemical structure of 48 to be 1,6,8-trihydroxy-3-trans-(prop-1-enyl) anthraquinone
which was given the trivial name 1’-deoxyrhodoptilometrene.

Results
143
OHO
O
OH
OH
87
65
10a4
3
21
9a 9 8a
104a
1'
2'
3'
H
H
H
H
Fig. 3.25. 1H–1H COSY and HMBC spectra of 1’-deoxyrhodoptilometrene (48).

Results
144
3.5.2. 1’-Deoxyrhodoptilometrin (49, known compound)
1’-Deoxyrhodoptilometrin
Synonym(s) 1,6,8-trihydroxy-3-propyl-9,10-anthraquinone
Sample code VLC-1,A
Biological source Comanthus sp.
Sample amount 10.0 mg
Physical description Red powder
Molecular formula C17H14O5
Molecular weight 298 g/mol
Retention time (HPLC) 35.79 min (standard gradient)
O
O
OH OH
OH
12
3
44a
5
6
78
8a9
9a
1010a
1'2'
3'
0,0 10,0 20,0 30,0 40,0 50,0 60,0-50
0
50
100
150
200 SE070808 #2 VLC-1, A UV_VIS_2mAU
min
1 - 35,787WVL:254 nm
Peak #1
-10,0
70,0
200 250 300 350 400 450 500 550 595
%
nm
223.3
288.3 266.4
Emodin 961.38
[M-H]-
100%
[M-H]-

Results
145
Compound (49) was obtained as a red powder. 13C NMR and DEPT (Table 3.27)
revealed the presence of seventeen carbon atoms divided into one methyl, two methylene,
four methine, and ten quaternary carbons. In ESIMS spectrum, it showed a molecular ion
peak at 297.4 [M-H]- indicating the probable existence of five oxygen atoms, and
suggesting a molecular formula of C17H14O5. This suggestion was confirmed by HRESIMS
(ion peak at m/z 299.0914 [M+H]+, � +1.0 ppm from calc for C17H15O5). Based on the
reported literature, 48 was identified as 1,6,8-trihydroxy-3-propyl-9,10-anthraquinone
which was first isolated in 1967 by Powell and Sutherland and no 13C NMR data have been
reported. 1H NMR (Table 3.27) showed the presence of four aromatic protons at [�H 6.45
(d, 2.20 Hz)], [�H 7.09 (d, 2.20 Hz)], [�H 7.50 (d, 1.25 Hz)], and [�H 7.02 (d, 1.25 Hz)]. The
first two were proven to be correlated by 1H�1H COSY (Fig. 3.26). The other two protons
were correlated together with two methylene groups at [�H 2.64 (2H, t, 7.85 Hz)] and [�H
1.68 (2H, m)] and one methyl group at [�H 0.98 (3H, t, 7.25 Hz)] forming an extended spin
system.
Analysis of HMBC spectrum of 49 (Fig. 3.26) revealed the presence of long range
couplings between the following: C-9 to H-2, H-4, H-5, and H-7; C-10 to H-4, and H-5;
and C-3 to H-2, H-4, and 2H-1’. These couplings established the chemical structure of 49
to be 1,6,8-trihydroxy-3-propyl-9,10-anthraquinone which was given the trivial name 1’-
deoxyrhodoptilometrin.

Results
146
OHO
O
OH
OH
87
65
10a4
3
21
9a 9 8a
104a
1'
2'
3'
H
H
H
H
Fig. 3.26. 1H–1H COSY and HMBC spectra of 1’-deoxyrhodoptilometrin (49).

Results
147
Table 3.27. NMR data of compounds (48 and 49).
# 48a) 49b)
�Hc) mult. (J Hz) �C
d) mult. �Hc) mult. (J Hz) �C
d) mult.
1 161.7, C 163.5, C
2 7.28 (1H, d, 1.25 Hz) 119.9, CH 7.02 (1H, d, 1.25 Hz) 124.6, CH
3 145.4, C 153.7, C
4 7.64 (1H, d, 1.25 Hz) 116.7, CH 7.50 (1H, d, 1.25 Hz) 120.9, CH
4a 133.4, C 134.7, C
5 7.07 (1H, d, 2.20 Hz) 109.7, CH 7.09 (1H, d, 2.20 Hz) 111.5, CH
6 166.7, C 169.8, C
7 6.50 (1H, d, 2.20 Hz) 107.9, CH 6.45 (1H, d, 2.20 Hz) 109.3, CH
8 164.6, C 166.8, C
8a 108.4, C 109.6, C
9 188.6, C 191.0, C
9a 114.2, C 115.2, C
10 181.6, C 183.6, C
10a 135.0, C 136.7, C
1’ 6.52 (1H, dd, 14.00, 1.00 Hz) 129.4, CH 2.64 (2H, t, 7.85 Hz) 39.1, CH2
2’ 6.65 (1H, m) 132.2, CH 1.68 (2H, m) 24.8, CH2
3’ 1.90 (3H, dd, 6.70, 1.00 Hz) 18.6, CH3 0.98 (3H, t, 7.25 Hz) 14.0, CH3
1-OH 12.00 (1H, br s) 12.00 (1H, s)
6-OH 12.00 (1H, br s) 12.04 (1H, s)
8-OH 11.33 (1H, br s) 11.36 (1H, br s) a)Measured in DMSO-d6, b)Measured in MeOH-d4, c)Measured at 500 MHz, d) at 125 MHz.

Results
148
3.5.3. (S)-(-) Rhodoptilometrin (50, known compound)
(S)-(-) Rhodoptilometrin
Synonym(s) 1,6,8-trihydroxy-3-((S)-1’-hydroxypropyl)anthracene-9,10-
dione
Sample code VLC-4, IV
Biological source Comanthus sp.
Sample amount 21.0 mg
Physical description Red crystals
Molecular formula C17H14O6
Molecular weight 314 g/mol
Optical rotation � �20D� -8.2°C (c 0.2, CH3OH)
Retention time (HPLC) 30.52 min (standard gradient)
O
O
OH OH
OH
12
3
44a
5
6
78
8a9
9a
1010a
1'2'
3'
OH
0,0 10,0 20,0 30,0 40,0 50,0 60,0-100
200
400
600
800 SE070921 #5 VLC-4, IV UV_VIS_2mAU
min
1 - 30,516WVL:254 nm
Peak #2 100%
-10,0
70,0
200 250 300 350 400 450 500 550 595
%
nm
224.4288.5266.4
No spectra library hits found![M-H]-
[M+H]+

Results
149
Compound (50) was obtained as a red powder. The UV absorption spectrum proved to
be closely similar to that of 49 [�max 224, 266, 288, and 440 nm] which implied a similar
chromophore in common. ESIMS of 50 exhibited a pseudomolecular ion peak at 315
[M+H]+, and 313 [M-H]- revealing an additional 16 amu compared to 1’-
dexoyrhodoptilometrin (49). This difference was expected to be due to an introduced
oxygen atom, and explained by the differences in 1H NMR and DEPT (Table 3.28)
revealed the presence of seventeen carbon atoms divided into one methyl, one methylene,
five methine, and ten quaternary carbons. 1H NMR (Table 3.28) showed the presence of
four aromatic protons at [�H 6.22 (d, 2.20 Hz)], [�H 6.79 (d, 2.20 Hz)], [�H 7.44 (d, 1.25
Hz)], and [�H 7.05 (d, 1.25 Hz)]. The first two were proven to be correlated by 1H�1H
COSY spectrum (Fig. 3.27). The other two protons were correlated together with one
methine at [�H 4.53 (t, 7.60 Hz)], one methylene [�H 1.74 (2H, m)] and one methyl groups
at [�H 0.98 (3H, t, 7.50 Hz)] forming an extended spin system.
Analysis of HMBC spectrum of 50 (Fig. 3.27) revealed the presence of long range
couplings between the following: C-9 to H-2, H-4, H-5, and H-7; C-10 to H-4, and H-5;
and C-3 to H-2, H-4, and H-1’. Accordingly these couplings established the chemical
structure of 50 to be 1,6,8-trihydroxy-3-(1’-hydroxypropyl)-9,10-anthraquinone which was
given the trivial name rhodoptilometrin (Powell and Sutherland, 1967; Bartolini et al.,
1973; Lee and Kim, 1995).

Results
150
OHO
O
OH
OH
87
65
10a4
3
21
9a 9 8a
104a
1'
2'
3'
H
H
H
HOH
Fig. 3.27. 1H–1H COSY and HMBC spectra of (S)-(-)rhodoptilometrin (50).

Results
151
3.5.4. 1’- Deoxyrhodoptilometrin-6-O-sulfate (51, known compound)
1’- Deoxyrhodoptilometrin-6-O-sulfate
Synonym(s) 1,6,8-trihydroxy-3-propyl-9,10-anthraquinone-6-O-sulfate
Sample code But. VLC-7a, B
Biological source Comanthus sp.
Sample amount 4.0 mg
Physical description Red powder
Molecular formula C17H14O8S
Molecular weight 378 g/mol
Retention time (HPLC) 30.21 min (standard gradient)
O
O
OH OH
OSO3H
12
3
44a
5
6
78
8a9
9a
1010a
1'2'
3'
0,0 10,0 20,0 30,0 40,0 50,0 60,0-100
0
125
250
375
500
600 SE071127 #3 But. VLC-7a, B UV_VIS_2mAU
min
1 - 29,073
2 - 30,214
3 - 35,287
WVL:254 nm
Peak #2 100%
-10,0
70,0
200 250 300 350 400 450 500 550 595
%
nm
226.4260.5
284.5
No spectra library hits found!
[M-H]-
[M+H]+

Results
152
3.5.5. Rhodoptilometrin-6-O-sulfate (52, known compound)
Rhodoptilometrin-6-O-sulfate
Synonym(s) 1,6,8-trihydroxy-3-((S)-1’-hydroxypropyl)anthracene-9,10-
dione-6-O-sulfate
Sample code But. VLC-8,E,A
Biological source Comanthus sp.
Sample amount 5.0 mg
Physical description Red powder
Molecular formula C17H14O9S
Molecular weight 394 g/mol
Optical rotation � �20D� -13.8°C (c 0.2, CH3OH)
Retention time (HPLC) 30.21 min (standard gradient)
O
O
OH OH
OSO3H
12
3
44a
5
6
78
8a9
9a
1010a
1'2'
3'
OH
0,0 10,0 20,0 30,0 40,0 50,0 60,0-100
200
400
600
800
1.000 SE071127 #11 But. VLC-8, E, A UV_VIS_2mAU
min
1 - 26,459
2 - 30,2613 - 31,560 4 - 48,030
WVL:254 nm
Peak #1 100%
-10,0
70,0
200 250 300 350 400 450 500 550 595
%
nm
260.0227.7
282.9
No spectra library hits found!
[M-H]-
[M+H]+

Results
153
Compound (51) was obtained as a greenish red powder. The UV absorption spectrum
resembled that of 49 [�max 224, 260, 285, and 440 nm] which implied a similar
chromophore in common. ESIMS of 51 exhibited a pseudomolecular ion peak at 379
[M+H]+, and 377 [M-H]- revealing an additional 80 amu compared to 1’-
dexoyrhodoptilometrin (49). This difference was expected to be due to an additional
sulfate (-SO3-) moiety in 51 than in 49. The downfield shift in 1H NMR (Table 3.28) [�H,
DMSO-d6, 51: C5-H: 7.61 (d, 3.50 Hz), C7-H: 7.20 (d, 3.5 Hz), cf 49: C5-H: 7.09 (d, 2.20
Hz), C7-H: 6.45 (d, 2.20 Hz)] was consistent with the attachment of sulfate moiety at C-6
position.
Analysis of HMBC spectrum of 51 revealed the presence of long range couplings
between the following: C-9 to H-2, H-4, H-5, and H-7; C-10 to H-4, and H-5; and C-3 to
H-2, H-4, and H-1’. Based on these couplings, the chemical structure of 50 established to
be 1,6,8-trihydroxy-3-propyl-9,10-anthraquinone-6-O-sulfate which was given the trivial
name 1’-deoxyrhodoptilometrin-6-O-sulfate (Powell and Sutherland, 1967; Bartolini et al.,
1973; Lee and Kim, 1995).
Compound (52) was obtained as a red powder. The UV absorption spectrum
resembled that of 50 [�max 227, 260, 283, and 440 nm] which implied a similar
chromophore in common. ESIMS of 52 exhibited a pseudomolecular ion peak at 395
[M+H]+, and 393 [M-H]- revealing an additional 80 amu compared to rhodoptilometrin
(50). This difference was expected to be due to an additional sulfate (-SO3-) moiety in 52
than in 50. The downfield shift in 1H NMR (Table 3.28) [�H, DMSO-d6, 52: C5-H: 7.66 (br
s), C7-H: 7.21 (br s), cf 50: C5-H: 6.79 (d, 2.20 Hz), C7-H: 6.22 (d, 2.20 Hz)] was
consistent with the attachment of sulfate moiety at C-6 position.
Analysis of HMBC spectrum of 52 revealed the presence of long range couplings
between the following: C-9 to H-2, H-4, H-5, and H-7; C-10 to H-4, and H-5; and C-3 to
H-2, H-4, and H-1’. Accordingly these findings confirmed the chemical structure of 52 to
be 1,6,8-trihydroxy-3-(1’-hydroxypropyl)-9,10-anthraquinone-6-O-sulfate which was
given the trivial name rhodoptilometrin-6-O-sulfate (Powell and Sutherland, 1967;
Bartolini et al., 1973; Lee and Kim, 1995).

Results
154
Table 3.28. NMR data of compounds (50–52).
# 50a) 51b) 52b)
�Hc) mult. (J Hz) �C
d) mult. �Hc) mult. (J Hz) �C
d) mult. �Hc) mult. (J Hz) �C
d) mult.
1 163.7, C 164.1, C 164.1, C
2 7.05 (1H, d, 1.3 Hz) 122.4, CH 7.07 (1H, s) 124.9, CH 7.28 (1H, s) 122.6, CH
3 156.1, C 154.6, C 158.2, C
4 7.44 (1H, d, 1.3 Hz) 116.6, CH 7.60 (1H, s) 121.2, CH 7.77 (1H, s) 116.2, CH
4a 135.3, C 134.7, C 135.2, C
5 6.79 (1H, d, 2.2 Hz) 113.6, CH 7.61 (1H, d, 2.5 Hz) 113.1, CH 7.66 (1H, br d) 113.7, CH
6 160.2, C 161.1, C 161.6, C
7 6.22 (1H, d, 2.2 Hz) 109.7, CH 7.20 (1H, d, 2.5 Hz) 115.2, CH 7.21 (1H, br s) 115.2, CH
8 167.5, C 165.9, C 165.8, C
8a 113.9, C 113.8, C 113.9, C
9 192.0, C 192.3, C 193.0, C
9a 118.4, C 115.1, C 119.0, C
10 184.3, C 182.8, C 182.9, C
10a 136.9, C 136.4, C 136.7, C
1’ 4.53 (1H, t, 7.0 Hz) 75.5, CH 2.68 (2H, t, 7.5 Hz) 39.2, CH2 4.58 (1H, t, 6.5 Hz) 75.7, CH
2’ 1.74 (2H, m) 32.6, CH2 1.64 (2H, m) 32.6, CH2 1.76 (2H, m) 32.9, CH2
3’ 0.98 (3H, t, 7.5 Hz) 10.3, CH3 0.90 (3H, t, 7.5 Hz) 13.9, CH3 0.96 (3H, t, 7.5 Hz) 10.5, CH3
a)Measured in MeOH-d4, b)Measured in DMSO-d6, c)Measured at 500 MHz, d) at 125 MHz.

Results
155
Absolute and relative configurations of the optically active anthraquinone derivatives,
compounds (50) and (52), were determined by performing Mosher reaction and measuring
optical rotation, respectively. The optical rotations � �20D� measured for compounds (3) and
(5), which have similarly single chiral center at C-1’, gave values of -8.0° (c 0.2, MeOH)
and -14.0° (c 0.2, MeOH), respectively which were related to those reported in literature
(Lee and Kim, 1995). These results established that both 50 and 52 are (-) isomer.
(S)-(-) Rhodoptilometrin
Table 3.29. Chemical shift differences between the (S)-MTPA and (R)-MTPA esters of 50.
position Chemical shift (�H, in C5D5N, 500 MHz) �
(S) – �(R) Rhodptilometrin (50) (S)-MTPA ester (R)-MTPA ester 2 8.2081 8.0350 8.0325 +0.0025
4 7.6890 7.4156 7.4126 +0.0030
2’ 1.8914 1.8790 1.8810 -0.0020
3’ 1.0744 1.0567 1.0605 -0.0038
Absolute configuration of 50 was determined following Mosher reaction procedure
(Dale and Mosher, 1973; Su et al., 2002) and the results (Table 3.29) proved the
assignment of the chiral center at C-1’ in 50 to be S configuration and consequently 52 was
considered to be the same isomer based on being (-) isomer as well. So, both compounds
(50) and (52) were concluded to be (S)-(-) isomers of rhodoptilometrin and
rhodoptilometrin-6-O-sulfate, respectively.

Results
156
3.5.6. Comaparvin (53, known compound)
3.5.7. 6-Methoxycomaparvin (54, known compound)
Comaparvin (55) / 6-Methoxycomaparvin (56), (3:2)
Synonym(s) 5,8-dihydroxy-10-methoxy-2-propyl-benzo[h]chromen-4-one
5,8-dihydroxy-6,10-dimethoxy-2-propyl-benzo[h]chromen-4-
one
Sample code VLC-3,II
Biological source Comanthus sp.
Sample amount 30.0 mg
Physical description Greenish yellow powder
Molecular formula Comaparvin: C17H16O5
6-Methoxy Comaparvin: C18H18O6
Molecular weight Comaparvin: 300 g/mol,
6-Methoxycomaparvin: 330 g/mol
Retention time (HPLC) 30.41 min (standard gradient)
O
O
O
OHHO
3'
2'1'
23
4
4a
5
66a
78
910
10a10b
O
O
O
OHHO
3'
2'1'
23
4
4a
5
66a
78
910
10a10b
O
0,0 10,0 20,0 30,0 40,0 50,0 60,0-200
500
1.000
1.600 SE070830 #3 VLC-3, II UV_VIS_2mAU
min
1 - 30,413
2 - 33,377
WVL:254 nm
Peak #1 100%
-10,0 200 250 300 350 400 450 500 550 595
%
nm
248.9 288.9
293.0
No spectra library hits found!
[M-H]-, (53)
70,0
[M-H]-, (54)

Results
157
Compound (53) was obtained as yellow powder and its 13C NMR spectral data (Table
3.30) revealed resonances for seventeen carbons and together with DEPT indicated the
presence of two methyl, two methylene, four methine, and nine quaternary carbon atoms.
In ESI mass spectrum, it showed a molecular ion peak at m/z 299.2 [M-H]- that suggested
the probable existence of further five oxygen atoms, leading to a molecular formula of
C17H16O5. This deduction was confirmed by HRESIMS (ion peak at m/z 299.0921 [M-H]-,
� +2.2 ppm from calc for C17H15O5). The taxonomic information and the molecular
formula pointed toward 53 being naphthopyrone comaparvin, which was first isolated by
Smith and Sutherland in 1971, and for which no 13C NMR data have been recorded. 1H
NMR (Table 3.30) revealed the presence of three aromatic protons at [�H 6.75 (1H, s)], [�H
6.59 (1H, d, 1.85 Hz)], and [�H 6.44 (1H, d, 1.85 Hz)], in addition to one proton at [�H 6.41
(1H, s)], that were ascribed to be H-6, H-7, H-9, and H-3, respectively. Also, 1H NMR
showed two proton resonances at [�H 12.84 (1H, s)], and [�H 10.26 (1H, s)] which
correspond to –OH protons at C-5, and C-8, respectively. The assignment of H-7 and H-9
was confirmed by 1H�1H COSY spectrum that revealed a clear correlation between them.
The ascription of H-3 was proven by 1H�1H COSY which displayed a correlation to
methylene group at [�H 2.71 (2H, t, 7.25 Hz)], then the spin system extends over methylene
[M-H]-, (53)
[M-H]-, (54)

Results
158
group at [�H 1.80 (2H, m)] and methyl group at [�H 0.96 (3H, t, 7.25 Hz)], forming
altogether the n-propyl side chain at C-2. 1H NMR exhibited one more methyl resonance at
[�H 3.91 (3H, s)] which was an oxygen-substituted singlet and correlated to 13C resonance
at �C 55.9 ppm, and both were assigned for methoxy group at C-10. The structural
elucidation of 53 was further confirmed by HMBC spectrum which exhibited long range
couplings between: C-10 to H-9, and C-10-OCH3; C-2 to H-3, and H2-1’; C-4 to H-3; and
C-10a to H-6, H-7, and H-9. The angular orientation of 53 was confirmed by ROESY
spectrum that revealed an obvious correlation between methoxy group 10-OCH3 at �H 3.91
with the terminal methyl and two methylene groups of the n-propyl side chain.
Based on these data (Table 3.30) and by comparison with reported literature (Smith
and Sutherland, 1971; Sakurai et al., 2002), compound (53) was deduced to be 5,8-
dihydroxy-10-methoxy-2-propyl-benzo[h]chromen-4-one known as comaparvin.
The 13C NMR data of compound (54) (Table 3.30), which was obtained as a reddish
yellow powder, displayed eighteen carbon resonances distributed into three methyl, two
methylene, three methine, and nine quaternary carbons. The LRESIMS data (m/z 329.2
[M-H]-) supposed the presence of six oxygen atoms and molecular formula was established
to be C18H18O6 based on the results from HRESIMS (m/z 329.1025 [M-H]-, � +1.7 ppm)
which was more than 53 by 30 amu. Dereplication based on the taxonomic information and
the molecular formula supported 54 to be naphthopyrone 6-methoxycomaparvin, that was
first isolated by Smith and Sutherland. 1H NMR spectral data of 54 (Table 3.30) explained
this difference in mass spectrum by revealing the disappearance of one aromatic proton
resonance and the emergence of one methyl resonance which was oxygen-substituted
singlet at [�H 3.83 (3H, s)]. The presence of this methoxy group was confirmed by 13C
NMR (Table 3.30) which displayed one additional carbon resonance at �C 59.4 ppm. Apart
from that 1H NMR of 54 exhibited the presence of two aromatic protons at [�H 6.89 (1H, d,
2.20 Hz)], [�H 6.50 (1H, d, 2.20 Hz)], and one more proton at [�H 6.40 (1H, s)], which were
oriented as H-7, H-9, and H-3, respectively. Moreover, 1H NMR showed two methylene
groups at [�H 2.72 (2H, t, 7.25 Hz)], [�H 1.81 (2H, m)], and two methyl groups at [�H 3.92
(3H, s)], and [�H 0.97 (3H, t, 7.25 Hz)]. Like in Comaparvin (53), 1H NMR of 54 exhibited
two resonances at [�H 13.06 (1H, s)], and [�H 10.36 (1H, s)], that were assigned for –OH
groups at C-5 and C-8, respectively. 1H�1H COSY confirmed the correlation between H-7
and H-9. Also, it established the correlation between H-3 and methylene group at C-1’ and
hence the n-propyl side chain at C-2. HMBC spectrum of 54 revealed some key long range
couplings between: C-10 to H-9, and C-10-OCH3; C-6 to H-7, and C-6-OCH3; and as in

Results
159
comaparvin (53), it showed couplings between C-4 to H-3; C-2 to H-3, and H2-1’; C-10a to
H-7, and H-9. ROESY spectrum supported the proposed angular structure of compound
(54), by exhibiting correlations between methoxy group 10-OCH3 at �H 3.92 with the
terminal methyl and two methylene groups of the n-propyl side chain at C-2. From these
data and by comparison with the available literature (Smith and Sutherland, 1971; Sakurai
et al., 2002; Folmer et al., 2008), compound (54) was found to be 5,8-dihydroxy-6,10-
dimethoxy-2-propyl-benzo[h]chromen-4-one which was called 6-methoxycomaparvin.
O
O
O
OHO
O
3'
2'
1'
2
34
4a5
66a
78
910
10a10b
H
H
H
55
1H-1H COSYHMBCROESY
Fig. 3.28. 1H–1H COSY, HMBC, and ROESY spectra of 55.

Results
160
3.5.8. 6-Methoxycomaparvin-5-methyl ether (55, known compound)
6-Methoxycomaparvin-5-methyl ether
Synonym(s) 8-hydroxy-5,6,10-trimethoxy-2-propyl-benzo[h]chromen-4-
one
Sample code VLC-4,C
Biological source Comanthus sp.
Sample amount 26.0 mg
Physical description Pale yellow rods
Molecular formula C19H20O6
Molecular weight 344 g/mol
Retention time (HPLC) 28.97 min (standard gradient)
O
O
O
OHO
3'
2'1'
23
4
4a
5
66a
78
910
10a10b
O
0,0 10,0 20,0 30,0 40,0 50,0 60,0-100
200
400
600
800
1.000 SE070720 #11 VLC-4c UV_VIS_2mAU
min
1 - 28,970
2 - 37,145 3 - 50,284
WVL:254 nm
Peak #1 100%
-10,0
70,0
200 250 300 350 400 450 500 550 595
%
nm
242.0276.6 202.9
No spectra library hits found!
[M+H]+
[M-H]-
[M-H]-

Results
161
Compound (55) was dereplicated and in LRESIMS, it displayed a molecular ion peak
at m/z 343.2 [M-H]-, which has 14 amu more than 6-methoxycomaparvin (54).The
molecular formula of was confirmed to be C19H20O6 by HRESIMS (m/z 343.1180 [M-H]-,
� +1.1 ppm) and 55 was deduced to be 6-methoxycomaparvin 5-methyl ether that was first
isolated by Smith and Sutherland in 1971. The NMR spectral data of 55 (Table 3.30) were
also similar to those of 54. The main differences in the spectra of the two compounds were
the presence of 1H and 13C resonances in compound (55) at [�H 3.77 (3H, s)], and at �C
61.6 ppm, respectively, and the disappearance of proton resonance at [�H 13.06 (1H, s)]
that was corresponding to –OH group at C-5 in 6-methoxycomaparvin (54). These
differences were consistent with the presence of a methoxy group at C-5 in 55 instead of
hydroxyl group in 54, which explained the 14 amu difference between them. 1H�1H
COSY spectrum (Fig. 3.28) revealed a correlation between two aromatic protons at [�H
6.63 (1H, d, 2.20 Hz)], and [�H 6.97 (1H, d, 2.20 Hz)] which were ascribed to be H-9, and
H-7, respectively. In addition it has established the correlation between H-3 at [�H 6.14
(1H, s)] to C-1’ methylene group at [�H 2.61 (2H, t, 7.25 Hz)] and continuing over the n-
propyl side chain forming an extended spin system. Further confirmation for the chemical
structure of 55 was provided by HMBC and ROESY spectra (Fig. 3.28).
According to these previous data and comparing to the corresponding literature (Smith
and Sutherland, 1971; Sakurai et al., 2002; Folmer et al., 2008), the identity of compound
(55) was deduced to be 8-hydroxy-5,6,10-trimethoxy-2-propylbenzo [h]chromen-4-one
which was named as 6-methoxycomaparvin-5-methyl ether.

Results
162
Table 3.30. NMR data of compounds (53–55), measured in DMSO-d6, 500 MHz.
# 53 54 55
�H mult. (J Hz) �C mult. �H mult. (J Hz) �C mult. �H mult. (J Hz) �C mult.
2 170.1,C 170.1,C 165.9, C
3 6.41 (1H, s) 109.3,CH 6.40 (1H, s) 108.7,CH 6.14 (1H, s) 111.2,CH
4 182.4,C 182.1,C 175.7,C
4a 107.7,C 107.5,C 113.5,C
5 155.5,C 145.8,C 146.0,C
6 6.75 (1H, s) 97.5,CH 133.5,C 142.6,C
6a 140.7,C 135.4,C 134.2,C
7 6.59 (1H, d, 2.20 Hz) 101.1,CH 6.90 (1H, d, 2.20 Hz) 95.3,CH 6.97 (1H, d, 2.20 Hz) 96.3,CH
8 159.9,C 160.2,C 159.7,C
9 6.44 (1H, d, 2.20 Hz) 97.2,CH 6.50 (1H, d, 2.20 Hz) 97.5,CH 6.63 (1H, d, 2.20 Hz) 99.5,CH
10 159.0,C 159.4,C 159.2,C
10a 104.1,C 103.1,C 106.7,C
10b 151.5,C 151.5,C 152.8,C
1’ 2.72 (2H, t, 7.25 Hz) 35.2,CH2 2.72 (2H, t, 7.25 Hz) 35.2,CH2 2.60 (2H, t, 7.25 Hz) 34.7,CH2
2’ 1.79 (2H, m) 19.1,CH2 1.82 (2H, m) 19.1,CH2 1.77 (2H, m) 19.1,CH2
3’ 0.95 (3H, t, 7.25 Hz) 13.3,CH3 0.97 (3H, t, 7.25 Hz) 13.3,CH3 0.94 (3H, t, 7.25 Hz) 13.3,CH3
5-OCH3 3.77 (3H, s) 61.4,CH3
6-OCH3 3.83 (1H, s) 59.4,CH3 3.85 (3H, s) 60.9,CH3
10-OCH3 3.90 (3H, s) 55.8,CH3 3.92 (3H, s) 55.9,CH3 3.92 (3H, s) 56.1,CH3
5-OH 12.84 (1H, s) 13.06 (1H, s)
6-OH
8-OH 10.26 (1H, s) 10.36 (1H, s) 10.38 (1H, s)

Results
163
3.5.9. 6-Methoxycomaparvin-5-methyl ether-8-O-sulfate(56, known compound)
6-Methoxycomaparvin-5-methyl ether-8-O-sulfate
Synonym(s) 5,6,10-trimethoxy-2-propyl-benzo[h]chromen-4-one-8-O-
sulfate
Sample code But. VLC-8,C,D
Biological source Comanthus sp.
Sample amount 2.0 mg
Physical description Greenish yellow powder
Molecular formula C19H20O9S
Molecular weight 424 g/mol
Retention time (HPLC) 25.34 min (standard gradient)
O
O
O
OHO3SO
3'
2'1'
23
4
4a
5
66a
78
910
10a10b
O
0,0 10,0 20,0 30,0 40,0 50,0 60,0-100
0
125
250
375
500
600 SE071127 #10 But. VLC-8, C, D UV_VIS_2mAU
min
1 - 25,344
WVL:254 nm
Peak #1 100%
-10,0
70,0
200 250 300 350 400 450 500 550 595
%
nm
233.8 268.4
366.1
No spectra library hits found!
[M+H]+
[M-H]-
[M-H]-

Results
164
3.5.10. 6-Hydroxycomaparvin-8-O-sulfate (57, known compound)
6-Hydroxycomaparvin-8-O-sulfate
Synonym(s) 5,6-dihydroxy-10-methoxy-2-propyl-benzo[h]chromen-4-one-
8-O-sulfate
Sample code But. VLC-8,D,A
Biological source Comanthus sp.
Sample amount 2.0 mg
Physical description Pale yellow powder
Molecular formula C17H16O9S
Molecular weight 396 g/mol
Retention time (HPLC) 24.04 min (standard gradient)
O
O
O
OHHO3SO
3'
2'1'
23
4
4a
5
66a
78
910
10a10b
OH
0,0 10,0 20,0 30,0 40,0 50,0 60,0-100
0
125
250
375
500
600 SE071127 #7 But. VLC-8, D, A UV_VIS_2mAU
min
1 - 24,040
2 - 26,682
3 - 27,085
WVL:254 nm
Peak #1 100%
-10,0 200 250 300 350 400 450 500 550 595
%
nm
240.6 283.0
375.2
No spectra library hits found!
[M+H]+
[M-H]-
[M-H]-
70,0

Results
165
The ESI mass spectrum of compound (56) showed a molecular ion peak at m/z 423.0
[M-H]-. Its molecular formula was deduced to be C19H20O932S1 by HRESIMS (m/z
423.0739 [M-H]-, � -1.1 ppm), which differs from 55 by more 80 amu. Based on the
literature, compound (56) was identified to be 6-methoxycomaparvin 5-methyl ether-8-O-
sulfate, which was first reported by Smith and Sutherland but without giving NMR spectral
data. 1H NMR spectral data of 56 and 55 were similar. The main difference between them
was the absence of proton resonance at [�H 10.38 (1H, s)] corresponding to –OH group at
C-8 in 6-methoxycomaparvin-5-methylether (55). Based on analysis of HRESIMS data of
56 and 55, it was concluded that the former contained sulfate (-SO3-) moiety at C-8 which
is not present in 55 and compensated for the 80 amu difference between them. The
downfield shift in 1H NMR [�H, DMSO-d6, 56: C7-H: 7.54 (d, 2.00 Hz), C9-H: 6.96 (d,
2.00 Hz), cf 55: C7-H: 6.97 (d, 2.20 Hz), C9-H: 6.63 (d, 2.20 Hz)] was consistent with the
attachment of sulfate moiety at C-8 position. The elucidated structure of 56 was further
supported by the results of 2D NMR spectra including 1H�1H COSY and ROESY spectra.
From the previous data (Table 3.31) and by comparison with the related literature (Smith
and Sutherland, 1971; Sakurai et al., 2002), compound (56) was concluded to be 5,6,10-
trimethoxy-2-propyl-benzo[h]chromen-4-one-8-sulfate which was named as 6-
methoxycomaparvin-5-methylether-8-O-sulfate.
The molecular formula of compound (57) was confirmed to be C17H16O932S1 by
HRESIMS (m/z 395.0428 [M-H]-, � -0.7 ppm), which differs from 6-methoxycomaparvin
(54) by 66 amu. The NMR spectral data of 57 (Table 3.31) were comparable to those of 54.
The major differences between them were that compound (57) showed only two methyl
resonances in 1H NMR, of which one was an oxygen-substituted singlet at �H 3.94 and the
other was the terminal methyl group of n-propyl side chain at [�H 0.98 (3H, t, 7.85 Hz)],
and devoided of the resonance for the second methoxy group at C-6 in 6-
methoxycomaparvin (54). Also, 1H NMR spectrum of 57 showed only two proton
resonances at [�H 13.01 (1H, s)], and at [�H 10.31 (1H, s)] which were assigned to be
belonging to –OH groups at C-5 and C-6, respectively. Judging from the data of HRESIMS
of 57 and 54, it was deduced that the former contained a sulfate (-SO3-) moiety as
substituent instead of methyl group in 54, which explained the 66 amu difference between
them. Similar to 56, the attachment of sulfate moiety at C-8 was evidenced by the
downfield shift in 1H NMR [�H, DMSO-d6, 57: C7-H: 7.23 (d, 2.20 Hz), C9-H: 7.21 (d,
2.20 Hz), cf 54: C7-H: 6.89 (d, 2.20 Hz), C9-H: 6.50 (d, 2.20 Hz)]. ROESY spectrum and
comparison with the respective literature (Smith and Sutherland, 1971; Sakurai et al.,

Results
166
2002) provided further evidences supporting that the elucidated structure for compound
(57) to be 5,6-dihydroxy-10-methoxy-2-propyl-benzo[h]chromen-4-one-8-O-sulfate that
was given the trivial name 6-hydroxycomaparvin-8-O-sulfate.
Table 3.31. 1H NMR data of compounds (56 and 57), measured in DMSO-d6, 500 MHz.
proton 56 57
�H mult. (J Hz) �H mult. (J Hz)
3-H 6.19 (1H, s) 6.40 (1H, s)
6-H
7-H 7.54 (1H, d, 2.00 Hz) 7.15 (1H, d, 2.00 Hz)
9-H 6.96 (1H, d, 2.00 Hz) 7.02 (1H, d, 2.00 Hz)
1’ 2.66 (2H, t, 7.25 Hz) 2.74 (2H, t, 7.25 Hz)
2’ 1.80 (2H, m) 1.83 (2H, m)
3’ 0.97 (3H, t, 7.25 Hz) 0.92 (3H, t, 7.25 Hz)
5-OCH3 3.79 (3H, s) 3.79 (3H, s)
6-OCH3 3.86 (3H, s) 3.86 (3H, s)
10-OCH3 3.94 (3H, s) 3.94 (3H, s)
5-OH 13.00 (1H, s)
6-OH 10.30 (1H, s)
8-OH

Results
167
3.5.11. 2’-Deoxythymidine (58, known compound)
2’-Deoxythymidine
Synonym(s) Thymine 2-deoxyriboside
Sample code But. VLC-7a,A
Biological source Comanthus sp.
Sample amount 3.0 mg
Physical description White amorphous solid
Molecular formula C10H14N2O5
Molecular weight 242 g/mol
Retention time (HPLC) 5.62 min (standard gradient)
HO
HO
O
N
O
NH
O1
23
4
56
1'
2'3'
4'5'
7
0,0 10,0 20,0 30,0 40,0 50,0 60,0-100
200
400
600
900 SE071127 #2 But. VLC-7a, A UV_VIS_2mAU
min
1 - 5,619WVL:254 nm
Peak #1 100%
-10,0200 250 300 350 400 450 500 550 595
%
nm
266.3
219.9
563.4
Hymenidin 963.21
[2M+H]+
[M-H]-
70,0
[M+H]+
[2M-H]-

Results
168
Compound (58) was obtained as a white amorphous solid from BuOH soluble fraction.
In its ESIMS, it showed a pseudomolecular ion peak at m/z 243 [M+H]+, and at m/z 484.8
[2M+H]+. The NMR spectral data of 58 (Table 3.32) together with the molecular weight
suggested a nucleosidic nature. The structure was unambiguously elucidated and
confirmed based on 1D and 2D NMR spectra including, 1H NMR, 13C NMR, 1H–1H
COSY and HMBC (Fig. 3.29). Based on this finding together with comparison of reported
literature (Allore et al., 1983; Lidgern et al., 1988), 58 was found to be 2’-deoxythymidine
nucleoside.
HO
HO
O
N O
NH
O
H1
2
4
5
6
7
1'2'
3'
4'
5'
Fig. 3.29. 1H–1H COSY and HMBC spectra of 2’-deoxythymidine (58).
Table 3.32. NMR data of 2’-deoxythymidine (58), measured in MeOD-d4, 500 MHz.
58
# �H mult. (J Hz) �C mult. # �H mult. (J Hz) �C mult.
2 152.4, C 1’ 6.27 (1H, t, J= 6.90 Hz) 86.2, CH
3* 11.26 (1H, br s) 2’ 2.24 (2H, m) 41.2, CH2
4 166.4, C 3’ 4.38 (1H, m, J= 3.50 Hz) 72.2, CH
5 111.5, C 4’ 3.90 (1H, q, J= 3.50 Hz) 88.8, CH
6 7.80 (1H, d, J= 1.10 Hz) 138.2, CH 5’ 3.78 (1H, dd, J= 11.95, 3.15 Hz)
3.71 (1H, dd, J= 11.95, 3.75 Hz)
62.8, CH2
7 1.87 (3H, d, J= 1.10 Hz) 12.4, CH3 3’-OH* 5.21 (1H, br d, J= 3.80 Hz)
5’-OH* 5.00 (1H, br s)

Results
169
3.5.12. Biological activity of anthraquinones and naphthopyrones isolatedfrom the marine Echinoderm Comanthus sp.
All the isolated anthraquinones, naphthopyrones, and emodin as well were subjected to
preliminary cytotoxicity (MTT) assay against L5178Y mouse lymphoma cells at a dose of
10 μg/mL. IC50 values were determined quantitatively for the potentially active candidates
(Table 3.33), using kahalalide F as positive control. Regarding anthraquinones, the results
indicated that n-propyl side chain as in 1’-deoxyrhodoptilometrin (49) instead of methyl
group in Emodin has escalated the cytotoxic activity of the former. This revealed its
importance which could be more evidenced by the abundant declined activity in case of 48
and 50 that had 1’-propenyl and 1’-hydroxypropyl side chains, respectively. In case of
naphthopyrones, it was concluded that 6-methoxycomaparvin-5-methylether (55) together
with the mixture of comaparvin (53) and 6-methoxycomaparvin (54) exhibited significant
cytotoxicity with IC50 of 4.6 and 5.2 μg/mL, respectively. Furthermore, the sulfate
derivatives had reduced activity compared to their corresponding unsulfated derivatives,
probably caused by the increased polarity of these compounds which will affect the
cellular uptake.
Table 3.33. Cytotoxicity (MTT) assay of extract, fractions, and isolated compounds from
the Echinoderm Comanthus sp.
Sample tested L5178Y growth in %
(@ 10 μg/mL)
IC50
(μg/mL) (μM)
Comanthus methanolic extract 99.8
n-Hexane Soluble Fraction 86.5
Ethyl Acetate Soluble Fraction 0.1
n-Butanol soluble Fraction 97.3
1’-Deoxyrhodoptilometrene (48) 89.7 >10
1’-Deoxyrhodoptilometrin (49) 0.2 2.3 7.7
(S)-(-)-Rhodoptilometrin (50) 64.1 >10
1’-Deoxyrhodoptilometrin-6-O-sulfate (51) 75.5 >10
(S)-(-)-Rhodoptilometrin-6-O-sulfate (52) 59.6 >10
Comaparvin (53) and 6-Methoxycomaparvin (54), (3:2) 4.3 5.2
6-Methoxycomaparvin-5-methyl ether (55) 6.1 4.6 13.4
6-Methoxycomaparvin-5-methyl ether-8-O-sulfate (56) 57.2 >10
6-Hydroxycomaparvin-8-O-sulfate (57) 24.4 7.5 18.9
2’-Deoxythymidine (58) 71.3 > 10
Emodin 77.0 > 10
Kahalalide F (positive control) 6.3 4.3

Results
170
Interestingly, testing all compounds at a dose of 1 �g/mL in biochemical protein
kinase activity assays revealed a similar pattern of activity to that found in the MTT assay
for L5178Y cells (Table 3.34) (Fig. 3.30). Six of the tested compounds inhibited the
activity of at least one of the 24 kinases that were investigated by at least 40%. For each of
these compounds IC50 values against all 24 protein kinases were determined. Compounds
inhibited cellular growth in the MTT assay proved to be active as kinase inhibitors. Table 3.34. IC50 values of Selected Compounds against 24 Different Protein Kinasesa
Cpd
AK
T1
AR
K5
Aur
ora-
A
Aur
ora-
B
AX
L
B-R
AF-
VE
CD
K2/
Cyc
A
CD
K4/
Cyc
D1
CK
2-al
pha1
CO
T
EG
F-R
EPH
B4
49 9.8 n.a. 0.90 0.54 4.2 2.9 8.0 5.2 n.a. 6.2 1.2 2.8
51 n.a. n.a. 3.9 2.8 9.9 n.a. n.a. n.a. n.a. n.a. 3.4 8.6
50 n.a. n.a. 1.3 1.3 n.a. n.a. 9.5 n.a. 8.2 n.a. 3.9 n.a.
52 n.a. n.a. 4.0 1.6 n.a. n.a. n.a. n.a. n.a. n.a. n.a. n.a.
53/54, (3:2) n.a. n.a. 2.2 3.7 3.5 1.1 n.a. 1.2 3.3 8.0 2.1 4.1
Cpd
ER
BB
2
FAK
IGF1
-R
INS-
R
ME
T
PDG
FR-b
eta
PLK
1
PRK
1
SAK
SRC
VE
GF-
R2
CO
T
49 2.0 5.5 1.5 5.5 n.a. 2.8 n.a. 8.1 1.7 1.1 0.56 n.a.
51 8.5 n.a. 3.7 n.a. n.a. 4.0 n.a. n.a. n.a. 2.1 1.0 n.a.
50 3.8 7.0 9.8 n.a. n.a. n.a. n.a. n.a. 3.2 n.a. 5.9 n.a.
52 n.a. n.a. n.a. n.a. 8.3 n.a. n.a. n.a. n.a. n.a. n.a. n.a.
53/54, (3:2) 5.7 2.1 3.5 5.5 7.3 2.3 n.a. 6.7 2.6 2.2 1.9 n.a.
aInhibitory potentials of compounds at various concentrations were determined in biochemical protein kinase activity assays. Listed are IC50 values in �g/mL. n.a.: not active, i.e., IC50 > 10 �g/mL.
Among the tested compounds, both 49 and the mixture of 53 and 54 inhibited a broad
panel of kinases with IC50 values ranging from 0.54 to 9.8 μg/mL. The parallel pattern of
activity in the cellular assay and in the biochemical protein kinase assays observed for
compounds (49), (50), and their respective 6-O-sulfate derivatives (51) and (52) suggests
that the inhibition of protein kinases may be one of the major mechanisms contributing to
the cytotoxic activity of these compounds. On the contrary, 6-methoxycomaparvin-5-
methyl ether (55) lacked such pattern in both assays. Although, it showed a potent
cytotoxic activity in the MTT assay with IC50 value of 4.6 μg/mL (13.4 μM). It didn’t

Results
171
inhibit any of the 24 protein kinases by � 40%. This discrepancy may perhaps be either
because of the poor solubility of 55 in water, incorporated in protein kinase assays, leading
to its precipitation or the cytotoxic activity of 55 proceeds through different pathways other
than inhibition of the tested protein kinases.
AKT1ARK5
Aurora-A
Aurora-B AXL
B-RAF-VE
CDK2/CycA
CDK4/CycD1
CK2-alpha1 COT
EGF-REPHB4
ERBB2 FAKIGF1-R INS-R MET
PDGFR-betaPLK1PRK1
SAKSRC
VEGF-R2 COT108642010.0
7.55.02.50.010.07.55.02.50.010.07.55.02.50.010
86420
49
Protein Kinase
51
IC50
(μg/
mL
)
50
52
53/54(3:2)
Fig. 3.30. In vitro protein kinase inhibitory activity assay against 24 different enzymes.
In the radical scavenging (DPPH) assay on TLC, active compounds appear as yellow
spots against a purple background. Then, for active ones, a spectrophotometric assay was
carried out as described in 2007 by Tsevegsuren et al. in order to evaluate the radical
scavenging activity by measuring the percentage of reduction of a 100 μM DPPH solution.
Only naphthopyrone derivatives displayed radical scavenging activity, and their results
revealed that the mixture of comaparvin (53) and 6-methoxycomaparvin (54) together with
6-hydroxycomaparvin-8-O-sulfate (57), and 6-methoxycomaparvin-5-methylether (55)
exhibited moderate to low antioxidant activities with IC50 values of 83.4, 124.6, and 130.7
μM, respectively compared to quercetin (IC50 = 6.1 μM).
In addition (S)-(-)-rhodoptilometrin (50) proved to be active against Gram positive
bacteria with MIC values of 7.81 μg/mL (24.9 μM) against multiresistant Staphylococcus
aureus (MRSA). Whereas, 1’-deoxyrhodoptilometrene (48) and 1’-deoxyrhodoptilometrin
(49) showed antiviral activity against human rhinoviruses (HRV2), (HRV8), and (HRV39);
and respiratory syncytial virus A (RSVA) with MIC values of 5.3, 10.6, 10.6, and 10.6 μM
for 48, respectively; and 5.2, 5.2, 5.2, and 1.3 μM for 49, respectively.

Discussion
172
4. Discussion
4.1. Methods for natural products tracing Natural products research needs to be continuously improved with regards to the efficiency
of the selection, screening, dereplication, isolation and structure elucidation processes so as
to keep being competitive with purely synthetic based discovery methods (Butler, 2004).
The marine ecosystems proved appealing for the scientific interests from chemists and
biologists because of the immeasurable diversity in chemical and biological aspects. Hence,
the extracts were selected based on the chemical profiling and applying a bioactivity-
guided strategy.
Due to their chemically diverse structures, natural products profiling retained being a
challenging task and therefore a single analytical method does not exist (Wolfender et al.,
2005). However, advanced analytical and hyphenated spectroscopic techniques coupled to
HPLC offered an intelligent means to provide a useful idea about the natural products in
fields of chemical structures and/or substituent moieties as well.
Of these advanced techniques, HPLC/UV-photodiode array detection (LC/UVDAD)
which allowed an online record of the UV spectra of the compounds together with a library
of UV spectra in a rather straightforward manner which in turn is extremely valuable for
dereplication of compounds previously isolated. In addition some related secondary
metabolites shared the basic chemical chromophore and hence the same UV absorption
maxima, they were not the same in fact. These differences were noticeable through
different retention times attributing the existence of a non-chromophoric moiety(ies). This
was further confirmed by a difference in their molecular weights that were determined by
HPLC/ESI-MS, another technique coupling LC to a mass spectrometric unit using electron
spray ionization (ESI) mode.
Many examples in the present study elicited the applicability of these hyphenated
techniques such as related bromopyrrole alkaloids which revealed differences in the
bromination pattern or the side chain substituent. Another example, the sulfated derivatives
that proved a different retention times from their respective non-sulfated ones that were
explained by a more 80 amu (i.e. SO3- moiety) in the molecular weights of the sulfated
derivatives as represented by the sulfated anthraquinones and naphthopyrones isolated
from the echinoderm Comanthus sp. in this study.

Discussion
173
4.2. Bromopyrroles: a typical class of marine alkaloids Bromopyrrole alkaloids constitute a family of exclusively marine alkaloids and represent a
fascinating example of the large variety of secondary metabolites elaborated by marine
sponges. The first member of this group to be isolated was oroidin (Fig. 4.1), initially from
the sponge Agelas oroides in 1971 (Forenza et al., 1971). Oroidin is considered as the key
metabolite of this family of alkaloids, since many of them possessing a pyrrole-imidazole
structure can be conceived as derivatives of the C11N5 skeleton of oroidin. These can vary
with regard to (a) oxidation, reduction, or hydration of the 2-amino-4(5)-vinylimidazole
unit, (b) dimerization, and (c) cyclization. The pyrrole-2-carboxamide moiety can be non-,
mono-, or dibrominated in 2-, 3-, and/or 4-position.
Since the mid-1970s, more than 150 derivatives, with a vast array of structures and
interesting biological activities, have been isolated from more than 20 different sponges of
various genera, essentially belonging to the Agelasidae, Axinellidae, and Halichondridae
families. It is currently believed that these alkaloids are taxon-specific of at least the
Agelasida order and can be used as chemical markers of theses phylogenetically related
sponges (Braeckman et al., 1992).
The antipredatory role of these alkaloids can be ecologically considered as the most
important biological function as noticed by the Caribbean reef sponge of the genus Agelas
(Wilson et al., 1999). Bromopyrrole alkaloids are important not only for their ecological
role and for chemotaxonomic considerations, but also for the number of interesting
pharmacological activities they have been shown to possess. Among them, the cytotoxicity
of agelastatin and the immunosuppressive activity of palau’amine are remarkable. This is
probably why they proved appealing to the organic chemists for total syntheses of
bromopyrrole alkaloids since 2000 for the purpose of further biological evaluation.
However, current interest in this group of marine natural products has been concerned not
only with preparative synthesis and biological activity but also with their biogenetic
chemical reactions.
In the group of bromopyrrole alkaloids, all compounds can be considered closely
related; they seem to share a common biogenetic pathway even if a plausible biosynthetic
mechanism leading to these marine alkaloids is still unproven. The first, and maybe the
only to the best of our knowledge, biosynthetic study performed in cell cultures of the
sponge Teichaxinella morchella using [14C]-labeled amino acids (Fig. 4.1) revealed that
histidine and proline / ornithine are precursors of stevensine (Andrade et al., 1999).
In the light of these studies, it has been proposed that both proline and ornithine can be
converted to pyrrole-2-carboxylic acid prior to halogenations; subsequently amide

Discussion
174
formation by reaction with 3-amino-1-(2-aminoimidazolyl)-prop-1-ene, derived from
histidine, generates oroidin, followed by cyclization to stevensine (Fig. 4.1).
H2NH2NOH
ONH
OH
O
HNN
HOOC
NH2
[14C] Ornithine [14C] Proline [14C] Histidine
HNN
HOOC
NH2
NH
OH
O
Br
Br
NH
HN N
H
NBr
Br
O
NH21
23 4
5 6 78
10
11
12
14
Oroidin
NH
NH
O
Br
NHHN
Br
Stevensine
NH2
Fig. 4.1. The biogenetic origin of stevensine from the sponge Teichaxinella morchella.
Recently, a new biomimetic spontaneous conversion of proline to 2-aminoimidazo-
linone derivatives using a self-catalyzed intramolecular transamination reaction together
with peroxide dismutation as key steps pointing to dispacamide A (Fig. 4.2) as the
forerunner of oroidin. Additionally 2,3-dibromo-1H-pyrrole-2-carboxylic acid and (Z)-3-
(2-amino-1H-imidazol-5-yl)acrylic acid (Fig. 4.1) were considered as probable hydrolysis
products of oroidin (Travert and Al-Mourabit, 2004).

Discussion
175
NH
NO
HN
O
NH2
NH
2 � Proline and guanidine
NH
NO
HN
O
NH2
NH
NH
NH
O
HN
O NH
NH
NH
NH
O
N
O NH
NH2
Br Br
Dispacamide APseudo-dipeptidePyrrole-proline-guanidine
Fig. 4.2. Postulated formation of pyrrole and 2-aminoimidazolinone moieties.
According to their chemical architecture, bromopyrrole alkaloids divided into:
(a) Oroidin-like linear monomer, whose structures contain the skeleton of oroidin
without any further C–C or C–N bond formation. This group was represented
by mukanadin D (9) and dispacamide E (30) isolated from the Indonesian
marine sponges Acanthostylotella sp. and Stylissa massa in this study,
respectively.
(b) Polycyclic oroidin-derivatives, whose structures can be rationalized by one the
many intramolecular cyclizations of oroidin or oroidin-like linear monomers
(Fig. 4.3).
NH
HN
NH
N
Br
Br
O
NH2
171
2
34
56 8
9
10
11
12
14
NH
NH
O
R1
N
HN
OH2N
C4/C10
N
NN
HN
OH2N
Br
Br
HO
N1/C12+N7/C12
NBr
Br
N
O
HNN
H2NN1/C12+N7/C11
NH
N
NHN
NH2
O
Br
Br
C4/C12+N7/C11 NBr
Br
NH
O
N NH
O
H
H
HHO
H3C
N1/C9+C8/C12
N
NH
N
NH
H2N
Br
Br
O
N1/C9
R2
Fig. 4.3. An overview of the five cyclization modes of polycyclic oroidin-derivatives.

Discussion
176
The cyclization modes can be hence divided into:
i) C4/C10 derivatives: represented by (-)-hymenine (29), (10Z)-
hymenialdisine analogues (33–36) in addition to other related derivatives
latonduine A (26) and aldisines (20–23) which were all isolated from the
methanolic extract of Stylissa massa in this study.
ii) N1/C12+N7/C11 derivatives: reprented by (-)-dibromophakellin H+Cl- (27)
that was obtained from the marine sponge S. massa as well.
iii) C4/C12+N7/C11 derivatives: represented by monobrominated (28) and
dibrominated (32) isophakellins which were both reported from Stylissa
massa in this study.
iv) N1/C12+N7/C12 derivatives: represented by a single member,
dibromoagelaspongin (Fig. 4.3), isolated from an Agelas sp. collected along
Tanzanian coasts (Fedoreyev et al., 1989). This molecule is closely related
to dibromophakellin (27), but in this case the nitrogen atoms N1 and N7 line
the same carbon of the imidazole ring, namely C12, and consequently the
pyrrole condensed ring is five-membered and not six-membered.
v) N1/C9 derivatives: cyclooroidin (Fig. 4.3) was isolated from the
Mediterranean sponge Agelas oroides (Fattorusso and Taglialatela-Scafati,
2000) as a prototype of this class. Cyclooroidin could be envisaged as the
precursor of the non-imidazole bromopyrrole alkaloids such as longamide
(12 and 25), its debromo derivative mukanadin C (24), longamide B (11 and
31), longamide B methyl ester (10 and 18) and longamide B ethyl ester
known as hanishin (19) which have been obtained in this study from both
Indonesian marine sponges Acanthostylotella sp. and Stylissa massa.
vi) N1/C9+C8/C12 derivatives: only agelastatins A–D represent this class of
bromopyrrole alkaloids which have been isolated from Agelas
dendromorpha (D’Ambrosio et al., 1993) and Cymbastela sp. (Hong et al.,
1998). Agelastatins are potent nanomolar antiproliferative agents against
several cancer cell lines (D’Ambrosio et al., 1996). Moreover, agelastatin A
inhibited glycogen synthase kinase-3 (GSK-3), an activity that could be
useful for the treatment of serious diseases including Alzheimer’s disease,
cancer, and type 2 diabetes (Meijer et al., 2000). Therefore, it proved
appealing for the intensive synthetic efforts.

Discussion
177
(c) Simple or cyclized oroidin-like dimers: such as sceptrin which was first
reported from the Caribbean marine sponge Agelas sceptrum in 1981 and after
which it was trivially named (Walker and Faulkner, 1981). Sceptrin was
considered as the parent of this group and structurally it was found to be a
symmetrical dimer of 2-debromooroidin. Sceptrin displayed a broad spectrum
of bioactivities such as antimicrobial against a vast array of bacterial and fungal
microorganisms and as antiviral as well (Walker and Faulkner, 1981; Keifer et
al., 1991).
(d) Other bromopyrrole alkaloids: which could not be classified under the
previous groups, basically because they lack the pyrrole-imidazole moieties.
This class represents either plausible precursors or hydrolysis products of the
bromopyrrole alkaloids and in this study it was represented by many examples
including acanthamides A–D (1–4) and compounds (5–7, 13 and 14) which
were all isolated from Acanthostylotella sp. in addition to compounds (15–17)
that were obtained from the marine sponge Stylissa massa.
4.3. Biological activity of bromopyrrole alkaloids Bromopyrrole alkaloids represent a group of secondary metabolites belonging particularly
to marine organisms mainly sponges. In addition to their important role as chemical
defense against predators or deterrents, they have exhibited an immense diversity of
biological activities such as cytotoxicity, antimicrobial against a broad spectrum of
microorganisms and viruses as well and as protein kinase inhibitors which are the
nowadays targets for treatment of a vast array of ailments including cancer, type 2 diabetes,
malaria and neurodegenerative disorders such as Alzheimer’s disease.
In this study, more than 30 bromopyrrole alkaloids have been isolated from two
Indonesian marine sponges Acanthostylotella sp. and Stylissa massa. As reported above,
they were distributed over different classes based on the chemical structures and hence the
biogenetic cyclization. They were all tested for their antiproliferative activity against
mouse lymphoma (L5178Y) cells using cytotoxicity (MTT) assay, antibacterial, antifungal,
antiviral and protein kinase inhibitory activity.
Of those isolated from Acanthostylotella sp., only mukanadin D (9) showed moderate
activity with an IC50 of 21.67 μmol/L. While in the in vitro antimicrobial and antiviral
activity assays, methyl 3,4-dibromo-1H-pyrrole-2-carboxylate (5) revealed antibacterial
activity with MIC values of 62.5 μg/mL against both multi-resistant Staphylococcus
aureus (MRSA), and Enterococcus faeclais. In addition it showed antifungal activity with

Discussion
178
MIC values of 62.5, and 125 μg/mL against Aspergillus faecalis, and Aspergillus
fumigatus, respectively. Whereas with the same MIC value of 62.5 μg/mL, ethyl 3,4-
dibromo-1H-pyrrole-2-carboxylate (15), obtained from Stylissa massa, showed antifungal
activity against Aspergillus faecalis and A. fumigatus. Moreover, 4-bromo-1H-pyrrole-3-
carboxamide (16) and aldisine (20) exhibited antiviral activity against human rhino viruses
(HRV2, HRV8, and HRV39) and respiratory syncytial virus A (RSVA) with IC50 values of
6.25, 0.78, 0.78, 0.78 μg/mL, respectively for 16 and 3.13, 1.56, 1.56, 0.78 μg/mL,
respectively for 20.
On the other hand, in cytotoxicity (MTT) assay of the bromopyrrole alkaloids isolated
from Stylissa massa, some of them interestingly proved potent cytotoxicity with (IC50 =
6.33–28.28 μM) compared to kahalalide F as standard (IC50 = 4.30 μM). Those active
candidates were (-)-longamide B ethyl ester, hanishin (19), latonduine A (26), (-)-
dibromophakellin H+Cl- (27) and hymenialdisine analogues (33–36).
Interestingly, the results of protein kinase inhibitory activity assay (Table 3.19)
revealed a correspondence with the respective cytotoxicity (MTT) assay results (Table
3.18). For example, compounds (33–36), that showed IC50 values between 1.50 and 4.0
μg/mL in the MTT assay, proved significant inhibitory activity against tested protein
kinases with IC50 values in the nanogram range (<0.1 μg/mL). This conclusively suggested
that protein kinase inhibition might be a plausible mechanism through which these
compounds exerted their antiproliferative activity. Although, (-)-hymenine (29), (-)-
dibromocantharelline (= dibromoisophakellin) (32) and (-)-mukanadin C (24) proved to be
potential inhibitors against the tested protein kinases (IC50 = 0.092–0.55 μg/mL), none of
them revealed a respective cytotoxicity in the MTT assay. This may be attributed to their
selective activity against other cell lines and/or being active in other discipline of
bioactivity other than antiproliferative activity. Additionally, 3-bromoaldisine (23) proved
the best activity profile compared to other aldisines (20–22), however they all shared a sort
of selective inhibitory activities against CLK-1 and CK-1 protein kinases with IC50 values
between 0.3 and 4.2 μg/mL (Table 3.19) which seemed to be corresponded to the presence
and the position of bromine substituent.

Discussion
179
4.4. Jaspamides: a unique group of cyclodepsipeptidesSponges of the genus Jaspis (Jaspidae) have been a rich source of biologically active,
structurally novel natural products. After the discovery of the cyclodepsipeptide jaspamide
(jasplakinolide, 37) in the sponge Jaspis cf. johnstoni in 1986 by each of Ireland and
Crews, which is known for its pronounced biological activities including antifungal (Scott
et al., 1988), anthelmintic, insecticidal (Zabriskie et al., 1986; Crews et al., 1986) and
cytotoxic activity (Inman and Crews, 1989), sponges of the genus Jaspis have received
considerable attention, and since then the chemistry of Jaspis sponges has been the subject
of more than 90 publications. A wide variety of constituents has been isolated from this
genus including several jaspamide derivatives from Jaspis splendens (Zampella et al.,
1999; Gala et al., 2007; 2008; 2009), isomalabaricane triterpenes from Jaspis stellifera
(Ravi et al., 1981; Tsuda et al., 1991; Kobayashi et al., 1996), cytotoxic macrolides from
the Okinawan sponge Jaspis sp. (Kobayashi et al., 1993), bengazoles (Rodriguez et al.,
1993; Searle et al., 1996) that stand out as unique bis-oxazoles containing a carbohydrate-
like polyol side chain, antiparasitic, antimicrobial, and cytotoxic amino acid derivatives
known as bengamides (D’Auria et al., 1997, Groweiss et al., 1999, Thale et al., 2001),
cytotoxic bromotyrosine derivatives (Park et al., 2003, Shinde et al., 2008), and a series of
dihydroxystyrene sulphate derivatives (Ohta et al., 1994; Tsukamoto et al., 1994; Chang et
al., 2008).
During the course of this study and as a part of our ongoing research on bioactive
natural products from marine sponges, we investigated a specimen of Jaspis splendens
collected at Kalimantan (Indonesia) whose crude methanolic extract completely inhibited
the cellular growth of mouse lymphoma (L5178Y) cells in the in vitro cytotoxicity (MTT)
assay. Bioactivity-guided isolation scheme of the total methanolic extract was applied and
it yielded eight compounds including three ketrosteroids, 6ß-hydroxy-24-methylcholesta-
4,22-dien-3-one (40), 6ß-hydroxy-24-methylcholesta-4-en-3-one (41), 6ß-hydroxy-24-
ethylcholesta-4-en-3-one (42), a diketopiperazine derivative maculosin-1 (cyclo-L-Pro-L-
Tyr) (43), a nucleoside derivative sangivamycin (44), two new jaspamides Q (38) and R
(39), were isolated together with the parent compound jaspamide (37).
All the isolated compound were reported from the marine sponge of the genus Jaspis
except 43 and 44 that were both firstly purified as secondary metabolites from Jaspis
digonoxea and J. Johnstoni, respectively but later, they were obtained from
microorganisms associated with the sponge. Hence, they were proven to be in fact
microbial secondary metabolites, produced by symbiont microorganisms associated with
the marine sponge of the genus Jaspis (Jayatilake et al., 1996; Fdhila et al., 2003).

Discussion
180
HN O
N
NH
O
O
O
O
HNR1
1
3
5
7
911
12
1415
16
17
1819
21
2426
27
30
OH
33
34
35
36
R2
R1= Br, R2= H: Jaspamide (37)
R1, R2= H: Jaspamide Q (38)
R1, R2= Br: Jaspamide R (39)
Based on the reported literature that all of the formerly isolated fifteen jaspamide
derivatives (B–L) showed antiproliferative activity against human breast (MCF-7) and
colon carcinoma (H-29) cell lines with IC50 values ranging from 0.01 to 33 μM (Gala et al.,
2009). Since jaspamide Q (38) and R (39) together with the parent jaspamide (37) differ in
the bromination pattern of the abrine (N-methyltryptophan) moiety. Since these
modifications were claimed as essential for the observed biological activity (Kahn et al.,
1991), compounds (38 and 39) together with other compounds isolated from J. splendens
collected in Kalimantan (Indonesia) were subjected to the in vitro cytotoxicity (MTT)
assay against mouse lymphoma (L5178Y) cell lines. They exhibited potent activities with
IC50 values between <0.1 and 10 μg/mL (<0.13 and 24.3 μM) (Table 3.23), compared to
kahalalide F (IC50 = 6.3 μg/mL, 4.3 μM) which was used as a positive control. Among the
tested compounds, the three jaspamide derivatives (37–39) together with the nucleoside
derivative sangivamycin (44) revealed the highest cytotoxicity with IC50 values in the
ng/mL range (<0.1 μg/mL). R3
OH
O
H
H H
1
35 6
11
810
14
17
18
1920
21 22
23
2425
26
27
28
2829
40: R3=
41: R3=
42: R3=
Whereas the isolated ketosteroids differed in the side chain attached to the pentacyclic
structure. Interestingly, compounds (40–42) revealed cytotoxicity in an ascending manner
with IC50 values of 10, 9.3, and 2.9 μg/mL, respectively. This may propose some SARs,
for example the presence of an ethyl moiety at C24 of the side chain in 42 significantly
escalated the cytotoxic activity compared to 41 and 40 where a methyl group is present
instead. In addition, the existence of a double bond between C22 and C23 as in 40 seems to
diminish the cytotoxicity than in 41 but this effect seems to be of a minor impact.

Discussion
181
4.5. Thalassiolins: sulfated flavonoids from Thalassia testudinumFlavonoids represent a class of natural products that combine both shikimate and acetate
biosynthetic pathways to build up the main aglyone skeleton (Fig. 4.4). Many
modifications have been noticed regarding both the hydroxylation and the glycosylation
patterns over the whole flavonoid skeleton.
OOH
HO O
OH
A C
B
Shikimate pathway
Acetate pathway
Fig. 4.4. Basic flavone aglycone skeleton and the involved biosynthetic pathways.
During the course of the present study, we have investigated the methanolic extract of
a specimen of seagrass Thalassia testudinum collected off Muk Island, Trang Province,
Thailand in 2007 that resulted in the isolation of two reported sulfated flavonoid glycosides
from the same species, namely thalassiolin A (luteolin 7-�-D-glucopyranosyl-2”-sulfate)
(45) and thalassiolin C (apigenin 7-�-D-glucopyranosyl-2”-sulfate) (46) in addition to
luteolin-3’-O-glucuronide (47), previously isolated from Salvia officinalis (Labiateae) that
was a subject of several studies as a resource of some potent antioxidants (Lu and Foo,
2000), and to the best of our knowledge it is the first report for 47 from marine
environment.
Thalassiolin A (45) was reported in literature as an in vitro inhibitor of HIV cDNA
integrase (IC50 = 0.4 μM) and antiviral against HIV with IC50 value of 30 μM (Rowely et
al., 2002) compared to thalassiolin C (46) that exhibited moderate to low activity. However,
none of them exhibited cellular toxicity against human colon cancer HCT-116 cells at
concentration up to 75 μM (Rowely et al., 2002).
Based on the related reported literature, compounds (45–47) were tested for cytotoxic
activity against mouse lymphoma (L5178Y) cells using the MTT assay, protein kinase in
vitro inhibitory activity against 24 different enzymes and the radical scavenging activity
using the DPPH assay.
However, none of the compounds (45–47) revealed potential cytotoxicity which was
in accordance with the reported literature. Only thalassiolin A (45) exhibited moderate to

Discussion
182
weak activity against some kinases such as PDGFR-beta (IC50= 0.63 μg/mL), Aurora-A
(IC50= 2.1 μg/mL) and Aurora-B (IC50= 1.5 μg/mL) which were proven to play a role in
prostate, pancreatic, and breast cancers, respectively.
Whereas in radical scavenging (DPPH) assay, results disclosed that thalassiolin A (45)
and luteolin-3’-O-glucuronide (47) possess mild radical scavenging activity with IC50
values of 48 μM for both compared to quercetin (IC50 = 6.0 μM) and kaempferol (IC50 =
23 μM).
4.6. Anthraquinones and naphthopyrones from Comanthus sp. During the course of this study, we have investigated the methanolic extract of a Philippine
specimen of the echinoderm Comanthus sp. collected off the northern shores of Mindoro
Island along the so-called Manila Channel in 1994.
The detailed bioactivity-guided chemical analysis resulted in the isolation of five
related anthraquinone derivatives (48–52) and the same number of naphthopyrone
analogues (53–57).
O
O
OH OH
OR2
R1
12
3
44a
5
6
788a99a
1010a
1'
2'
3'
O
O
O
R5R3
R4
3'
2'1'
23
4
4a5
66a7
8
91010a10b
R1 R2 R3 R4 R5
48: H, �1’(2’) H 53: OH H OH 49: H, 1’,2’-dihydro H 54: OH OCH3 OH 50: OH H 55: OH OCH3 OCH3
51: H SO3- 56: SO3
- OCH3 OCH3
52: OH SO3- 57: SO3
- OH OH
4.6.1. Biosynthesis of anthraquinones and naphthopyrones Anthraquinones are biosynthesized by a linear head-to-tail combination of acetate and
malonate moieties yielding an octaketide precursor, a process that is catalyzed by
polyketide synthase enzyme followed by the loss of carboxylic acid carbon from the
terminal unit at C-3, but the detailed sequence of condensation, dehydration and
hydroxylation steps is not well known (Fig. 4.5) (Han et al., 2002; Dewick, 2002).

Discussion
183
SCoA
O
COOH
SCoA
OAcetate CoA Malonyl CoA
+ 7 �
O
OOOCoAS
O O O O
Octaketide chainAldol condensation
��3H2O
HOOC
O
OOO
Hypothetical intermediate I
HOOC
OH
OHOOH
OEndocrocin
EnolizationOxidation
OH
OHOOH
O
Decarboxylation� CO2
Emodin
C-Alkylation[SAM]
OH
OHOOH
O1'-Deoxyrhodoptilometrin
Synthase
Fig. 4.5. Postulated biosynthetic pathway for anthraquinones (Han et al., 2002).
The periphery of the carbon skeleton is constructed by folding the octaketide chain,
and then the ring at the centre of the fold is formed first, followed in turn by the next two
rings (Dewick, 2002). The validity of the octaketide pathway was confirmed by
spectroscopic studies utilizing single and double labeled acetates (Stoessl et al., 1983,
Suemitsu et al., 1989, Ohnishi et al., 1992). In the end, modification of the basic structure
resulted from either oxidation alone or together with dehydration to form different
anthraquinone derivatives.
The biosynthetic pathway of naphtopyrone as postulated below (Fig. 4.6) was based
on those reported for 2,5-dimethyl-7-hydroxychromone (Ayer and Racok, 1990) and for
anthraquinones (Han et al., 2002). 2,5-Dimethyl-7-hydroxychromone has been isolated

Discussion
184
from the roots of Polygonum cuspidatum, a plant used in Chinese and Japanese traditional
medicines (Kimura et al., 1983). As illustrated below, the postulated biosynthetic pathway
for 2,5-dimethyl-7-hydroxychromone revealed that it probably originates from a
hexaketide precursor not pentaketide as with other chromones (Ayer and Racok, 1990).
O
CoAS
OO
O
O
O
Hexaketide precursor
Cyclization
O
CoAS
OO
HO
HO
Hydrolysis
Decarboxylation� CO2
OO
HO
HOCyclization� H2O
O
HO
O
2,5-Dimethyl-7-hydroxychromone
DemethylationOxidation
+DMAPP
O
O
HO
OCH3
OH
Comaparvin (naphthopyrone)
C-Alkylation
OPP
Fig. 4.6. Postulated biosynthetic pathway for naphthopyrones (Ayer and Racok, 1990).
Afterwards, the biosynthesis of naphthopyrone was postulated to be continued through
incorporation of a C5 unit through dimethylallyl pyrophosphate moiety (DMAPP) to build
up the third aromatic ring in the naphthopyrone basic skeleton and hence the end step
would be either oxidation or methylation to modify the substituent moieties between
hydroxyl or methoxy groups affording the different isolated naphthopyrone derivatives.

Discussion
185
4.6.2. Biological activity of anthraquinones and naphthopyrones Nuclear factor �B (NF-�B) is an inducible transcription factor that plays a role in cancer
development and inflammation (Karin, 2004). Formerly, the effects of 6-
methoxycomaparvin (54) and 6-methoxycomaparvin-5-methyl ether (55) on TNF�-
induced transcriptional activity of NF-�B were examined. The results revealed that both of
them completely inhibit TNF�-induced NF-�B activation and NF-�B-DNA binding at MIC
of 300 μM (Folmer et al., 2008).
All the isolated anthraquinones, naphthopyrones, and emodin as well were subjected
to preliminary cytotoxicity (MTT) assay against L5178Y mouse lymphoma cells at a dose
of 10 μg/mL. IC50 values were determined quantitatively for the potentially active
candidates (see Table 3.33), using kahalalide F as positive control. Regarding
anthraquinones, the results indicated that n-propyl side chain as in 1’-deoxyrhodo-
ptilometrin (49) instead of methyl group in emodin has elevated the cytotoxic activity of
the former. This might implicate its importance which could be more evidenced by the
abundant declined activity in case of 48 and 50 that had 1’-propenyl and 1’-hydroxypropyl
side chains, respectively. In case of naphthopyrones, it was concluded that 6-
methoxycomaparvin-5-methyl ether (55) together with the mixture of comaparvin (53) and
6-methoxycomaparvin (54) exhibited significant cytotoxicity with IC50 of 4.6 and 5.2
μg/mL, respectively. Furthermore, the sulfate derivatives had reduced activity compared to
their corresponding unsulfated ones, probably caused by the increased polarity of these
compounds which would affect the cellular uptake.
Interestingly, testing all compounds at a dose of 1 �g/mL in biochemical protein
kinase activity assays revealed a similar pattern of activity to that found in the MTT assay
for L5178Y cells (see Table 3.34) (see Fig. 3.30), i.e. compounds inhibited cellular growth
in the MTT assay proved to be active as kinase inhibitors.
Among the tested compounds, both 49 and the mixture of 53 and 54 inhibited a broad
panel of kinases with IC50 values ranging from 0.54 to 9.8 μg/mL. The parallel pattern of
activity in the cellular assay and in the biochemical protein kinase assays observed for
compounds (49), (50), and their respective 6-O-sulfate derivatives (51) and (52) suggests
that the inhibition of protein kinases may be one of the major mechanisms contributing to
the cytotoxic activity of these compounds. On the contrary, 6-methoxycomaparvin-5-
methyl ether (55) lacked such pattern in both assays. Although, it showed a potent
cytotoxic activity in the MTT assay with IC50 value of 4.6 μg/mL. It didn’t inhibit any of
the 24 protein kinases by � 40%. This discrepancy may perhaps be either because of the
poor solubility of 55 in water, incorporated in protein kinase assays, leading to its

Discussion
186
precipitation or the cytotoxic activity of 55 proceeds through different pathways other than
inhibition of the tested protein kinases.
In the radical scavenging (DPPH) assay, a spectrophotometric assay was carried out as
described in 2007 by Tsevegsuren et al. Only naphthopyrone derivatives displayed mild
radical scavenging activity, and their results revealed that the mixture of comaparvin (53)
and 6-methoxycomaparvin (54) together with 6-hydroxycomaparvin-8-O-sulfate (57), and
6-methoxycomaparvin-5-methyl ether (55) exhibited only moderate to weak antioxidant
activities with IC50 values of 83.4, 124.6, and 130.7 μM, respectively compared to
quercetin (IC50 = 6.1 μM).
In addition (S)-(-)-rhodoptilometrin (50) proved to be active against Gram positive
bacteria with MIC values of 7.81 μg/mL against multi-resistant Staphylococcus aureus
(MRSA). Whereas, 1’-deoxyrhodoptilometrene (48) and 1’-deoxyrhodoptilometrin (49)
showed antiviral activity against human rhinoviruses (HRV2), (HRV8), and (HRV39); and
respiratory syncytial virus A (RSVA) with MIC values of 1.56, 3.13, 3.13, and 3.13 μg/mL
for 48, respectively; and 1.56, 1.56, 1.56, and 0.39 μg/mL for 49, respectively. Therefore,
compounds (48–50) are considered as interesting candidates for further biological
investigations.
4.7. Sulfated secondary metabolites: occurrence and influence Sulfur is found in the amino acids cysteine and methionine, often responsible for protein
structure and enzymatic activity; in coenzymes, such as iron-sulfur centres, thiamine, lipoic
acid, or coenzyme A; and in many secondary metabolites, e.g., glucosinolates, alliins, etc.
Not surprisingly, therefore, sulfur is an essential micronutrient for all living organisms
(Kopriva et al., 2007).
Glucosinolates are a well-studied example of compounds involved in plant defense
against biotic stress, particularly against herbivores and pathogens in Brassicales (Halkier
and Gershenzon, 2006). They exert their defensive action through enzymatic reaction of
myrosinase, producing toxic volatile isothiocyanates and nitrils. Finally, sulfation mediated
by sulfotransferase (SOT) takes place as an essential end step.
Plants possess many other sulfated compounds, including sulfoflavonoids and sulfated
oligosaccharides, play different roles in defense against plant stress (Varin et al., 1997;
Menrad et al., 2004).
In mammals, sulfation is a major contributor to the homeostasis and regulation of
numerous biologically potent endogenous chemicals, such as catecholamines, steroids, and
iodothyronines, as well as contributing to the detoxification of xenbiotics (Coughtrie et al.,

Discussion
187
1998). In bacterial, sulfation is essential for the signalling of rhizobial nod factors to the
plant (Truchet et al., 1991).
In this study, a sum of six secondary metabolites have been reported of which two
were thalassiolins A (45) and C (46) that were isolated and reported from the same
seagrass speices Thalassia testudinum. The other four sulfated metabolites were two
anthraquinones (51 and 52) and two naphthopyrones (56 and 57) that were obtained and
reported from the same echinoderm genus Comanthus. The existence of sulfate moiety has
imparted a partially higher polarity of these metabolites and therefore they were all
purified from n-BuOH fraction of the total methanolic extract of the corresponding
organism. This partially imparted higher polarity by sulfate moieties in anthraquinones and
naphthopyrones has influenced the cellular uptake of these metabolites and resulted in
diminished bioactivity compared to the respective metabolites lacking sulfate as shown
above.

Summary
188
5. Summary Marine sponges are the source of the greatest chemical diversity of natural products. From
which one-third of all marine natural products have been isolated and hence considered as
the most popular source of novel compounds. The marine sponges are considered not only
as a very important source of new natural products but also as a source for bioactive
compounds. These compounds are interesting candidates for new drugs, primarily in the
fields of cancer, anti-inflammatory, anti-infective and analgesic.
Recently, two marine natural products have been introduced as new medicaments:
Prialt® (also known as ziconotide) as a potent analgesic for severe chronic pain and
Yondelis® (known also as trabectedin or ET-743) as antitumor agent for the treatment of
advanced soft tissue sarcoma. Moreover, Aplidin® (plitidepsin), kahalalide F, and
Zalypsis® (jorumycin derivative) are in clinical trial phases for treatment of solid tumors
and haematological malignancies.
Many successful cases, as shown above, proved to have various pharmaceutical
significances, which have been developed to preclinical or clinical trial phases for
treatment of serious diseases such as Alzheimer’s disease, type 2 diabetes, cancer and
infectious diseases in addition to pain killing and anti-inflammatory activities.
Therefore, the aim of this study was directed toward the isolation and structural
elucidation of marine natural products, either known or preferentially new ones, in
appreciable amounts so as to enable testing various biological activities.
Secondary metabolites isolation and structural elucidation were performed by means
of new sophisticated analytical techniques including mass spectrometry and nuclear
magnetic resonance spectroscopy. Moreover, the absolute configuration of the selected
optically active natural products were determined and reported based on the chiral
derivatization using Mosher reaction. For the assessment of biological activity, a vast array
of assays has been performed including cytotoxicity (MTT), antibacterial, antifungal,
antiviral, protein kinase inhibitory and antioxidant (DPPH) activities.
Different types of marine organisms have been involved in this study including
sponges, seagrasses and echinoderms that have been collected off various geographic
locations namely Indonesia, Philippine, and Thailand.
1. Acanthostylotella sp.
Six new dibromopyrrole alkaloids have been isolated from the methanolic extract of the
Indonesian marine sponge Acanthostylotella sp. (Indonesia). They include four new
acanthamides (A–D) in addition to methyl 3,4-dibromo-1H-pyrrole-2-carboxylate and 3,5-

Summary
189
dibromo-1H-pyrrole-2-carboxylic acid. Furthermore, eight known dibromopyrrole
alkaloids were obtained from the same extract. Among the isolated compounds, mukanadin
D revealed moderate cytotoxicity against mouse lymphoma (L5178Y) cells. Whereas,
methyl 3,4-dibromo-1H-pyrrole-2-carboxylate exhibited moderate antimicrobial and
antiviral activites.
2. Stylissa massa
Twenty two bromopyrrole alkaloids have been purified and identified from the methanolic
extract of the marine sponge Stylissa massa (Indonesia) among which two new natural
dibromopyrrole alkaloids have been isolated namely, ethyl 3,4-dibromo-1H-pyrrole-2-
carboxylate and dispacamide E. The isolated compounds revealed interesting bioactivity
results in different bioassays including cytotoxicity (MTT) assay, antimicrobial, antifungal,
antiviral and in vitro protein kinase inhibitory activity.
3. Jaspis splendens
Eight compounds were isolated through a bioactivity-guided isolation scheme from the
ethyl acetate soluble fraction of the total methanolic extract of Jaspis splendens (Indonesia).
In addition to three known ketosteroids, a diketopiperazine derivative cyclo-L-Pro-L-Tyr,
and nucleoside derivative sangivamycin, two new jaspamide derivatives, were isolated
together with the parent compound jaspamide.
All isolated compounds exhibited cytotoxicity against mouse lymphoma (L5178Y)
cells in particular new jaspamide derivatives together with jaspamide, cyclo-L-Pro-L-Tyr
and sangivamycin showed the highest cytotoxicity with IC50 values ranging from <0.1 to
0.28 μg/mL, compared to kahalalide F (IC50= 6.3 μg/mL).
4. Thalassia testudinum
A detailed chemical investigation of the methanolic extract of T. testudinum (Thailand)
was carried out and lead to the isolation of two sulfated flavonoid glycosides, thalassiolin
A and thalassiolin C. Whilst luteolin-3’-O-glucuronide was also isolated and to the best of
our knowledge, it is the first report for this compound from marine habitat, however it was
reported from Sage (Salvia officinalis, family Labiatae) which has been the subject of
several studies as a resource of some potent antioxidants. Finally, all the isolated
flavonoids glycosides were tested for radical scavenging (DPPH) activity.

Summary
190
5. Comanthus sp.
Bioactivity-guided fractionation strategy of Comanthus sp. (Philippine) extract was
performed leading to the isolation of sixteen compounds; five of them were anthraquinones
including one new natural product, five were naphthopyrones, one nucleoside, 2’-
deoxythymidine, and five were steroidal secondary metabolites. Herein, we would
comprehensively report isolation, structural elucidation based on the analysis of
spectroscopic and spectrometric data in addition to comparison with the related literature,
absolute stereochemistry of two optically active anthraquinone derivatives,
rhodoptilometrin and its 6-O-sulfate derivative has be reported here for the first time using
Mosher reaction which revealed that both of them are (S)-(-) isomers.
All the isolated compounds were subjected qualitatively and quantitatively to radical
scavenging (DPPH) assay, cytotoxic (MTT) assay against (L5178Y) mouse lymphoma cell
line, protein kinase in vitro inhibitory activity assay against 24 different protein kinases,
antimicrobial, antifungal and antiviral activities. Anthraquinones and naphthopyrones
displayed interesting results that could be related in different assays.

References
191
6. References
Allore B.D., Queen A., Blonski W.J., Hruska F.E. (1983). A kinetic and nuclear magnetic
resonance study of methylated pyrimidine nucleosides. Can. J. Chem., 61, 2397–
2402.
Andrade P., Willoughby R., Pomponi S.A., Kerr R.G. (1999). Biosynthetic studies of the
alkaloid, stevensine, in a cell culture of the marine sponge Teichaxinella morchella.
Tetrahedron Lett., 40, 4775–4778.
Ang K.K.H., Holmes M.J., Higa T., Hamann M.T., Kara U.A.K. (2000). In vivo
antimalarial activity of the betacarboline alkaloid manzamine A. Antimicrob. Agents
Chemother., 44, 1645–1649.
Aoki S., Yoshioka Y., Miyamoto Y., Higuchi K., Setiawan A., Murakami N., Chen Z.S.,
Sumizawa T., Akiyama S., Kobayashi M. (1998). Agosterol A, a novel
polyhydroxylated sterol acetate reversing multidrug resistance from a marine sponge
of Spongia sp. Tetrahedron Lett., 39, 6303–6306.
Assmann M., Köck M. (2002). Monobromoisophakellin, a new bromopyrrole alkaloids
from the Caribbean sponge Agelas sp. Z. Naturforsch., 57c, 153–156.
Ayer W.A., Racok J.S. (1990). The metabolites of Talaromyces flavus: Part 1. Metabolites
of the organic extracts. Can. J. Chem., 68, 2085–2094.
Banville J., Brassard P. (1976). Reactions of keten Acetals. Part VI. Total syntheses of the
anthraquinones (±)-nalgiovensin, (±)-isorhodoptilometrin and (±)-rhodoptilometrin. J.
Chem. Soc. Perkin Trans 1, 613–619.
Barnes R. D., “Invertebrate Zoology,” 5th ed., Saunders College Publishing, Fort Worth,
USA, 1987, pp. 826–834.
Bartolini G.L., Erdman T.R., Scheuer P.J. (1973). Anthraquinone pigments from the
crinoid Comanthus bennetti. Tetrahedron, 29, 3699–3702.
Bergmann W., Burke D.C. (1955). Contribution to the study of marine products. XXXIX
the nucleosides of the sponges III. Spongothymidine and spongouridine. J. Org.
Chem., 20, 1501–1507.
Bergmann W., Feeney R.J. (1951). Contribution to the study of marine products. XXXII.
The nucleotides of sponges I. J. Org. Chem., 16, 981–987.
Bergmann W., Watkins J.C., Stempien M.F. (1957). Contribution to the study of marine
products. XLV. Sponge nucleic acids. J. Org. Chem., 22, 1308–1313.
Bhakuni D.S., Rawat, D.S. (2005). Bioactive Marine Natural Products: p. 26–77 (Springer-
Anamaya, New York, New Delhi).

References
192
Braeckman J.C., Daloze Q., Stoller C., Van Soest R.W. (1992). Chemotaxonomy of Agelas
(Porifera: Demospongiae). Biochem. Syst. Ecol., 20, 417–430.
Butler M.S. (2004). The role of natural product chemistry in drug discovery. J. Nat. Prod.,
67, 2141–2153.
Cafieri F., Carnuccio R., Fattorusso E., Taglialatela-Scafati O., Vallefuoco T. (1997). Anti-
histaminic activity of bromopyrrole alkaloids isolated from Caribbean Agelas
sponges. Bioorg. Med. Chem. Lett., 7, 2283–2288.
Cafieri F., Fattorusso E., Mangoni A., Taglialatela-Scafati O. (1995). Longamide and 3,7-
dimethylisoguanine, two novel alkaloids from the marine sponge Agelas longissima.
Tetrahedron Lett., 36, 7893–7896.
Cafieri F., Fattorusso E., Mangoni A., Taglialatela-Scafati O. (1996). Dispacamides, anti-
histamine alkaloids from Caribbean Agelas sponges. Tetrahedron Lett., 37, 3587–
3590.
Cafieri F., Fattorusso E., Taglialatela-Scafati O. (1998). Novel bromopyrrole alkaloids
from the sponge Agelas dispar. J. Nat. Prod., 61, 122–125.
Carmichael J., DeGraff W.G., Gazdar A.F., Minna J.D., Mitchell J.B. (1987). Evaluation
of a tetrazolium-based semiautomated colorimetric assay: Assessment of
radiosensitivity. Cancer Res., 47, 943–946.
Chang Y.H., Shin D., Na Z., Lee H.-S., Kim D.-D., Oh K.-B., Shin J. (2008).
Dihydroxystyrene metabolites from an association of the sponge Poecillastra
wondoensis and Jaspis sp. J. Nat. Prod., 71, 779–783.
Cimino G., De Rosa S., De Stefano S., Mazzarella L., Puliti R., Sodano G. (1982).
Isolation and X-ray crystal structure of a novel bromo-compound from two marine
sponges. Tetrahedron Lett., 23, 767–768.
Cimino G., De Rosa S., De Stefano S., Mazzarella L., Puliti R., Sodano G. (1982).
Isolation and X-ray crystal structure of a novel bromo compound from two marine
sponges. Tetrahedron Lett., 23, 767–768.
Claeson P., Bohlin L. (1997). Some aspects of bioassay methods in natural-product
research aimed at drug lead discovery. Trends. Biotech., 15, 245–246.
Coughtrie M.W.H., Sharp S., Maxwell K., Innes N.P. (1998). Biology and function of the
reversible sulfation pathway catalyzed by human sulfotransferases and sulfatases.
Chem. Biol. Inter., 109, 3–27.
Crews P., Manes L.V., Boehler M. (1986). Jasplakinolide, a cyclodepsipeptide from the
marine sponge, Jaspis sp. Tetrahedron Lett., 27, 2797–2800.

References
193
Crompton D.W.T., Nesheim M.C. (2002). Nutritional impact of intestinal helminthiasis
during the human life cycle. Annu. Rev. Nutr., 22, 35–59.
D`Auria M.V., Paloma L.G., Minale L., Riccio R., Debitus C. (1992). Unique 3�-
methylsterols from the Pacific sponge Jereicopsis graphidiophora. J. Nat. Prod., 55,
311–320.
D’Ambrosio M., Guerriero A., Debitus C., Ribes O., Pusset J., Leroy S., Pietra F. (1993).
Agelastatin A, a new skeleton cytotoxic alkaloid of the oroidin family. Isolation from
the Axinellid sponge Agelas dendromorpha of the Coral Sea. J. Chem. Soc. Chem.
Commun., 16, 1305–1306.
D’Ambrosio M., Guerriero A., Ripamonti M., Debitus C., Waikedre J., Pietra F. (1996). 65.
The active centers of agelastatin A, a strongly cytotoxic alkaloid of the Coral Sea
Axinellid sponge Agelas dendromorpha, as determined by comparative bioassays
with semisynthetic derivatives. Helv. Chim. Acta, 79, 727–735.
D’Auria M.V., Giannini C., Minale L., Zampella A., Debitus C., Frostin M. (1997).
Bengamides and related amino acid derivatives from the new Caledonian marine
sponge Jaspis carteri. J. Nat. Prod., 60, 814–816.
Dale J.A., Mosher H.S. (1973). Nuclear magnetic resonance enantiomer reagents.
Configurational correlations via nuclear magnetic resonance chemical shifts of
diastereomeric mandelate, O-methylmandelate and �-methoxy-�-trifluoromethyl-
phenylacetate (MTPA) esters. J. Amer. Chem. Soc., 95, 512–519.
Davidson S.K., Allen S.W., Lim G.E., Anderson C.M., Haygood M.G. (2001). Evidence
for the biosynthesis of bryostatins by the bacterial symbiont "Candidatus
Endobugula sertula" of the bryozoan Bugula neritina. Appl. Environ. Microbiol., 67,
4531–4537.
De Nanteuil G., Ahond A., Guilhem J., Poupat C., Dau E.T.H., Potier P. (1985).
“Invertebres marins du lagon neo-caledonien–V. Isolement et identification des
metabolites d’une nouvelle espece de spongiaire, Pseudaxinyssa cantharella.”
Tetrahedron, 41, 6019–6033.
DeBusk L.M., Chen Y., Nishishita T., Chen J., Thomas J.W., Lin P.C. (2003). Tie2
receptor tyrosine kinase, a major mediator of tumor necrosis factor alpha-induced
angiogenesis in rheumatoid arthritis. Arthritis Rheum., 48, 2461–2471.
Dehm S., Senger M.A., Bonham K. (2001). SRC transcriptional activation in a subset of
human colon cancer cell lines. FEBS Letters, 487, 367–371.
Dewick, P. M. (2002). Medicinal natural products. A biosynthetic approach. John Wiley &
Sons Ltd, Baffins Lane, Chichester, England.

References
194
Ebel R., Brenzinger M., Kunze A., Gross H.J., Proksch P. (1997). Wound activation of
protoxins in marine sponge Aplysina aerophoba. J. Chem. Ecol., 23, 1451–1457.
Fathi-Afshar R., Allen T.M. (1988). Biologically active metabolites from Agelas
mauritiana. Can. J. Chem., 66, 45–50.
Fattorusso E., Taglialatela-Scafati O. (2000) Two novel pyrrole-imidazole alkaloids from
the Mediterranean sponge Agelas oroides. Tetrahedron Lett., 41, 9917–9922.
Fdhila F., Vzquez V., Snchez J.L., Riguera R. (2003). dd-Diketopiperazines: antibiotics
active against Vibrio anguillarum isolated from marine bacteria associated with
cultures of Pecten maximus. J. Nat. Prod., 66, 1299–1301.
Fedoreyev S.A., Ilyin S.G., Utkina N.K., Maximov O.B., Reshetnyak M.V., Antipin M.Y.,
Struchkov Y.T. (1989). The structure of dibromoagelospongin - a novel bromine-
containing guanidine derivative from the marine sponge Agelas sp. Tetrahedron, 45,
3487–3492.
Folmer F., Harrison W.T.A., Tabudravu J.N., Jaspars M., Aalbersberg W., Feussner K.,
Wright A.D., Dicato M., Diederich M. (2008). NF-�B inhibiting naphthopyrones
from the Fijian echinoderm Comanthus parvicirrus. J. Nat. Prod., 71, 106–111.
Forenza S., Minale L., Riccio R., Fattorusso E. (1971). New bromo-pyrrole derivatives
from the sponge Agelas oroides. J. Chem. Soc., Chem. Comm., 1129–1130.
Francesconi K.A. (1980). Pigments of some echinoderms collected from Western
Australian waters. Aust. J. Chem., 33, 2781–2784.
Gala F., D’Auria M.V., De Marino S., Sepe V., Zollo F., Smith C.D., Copper J.E.,
Zampella A. (2008). Jaspamides H–L, new actin-targeting depsipeptides from the
sponge Jaspis splendens. Tetrahedron, 64, 7127–7130.
Gala F., D’Auria M.V., De Marino S., Sepe V., Zollo F., Smith C.D., Keller S.N.,
Zampella A. (2009). Jaspamides M–P: new tryptophan modified jaspamide
derivatives from the sponge Jaspis splendens. Tetrahedron, 65, 51–56.
Garces C.A., Kurenova E.V., Golubovska V.M., Cance W.G. (2006). Vascular endothelial
growth factor receptor-3 and focal adhesion kinase bind and suppress apoptosis in
breast cancer cells. Cancer Res., 66, 1446–1454.
Garcia E.E., Benjamin L.E., Ian Fryer R. (1973). Reinvestigation into the structure of
oroidin, a bromompyrrole derivatives from marine sponge. J. Chem. Soc., Chem.
Comm., 78–79.
Georges P., Sylvestre M., Ruegger H., Bourgeois P. (2006). Ketosteroids and
hydroxyketosteroids, minor metabolites of sugarcane wax. Steroids, 71, 647–652.

References
195
Groweiss A., Newcomer J.J., O’Keefe B.R., Blackman A., Boyd M.R. (1999). Cytotoxic
metabolites from an Australian collection of the sponge Jaspis species. J. Nat. Prod.,
62, 1691–1693.
Gunasekera S.P., Cranick S., Longley R.E. (1989). Immunosuppressive compounds from a
deep water marine sponge, Agelas flabelliformis. J. Nat. Prod., 52, 757–761.
Halkier B.A., Gershenzon J. (2006). Biology and biochemistry of glucosinolates. Ann. Rev.
Plant Biol., 57, 303–333.
Han Y.S., van der Heijden R., Lefeber A.W.M., Erkelens C., Verpoorte R. (2002).
Biosynthesis of anthraquinones in cell cultures of Cinchona ‘Robusta’ proceeds via
the methylerythritol 4-phosphate pathway. Phytochemistry, 59, 45–55.
Handy S., Zhang Y. (2006). Regioselective couplings of dibromopyrrole esters. Synthesis,
2006, 3883–3887.
Harborne J.B.,Williams C.A. (1976). Occurrence of sulfated flavones and caffeic acid
esters in members of the fluviales. Biochem. Syst. Ecol., 4, 37–44.
Hassan W., Elkhayat E., Edrada R., Ebel R., Proksch P. (2007). New bromopyrrole
alkaloids from the marine sponges Axinella damicornis and Stylissa flabelliformis.
Nat. Prod. Commun., 2, 1–6.
Hofer M.D., Fecko A., Shen R., Setlur S.R., Pienta K.G., Tomlins S.A., Chinnaiya A.M.,
Rubin M.A. (2004). Expression of the platelet-derived growth factor receptor in
prostate cancer and treatment implications with tyrosine kinase inhibitors. Neoplasia,
6, 503–512.
Hong T.W., Jimenez D.R., Molinski T.F. (1998). Agelastatins C and D, new pentacyclic
bromopyrroles from the sponge Cymbastela sp., and potent anthropod toxicity of (–)-
agelastatin A. J. Nat. Prod., 61, 158–161.
Hu J., Peng J., Kazi A., Kelly M., Hamann M. (2005). Bromopyrrole alkaloids from the
Jamaican sponge Didiscus oxeata. J. Chem. Res., 7, 427–428.
Inaba K., Sato H., Tsuda M., Kobayashi J. (1998). Spongiacidins A–D, new bromopyrrole
alkaloids from Hymeniacidon sponge. J. Nat. Prod., 61, 693–695.
Inman W., Crews P. (1989). Novel marine sponge derived amino acids, 8. conformational
analysis of jasplakinolide. J. Am. Chem. Soc., 111, 2822–2829.
Iseki H., Ko T.C., Xue X.Y., Seapan A., Townsend C.M.Jr. (1998). A novel strategy for
inhibiting growth of human pancreatic cancer cells by blocking cyclin dependent
kinase activity. J. Gastrointest. Surg., 2, 36–43.

References
196
Izeradjene K., Douglas L., Delaney A., Houghton J.A. (2004). Influence of casein kinase II
in tumor necrosis factor-related apoptosis-inducing ligand-induced apoptosis in
human rhabdomyosarcoma cells. Clin. Cancer Res., 10, 6650–6660.
Jayatilake G.S., Thornton M.P., Leonard A.C., Grimwade J.E., Baker B.J. (1996).
Metabolites from an Antarctic sponge-associated bacterium, Pseudomonas
aeruginosa. J. Nat. Prod., 59, 293–296.
Jensen P.R., Jenkins K.M., Porter D., Fenical W. (1998). Evidence that a new antibiotic
flavone glycoside chemically defends the Seagrass Thalassia testudinum against
zoosporic fungi. Appl. Environ. Microbiol., 64, 1490–1496.
Kahn M., Nakanishi H., Su T., Lee J.H., Johnson M. (1991). Design and synthesis of
nonpeptide mimetics of jaspamide. Int. J. Pept. Protein Res., 38, 324–334.
Kalli K.R., Falowo O.I., Bale L.K., Zschunke M.A., Roche P.C., Conover C.A. (2002).
Functional insulin receptors on human epithelial ovarian carcinoma cells:
Implications for IGF-II mitogenic signaling. Endocrinology, 143, 3259–3267.
Karin M. (2006). Nuclear factor-�B in cancer development and progression. Nature, 441,
431–436.
Keen N., Taylor S. (2004). Aurora-kinase inhibitors as anticancer agents. Nature Rev.
Cancers, 4, 927–936.
Keifer P.A., Schwartz R.E., Koker M.E.S., Hughes R.G., Jr., Rittschof D., Rinehart K.L.
(1991). Bioactive bromopyrrole metabolites from the Caribbean sponge Agelas
conifera. J. Org. Chem., 56, 2965–2975.
Kent R.A., Smith I.R., Sutherland M.D. (1970). Pigments of marine animals. X.
Substituted naphthopyrones from the crinoid Comantheria perplexa. Aust. J. Chem.,
23, 2325–2335.
Kimura Y., Kozawa M., Baba K., Hata K. (1983). New constitutents of roots of
Polygonum cuspidatum. Planta Med., 48, 164–168.
Kitagawa I., Kobayashi J., Kitanaka K., Kido M., Kyogoku Y. (1983). Marine natural
products. XII. On the chemical constituents of the Okinawan marine sponge
Hymeniacidon aldis. Chem. Pharm. Bull., 3, 2321–2328.
Kitagawa I., Kobayashi M., Kitanaka K., Kido M., Kyogoku Y. (1983). Marine natural
products. XII. On the chemical constituents of the Okinawan marine sponge
Hymeniacidon aldis. Chem. Pharm. Bull., 31, 2321–2328.
Kobayashi J., Murata O., Shigemori H., Sasaki T. (1993). Jaspisamides A–C, new
cytotoxic macrolides from the Okinawan marine sponge Jaspis sp. J. Nat. Prod., 56,
787–791.

References
197
Kobayashi J., Ohizumi Y., Nakamura H., Hirata Y., Wakamatsu K., Miyazawa T. (1986).
Hymenine, a novel �-adrenoceptor blocking agent from the Okinawan marine sponge
Hymeniacidon sp. Experientia, 42, 1064–1065.
Kobayashi J., Yuasa K., Kobayashi T., Sasaki T., Tsuda M. (1996). Jaspiferals A–G, new
cytotoxic isomalabaricane-type nortriterpenes from Okinawan marine sponge Jaspis
stellifera. Tetrahedron, 52, 5745–5750.
König G., Wright A., Linden A. (1998). Antiplasmodial and cytotoxic metabolites from the
Maltese sponge Agelas oroides. Planta Medica, 64, 443–447.
König G.M., Wright A.D. (1996). Marine natural products research: current directions and
future potential. Planta Medica, 62, 193–211.
Kontiza I., Abatis D., Malakate K., Vagias C., Roussis V. (2006). 3-Ketosteroids from the
marine organisms Dendrophyllia cornigera and Cymodocea nodosa. Steroids, 71,
177–181.
Kopriva S., Wiedemann G., Reski R. (2007). Sulfate assimilation in basal land plants–what
does genomic sequencing tell us? Plant Biol., 9, 556–564.
Kusakai G., Suzuki A., Ogura T., Miyamoto S., Ochiai A., Kaminishi M., Esumi H. (2004).
ARK5 expression in colorectal cancer and its implications for tumor progression. Am.
J. Pathol., 164, 987–995.
Lee J.W., Soung Y.H., Kim S.Y., Park W.S., Nam S.W., Kim S.H., Lee J.Y., Yoo N.J.,
Lee S.H. (2005). ERBB2 kinase domain mutation in a gastric cancer metastasis.
APMIS, 113, 683–687.
Lee N.K., Kim Y.H. (1995). New cytotoxic anthraquinones from the crinoid Ptilometra:
1’-deoxyrhodoptilometrin-6-O-sulfate and rhodoptilometrin-6-O-sulfate. Bull.
Korean Chem. Soc., 16, 1011–1013.
Li C.-J., Schmitz F.J., Kelly-Borges M. (1998). A new lysine derivative and new 3-
bromopyrrole carboxylic acid derivative from two marine sponges. J. Nat. Prod., 61,
387–389.
Li D., Zhu J., Firozi P., Abbruzzesse J.L., Evans D.B., Cleary K., Fries H., Sen S. (2003).
Overexpression of oncogenic STK15/BTAK/Aurora A kinase in human pancreatic
cancer. Clin. Cancer Res., 9, 991–997.
Lidgren G., Bohlin L., Christophersen C. (1988). Studies of Swedish marine organisms,
Part X. Biologically active compounds from the marine sponge Geodia baretti. J.
Nat. Prod., 51, 1277–1280.
Lindquist N., Hay M.E., Fenical W. (1992). Defense of ascidians and their conspicuous
larvae, Adults versus Larval chemical defenses. Ecol. Monogr., 62, 547–568.

References
198
Linington R.G., Williams D.E., Tahir A., van Soest R., Andersen R.J. (2003). Latonduines
A and B, new alkaloids isolated from the marine sponge Stylissa carteri: structure
elucidation, synthesis, and biogenetic implications. Org. Lett., 5, 2735–2738.
Lu Y., Foo L.Y. (2000). Flavonoid and phenolic glycosides from Salvia officinalis.
Phytochemistry, 55, 263–267.
Luca P.D., Rosa M.D., Minale L., Sodano G. (1972). Marine sterols with a new pattern of
side chain alkylation from the sponge Aplysina (= Verongia) aerophoba. J. Chem.
Soc. Perkin Trans. I, 2132–2135.
Macmillan J.C., Hudson J.W., Bull S., Dennis J.W., Swallow C.J. (2001). Comparative
expression of the mitotic regulators SAK and PLK in colorectal cancer. Annals of
Surgical Oncology, 8, 729–740.
Mancini I., Guella G., Amade P., Roussakis C., Pietra F. (1997). Hanishin, a semiracemic,
bioactive C9 alkaloid of the Axinellid sponge Acanthella carteri from the Hanish
Islands. A shunt metabolite? Tetrahedron Letters, 38, 6271–6274.
Martinez A., Castro A., Dorronsoro I., Alonso M. (2002). Glycogen synthase kinase (GSK-
3) inhibitors as new promising drugs for diabetes, neurodegeneration, cancer and
inflammation. Med. Res. Rev., 22, 373–384.
Mattia C.A., Mazzarella L., Puliti R. (1982). 4-(2-Amino-4-oxo-2-imidazolin-5-ylidene)-2-
bromo-4,5,6,7-tetrahydropyrrolo-[2,3-C] azepine -8-one Methanol solvate–a new
bromo compound from the sponge Acanthella aurantiaca. Acta Crystallogr., Sec B,
Struct. Sci., 38, 2513–2515.
Mayer A.M.S., Glaser K.B., Cuevas C., Jacobs R.S., Kem W., Little R.D., McIntosh J.M.,
Newman D.J., Potts B.C., Shuster D.E. (2010). The odyssey of marine
pharmaceuticals: a current pipeline perspective. Trends Pharmacol. Sci., 31, 255–
265.
McMillan C., Zapata O., Escobar L. (1980). Sulfated phenolic compounds in seagrasses.
Aquat. Bot., 8, 267–278.
Meijer L., Thunnissen A.M.W.H., White A.W., Garnier M., Nikolic M., Tsai L.H., Walter
J., Cleverley K.E., Salinas P.C., Wu Y.Z., Biernat J., Mandelkow E.M., Kim S.H.,
Pettit G.R. (2000). Inhibition of cyclin-dependent kinases, GSK-3 beta and CK1 by
hymenialdisine, a marine sponge constituent. Chem. Biol., 7, 51–63.
Ménard R., Alban S., de Ruffray P., Jamois F., Franz G., Fritig B., Yvin J.C., Kauffmann S.
(2004). �-1,3 Glucan sulfate, but not �-1,3 glucan, induces the salicylic acid
signaling pathway in tobacco and Arabidopsis. Plant Cell, 16, 3020–3032.

References
199
Menezes D.E.L., Peng J., Garrett E.N., Louie S.G., Lee S.H., Wiesmann M., Tang Y.,
Shephard L., Goldbeck C., Oei Y., Ye H., Aukerman S.L., Heise C. (2005). CHIR-
258: A potent inhibitor of FLT3 kinase in experimental tumor xenograft models of
human acute myelogenous leukemia. Clin. Cancer Res., 11, 5281–5291.
Miller F.A., Dioxon G.J. Sloan B.J., Mclean I.W. (1968). Antimicrobial agents and
chemotherapy. Am. Soc. Microbiol., p. 136.
Mishra S.K., Satpathy S.K., Mohanty S. (1999). Survey of malaria treatment and deaths.
Bull. World Health Organ., 77, 1020.
Molinski T.F., Dalisay D.S., Lievens S.L., Saludes J.P. (2009). Drug development from
marine natural products. Nature Rev. Drug Discovery, 8, 69–86.
Nagai H., Murata M., Torigoe K., Satake M., Yasumoto T. (1992). Gambieric acids: new
potent antifungal substances with unprecedented polyether structures from a marine
dinoflagellate Gambierdiscus toxicus. J. Org. Chem., 57, 5448–5453.
National Cancer Institute. (22 November 2005). Mutations in gliboblastoma in multiforme
predict responsed to target therapies. NCI Cancer Bulletin (online), 2(45).
Neeman I., Fishelson L., Kashmann Y. (1975). Isolation of new toxin from the sponge
Lantrunculia magnifica in the Gulf of Aquapa (Red Sea). Mar. Biol., 30, 293–296.
Newman D.J., Cragg G.M. (2004). Advanced preclinical and clinical trials of natural
products and related compounds from marine sources. Curr. Med. Chem., 11, 1693–
1713.
Newman D.J., Cragg G.M., Sander K.M. (2000). The influence of natural products upon
drug discovery. Nat. Prod. Rep., 17, 215–234.
Nikoulina S.E., Ciaraldi T.P., Mudaliar S., Mohideen P., Carter L., Henry R.R. (2000).
Potential role of glycogen synthase kinase-3 in skeletal muscle insulin resistance of
type 2 diabetes. Diabetes, 49, 263–271.
Ohnishi K., Tanabe H., Hayashi S., Suemitsu R. (1992). Biosynthesis of alterporriol A by
Alternaria porri. Biosci. Biotech. Biochem., 56, 42–43.
Ohta S., Kobayashi H., Ikegami S. (1994). Jaspisin, a novel styryl sulfate from the marine
sponge, Jaspis species. Biosci. Biotech. Biochem., 58, 1752–1753.
Ohtani I., Kusumi T., Kashman Y., Kakisawa H. (1991). High-field FT NMR application
of Mosher’s method. The absolute configurations of marine terpenoids. J. Am. Chem.
Soc., 113, 4092–4096.
Ouyang B., Knauf J.A., Smith E.P., Zhang L., Ramsey T., Yusuff N., Batt D., Fagin J.A.
(2006). Inhibitors of Raf kinase activity block growth of thyroid cancer cells with
RET/PTC or BRAF mutations in vitro and in vivo. Clin. Cancer Res., 12, 1785–1793.

References
200
Park Y., Liu Y., Hong J., Lee C.-O., Cho H., Kim D.-K., Im K.S., Jung J.H. (2003). New
bromotyrosine derivatives from an association of two sponges, Jaspis wondoensis
and Poecillastra wondoensis. J. Nat. Prod., 66, 1495–1498.
Patel J., Pelloux-Léon N., Minassian F., Vallée Y. (2005). Syntheses of S-enantiomers of
hanishin, longamide B, and longamide B methyl ester from L-aspartic acid �-methyl
ester: establishment of absolute stereochemistry. J. Org. Chem., 70, 9081–9084.
Pawlik J.R. (1993). Marine invertebrate chemical defenses. Chem. Rev., 93, 1911–1922.
Pettit G., Herald C., Leet J., Gupta R., Schaufelberger D., Bates R., Clewlow P., Doubek
D., Manfredi K., Rützler K., Schmidt J., Tackett L., Ward F., Bruck M., Camou F.
(1990). Antineoplastic agents. 168. Isolation and structure of axinohydantoin. Can. J.
Chem., 68, 1621–1624.
Pettit G.R., Cichacz Z.A., Gao F., Herald C.L., Boyed M.R., Schmidt J.M., Hooper J.N.A.
(1993). Isolation and structure of spongistatin 1. J. Org. Chem., 58, 1302–1304.
Pettit G.R., Herald C.L., Doubex D.L., Herald D.L. (1982). Isolation and structure of
bryostatin 1. J. Am. Chem. Soc., 104, 6846–6848.
Powell V.H., Sutherland M.D. (1967). Pigments of marine animals. VI. Anthraquinoid
pigments of the crinoids Ptilometra australis Wilton and Tropiometra afra Hartlaub.
Aust. J. Chem., 20, 541–553.
Proksch P., Ebel R. (1998). Ecological significance of alkaloids from marine invertebrates
alkaloids, biochemistry, ecology and medicinal application, Edited by Margaret F.
Roberts and Michael Wink, Plenum Publishing, 379–394.
Proksch P., Edrada R.A., Ebel, R. (2002). Drugs from the seas—current status and
microbiological implications. Appl. Microbiol. Biotechnol., 59, 125–134.
Qiao H., Hung W., Tremblay E., Wojcik J., Gui J., Ho J., Klassen J., Campling B., Elliot B.
(2002). Constitutive activation of met kinase in non-small-cell lung carcinomas
correlates with anchorage-independent cell survival. J. Cell Biochem., 86, 665–677.
Ravi B.N., Wells R.J., Croft K.D. (1981). Malabaricane triterpenes from a Fijian collection
of the sponge Jaspis stellifera. J. Org. Chem., 46, 1998–2001.
Rideout J.A., Smith N.B., Sutherland M.D. (1979). Chemical defense of crinoids by
polyketide sulfates. Experientia, 35, 1273–1274.
Rinehart K.L., Gloer J.B., Cook J.C., Mizsak S.A., Scahill T.A. (1981). Structures of the
didemnins antiviral and cytotoxic depsipeptides from a Caribbean tunicate. J. Am.
Chem. Soc., 103, 1857–1859.
Rinehart K.L., Kobayashi J., Harbour G.C., Hughes R.G., Jr., Mizsak S.A., Scahill T.A.
(1984). Eudistomins C, E, K, and L potent antiviral compounds containing a novel

References
201
oxathiazepine ring from the Caribbean tunicate Eudistoma olivaceum. J. Am. Chem.
Soc., 106, 1524–26.
Rodriguez J., Nieto R.M., Crews P. (1993). New structures and bioactivity patterns of
bengazole alkaloids from a choristid marine sponge. J. Nat. Prod., 56, 2034–2040.
Rowley D.C., Hansen M.S.T., Rhodes D., Sotriffer C.A., Ni H., McCammon J.A.,
Bushman F.D., Fenical W. (2002). Thalassiolins A–C: new marine-derived inhibitors
of HIV cDNA integrase. Bioorg. Med. Chem., 10, 3619–3625.
Rubinstein I., Goad L.J. (1974). Occurence of (24S)-24-methylcholesta-5,22-dien-3�-ol in
the diatom Phaeodactylum tricornutum. Phytochemistry, 13, 485–487.
Rudi A., Kashman Y., Benayahu Y., Schleyer M. (1994). Amino acid derivatives from the
marine sponge Jaspis digonoxea. J. Nat. Prod., 57, 829–832.
Sakuma Y., Tanaka J., Higa T. (1987). New naphthopyrone pigments from the crinoid
Comanthus parvicirrus. Aust. J. Chem., 40, 1613–1616.
Sakurai M., Kohno J., Yamamoto K., Okuda T., Nishio M., Kawano K., Ohnuki T. (2002).
TMC-256A1 and C1, new inhibitors of IL-4 signal transduction produced by
Aspergillus niger var niger TC 1629. J. Antibiotics, 55, 685–692.
Schmitz K.J., Grabellus F., Callies R., Otterbach F., Wohlschlaeger J., Levkau B., Kimmig
R., Schmid K.W., Baba H.A. (2005). High expression of focal adhesion kinase
(p125FAK) in node-negative breast cancer is related to overexpression of HER-2/neu
and activated Akt kinase but does not predict outcome. Breast Cancer Res., 7, R194–
R203.
Scott V.R., Boehme R., Matthews T.R. (1988). New class of antifungal agents:
jasplakinolide, a cyclodepsipeptide from the marine sponge, Jaspis species.
Antimicrob. Agents Chemother., 32, 1154–1157.
Searle P.A., Richter R.K., Molinski T.F. (1996). Bengazoles C–G from the sponge Jaspis
sp. synthesis of the side chain and determination of absolute configuration. J. Org.
Chem., 61, 4073–4079.
Sharma G., Magdoff-Fairchild B. (1977). Natural products of marine sponges. 7. The
constitution of weakly basic guanidine compounds, dibromophakellin and
monobromophakellin. J. Org. Chem., 42, 4118–4124.
Sharma G.M., Buyer J.S., Pomerantz M.W. (1980).Characterization of a yellow compound
isolated from the marine sponge Phakellia flabellata. J. Chem. Soc. Chem. Commun.,
435–436.
Sharma V., Lansdell T.A., Jin G., Tepe J.J. (2004). Inhibition of cytokine production by
hymenialdisine derivatives. J. Med. Chem., 47, 3700–3703.

References
202
Sheikh Y.M., Djerassi C. (1974). Steroids from sponges. Tetrahedron, 30, 4095–4103.
Shinde P.B., Lee Y.M., Dang H.T., Hong J., Lee C.-O., Jung J.H. (2008). Cytotoxic
bromotyrosine derivatives from a two-sponge association of Jaspis sp. and
Poecillastra sp. Bioorg. Med. Chem. Lett., 18, 6414–6418.
Smith I.R., Sutherlan M.D. (1971). Pigments of marine animals. XI. Angular
naphthopyrones from the crinoids Comanthus parvicirrus timorensis. Aust. J. Chem.,
24, 1487–1499.
Sourvinos G., Tsatsanis C., Spandidos D.A. (1999). Overexpression of the Tpl-2/Cot
oncogene in human breast cancer. Oncogene, 18, 4968–4973.
Staal S.P. (1987). Molecular cloning of the akt oncogene and its human homologues AKT1
and AKT2: Amplification of AKT1 in a primary human gastric adenocarcinoma,
Proc. Natl. Acad. Sci. USA, 84, 5034–5037.
Stoessl A., Unwin C.H., Stothers J.B. (1983). On the biosynthesis of some polyketide
metabolites in Alternaria solani. 13C and 2Hmr studies. Can. J. Chem., 61, 372–377.
Su B.N., Park E.J., Mbwambo Z.H., Santarsiero B.D., Mesecar A.D., Fong H.H.S.,
Pezzuto J.M., Kinghorn A.D. (2002). New chemical constituents of Euphorbia
quinquecostata and absolute configuration assignment by a convenient Mosher ester
procedure carried out in NMR tubes. J. Nat. Prod., 65, 1278–1282.
Suemitsu R., Ohnishi K., Yanagawase S., Yamamoto K., Yamada Y. (1989). Biosynthesis
of macrosporin by Alternaria porri. Phytochemistry, 28, 1621–1622.
Supriyono A., Schwarz B., Wray V., Witte L., Müller W.E.G., van Soest R.W.M.,
Sumaryono W., Proksch P. (1995). Bioactive alkaloids from the tropical marine
sponge Axinella carteri. Z. Naturforsch. C, J. Biosci., 50c, 669–674.
Sutherland M.D., Wells J.W. (1967). Pigments of marine animals. IV. The anthraquinoid
pigments of the crinoids, Comatula pectinata and C. cratera A.H. Clark. Aust. J.
Chem., 20, 515–533.
Tannert R., Hu T.-S., Arndt H.-D., Waldmann H. (2009). Solid-phase based total synthesis
of jasplakinolide by ring-closing metathesis. Chem. Commun., 2009, 1493–1495.
Thale Z., Kinder F.R., Bair K.W., Bontempo J., Czuchta A.M., Versace R.W., Philips P.E.,
Sanders M.L., Wattanasin S., Crews P. (2001). Bengamides revisited: new structures
and antitumor studies. J. Org. Chem., 66, 1733–1741.
Travert N., Al-Mourabi A. (2004). A likely biogenetic gateway linking 2-
aminoimidazolinone metabolites of sponges to proline: spontaneous oxidative
conversion of the pyrrole-proline-guanidine pseudo-peptide to dispacamide A. J. Am.
Chem. Soc., 126, 10252–10253.

References
203
Truchet G., Roche P., Lerouge P., Vasse J., Camut S., de Billy F., Promé J.C., Dénarié J.
(1991). Sulfated lipo-oligosaccharide signals of Rhizobium meliloti elicit root nodule
organogenesis in alfalfa. Nature, 351, 670–673.
Tsevegsuren N., Edrada R.A., Lin W., Ebel R., Torre C., Ortlepp S., Wray V., Proksch P.
(2007). Biologically active natural products from Mongolian medicinal plants
Scorzonera divaricata and Scorzonera pseudodivaricata. J. Nat. Prod., 70, 962–967.
Tsuda M., Ishibashi M., Agemi K., Sasaki T., Kobayashi J. (1991). Stelliferins A–F, new
antineoplastic isomalabaricane triterpenes from the Okinawan marine sponge Jaspis
stellifera. Tetrahedron, 47, 2181–2194.
Tsukamoto S., Kato H., Hirota H., Fusetani N. (1994). Narains: N,N-dimethylguanidinium
styryl sulfates, metamorphosis inducers of ascidian larvae from a marine sponge
Jaspis sp. Tetrahedron Lett., 35, 5873–5874.
Uemoto H., Tsuda M., Kobayashi J. (1999). Mukanadin A–C, new bromopyrrole alkaloids
from marine sponge Agelas nakamurai. J. Nat. Prod., 62, 1581–1583.
Umeyama A., Ito S., Yuasa E., Arihara S., Yamada T. (1998). A new bromopyrrole
alkaloid and the optical resolution of the racemate from the marine sponge
Homaxinella sp. J. Nat. Prod., 61, 1433–1434.
Varin L., Marsolais F., Richard M., Rouleau M. (1997). Biochemistry and molecular
biology of plant sulfotransferases. FASEB J., 11, 517–525.
Walker R.P., Faulkner D.J. (1981). Sceptrin, an antimicrobial agent from the sponge
Agelas sceptrum. J. Am. Chem. Soc., 103, 6772–6773.
Weichert W., Schmidt M., Gekeler V., Denkert C., Stephan C., Jung K., Loening S., Dietel
M., Kristiansen G. (2004). Polo-like kinase 1 is overexpressed in prostate cancer and
linked to higher tumor grades. Prostate, 60, 240–245.
Wender P.A., Hinkle K.W., Koehler M.F.T., Lippa, B. (1999). The rational design of
potential chemotherapeutic agents: synthesis of bryostatin analogues. Med. Res. Rev.,
19, 388–407.
Whitehead R. (1999). Natural Product Chemistry. Ann. Rep. Prog. Chem. Sec., 95B, 183–
205.
Williams D.H., Faulkner D.J. (1996). Isomers and tautomers of hymenialdisine and
debromohymenialdisine. Nat. Prod. Lett., 9, 57–64.
Wilson D.M., Puyama M., Fenical W., Pawlik J.R. (1999). Chemical defense of the
Caribbean reef sponge Axinella corrugata against predatory fishes. J. Chem. Ecol.,
25, 2811–2823.

References
204
Wolfender J.L., Queiroz E.F., Hostettmann K. (2005). Phytochemistry in the microgram
domain – a LC-NMR perspective. Magn. Reson. Chem., 43, 697–709.
Wright J.L.C., McInnes A.G., Shimizu S., Smith D.G., Walter J.A., Idler D., Khalil W.
(1978). Identification of C-24 alkyl epimers of marine sterols by 13C nuclear
magnetic resonance spectroscopy. Can. J. Chem., 56, 1898–1903.
Xia G., Kumar S.R., Masood R., Zu S., Reddy R., Krasnaperov V., Quinn D.I., Henshal
S.M., Sutherland R.L., Pinski J.K., Daneshmand S., Buscarini M., Stein J.P., Zong C.,
Broek D., Roy-Burman P., Gill P.S. (2005). EphB4 expression and biological
significance in prostate. Cancer Res., 65, 4623–4632.
Xu Y.-Z., Yakushijin K., Horne D.A. (1997). Synthesis of C11N5 marine sponge alkaloids:
(±)-hymenine, stevensine, hymenialdisine, and debromohymenialdisine. J. Org.
Chem., 62, 456–464.
Yu Q., Sicinska E., Geng Y., Ahnstrom M., Zagozdzou A., Kong Y., Gardner H.,
Kiyokawa H., Harris L.N., Stal O., Sicinski P. (2006). Requirement for CDK4 kinase
function in breast cancer. Cancer cell, 9, 23–32.
Zabriskie T.E., Klocke J.A., Ireland C.M., Marcus A.H., Molinski T.F., Faulkner D.J., Xu
C., Clardy J.C. (1986). Jaspamide, a modified peptide from a Jaspis sponge, with
insecticidal and antifungal activity. J. Am. Chem. Soc., 108, 3123–3124.
Zabriskie T.M., Ireland C.M. (1989). The isolation and structure of modified bioactive
nucleosides from Jaspis johnstoni. J. Nat. Prod., 52, 1353–1356.
Zhang X., Yee D. (2000). Tyrosine kinase signaling in breast cancer: Insulin-like growth
factors and their receptors in breast cancer. Breast Cancer Res., 2, 170–175.

Abbreviations
205
7. List of abbreviations
� �20D� Specific rotation at the sodium D-line
br Broad singnal
CDCl3 Deuterated chloroform
CHCl3 Chloroform
CI Chemical ionization
COSY Correlation spectroscopy
d Doublet signal
DCM Dichloromethane
dd Doublet of doublet signal
DEPT Distortionless enhancement by polarization transfer
DMSO Dimethyl sulfoxide
DPPH 2,2-Diphenyl-1-picryl-hydrazyl
ED Effecive dose
EI Electron impact ionization
ESI Electron spray ionization
et al. et altera (and others)
EtOAc Ethyl acetate
eV Electron Volt
FAB Fast atom bombardment
g Gram
HMBC Heteronuclear multiple bond connectivity
HMQC Heteronuclear multiple quantum coherence
H2O Water
HPLC High performance liquid chromatography
hr Hour
HR-MS High resolution-mass spectrometry
Hz Hertz
L Liter
LC Liquid chromatography
LC-MS Liquid chromatography-mass spectrometry
m Multiplet signal
MeOD Deuterated methanol
MeOH Methano

Abbreviations
206
mg Milligram
MHz Mega Hertz
min Minute
mL Milliliter
MS Mass spectrometry
MTT Microculture tetrazolium assay
m/z Mass per charge
μg Microgram
μL Microliter
μM Micromolar
ng Nanogram
NMR Nuclear magnetic resonance
NOE Nuclear Overhauser effect
NOESY Nuclear Overhauser and exchange spectroscopy
q Quartet signal
ROESY Rotating frame Overhauser enhancement spectroscopy
RP 18 Reversed phase C 18
s Singlet signal
t Triplet signal
TFA Trifluoroacetic acid
TLC Thin layer chromatography
UV Ultra-violet
VLC Vaccum liquid chromatography
n-BuOH n-Butanol

Attachements
207
8. Attachments
Attachment 1. 1H NMR spectrum of acanthamide A (1).
Attachment 2. 1H NMR spectrum of acanthamide B (2).
Attachment 3. 1H NMR spectrum of acanthamide C (3).

Attachements
208
Attachment 4. 1H NMR spectrum of acanthamide D (4).
Attachment 5. 1H NMR spectrum of methyl 3,4-dibromo-1H-pyrrole-2-carboxylate (5).
Attachment 6. 13C NMR spectrum of methyl 3,4-dibromo-1H-pyrrole-2-carboxylate (5).

Attachements
209
Attachment 7. 1H NMR spectrum of 3,5-dibromo-1H-pyrrole-2-carboxylic acid (6).
Attachment 8. 13C NMR spectrum of 3,5-dibromo-1H-pyrrole-2-carboxylic acid (6).
Attachment 9. 1H NMR spectrum of 4,5-dibromo-N-(methoxymethyl)-1H-pyrrole-2-
carboxamide (7).

Attachements
210
Attachment 10. 1H NMR spectrum of 4,5-dibromo-1H-pyrrole-2-carboxamide (8).
Attachment 11. 13C NMR spectrum of 4,5-dibromo-1H-pyrrole-2-carboxamide (8).
Attachment 12. 1H NMR spectrum of mukanadin D (9).

Attachements
211
Attachment 13. 1H NMR spectrum of (±)-longamide B methyl ester (10).
Attachment 14. 13C NMR and DEPT spectra of (±)-longamide B methyl ester (10).

Attachements
212
Attachment 15. 1H NMR spectrum of (±)-longamide B (11).
Attachment 16. 13C NMR spectrum of (±)-longamide B (11).
Attachment 17. 1H NMR spectrum of (±)-longamide (12).

Attachements
213
Attachment 18. 13C NMR spectrum of (±)-longamide (12).
Attachment 19. 1H NMR spectrum of 3,4-dibromo-1H-pyrrole-2-carboxamide (13).
Attachment 20. 1H NMR spectrum of 2-cyano-4,5-dibromo-1H-pyrrole (14).

Attachements
214
Attachment 21. 1H NMR spectrum of ethyl 3,4-dibromo-1H-pyrrole-2-carboxylate (15).
Attachment 22. 13C NMR and DEPT of ethyl 3,4-dibromo-1H-pyrrole-2-carboxylate (15).

Attachements
215
Attachment 23. 1H NMR spectrum of 4-bromo-1H-pyrrole-3-carboxamide (16).
Attachment 24. 1H NMR spectrum of 3,4-dibromo-1H-pyrrole-2-carboxamide (17).
Attachment 25. 1H NMR spectrum of (-)-longamide B methyl ester (18).

Attachements
216
Attachment 26. 1H NMR spectrum of (-)-longamide B ethyl ester, hanishin (19).
Attachment 27. 1H NMR spectrum of (-)-longamide B (31).
Attachment 28. 1H NMR spectrum of aldisine (20).

Attachements
217
Attachment 29. 1H NMR spectrum of 2,3-dibromoaldisine (21).
Attachment 30. 1H NMR spectrum of 2-bromoaldisine (22).
Attachment 31. 1H NMR spectrum of 3-bromoaldisine (23).

Attachements
218
Attachment 32. 1H NMR spectrum of (-)-mukanadin C (24).
Attachment 33. 1H NMR spectrum of (-)-longamide (25).
Attachment 34. 1H NMR spectrum of latonduine A (26).

Attachements
219
Attachment 35. 1H NMR spectrum of (-)-dibromophakellin H+Cl- (27).
Attachment 36. 1H NMR spectrum of (-)-monobromoisophakellin (28).
Attachment 37. 1H NMR spectrum of (-)-dibromocantharelline (32).

Attachements
220
Attachment 38. 1H NMR spectrum of (-)-hymenine (29).
Attachment 39. 1H NMR and 13C NMR spectra of dispacamide E (30).

Attachements
221
Attachment 40. 1H NMR spectrum of (10Z)-debromohymenialdisine (33).
Attachment 41. 1H NMR spectrum of spongiacidin B (34).
Attachment 42. 1H NMR spectrum of (10Z)-hymenialdisine (35).
Attachment 43. 1H NMR spectrum of (10Z)-3-bromohymenialdisine (36).

Attachements
222
Attachment 44. 1H NMR spectrum of jaspamide (37).
Attachment 45. 1H NMR spectrum of jaspamide Q (38).
Attachment 46. 1H NMR spectrum of jaspamide R (39).

Attachements
223
Attachment 47. 1H NMR spectrum of 6ß-hydroxy-24-methylcholesta-4,22-dien-3-one (40).
Attachment 48. 13C NMR spectrum of 6ß-hydroxy-24-methylcholesta-4,22-dien-3-one (40).
Attachment 49. 1H NMR spectrum of 6ß-hydroxy-24-methylcholesta-4-en-3-one (41).

Attachements
224
Attachment 50. 13C NMR and DEPT spectra of 6ß-hydroxy-24-methylcholesta-4-en-3-one (41).
Attachment 51. 1H NMR spectrum of 6ß-hydroxy-24-ethylcholesta-4-en-3-one (42).

Attachements
225
Attachment 52. 13C NMR and DEPT spectra of 6ß-hydroxy-24-ethylcholesta-4-en-3-one (42).
Attachment 53. 1H NMR spectrum of maculosin-1 (cyclo-L-Pro-L-Tyr) (43).

Attachements
226
Attachment 54. APT spectrum of maculosin-1 (cyclo-L-Pro-L-Tyr) (43).
Attachment 55. 1H NMR spectrum of sangivamycin (44).
Attachment 56. APT spectrum of sangivamycin (44).

Attachements
227
Attachment 57. 1H NMR spectrum of thalassiolin A(45).
Attachment 58. 1H NMR spectrum of thalassiolin C (46).
Attachment 59. 1H NMR spectrum of luteolin 3’-O-glucuronide (47).
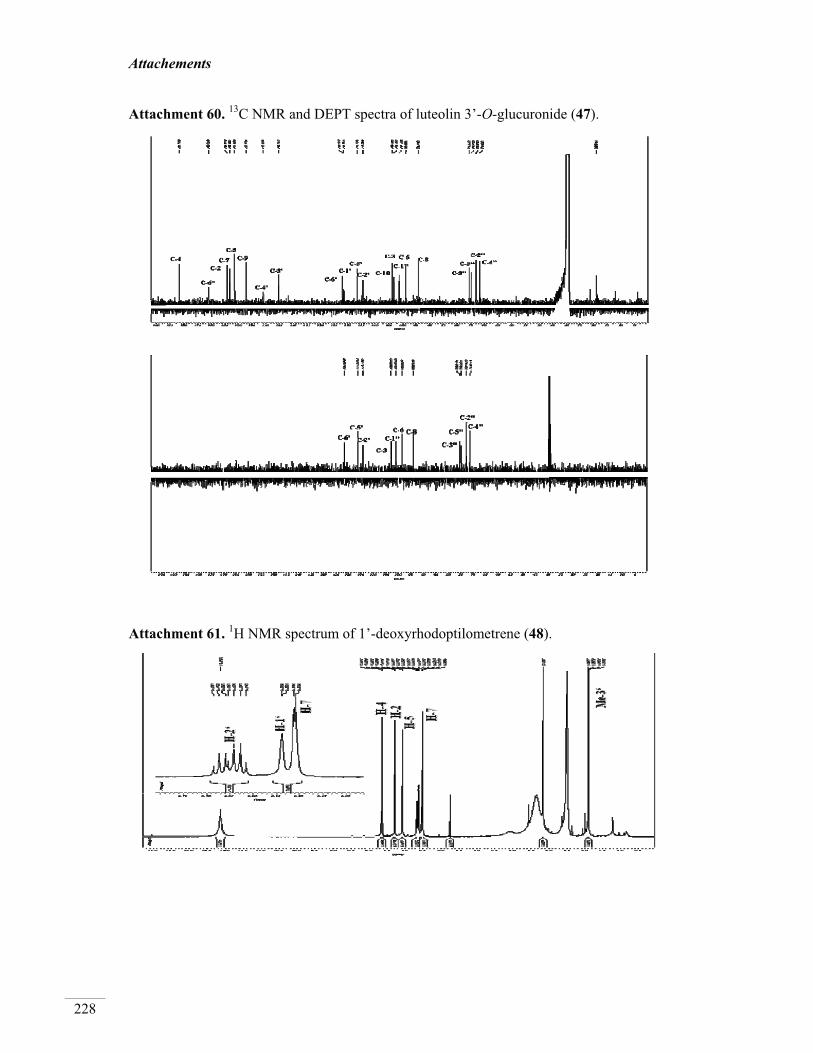
Attachements
228
Attachment 60. 13C NMR and DEPT spectra of luteolin 3’-O-glucuronide (47).
Attachment 61. 1H NMR spectrum of 1’-deoxyrhodoptilometrene (48).

Attachements
229
Attachment 62. 13C NMR and DEPT spectra of 1’-deoxyrhodoptilometrene (48).
Attachment 63. 1H NMR spectrum of 1’-deoxyrhodoptilometrin (49).

Attachements
230
Attachment 64. 13C NMR and DEPT spectra of 1’-deoxyrhodoptilometrin (49).
Attachment 65. 1H NMR spectrum of (S)-(-)-rhodoptilometrin (50).

Attachements
231
Attachment 66. 13C NMR and DEPT spectra of (S)-(-)-rhodoptilometrin (50).
Attachment 67. 1H NMR spectrum of 1’-deoxyrhodoptilometrin-6-O-sulfate (51).

Attachements
232
Attachment 68. 13C NMR spectrum of 1’-deoxyrhodoptilometrin-6-O-sulfate (51).
Attachment 69. 1H NMR spectrum of (S)-(-)-rhodoptilometrin-6-O-sulfate (52).
Attachment 70. 13C NMR spectrum of (S)-(-)-rhodoptilometrin-6-O-sulfate (52).

Attachements
233
Attachment 71. 1H NMR spectrum of comaparvin (53).
Attachment 72. 1H NMR spectrum of comaparvin (53) / 6-methoxycomaparvin (54).
Attachment 73. 13C NMR spectrum of comaparvin (53) / 6-methoxycomaparvin (54).

Attachements
234
Attachment 74. 1H NMR spectrum of 6-methoxycomaparvin-5-methyl ether (55).
Attachment 75. 13C NMR spectrum of 6-methoxycomaparvin-5-methyl ether (55).
Attachment 76. 1H NMR spectrum of 6-methoxycomaparvin-5-methyl ether-8-O-sulfate (56).

Attachements
235
Attachment 77. 1H NMR spectrum of 6-hydroxycomaparvin-8-O-sulfate (57).
Attachment 78. 1H NMR spectrum of 2’-deoxythymidine (58).
Attachment 79. 13C NMR and DEPT spectra of 2’-deoxythymidine (58).

Resume
236
Resume
Name: Sherif Saeed Ebada Elsayed
Date of birth: September 1st, 1978 in Cairo, Egypt.
Nationality: Egyptian.
Work address: Institüt für Pharmazeutische Biologie und Biotechnologie,
Universitätsstrasse 1, Geb. 26.23, D-40225, Düsseldorf, Deutschland
Tel.: 0049–211–81–14187, Fax.: 0049–211–81–11923
Permanent address: Department of Pharmacognosy and Phytochemistry, Faculty of
Pharmacy, Ain-Shams University, Organization of African Unity
Street 1, 11566, Cairo, Egypt. E-mail: [email protected]
Education Course: � Predocotoral studies at Institute of Pharmaceutical Biology and Biotechnology,
Heinrich-Heine University, Duesseldorf, Germany, since January, 2007.
� Receiving the M.Sc. degree in Pharmaceutical Sciences (Pharmacognosy and Phytochemistry) at Department of Pharmacognosy, Faculty of Pharmacy, Ain-Shams University, Cairo, Egypt, in May, 2006. The research project was entitled "Phytochemical and Biological study on Peltophorum africanum Sond., family Fabaceae".
� Premaster studies at Department of Pharmacognosy, Faculty of Pharmacy, Ain-Shams University, Cairo, Egypt, since April, 2002.
� General and special preparatory courses of the M. Sc. in Pharmaceutical Sciences (Pharmacognosy) at Faculty of Pharmacy, Ain-Shams University, Cairo, Egypt, grade distinction, in 2001.
� Receiving the Bachelor degree in Pharmaceutical Sciences at Faculty of pharmacy, Ain-Shams University, Cairo, Egypt, in May, 2000.
� Graduate study in Pharmaceutical Sciences at Faculty of Pharmacy, Ain-Shams University, Cairo, Egypt, since Septemtber, 1995.
� Graduating in Al-Tawfikia Secondary School, Cairo, Egypt, in May, 1995.
Scientific Experience: � Ph.D. student at the Institute of Pharmaceutical Biology and Biotechnology,
Heinrich-Heine University, Duesseldorf, Germany, since January, 2007.

Resume
237
� Assistant lecturer at Department of Pharmacognosy, Faculty of Pharmacy, Ain-Shams University, Cairo, Egypt, from 2006–2007.
� Supervising and teaching the graduate practical courses of pharmacognosy and Phytochemistry for 3rd–7th semester students at Department of Pharmacognosy, Faculty of Pharmacy, Ain-Shams University, Cairo, Egypt, from 2004–2006.
� Supervising and teaching the graduate practical courses of Pharmacognosy and Phytochemistry for 4th–6th semester students at Department of Natural Products and Alternative Medicine, Faculty of Pharmacy, King AbdulAziz University, Jeddah, Saudi Arabia, from 2003–2004.
� Teaching Assistant at Department of Natural Products and Alternative Medicine, Faculty of Pharmacy, King AbdulAziz University, Jeddah, Saudi Arabia, from 2003–2004.
� Demonstrator at Department of Pharmacognosy, Faculty of Pharmacy, Ain-Shams University, Cairo, Egypt, in October, 2000.
Publications1) Ebada S.S., Proksch P. (2010). Marine organisms and their prospective use in therapy
of human diseases. In Melhorn, H. (ed) Nature helps… (Springer Verlag) (Submitted)
2) Ebada S.S., Proksch P. (2010). Chemistry and biology of guanidine alkaloids from marine invertebrates. MiniRev. Med. Chem. (Submitted).
3) Ebada S.S., Duong T.N., Li-Weber M., Proksch P. Chemistry and biology of rocaglamides (= flavaglines) and related derivatives from Aglaia species (Meliaceae). In Falk H. (ed) Progress Chem. Org. Nat. Prod. (Springer Verlag) (Submitted).
4) Ebada S.S., Proksch P. Chemistry of marine sponges–Alkaloids, peptides, and terpenoids. In Taglialatela-Scafati O., Fattorusso, E. (ed) Marine Natural Products (Springer Verlag) (Accepted).
5) Chovolou Y., Ebada S.S., Wätjen W., Proksch P. (2010). Angular naphthopyrones from the Philippine echinoderm Comanthus sp. inhibit TNF-alpha-induced NF-�B activation. Eur. J. Pharmacol. (Accepted).
6) Xu J., Ebada S.S., Proksch P. (2010). Pestalotiopsis a highly creative genus: chemistry and bioactivity of secondary metabolites. Fungal Diversity, 44, 15–31.
7) Ebada S.S., Lin W., Proksch P. (2010). Bioactive sesterterpenes and triterpenes from marine sponges: occurrence and pharmacological significance. Mar. Drugs., 8, 313–346.

Resume
238
8) Ebada S.S., Wray V., de Voogd N.J., Deng Z., Lin W., Proksch P. (2009). Two new jaspamide derivatives from the marine sponge Jaspis splendens. Mar. Drugs., 7, 435–444.
9) Orfali S.S., Ebada S.S., El-Shafae A.M., Al-Taweel A.M., Lin W.H., Wray V., Proksch P. (2009). 3-O-trans-Caffeoylisomyricadiol: A new triterpenoid from Tamarix nilotica growing in Saudi Arabia. Z. Naturforsch., 64c, 637–643.
10) Ebada S.S., Edrada-Ebel R.A., de Voogd N.J., Wray V., Proksch P. (2009). Dibromopyrrole alkaloids from the Marine Sponge Acanthostylotella sp. Nat. Prod. Comm., 4, 47–52.
11) Ebada S.S., Edrada-Ebel R.A., Lin W., Proksch P. (2008). Methods for isolation, purification and structural elucidation of bioactive secondary metabolites from marine invertebrates. Nat. Protcols, 3, 1820–1831.
12) Ebada S.S., Ayoub N.A., Singab A.B., Al-Azizi M.A. (2008). Phytophenolics from Peltophorum africanum Sond. (Fabaceae) with promising hepatoprotective activity. Pharm. Mag., 4, 286–292.
Conferences 1) Ebada S.S., Chovolou Y., Wätjen W., Wray V., Edrada-Ebel R.A., Kubbutat M.H.G.,
Proksch P. (2010). Protein kinase inhibiting anthraquinones and NF-�B inhibiting naphthopyrones from the Phillipine echinoderm Comanthus sp. Planta Medica, 76. Poster presentation at the 58th international congress and annual meeting of the society for medicinal plants and natural product research, August 16th–September 2nd, Berlin, Germany.
2) Ebada S.S., de Voogd N.J., Müller W.E.G., Meijer L., Proksch P. (2010). Kinase inhibiting bromopyrrole alkaloids from the Indonesian sponge Stylissa massa. PlantaMedica, 76. Poster presentation at the 58th international congress and annual meeting of the society for medicinal plants and natural product research, August 16th–September 2nd, Berlin, Germany.
3) Ebada S.S., Lin W., de Voogd N., Proksch P. (2009). New jaspamide derivatives from the marine sponge Jaspis sp. Planta Medica, 75. Poster presentation at the 57th international congress and annual meeting of the society for medicinal plants and natural product research, August 16th–20th, Geneva, Switzerland.
4) Ebada S.S., Wray V., Edrada-Ebel R.A., Proksch P. (2009). Anthraquinones and naphthopyrones from the marine echinoderm Comanthus sp. Planta Medica, 75. Poster presentation at the 57th international congress and annual meeting of the society for medicinal plants and natural product research, August 16th–20th, Geneva, Switzerland.

![Analysis of [FeFe]hydrogenase genes for the elucidation of a ...](https://static.fdokumen.com/doc/165x107/6324e1b9051fac18490cfd07/analysis-of-fefehydrogenase-genes-for-the-elucidation-of-a-.jpg)