NONLOCAL BOUNDARY VALUE-PROBLEM FOR PARTIAL DIFFERENTIAL EQUATIONS WITH VARIABLE COEFFICIENTS
Upload
independentCategory
view
0download
0
Protein Science (1993), 2, 2050-2065. Cambridge University Press. Printed in the USA. Copyright 0 1993 The Protein Society
Local and nonlocal interactions in globular proteins and mechanisms of alcohol denaturation
PAUL D. THOMAS’ AND KEN A. DILL2 ’ Graduate Group in Biophysics, University of California, San Francisco, California 94143-0448 * Department of Pharmaceutical Chemistry, University of California, San Francisco, California 94143-1204
(RECEIVED May 15, 1993; ACCEPTED October 1, 1993)
Abstract
How important are helical propensities in determining the conformations of globular proteins? Using the two- dimensional lattice model and two monomer types, H (hydrophobic) and P (polar), we explore both nonlocal interactions, through an HH contact energy, E , as developed in earlier work, and local interactions, through a helix energy, u. By computer enumeration, the partition functions for short chains are obtained without approxi- mation for the full range of both types of energy. When nonlocal interactions dominate, some sequences undergo coil-globule collapse to a unique native structure. When local interactions dominate, all sequences undergo helix-coil transitions. For two different conformational properties, the closest correspondence between the lat- tice model and proteins in the Protein Data Bank is obtained if the model local interactions are made small com- pared to the HH contact interaction, suggesting that helical propensities may be only weak determinants of globular protein structures in water. For some HP sequences, varying U/E leads to additional sharp transitions (sometimes several) and to “conformational switching” between unique conformations. This behavior resembles the transi- tions of globular proteins in water to helical states in alcohols. In particular, comparison with experiments shows that whereas urea as a denaturant is best modeled as weakening both local and nonlocal interactions, trifluoro- ethanol is best modeled as mainly weakening HH interactions and slightly enhancing local helical interactions. Keywords: alcohol denaturation; compact conformations; helical propensities; HP lattice model; hydrophobic interaction
What is the relative importance of local interactions (he- lical propensities) compared to nonlocal interactions (mainly solvent-mediated and hydrophobic interactions) in determining the native structures of globular proteins? One view has held that the local interactions are the main determinants of structure, while the nonlocal interactions just provide nonspecific stability to the compact state (Anfinsen & Scheraga, 1975). That is, interactions among adjacent and near-neighbor peptide units tend to drive proteins to configure into helices at certain points in the sequence, which ultimately end up as helices in the native structure. In this view, helices should be identifiable by factors that are local within the sequence, and this should strongly specify how they can pack to form the native structure. Recently, an alternative view has developed that nonlocal interactions may be a major determinant not only of the stabilities but also of the structures of globular
Reprint requests to: Ken A. Dill, Department of Pharmaceutical Chemistry, Box 1204, University of California, San Francisco, Cali- fornia 94143-1204.
proteins (Dill, 1990; Chan & Dill, 1991b). In this view, a major factor in determining where helices form in native structures is the sequence positions of hydrophobic mono- mers. That is, predicting helices (and also sheets) in native structures is more a matter of finding the correct global hydrophobicity patterns than of finding good local helical propensity patterns, even though the latter are known to be non-negligible. The present work aims to explore this question in more detail by using a simplified model that has an exact partition function, and to study the conse- quences of different balances between local and nonlocal interactions. We refer to this model as the “helical-HP model. ”
We then apply the model to the denaturation of proteins by alcohols and other agents. The ability of alcohols to induce a-helical conformations in proteins was first noted in optical rotatory dispersion experiments by Tanford et al. (1960) on @-lactoglobulin. Tamburro et al. (1968) studied the effects of trifluoroethanol (TFE) on the conforma- tions of the ribonuclease S-peptide; TFE was found to stabilize the small peptide in the same (a-helical) confor-
2050

Local and nonlocal interactions in proteins 205 1
mation that it adopts in the native protein. Since then, alcohols have been used widely to examine the conforma- tional (particularly helical) propensities of peptides (Nel- son & Kallenbach, 1986; Lehrman et al., 1990; Segawa et al., 1991; Sonnichsen et al., 1992) and to induce con- formational changes in intact proteins (Stone et al., 1985; Wilkinson & Mayer, 1986; Dufour & HaertlC, 1990; Jack- son & Mantsch, 1992; Buck et al., 1993; Fan et al., 1993). The primary physical mechanisms by which alcohols effect these changes are still unresolved. The helical-HP model reproduces some basic characteristics of experimental de- naturation of proteins by alcohols and other denaturants, and offers an interpretation of their mechanisms of action.
The helical-HP model
The helical-HP model is of short chains, which are specific sequences of H (hydrophobic) and P (polar) monomers, configured as self-avoiding walks on two-dimensional (2D) lattices. A monomer represents a single amino acid residue. Figure 1 shows two possible conformations of a 16-monomer chain on the lattice. Each monomer occupies one site on the lattice, and monomers that are consecu- tive in the sequence must be next to each other on the lat- tice (chain connectivity constraint). No two monomers may occupy the same lattice site (excluded volume con- straint). We use a search-tree algorithm to enumerate all of the possible conformations of a chain of given length (Chan & Dill, 1989). For the 16-monomer chains modeled in this paper, there are 802,075 possible conformations on the 2D square lattice. The relative populations, p ( A ) / p (B) , of any two conformations A and B are given by the Boltzmann distribution:
where AG, and AGB represent the Gibbs free energies of conformations A and B, respectively, relative to a com- mon reference, k is Boltzmann’s constant, and Tis the ab- solute temperature.
In a previous treatment, referred to as the H P model (Lau & Dill, 1989; Chan & Dill, 1991a; Shortle et al., 1992), a single type of energy was considered, account- ing for the favorability of each HH contact in a given chain conformation. This interaction is nonlocal in the sense that HH contacts involve two H monomers that need not be near neighbors in the sequence; they are me- diated through space rather than being mediated along neighboring covalent bonds. Conformational properties of the H P model have been studied in detail. Even though the model chains are short and configured in two dimen- sions, nevertheless the H P model shows certain features of globular proteins (Lau & Dill, 1989, 1990; Chan & Dill, 1991a; Lipman & Wilbur, 1991; Miller et al., 1992;
A B
Fig. 1. 2D helical-HP model conformations, for a sample sequence (HHPHPHPPHPPPHPPH). H (hydrophobic) residues are filled; P (polar) residues are open. Conformation A contains four HH con- tacts (black diamonds) and no helical bonds, AG = 46. Conformation B contains three HH contacts and two helical bonds (bold lines), AG = 3e + 20.
Shortle et al., 1992; Camacho & Thirumalai, 1993a,b; O’Toole & Panagiotopoulos, 1993; Unger & Moult, 1993). For example, increasing the strength of the HH interac- tion in the H P model leads to a relatively sharp transition from a denatured ensemble of open conformations to a small number of compact conformations (often only one or a few) that are composed of secondary structures and have cores mainly composed of H monomers. The con- formations of lowest energy in the H P model are differ- ent for different sequences. Native states are relatively insensitive to mutations, particularly on the surface; there is high “convergence,” Le., many different sequences fold to a given native state; and there are favored folding path- ways. Thus, the simple H P lattice model offers a useful framework for studying the physical bases of protein properties that are currently difficult to study by other types of models.
We now consider a more general model, the helical-HP model, in which the free energy is a sum of two types of energy. First, as before, we consider a contact interaction, e I 0, for each HH contact. The net exposed surface of H monomers in the 2D model protein (i.e., contacting ei- ther P monomers or solvent) is decreased by two perim- eter units (the 2D equivalent of surface area) for every contact made between two H monomers. Physically, the H H contact primarily represents the burial, or desolva- tion, of nonpolar amino acid side chains. HH or “hydro- phobic” contacts is our shorthand notation for a more complex reality, and represents all the factors involved in the transfer of each nonpolar side chain from water to its specific contact environment, including water ordering, dispersion interactions, and hydrogen bonding, and thus differs from some other definitions. If m is the number of HH contacts in a model conformation, then the total nonlocal contact energy of that conformation is me. (Be- cause we are not concerned in this paper with the temper-

2052 P.D. Thomas and K.A. Dill
ature dependence of the model, we interchangeably refer to contact energies as contact free energies.) It should also be noted that although the H H contacts need not be lo- cal in sequence, they may be. In this way, a 2D helix can be stabilized by both intrahelix (i, i + 3) H H contacts and HH contacts between monomers in helices and monomers in other parts of the chain (e.g., in Fig. 1B).
Second, we introduce an additional energy term to ac- count for local interactions. Local interactions are those among near-neighboring residues in the sequence. Local interactions drive turns (Dyson & Wright, 1991) and a-helices in peptides (Zimm & Bragg, 1959), and are the predominant sites of hydrogen bonding (Stickle et al., 1992). The helical-HP model represents local interactions with an energy that favors helix formation. The model he- lical interaction also represents more than a single type of atomic interaction: several factors are involved in helix formation, including intramolecular (i, i + 4) hydrogen bonds and steric and dispersion interactions. In this re- gard, the distinction between local and nonlocal interac- tions is not a distinction between hydrogen bonding and water ordering effects; it is a distinction mainly between helical propensities and nonpolar transfers. Two turns of a 2D lattice helix are shown in Figure 1B. The reason this particular lattice conformation is considered to be heli- cal is because it is the only conformation on the 2D square lattice that has the same topology (i.e., contact map) as a three-dimensional a-helix (Chan & Dill, 1989). When six consecutive monomers of a 2D chain are in such a structure, a helical energy of 2u is assigned to the confor- mation, one contribution of u for each of the two (i, i + 3) contacts. The minimum length of a helix is defined to be six residues, i.e., two helical bonds, since a single (i, i + 3) contact is more properly defined as a turn. We refer to each helical ( i , i + 3) contact in the model as a "helical bond." A helical bond is assumed to be favorable, i.e., u 5 0, independently of the H P sequence. The sequence independence of the model helical interaction is an ap- proximation based on the experimental observation that, over the 20 amino acids, helical propensities vary rela- tively little in energy compared to hydrophobicity. Heli- cal propensities in peptides vary by approximately a factor of 8, ranging over the amino acids, excluding proline (Lyu et al., 1990; O'Neil & DeGrado, 1990; Scholtz & Baldwin, 1992), whereas hydrophobic interactions vary by a factor of 100 or more (Nozaki & Tanford, 1971; Chothia, 1976; Fauchtre & Pliska, 1983; Rose et al., 1985). It would be straightforward to include a sequence dependence of he- licity in this model, but it only adds additional parameters that would obscure the purpose of the present study. Ev- ery added helical unit (two added residues) adds u to the energy sum; the local energy is then nu for a conforma- tion having n helical bonds.
Thus, the total energy of a conformation is:
relative to an open reference conformation that has no H H contacts and no helical structure. This energy ac- counts for the intrachain interactions; the conformational entropy is treated through the enumeration process. For a given sequence of 16 H and P monomers, we evaluate the free energy of each of the 802,075 conformations ac- cording to Equation 2. The "native state" of a sequence is defined as the conformation (or conformations) that has the lowest free energy for particular values of u and E .
To illustrate the energy contributions, consider the con- formations shown in Figure 1. Conformation A contains four HH contacts but no helical bonds; it has energy AG, = 46. Conformation B contains three HH contacts and two helical bonds; it has energy AGB = 3~ + 2u. The population ratio of conformer A relative to conformer B will be
exp(4dkT) exp[ (3~ + 2a)/kT]
The strengths of the two types of interaction are varied by changing the values of u and E. Conformations A and B will be present in equal populations, in this example, when AG, = AGB, i.e., when U / E = 1/2. Relative to this value, if U/E is decreased, conformation A will be favored; if U/E is increased, B will be more populated. Thus, in general, the native conformation(s) of any sequence will depend on the ratio U/E, i.e., on the balance between local and nonlocal interactions. Likewise, different native states for the same sequence will be present in equal pop- ulations at integral fractional values of U/E.
The fractional population of any single conformation can be calculated for given values of u and E as the Boltz- mann weight for that conformation, divided by the par- tition function, Z (the sum of the Boltzmann factors of all possible conformations):
f (conf) e-l(mconf-mnatlve)c+(nconf-n"~t,"~)ul
- -
m=O n=O
where the subscripts "native" and "conf" refer to the properties of the native conformation (for that particu- lar ratio of U / E ) and the conformation of interest, respec- tively; m is the number of HH contacts; n is the number of helical bonds; mmax is the maximum possible number of H H contacts for the given sequence; and nmax is the maximum possible number of helical turns for a given chain length. The degeneracy function g(m, n ) specifies the number of conformations in the ensemble having particular values of m and n . Our convention is that the native state has a Boltzmann weight of 1. The fractional population, and therefore the stability, of any conforma- tion can be calculated exactly for any helical-HP sequence at any values of u and E.

Local and nonlocal interactions in proteins 205 3
In physical terms, the quantities E and u represent the degrees to which external factors, such as temperature and solvents, determine: (1) the affinity between two nonpolar amino acids, and (2) the propensity to form helices, re- spectively. For example, as noted in more detail below, alcohols such as ethanol and TFE in water weaken the hydrophobic interaction and strengthen the helical pro- pensity. Increasing concentrations of guanidine hydro- chloride (GuHCl) and urea in water weaken both types of interaction (Robinson & Jencks, 1965; Nandi & Robinson, 1984). GuHCl can denature helical peptides (Shoemaker et al., 1988), implying that increasing its concentration in water would correspond, in our model, to a decrease in both E and u.
Predictions of the model
First, consider two limiting cases. When the contact in- teractions are weak ( E small), the model describes helix- coil processes: all sequences become helical as u becomes large. For E = 0 when u < 0, the helix is the conformation of minimum energy and therefore defines the native state (i.e., the conformation of minimum free energy) for all sequences. On the other hand, when there are no local in- teractions (a = 0), the helical-HP model reduces to the H P model explored in previous studies (Lau & Dill, 1989, 1990; Chan & Dill, 1991a; Lipman & Wilbur, 1991; Miller et al., 1992; Shortle et al., 1992; Camacho & Thirumalai, 1993a,b; O’Toole & Panagiotopoulos, 1993; Unger & Moult, 1993).
The two types of interaction, local and nonlocal, can cooperate to stabilize a given conformation. Figure 2 shows, for two different HP sequences, the effect of strengthening the HH attraction (i.e., making E more negative) for a constant small helical energy (a). The HH
15
0
0 1 2 3 4 5 c/-kT
Fig. 2. Population of helical conformer versus HH interaction, E , for sequences A (HPPHHPHHPHPPHHHH) and B (HHPHPPPHPHH PHPHH). For sequence A, the helix is first stabilized by favorable HH interactions, but then is destabilized as chain compactness becomes more important. Sequence B is destabilized by HH attractions. Populations are calculated by Equation 4; for both cases, u = -2.25kT.
contact interaction helps to increase the stability (i.e., the fractional population) of the 16-residue helix conforma- tion of the sequence labeled A, but decreases the helicity for sequence B. For sequence A, the helical conformation contains several HH contacts, and increasing the energy associated with these contacts stabilizes the helical con- formation. Sequence B in a helix makes only one HH con- tact, so increasing E only destabilizes the helix in favor of the many other conformations that have more HH con- tacts. Experiments on helical peptides show a similar re- sult: helices are stabilized if their formation results in the burial of nonpolar surface (Tanford, 1968; Chou et al., 1972; Richards & Richmond, 1978). Curve A also shows that when a helix is stabilized by HH interactions, further strengthening of the H H interactions can ultimately lead to transitions to even more stable conformations having more HH contacts and fewer helical bonds.
For a given H P sequence, the ratio C / E determines which conformation(s) are native. Figure 3 shows exam- ples of “native state phase diagrams,” i.e., maps of the minimum-energy states, and the transitions among them, for different values of u and E . The conformations shown on the phase diagrams are the most populated (native) conformations, but other conformations are also present in lesser concentrations, depending on their Boltzmann weights. In the lower left corner of each diagram, which corresponds to both interactions being weak, all confor- mations have nearly the same populations. This region corresponds to the denatured state of the chain. As the interaction energies are increased (by increasing the dis- tance from the origin), the native conformation(s) become more populated. Increasing both interaction energies, from the origin along a line at angle 0 with respect to the x-axis of these phase diagrams, corresponds to a fixed bal- ance of energies u/c = tan 8. Transition points (dotted lines) are points of equal populations of different native states, and occur at integral fractions of U / E in the lattice model.
The model predicts “conformational switching.” This follows from the existence of transition lines in the phase diagrams. That is, in some particular solvent (i.e., par- ticular values of u and E ) the sequence has one native state, whereas changing the solvent causes a transition to a dif- ferent native state. Thus, the model can flip-flop between two different states with changes in external conditions. At any given value of U / E there may be more than one na- tive conformation with the same number, m, of HH con- tacts and the same number, n, of helical bonds (e.g., in Fig. 3C).
How many H P sequences fold to a unique native con- formation? It depends on the relative interaction strengths, U / E . By “unique” we mean that only one conformation, out of 802,075 possible, has the minimum free energy. We find the native conformations of each possible sequence of H P copolymers of length 16, over all possible values of U / E . The number of distinct sequences (i.e., the size of

2054
A HPHHPHHHHPHHPHHH
0 5 10 15 20
E l - k l
C HPPHHHPHHHPPHPHH
0 5 10 15 20
EI-kT
B HPPHHHPPPPHHHHHH
20
15
c : 10 b
5
0
0 5 10 15 20
EI-kT
D PPPPPPHHHHHHHHPH
0 5 10 15 20
EI -kT
Fig. 3. Native state phase diagrams versus u and t . Open regions show which 2D lattice conformations are native for the given sequence for particular ranges of u and t. H residues in the sequence are shown as black dots. Dashed lines indicate transitions, and are labeled with the transition values of u/e; solid lines enclose the regions where the con- forrnation(s) shown comprise over 95% of the total population (by Equation 4). For small u and e , there is a large ensemble of denatured conformations. For large u and t , sequence A undergoes two confor- mational switching transitions as u/t is increased. Sequence B shows only a single transition (at high u and e ) between helix and helix bundle; this sequence has no unique native conformation at u/t = 0 for any value of t . Sequence C has many transitions, one to a nonunique native state favored for 1/3 < u/t < 1/2. Sequence D has only a helix-coil transi- tion, because it cannot form a core of contacting H residues. All se- quences undergo helix-coil transitions. Some undergo coil-globule, globule-globule, or globule-helix transitions.
“sequence-space”) is 32,896 if we take into account mir- ror-image equivalence (HP chains have no polarity, e.g., the tetramer sequence PHPH is equivalent to HPHP). Figure 4A shows the number of sequences that fold to a unique native structure. When local forces are dominant ( U / E is large), all sequences fold to a unique conforma- tion, namely the 16-residue helix. When H H contact in- teractions are dominant, fewer sequences map to a greater number of different unique native states.
When helical interactions are large, but not so large that they completely overwhelm the H H interactions, many helical-HP model sequences will form “helical bun- dles”: two helices packed side by side antiparallel to each other with a common “core” of contacting H residues. (The two-helix bundle is the two-dimensional equivalent of a bundle of multiple helices in three dimensions.) Phys-
P.D. Thomas and K.A. Dill
A 500
400 2 : s 200
300 52 0
100
0
B 400
v) 300 0 a z 200
O” 100
,o
0
30 0 a 0
20 2 0
0)
U 10 8
0
3 0
2.5
2 0 0
v)
1 5 g 1 0 ; D
0 5 v)
Fig. 4. Uniqueness of native structure versus u/e. A: Solid line (right scale) is the number of sequences in all of sequence-space that fold to unique native states (size of single-sequence set). It increases with u/t because all sequences fold to a helix for large u. Dashed line (left scale) is the number of different conformations to which sequences fold (size of single-conformation set), which decreases to 1 for large u. These curves are discontinuous because transitions between native states occur at a finite number of integral fractions of u/t. B: With “minimum sta- bility’’ criteria, which make the low-u/t end of each curve more contin- uous. Note that these criteria are applied only for u/e 5 0.15. New sequences are added to the list of proteinlike sequences when the unique native conformation becomes stable (see text), so for this range both curves are increasing.
ically, these intermediate values of U / E correspond to the conditions present in the interior of cell membranes. The nonpolar environment of the membrane interior would lead to a reduced hydrophobic driving force and increased intramolecular hydrogen-bonding driving force (because there will be no solvent hydrogen bonds available in the membrane interior) relative to water. The membrane- spanning regions of many integral membrane proteins are a-helical. These helices associate into helical bundles, with the more hydrophobic groups exposed to the membrane (Rees et al., 1989), suggesting that the hydrophobic inter- actions between side chains are less favorable than inter- actions with the acyl chains of membrane molecules. In our model, this situation corresponds to a contact inter- action between P monomers, which is equivalent to the H H interaction (by symmetry). Thus, the helical-HP model finds a helical bundle conformation to be the na- tive state for many sequences under “membrane-like” conditions.
This result, that many helical-HP sequences fold to he- lical bundles for intermediate values of U / E , also has an

Local and nonlocal interactions in proteins 2055
implication for designing protein folding algorithms. It implies that by choosing helical propensities too large, not only will helical bundle proteins fold into helical bundles but also many other sequences will incorrectly fold to he- lical bundles. Conversely, our results suggest that if a folding algorithm incorrectly folds most sequences to he- lical bundles, the helical propensities have been chosen to be too large.
How often does conformational switching involve a transition between unique native conformations, i.e., from one unique conformation to another unique confor- mation? The sequence shown in Figure 3A has a unique native conformation at all values of u/e (except exactly at transition points) when both types of interaction are strong. This type of behavior turns out to be quite gen- eral: more than half of the sequences that have a unique native conformation at one value of u/e will also have a unique but different native conformation if U / E is in- creased through a transition point. The chain does not pass through a disordered ensemble of conformations be- tween the two states, but rather undergoes a simple two- state transition, toggling between states in response to ap- propriate changes in external conditions. These sequences are “conformational switches.” For other sequences, the behavior can be more complex. Experimentally, peptides have been designed that can act as conformational switches, changing conformation in response to changes in external conditions (Mutter & Hersperger, 1990). The polypeptide gramicidin A has been shown to undergo a conformational change from double-helical dimer to he- lical monomer upon insertion into a cell membrane (Kil- lian, 1992). For many H P sequences, the helical-HP model predicts a globule-helix transition for such a change in external conditions, i.e., a large increase in u and a decrease in E .
Comparison of the helical-HP model with properties of proteins
Our aim in this section is to compare properties of the helical-HP lattice model with properties of native protein structures from the Brookhaven Protein Data Bank (PDB), in order to determine which relative strengths of local (helical) and nonlocal (HH contact) interactions cause the model to resemble real proteins most closely. To do so, we must first choose which model sequences are most “proteinlike.” In this regard, we consider only unique native states predicted by the model, since native states of real proteins are unique, at least to low resolu- tion. In other words, if over a certain range of U / E a given helical-HP sequence has only a single conformation hav- ing the minimum energy (according to Equation 2), it will be considered to be proteinlike over that range; if it has multiple (degenerate) native conformations, it will not. We construct a set of all proteinlike sequences for each range of u/e (see Fig. 4). Because the native states of each
helical-HP sequence vary with U / E , different balances of local and nonlocal interactions yield different sets of unique native conformations. We aim to find the balance of U / E in our model proteins that most closely mimics aqueous solvent conditions for real proteins.
The native state of a helical-HP sequence is defined as the conformation(s) of lowest energy. On either side of a transition point, there will be a different native state. But only in the limit of infinite interaction energies will there be an exact transition point between stable states. As is evident in Figure 3, for finite u and E there is a range of u/e surrounding each transition point in which the native state is not highly stable; the size of this range depends on the magnitude of u and E relative to kT. In addition to the requirement that a particular helical-HP sequence have a unique native conformation to be con- sidered proteinlike, we add a stability requirement. We choose E = -9.5kTand a fractional population of 95% (by Equation 4), which we refer to as our “minimum sta- bility” criteria. Thus, for example, the helical-HP se- quence shown in Figure 3B would not meet the minimum stability requirement for approximately U / E < 0.2. Fig- ure 4B plots the number of sequences that are proteinlike on this basis, for small u/e.
For comparison with real proteins, we choose a repre- sentative sample of 1 1 3 proteins from the PDB, derived from Appendix 3 of Protein Architecture (Lesk, 1991). Because we do not know how the known proteins “sam- ple” all the possible protein sequences and structures, we consider the two possible unbiased ways to represent sets of model conformations. The “single-conformation” set contains each unique native conformation once. That is, no matter how many sequences fold to a given conforma- tion, it is represented once. By contrast, in the “single- sequence” set, each sequence that folds to a unique native conformation is represented once; so a given conformation is represented in proportion to the number of sequences that have that same conformation. Hence, the single- sequence set is larger than the single-conformation set, and grows with increasing u/e (Fig. 4). Probably neither of these sequence ensembles truly represents the proteins in the PDB sample, but they provide two unbiased limit- ing cases. Our PDB sample is not a single-conformation set because nearly identical native structures often appear more than once, such as the globins, due to different se- quences that have essentially the same structures. It is therefore probably closer to being a single-sequence set, but it too may be a biased sample of all proteins, because the PDB contains mostly relatively small, crystallizable molecules.
To compare the model to real protein structures, we ex- amine two properties: (1) the ratio of helix to sheet sec- ondary structure in each set, and (2) the distribution of tertiary structural similarities, according to a property de- fined below. We choose these two properties because they are the most sensitive tests of the balance between the two

2056 P.D. Thomas and K.A. Dill
types of energies, and because their distributions do not involve artifacts that might arise from cross comparisons of lattice model and real protein structures. Rather, we obtain a distribution function for the lattice model and one for real proteins, and then compare the two distribu- tion functions.
Secondary structures in proteins
Lattice model studies show that the formation of helices and sheets can be driven by compactness, for example, as a consequence of HH interactions (Chan & Dill, 1990). For many sequences, the H P model leads to native states with much secondary structure. However, while the 2D lattice model predicts amounts of helix and sheet similar to those found in the Protein Data Bank (Chan & Dill, 1990), recent studies that are not confined to the discrete bond angles of a lattice show that the secondary structures driven by compactness alone are structurally diverse. Without hydrogen bonding, only a small fraction of the conformations that have the helix topology ((i, i + 3) con- tact repeats) are specifically a-helices (Gregoret & Cohen, 1991; Hao et al., 1992; D. Yee, H.S. Chan, T. Havel, & K.A. Dill, in prep.). Compactness is predicted to give sta- bility, but not structural specificity, to secondary struc- tures in globular proteins. It is not yet known exactly how much of the free energy stabilizing a-helices derives from compactness versus hydrogen bonding; it depends strongly on what criteria are used to distinguish an a-helix from a nonhelical conformation. The problem is substantial: the amount of a-helix predicted by different published he- lical criteria can vary from 3 to 50% for a given chain con- formation (Yee et al., in prep.). If loose criteria are used to define helices, then compactness can account for most of their driving force, but if helices are defined by strin- gent criteria, then hydrogen bonding must also be invoked to account for their observed populations.
In the present study we compare secondary structures from the 2D lattice model with those from proteins in the Protein Data Bank. Because of the difficulties noted above, we focus here on the shapes and relative areas of distribution functions rather than on absolute numbers of secondary structures, because the latter are so sensitive to subjective criteria. Whereas there are ambiguities in de- fining real protein secondary structures, there is no am- biguity in defining them on 2D square lattices. The definitions of the 2D secondary structure types follow from properties of the contact map and are given in Fig- ure 5 (Chan & Dill, 1990).
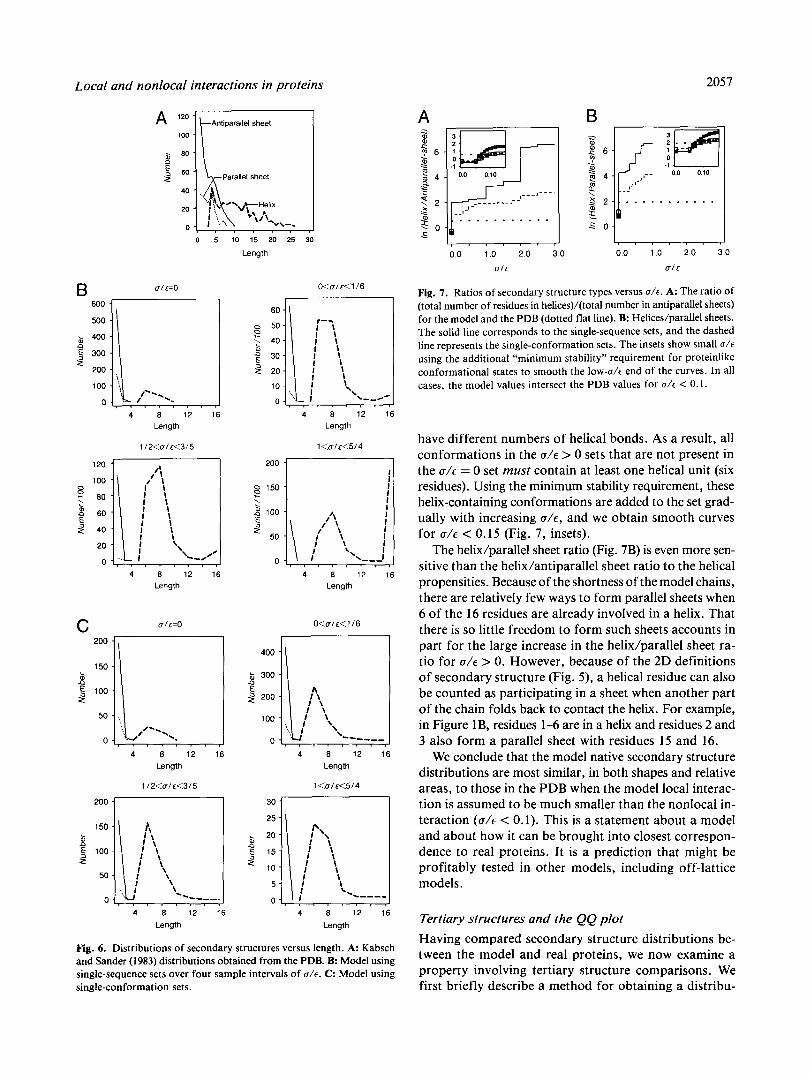
What balance between local and nonlocal interactions is needed to bring the model into closest correspondence with real proteins? This is addressed in Figures 6 and 7. For comparison, Figure 6A shows the length distributions of protein helices and sheets derived from the PDB by Kabsch and Sander (1983). The corresponding model dis- tributions are shown in Figure 6B and c , for different val-
A B C helix antiparallel parallel
sheet sheet
7 jC3 r" i+2 - i-l i M i + ]
i M i + ] i M i+l
i + S
Fig. 5. Secondary structures on the 2D square lattice. A: Helix, at least two sequential noncovalent contacts between residues [( i, i + 3) . ( i + 2, i + S ) , . . . , ( i + 2n, i + 2n + 3)]. B: Antiparallel sheet [(i, j ) , ( i + 1, j - I ) ,..., ( i+n , j -n ) ] .C:Para l Ie l shee t [ ( i , j ) , ( i+I . j+1) ,..., ( i + n , j + n ) ] .
ues of d e . It has been noted before (Dill, 1990) that if helical propensities were the dominant forces responsible for the structures in globular proteins, proteins would have more long helices and fewer short ones: helix stabil- ity should increase with length. This prediction is seen in the model distributions shown in Figure 6B: when local helical interactions are significant (u/c > 1/2), more he- lices are longer and fewer are shorter in the native states of the model. But when there is less helical driving force (u/c < 1/6), the model shows a monotonically decreasing helicity with length, as is observed in proteins in the PDB. Hence, the distribution functions in Figure 6 have shapes most similar to those for real proteins if the free energy to form one helical bond is from approximately 0 to 15% of the free energy involved in forming one HH contact.
Figure 7 shows how the weighted areas under these dis- tribution functions, which equal the total number of res- idues participating in each type of secondary structure, depend on u/e. The use of the area under the curve helps reduce arbitrariness of decisions about whether helices observed in real proteins are continuous or broken, and it helps compensate for the limited data due to the short- ness of the chains in the lattice model. Figure 7A and B shows the helix/antiparallel sheet ratio and the helix/ parallel sheet ratio, respectively, as functions of u/c in the model. The value for the Kabsch and Sander (1983) PDB study is shown as a horizontal line. Both the single- sequence and the single-conformation sets are shown in each figure; they show significant agreement, and mainly differ only in magnitude.
From Figure 7 it is evident that 0.05 < u/c < 0.1 is the range for which the model most accurately reproduces the helix/parallel sheet and the helix/antiparallel sheet ratios of proteins in the PDB. One notable feature of the model curves is the large step increase in the helixhheet ratio for even the smallest increment in U / E above zero. This arises because when even a small nonzero local term is added to the free energy, it breaks the degeneracy between conformations with a given number of HH contacts that
Local and nonlocal interactions in proteins 2057
100
. . . . . . . . . . . 0 5 10 15 20 25 30 I
Length
O<uI ~ < 1 16
0.0 1.0 2.0 3.0 0.0 1.0 2.0 3.0
ul E U I E
Fig. 7. Ratios of secondary structure types versus a / € . A: The ratio of (total number of residues in helices)/(total number in antiparallel sheets) for the model and the PDB (dotted flat line). B: Helices/parallel sheets. The solid line corresponds to the single-sequence sets, and the dashed line represents the single-conformation sets. The insets show small a/'€ using the additional "minimum stability" requirement for proteinlike conformational states to smooth the low-a/c end of the curves. In all cases, the model values intersect the PDB values for a/t < 0.1.
have different numbers of helical bonds. As a result, all conformations in the U / E > 0 sets that are not present in the U / E = 0 set must contain at least one helical unit (six residues). Using the minimum stability requirement, these helix-containing conformations are added to the set grad- ually with increasing U / E , and we obtain smooth curves for U / E < 0.15 (Fig. 7, insets).
The helix/parallel sheet ratio (Fig. 7B) is even more sen- sitive than the helix/antiparallel sheet ratio to the helical propensities. Because of the shortness of the model chains, there are relatively few ways to form parallel sheets when 6 of the 16 residues are already involved in a helix. That there is so little freedom to form such sheets accounts in part for the large increase in the helix/parallel sheet ra- tio for U / E > 0. However, because of the 2D definitions of secondary structure (Fig. 5 ) , a helical residue can also be counted as participating in a sheet when another part of the chain folds back to contact the helix. For example, in Figure lB, residues 1-6 are in a helix and residues 2 and 3 also form a parallel sheet with residues 15 and 16.
We conclude that the model native secondary structure distributions are most similar, in both shapes and relative areas, to those in the PDB when the model local interac- tion is assumed to be much smaller than the nonlocal in- teraction ( U / E < 0.1). This is a statement about a model and about how it can be brought into closest correspon- dence to real proteins. It is a prediction that might be profitably tested in other models, including off-lattice models.
Tertiary structures and the QQ plot Having compared secondary structure distributions be- tween the model and real proteins, we now examine a property involving tertiary structure comparisons. We first briefly describe a method for obtaining a distribu-
B 600
500
& 400
f 300 2
200
100
0
a
U / E = O
Length
1<u/~<514
Length
1 12<Ul ~ < 3 1 5
200
8 150 7..
\
2 100 5 2
50
0
120
too a
2 d 60
z" 40 E
20
0
2 80
C
,' \\ I \ I \ I I '\ I I \"A
4 8 12 16 Length
4 8 12 16 Length
u/E=O O<al E<I 16
400
9 2 300
E z" 200
100
0 4 8 12 16 4 8 12 16
Length
112<aIE<315
2oo 1 150
100
50
0
Length
1 <u/ E<% 4
1 1
z" 10 ! 0 5
Length Length
Fig. 6. Distributions of secondary structures versus length. A: Kabsch and Sander (1983) distributions obtained from the PDB. B: Model using single-sequence sets over four sample intervals of a /€ . C: Model using single-conformation sets.

205 8 P.D. Thomas and K.A. Dill
tion of pairwise dissimilarities between tertiary structures, and then a general method for comparing different dis- tributions. Finally, we use these methods to compare our model conformation distributions to the PDB. For this tertiary structure comparison as well, the model bears closest resemblance to real proteins when the helical in- teractions in the model are set to be near zero.
The pairwise structural dissimilarity distribution, de- scribed in more detail elsewhere (Yee & Dill, 1993), is based on a measure, d ( R, S ) , of pairwise dissimilarities of two polymer or protein conformations, R and S. d ( R , S ) is a number that ranges from 0 to 1, 0 indicat- ing the structures are identical and 1 indicating they have the greatest possible structural dissimilarity. The dissim- ilarity of two chain conformations is computed from their weighted distance maps, For a chain of length N , the weighted distance map is an N X N matrix in which each element w (i, j ) equals the distance between the positions of residues i and j (Ca coordinates are used for protein comparisons; lattice monomer sites are used for the model) raised to the inverse power, p ( p > 0):
w(i , j ) = d ( i , j)-J'. ( 5 )
The weighted distance map has the property that residues that are close together in space are weighted more heav- ily than residues that are distant in space. Here we use p = 2, so the weights include contributions from residues other than nearest neighbors. The comparison of two dis- tance maps, to get the score d ( R , S ) , is made by sliding one map across the other and finding the alignment of highest similarity.
Using this measure, d ( R , S ) , of dissimilarity between conformations R and S, we find the pairwise dissimilar- ities among all the conformations in a given set. The d ( R, S ) distribution is shown in Figure 8 for n ( n - 1)/2 = 6,328 pairwise comparisons of 113 representative proteins in the Protein Data Bank. It represents the relatedness among the tertiary structures of known proteins. Corre- spondingly, we obtain a d ( R , S ) distribution for the na- tive conformations predicted by the 2D helical-HP model for different intervals of U / E (Fig. 9, insets). For each in- terval of U / E , distributions were generated for both the single-conformation and single-sequence sets.
500 - A Fig. 8. Distribution of pair- wise tertiary structure dissim- ilarities for 113 proteins from the PDB (see text for details).
2 300 E z" 200
100
n - " I I
0.0 0.2 0.4 0.6 0.8 1.0
Dlsslmllarlty
How similar are the two distribution functions: of the pairwise dissimilarities among proteins and of the pairwise dissimilarities among native states in the helical-HP model? We make this comparison using a quantile-quantile (QQ) plot (Chambers et al., 1983). This type of plot compares the shapes of two distribution functions. The range of val- ues on the x- and y-axes of the QQ plot is 0 to 1. Point (x, y) on the QQ plot is the pair ( d ( R , S ) value of one distribution, d(R', S ' ) value of the other distribution) at which the areas under the two distribution functions are equal. That is, a point (x, y ) on a QQ plot is repre- sented by:
where A is the distribution function represented on the x-axis of the plot, B on they-axis, and ds is a small score interval.
The QQ plot has several properties that make it useful for comparing distribution functions. First, if two distri- butions have identical shape, the QQ plot is linear. For example, the comparison of two Gaussian distributions will yield a linear QQ plot irrespective of their relative widths and displacements. If the QQ plot is linear, the slopes and the intercepts have a simple interpretation. The slope corresponds to the relative widths of the dis- tributions; e.g., a slope of 3 indicates that distribution B is wider than distribution A by a factor of 3. They-intercept corresponds to the shift of the mean of one distribution relative to the other: it is the point on distribution A that corresponds to 0 on distribution B. Figure 9 also shows QQ plots for the 2D helical-HP lattice model versus the PDB for the given intervals of U / E .
We focus on three properties of the QQ plot: (1) 1' Inear- ity (resemblance of the shapes), (2) slope (resemblance of the widths), and (3) slope-intercept (resemblance of the mean values). These three properties of the QQ plot most quantitatively express the resemblance of the pairwise structural dissimilarity distribution of the lattice model native conformations to the PDB distribution, and are plotted versus U / E in Figure 10. The root mean square de- viation (RMSD) of the QQ plots from linearity (Fig. 10A) is probably the best measure of deviation between distri- butions, because if linearity does not hold, the other mea- sures lose their simple interpretations.
Figure 10A shows that the model most nearly resem- bles the PDB for U / E = 0 for the single-sequence set and for U / E < 1 for the single-conformation set. This result holds true even when the more stringent requirement of minimum stability is used to define the conformation sets (Fig. 10A, inset). As noted above, the single-sequence set may be more representative of the sequence distribution in the PDB. The single-conformation set is much less sen- sitive to small changes in U / E , since conformations are lost gradually with increasing U / E (Fig. 4A). The fall of the

Local and nonlocal interactions in proteins 2059
B ul c=O A O<u/ ~ < 1 I 6 O<ulc<1/6
1 .o
0.8
5 0.6
s 0 4
0.2
0.0
B
1 0
08
3 0 6
0 4
0 2
0.0
B
1 .o
0.8
5 0.6 ' 0 4
0.2
0 0
1 0
0.8
5 06
0.4
0.2
0 0
D
0.0 0 5 1 0 0 0 0.5 1 .o Database Database
1/2<U1~<3/5 1<a/c<5/4
00 0.5 1 .o Database
112<UIE<3/5
0 0 0 5 1 .o Database
l<u/c<5/4
1 0
0 8
- 0.6
s 0 4
0 2
0 0
p" i"/ 1 .o
0 8
3 0 6
9 0 4
0.2
00
y, /*
1 0
0 8
06
0 4
0 2
0 0 0.0 0 5 1 .o 00 0.5 1 0
Database Database 0 0 0 5 1 .o
Database 0 0 0.5 1 .o
Database
Fig. 9. Model pairwise dissimilarity distributions (insets). Comparison with the PDB distribution is shown as QQ plots. The more linear the plot, the more similar the model and PDB distributions. Single-sequence (A) and single-conformation (B) sets. The greatest similarity is for a/€ = 0 in A, and u/t < 315 in B. These distributions are constructed by comparing each confor- mation in the set over a given range of a/€ pairwise with every other conformation in that set. The peak at score 0 in A reflects different sequences folding to identical conformations.
B 1 A RMSD to zero for large U / E does not indicate an increase
in similarity of the distributions; it becomes a pathologi- cal comparison at that point and simply reflects that most sequences fold to a single conformation, the helix. The single-sequence dissimilarity distribution collapses to a peak at 0 and the QQ plot is fit well by a line of slope 0, while the single-conformation distribution becomes un- defined because there is only one conformation.
The mean scores graphed in Figure 10B simply confirm the expected result that sets of 16-residue conformations on a 2D lattice do not have as much structural variation as 3D proteins of lengths from about 50 to 200 residues. The mean score for the model decreases with increasing u/e, as native conformations become increasingly helical and tend to resemble each other more closely. What is more surprising, however, is that the model dissimilarity distributions predicted by the model for u/e < 1 have ap- proximately the same width as the PDB (Fig. 1OC). This result indicates that the model displays a range of struc- tural variation similar to the PDB.
Thus, the dissimilarity distribution for the single- sequence set at u/c = 0 differs from the PDB distribution primarily in having a lower mean score. I f we were to shift the PDB distribution to match this lower mean score, the low-score tail of the distribution would show negative dis- similarity scores. Significantly, the relative area of this low-score region almost exactly matches the relative area of the zero-score peak of the single-sequence distribution
I
00 1 0 20 3 U I E
C
0 0 4 - 00 1 0 2 0 3 0 . , I I . I ,-
0 1 E
O 5 1 00 1 0 20 30
U1.E
Fig. 10. Comparing the QQ plots. A: RMSD of QQ plots from linear- ity. The inset uses the "minimum stability" requirement for defining pro- teinlike conformational states, which yields a "continuous" curve for u/c 5 0.15. An RMSD of 0 indicates that two distribution shapes are identical; larger RMSDs indicate less similarity between distribution shapes. B: Mean dissimilarity scores of the distributions. The PDB dis- tribution has a mean of 0.71. c: Slopes of linear fits to the QQ plots. A slope of 1 indicates that the two distributions have identical widths; smaller slopes indicate narrower distributions. Solid and dashed lines represent single-sequence and single-conformation sets, respectively.

P.D. Thomas and K.A. Dill
for u/e = 0. This tail indicates some clustering of the pro- teins in the PDB into families (Yee & Dill, 1993), which the low-resolution model reflects as different sequences having identical conformations. In this way, the single- sequence set for U / E = 0 captures a prominent feature of the PDB that is absent from the single-conformation sets.
We conclude that the closest resemblance of the model to real proteins is obtained when the nonlocal interactions dominate and the local interactions in the model are small. Thus, adding a helical interaction to the HP model does not improve its ability to resemble properties of proteins in the PDB. Even if the 2D model intrinsically overesti- mates the amounts of helix, then it would artifactually ac- count for why no helical propensities need be added to the H P model to reach the amounts of helix observed in real proteins. But this explanation would fail to account for the agreement of the distributions of secondary structural types, the decreasing frequency of helices with length, and the pairwise tertiary structural similarities. Apart from the disagreement of the chain-length-dependent mean score, the distribution of model native structures for U / E = 0 re- sembles closely that of proteins, including some cluster- ing into families seen in the single-sequence set. Because the model has the low resolution of a square lattice, is re- stricted to short chains, and is two dimensional, it is ob- viously not a microscopically accurate representation of real proteins. Nevertheless, the model reproduces the gen- eral features of these distributions, and two different mea- sures, of secondary and tertiary structures, show that the best correspondence with real proteins is obtained when local interactions are set to be very small compared to nonlocal interactions. The implications of the model for proteins are that the relative distributions of helix and sheet, and the general distribution of tertiary structural topologies, of globular proteins in aqueous solution are dictated more strongly by the nonlocal hydrophobic in- teractions than by helical propensities.
The mechanism of alcohol denaturation
Globular proteins can be denatured or stabilized by agents in solution that mediate nonlocal or local interactions or both. For example, whereas urea and guanidine hydro- chloride disrupt both hydrophobic clustering and second- ary structure, denaturation by alcohols is more complex. Also, peptides adopt different secondary structures de- pending on the nature of the solvent (Zhong & Johnson, 1992). In this section, we use the helical-HP model to ex- plore the different classes of structures that could arise when different types of agents, particularly alcohols, act on globular proteins.
How might alcohols affect peptide and protein confor- mations? Several physical mechanisms have been proposed to explain these conformational effects, but the relative importance of each has not yet been resolved. Focusing on helix induction by TFE, Nelson and Kallenbach (1 986)
have compared charge and hydrogen-bonding mecha- nisms. The dielectric constant of TFE is approximately one-third that of water, so charge interactions should be more important in TFE. By varying the dielectric con- stant, Nelson and Kallenbach found a negligible increase in peptide helix stabilization in TFE and concluded that hydrogen bonding may be the more important mechanism of the two. Nuclear magnetic resonance studies by Llinas and Klein (1975) have shown that TFE is a slightly stronger proton donor than water, but is a much weaker proton acceptor. Polypeptide backbone groups have both donors and acceptors. Because the effect of TFE on pro- ton acceptance dominates, adding TFE to aqueous solu- tion will primarily decrease the solvent’s ability to compete with peptide carbonyl acceptors. In TFE, the peptide am- ide donors should therefore favor making hydrogen bonds with peptide carbonyls. Therefore, Nelson and Kallenbach (1986) concluded that intramolecular hydro- gen bonds should be strengthened by the addition of TFE to an aqueous solution. Because the a-helical conforma- tion forms backbone-backbone hydrogen bonds, it will become increasingly favored by addition of TFE to an aqueous solution.
The effects of alcohols on polypeptides have been found to be strongly sequence-dependent (Lehrman et al., 1990; Segawa et al., 1991; Sonnichsen et al., 1992). The tendency to induce helical structure has been found in nearly all studies, but the amount of alcohol needed var- ies widely depending on the sequence and the length of the polypeptide. Three peptides corresponding to &sheet- containing regions of plastocyanin show no appreciable increase in helical content in up to 90% TFE (Dyson et al., 1992). For some peptides, the amount of TFE required for the coil-to-helix transition correlates with the helical propensity according to secondary-structure prediction methods such as those of Chou and Fasman (1974). For proteins, the effects of alcohol appear to be more com- plex. Myelin basic protein (MBP) in 92% TFE shows ap- proximately 47% helical structure as judged from far-UV circular dichroism data (Stone et al., 1985), whereas ubiq- uitin shows almost 100% helical structure under similar conditions (Wilkinson & Mayer, 1986). More recent NMR studies of ubiquitin in 60% methanol (dielectric con- stant = 5 l), however, indicate that much of the native sec- ondary structure is preserved despite the strongly helical CD results (Harding et al., 1991). In additional studies on the fragments of MBP (Stone et al., 1985) and other pro- teins (Lehrman et al., 1990; Segawa et al., 1991), the sum of CD spectra for proteolytic fragments of a protein is found to differ from the spectrum for the intact protein. Hence, nonlocal interactions appear to play some role in determining the conformations that are induced by alcohols.
The stability of ribonuclease is decreased by addition of alcohols and tetraalkylammonium salts; the magnitude of this decrease depends only on the number of effective

Local and nonlocal interactions in proteins 206
methylene groups of the compound, i.e., on the hydro- phobicity of the solvent (von Hippel & Wong, 1965). Fur- ther, the effect of ethanol on the thermodynamics of thermal ribonuclease denaturation displays the same tem- perature dependence as partition experiments on small hydrophobic solutes (Brandts & Hunt, 1967). NMR and near-UV CD studies of alcohol-induced states of proteins indicate a disruption of well-defined tertiary structure (Dufour & HaertlC, 1990; Harding et al., 1991; Buck et al., 1993; Fan et al., 1993; Alexandrescu et al., 1994). The alcohol denaturation of ubiquitin (Wilkinson & Mayer, 1986) and myoglobin appears to be well described by a “preferential solvation model” in which alcohols are pro- posed to interact most strongly with hydrophobic groups on the protein (Arakawa & Goddette, 1985). Therefore, in addition to its effects on hydrogen bonding, TFE and other alcohols may also affect the strength of nonlocal interactions in proteins.
Thus, it is known how the helicity of some proteins changes with concentration of agents such as TFE and urea. Because these agents affect both local and non- local interactions, our model provides a way to explore their actions. The helical-HP model contains both local and nonlocal mechanisms in their simplest forms. The strengthening of intramolecular helical bonds of proteins in TFE is modeled as an increase in the helical bond energy, u. The weakening of hydrophobic interactions is modeled as a decrease in the HH contact interaction en- ergy, c. As noted earlier, we have found that globular pro- teins in aqueous solutions are best represented in our model by taking the ratio of local to nonlocal interaction strength, U / E , to be approximately zero. Now, let us sup- pose the effect of increasing the concentration of some agent, such as alcohol, is to strengthen helical bonds (a more negative) and weaken HH interactions ( E less neg- ative) in the ratio p . For example, for an agent that has p = 1, every increment of its concentration leads to 1 unit of free energy stabilization of helical interactions and 1 unit of free energy destabilization of the HH interac- tion. An agent that has p = 0 is one that acts entirely to weaken HH interactions. An agent with p >> 1 is a pure helical bond stabilizer. An agent with p << -1 is a pure helical bond destabilizer. Figure 11A shows a native state phase diagram for a helical-HP sequence, and the lines with different slopes, p , correspond to the ways that dif- ferent agents will lead to the traversal of different stable conformations.
The average helicity, ( h / N ) , for any helical-HP se- quence can be calculated as a function of the energies u and E , using
A native states
10
8
” 6 5 b 4 \
2
0 , 0 2 4 6 8 1 0
cl -kT
B <helicity>
10
8
C 6 + b 4 \
2
0 0 2 4 6 8 1 0
El-kT
Fig. 11. Model solvent effects on u and E . A: The dashed lines show dif- ferent possible models for how an incremental change in solvent con- centration affects u and E , in the ratios (from bottom to top) p = 1/5, 112, 1, 2 for the native state phase diagram of the sequence (PHPPPHPPHPHPHHHP). The alcohol-induced conformations are less stable than the aqueous native state for p < 1 . B: The correspond- ing (helicity) phase diagram, calculated from Equation 7.
where h is the number of residues participating in helices, Nis the chain length, and all other symbols are as defined for Equation 4. Figure 11B shows a sample (helicity) phase diagram for a helical-HP sequence.
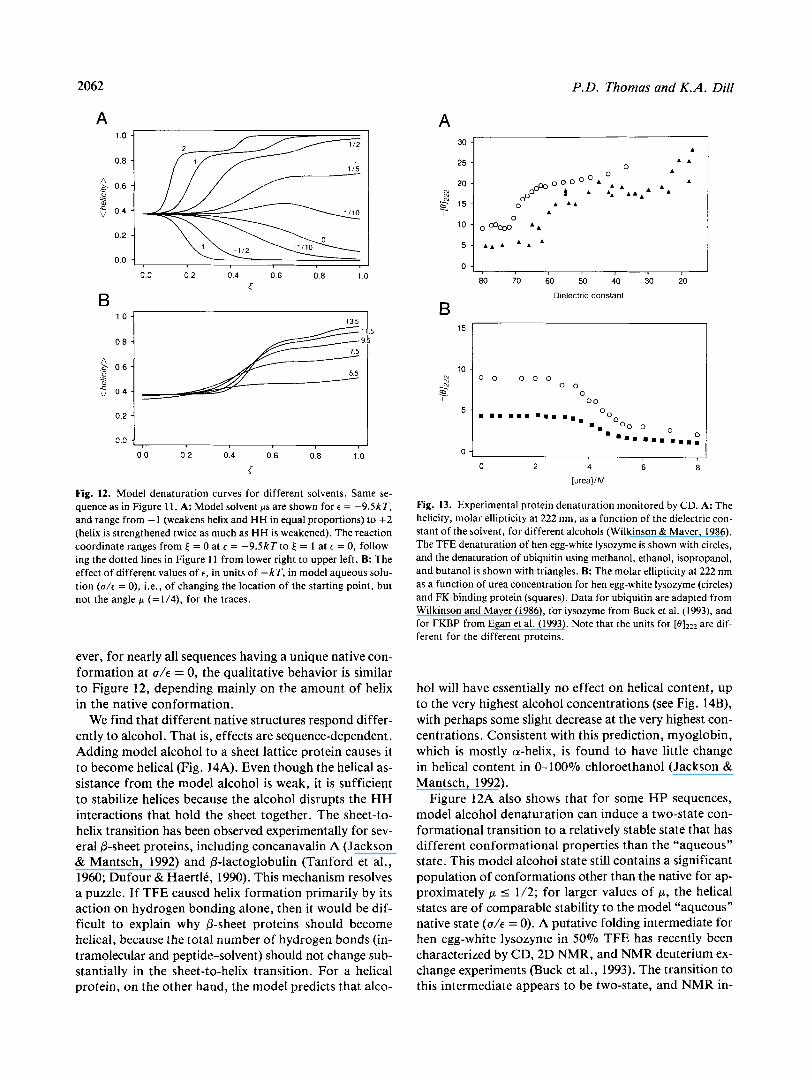
Figure 12A shows the model denaturation curves for the sequence in Figure 11. The various curves represent different balances ( p ) in the increase in helical bond strength relative to the decrease in HH interaction strength. These curves are “slices” through the (helicity) phase diagram (Fig. 11B). For comparison, experimental helicities measured by far-UV CD during alcohol and urea denaturation of different proteins are shown in Fig- ure 13. The alcohol-denaturation data (Fig. 13A) are best fit by approximately 112 < p < 1/5, suggesting that the primary effect of alcohol is on the nonlocal interactions rather than on the local helical interactions. That is, in the action of alcohols on the conformations of globular pro- teins, our model predicts that the effect on the hydropho- bic contribution to the free energy is two- to fivefold more important than the effect on helical propensities. We re- fer to agents with these values of p as “model alcohols.’’
Let us compare denaturation by urea with denaturation by alcohols. Figure 13B shows the experimental CD data for lysozyme and FK-binding protein (FKBP). The model best fits these curves for a range of values p I 0. Thus, whereas TFE and other alcohols strengthen helical pro- pensities, urea weakens them. According to this model comparison, urea acts on proteins mainly by weakening the intrachain hydrophobic interactions and to a lesser de- gree by weakening helical propensities.
The shapes of the transition curves depend not only on p but also on the value of E chosen to represent the pure “aqueous” solution. The value of E controls the sharpness of the curves (see Fig. 12B). We also find that different HP sequences yield different denaturation curves. How-
P.D. Thomas and K.A. Dill 2062
A
s 3
V
= E
1 0
0.8
06
0 4
0 2
00
0 0 02 0 4 06 0 8 1 0 c
B
O 2 1 0 0 0 2 0 4 0.6 08 1 .o
E
Fig. 12. Model denaturation curves for different solvents. Same se- quence as in Figure l l . A: Model solvent ps are shown for E = -9SkT, and range from -1 (weakens helix and HH in equal proportions) to f 2 (helix is strengthened twice as much as HH is weakened). The reaction coordinate ranges from E = 0 at E = -9.5kTto = 1 at E = 0, follow- ing the dotted lines in Figure 11 from lower right to upper left. B: The effect of different values o f t , in units of -kT, in model aqueous solu- tion (U/E = 0), i.e., of changing the location of the starting point, but not the angle p (=1/4), for the traces.
ever, for nearly all sequences having a unique native con- formation at U / E = 0, the qualitative behavior is similar to Figure 12, depending mainly on the amount of helix in the native conformation.
We find that different native structures respond differ- ently to alcohol. That is, effects are sequence-dependent. Adding model alcohol to a sheet lattice protein causes it to become helical (Fig. 14A). Even though the helical as- sistance from the model alcohol is weak, it is sufficient to stabilize helices because the alcohol disrupts the H H interactions that hold the sheet together. The sheet-to- helix transition has been observed experimentally for sev- eral P-sheet proteins, including concanavalin A (Jackson & Mantsch, 1992) and P-lactoglobulin (Tanford et al., 1960; Dufour & Haertlt, 1990). This mechanism resolves a puzzle. If TFE caused helix formation primarily by its action on hydrogen bonding alone, then it would be dif- ficult to explain why P-sheet proteins should become helical, because the total number of hydrogen bonds (in- tramolecular and peptide-solvent) should not change sub- stantially in the sheet-to-helix transition. For a helical protein, on the other hand, the model predicts that alco-
A 30
25
20
2 15 e i\i
10
5
0
B
A
80 70 60 50 40 30 20
Dlelectrlc constant
10 N
N s 0 0 0 0 0
0 0 0
0 0
0 2 6 8
[ureajiM
Fig. 13. Experimental protein denaturation monitored by CD. A: The helicity, molar ellipticity a t 222 nm, as a function of the dielectric con- stant of the solvent, for different alcohols (Wilkinson & Mayer, 1986). The TFE denaturation of hen egg-white lysozyme is shown with circles, and the denaturation of ubiquitin using methanol, ethanol, isopropanol, and butanol is shown with triangles. B: The molar ellipticity a t 222 nm as a function of urea concentration for hen egg-white lysozyme (circles) and FK-binding protein (squares). Data for ubiquitin are adapted from Wilkinson and Mayer (1986), for lysozyme from Buck et al. (1993), and for FKBP from Egan et al. (1993). Note that the units for [e1222 are dif- ferent for the different proteins.
hol will have essentially no effect on helical content, up to the very highest alcohol concentrations (see Fig. 14B), with perhaps some slight decrease at the very highest con- centrations. Consistent with this prediction, myoglobin, which is mostly a-helix, is found to have little change in helical content in 0-100% chloroethanol (Jackson & Mantsch, 1992).
Figure 12A also shows that for some HP sequences, model alcohol denaturation can induce a two-state con- formational transition to a relatively stable state that has different conformational properties than the “aqueous” state. This model alcohol state still contains a significant population of conformations other than the native for ap- proximately p I 1/2; for larger values of p, the helical states are of comparable stability to the model “aqueous” native state ( U / E = 0). A putative folding intermediate for hen egg-white lysozyme in 50% TFE has recently been characterized by CD, 2D NMR, and NMR deuterium ex- change experiments (Buck et al., 1993). The transition to this intermediate appears to be two-state, and NMR in-

Local and nonlocal interactions in proteins
A 1 0
08
2 06 G .=
0 4
0 2
0 0
B
-1/2
00 0 2 0 4 06 08 1 0
t
0 2 - -1/2
0 0 -
0.0 0 2 0 4 06 08 1 0
f
Fig. 14. A: A model sheet protein becomes helical in model alcohol (115 < p < 112). but denatures in model urea ( p = -1/2). Sequence HPHHPHHHHHHPHHHH has a sheet conformation in aqueous con- ditions ( U / E = 0). B: A model helical bundle protein, sequence HHPH HHHPHHPHHHHH, does not change helical content in model alco- hol, but denatures in model urea.
dicates significant conformational averaging in the inter- mediate state. A novel state of @-lactoglobulin has also been observed at about 20% ethanol that shows a differ- ent binding stoichiometry and only a small change in el- lipticity at 222 nm relative to the aqueous protein (Dufour & HaertlC, 1990). Monellin adopts a relatively stable non- native conformation in both 50% ethanol and 50% TFE, in which one of the @-strands converts to an a-helix while the native a-helix remains intact (Fan et al., 1993). Two helical regions have been identified from the 2D NMR spectrum of a-lactalbumin in 50% TFE at low pH (Alex- andrescu et al., 1994); one of these regions forms an a-helix in the aqueous conformation as well, while the other does so only in the presence of TFE. We find simi- lar behavior for the model helical-HP sequence shown in Figure 11A. A conformational transition occurs at U / E = 113 in which the N-terminal residues become helical in model alcohol. This state contains three native conforma- tions, all of which preserve the C-terminal helix found in the native state as well as the N-terminal model alcohol- induced helix. The three conformations differ in the rel- ative orientation of the two helices, i.e., the secondary structure is well defined but the tertiary structure is not.
2063
Despite its simplicity, the helical-HP model displays features of real proteins in solutions with alcohol cosol- vents, including CD curves and conformational transi- tions for some sequences. These data are qualitatively fit for a range of values 1/5 < p < 1/2, which suggests that the dominant effect of alcohols on aqueous protein so- lutions is on the hydrophobic interaction. The model pre- dicts that all sequences will ultimately become helical in alcohol solutions. The observation that some peptides do not adopt a helical conformation in TFE (Dyson et al., 1992) would require a generalization of the model in which different residues would have different helical propensities.
Conclusions
We describe the helical-HP lattice model of protein con- formations. It contains two interaction parameters: E , rep- resenting the nonlocal contact interactions that favor HH contacts, and u, representing a local propensity for helix formation. For all the possible sequences for chains of length n = 16, we vary these two energy parameters over their full ranges. When the HH contact energy is the dom- inant interaction, different sequences collapse to differ- ent unique native conformations that are compact and globular. When the helix interaction is dominant, the lowest energy state of all sequences is the helical confor- mation. What relative strength of helical and HH contact energies causes the lattice model to have structural prop- erties resembling those of real proteins? We consider two structural properties. First, we consider the relative amounts of different types of secondary structure. HH- driven compactness alone, in the absence of significant lo- cal interactions, leads to model distributions of secondary structures that most closely resemble those of proteins in the PDB. Even a small increase in the helical interactions in the model leads to much more helix than is observed in real proteins. The second property we consider is the distribution of tertiary structural similarities among all proteins. The 2D lattice model gives distributions that closely resemble those of real proteins. For this property, too, the model most closely resembles real proteins if the helical interaction is very small. Of course, there are im- portant caveats due to the simplicity of the model-it is two dimensional, restricted to lattice conformations, low resolution, and it involves only short chains. Nevertheless, the similarities we find, for different properties, between real proteins and our model at U / E = 0 suggest that intrin- sic helical propensities may not be a strong driving force for the folding of globular proteins.
When both HH and helical interactions are present, chains are found to undergo conformational switching transitions often from one unique conformation to an- other in response to changes in external solvent condi- tions. Conformational switching involves transitions between different native states, and results from a trade- off between helix formation and HH contacts. This model

2064 P.D. Thomas and K.A. Dill
describes the effects of different types of denaturing agents on protein conformations, including the transitions of sheet proteins and others to helical conformations in alcohols. Comparisons with experiments suggest that whereas urea weakens nonlocal hydrophobic interactions and helical propensities, alcohols such as TFE act mainly by weakening hydrophobic interactions but with some small strengthening of helical propensities.
Acknowledgments
We thank David Yee and Dr. Hue Sun Chan for helpful discus- sions and for providing some computer programs, and Dr. Chris Dobson for helpful discussions and for sending preprints prior to publication. Support was provided by the NIH. P.D. Thomas is a Howard Hughes Medical Institute Predoctoral Fellow.
References
Alexandrescu, A.T., Ng, Y.-L., & Dobson, C.M. (1994). Characteriza- tion of a TFEinduced partially folded state of a-lactalbumin. J. Mol. Biol., in press.
Anfinsen, C.B. & Scheraga, H.A. (1975). Experimental and theoreti- cal aspects of protein folding. Adv. Protein Chem. 29, 205-300.
Arakawa, T. & Goddette, D. (1985). The mechanism of helical transi- tion of proteins by organic solvents. Arch. Biochem. Biophys. 240, 21-32.
Brandts, J.F. & Hunt, L. (1967). The thermodynamics of protein de- naturation. 111. The denaturation of ribonuclease in water and in aqueous urea and aqueous ethanol mixtures. J. Am. Chem. Soc. 89,
Buck, M., Radford, S.E., &Dobson, C.M. (1993). A partially folded state of hen egg white lysozyme in trifluoroethanol: Structural char- acterization and implications for protein folding. Biochemistry 32, 669-678.
Camacho, C.J. & Thirumalai, D. (1993a). Kinetics and thermodynam- ics of folding in model proteins. Proc. Natl. Acad. Sci. USA 90,
Camacho, C.J. & Thirumalai, D. (1993b). Minimum energy compact structures of random sequences of heteropolymers. Phys. Rev. Lett., in press.
Chambers, J.M., Cleveland, W.S., Kleiner, B., &Tukey, P.A. (1983). Graphical Methods for Data Analysis. Duxbury Press, Boston.
Chan, H.S. &Dill, K.A. (1989). Compact polymers. Macromolecules 22, 4559-4573.
Chan, H.S. & Dill K.A. (1990). Origins of structure in globular proteins. Proc. Natl. Acad. Sci. USA 87, 6388-6392.
Chan, H.S. & Dill, K.A. (1991a). Sequence-space soup of proteins and copolymers. J. Chem. Phys. 95, 3775-3787.
Chan, H.S. & Dill, K.A. (1991b). Polymer principles in protein struc- ture and stability. Annu. Rev. Biophys. Biophys. Chem. 20,447-449.
Chothia, C. (1976). The nature of accessible and buried surfaces in pro- teins. J. Mol. Biol. 105, 1-14.
Chou, P.Y. & Fasman, G.D. (1974). Prediction of protein conforma- tion. Biochemistry 13, 222-245.
Chou, P.Y., Wells, M., & Fasman, G.D. (1972). Conformational stud- ies on copolymers of hydroxylpropyl-L-glutamine and L-leucine. Cir- cular dichroism studies. Biochemistry 11, 3028-3043.
Dill, K.A. (1990). Dominant forces in protein folding. Biochemistry 29,
Dufour, E. & Haertle, T. (1990). Alcohol-induced changes of p-lacto- globulin-retinol binding stoichiometry. Protein Eng. 4 , 185-190.
Dyson, H.J., Sayre, J.R., Merutka, G., Shin, H.-C., Lerner, R.A., & Wright, P.E. (1992). Folding of peptide fragments comprising the complete sequence of proteins: Models for initiation of protein fold- ing 11. plastocyanin. J. Mol. Biol. 226, 818-835.
Dyson, H.J. & Wright, P.E. (1991). Defining solution conformations
4826-4838.
6369-6372.
7133-7155.
of small linear peptides. Annu. Rev. Biophys. Biophys. Chem. 20,
Egan, D.A., Logan, T.M., Liang, H., Matayoshi, E., Fesik, S.W., & Holzman, T.F. (1993). Equilibrium denaturation of recombinant hu- man FK binding protein in urea. Biochemistry 32, 1920-1927.
Fan, P., Bracken, C., & Baum, J. (1993). Structural characterization of monellin in the alcohol-denatured state by NMR: Evidence for &sheet to a-helix conversion. Biochemistry 32, 1573-1582.
Fauchere, J.-L. & Pliska, V. (1983). Hydrophobic parameters II of amino acid side chains from the partitioning of N-acetyl-amino acid am- ides. Eur. J. Med. Chem. Ther. Chem. 18, 369-375.
Gregoret, L.M. & Cohen, F.E. (1991). Protein folding-Effect of pack- ing density on chain conformation. J. Mol. Bid. 229, 109-122.
Harding, M.M., Williams, D.H., & Woolfson, D.N. (1991). Character- ization of a partially denatured state of a protein by two-dimensional NMR: Reduction of the hydrophobic interactions in ubiquitin. Bio- chemistry 30, 3120-3128.
Hao, M.H., Rackovsky, S., Liwo, A., Pincus, M.R., & Scheraga, H.A. (1992). Effects of compact volume and chain stiffness on the con- formations of native proteins. Proc. Natl. Acad. Sci. USA 89,
Jackson, M. & Mantsch, H.H. (1992). Halogenated alcohols as solvents for proteins: FTIR spectroscopic results. Biochim. Biophys. Acta 1118, 139-143.
Kabsch, W. & Sander, C. (1983). Dictionary of protein secondary struc- ture: Pattern recognition of hydrogen-bonded and geometrical fea- tures. Biopolymers 22, 2577-2637.
Killian, J.A. (1992). Gramicidin and gramicidin-lipid interactions. Bio- chim. Biophys. Acta 1113, 391-425.
Lau, K.F. & Dill, K.A. (1989). A lattice statistical mechanics model of the conformational and sequence spaces of proteins. Macromolecules 22, 3986-3997.
Lau, K.F. & Dill, K.A. (1990). Theory for protein mutability and bio- genesis. Proc. Natl. Acad. Sci. USA 87, 638-642.
Lehrman, S.R., Tuls, J.L., & Lund, M. (1990). Peptide a-helicity in aqueous TFE: Correlations with predicted a-helicity and the second- ary structure of the corresponding regions of bovine growth hor- mone. Biochemistry 29, 5590-5596.
Lesk, A.M. (1991). Protein Architecture [Practical Approach Series]. IRL Press, New York.
Lipman, D.J. & Wilbur, W.J. (1991). Modelling neutral and selective evolution of protein folding. Proc. R. Soc. Lond. B 245, 7-1 1.
Llinas, M. & Klein, M.P. (1975). Charge relay at the peptide bond: a protein magnetic resonance study of solvation effects on the amide electron density distribution. J. Am. Chem. SOC. 97, 4731-4737.
Lyu, P.C., Liff, M.I., Marky, L.A., & Kallenbach, N.R. (1990). Side chain contributions to the stability of alpha-helical structure in pep- tides. Science 250, 669-673.
Miller, R., Danko, C.A., Fasolka, M.J., Balazs, A.C., Chan, H.S., & Dill, K.A. (1992). Folding kinetics of proteins and copolymers. J. Chem. Phys. 96, 768-790.
Mutter, M. & Hersperger, R. (1990). Peptides as conformational switch: Medium-induced conformational transitions of designed peptides. Ang. Chem. 29, 185-187.
Nandi, P.K. & Robinson, D.R. (1984). Effects of urea and guanidine hydrochloride on peptide and nonpolar groups. Biochemistry 23, 6661-6668.
Nelson, J.W. & Kallenbach, N.R. (1986). Stabilization of the Ribonu- clease S-peptide a-helix by trifluoroethanol. Proteins Struct. Funct. Genet. I , 211-217.
Nozaki, Y. & Tanford, C. (1971). The solubility of amino acids and two
J. Biol. Chem. 246, 2211-2217. glycine polypeptides in aqueous ethanol and dioxane solutions.
O’Neil, K.T. & DeGrado, W.F. (1990). A thermodynamic scale for the helix-forming tendencies of the commonly occurring amino acids. Science 250, 646-65 1.
OToole, E.M. & Panagiotopoulos, A.Z. (1993). Effect of sequence and intermolecular interactions on the number and nature of low-energy states for simple model proteins. J. Chem. Phys. 90, 3185-3190.
Rees, D.C., DeAntonio, L., & Eisenberg, D. (1989). Hydrophobic or- ganization of membrane proteins. Science 245, 510-513.
Richards, F.M. & Richmond, T. (1978). Solvents, interfaces and pro- tein structure. In Molecular Interactions and Activity in Proteins
519-538.
6614-6618.

Local and nonlocal interactions in proteins 2065
(Wolstenholme, G.E., Ed.), pp. 23-45. Ciba Foundation Symposium 60. Excerpta Medica, Amsterdam.
Robinson, D.R. & Jencks, W.P. (1965). The effect of compounds of the urea-guanidinium class on the activity coefficient of the acetyltet-
2462-2470. raglycine ethyl ester and related compounds. J. Am. Chem. Soc. 87,
Rose, G.D., Geselowitz, A.R., Lesser, G.J., Lee, R.H., & Zehfus, M.H. (1985). Hydrophobicity of amino acid residues in globular proteins. Science 229, 834-838.
Scholtz, J.M. & Baldwin, R.L. (1992). The mechanism of alpha-helix formation by peptides. Annu. Rev. Biophys. Biomol. Struct. 21,
Segawa, S.-I., Fukono, T., Fujiwara, K., & Noda, Y. (1991). Local struc- tures in unfolded lysozyme and correlation with secondary structures in the native conformation: Helix-forming and -breaking propen- sity of peptide segments. Biopolymers 31, 497-509.
Shoemaker, K.R., Fairman, R., York, E. J., Stewart, J.M., & Baldwin, R.L. (1988). Circular dichroism measurement of peptide helix un- folding. In Peptides: Proceedings of the Tenth American Peptide Symposium (Marshall, G.R. , Ed.), pp. 15-20. ESCOM, Leiden.
Shortle, D., Chan, H.S., & Dill, K.A. (1992). Modeling the effects of mutations on the denatured states of proteins. Protein Sci. I , 201-215.
Sonnichsen, F.D., van Eyk, J.E., Hodges, R.S., & Sykes, B.D. (1992). Effect of TFE on protein secondary structure: An NMR and CD study using a synthetic actin peptide. Biochemistry 31, 8790-8798.
Stickle, D.F., Presta, L.G., Dill, K.A., &Rose, G.D. (1992). Hydrogen bonding in globular proteins. J. Mol. Biol. 226, 1143-1159.
95-118.
Stone, A.L., Park, J.Y., & Martenson, R.E. (1985). Low-ultraviolet CD spectra of oligopeptides 1-95 and 96-168 derived from myelin ba- sic protein of rabbit. Biochemistry 24, 6666-6673.
Tamburro, A.M., Scatturin, A., Rocchi, R., Marchiori, F., Borin, G., & Scoffone, E. (1968). Conformational transitions of bovine pan- creatic ribonuclease S-peptide. FEBS Lett. I , 298-300.
Tanford, C. (1968). Protein denaturation. Adv. Protein Chem. 23,
Tanford, C., De, P.K., & Taggart, V.G. (1960). The role of the a-helix in the structure of proteins: Optical rotatory dispersion of &lacto- globulin. J. Am. Chem. SOC. 82, 6028-6034.
Unger, R. & Moult, J. (1993). Genetic algorithms for protein folding simulations. J. Mol. Biol. 231, 75-81.
von Hippel, P.H. & Wong, K.-Y. (1965). On the conformational stabil- ity of globular proteins: The effects of various electrolytes and non-
240, 3909-3923. electrolytes on the thermal ribonuclease transition. J. Biol. Chem.
Wilkinson, K.D. & Mayer, A.N. (1986). Alcohol-induced conforma- tional changes of ubiquitin. Arch. Biochem. Biophys. 250, 390-399.
Yee, D. & Dill, K.A. (1993). Families and the structural relatedness among globular proteins. Protein Sci. 2, 884-889.
Zhong, L. &Johnson, W.C., Jr. (1992). Environment affects amino acid preference for secondary structure. Proc. Nutl. Acad. Sci. 89,
Zimm, B.H. & Bragg, J.K. (1959). Theory of the phase transition be- tween helix and random coil in polypeptide chains. J. Chem. Phys.
121-282.
4462-4465.
31, 526-535.
Copyright © 2022 FDOKUMEN