Eletrochemical synthesis of CdTe and CdSe quantum dots TGA-capped
Interaction of Globular Plasma Proteins with Water-SolubleCdSe Quantum DotsJyotsana Pathak,[a] Kamla Rawat,*[b, c] Shilpa Sanwlani,[a] and H. B. Bohidar*[a, b]
1. Introduction
Water-soluble luminescent colloidal quantum dots (QDs) haveattracted a lot of attention for biological and pharmaceuticalapplications as drug carriers and imaging agents. Protein–nanoparticle interactions play a key role in biomedical applica-tions, because when nanoparticles enter a cellular environmentthey can form strong interactions with intracellular proteinsthat may result in the transmission of biological signals, due toaltered protein conformations. This perturbed signaling trans-duction in cells may cause toxicity. The biological applicationof semiconductor QDs (semiconductor nanocrystals) has at-tracted considerable attention in the recent years, as they haveseveral features that biologists can utilize, such as size-tunablecolor, broad absorption and narrow emission bands, and largetwo-photon absorption cross-sections.[1, 2] Thus, QDs havefound applications in many areas such as in photonics, phar-maceutics, semiconductor devices and so forth. Common QDsare CdSe, PbS, CdTe, CdS, ZnS, ZnTe, and AsTe. Amongst these,CdSe stands out as a promising nanomaterial, because its opti-cal band gap can be regulated by changing its particle size.However, these particles are hydrophobic and cannot be useddirectly for biological and other applications, for which anaqueous dispersion of nanoparticles is required. The conver-
sion from hydrophobic to hydrophilic properties can be ach-ieved by a phase-transfer process ;[3] however, this is accom-plished at the cost of stability and photoluminescence efficien-cy, as well as with a growth in the particle size.[4]
Size-tunable photoluminescence (PL) is distributed through-out the visible region of the electromagnetic spectrum[5, 6] andhas permitted the extensive use of 3-mercaptopropionic acid(MPA)-capped cadmium selenide (CdSe) QDs in biology, partic-ularly in cellular labeling and imaging. Thus, surface modifica-tion of QDs with biomolecules, especially proteins, has attract-ed a lot of attention lately.[7] In contrast, QDs synthesized innonpolar solutions are only soluble in nonpolar organic sol-vents, and must be made water-soluble through ligand ex-change. Of the two component ions (Cd+ 2 and Se�2), Cd+ 2 be-longs to the heavy-metal group and its effect on plasma pro-teins is not clearly understood. Furthermore, the hydrophobicnature of CdSe particles necessitates their surface modificationto enable them to be water dispersible. Both organic and inor-ganic compounds, including polymers, amines, tri-n-octyl phos-phine oxide (TOPO), and thiols, have commonly been used ascapping agents in the past. Such surface capping preventsnonradiative recombination at the surface sites and also regu-lates growth kinetics by inhibiting aggregation through sterichindrance[8, 9] Notably, the QD interface environment (capping)plays a crucial role in determining its optical properties, suchas luminescence. For instance, the kinetics of the transfer ofphotoelectrons and holes to the capping agent has an overallimpact on the photoluminescence properties of the QDs.[10]
The serum albumin proteins used herein are the most abun-dant proteins found in plasma. They are important carriers forthe storage and transport of endogenous and exogenous drugmolecules; furthermore, they maintain osmotic pressure, act aspH buffers, and function as carriers of nutrients. These proteinswere chosen because of their low cost and ready availability,
The interactions between water-soluble semiconductor quan-tum dots [hydrophilic 3-mercaptopropionic acid (MPA)-coatedCdSe] and three globular plasma proteins, namely, bovineserum albumin (BSA), b-lactoglobulin (b-Lg) and human serumalbumin (HSA), are investigated. Acidic residues of protein mol-ecules form electrostatic interactions with these quantum dots(QDs). To determine the stoichiometry of proteins bound toQDs, we used dynamic light scattering (DLS) and zeta potentialtechniques. Fluorescence resonance energy transfer (FRET) ex-
periments revealed energy transfer from tryptophan residuesin the proteins to the QD particles. Quenching of the intrinsicfluorescence of protein molecules was noticed during thisbinding process (hierarchy HSA<b-Lg <BSA, lower binding af-finity for hydrophobic protein molecules). Upon binding withQD particles, the protein molecules underwent substantial con-formational changes at the secondary-structure level (50 % hel-icity lost), due to loss in hydration.
[a] J. Pathak, S. Sanwlani, H. B. BohidarSchool of Physical Sciences, Jawaharlal Nehru UniversityNew Delhi 110067 (India)
[b] K. Rawat, H. B. BohidarSpecial Center for Nanosciences, Jawaharlal Nehru UniversityNew Delhi 110067 (India)E-mail : [email protected]
[c] K. RawatInter University Accelerator Centre (IUAC)New Delhi 110067 (India)
Supporting Information for this article is available on the WWW underhttp://dx.doi.org/10.1002/cphc.201402629.
ChemPhysChem 0000, 00, 0 – 0 � 0000 Wiley-VCH Verlag GmbH & Co. KGaA, Weinheim1 &
These are not the final page numbers! ��These are not the final page numbers! ��
ArticlesDOI: 10.1002/cphc.201402629
as well as their strong binding affinity to a variety of inorganicmolecules. In particular, water-soluble and biological-compati-ble QDs have played an important role in a wide range of ap-plications in biotechnology, medicine, and other fields.[11–14]
The ability to prepare water-soluble QDs and design them totarget special biomolecules, would enable many applicationsin cellular labeling and imaging. Thus, the surface modificationof QDs[15–21] especially with proteins, e.g. bovine serum albumin(BSA), has attracted much attention lately. These modified QDscombine the unique spectroscopic characteristics of conven-tional QDs with the functions of the proteins.
In the current work, we study the mechanisms of the inter-actions between QDs and human blood proteins to deducetheir toxicology in biology and medicine, and the issue of thesafety of nanomaterials in public health. Rçcker et al. havequantitatively analyzed the adsorption of human serum albu-min onto small polymer-coated FePt and CdSe/ZnS nanoparti-cles by using fluorescence correlation spectroscopy and time-resolve spectroscopy.[22] Here, we provide a comparative studyof the adsorption of BSA, human serum albumin (HSA), andlactoglobulin (b-Lg) onto 3-mercaptopropionic acid (MPA)-capped CdSe nanoparticles, and also study the impact on thesecondary structure of the proteins concerned. In particular,we conduct a systematic and comprehensive study to under-stand globular protein–QD binding by using an array of spec-troscopy experiments. Due to the limited experimental studiesmade on plasma protein-QD systems, to date, the interactionbetween these two moieties remain poorly understood, and atbest empirical ; this, in particular, has motivated the presentwork.
2. Results and Discussion
2.1 Characterization of CdSe QDs
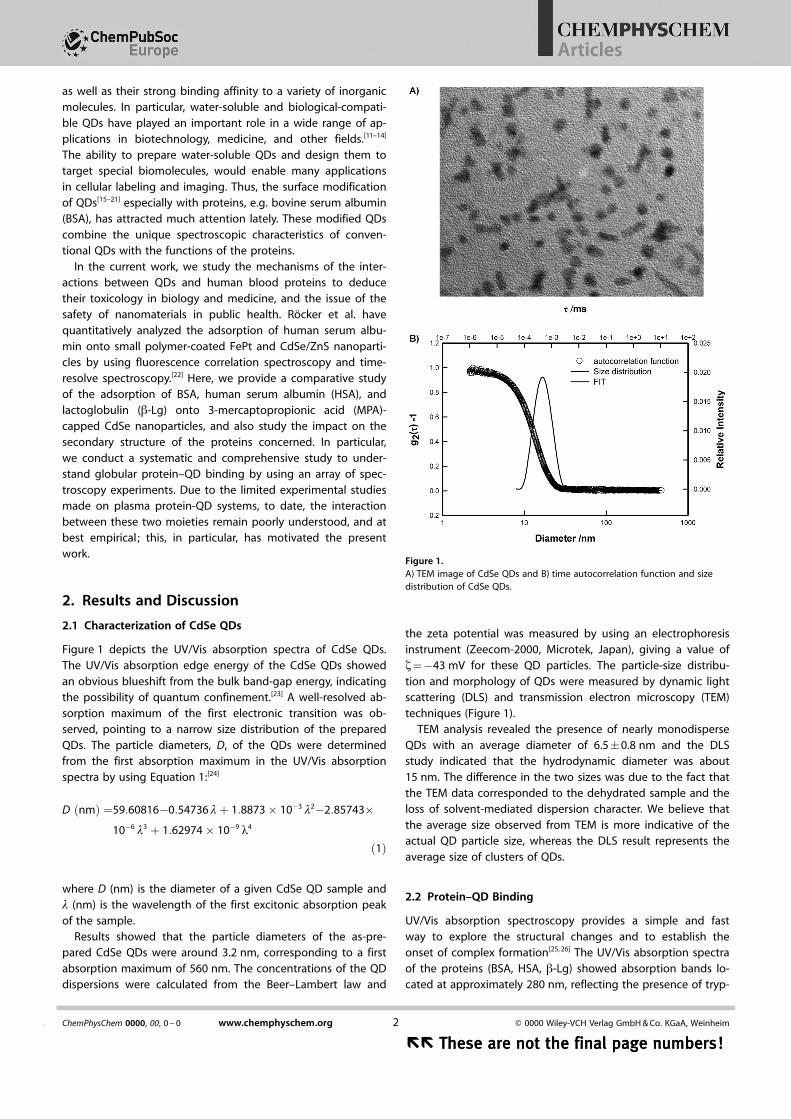
Figure 1 depicts the UV/Vis absorption spectra of CdSe QDs.The UV/Vis absorption edge energy of the CdSe QDs showedan obvious blueshift from the bulk band-gap energy, indicatingthe possibility of quantum confinement.[23] A well-resolved ab-sorption maximum of the first electronic transition was ob-served, pointing to a narrow size distribution of the preparedQDs. The particle diameters, D, of the QDs were determinedfrom the first absorption maximum in the UV/Vis absorptionspectra by using Equation 1:[24]
D ðnmÞ ¼59:60816�0:54736 lþ 1:8873� 10�3 l2�2:85743�10�6 l3 þ 1:62974� 10�9 l4
ð1Þ
where D (nm) is the diameter of a given CdSe QD sample andl (nm) is the wavelength of the first excitonic absorption peakof the sample.
Results showed that the particle diameters of the as-pre-pared CdSe QDs were around 3.2 nm, corresponding to a firstabsorption maximum of 560 nm. The concentrations of the QDdispersions were calculated from the Beer–Lambert law and
the zeta potential was measured by using an electrophoresisinstrument (Zeecom-2000, Microtek, Japan), giving a value ofz=�43 mV for these QD particles. The particle-size distribu-tion and morphology of QDs were measured by dynamic lightscattering (DLS) and transmission electron microscopy (TEM)techniques (Figure 1).
TEM analysis revealed the presence of nearly monodisperseQDs with an average diameter of 6.5�0.8 nm and the DLSstudy indicated that the hydrodynamic diameter was about15 nm. The difference in the two sizes was due to the fact thatthe TEM data corresponded to the dehydrated sample and theloss of solvent-mediated dispersion character. We believe thatthe average size observed from TEM is more indicative of theactual QD particle size, whereas the DLS result represents theaverage size of clusters of QDs.
2.2 Protein–QD Binding
UV/Vis absorption spectroscopy provides a simple and fastway to explore the structural changes and to establish theonset of complex formation[25, 26] The UV/Vis absorption spectraof the proteins (BSA, HSA, b-Lg) showed absorption bands lo-cated at approximately 280 nm, reflecting the presence of tryp-
Figure 1.A) TEM image of CdSe QDs and B) time autocorrelation function and sizedistribution of CdSe QDs.
ChemPhysChem 0000, 00, 0 – 0 www.chemphyschem.org � 0000 Wiley-VCH Verlag GmbH & Co. KGaA, Weinheim2&
�� These are not the final page numbers!�� These are not the final page numbers!
Articles
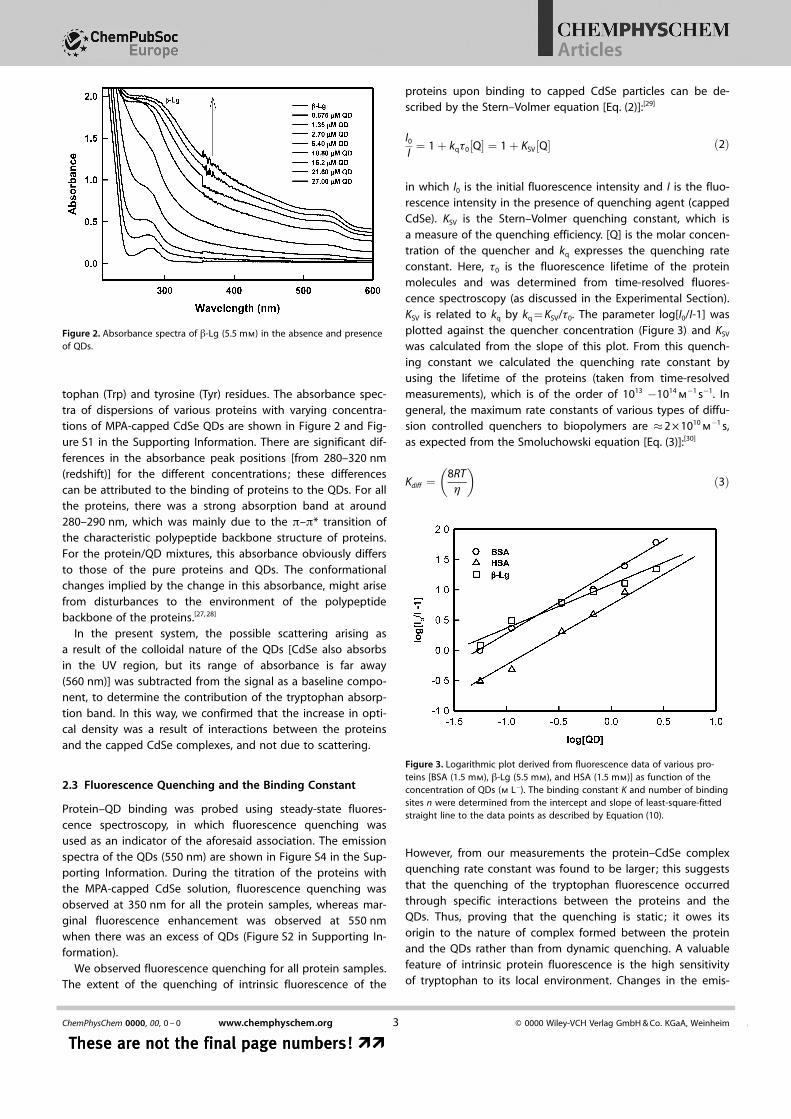
tophan (Trp) and tyrosine (Tyr) residues. The absorbance spec-tra of dispersions of various proteins with varying concentra-tions of MPA-capped CdSe QDs are shown in Figure 2 and Fig-ure S1 in the Supporting Information. There are significant dif-ferences in the absorbance peak positions [from 280–320 nm(redshift)] for the different concentrations; these differencescan be attributed to the binding of proteins to the QDs. For allthe proteins, there was a strong absorption band at around280–290 nm, which was mainly due to the p–p* transition ofthe characteristic polypeptide backbone structure of proteins.For the protein/QD mixtures, this absorbance obviously differsto those of the pure proteins and QDs. The conformationalchanges implied by the change in this absorbance, might arisefrom disturbances to the environment of the polypeptidebackbone of the proteins.[27, 28]
In the present system, the possible scattering arising asa result of the colloidal nature of the QDs [CdSe also absorbsin the UV region, but its range of absorbance is far away(560 nm)] was subtracted from the signal as a baseline compo-nent, to determine the contribution of the tryptophan absorp-tion band. In this way, we confirmed that the increase in opti-cal density was a result of interactions between the proteinsand the capped CdSe complexes, and not due to scattering.
2.3 Fluorescence Quenching and the Binding Constant
Protein–QD binding was probed using steady-state fluores-cence spectroscopy, in which fluorescence quenching wasused as an indicator of the aforesaid association. The emissionspectra of the QDs (550 nm) are shown in Figure S4 in the Sup-porting Information. During the titration of the proteins withthe MPA-capped CdSe solution, fluorescence quenching wasobserved at 350 nm for all the protein samples, whereas mar-ginal fluorescence enhancement was observed at 550 nmwhen there was an excess of QDs (Figure S2 in Supporting In-formation).
We observed fluorescence quenching for all protein samples.The extent of the quenching of intrinsic fluorescence of the
proteins upon binding to capped CdSe particles can be de-scribed by the Stern–Volmer equation [Eq. (2)]:[29]
I0
I¼ 1þ kqt0½Q� ¼ 1þ KSV½Q� ð2Þ
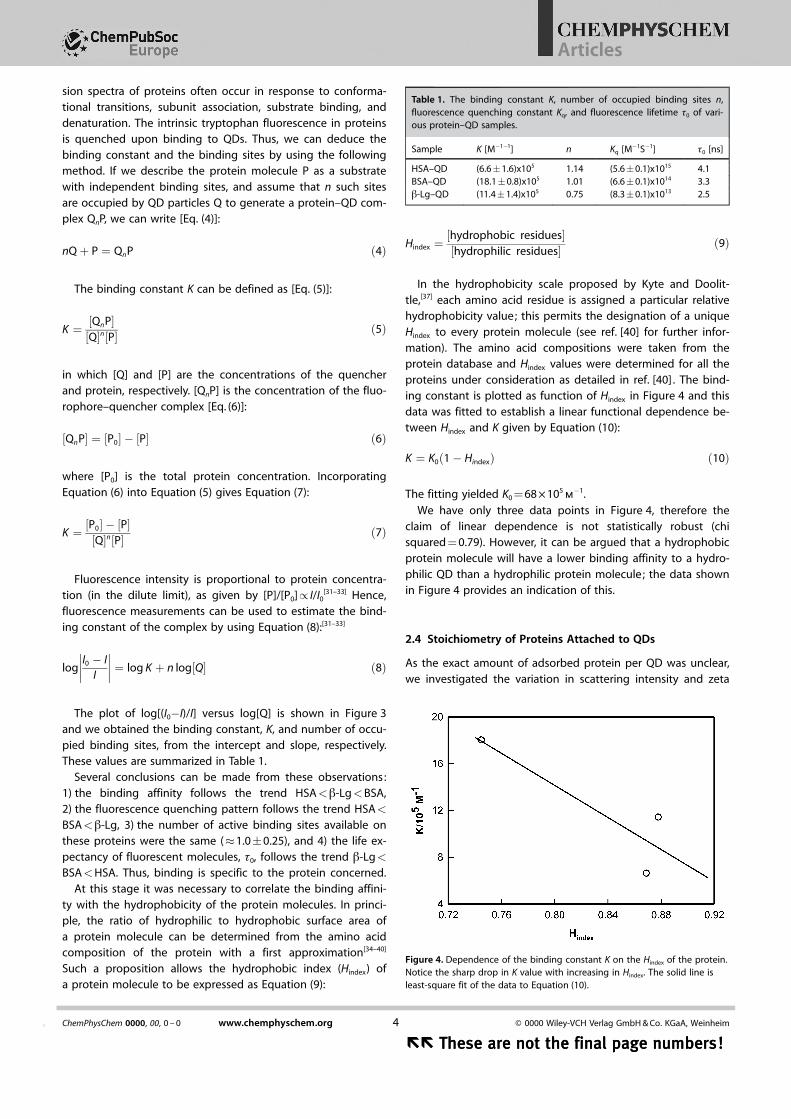
in which I0 is the initial fluorescence intensity and I is the fluo-rescence intensity in the presence of quenching agent (cappedCdSe). KSV is the Stern–Volmer quenching constant, which isa measure of the quenching efficiency. [Q] is the molar concen-tration of the quencher and kq expresses the quenching rateconstant. Here, t0 is the fluorescence lifetime of the proteinmolecules and was determined from time-resolved fluores-cence spectroscopy (as discussed in the Experimental Section).KSV is related to kq by kq = KSV/t0. The parameter log[I0/I-1] wasplotted against the quencher concentration (Figure 3) and KSV
was calculated from the slope of this plot. From this quench-ing constant we calculated the quenching rate constant byusing the lifetime of the proteins (taken from time-resolvedmeasurements), which is of the order of 1013 �1014
m�1 s�1. In
general, the maximum rate constants of various types of diffu-sion controlled quenchers to biopolymers are �2 � 1010
m�1 s,
as expected from the Smoluchowski equation [Eq. (3)]:[30]
Kdiff ¼8RT
h
� �ð3Þ
However, from our measurements the protein–CdSe complexquenching rate constant was found to be larger; this suggeststhat the quenching of the tryptophan fluorescence occurredthrough specific interactions between the proteins and theQDs. Thus, proving that the quenching is static; it owes itsorigin to the nature of complex formed between the proteinand the QDs rather than from dynamic quenching. A valuablefeature of intrinsic protein fluorescence is the high sensitivityof tryptophan to its local environment. Changes in the emis-
Figure 2. Absorbance spectra of b-Lg (5.5 mm) in the absence and presenceof QDs.
Figure 3. Logarithmic plot derived from fluorescence data of various pro-teins [BSA (1.5 mm), b-Lg (5.5 mm), and HSA (1.5 mm)] as function of theconcentration of QDs (m L�). The binding constant K and number of bindingsites n were determined from the intercept and slope of least-square-fittedstraight line to the data points as described by Equation (10).
ChemPhysChem 0000, 00, 0 – 0 www.chemphyschem.org � 0000 Wiley-VCH Verlag GmbH & Co. KGaA, Weinheim3 &
These are not the final page numbers! ��These are not the final page numbers! ��
Articles
sion spectra of proteins often occur in response to conforma-tional transitions, subunit association, substrate binding, anddenaturation. The intrinsic tryptophan fluorescence in proteinsis quenched upon binding to QDs. Thus, we can deduce thebinding constant and the binding sites by using the followingmethod. If we describe the protein molecule P as a substratewith independent binding sites, and assume that n such sitesare occupied by QD particles Q to generate a protein–QD com-plex QnP, we can write [Eq. (4)]:
nQþ P ¼ QnP ð4Þ
The binding constant K can be defined as [Eq. (5)]:
K ¼ ½QnP�½Q�n½P� ð5Þ
in which [Q] and [P] are the concentrations of the quencherand protein, respectively. [QnP] is the concentration of the fluo-rophore–quencher complex [Eq. (6)]:
½QnP� ¼ ½P0� � ½P� ð6Þ
where [P0] is the total protein concentration. IncorporatingEquation (6) into Equation (5) gives Equation (7):
K ¼ ½P0� � ½P�½Q�n½P� ð7Þ
Fluorescence intensity is proportional to protein concentra-tion (in the dilute limit), as given by [P]/[P0]/ I/I0
[31–33] Hence,fluorescence measurements can be used to estimate the bind-ing constant of the complex by using Equation (8):[31–33]
logI0 � I
I
�������� ¼ log K þ n log½Q� ð8Þ
The plot of log[(I0�I)/I] versus log[Q] is shown in Figure 3and we obtained the binding constant, K, and number of occu-pied binding sites, from the intercept and slope, respectively.These values are summarized in Table 1.
Several conclusions can be made from these observations:1) the binding affinity follows the trend HSA<b-Lg<BSA,2) the fluorescence quenching pattern follows the trend HSA<BSA<b-Lg, 3) the number of active binding sites available onthese proteins were the same (�1.0�0.25), and 4) the life ex-pectancy of fluorescent molecules, t0, follows the trend b-Lg<BSA<HSA. Thus, binding is specific to the protein concerned.
At this stage it was necessary to correlate the binding affini-ty with the hydrophobicity of the protein molecules. In princi-ple, the ratio of hydrophilic to hydrophobic surface area ofa protein molecule can be determined from the amino acidcomposition of the protein with a first approximation[34–40]
Such a proposition allows the hydrophobic index (Hindex) ofa protein molecule to be expressed as Equation (9):
Hindex ¼½hydrophobic residues�½hydrophilic residues� ð9Þ
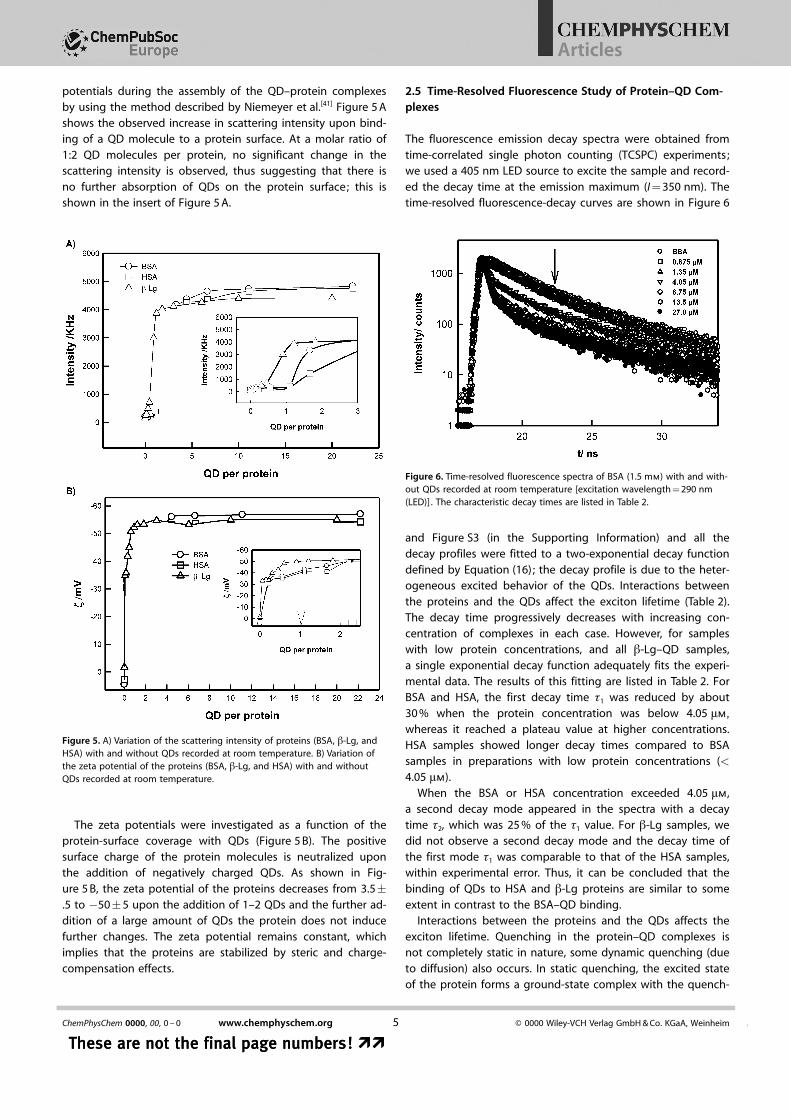
In the hydrophobicity scale proposed by Kyte and Doolit-tle,[37] each amino acid residue is assigned a particular relativehydrophobicity value; this permits the designation of a uniqueHindex to every protein molecule (see ref. [40] for further infor-mation). The amino acid compositions were taken from theprotein database and Hindex values were determined for all theproteins under consideration as detailed in ref. [40] . The bind-ing constant is plotted as function of Hindex in Figure 4 and thisdata was fitted to establish a linear functional dependence be-tween Hindex and K given by Equation (10):
K ¼ K0ð1� HindexÞ ð10Þ
The fitting yielded K0 = 68 � 105m�1.
We have only three data points in Figure 4, therefore theclaim of linear dependence is not statistically robust (chisquared = 0.79). However, it can be argued that a hydrophobicprotein molecule will have a lower binding affinity to a hydro-philic QD than a hydrophilic protein molecule; the data shownin Figure 4 provides an indication of this.
2.4 Stoichiometry of Proteins Attached to QDs
As the exact amount of adsorbed protein per QD was unclear,we investigated the variation in scattering intensity and zeta
Table 1. The binding constant K, number of occupied binding sites n,fluorescence quenching constant Kq, and fluorescence lifetime t0 of vari-ous protein–QD samples.
Sample K [M�1�1] n Kq [M�1S�1] t0 [ns]
HSA–QD (6.6�1.6)x105 1.14 (5.6�0.1)x1015 4.1BSA–QD (18.1�0.8)x105 1.01 (6.6�0.1)x1014 3.3b-Lg–QD (11.4�1.4)x105 0.75 (8.3�0.1)x1013 2.5
Figure 4. Dependence of the binding constant K on the Hindex of the protein.Notice the sharp drop in K value with increasing in Hindex. The solid line isleast-square fit of the data to Equation (10).
ChemPhysChem 0000, 00, 0 – 0 www.chemphyschem.org � 0000 Wiley-VCH Verlag GmbH & Co. KGaA, Weinheim4&
�� These are not the final page numbers!�� These are not the final page numbers!
Articles
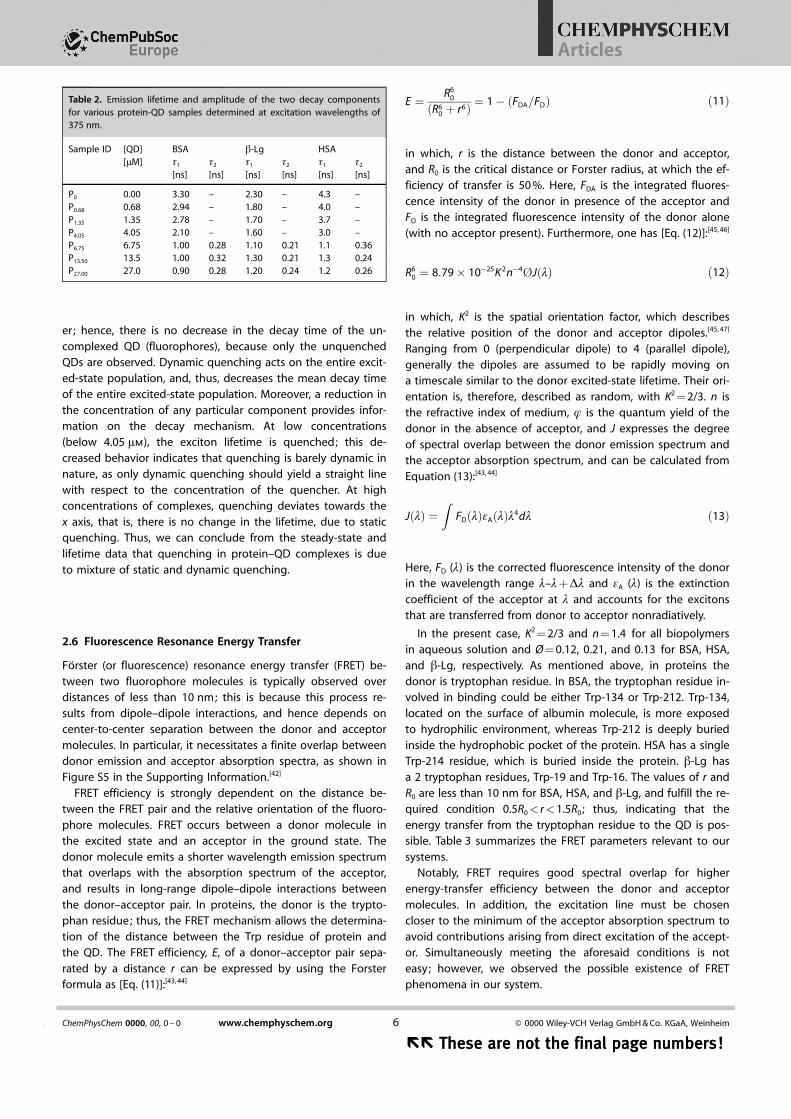
potentials during the assembly of the QD–protein complexesby using the method described by Niemeyer et al.[41] Figure 5 Ashows the observed increase in scattering intensity upon bind-ing of a QD molecule to a protein surface. At a molar ratio of1:2 QD molecules per protein, no significant change in thescattering intensity is observed, thus suggesting that there isno further absorption of QDs on the protein surface; this isshown in the insert of Figure 5 A.
The zeta potentials were investigated as a function of theprotein-surface coverage with QDs (Figure 5 B). The positivesurface charge of the protein molecules is neutralized uponthe addition of negatively charged QDs. As shown in Fig-ure 5 B, the zeta potential of the proteins decreases from 3.5�.5 to �50�5 upon the addition of 1–2 QDs and the further ad-dition of a large amount of QDs the protein does not inducefurther changes. The zeta potential remains constant, whichimplies that the proteins are stabilized by steric and charge-compensation effects.
2.5 Time-Resolved Fluorescence Study of Protein–QD Com-plexes
The fluorescence emission decay spectra were obtained fromtime-correlated single photon counting (TCSPC) experiments;we used a 405 nm LED source to excite the sample and record-ed the decay time at the emission maximum (I = 350 nm). Thetime-resolved fluorescence-decay curves are shown in Figure 6
and Figure S3 (in the Supporting Information) and all thedecay profiles were fitted to a two-exponential decay functiondefined by Equation (16) ; the decay profile is due to the heter-ogeneous excited behavior of the QDs. Interactions betweenthe proteins and the QDs affect the exciton lifetime (Table 2).The decay time progressively decreases with increasing con-centration of complexes in each case. However, for sampleswith low protein concentrations, and all b-Lg–QD samples,a single exponential decay function adequately fits the experi-mental data. The results of this fitting are listed in Table 2. ForBSA and HSA, the first decay time t1 was reduced by about30 % when the protein concentration was below 4.05 mm,
whereas it reached a plateau value at higher concentrations.HSA samples showed longer decay times compared to BSAsamples in preparations with low protein concentrations (<4.05 mm).
When the BSA or HSA concentration exceeded 4.05 mm,a second decay mode appeared in the spectra with a decaytime t2, which was 25 % of the t1 value. For b-Lg samples, wedid not observe a second decay mode and the decay time ofthe first mode t1 was comparable to that of the HSA samples,within experimental error. Thus, it can be concluded that thebinding of QDs to HSA and b-Lg proteins are similar to someextent in contrast to the BSA–QD binding.
Interactions between the proteins and the QDs affects theexciton lifetime. Quenching in the protein–QD complexes isnot completely static in nature, some dynamic quenching (dueto diffusion) also occurs. In static quenching, the excited stateof the protein forms a ground-state complex with the quench-
Figure 5. A) Variation of the scattering intensity of proteins (BSA, b-Lg, andHSA) with and without QDs recorded at room temperature. B) Variation ofthe zeta potential of the proteins (BSA, b-Lg, and HSA) with and withoutQDs recorded at room temperature.
Figure 6. Time-resolved fluorescence spectra of BSA (1.5 mm) with and with-out QDs recorded at room temperature [excitation wavelength = 290 nm(LED)]. The characteristic decay times are listed in Table 2.
ChemPhysChem 0000, 00, 0 – 0 www.chemphyschem.org � 0000 Wiley-VCH Verlag GmbH & Co. KGaA, Weinheim5 &
These are not the final page numbers! ��These are not the final page numbers! ��
Articles
er; hence, there is no decrease in the decay time of the un-complexed QD (fluorophores), because only the unquenchedQDs are observed. Dynamic quenching acts on the entire excit-ed-state population, and, thus, decreases the mean decay timeof the entire excited-state population. Moreover, a reduction inthe concentration of any particular component provides infor-mation on the decay mechanism. At low concentrations(below 4.05 mm), the exciton lifetime is quenched; this de-creased behavior indicates that quenching is barely dynamic innature, as only dynamic quenching should yield a straight linewith respect to the concentration of the quencher. At highconcentrations of complexes, quenching deviates towards thex axis, that is, there is no change in the lifetime, due to staticquenching. Thus, we can conclude from the steady-state andlifetime data that quenching in protein–QD complexes is dueto mixture of static and dynamic quenching.
2.6 Fluorescence Resonance Energy Transfer
Fçrster (or fluorescence) resonance energy transfer (FRET) be-tween two fluorophore molecules is typically observed overdistances of less than 10 nm; this is because this process re-sults from dipole–dipole interactions, and hence depends oncenter-to-center separation between the donor and acceptormolecules. In particular, it necessitates a finite overlap betweendonor emission and acceptor absorption spectra, as shown inFigure S5 in the Supporting Information.[42]
FRET efficiency is strongly dependent on the distance be-tween the FRET pair and the relative orientation of the fluoro-phore molecules. FRET occurs between a donor molecule inthe excited state and an acceptor in the ground state. Thedonor molecule emits a shorter wavelength emission spectrumthat overlaps with the absorption spectrum of the acceptor,and results in long-range dipole–dipole interactions betweenthe donor–acceptor pair. In proteins, the donor is the trypto-phan residue; thus, the FRET mechanism allows the determina-tion of the distance between the Trp residue of protein andthe QD. The FRET efficiency, E, of a donor–acceptor pair sepa-rated by a distance r can be expressed by using the Forsterformula as [Eq. (11)]:[43, 44]
E ¼ R60
ðR60 þ r6Þ ¼ 1� ðFDA=FDÞ ð11Þ
in which, r is the distance between the donor and acceptor,and R0 is the critical distance or Forster radius, at which the ef-ficiency of transfer is 50 %. Here, FDA is the integrated fluores-cence intensity of the donor in presence of the acceptor andFD is the integrated fluorescence intensity of the donor alone(with no acceptor present). Furthermore, one has [Eq. (12)]:[45, 46]
R60 ¼ 8:79� 10�25K 2n�4�JðlÞ ð12Þ
in which, K2 is the spatial orientation factor, which describesthe relative position of the donor and acceptor dipoles.[45, 47]
Ranging from 0 (perpendicular dipole) to 4 (parallel dipole),generally the dipoles are assumed to be rapidly moving ona timescale similar to the donor excited-state lifetime. Their ori-entation is, therefore, described as random, with K2 = 2/3. n isthe refractive index of medium, f is the quantum yield of thedonor in the absence of acceptor, and J expresses the degreeof spectral overlap between the donor emission spectrum andthe acceptor absorption spectrum, and can be calculated fromEquation (13):[43, 44]
JðlÞ ¼Z
FDðlÞeAðlÞl4dl ð13Þ
Here, FD (l) is the corrected fluorescence intensity of the donorin the wavelength range l–l+ Dl and eA (l) is the extinctioncoefficient of the acceptor at l and accounts for the excitonsthat are transferred from donor to acceptor nonradiatively.
In the present case, K2 = 2/3 and n = 1.4 for all biopolymersin aqueous solution and Ø = 0.12, 0.21, and 0.13 for BSA, HSA,and b-Lg, respectively. As mentioned above, in proteins thedonor is tryptophan residue. In BSA, the tryptophan residue in-volved in binding could be either Trp-134 or Trp-212. Trp-134,located on the surface of albumin molecule, is more exposedto hydrophilic environment, whereas Trp-212 is deeply buriedinside the hydrophobic pocket of the protein. HSA has a singleTrp-214 residue, which is buried inside the protein. b-Lg hasa 2 tryptophan residues, Trp-19 and Trp-16. The values of r andR0 are less than 10 nm for BSA, HSA, and b-Lg, and fulfill the re-quired condition 0.5R0< r<1.5R0 ; thus, indicating that theenergy transfer from the tryptophan residue to the QD is pos-sible. Table 3 summarizes the FRET parameters relevant to oursystems.
Notably, FRET requires good spectral overlap for higherenergy-transfer efficiency between the donor and acceptormolecules. In addition, the excitation line must be chosencloser to the minimum of the acceptor absorption spectrum toavoid contributions arising from direct excitation of the accept-or. Simultaneously meeting the aforesaid conditions is noteasy; however, we observed the possible existence of FRETphenomena in our system.
Table 2. Emission lifetime and amplitude of the two decay componentsfor various protein-QD samples determined at excitation wavelengths of375 nm.
Sample ID [QD][mM]
BSA b-Lg HSAt1
[ns]t2
[ns]t1
[ns]t2
[ns]t1
[ns]t2
[ns]
P0 0.00 3.30 – 2.30 – 4.3 –P0.68 0.68 2.94 – 1.80 – 4.0 –P1.35 1.35 2.78 – 1.70 – 3.7 –P4.05 4.05 2.10 – 1.60 – 3.0 –P6.75 6.75 1.00 0.28 1.10 0.21 1.1 0.36P13.50 13.5 1.00 0.32 1.30 0.21 1.3 0.24P27.00 27.0 0.90 0.28 1.20 0.24 1.2 0.26
ChemPhysChem 0000, 00, 0 – 0 www.chemphyschem.org � 0000 Wiley-VCH Verlag GmbH & Co. KGaA, Weinheim6&
�� These are not the final page numbers!�� These are not the final page numbers!
Articles

2.7 Effects on Secondary Structure
Protein–QD interactions may induce protein conformationalchanges and these can be detected by circular dichroism (CD)and FTIR spectroscopy. The basis of CD spectroscopy is the dif-ference between the absorption of right-handed and left-handed circularly polarized light through a sample; this differ-ential absorption is related to the chirality of the proteins. It isa quantitative technique to investigate the secondary structureof proteins in aqueous solution, and the integrity of the secon-dary structure has a bearing on the biological activity of pro-teins.
The CD spectra of the proteins and their QD-bound com-plexes are shown in Figure S5 in the Supporting Information.When QDs were added to the proteins the characteristic peaks(two negative double-humped peaks) corresponding to higha-helical content in proteins became deeper. As the a-helix isone of the elements of secondary structure, the structuralchange of albumin could then be evaluated from the a-helicalcontent (denoted as helicity in Figure 7). The a-helical contentof BSA decreased upon addition of the QDs, which suggestedan interaction between the QDs and protein. The decreasedpercentage of a-helical content indicated that the QDs werebound to the amino acid residues of the main polypeptidechain of the protein, thus destroying their hydrogen-bondingnetworks.[46]
The CD result was expressed in terms of mean residue ellip-ticity (MRE) in deg cm2 dmol�1 [Eq. (14)]:[47]
MRE ¼ ½q�ðm degÞcpnAAl
ð14Þ
where ½q� is the CD in millidegrees obtained from the spectra,cp is the molar concentration of the protein, and nAA is numberof amino acid residues in the protein. The a-helix content ofproteins in the presence and absence of QDs were calculatedfrom Equation (15):
% a-helix ¼ ð�½q� at negative band�4000Þ100½33000�4000 >Þ ð15Þ
The CD data was used in Equation (15) to determine the a-helix content (secondary structure) of various molecular com-plexes (Figure 7). Some of the general features observed were:1) the protein molecules lost 50 % of their helicity when theywere bound to QD particles (region I) and 2) binding saturationoccurred at a QD concentration of 5 mm (region II). This is con-sistent with other experimental results.
2.8 Hydration of Complexes
FTIR spectroscopy is another valuable method for monitoringchanges in the secondary structure of proteins. The specificityof the binding of QD particles to protein surfaces can be deter-mined from deviations in the vibration-mode frequency of vari-ous functional groups observed in FTIR spectra. The specificstretching and bending vibrations of the peptide backbone inamide I, II, and III bands provides information about secondarystructures such as a-helix, b-sheets, turns, and unorderedstructures (referred to as random coils). Of all the amide bandsof the peptide group, amide I, which gives rise to infraredbands in the region between approximately 1600 and1700 cm�1, has been proven to be the most sensitive probe ofprotein secondary structure. In the IR study of proteins, the po-sition[48, 49] of the amide I component bands indicates the typeof secondary structure; the amide I peak for proteins contain-ing predominantly a-helical structure appears in the range of1648–1660 cm�1, for proteins with predominant b-sheet struc-ture it appears in the range of 1615–1635 cm�1, and for thosewith predominant turns it appears in the range of 1680–1690 cm�1.
Figures 8 and S5 (in the Supporting Information) show thatin the FTIR spectra (in the range of 1600–4000 cm�1) of theproteins in the absence and presence of QDs an intense bandin the amide I region could be observed. The bands at 1653,1659, and 1663 cm�1 (BSA, b-Lg, and HSA, respectively), mainlydue to amide I, are characteristic of high a-helical content inthe proteins[50, 51] . After binding to the QDs, the intensity of theband at 1659 cm�1 decreased, indicating that the a-helical con-tent in the proteins was reduced. The bands at 1615, 1617,and 1618 cm�1 in all proteins are due to intermolecular b-sheetstructure, bands at 1632, 1638, and 1639 cm�1 are due to intra-molecular b-sheet structure, and bands at 1680 ,1681,1682 cm�1 are due to turns. As shown, the intensities of thebands assigned to b-sheet structure and turns increase withthe addition of QDs, whereas those due to the a-helical struc-
Table 3. The FRET parameters of the protein–QD samples.
Protein J(l)1011 [cm3 M�1] R0 [nm] r [nm] E [%]
BSA 1.87 8.1 8.2 48HSA 1.71 8.8 9.4 35b-Lg 1.49 8 9.6 26
Figure 7. Dependence of the secondary structure (helicity) of the proteins[BSA (1.5 mm), b-Lg (5.5 mm) and HSA (1.5 mm)] on the QD concentration.Note the loss of secondary structure, due to complexation of proteins withQD particles in region I.
ChemPhysChem 0000, 00, 0 – 0 www.chemphyschem.org � 0000 Wiley-VCH Verlag GmbH & Co. KGaA, Weinheim7 &
These are not the final page numbers! ��These are not the final page numbers! ��
Articles

ture decrease, relatively. From the shift in peak position, weconfirmed that the conformation of the proteins was affectedby the addition of QDs. These results indicate that the secon-dary structure of proteins changed because of interactions ofQDs with proteins, in agreement with the results of the fluo-rescence and CD experiments.
The spectra shown in Figures 8 and S6 (in the Supporting In-formation) indicate the presence of the following prominentmodes of vibration: 1) 1680 cm�1 (COOH), 2) 2400 cm�1 (C=N)and 3) 3200–3500 cm�1 (O�H and N�H); these vibrations werecommon to all the proteins, which allowed us to draw someuniversal conclusions. MPA-capped QDs and acidic residues ofthe proteins contain COOH groups, which yielded the1680 cm�1 peak. The peak area under this particular peak in-creased with increasing QD concentration, thus implying bind-ing between the two entities. However, no peak shift was no-ticed during this process. Not much change was noted as faras the 2400 cm�1 C=N peak was concerned, because in all thesamples the protein concentration was fixed.
The vibrational bands corresponding to the O�H groupreside in the range of 3200–3500 cm�1 in the FTIR spectra.There are three identifiable H�O�H stretching vibrations at3200(structured water), 3310 (partially structured water), and3460 cm�1 (amorphous water).[52, 53] Collectively, the area underthe 3200–3500 cm�1 spectral band can be considered as hydra-tion water. A closer examination of the spectra shown inFigure 7, indicates that the area under this band decreasedwith increasing QD concentration, as shown in Figures 9 andS8 (in the Supporting Information). More specifically, the pro-tein–QD complexes were much less hydrated compared to thenative protein molecules. Notably, the native protein moleculeswere the most hydrated, whereas the QD particles had theleast hydration. The protein–QD complexes were associatedwith intermediate hydration values, as shown in Figure 8 b. De-hydration of the protein could give rise to loss in secondarystructure, which we observed from the CD data (region I). Suchbehavior was uniformly seen for all protein samples (Fig-ure 8 b).
It has been argued previously that our QD particles havea negative zeta potential (z��50 mV). The protein–QD com-plexes had a significantly different zeta potential, thus implyingassociation between the two molecules. Furthermore, it is real-istic to assume that the QD particles were non-homogeneouslycoated with MPA molecules. Thus, the binding between theprotein molecules and the QDs mostly occurred at the COOHsites of the protein. This was evident from the abovemen-tioned analysis of the 1680 cm�1 peak in the FTIR spectra. Thisimmediately implies that the binding between the two moiet-ies was largely electrostatic in nature.
3. Conclusions
We have reported a series of studies into the interactions be-tween CdSe MPA-coated QDs and common blood serum pro-teins, BSA, b-Lg, and HSA. Binding of CdSe QDs to these threecommon globular protein molecules, which have well-definedsecondary structure (helicity>60 %), was systematically andcomprehensively probed. Upon binding with the QDs, a loss inthe secondary structure of all proteins was noticed; this wastypically of the order of 20 %. The existence of protein–QDcomplexes led to a quenching of the fluorescence signal,which indicated a binding saturation typically at a QD concen-tration of 4.05 mm ; this was in concurrence with the data ob-tained from FTIR spectroscopy, which implied a correspondingloss in hydration. Native proteins can be unfolded by heat, ex-tremes in pH, changes in the chemical and physical environ-ment, and by denaturants such as urea or guanidinium chlo-ride (GdmCl). Protein denaturation was avoided in our case byperforming the experiments at room temperature (25 8C), bynot subjecting the samples to extreme pHs, and by using thesamples devoid of known denaturants.
The results convincingly indicate that the proteins bind tothe QDs. Furthermore, the average stoichiometry of the pro-tein–QD complexes was determined and was consistent withprevious studies.[41] Remarkable QD-induced protein denatura-
Figure 8. FTIR spectra of proteins b-Lg (5.5 mm) in the absence and pres-ence of QDs. The values written on the curve indicates micromolar concen-tration of QDs.
Figure 9. Plot of hydration of protein–QD complexes [BSA (1.5 mm), b-Lg(5.5 mm) and HSA (1.5 mm)] versus QD concentration. Note the loss of hy-dration by as much as 25 %, due to the binding in region I. The sharp dropin this area demarcates the two regions (arrow).
ChemPhysChem 0000, 00, 0 – 0 www.chemphyschem.org � 0000 Wiley-VCH Verlag GmbH & Co. KGaA, Weinheim8&
�� These are not the final page numbers!�� These are not the final page numbers!
Articles
tion, and the Forster energy transfer (FRET) between the tryp-tophan groups of protein and the QDs were observed in eachprotein. In QD-bound proteins, tryptophan groups serve asenergy-transfer donors and the QDs serve as acceptors. Thelifetime and emission quenching of tryptophan appears to co-incide with the binding of the proteins to the QDs, and is a sig-nature of this binding. Plausible evidences of this are the fluo-rescence intensity and lifetime quenching of the tryptophangroups. The observed quenching behavior can also be ex-plained by an alternative mechanism; this is is related tochange in structure of the proteins upon binding to the QDs,which could alter the local environment of the tryptophan andin turn give rise to the observed quenching. Likewise, the cor-responding increase in QD emission could be caused by im-proved passivation of surface-trap states when the proteinsbind to the surface of the QDs.
In summary, nanocrystals such as CdSe QDs considerablyalter the biological activity of proteins upon binding, by caus-ing partial denaturation of the proteins concerned. Further-more, the biological activity of the proteins is dependent ontheir tertiary structure and the toxicity of the QDs in biologicalsystems, which requires further study. In fact, we have reportedan extensive study on cytotoxicity, cellular uptake, and bio-imaging using these QDs (see ref. [54]). A deeper understand-ing of nanomaterial–protein interactions is required.
Experimental Section
BSA, b-Lg, and HSA were bought from Sigma–Aldrich chemicalcompany (U.S.A.). These were used as received (minimum purity of>96 %) without further purification. CdSe QDs were synthesizedfollowing the kinetic growth method pioneered by Peng et al. in2001.[8] Aqueous solutions of all proteins were prepared with a con-centration of 0.01 % (w/v) by dissolving a known amount of theprotein powder in deionized water at 25 8C, stirring with a magneticstirrer for approximately 1 h; the pH of protein solutions were�5.7�0.5. This produced visually colorless and transparent solu-tions, which were stored in sterilized air-tight glass bottles forfuture use. The pH of the CdSe QD dispersion was �9.0�0.5.Keeping the protein concentration fixed, different protein–QDscomplexes were generated by varying the QD concentration (0.6–27 mm). The pH of these solutions changed to 8.2�0.5 with gradu-al addition of the QDs to the protein solutions.
UV/Vis absorption spectra were obtained using a spectrophotome-ter (Model CE-7300, Cecil Instruments, U. K.) operating in the wave-length range 190–900 nm. FTIR spectra from all samples were re-corded on a FTIR/Raman Spectrometer (1064 nm) attached to a mi-croscope (Varian 7000 FT-Raman and Varian 600 UMA). We usedFTIR spectroscopy to investigate the structure of the water in vari-ous solutions, because vibrational spectra are sensitive to the localmolecular environment. The average particle size was determinedby using a JEOL 2100F, TEM (digital TEM with AN image analysissystem at a maximum magnification of 1, 50,000X operating ata voltage OF200 kV). This was also performed by using dynamiclight scattering (DLS) techniques. Further details of the DLS setupused can be obtained from ref. [55]. Zeta potential measurementswere performed on an electrophoresis instrument (model: ZC-2000, Microtec, Japan).
Steady-state fluorescence was measured using a Varian Caryeclipse fluorescence spectrophotometer with a spectral range of190–1000 nm, and lifetime decay experiments were performedusing a TCSPC setup (FL920, Edinburgh Instrument). All sampleswere excited with diode lasers and the emission decays were col-lected at emission peak wavelength at magic angle polarization(558). Here, we used a picosecond time-resolved fluorescence spec-trometer (TRFS) to probe the effect of the solvent on the lifetimeof relaxations. All the measurements were performed witha 100 nm time-to-amplitude convertor (TAC) at excitation wave-lengths of 375 and 405 nm LED source. The time resolution for theTCSPC setup was �120 ps (measured with a LUDOX solution). Thedata were least squares fitted to the two-exponential fitting func-tion (goodness-of-fit c2 values are always � 0.95) given by usingEquation (16):
FðtÞ ¼ a0 þ a1 expð�t=t1Þ þ a2 expð�t=t2Þ ð16Þ
in which a0 defines the time shift between instrument responsefunction and the sample. The relaxation times, t1 and t2, corre-spond to various lifetimes of the characteristic excited states. F(t)could not be fitted to a single exponential function. The averagetime constant or correlation time is given as [Eq. (7)]:
th i ¼X
i
ait1 ð17Þ
The efficiency of energy transfer was calculated from the fluores-cence intensity of the donor in the presence and absence of theacceptor. All FRET calculations were done using PHOTOCHEMCADsoftware, using emission and absorbance data for the donor (pro-teins) and acceptor (QDs).
CD experiments were carried out with an Applied Photo physicsChirascan instrument (USA) to estimate the secondary structure ofproteins by using the standard operation procedure. Each spec-trum is the average of three successive scans. Appropriate baselinecorrections in the CD spectra were made. The pathlength of thecuvette used in the CD experiments was 0.1 cm and the wave-length range used was 200–280 nm. It has been reported thatbelow approximately 200 nm, CD data are not accurate for analysisof protein secondary structure.[56]
Acknowledgements
We are thankful to Advanced Research Instrumentation Facilityof Jawaharlal Nehru University for allowing us access to FTIR,TRFS, and CD facilities. J.P. and S.S. acknowledge receipt of a re-search fellowship from the University Grants Commission, Gov-ernment of India. K.R. is thankful to Department of Science andTechnology, Government of India, for the Inspire Faculty Award.This work was supported by a grant from the Department of Sci-ence and Technology, Government of India.
Keywords: conformation analysis · hydration · proteins ·quantum dots · secondary structure
[1] V. Biju, T. Itoh, A. Anas, A. Sujith, M. Ishikawa, Anal. Bioanal. Chem. 2008,391, 2469 – 2495.
[2] A. P. Alivisatos, Science 1996, 271, 933 – 937.
ChemPhysChem 0000, 00, 0 – 0 www.chemphyschem.org � 0000 Wiley-VCH Verlag GmbH & Co. KGaA, Weinheim9 &
These are not the final page numbers! ��These are not the final page numbers! ��
Articles
[3] W. W. Yu, E. Chang, J. C. Falkner, J. Zhang, A. M. Al-Somali, C. M. Sayes, J.Johns, J. R. Drezek, V. L. Colvin, J. Am. Chem. Soc. 2007, 129, 2871 – 2879.
[4] H. T. Uyeda, I. L. Medintz, J. K. Jaiswal, S. M. Simon, H. Mattoussi, J. Am.Chem. Soc. 2005, 127, 3870 – 3878.
[5] D. J. Norris, A. Sacra, C. B. Murray, M. G. Bawendi, Phys. Rev. Lett. 1994,72, 2612 – 2615.
[6] M. A. Hines, P. Guyot-Sionnest, J. Phys. Chem. 1996, 100, 468 – 471.[7] Z. Lin, X. Su, Y. Mu, Q. Jin, J. Nanosci. Nanotechnol. 2004, 4, 641 – 645.[8] J. Aldana, Y. A. Wang, X. Peng, J. Am. Chem. Soc. 2001, 123, 8844 – 8850.[9] S. F. Wuister, A. Meijerink, J. Lumin. 2003, 105, 35 – 43.
[10] S. Sadhu, P. S. Chowdhury, A. Patra, J. Lumin. 2008, 128, 1235 – 1240.[11] N. Gaponik, I. L. Radtchenko, G. B. Sukhorukov, H. Weller, A. L. Rogach,
Adv. Mater. 2002, 14, 879 – 882.[12] D. V. Talapin, A. L. Rogach, E. V. Shevchenko, A. Komowski, M. Haase, H.
Weller, J. Am. Chem. Soc. 2002, 124, 5782 – 5790.[13] A. C. S. Samia, X. Chen, C. Burda, J. Am. Chem. Soc. 2003, 125, 15736 –
15737.[14] A. C. S. Samia, S. Dayal, C. Burda, Photochem. Photobiol. 2006, 82, 617 –
625.[15] J. H. Wang, H. Q. Wang, H. L. Zhang, X. Q. Li, X. F. Hua, Y. C. Cao, Z. L.
Huang, Y. D. Zhao, Anal. Bioanal. Chem. 2007, 388, 969 – 974.[16] M. Li, Y. Ge, Q. Chen, S. Xu, N. Wang, X. Zhang, Talanta 2007, 72, 89 – 94.[17] W. Chang, Y. Shen, A. Xie, H. Zhang, J. Wang, W. Lu, J. Colloid Interface
Sci. 2009, 335, 257 – 263.[18] A. M. Smith, H. Duan, A. M. Mohs, S. Nie, Adv. Drug Delivery Rev. 2008,
60, 1226 – 1240.[19] J. Xie, Y. Zheng, J. Y. Ying, J. Am. Chem. Soc. 2009, 131, 888 – 889.[20] L. Yang, R. Xing, Q. Shen, K. Jiang, F. Ye, J. Wang, Q. Ren, J. Phys. Chem.
B 2006, 110, 10534 – 10539.[21] M. S. Bakshi, V. S. Jaswal, G. Kaur, T. W. Simpson, P. K. Banipal, T. S. Bani-
pal, F. Possmayer, N. O. Petersen, J. Phys. Chem. C 2009, 113, 9121 –9127.
[22] C. Rçcker, M. Pçtzl, F. Zhang, W. J. Parak, G. U. Nienhaus, Nat. Nanotech-nol. 2009, 4, 577 – 580.
[23] C. B. Murray, D. J. Norris, M. G. Bawendi, J. Am. Chem. Soc. 1993, 115,8706 – 8715.
[24] J. Jasieniak, L. Smith, J. V. Embden, P. Mulvaney, J. Phys. Chem. C 2009,113, 19468 – 19474.
[25] J. Wang, Y. Wang, J. Gao, P. Hu, H. Guan, L. Zhang, R. Xu, X. Chen, X.Zhang, Ultrason. Sonochem. 2009, 16, 41 – 49.
[26] P. . Kandagal, J. Seetharamappa, S. Ashoka, S. M. T. Shaikh, D. H. Manju-natha, Int. J. Biol. Macromol. 2006, 39, 234 – 239.
[27] A. N. Glazer, E. L. Smith, J. Biol. Chem. 1961, 236, 2942 – 2947.[28] D. H. Hu, H. M. Wu, J. G. Liang, H. Y. Han, Spectrochim. Acta Part A 2008,
69, 830 – 834.[29] J. R. Lakowicz, Principles of fluorescence spectroscopy, Kluwer Academic/
Plenum publishers, Dordrecht, The Netherlands 2004.[30] M. Tachiya, J. Chem. Phys. 1982, 76, 340 – 348.
[31] W. R. Ware, J Phys Chem. 1962, 66, 455 – 458.[32] Y. J. Hu, Y. Liu, A. X. Hou, R. M. Zhao, X. S. Qu, S. S. Qu, Acta Chim. Sin.
2004, 62, 1519 – 1523.[33] Y. J. Hu, Y. Liu, J. B. Wang, X. H. Xiao, S. S. Qua, J. Pharm. Biomed. Anal.
2004, 36, 915 – 919.[34] G. D. Rose, A. R. Geselowitz, G. J. Lesser, R. H. Lee, M. H. Zehfus, Science
1985, 229, 834 – 838.[35] D. Eisenberg, Annu. Rev. Biochem. 1984, 53, 595 – 623.[36] D. Eisenberg, E. Komaromy, R. Wall, J. Mol. Biol. 1984, 179, 125 – 142.[37] J. Kyte, R. F. Doolittle, J. Mol. Biol. 1982, 157, 105 – 132.[38] R. Wolfenden, L. Andersson, P. Cullis, C. Southgate, Biochemistry 1981,
20, 849 – 855.[39] T. P. Hopp, K. R. Woods, Proc. Natl. Acad. Sci. USA 1981, 78, 3824 – 3828.[40] K. Rawat, H. B. Bohidar, J. Phys. Chem. B 2012, 116, 11065 – 11074.[41] B. I. Ipe, A. Shukla, H. C. Lu, B. Zou, H. Rehage, C. M. Niemeyer, Chem-
PhysChem 2006, 7, 1112 – 1118.[42] A. R. Clapp, I. L. Z. Medint, J. M. Mauro, B. R. Fisher, M. G. Bawendi, H.
Mattoussi, J. Am. Chem. Soc. 2004, 126, 301 – 310.[43] L. A. Sklar, B. S. Hudson, R. D. Simoni, Biochemistry 1977, 16, 819 – 828.[44] L. Stryer, Annu. Rev. Biochem. 1978, 47, 819 – 846.[45] J. N. Demas, G. A. Crosby, J. Phys. Chem. 1971, 75, 991 – 1024.[46] Z. C. Shang, P. G. Yi, Q. L. Yu, R. L. Lin, Acta Phys. Chim. Sin. 2001, 17,
48 – 52.[47] X. X. Cheng, Y. Lui, B. Zhou, X. H. Xiao, Y. Liu, Spectrochim. Acta Part A
2009, 72, 922 – 1134.[48] F. L. Cui, J. Fan, D. L. Ma, M. C. Liu, X. G. Chen, Z. D. Hu, Anal. Lett. 2003,
36, 2151 – 2166.[49] L. Shang, Y. Wang, J. Jiang, S. Dong, Langmuir 2007, 23, 2714 – 2721.[50] M. Jackson, H. H. Mantsch, Crit. ReV. Biochem. Mol. Biol. 1995, 30, 95 –
120.[51] V. Tattini Jr. , D. F. Parra, B. Polakiewicz, R. N. M. Pitombo, Int. J. Pharm.
2005, 304, 124 – 134.[52] W. Gadomski, B. Ratajska-Gadomska, Chem. Phys. Lett. 2004, 399, 471 –
474.[53] B. Ratajska-Gadomska, W. Gadomski, J. Chem. Phys. 2010, 133, 234505 –
17.[54] S. Sanwlani, K. Rawat, M. Pal, H. B. Bohidar, A. K. Verma, J. Nanopart. Res.
2014, 16, 2382 – 1 – 11.[55] H. B. Bohidar in Handbook of Polyelectrolytes (Eds. : H. S. Nalwa, S.
Kumar, S. K. Tripathy), American Scientific Publishers: Valencia, CA 2002,Vol. II, pp. 117144.
[56] A. Toumadje, S. W Alcorn Jr. , W. C. Johnson, Anal. Biochem. 1992, 200,321 – 331.
Received: September 12, 2014Revised: January 23, 2014Published online on && &&, 2015
ChemPhysChem 0000, 00, 0 – 0 www.chemphyschem.org � 0000 Wiley-VCH Verlag GmbH & Co. KGaA, Weinheim10&
�� These are not the final page numbers!�� These are not the final page numbers!
Articles
ARTICLES
J. Pathak, K. Rawat,* S. Sanwlani,H. B. Bohidar*
&& –&&
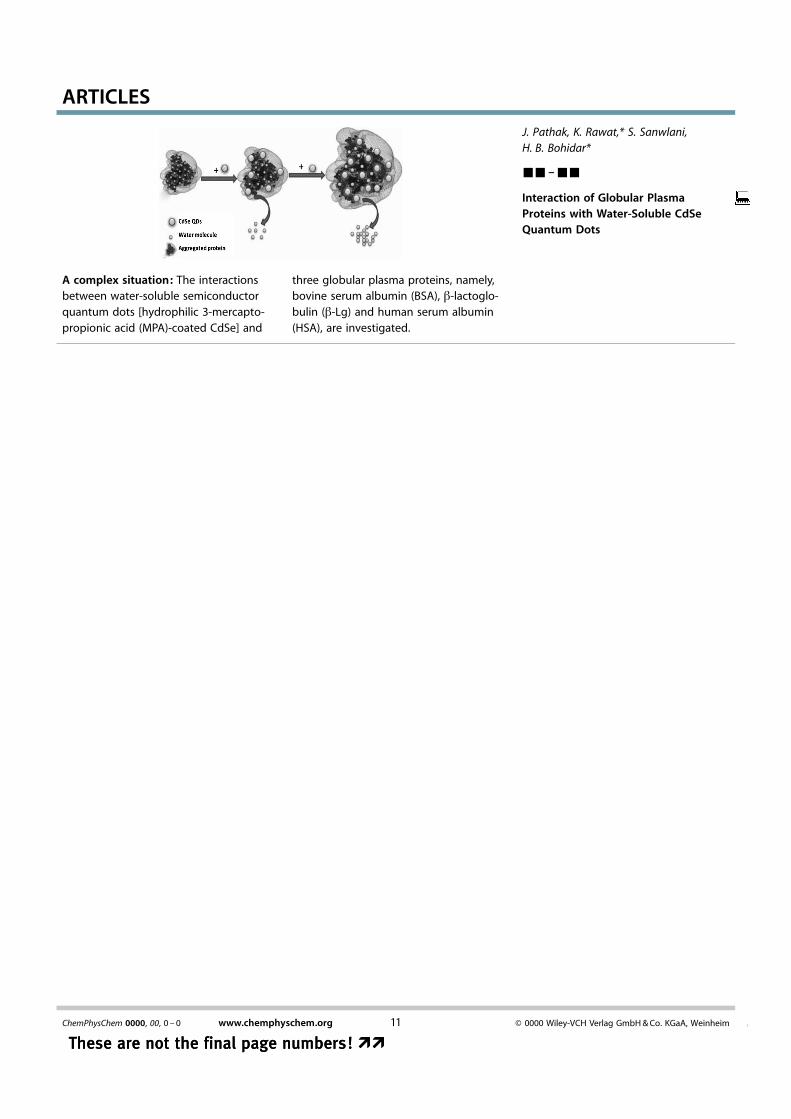
Interaction of Globular PlasmaProteins with Water-Soluble CdSeQuantum Dots
A complex situation: The interactionsbetween water-soluble semiconductorquantum dots [hydrophilic 3-mercapto-propionic acid (MPA)-coated CdSe] and
three globular plasma proteins, namely,bovine serum albumin (BSA), b-lactoglo-bulin (b-Lg) and human serum albumin(HSA), are investigated.
ChemPhysChem 0000, 00, 0 – 0 www.chemphyschem.org � 0000 Wiley-VCH Verlag GmbH & Co. KGaA, Weinheim11 &
These are not the final page numbers! ��These are not the final page numbers! ��
Copyright © 2022 FDOKUMEN