Quaternary Amine-Terminated Quantum Dots Induce ...
36
Subscriber access provided by UNIV OF WISCONSIN - MADISON is published by the American Chemical Society. 1155 Sixteenth Street N.W., Washington, DC 20036 Published by American Chemical Society. Copyright © American Chemical Society. However, no copyright claim is made to original U.S. Government works, or works produced by employees of any Commonwealth realm Crown government in the course of their duties. Interface Components: Nanoparticles, Colloids, Emulsions, Surfactants, Proteins, Polymers Quaternary Amine-Terminated Quantum Dots Induce Structural Changes to Supported Lipid Bilayers Arielle C Mensch, Joseph T. Buchman, Christy L. Haynes, Joel A. Pedersen, and Robert J Hamers Langmuir, Just Accepted Manuscript • DOI: 10.1021/acs.langmuir.8b02047 • Publication Date (Web): 05 Sep 2018 Downloaded from http://pubs.acs.org on September 6, 2018 Just Accepted “Just Accepted” manuscripts have been peer-reviewed and accepted for publication. They are posted online prior to technical editing, formatting for publication and author proofing. The American Chemical Society provides “Just Accepted” as a service to the research community to expedite the dissemination of scientific material as soon as possible after acceptance. “Just Accepted” manuscripts appear in full in PDF format accompanied by an HTML abstract. “Just Accepted” manuscripts have been fully peer reviewed, but should not be considered the official version of record. They are citable by the Digital Object Identifier (DOI®). “Just Accepted” is an optional service offered to authors. Therefore, the “Just Accepted” Web site may not include all articles that will be published in the journal. After a manuscript is technically edited and formatted, it will be removed from the “Just Accepted” Web site and published as an ASAP article. Note that technical editing may introduce minor changes to the manuscript text and/or graphics which could affect content, and all legal disclaimers and ethical guidelines that apply to the journal pertain. ACS cannot be held responsible for errors or consequences arising from the use of information contained in these “Just Accepted” manuscripts.
-
Upload
khangminh22 -
Category
Documents
-
view
4 -
download
0
Transcript of Quaternary Amine-Terminated Quantum Dots Induce ...

Subscriber access provided by UNIV OF WISCONSIN - MADISON
is published by the American Chemical Society. 1155 Sixteenth Street N.W.,Washington, DC 20036Published by American Chemical Society. Copyright © American Chemical Society.However, no copyright claim is made to original U.S. Government works, or worksproduced by employees of any Commonwealth realm Crown government in the courseof their duties.
Interface Components: Nanoparticles, Colloids, Emulsions, Surfactants, Proteins, Polymers
Quaternary Amine-Terminated Quantum Dots InduceStructural Changes to Supported Lipid Bilayers
Arielle C Mensch, Joseph T. Buchman, Christy L. Haynes, Joel A. Pedersen, and Robert J HamersLangmuir, Just Accepted Manuscript • DOI: 10.1021/acs.langmuir.8b02047 • Publication Date (Web): 05 Sep 2018
Downloaded from http://pubs.acs.org on September 6, 2018
Just Accepted
“Just Accepted” manuscripts have been peer-reviewed and accepted for publication. They are postedonline prior to technical editing, formatting for publication and author proofing. The American ChemicalSociety provides “Just Accepted” as a service to the research community to expedite the disseminationof scientific material as soon as possible after acceptance. “Just Accepted” manuscripts appear infull in PDF format accompanied by an HTML abstract. “Just Accepted” manuscripts have been fullypeer reviewed, but should not be considered the official version of record. They are citable by theDigital Object Identifier (DOI®). “Just Accepted” is an optional service offered to authors. Therefore,the “Just Accepted” Web site may not include all articles that will be published in the journal. Aftera manuscript is technically edited and formatted, it will be removed from the “Just Accepted” Website and published as an ASAP article. Note that technical editing may introduce minor changesto the manuscript text and/or graphics which could affect content, and all legal disclaimers andethical guidelines that apply to the journal pertain. ACS cannot be held responsible for errors orconsequences arising from the use of information contained in these “Just Accepted” manuscripts.

1
Quaternary Amine-Terminated Quantum Dots 1
Induce Structural Changes to Supported Lipid 2
Bilayers 3
Arielle C. Mensch,†,⊥Joseph T. Buchman,∥ Christy L. Haynes,∥
Joel A. Pedersen,
*†‡§ and Robert J. Hamers
*† 4
†Department of Chemistry, University of Wisconsin, Madison, WI 53706, United States 5
∥Department of Chemistry, University of Minnesota, Minneapolis, MN 55455, United States 6
‡Department of Soil Science, University of Wisconsin, Madison, WI 53706, United States 7
§Department of Civil and Environmental Engineering, University of Wisconsin, Madison, WI 53706, 8
United States 9
ABSTRACT 10
The cytoplasmic membrane represents an essential barrier between the cytoplasm and the environment 11
external to cells. Interaction with nanomaterials can alter the integrity of the cytoplasmic membrane 12
through the formation of holes and membrane thinning, which can ultimately lead to adverse biological 13
impacts. Here we use supported lipid bilayers as experimental models for the cytoplasmic membrane to 14
investigate the impact of quantum dots functionalized with the cationic polymer 15
Page 1 of 35
ACS Paragon Plus Environment
Langmuir
123456789101112131415161718192021222324252627282930313233343536373839404142434445464748495051525354555657585960

2
poly(diallyldimethylammonium chloride) (PDDA) on membrane structure. Using quartz crystal 16
microbalance with dissipation monitoring we show that the positively charged quantum dots attach to 17
and induce structural rearrangement to zwitterionic bilayers in solely the liquid-disordered phase and in 18
those containing phase-segregated liquid-ordered domains. Real-time atomic force microscopy imaging 19
revealed that PDDA-coated quantum dots, and to a lesser extent PDDA itself, induced disappearance of 20
liquid-ordered domains. We hypothesize this effect is due to an increase in energy per unit area caused 21
by collisions between PDDA-coated quantum dots at the membrane surface. This increase in free energy 22
per area exceeds the approximate free energy change associated with membrane mixing between the 23
liquid-ordered and liquid-disordered phases and results in the destabilization of membrane domains. 24
INTRODUCTION 25
Increasing deployment of nanomaterials in consumer products and commercial processes raises 26
concerns that engineered nanomaterials released into the environment may interact adversely with 27
organisms.1-3 However, understanding the impact of nanomaterials on organisms at a mechanistic level 28
is difficult and requires a systematic approach using complementary analytical tools.3-5 Prior studies 29
have indicated a number of different possible modes of interaction occurring at the nano-bio interface, 30
including endocytic uptake,6-7 passive diffusion, membrane permeabilization,8-9 lipid extraction,10 and 31
indirect interactions such as ROS generation11 or ion dissolution.12 The potential interactions between 32
nanoparticles and cell surfaces are complex, may occur through a number of different mechanisms, and 33
ultimately depend on the type of nanomaterial and cell surface structure. 34
For eukaryotic organisms, the initial interaction with nanomaterials frequently involves contact with 35
the cytoplasmic membrane, which can result in internalization and be a first step toward inducing toxic 36
responses.13-14 Supported lipid bilayers (SLBs) are frequently used as model systems to gain fundamental 37
Page 2 of 35
ACS Paragon Plus Environment
Langmuir
123456789101112131415161718192021222324252627282930313233343536373839404142434445464748495051525354555657585960

3
insights into nanoparticle-membrane interactions.15-18 While SLBs do not recapitulate the full complexity 38
of cell membranes, they provide a higher degree of control than can be achieved in vivo because their 39
composition can be systematically varied to investigate the influence of biomolecules that are important 40
in the structure and function of cell membranes.15, 19-20 Prior studies have shown that nanomaterials can 41
induce a number of changes in SLBs including hole formation,18, 21-22 membrane thinning,18 and 42
morphological changes.23 43
Cell membranes contain many components that phase segregate into domains exhibiting different 44
degrees of structural order. Laterally organized domains (frequently referred to as membrane rafts or 45
nanodomains) are important features of eukaryotic and prokaryotic membranes24 and play roles in 46
signal transduction and membrane trafficking.25 In eukaryotes, sphingolipids and cholesterol often 47
mediate the domain structures in cellular membranes.26 In lipid bilayers, segregation into liquid-ordered 48
(Lo) and liquid-disordered (Ld) can be induced to study aspects of the phase segregation that occurs in 49
cytoplasmic membranes. Prior work using phase-segregated bilayers showed that the interaction with 50
amphiphilic dendrimers varied depending on the bilayer phase.27 Partial solubilization occurred with 51
fluid-phase bilayers, while local depressions and flexible lipid patches occurred with gel-phase bilayers, 52
and a ribbon-like network with spherical aggregates occurred with bilayers having both fluid and gel 53
phases.27 Other studies showed that hydrophilic quantum dots28 and polycationic dendrimers29-30 54
interact preferentially with Lo domains, and that anionic diamond nanoparticles alter the domain shape 55
and packing.31 In recent work, we showed that 4-nm mercaptopropylamine-capped gold nanoparticles 56
interacted to a larger extent with SLBs containing phase-segregated Lo and Ld domains than with SLBs 57
comprised solely of the Ld phase.15 These studies suggest that liquid-ordered regions or their boundaries 58
may play an important role in controlling nanoparticle interactions, but a real-time, molecular-level 59
understanding of the interactions remains elusive. 60
Page 3 of 35
ACS Paragon Plus Environment
Langmuir
123456789101112131415161718192021222324252627282930313233343536373839404142434445464748495051525354555657585960

4
The objective of this study was to use complementary real-time, in situ characterization methods to 61
directly observe the impacts of cationic nanoparticles on liquid-ordered domains in supported lipid 62
bilayers. We chose CdSe/ZnS core/shell quantum dots wrapped with a cationic, amphiphilic polymer, 63
poly(diallyldimethylammonium chloride) (PDDA), as a model nanoparticle system. PDDA was chosen 64
because prior studies have shown that cationic nanoparticles interact more strongly with lipid bilayers 65
compared with uncharged or anionic nanoparticles15, 18, 32-33 and because wrapping with PDDA yielded 66
colloidally stable nanoparticles under the conditions of our experiments. We chose CdSe/ZnS quantum 67
dots because of their technological relevance,34-35 and thus the concern of environmental release36 and 68
toxicity.37 As model bilayers, we studied one composition forming a Ld phase and a second composition 69
containing both Ld and Lo phases through the inclusion of sphingomyelin and cholesterol, two 70
biomolecules enriched in the phase-segregated “rafts” found in eukaryotic cell membranes,38 into the 71
SLBs. We use real-time, in situ atomic force microscopy (AFM) time-lapse imaging to directly observe the 72
influence of the nanoparticles on the size and shape of the phase-segregated regions over time, and 73
quartz crystal microbalance with dissipation monitoring (QCM-D) to assess net changes in mass 74
associated with the interaction. AFM results show that the introduction of PDDA-QDs to phase-75
segregated bilayers leads to the shrinking of the liquid-ordered regions, eventually leading to complete 76
loss of the Lo regions. Our results suggest that increased energy per area induced by nanoparticle-77
nanoparticle collisions may alter membrane structure by reducing the molecular driving forces for phase 78
segregation. 79
EXPERIMENTAL 80
Quantum Dot Characterization. Cadmium selenide core quantum dots with a zinc sulfide shell and a 81
positively charged poly(diallyldimethylammonium chloride) (PDDA) polymer wrapping (average 82
molecular mass of 200,000 Da) were procured from OceanNanotech (QSQ-620, manufacturer reported 83
Page 4 of 35
ACS Paragon Plus Environment
Langmuir
123456789101112131415161718192021222324252627282930313233343536373839404142434445464748495051525354555657585960

5
core size 3.3 nm, shell thickness 2.5 nm, and PDDA thickness 2 nm). The polymer wrapping ensured 84
colloidal stability in water and allowed us to probe the impact of a positively charged particle on the 85
lipid bilayers. We measured the diffusivities and electrophoretic mobilities of the PDDA-QDs by dynamic 86
light scattering and laser Doppler microelectrophoresis (Malvern Zetasizer Nano ZS) at a 1 nM number 87
concentration of QDs in 0.010 M NaCl buffered to pH 7.4 with 0.010 M HEPES. The diffusivity and 88
electrophoretic mobility measurements were the average of five measurements. An intensity 89
correlation function was used to determine the diffusion coefficient of the particles. From the diffusion 90
coefficient we determined the hydrodynamic diameter using the Stokes-Einstein equation and from 91
these values estimated number-averaged hydrodynamic diameter (dh) using Mie theory.39 Transmission 92
electron microscopy was conducted on a Tecnai T12 microscope to determine the core size of the 93
particles. Additional sample preparation details can be found in the Supporting Information. 94
Lipid Vesicle Preparation and Characterization. We prepared small unilamellar vesicles composed 95
solely of 1,2-dioleoyl-sn-glycero-3-phosphocholine (DOPC, 850375C, Avanti Polar Lipids) or DOPC with 96
plant-derived cholesterol (Chol, 700100P, Avanti Polar Lipids) and sphingomyelin from chicken egg yolk 97
(SM, S0756, Sigma Aldrich) as previously described.15 The gel-to-liquid crystalline phase transition 98
temperatures for DOPC and 16:0 SM (the bulk component of the egg yolk SM) are –21 °C40 and 41 °C41, 99
respectively. Briefly, stock solutions of Chol and SM were dissolved in chloroform (1 mg/mL) and 100
sonicated for 30 min. The three components were mixed to the desired ratio (100% DOPC or 60/20/20 101
mol% DOPC/SM/Chol), the chloroform was removed under a stream of nitrogen gas, and any residual 102
chloroform was removed under vacuum overnight. The dried film was rehydrated in 0.001 M NaCl 103
buffered to pH 7.4 with 0.01 M HEPES and vortexed briefly followed by sonication for 30 min to leave a 104
cloudy solution. Following three cycles of freezing with liquid nitrogen and thawing by sonication, the 105
solution was extruded 11 times (Avanti 610000 extruder kit) through a 50 nm polycarbonate membrane 106
Page 5 of 35
ACS Paragon Plus Environment
Langmuir
123456789101112131415161718192021222324252627282930313233343536373839404142434445464748495051525354555657585960

6
filter (Whatman) to give small unilamellar vesicles. Vesicles were stored at 4 °C and used within one 107
week of extrusion. 108
Quartz Crystal Microbalance with Dissipation Monitoring. Quartz crystal microbalance with 109
dissipation monitoring measures changes in resonance frequency (Δƒ) and changes in dissipation (ΔD) 110
due to the interaction of an analyte (PDDA-QDs in our case) with the surface of an AT-cut quartz crystal 111
oscillating in shear mode parallel to the bilayer. Changes in frequency are related to the mass of the 112
surface-bound analyte and any hydrodynamically coupled water present at the sensor surface. For 113
laterally homogeneous adlayers, changes in the energy dissipation or damping are related to the 114
resulting film’s viscoelasticity, whereas for films of discrete nanosized objects, ΔD is related to the 115
stiffness of the particle-surface contacts.42 For rigidly adsorbed films, defined as –ΔDν/(Δƒν/ν) << 2/(ƒν) 116
(equal to 4 × 10⁻⁷ Hz-1 for the 4.96 MHz crystals used here)42, where ν is the harmonic number, the 117
adsorbed surface mass density (ΔΓQCM-D) is linearly proportional to the change in frequency, as described 118
by the Sauerbrey equation:43 119
(1) 120
where C is the mass sensitivity constant (equal to 18.0 ng·Hz-1·cm-2 for a 4.96 MHz crystal). In all 121
experiments presented, –ΔDν/(Δƒν/ν) < 4 × 10⁻⁷ Hz-1 and the Sauerbrey equation was applied to estimate 122
the surface mass density when noted. 123
Prior to use, SiO2-coated QCM-D crystals (QSX303, Biolin Scientific, Gothenburg, Sweden) were 124
soaked in a 2% sodium dodecyl sulfate solution for 10 min, rinsed three times alternatively with 125
ultrapure water and ethanol, dried with N2 gas, and exposed to UV/ozone from a low-pressure mercury 126
lamp for 20 min (Bioforce Nanosciences UV/Ozone Procleaner, 185 and 254 nm). The crystals were then 127
∆ΓQCM-D
= −C
ν∆f
ν
Page 6 of 35
ACS Paragon Plus Environment
Langmuir
123456789101112131415161718192021222324252627282930313233343536373839404142434445464748495051525354555657585960

7
loaded into temperature-controlled, liquid flow cells (QFM 401, Biolin Scientific) on a Q-Sense E4 128
instrument (Biolin Scientific). 129
We formed supported lipid bilayers on the SiO2 sensor from small unilamellar vesicles composed 130
of purely DOPC or 60/20/20 mol% DOPC/SM/Chol using the vesicle fusion method.15, 44 The sensors were 131
equilibrated in 0.150 M NaCl buffered to pH 7.4 with 0.010 M HEPES (pH and buffer concentration used 132
throughout) and flowed until a stable baseline was reached. A solution of vesicles (0.03125 mg·mL-1) in 133
the same solution was flowed (0.100 mL·min-1) over the surface until the critical surface vesicle 134
concentration45 was attained, at which point, the vesicles fused and ruptured to spontaneously form a 135
supported lipid bilayer. Any loosely adsorbed vesicles were rinsed away and a stable baseline was 136
established by rinsing with vesicle-free solution. The ionic strength of the solution was lowered to 0.010 137
M NaCl until the frequency and dissipation values stabilized. 138
Suspensions of 1 nM PDDA-QDs in 0.010 M NaCl were vortexed and immediately flowed over 139
the bilayers. Attachment was monitored for 20 min followed by rinsing with nanoparticle-free solution, 140
until stable frequency and dissipation values were observed, to examine the reversibility of the 141
interaction and any other changes induced by rinsing. Control experiments examined the interaction of 142
PDDA-QDs with the underlying SiO2 sensor. All attachment experiments were carried out at 25.0 ± 0.5 °C 143
in at least triplicate. 144
Atomic Force Microscopy. We acquired AFM images of supported lipid bilayers before and after 145
exposure to PDDA-QDs. Supported lipid bilayers were formed on atomically flat surfaces of mica. Mica 146
substrates (Highest Grade V1, Ted Pella) were adhered to glass bottom dishes (P60G-1.5-30-F, MatTek 147
Corporation) using 5-minute epoxy (ITW Polymer Adhesives) and then cleaved using double-sided tape 148
to produce clean, atomically flat surfaces. We equilibrated the mica with 3 mL of 0.150 M NaCl and 149
Page 7 of 35
ACS Paragon Plus Environment
Langmuir
123456789101112131415161718192021222324252627282930313233343536373839404142434445464748495051525354555657585960

8
0.005 M CaCl2 buffered to pH 7.4 with 0.010 M HEPES for at least 20 min. Calcium was used to facilitate 150
the adsorption of the negatively charged vesicles on the negatively charged mica.46 The mica remained 151
completely submerged during initial equilibration, formation of supported lipid bilayers, exposure to 152
PDDA-QDs, and AFM imaging. Supported lipid bilayers were formed following a previously published 153
protocol47 adapted to our solution conditions. Briefly, small unilamellar vesicles (0.0625 mg·mL-1) in the 154
same solution were added to the dish to cover the bottom of the dish and the mica surface and heated 155
for 1 h to 45 °C (above the transition temperature of all lipids used). Samples were allowed to cool to 156
room temperature, and the liquid was exchanged with 12 mL (three 4 mL aliquots) of vesicle-free 157
solution to remove loosely adhered vesicles, then with 12 mL (three 4 mL aliquots ) of 0.150 M NaCl to 158
remove excess calcium, and finally with 12 mL (three 4 mL aliquots ) of 0.010 M NaCl solution to reduce 159
ionic strength. 160
All images were collected in PeakForce Tapping™ mode using a Dimension Icon (Bruker) atomic 161
force microscope. Gold-coated silicon nitride probes (Bruker, NPG) with a nominal force constant of 0.24 162
N·m-1 were employed. The gold coating reduced electrostatic interactions with the positively charged 163
PDDA-QDs relative to more commonly used silicon nitride probes. Prior to imaging, the deflection 164
sensitivity of the cantilever in air was determined using a fused silica reference sample. The force 165
constant was also calibrated in air using the thermal tune method and fitting the power spectral density 166
plot to a Lorentzian function.49 Imaging was conducted in 0.010 M NaCl buffered to pH 7.4 with 0.010 M 167
HEPES. The deflection sensitivity of the tip in liquid was re-calibrated using the previously determined 168
force constant.50-51 169
Following calibration, the AFM head was raised, the calibration sample was removed, the bilayer 170
sample in the dish was then placed onto the vacuum line of the AFM stage, and magnets were placed on 171
Page 8 of 35
ACS Paragon Plus Environment
Langmuir
123456789101112131415161718192021222324252627282930313233343536373839404142434445464748495051525354555657585960

9
three sides of the dish to prevent movement of the dish during imaging. The AFM head was replaced 172
and slowly lowered until the drop of buffer on the tip reached the submerged sample. 173
Images were collected at room temperature (24.5 °C). Supported lipid bilayers sometimes contain ~4 174
nm deep holes, extending to the underlying mica substrate. All experiments reported here used high 175
quality bilayers that contained no holes or other defects over at least three regions scanned microns 176
away from one another. We placed a registration marker on the bottom of the glass-bottom dish to 177
ensure that same region could be found using the optical microscope on the AFM and that the same 178
defect-free region was examined before and after exposure to nanomaterials. To minimize the effect of 179
the mica substrate and electrostatic attractive forces that could occur between the positively charged 180
quantum dots and the negatively charged mica due to holes in the bilayer,18, 21 any bilayers found to 181
contain holes or defects prior to PDDA-QD exposure were discarded. At least three images were 182
collected for at least three different samples for each bilayer type studied prior to introduction of PDDA-183
QDs. 184
To examine the time scale of structural changes induced by exposure to PDDA-QDs, we initiated 185
imaging immediately after introducing 1 nM QD suspensions in 0.010 M NaCl buffered to pH 7.4 with 186
0.010 M HEPES to the bilayers. Initial images took ~8 min to optimize and collect, and subsequent 187
images were collected every ~4-5 min. We acquired images of the same region for up to 1 h. We also 188
conducted experiments designed to match the sequence of solution changes used for QCM-D studies. In 189
these experiments suspensions of 1 nM QDs in 0.010 M NaCl buffered to pH 7.4 with 0.010 M HEPES 190
were added to the supported lipid bilayer and allowed to interact for 20 min. After 20 min, bilayers were 191
rinsed with 12 mL (three 4 mL aliquots) of nanoparticle-free solution to remove any loosely adhered 192
QDs, and imaging was immediately conducted at various spots on the bilayers. Resulting images were 193
similar to those observed in the images collected over time. Control experiments were conducted to 194
Page 9 of 35
ACS Paragon Plus Environment
Langmuir
123456789101112131415161718192021222324252627282930313233343536373839404142434445464748495051525354555657585960

10
investigate any topographic changes resulting from exposure of bilayers to free PDDA polymer. These 195
control experiments employed poly(diallyldimethylammonium chloride) (Sigma, molecular mass 196
200,000-350,000 Da, 25 µg·mL-1) in 0.010 M NaCl buffered to pH 7.4 with 0.010 M HEPES . 197
Determination of free polymer concentration in these solutions of quantum dots is difficult; the 198
concentration used here was based on the concentration of polymer used in the functionalization and is 199
therefore an overestimate. We chose to overestimate the polymer concentration to increase confidence 200
that any effects observed were due to the quantum dots rather than to polymer free in solution. Control 201
experiments were also conducted in which background solution was added instead of PDDA-QDs and 202
imaging was immediately began to ensure that no changes in bilayer structure were observed due to 203
sample preparation or changes over time. 204
RESULTS AND DISCUSSION 205
Characterization of PDDA-QDs. The PDDA-QDs were positively charged and had an electrophoretic 206
mobility of a (+2.6 ± 0.3) × 108 m2 V-1 s-1 in 0.010 M NaCl buffered to pH 7.4 with 0.010 M HEPES, the 207
solution used in investigating interaction with supported lipid bilayers. The hydrodynamic diameter of 208
these particles in this solution was 17 ± 1 nm, suggesting the particles were slightly aggregated in 209
solution. The diameter determined by TEM was 6.1 ± 1.2 nm (Figure S3). 210
Formation of Zwitterionic Lipid Bilayers on SiO2. We constructed supported bilayers composed of 211
DOPC or 60/20/20 mol% DOPC/SM/Chol on SiO2-coated QCM-D sensor crystals. We chose to work with 212
DOPC because phosphatidylcholine is a majority component in the outer leaflet of eukaryotic 213
cytoplasmic membranes.38 The cholesterol- and sphingomyelin-containing bilayers were used to probe 214
the importance of phase-segregated domains in the interaction of PDDA-QDs with bilayers. Both DOPC 215
and SM possess zwitterionic phosphatidylcholine headgroups. Phosphatidylcholine bilayers formed on a 216
Page 10 of 35
ACS Paragon Plus Environment
Langmuir
123456789101112131415161718192021222324252627282930313233343536373839404142434445464748495051525354555657585960

11
SiO2 surface carry net negative potentials.16, 52-53 The high affinity of SM for Chol promotes dense packing 217
and formation of Lo domains.54-55 218
Figure S1 shows example QCM-D frequency and dissipation traces for the formation of DOPC and 219
60/20/20 mol% DOPC/SM/Chol bilayers. The traces exhibit the characteristic minimum in frequency and 220
maximum in dissipation corresponding to the attainment of a critical surface vesicle concentration at 221
which point the vesicles fuse and rupture, releasing the water contained within them and spontaneously 222
form supported lipid bilayers.56 Table S1 presents the frequency and dissipation values obtained for the 223
bilayers after rinsing with vesicle-free solution to remove adhering vesicles. The DOPC bilayers exhibited 224
final frequency changes of 24.8 ± 0.3 Hz, which corresponds to a mass of 446 ± 5 ng·cm-2 as 225
approximated with the Sauerbrey equation,43 and dissipation changes of 0.2 (± 0.1) × 10-6 (Table S1). 226
These values are consistent with previous reports of well-formed DOPC bilayers under similar solution 227
conditions.15, 45, 56 The 60/20/20 mol% DOPC/SM/Chol bilayers had a final frequency changes of 27.0 ± 228
0.5 Hz, which corresponds to masses of 486 ± 9 ng·cm-2 and dissipation changes of 0.4 (± 0.1) × 10-6 229
(Table S1). These values are consistent with those previously reported for supported lipid bilayers 230
containing Lo domains.15 231
Interaction of PDDA-QDs with DOPC and Lo Domain-containing Bilayers as Probed by QCM-D. We 232
characterized the interaction of quantum dots with supported lipid bilayers described above by 233
monitoring changes in frequency and dissipation upon introduction of PDDA-QDs to the flow chamber. 234
Figure 1a shows the QCM-D frequency change as a function of time as quantum dots interact with a 235
DOPC bilayer. Table 1 summarizes the observed changes in frequency and energy dissipation. At the 236
longest exposures indicated prior to rinsing (Δf20 min), the QCM-D resonance frequency decreased by 237
22.8 ± 1.2 Hz, which corresponds to a Sauerbrey mass of 410 ± 22 ng·cm-2. The large frequency decrease 238
demonstrates attachment of the positively charged nanoparticles to the bilayer, consistent with 239
Page 11 of 35
ACS Paragon Plus Environment
Langmuir
123456789101112131415161718192021222324252627282930313233343536373839404142434445464748495051525354555657585960

12
favorable electrostatic interactions. Figure 1b shows the corresponding shift in dissipation factor 240
associated with PDDA-QD attachment. The maximum change in dissipation before initiation of the rinse 241
step was 1.8 (± 0.1) × 10-6. Upon rinse, a small increase in frequency (3.8 ± 0.7 Hz) and drop in 242
dissipation (–0.8 (± 0.1) × 10-6) were observed, corresponding to a slight reduction in both surface-243
associated mass and energy dissipation. We attribute these changes to removal of loosely adsorbed 244
quantum dots. Interestingly, approximately 10 min after the rinse began, the frequency rises sharply and 245
dissipation increases dramatically. Ultimately, the frequency and dissipation values reach constant 246
values corresponding to a net increase in dissipation (1.5 (± 0.2) × 10-6) and no net change in frequency 247
relative to the values immediately prior to the commencement of rinsing. 248
We next investigated the interaction of PDDA-QDs with phase-segregated SLBs using 60/20/20 mol% 249
DOPC/SM/Chol bilayers. Figure 1c,d shows frequency and dissipation traces for the interaction of PDDA-250
QDs with a 60/20/20 mol% DOPC/SM/Chol bilayer. The attachment of PDDA-QDs to these phase-251
segregated bilayers produced maximum changes in frequency and dissipation (Δf20 min and ΔD20 min) of –252
18.2 ± 0.8 Hz (corresponding to a Sauerbrey mass of 328 ± 14 ng·cm-2) and 1.3 (± 0.1) × 10-6 (Table 1). 253
Figure 1c, d shows that upon rinsing, a small increase in frequency (2.2 ± 0.2 Hz) and decrease in 254
dissipation (–0.6 (± 0.1) × 10-6) were produced, followed closely by a sharp increase in dissipation and 255
drop in frequency until plateau values are reached, similar to that observed for pure DOPC. The net 256
effect of rinsing is an average increase in dissipation (2.0 (± 0.2) × 10-6) and no mass change compared to 257
the maximum values prior to rinse. 258
The extent of attachment to the DOPC and phase-segregated bilayers did not differ (p = 0.063 and 259
0.900, respectively, for Δf20 min and ΔD20 min), similar to a prior study15 comparing the interaction of gold 260
nanoparticles (AuNPs) functionalized with cationic mercaptopropylamine (MPNH2) with the same 261
bilayers under the same solution conditions as used here. In that study, the presence of phase-262
Page 12 of 35
ACS Paragon Plus Environment
Langmuir
123456789101112131415161718192021222324252627282930313233343536373839404142434445464748495051525354555657585960

13
segregated domains promoted attachment of MPNH2-AuNPs at 0.1 M NaCl, an ionic strength higher 263
than we employed in the present study. The results from our study differ from that on MPNH2-AuNP in 264
one important way: the changes in frequency and dissipation observed during rinsing in the present 265
study did not occur in the study employing MPNH2-AuNPs. This difference is presumably due primarily 266
to the cationic molecules used to coat the nanoparticle surfaces. The nanoparticles used in the previous 267
study were functionalized with short molecular ligands terminating in a primary amine.15 In the present 268
study, the QD were wrapped with PDDA polymer (average molecular mass of 200,000 Da) which has 269
cyclic quaternary amine pendant groups. 270
To determine whether changes in frequency and energy dissipation observed during rinsing for the 271
systems containing PDDA-QDs required the presence of a phospholipid bilayer, we conducted analogous 272
experiments using SiO2-coated QCM-D sensors lacking supported lipid bilayers. Figure S2 shows an 273
example QCM-D trace from such a control experiment and demonstrates the attachment of PDDA-QDs 274
to the SiO2 substrate followed by stabilization of the frequency and dissipation values (Table 1). Rinsing 275
the PDDA-QDs adhered to the silica substrate was not accompanied by the shifts in frequency (Figure 276
S2a) or dissipation (Figure S2b) observed for these particles on DOPC bilayers. This result suggests that 277
the presence of the bilayer is necessary for the frequency and dissipation changes observed upon rinsing 278
attached PDDA-QDs (Figure 1a,b). 279
We hypothesize that the changes in frequency and dissipation occurring after removal of PDDA-QDs 280
from the overlying solution during rinsing correspond to restructuring of the bilayer-QD system. We 281
tested this hypothesis in the AFM experiments described below. We note that a previous study on the 282
formation of negatively charged SLBs on QCM-D sensor surfaces reported similar trends in frequency 283
and dissipation and attributed them to the restructuring of adsorbed phospholipids on the silica 284
surface.44 285
Page 13 of 35
ACS Paragon Plus Environment
Langmuir
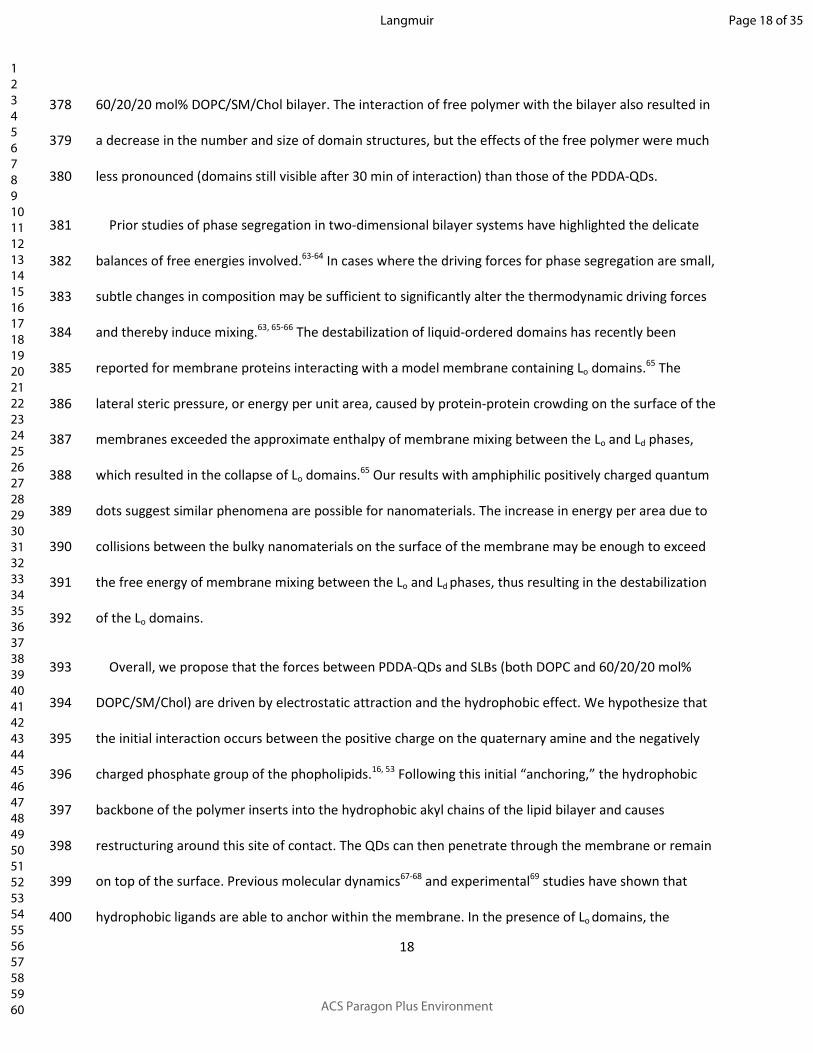
123456789101112131415161718192021222324252627282930313233343536373839404142434445464748495051525354555657585960

14
Interaction with PDDA-QDs Induces Structural Changes to DOPC Bilayers. The results of the QCM-D 286
experiments described above suggested that interaction of PDDA-QDs with both DOPC and 60/20/20 287
mol% DOPC/SM/Chol bilayers led to structural rearrangements. We monitored the interaction of the 288
PDDA-QDs with both bilayer types using time-resolved AFM. Figure 2 (and the movie found in the 289
Supporting Information) shows a time-lapse sequence for PDDA-QDs interacting with a DOPC bilayer. 290
Prior to introduction of PDDA-QDs (Fig. 2a), the supported lipid bilayer had a uniformly smooth surface 291
with RMS height variations < 110 pm, consistent with the DOPC bilayer following the topography of the 292
underlying mica substrate. This uniformity is consistent with the fact that prior studies15 have shown 293
that under conditions similar to those of this experiment, DOPC is present in an entirely liquid-294
disordered phase. To confirm that the DOPC bilayer was present we conducted force-breakthrough 295
curves (Figure S4) and observed that the layers exhibited a rupture event characteristic of SLBs. The 296
breakthrough force observed for DOPC bilayers was ~3 nN and the discontinuity was ~4-5 nm in length 297
corresponding to the height of the bilayer. These values were consistent with previous reports for DOPC 298
SLBs57 with exact values being dependent on the environmental conditions of the particular study (i.e., 299
pH, temperature, rate of indentation).58 After this confirmation we added quantum dots and 300
immediately began imaging. 301
Figure 2b shows that the QDs caused structural changes immediately upon interaction with the DOPC 302
bilayer. Starting with the first time point imaged after exposure of the bilayer to PDDA-QDs (at t = 8 303
min), the AFM data showed small regions 1.1 ± 0.2 nm in height, some of which contained taller features 304
with heights of 8.6 ± 2.3 nm (Figure 3a, Table 2). We refer to the former as “microdomains” to 305
distinguish them from the phase-segregated domains. The taller features appeared solely within the 306
microdomains. The height of the taller features is consistent with the nanoparticle diameter determined 307
from TEM images (6.1 ± 1.2 nm, Figure S3). In a control experiment we examined the impact of 25 308
Page 14 of 35
ACS Paragon Plus Environment
Langmuir
123456789101112131415161718192021222324252627282930313233343536373839404142434445464748495051525354555657585960

15
µg·mL-1PDDA polymer on bilayer structure in the absence of QDs (Figure 3b). This PDDA concentration is 309
an overestimation of free polymer in solution and was based on the concentration of polymer used in 310
the functionalization according to the manufacturer. We observed the formation of ~1 nm tall 311
microdomains that lacked the taller features present in the some of the microdomains induced in DOPC 312
bilayers exposed to PDDA-QDs. The ~1 nm high features are induced by interaction of the bilayer with 313
PDDA or PDDA-QDs as the structure of the DOPC bilayer did not change over time after addition of 314
PDDA-QD-free buffer (Figure S5a,b). We therefore conclude that the microdomains observed in Fig. 3b 315
arise only after the bilayers are exposed to the PDDA polymer or the PDDA-QDs and that the tallest 316
features likely correspond to PDDA-QDs. Similar structures have been reported previously, where the 317
interaction of amphiphilic peptides with a DOPC bilayer produced locally high regions (~10 nm relative 318
to the underlying DOPC bilayer) formed within microdomains (~1.4 nm taller than the underlying 319
bilayer).59 The authors of that study hypothesized that the tallest features were either large aggregates 320
of peptides or partially solubilized/“budding” regions of the bilayer.59 While we hypothesize in our study 321
that the tallest features are quantum dots, we cannot rule out that the PDDA-QDs caused budding 322
regions of the bilayers, whereas the polymer alone did not. 323
Exposure of bilayers to either PDDA-QDs or PDDA resulted in microdomain formation. We hypothesize 324
that the microdomains arise from the interaction with the PDDA polymer – either wrapping the QDs or 325
free in solution. The high local density of PDDA on the QDs and the comparatively large size of PDDA-326
QDs appears to lead to more pronounced structural perturbations relative to the polymer alone. 327
Previous research on amine-terminated poly(amidoamine) dendrimers has shown that the degree of 328
disruption to liquid crystalline supported phospholipid bilayers increases with dendritic generation and 329
therefore dendrimer size.60 The polymer alone induces formation of microdomains occupying 2.0 ± 1.9% 330
of the total area over ~30 min, whereas exposure to PDDA-QDs resulted in a fractional coverage of 23.0 331
Page 15 of 35
ACS Paragon Plus Environment
Langmuir
123456789101112131415161718192021222324252627282930313233343536373839404142434445464748495051525354555657585960

16
± 2.2% microdomains over this same time frame. Initial attachment likely occurs due to favorable 332
electrostatic attraction between the positively charged quaternary amine pendant groups of the PDDA 333
and the negative surface potential of the bilayer as has been reported previously with primary amines.16, 334
53 Following initial attachment, we hypothesize that the hydrophobic backbone of the polymer likely 335
extends into the hydrophobic core of the bilayer. The resulting mechanical stresses induce a height 336
change in the surrounding bilayer. Such a height change can arise from changes in the tilt angle of the 337
lipids with respect to the surface normal. The observed height change (1.1 ± 0.2 nm) is also consistent 338
with the quantum dots inducing an increase in lipid ordering, due to more efficient packing of the 339
hydrophobic tail groups, within the membrane.61 However, an increase in lipid ordering and packing 340
would be expected to lead to the formation of holes or a decrease in bilayer coverage,59 neither of 341
which are observed in Fig. 2. In Fig. 2b-h, the data show that over time more microdomains form, 342
consistent with penetration of more particles into the bilayer over time. The formation of more 343
microdomains over time is also consistent with the decrease in frequency and increase in dissipation 344
observed by QCM-D. More quantum dots may penetrate the bilayer over time causing an increase in 345
mass at the surface and a more dissipative final structure. 346
Interaction of PDDA-QDs with Phase-segregated Bilayers Cause Lo domains to Disappear. We next 347
used in situ AFM imaging to examine the interaction of the quantum dots with a 60/20/20 mol% 348
DOPC/SM/Chol bilayer over time. Figure 4a shows that this bilayer composition forms phase-segregated 349
Lo domains, strongly enriched in sphingomyelin and cholesterol, that are ~1 nm higher in height than the 350
Ld phase containing predominantly DOPC. This finding is consistent with previous work showing that 351
cholesterol induces ordering of the unsaturated acyl chains of sphingomyelin, making the Lo regions ~1 352
nm taller than the Ld regions.15, 61 The shape and lateral sizes of the Lo domains are also consistent with 353
previous reports of similar bilayers on mica substrates.48 Commencing with the first time point collected 354
Page 16 of 35
ACS Paragon Plus Environment
Langmuir
123456789101112131415161718192021222324252627282930313233343536373839404142434445464748495051525354555657585960

17
after addition of the QDs, structural changes occurred similar to those observed with pure DOPC 355
bilayers. Figure 4b shows the formation of microdomains in the Ld phases of the bilayer, encompassing 356
taller features, consistent with our observations on liquid crystalline DOPC bilayers. We further found 357
that the restructured lipids around the quantum dots were slightly taller (1.8 ± 0.2 nm, p < 0.001) than 358
analogous structures in the DOPC bilayer (Figure 5b, Table 2). This increased height relative to the 359
surrounding Ld phase is consistent with the positive amine groups of the PDDA-QDs binding to the 360
phosphocholine headgroup of the lipid bilayers and the resulting mechanical stresses inducing a height 361
change in the surrounding bilayer, much like our observations in the case of PDDA-QDs interacting with 362
the DOPC bilayer. The larger thickness of the microdomains in phase-segregated SLBs relative to those 363
formed in pure DOPC may be due to the presence of cholesterol in the Ld domains of the phase-364
segregated bilayers. A previous study showed that the presence of 30% cholesterol in a POPC bilayer 365
increased its height by ~0.4 nm.62 Therefore, the presence of cholesterol in the membranes used in our 366
work, may account for the increase in height of the microdomains as compared to pure DOPC. 367
Upon addition of the QDs, the liquid-ordered domains of the DOPC/SM/Chol bilayer decrease in 368
size and ultimately disappear within 15 min as clearly shown in Fig. 4d and 4e. Control experiments 369
scanning the bilayer over the same length of time without exposure to PDDA-QDs showed no formation 370
of microdomains or bright regions over the length scales of these studies (Figure S5c,d). Figure S5c, d 371
shows that small Lo domains (< 0.06 µm2) disappear over time without the addition of PDDA-QDs; 372
however, Figure S6 shows that the addition of PDDA-QDs to the same bilayer in Figure S5 results in the 373
complete disappearance of the phase-segregated domains within 20 min. This confirms that diffusion of 374
the phase-segregated domains within the bilayer alone cannot account for the observed disappearance 375
of the domains and that this effect is due to interaction with the PDDA-QDs. Figure S7 shows time-lapse 376
images of free PDDA polymer (molecular mass 200,000 – 350,000, 25 µg·mL-1) interacting with a 377
Page 17 of 35
ACS Paragon Plus Environment
Langmuir
123456789101112131415161718192021222324252627282930313233343536373839404142434445464748495051525354555657585960
18
60/20/20 mol% DOPC/SM/Chol bilayer. The interaction of free polymer with the bilayer also resulted in 378
a decrease in the number and size of domain structures, but the effects of the free polymer were much 379
less pronounced (domains still visible after 30 min of interaction) than those of the PDDA-QDs. 380
Prior studies of phase segregation in two-dimensional bilayer systems have highlighted the delicate 381
balances of free energies involved.63-64 In cases where the driving forces for phase segregation are small, 382
subtle changes in composition may be sufficient to significantly alter the thermodynamic driving forces 383
and thereby induce mixing.63, 65-66 The destabilization of liquid-ordered domains has recently been 384
reported for membrane proteins interacting with a model membrane containing Lo domains.65 The 385
lateral steric pressure, or energy per unit area, caused by protein-protein crowding on the surface of the 386
membranes exceeded the approximate enthalpy of membrane mixing between the Lo and Ld phases, 387
which resulted in the collapse of Lo domains.65 Our results with amphiphilic positively charged quantum 388
dots suggest similar phenomena are possible for nanomaterials. The increase in energy per area due to 389
collisions between the bulky nanomaterials on the surface of the membrane may be enough to exceed 390
the free energy of membrane mixing between the Lo and Ld phases, thus resulting in the destabilization 391
of the Lo domains. 392
Overall, we propose that the forces between PDDA-QDs and SLBs (both DOPC and 60/20/20 mol% 393
DOPC/SM/Chol) are driven by electrostatic attraction and the hydrophobic effect. We hypothesize that 394
the initial interaction occurs between the positive charge on the quaternary amine and the negatively 395
charged phosphate group of the phopholipids.16, 53 Following this initial “anchoring,” the hydrophobic 396
backbone of the polymer inserts into the hydrophobic akyl chains of the lipid bilayer and causes 397
restructuring around this site of contact. The QDs can then penetrate through the membrane or remain 398
on top of the surface. Previous molecular dynamics67-68 and experimental69 studies have shown that 399
hydrophobic ligands are able to anchor within the membrane. In the presence of Lo domains, the 400
Page 18 of 35
ACS Paragon Plus Environment
Langmuir
123456789101112131415161718192021222324252627282930313233343536373839404142434445464748495051525354555657585960

19
additional energy per area induced by the addition of the PDDA-QDs to these systems, exceeds the 401
enthalpy of membrane mixing and results in the mixing of the Lo and Ld phases. While this phenomenon 402
has been shown previously following interactions with proteins65 and polymers66 in similar systems, we 403
believe this to be the first evidence of positively charged quantum dots inducing the collapse of Lo 404
domains. 405
SUMMARY AND CONCLUSIONS 406
Our results show that PDDA-QDs induce complex structural rearrangements of supported lipid 407
bilayers consisting of 100% DOPC or 60/20/20 mol% DOPC/SM/Chol. The use of complementary, in situ 408
analytical methods provided unprecedented insights into these structural changes. Namely, QCM-D 409
shows that the interaction of QDs with the lipid bilayers induces structural rearrangements of the 410
bilayers. Real-time in situ AFM imaging shows the formation of microdomains with higher features in the 411
center of some microdomains that are consistent with quantum dots attached to the bilayer. 412
Interestingly, the interaction of the positively charged amphiphilic quantum dots led to selective 413
shrinkage of the liquid-ordered domains, with complete disappearance occurring after ~15 min of 414
interaction. We hypothesize that the positive charge on the PDDA polymer interacts favorably with the 415
negatively charged bilayers. Following this favorable interaction, the hydrophobic backbone of the 416
polymer ligand can insert into the hydrophobic akyl chains of the bilayer and cause restructuring around 417
this point of contact. Ultimately, when the additional energy per area caused by polymer-polymer, 418
nanoparticle-nanoparticle, and/or nanoparticle-polymer collisions at the membrane surface exceeds the 419
free energy of membrane mixing, the collapse of Lo domains was observed. 420
The present study represents an initial demonstration of the complex interactions that can occur 421
between quantum dots wrapped with a positively charged, amphiphilic polymer, and supported lipid 422
Page 19 of 35
ACS Paragon Plus Environment
Langmuir
123456789101112131415161718192021222324252627282930313233343536373839404142434445464748495051525354555657585960

20
bilayers. While more studies are necessary to generalize these results, other studies with amphiphilic 423
and positively charged, hydrophobic ligands have shown similar features59 and similar mechanisms of 424
interaction were proposed.68 Thus, we expect the results presented here will be most transferable to 425
nanomaterials with positively charged hydrophobic or amphiphilic ligands. 426
ASSOCIATED CONTENT 427
Supporting Information. The Supporting Information is available free of charge on the ACS Publications 428
website. 429
Frequency and dissipation QCM-D traces for DOPC and 60/20/20 mol% DOPC/SM/Chol bilayer 430
formation and interaction with PDDA-QDs; Summary of frequency and dissipation shifts observed for 431
DOPC and 60/20/20 mol% DOPC/SM/Chol bilayer formation; Changes in frequency and dissipation as a 432
function of time as PDDA-QDs interact with the underlying SiO2 substrate; TEM of the quantum dots; 433
representative FB curve on DOPC; time-lapse AFM of DOPC and 60/20/20 mol% DOPC/SM/Chol in the 434
absence of PDDA-QDs; additional time-lapse AFM of PDDA-QDs interacting with a 60/20/20 mol% 435
DOPC/SM/Chol bilayer; time lapse AFM of 60/20/20 mol% DOPC/SM/Chol exposed to 25 µg·mL-1PDDA 436
polymer. 437
AUTHOR INFORMATION 438
Corresponding Author 439
*Phone: 608-262-6371; e-mail: [email protected]. 440
*Phone: 608-263-4971; e-mail: [email protected]. 441
Page 20 of 35
ACS Paragon Plus Environment
Langmuir
123456789101112131415161718192021222324252627282930313233343536373839404142434445464748495051525354555657585960

21
ORCID ID 442
Joseph T. Buchman: 0000-0001-5827-8513 443
Robert J. Hamers: 0000-0003-3821-9625 444
Christy L. Haynes: 0000-0002-5420-5867 445
Arielle C. Mensch: 0000-0002-4063-5882 446
Joel A. Pedersen: 0000-0002-3918-1860 447
Present Address 448
⊥ Environmental Molecular Sciences Laboratory, Pacific Northwest National Laboratory, Richland, WA 449
99354 United States. 450
Notes 451
The authors declare no competing financial interest. 452
ACKNOWLEDGMENTS 453
This work was supported by the National Science Foundation under the Center for Sustainable 454
Nanotechnology, CHE-1503408. The CSN is part of the Centers for Chemical Innovation Program. J.T.B. 455
was supported by the National Science Foundation Graduate Research Fellowship under Grant No. 456
00039202. 457
REFERENCES 458
1. Nel, A.; Xia, T.; Mӓdler, L.; Li, N., Toxic potential of materials at the nanolevel. Science, 2006, 459
311, 622-627. 460
Page 21 of 35
ACS Paragon Plus Environment
Langmuir
123456789101112131415161718192021222324252627282930313233343536373839404142434445464748495051525354555657585960

22
2. Christian, P.; Von der Kammer, F.; Baalousha, M.; Hofmann, T., Nanoparticles: Structure, 461
properties, preparation and behaviour in environmental media. Ecotoxicology, 2008, 17, 326-43. 462
3. Maurer-Jones, M. A.; Gunsolus, I. L.; Murphy, C. J.; Haynes, C. L., Toxicity of engineered 463
nanoparticles in the environment. Anal. Chem., 2013, 85, 3036-49. 464
4. Hamers, R. J., Nanomaterials and global sustainability. Acc. Chem. Res., 2017, 50, 633-637. 465
5. Louie, S. M.; Dale, A. L.; Casman, E. A.; Lowry, G. V., Challenges facing the environmental 466
nanotechnology research enterprise. In Engineered nanoparticles and the environment: 467
Biophysicochemical processes and toxicity, Xing, B.; Vectis, C. D.; Senesi, N., Eds. 2016; Vol. 4, pp 3-19. 468
6. Felix, L. C.; Ortega, V. A.; Goss, G. G., Cellular uptake and intracellular localization of poly (acrylic 469
acid) nanoparticles in a rainbow trout (Oncorhynchus mykiss) gill epithelial cell line, RTgill-W1. Aquat. 470
Toxicol., 2017, 192, 58-68. 471
7. Ding, B.; Tian, Y.; Pan, Y.; Shan, Y.; Cai, M.; Xu, H.; Sun, Y.; Wang, H., Recording the dynamic 472
endocytosis of single gold nanoparticles by AFM-based force tracing. Nanoscale, 2015, 7, 7545-9. 473
8. Chen, J.; Hessler, J. A.; Putchakayala, K.; Panama, B. K.; Khan, D. P.; Hong, S.; Mullen, D. G.; 474
DiMaggio, S. C.; Som, A.; Tew, G. N.; Lopatin, A. N.; James R. Baker, J.; Holl, M. M. B.; Orr, B. G., Cationic 475
nanoparticles induce nanoscale disruption in living cell plasma membranes. J. Phys. Chem. B, 2009, 113, 476
11179-11185. 477
9. Leroueil, P. R.; Hong, S.; Mecke, A.; Jr., J. R. B.; Orr, B. G.; Holl, M. M. B., Nanoparticle interaction 478
with biological membranes: Does nanotechnology present a Janus face? Acc. Chem. Res., 2007, 40, 335-479
342. 480
10. Zhu, W.; von dem Bussche, A.; Yi, X.; Qiu, Y.; Wang, Z.; Weston, P.; Hurt, R. H.; Kane, A. B.; Gao, 481
H., Nanomechanical mechanism for lipid bilayer damage induced by carbon nanotubes confined in 482
intracellular vesicles. Proc. Natl. Acad. Sci. U.S.A., 2016, 113, 12374-12379. 483
11. Kim, M. S.; Louis, K. M.; Pedersen, J. A.; Hamers, R. J.; Peterson, R. E.; Heideman, W., Using 484
citrate-functionalized TiO2 nanoparticles to study the effect of particle size on zebrafish embryo toxicity. 485
Analyst, 2014, 139, 964-72. 486
12. Hang, M. N.; Gunsolus, I. L.; Wayland, H.; Melby, E. S.; Mensch, A. C.; Hurley, K. R.; Pedersen, J. 487
A.; Haynes, C. L.; Hamers, R. J., Impact of nanoscale lithium nickel manganese cobalt oxide (NMC) on the 488
bacterium Shewanella oneidensis MR-1. Chem. Mater., 2016, 28, 1092-1100. 489
13. Lesniak, A.; Salvati, A.; Santos-Martinez, M. J.; Radomski, M. W.; Dawson, K. A.; Åberg, C., 490
Nanoparticle adhesion to the cell membrane and its effect on nanoparticle uptake efficiency. J. Am. 491
Chem. Soc., 2013, 135, 1438-44. 492
Page 22 of 35
ACS Paragon Plus Environment
Langmuir
123456789101112131415161718192021222324252627282930313233343536373839404142434445464748495051525354555657585960

23
14. Goodman, C. M.; McCusker, C. D.; Yilmaz, T.; Rotello, V. M., Toxicity of gold nanoparticles 493
functionalized with cationic and anionic side chains. Bioconjugate Chem., 2004, 15, 897-900. 494
15. Melby, E. S.; Mensch, A. C.; Lohse, S. E.; Hu, D.; Orr, G.; Murphy, C. J.; Hamers, R. J.; Pedersen, J. 495
A., Formation of supported lipid bilayers containing phase-segregated domains and their interaction 496
with gold nanoparticles. Environ. Sci.: Nano, 2016, 3, 45-55. 497
16. Troiano, J. M.; Olenick, L. L.; Kuech, T. R.; Melby, E. S.; Hu, D.; Lohse, S. E.; Mensch, A. C.; 498
Dogangun, M.; Vartanian, A. M.; Torelli, M. D.; Ehimiaghe, E.; Walter, S. R.; Fu, L.; Anderton, C. R.; Zhu, 499
Z.; Wang, H.; Orr, G.; Murphy, C. J.; Hamers, R. J.; Pedersen, J. A.; Geiger, F. M., Direct probes of 4 nm 500
diameter gold nanoparticles interacting with supported lipid bilayers. J. Phys. Chem. C, 2015, 119, 534-501
546. 502
17. Chen, K. L.; Bothun, G. D., Nanoparticles meet cell membranes: Probing nonspecific interactions 503
using model membranes. Environ. Sci. Technol., 2014, 48, 873-80. 504
18. Leroueil, P. R.; Berry, S. A.; Duthie, K.; Han, G.; Rotello, V. M.; McNerny, D. Q.; Jr., J. R. B.; Orr, B. 505
G.; Holl, M. M. B., Wide varieties of cationic nanoparticles induce defects in supported lipid bilayers. 506
Nano Letters, 2008, 8, 420-424. 507
19. Jacobson, K. H.; Gunsolus, I. L.; Kuech, T. R.; Troiano, J. M.; Melby, E. S.; Lohse, S. E.; Hu, D.; 508
Chrisler, W. B.; Murphy, C. J.; Orr, G.; Geiger, F. M.; Haynes, C. L.; Pedersen, J. A., Lipopolysaccharide 509
density and structure govern the extent and distance of nanoparticle interaction with actual and model 510
bacterial outer membranes. Environ. Sci. Technol., 2015, 49, 10642-50. 511
20. Melby, E. S.; Allen, C. R.; Foreman-Ortiz, I. U.; Caudill, E. R.; Kuech, T. R.; Vartanian, A. M.; Zhang, 512
X.; Murphy, C. J.; Hernandez, R. T.; Pedersen, J. A., Peripheral membrane proteins dramatically alter 513
nanoparticle interaction at lipid bilayer interfaces. Langmuir, (in review). 514
21. Hong, S.; Bielinska, A. U.; Mecke, A.; Keszler, B.; Beals, J. L.; Shi, X.; Balogh, L.; Orr, B. G.; James R. 515
Baker, J.; Holl, M. M. B., Interaction of poly(amidoamine) dendrimers with supported lipid bilayers and 516
cells: Hole formation and the relation to transport. Bioconjugate Chem., 2004, 15, 774-782. 517
22. Lee, K.; Zhang, L.; Yi, Y.; Wang, X.; Yu, Y., Rupture of lipid membranes induced by amphiphilic 518
Janus nanoparticles. ACS Nano, 2018, 12, 3646-3657. 519
23. Jing, B.; Abot, R. C.; Zhu, Y., Semihydrophobic nanoparticle-induced disruption of supported lipid 520
bilayers: Specific ion effect. J. Phys. Chem. B, 2014, 118, 13175-82. 521
24. Bramkamp, M.; Lopez, D., Exploring the existence of lipid rafts in bacteria. Microbiol. Mol. Biol. 522
Rev., 2015, 79, 81-100. 523
Page 23 of 35
ACS Paragon Plus Environment
Langmuir
123456789101112131415161718192021222324252627282930313233343536373839404142434445464748495051525354555657585960

24
25. Sezgin, E.; Levental, I.; Mayor, S.; Eggeling, C., The mystery of membrane organization: 524
Composition, regulation and roles of lipid rafts. Nat. Rev. Mol. Cell Biol., 2017, 18, 361-374. 525
26. Simons, K.; Ikonen, E., Functional rafts in cell membranes. Nature, 1997, 387, 569-572. 526
27. Lind, T. K.; Zielińska, P.; Wacklin, H. P.; Urbańczyk-Lipkowska, Z.; Cárdenas, M., Continuous flow 527
atomic force microscopy imaging reveals fluidity and time-dependent interactions of antimicrobial 528
dendrimer with model lipid membranes. ACS Nano, 2014, 8, 396-408. 529
28. Chelladurai, R.; Debnath, K.; Jana, N. R.; Basu, J. K., Nanoscale heterogeneities drive enhanced 530
binding and anomalous diffusion of nanoparticles in model biomembranes. Langmuir, 2018, 34, 1691-531
1699. 532
29. Mecke, A.; Lee, D.-K.; Ramamoorthy, A.; Orr, B. G.; Holl, M. M. B., Synthetic and natural 533
polycationic polymer nanoparticles interact selectively with fluid-phase domains of DMPC lipid bilayers. 534
Langmuir, 2005, 21, 8588-8590. 535
30. Erickson, B.; DiMaggio, S. C.; Mullen, D. G.; Kelly, C. V.; Leroueil, P. R.; Berry, S. A.; Baker, J. R., 536
Jr.; Orr, B. G.; Banaszak Holl, M. M., Interactions of poly(amidoamine) dendrimers with Survanta lung 537
surfactant: The importance of lipid domains. Langmuir, 2008, 24, 11003-8. 538
31. Chakraborty, A.; Mucci, N. J.; Tan, M. L.; Steckley, A.; Zhang, T.; Forrest, M. L.; Dhar, P., 539
Phospholipid composition modulates carbon nanodiamond-induced alterations in phospholipid domain 540
formation. Langmuir, 2015, 31, 5093-104. 541
32. Moghadam, B. Y.; Hou, W. C.; Corredor, C.; Westerhoff, P.; Posner, J. D., Role of nanoparticle 542
surface functionality in the disruption of model cell membranes. Langmuir, 2012, 28, 16318-26. 543
33. Mensch, A. C.; Tapia Hernandez, R.; Kuether, J. E.; Torelli, M. D.; Feng, Z. V.; Hamers, R. J.; 544
Pedersen, J. A., Natural organic matter concentration impacts the interaction of functionalized diamond 545
nanoparticles with model and actual bacterial membranes. Environ. Sci. Technol., 2017, 51, 11075-546
11084. 547
34. Martynenko, I. V.; Litvin, A. P.; Purcell-Milton, F.; Baranov, A. V.; Fedorov, A. V.; Gun'ko, Y. K., 548
Application of semiconductor quantum dots in bioimaging and biosensing. J. Mater. Chem. B, 2017, 5, 549
6701-6727. 550
35. Rühle, S.; Shalom, M.; Zaban, A., Quantum-dot-sensitized solar cells. ChemPhysChem, 2010, 11, 551
2290-304. 552
36. Hardman, R., A toxicologic review of quantum dots: Toxicity depends on physicochemical and 553
environmental factors. Environ. Health Perspect., 2006, 114, 165-172. 554
Page 24 of 35
ACS Paragon Plus Environment
Langmuir
123456789101112131415161718192021222324252627282930313233343536373839404142434445464748495051525354555657585960

25
37. King-Heiden, T. C.; Wiecinski, P. N.; Mangham, A. N.; Metz, K. M.; Nesbit, D.; Pedersen, J. A.; 555
Hamers, R. J.; Heideman, W.; Peterson, R. E., Quantum dot nanotoxicity assessment using the zebrafish 556
embryo. Environ. Sci. Technol., 2009, 43, 1605-1611. 557
38. Brown, D. A.; London, E., Functions of lipid rafts in biological membranes. Annu. Rev. Cell Dev. 558
Biol., 1998, 14, 111-136. 559
39. Malvern Instruments, Intensity-volume-number: What size is correct?; Technical Note MRK1357-560
01; Malvern Instruments: Malvern, United Kingdom; 2009. 561
40. Barton, P. G.; Gunstone, F. D., Hydrocarbon chain packing and molecular motion in phospholipid 562
bilayers formed from unsaturated lecithins. Synthesis and properties of sixteen positional isomers of 563
1,2-dioctadecenoyl-sn-glycero-3-phosphorylcholine. J. Biol. Chem., 1975, 250, 4470-4476. 564
41. Estep, T. N.; Mountcastle, D. B.; Barenholz, Y.; Biltonen, R. L.; Thompson, T. E., Thermal behavior 565
of synthetic sphingomyelin-cholesterol dispersions. Biochem., 1979, 18, 2112-2117. 566
42. Reviakine, I.; Johannsmann, D.; Richter, R. P., Hearing what you cannot see and visualizing what 567
you hear: Interpreting quartz crystal microbalance data from solvated interfaces. Anal. Chem., 2011, 83, 568
8838-48. 569
43. Sauerbrey, G., Verwendung von Schwingquarzen zur Wägung dünner Schichten und zur 570
Mikrowägung. Zeitschrift für Physik, 1959, 155, 206-222. 571
44. Richter, R.; Mukhopadhyay, A.; Brisson, A., Pathways of lipid vesicle deposition on solid surfaces: 572
A combined QCM-D and AFM study. Biophys. J., 2003, 85, 3035-3047. 573
45. Keller, C. A.; Kasemo, B., Surface specific kinetics of lipid vesicle adsorption measured with a 574
quartz crystal microbalance. Biophys. J., 1998, 75, 1397-1402. 575
46. Richter, R. P.; Brisson, A. R., Following the formation of supported lipid bilayers on mica: A study 576
combining AFM, QCM-D, and ellipsometry. Biophys. J., 2005, 88, 3422-33. 577
47. Sullan, R. M.; Li, J. K.; Zou, S., Direct correlation of structures and nanomechanical properties of 578
multicomponent lipid bilayers. Langmuir, 2009, 25, 7471-7. 579
48. Sullan, R. M.; Li, J. K.; Hao, C.; Walker, G. C.; Zou, S., Cholesterol-dependent nanomechanical 580
stability of phase-segregated multicomponent lipid bilayers. Biophys. J., 2010, 99, 507-16. 581
49. Hutter, J. L.; Bechhoefer, J., Calibration of atomic‐force microscope tips. Rev. Sci. Instrum., 1993, 582
64, 1868-1873. 583
50. Ohler, B., Practical advice on determination of cantilever spring constants; Veeco: 2007. 584
Page 25 of 35
ACS Paragon Plus Environment
Langmuir
123456789101112131415161718192021222324252627282930313233343536373839404142434445464748495051525354555657585960

26
51. Butt, H. J.; Jaschke, M., Calculation of thermal noise in atomic force microscopy. 585
Nanotechnology, 1995, 6, 1-7. 586
52. Zimmermann, R.; Küttner, D.; Renner, L.; Kaufmann, M.; Zitzmann, J.; Müller, M.; Werner, C., 587
Charging and structure of zwitterionic supported bilayer lipid membranes studied by streaming current 588
measurements, fluorescence microscopy, and attenuated total reflection Fourier transform infrared 589
spectroscopy. Biointerphases, 2009, 4, 1-6. 590
53. Kuech, T. R. Biological interactions and environmental transformations of nanomaterials. Ph. D. 591
Dissertation, University of Wisconsin-Madison, 2015. 592
54. Slotte, J. P., Biological functions of sphingomyelins. Prog. Lipid Res., 2013, 52, 424-37. 593
55. Quinn, P. J., Structure of sphingomyelin bilayers and complexes with cholesterol forming 594
membrane rafts. Langmuir, 2013, 29, 9447-56. 595
56. Cho, N. J.; Frank, C. W.; Kasemo, B.; Hook, F., Quartz crystal microbalance with dissipation 596
monitoring of supported lipid bilayers on various substrates. Nat Protoc, 2010, 5, 1096-106. 597
57. Attwood, S. J.; Choi, Y.; Leonenko, Z., Preparation of DOPC and DPPC supported planar lipid 598
bilayers for atomic force microscopy and atomic force spectroscopy. Int. J. Mol. Sci., 2013, 14, 3514-39. 599
58. Alessandrini, A.; Seeger, H. M.; Di Cerbo, A.; Caramaschi, T.; Facci, P., What do we really 600
measure in AFM punch-through experiments on supported lipid bilayers? Soft Matter, 2011, 7, 7054. 601
59. Rigby-Singleton, S. M.; Davies, M. C.; Harris, H.; O’Shea, P.; Allen, S., Visualizing the solubilization 602
of supported lipid bilayers by an amphiphilic peptide. Langmuir, 2006, 22, 6273-6279. 603
60. Mecke, A.; Majoros, I. J.; Patri, A. K.; James R. Baker, J.; Holl, M. M. B.; Orr, B. G., Lipid bilayer 604
disruption by polycationic polymers: The roles of size and chemical functional group. Langmuir, 2005, 605
21, 10348-10354. 606
61. Chiantia, S.; Kahya, N.; Ries, J.; Schwille, P., Effects of ceramide on liquid-ordered domains 607
investigated by simultaneous AFM and FCS. Biophys. J., 2006, 90, 4500-8. 608
62. Nezil, F. A.; Bloom, M., Combined influence of cholesterol and synthetic amphiphillic peptides 609
upon bilayer thickness in model membranes. Biophys. J., 1992, 61, 1176-1183. 610
63. Honerkamp-Smith, A. R.; Cicuta, P.; Collins, M. D.; Veatch, S. L.; den Nijs, M.; Schick, M.; Keller, S. 611
L., Line tensions, correlation lengths, and critical exponents in lipid membranes near critical points. 612
Biophys. J., 2008, 95, 236-46. 613
Page 26 of 35
ACS Paragon Plus Environment
Langmuir
123456789101112131415161718192021222324252627282930313233343536373839404142434445464748495051525354555657585960
27
64. Honerkamp-Smith, A. R.; Veatch, S. L.; Keller, S. L., An introduction to critical points for 614
biophysicists; observations of compositional heterogeneity in lipid membranes. Biochim. Biophys. Acta, 615
2009, 1788, 53-63. 616
65. Scheve, C. S.; Gonzales, P. A.; Momin, N.; Stachowiak, J. C., Steric pressure between membrane-617
bound proteins opposes lipid phase separation. J. Am. Chem. Soc., 2013, 135, 1185-8. 618
66. Imam, Z. I.; Kenyon, L. E.; Carrillo, A.; Espinoza, I.; Nagib, F.; Stachowiak, J. C., Steric pressure 619
among membrane-bound polymers opposes lipid phase separation. Langmuir, 2016, 32, 3774-84. 620
67. Gkeka, P.; Angelikopoulos, P.; Sarkisov, L.; Cournia, Z., Membrane partitioning of anionic, ligand-621
coated nanoparticles is accompanied by ligand snorkeling, local disordering, and cholesterol depletion. 622
PLoS Comput. Biol., 2014, 10, e1003917. 623
68. Van Lehn, R. C.; Alexander-Katz, A., Pathway for insertion of amphiphilic nanoparticles into 624
defect-free lipid bilayers from atomistic molecular dynamics simulations. Soft Matter, 2015, 11, 3165-75. 625
69. Smith, P. E. S.; Brender, J. R.; Dürr, U. H. N.; Xu, J.; Mullen, D. G.; Holl, M. M. B.; Ramamoorthy, 626
A., Solid state NMR reveals the hydrophobic-core location of poly(amidoamine) dendrimers in 627
biomembranes. J. Am. Chem. Soc., 2010, 132, 8087-8097. 628
70. Grennan, A. K., Lipid rafts in plants. Plant Physiol., 2007, 143, 1083-5. 629
71. Alvarez, F. J.; Douglas, L. M.; Konopka, J. B., Sterol-rich plasma membrane domains in fungi. 630
Eukaryot. Cell, 2007, 6, 755-63. 631
632
633
Page 27 of 35
ACS Paragon Plus Environment
Langmuir
123456789101112131415161718192021222324252627282930313233343536373839404142434445464748495051525354555657585960

28
Table 1. Summary of frequency shifts (Δƒ) and dissipation changes (ΔD) upon interaction between PDDA-QDs and the indicated supported lipid bilayer or silica surface as measured by quartz crystal microbalance with dissipation monitoring.a
Bilayer
Type
Δƒ20 min
(Hz)
ΔD20 min
(×10-6)
Δƒrinsed
(Hz)
ΔDrinsed
(×10-6)
DOPC
–22.8 ± 1.2 1.8 ± 0.1
–21.7 ± 1.8 3.3 ± 0.3
3.3 ± 0.2
0.5 ± 0.04
DOPC/SM/Chol
SiO2
–18.2 ± 0.8
–15.5 ± 0.4
1.3 ± 0.1
0.6 ± 0.01
–18.7 ± 2.4
–15.5 ± 0.3
a Attachment experiments were conducted in 0.010 M NaCl buffered to pH 7.4 with 0.010 M HEPES at 25 °C. All data are for the 3rd harmonic.
Data for the frequency and dissipation shifts are after 20 min of attachment or for the final equilibrated values following rinse with buffer.
Values are means ± standard deviations of at least triplicate experiments. Abbreviations: DOPC, 1,2-dioleoyl-sn-glycero-3-phosphocholine; SM,
sphingomyelin; Chol, cholesterol.
Page 28 of 35
ACS Paragon Plus Environment
Langmuir
123456789101112131415161718192021222324252627282930313233343536373839404142434445464748495051525354555657585960

29
Table 2. Line scan analysis of features observed by AFM.a
Bilayer Type Microdomain Heightb (nm) Particle Height within Microdomainsb (nm)
DOPC
1.1 ± 0.2
(N = 26)
8.6 ± 2.3
(N = 31)
DOPC/SM/Chol
1.8 ± 0.2
(N = 25)
7.7 ± 2.6
(N = 31)
a AFM experiments were conducted in 0.010 M NaCl buffered to pH 7.4 with 0.010 M HEPES at 24.5 °C. Values are averages and standard
deviations of N line scans. Abbreviations: DOPC, 1,2-dioleoyl-sn-glycero-3-phosphocholine; SM, sphingomyelin; Chol, cholesterol.
b Referenced to underlying bilayer.
Page 29 of 35
ACS Paragon Plus Environment
Langmuir
123456789101112131415161718192021222324252627282930313233343536373839404142434445464748495051525354555657585960

30
Figure 1. Representative changes in a, c) frequency and b, d) dissipation upon introduction of 1 nM
PDDA-QDs to a a,b) DOPC or c,d) 60/20/20 mol% DOPC/SM/Chol bilayer in 0.01 M NaCl buffered to pH
7.4 with 0.01 M HEPES. The bilayer has already been formed and interaction between the QDs and the
bilayer begins where noted. The dashed line represents the point where buffer without QDs reach the
sensor surface and some mass loss and decrease in dissipation is initially observed. All data are for the
3rd harmonic.
Page 30 of 35
ACS Paragon Plus Environment
Langmuir
123456789101112131415161718192021222324252627282930313233343536373839404142434445464748495051525354555657585960

31
Figure 2. Time-lapse topographical AFM images showing the impact of PDDA-QDs on a DOPC bilayer
immediately after injection of particles. a) DOPC bilayer prior to the introduction of PDDA-QDs, b-h)
subsequent images taken after interaction with the PDDA-QDs. All images were collected in 0.01 M NaCl
buffered to pH 7.4 with 0.01 M HEPES at 24.5 °C. Black arrows represent the scan direction for the given
image. Scale bars on all images are 2 µm. Z-height color scale corresponds to all images. The time on
each image indicates how much time the bilayer had been in contact with PDDA-QDs. Each image took
between 4-6 min to capture depending on optimization of scan parameters. A video of this sequence
can be found in the supporting information.
Page 31 of 35
ACS Paragon Plus Environment
Langmuir
123456789101112131415161718192021222324252627282930313233343536373839404142434445464748495051525354555657585960

32
Figure 3. a) Line profile across the microdomains observed after interaction of PDDA-QDs with the
DOPC bilayer from Figure 2a and b) PDDA polymer (molecular mass 200,000-350,000 Da, 0.0025 wt.
%) interaction with a DOPC bilayer with corresponding line scan. All images were collected in 0.01 M
NaCl buffered to pH 7.4 with 0.01 M HEPES at 24.5 °C. Line scans were taken across the dashed blue
line in each image. Scale bars on all images are 2 µm. Z-height color scale corresponds to both images.
Page 32 of 35
ACS Paragon Plus Environment
Langmuir
123456789101112131415161718192021222324252627282930313233343536373839404142434445464748495051525354555657585960

33
Figure 4. Time-lapse topographical AFM images showing the effect of PDDA-QDs on a bilayer initially
containing phase-segregated domains. Bilayer composition was 60/20/20 mol% DOPC/SM/Chol. a)
Bilayer prior to the introduction of PDDA-QDs, b-h) subsequent images taken after interaction with the
PDDA-QDs. All images were collected in 0.01 M NaCl buffered to pH 7.4 with 0.01 M HEPES at 24.5 °C.
Black arrows represent the scan direction for the given image. Scale bars on all images are 2 µm. The red
arrows are intended to direct the reader’s eye to the disappearance of the liquid-ordered domains. Z-
height color scale corresponds to all images. The time on each image indicates how much time the
bilayer had been in contact with PDDA-QDs. Each image took between 3-6 min to capture depending on
optimization of scan parameters. A video of this sequence can be found in the supporting information.
Page 33 of 35
ACS Paragon Plus Environment
Langmuir
123456789101112131415161718192021222324252627282930313233343536373839404142434445464748495051525354555657585960

34
Figure 5. Representative line traces observed for height across features observed in a 60/20/20 mol%
DOPC/SM/Chol bilayer (note: same bilayer as presented in Figure 4) a) prior to and b) after interaction
with 1 nM PDDA-QDs. The blue trace traces in both images show the height over a liquid-ordered
domain, whereas the red trace in b) shows the height across the microdomain structure induced by the
PDDA-QDs. All images were collected in 0.01 M NaCl buffered to pH 7.4 with 0.01 M HEPES at 24.5 °C.
Scale bars are 2 µm. Z-height color scale corresponds to both images.
Page 34 of 35
ACS Paragon Plus Environment
Langmuir
123456789101112131415161718192021222324252627282930313233343536373839404142434445464748495051525354555657585960

35
TOC Image
Page 35 of 35
ACS Paragon Plus Environment
Langmuir
123456789101112131415161718192021222324252627282930313233343536373839404142434445464748495051525354555657585960