The proteome and transcriptome analysis ofBacillus subtilis in response to salicylic acid

CdSe quantum dot internalization by Bacillus subtilis and Escherichia coli
Jeremiah A. Kloepfer”, Randall E. Mielke”, and Jay L. Nadeau”” ”Jet Propulsion Laboratory M / S 183-301,4800 Oak Grove Dr., Pasadena, CA 91 109
ABSTRACT
Biological labeling has been demonstrated with CdSe quantum dots in a variety of animal cells, but bacteria are harder to label because of their cell walls. We discuss the challenges of using minimally coated, bare CdSe quantum dots as luminescent internal labels for bacteria. These quantum dots were solubilized with mercaptoacetic acid and conjugated to adenine. Significant evidence for the internal staining of Bacillus subtilis (Gram positive) and Escherichia coli (Gram negative) using these structures is presented via steady-state emission, epifluorescence microscopy, transmission electron microscopy, and energy dispersive spectroscopy. In particular, the E. coli adenine auxotroph, and not the wild type, took up adenine coated quantum dots, and this only occurred in adenine deficient growth media. Labeling strength was enhanced by performing the incubation under room light. This process was examined with steady-state emission spectra and time-resolved luminescence profiles obtained from time-correlated-single-photon counting.
Keywords: Semiconductor, nanocrystal, quantum dot, CdSe, bacteria, labeling, emission lifetime, adenine
1. INTRODUCTION
Over the past decade much research has gone toward developing semiconductor nanocrystals, or “quantum dots,” as biological Quantum dot labeling kits can now be purchased commercially, and successful internal labeling has been demonstrated in a variety of eukaryotic cells. While quantum dots offer many advantages over molecules traditionally used for cell staining, several technical challenges must be met to use them in a biological setting. For instance, organisms that do not endocytose (such as bacteria) remain hard to stain with quantum dots. Here the labeling of the bacteria Bucillus subtilis (Gram positive) and Escherichia coli (Gram negative) is demonstrated using CdSe nanocrystals. The current state-of-the-art in quantum dot cell labeling and its deficiencies are considered with regard to moving the field beyond the realm of simple cell staining toward the construction of more advanced biological probes.
Semiconductor nanocrystals have several properties that make them useful as fluorescent biological labels. Due to the “quantum size effect,” the size of the bandgap varies inversely with the physical diameter of the nanocry~tal.~ Absorption of light occurs at a broad range of frequencies greater than the bandgap, such that a single photon source can excite the entire size distribution of quantum dots. Radiative relaxation of an excited quantum dot results in a narrow emission peak, which is distinguishable from the emission of other quantum dots if their sizes are sufficiently different. CdSe semiconductor quantum dots are typically chosen for their emission over the entire visible light region and narrow spectra (-35 nm Gaussian full-width-at-half maximum, FWHM). Quantum dots also have greater resistance to photobleaching than do organic dyes if sufficiently protected from the environment.6
Among the more problematic features of CdSe nanocrystals is their insolubility in water and sensitivity to surface chemistry.’ Synthesized CdSe quantum dots usually have an outer nonpolar layer, primarily tri-n- octylphosphine oxide (TOPO), which binds mainly with Cd and leaves surface Se sites partially exposed. Non-radiative pathways exist by which excited quantum dots may relax to the ground state, primarily through states coupled to the surface of the quantum dot and lying within the bandgap.* These states lower the quantum yield. Quantum dots with exposed surfaces are also more prone to quenching through electron and energy transfer with the surrounding molecules. Alternatively, emission photoenhancement has also been recorded, possibly due to a stabilizing effect of water coordinated with the s u r f a ~ e . ~ * ’ ~ Finally, exposed CdSe surfaces will eventually undergo surface photooxidation,
*[email protected]; phone 1 818 354-0522; fax 1 818 393-4445; jpl.nasa.gov.

whereby O2 absorbs to the surface and after some time SeOz or a mixed CdSe-oxide desorbs." This process appears to be accelerated under UV and visible light and shrinks the size of the nanocrystal, causing a corresponding shift of the emission spectrum to the UV.
The current technique for reducing surface sensitivity and preventing oxidation is to coat the quantum dot with a higher bandgap semiconductor, such as ZnS12*13, andor polymers and protein^.'^-'^ Both is commonly done since ZnS- capped CdSe alone will still undergo quenching and possible surface oxidation. The additional polymer layers can also improve water solubility by attaching polar molecules and proteins. While these coating techniques are useful for creating biological labels, some reduce the possibility of creating more advanced sensors based on electron transfer and fluorescence resonance energy transfer (FRET). As well, they significantly increase the physical size of the nanocrystal which would limit their ability to cross some cell walls or otherwise be internalized by cells.
The ideal quantum dot sensor would retain its original size and only fluorescence in the presence of the target cell or molecule. A possible reaction mechanism could be described as follows. Outside the cell electron or energy transfer with molecules (Q) conjugated to the excited quantum dot (CdSe*) would quench the emission:
Once in contact with the target cell, the quencher would be metabolically removed and the emission turned on:
(CdSe)Q + cell - (CdSe)cell + hvacirarion - (CdSe*)cell -+ (CdSe)cell + hvemission
This type of quantum dot device could be used for detecting microorganisms such as fungi and bacteria in situ, because the background labeling would be very weak and hence washing of the sample would not be necessary in order to achieve good signal to noise.
Bare CdSe quantum dots can be water solubilized using thiol-containing compounds such as mercaptoacetic acid (MAA).73'83'9 Under room light (CdSe)MAA is only stable for a few hours, during which CdSe photocatalyzes adjacent MAA to form a di-sulfide bond, causing the quantum dots to precipitate and ~ x i d i z e . ~ MAA also quenches the CdSe luminescence. MAA does however provide a framework upon which other molecules can be conjugated to the quantum dot. Such molecules might enhance the quantum dot solubility and provide stability under room light, as well as provide an attractive target for a micr~organism.~ This paper details quantum dot sensors based on MAA-solubilized CdSe. The effects of MAA quenching on the CdSe emission is shown using both steady-state and transient emission measurements. Adenine (6-aminopurine or 6AP) is conjugated to the (CdSe)MAA and labeling of B. subtilis and E. coli with this structure is demonstrated. The roles of luminescence photoenhancement and surface oxidation and how they might be used improve the quality of labeling are also considered.
2. METHODOLOGY
Experimental details have been published elsewhere - the basic method is as f01lows.~
2.1 Synthesis and handling of CdSe structures CdSe semiconductor nanocrystals were synthesized using a standard procedure whereby Cd and Se precursors are injected into molten tri-n-octylphosphine oxide (TOPO, tech grade 90%) at temperatures ranging from 250 to 350"C.20 Cadmium acetate was substituted for dimethylcadmium as the Cd precursor. Large diameter nanocrystals are produced with higher injection temperatures and longer bake times. The resulting TOPROPO passivated nanocrystals, referred to here as (CdSe)TOPO, are washed with methanol and stored in a variety of inorganic solvents in the dark under air. The approximate starting (CdSe)TOPO concentration was 10 pM, estimated from the absorption spectrum and the extinction coefficients provided by Schmelz et aL2' Typical quantum dot diameters used in this study ranged from 3.5 to 5 nm.
CdSe were solubilized in aqueous solutions using mercaptoacetic acid (MAA), and are referred to as (CdSe)MAA. MAA contains a thiol group (S-H) which binds to Cd surface atoms and displaces the TOPROPO coat. The other end of MAA has a carboxylic acid group which provides water solubility and offers a potential conjugation site for linking to other molecules. (CdSe)MAA were stored in the dark where they were stable for several months -
exposure to room light caused them to precipitate over several hours. Molecules with free primary amines, such as adenine (6AP), were coupled to (CdSe)MAA using the activator 1 -ethyl-3-(3-dimethylaminopropyl) carbodiimide hydrochloride (EDC) and formed an amide bond link.22 The proteins wheat germ agglutinin (WGA) and streptavidin were also conjugated to the quantum dots to demonstrate external cell labeling versus internal labeling with (CdSe)6AP.4
2.2 Steady-state and transient spectroscopy Absorbance spectra were recorded with a Hewlett-Packard 8453 or Cary 50 UV-visible spectrophotometer. Steady- state emission measurements were collected with a Hitachi F-4500 fluorescence spectrometer or an Ocean Optics S2000 spectrometer. A Gemini EM plate reader in epifluorescence mode (minimizes scattering) was used to collect the emission of bacteria samples. Spectra were normalized to bacterial density by matching absorbance at 600 nm and emission at a wavelength significantly distant from the photoluminescence of the quantum dots being used.
Transient emission measurements were made using the time-correlated-single-photon counting (TCSPC) technique. Experimental details will be published in a forthcoming paper - the basic setup is described as follows. Stirred samples in a lcm cuvette were excited at 395 nm using the frequency doubled output of a Tisapphire regenerative amplifier (Coherent RegA 9050) operating at 200 kHz. Emission was collected at an angle perpendicular to the excitation beam and focused into a 118 m double spectrograph (CVI CMSP112, subtractive mode) for wavelength selection. The selected photons were then collected with a Hamamatsu RU3809 micro-channel plate detector and the amplified signal was recorded with a Becker and Hick1 SPC-630 photon countin board. Single exponential lifetimes as fast as 12.4 ps (pinacyanol chloride in ethanol) were measured with this system. 23
2.3 Bacterial labeling and microscopy Bacillus subtilis ATCC 9372, Escherichia coli ATCC 25922, and Escherichia coli adenine auxotroph ATCC 23804 were purchased from American Type Culture Collection (ATCC). Bacteria were grown in Luria-Bertani (LB) media and incubated at 37 “C for E. coli and 30 “C for B. subtilis. Bacteria were labeled with CdSe by preparing a solution of approximately 25% quantum dot conjugates, 10% bacteria, and 65% growth media and incubated at the appropriate temperature. For B. subtilis, this growth media for the labeling step was LB - for E. coli, the labeling occurred in a “minimal medium” consisting of 0.2% (wt/v) ammonium sulfate, 1.4% dipotassium phosphate, 0.6% monopotassium phosphate, 0.1% sodium citrate, 0.02% magnesium sulfate, and 0.5% glucose in water. Growth and labeling was followed over 15 min to 5 hr.
Light microscopy was performed with a Nikon Eclipse E600 upright microscope with a Nikon PlanFluor lOOx lens (N.A. = 1.30) and a modified UV-DAPI filter cube set (excitation = 330-380 nm, dichroic = 400 nm, emission = 435 LP). Bacteria were examined flame-fixed to a microscope slide or wet under a coverslip. Both transmission electron microscopy (TEM) and energy dispersive X-ray spectroscopy (EDS) were performed on unstained bacteria on whole mounts and thin sections. Instrument and measurement details can be found here:
3. DATA
3.1 Quenching of quantum dots in water The steady-state and transient emission spectra of relevant quantum dot systems for green fluorescing CdSe are shown in fig. 1A and 1B. CdSe in nonpolar solvents, such as hexane, are coated with TOPO, whereas as those in water have been solubilized with MAA which displaces the TOPO shell. Also shown is the emission spectrum of photoenhanced quantum dots in water. (CdSe)TOPO yields a narrow emission peak centered at 550 nm with a FWHM of 35 nm (not shown). The quantum yield was estimated to be 3%, determined relative to the fluorescein dianion. Once solubilized with MAA, the emission is almost completely quenched. The quantum yield of these nanocrystals is far below 0.1%. Prolonged exposure to room light or a UV lamp causes the quantum dots to precipitate over the course of an hour and results in a dramatic enhancement of emission. The spectra shown in fig. 1A is of the same sample before ((CdSe)MAA) and after ((CdSe)photoenhanced) 150 min under a UV lamp (Mineralight UVGL-25, long wavelength 365 nm). The peak emission wavelength shifted from 550 to 545 nm in that time. There are only slight changes to the initial (CdSe)MAA spectrum when 6AP is conjugated to the quantum dots in the dark.
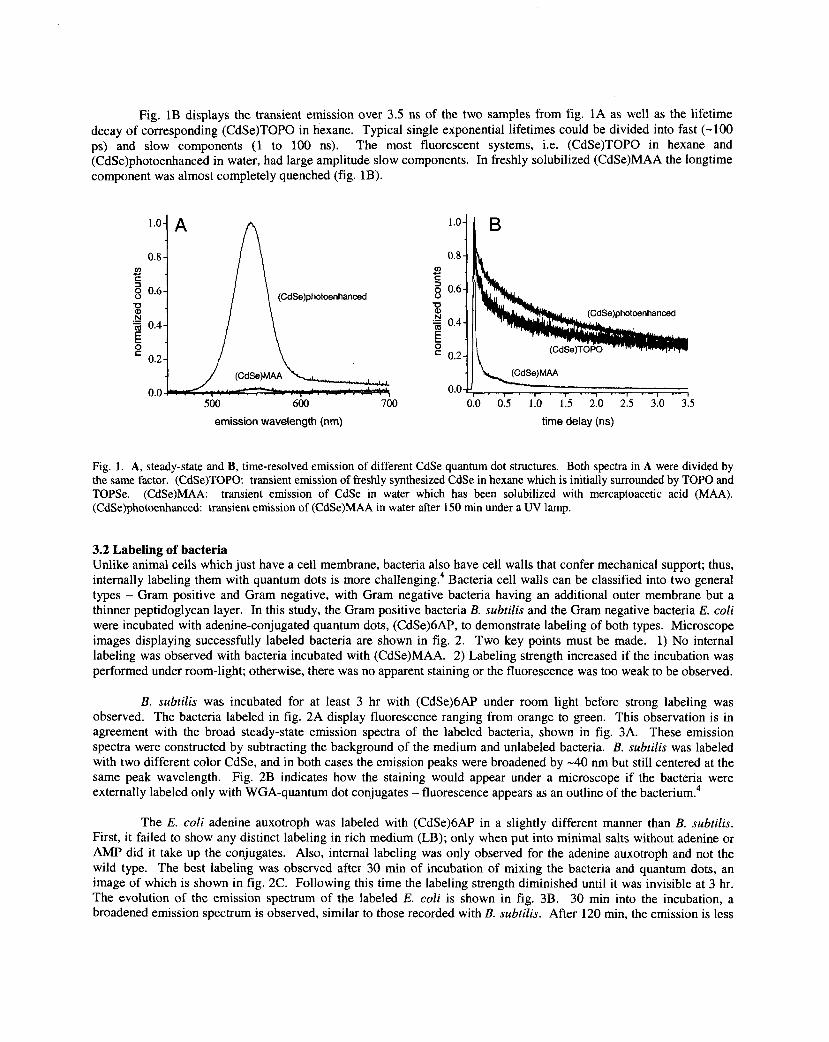
Fig. 1B displays the transient emission over 3.5 ns of the two samples from fig. 1A as well as the lifetime decay of corresponding (CdSe)TOPO in hexane. Typical single exponential lifetimes could be divided into fast (-100 ps) and slow components (1 to 100 ns). The most fluorescent systems, i.e. (CdSe)TOPO in hexane and (CdSe)photoenhanced in water, had large amplitude slow components. In freshly solubilized (CdSe)MAA the longtime component was almost completely quenched (fig. 1B).
(CdSe)photoenhanced
500 600 700 0.0 0.5 1.0 1.5 2.0 2.5 3.0 3.5 emission wavelength (nm) time delay (ns)
Fig. 1. A, steady-state and B, time-resolved emission of different CdSe quantum dot structures. Both spectra in A were divided by the same factor. (CdSe)TOPO: transient emission of freshly synthesized CdSe in hexane which is initially surrounded by TOP0 and TOPSe. transient emission of CdSe in water which has been solubilized with mercaptoacetic acid (MAA). (CdSe)photoenhanced transient emission of (CdSe)MAA in water after 150 min under a UV lamp.
(CdSe)MAA:
3.2 Labeling of bacteria Unlike animal cells which just have a cell membrane, bacteria also have cell walls that confer mechanical support; thus, internally labeling them with quantum dots is more ~hallenging.~ Bacteria cell walls can be classified into two general types - Gram positive and Gram negative, with Gram negative bacteria having an additional outer membrane but a thinner peptidoglycan layer. In this study, the Gram positive bacteria B. subtilis and the Gram negative bacteria E. coli were incubated with adenine-conjugated quantum dots, (CdSe)6AP, to demonstrate labeling of both types. Microscope images displaying successfully labeled bacteria are shown in fig. 2. Two key points must be made. 1) No internal labeling was observed with bacteria incubated with (CdSe)MAA. 2) Labeling strength increased if the incubation was performed under room-light; otherwise, there was no apparent staining or the fluorescence was too weak to be observed.
B. subtilis was incubated for at least 3 hr with (CdSe)6AP under room light before strong labeling was observed. The bacteria labeled in fig. 2A display fluorescence ranging from orange to green. This observation is in agreement with the broad steady-state emission spectra of the labeled bacteria, shown in fig. 3A. These emission spectra were constructed by subtracting the background of the medium and unlabeled bacteria. B. subtilis was labeled with two different color CdSe, and in both cases the emission peaks were broadened by -40 nm but still centered at the same peak wavelength. Fig. 2B indicates how the staining would appear under a microscope if the bacteria were externally labeled only with WGA-quantum dot conjugates - fluorescence appears as an outline of the bacter i~m.~
The E. coli adenine auxotroph was labeled with (CdSe)6AP in a slightly different manner than B. subtilis. First, it failed to show any distinct labeling in rich medium (LB); only when put into minimal salts without adenine or AMP did it take up the conjugates. Also, internal labeling was only observed for the adenine auxotroph and not the wild type. The best labeling was observed after 30 min of incubation of mixing the bacteria and quantum dots, an image of which is shown in fig. 2C. Following this time the labeling strength diminished until it was invisible at 3 hr. The evolution of the emission spectrum of the labeled E. coli is shown in fig. 3B. 30 min into the incubation, a broadened emission spectrum is observed, similar to those recorded with B. subtilis. After 120 min, the emission is less

distinct and unevenly broadened, possibly indicating decomposition of the quantum dots. For comparison purposes, external labeling is shown in fig. 2D.
Fig. 2. Internal versus external labeling of bacteria under room light. Scale bar = 10 pm. A, B. subtilis , 3 hr incubation with adenine-conjugated QDs with yellow emission peak (590 nm). B, The same QDs conjugated to wheat germ agglutinin (WGA) and incubated with B. subtilis for 30 min. The lack of intemalization of this conjugate, and the retention of the original QD emission spectrum without broadening, are apparent in contrast with panel A. C, E. coli adenine auxotroph, 30 min incubation with green- emitting (560 nm peak) QDs conjugated to adenine. The broadening of the spectrum is most evident in the form of red punctae that typically occur on the ends of cells (arrow). D, E. coli externally labeled by biotinylation and incubation with streptavidin-green QD for contrast with panel C.
450 500 550 600 650 700 Emission (nm) Emission (nm)
Fig. 3. Emission spectra from (CdSe)6AP labeled bacteria. Background emission from culture medium and unlabeled bacteria has been subtracted. A, B. subtilis incubated with two colors of (CdSe)6AP for 5 hr. Green (CdSe)6AP alone show an emission peak of 550 nm with FWHM = 40 nm (solid line); the corresponding bacteria labeled spectrum (solid circles) has the same peak but a broader FWHM of 80 nm. The situation is similar for the yellow CdSe (emission 570 nm, solid line) and the yellow-labeled B. subtilis (filled squares). B, E. coli adenine auxotroph incubated with yellow (CdSe)6AP (solid line) for 30 min (solid circles) and 2 hr (squares).
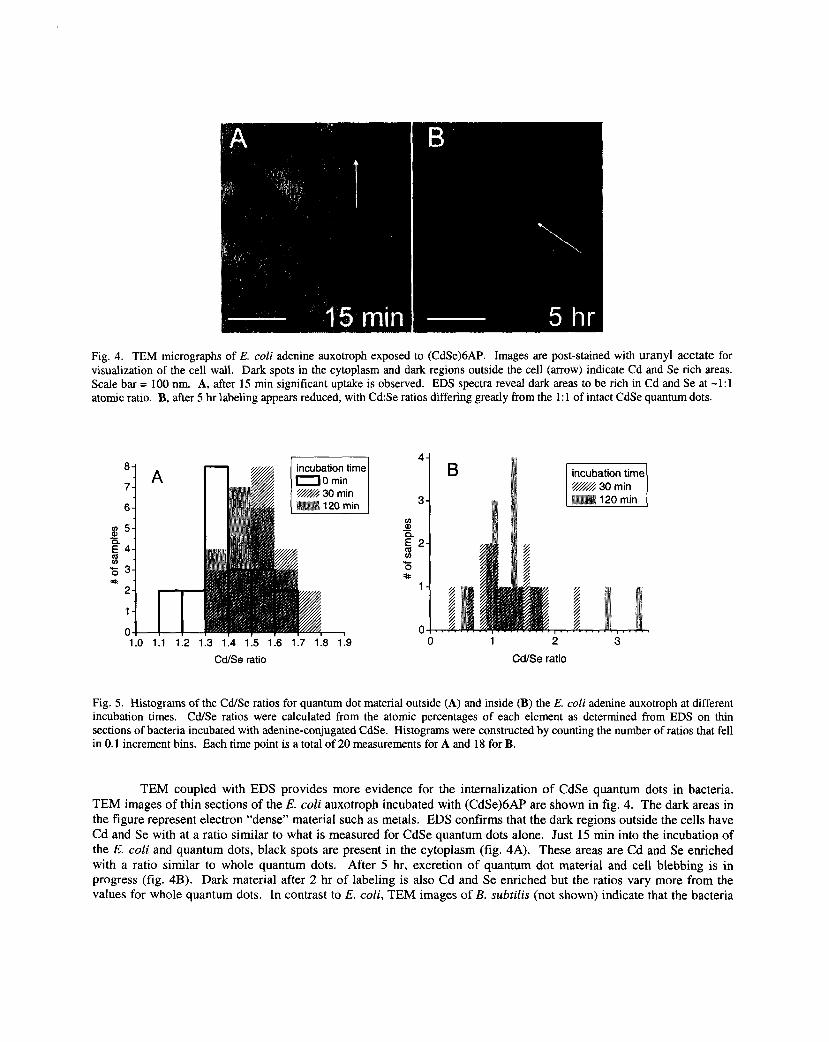
Fig. 4. TEM micrographs of E. coli adenine auxotroph exposed to (CdSe)6AP. Images are post-stained with uranyl acetate for visualization of the cell wall. Dark spots in the cytoplasm and dark regions outside the cell (arrow) indicate Cd and Se rich areas. Scale bar = 100 nm. A, after 15 min significant uptake is observed. EDS spectra reveal dark areas to be rich in Cd and Se at -1:l atomic ratio. B, after 5 hr labeling appears reduced, with Cd:Se ratios differing greatly from the 1 : 1 of intact CdSe quantum dots.
A
1
B
1.0 1:i 1:2 1.3 114 115 1:s 1:7 1.8 1:9 0 1 2 3 - .
Cd/Se ratio Cd/Se ratio
Fig. 5 . Histograms of the Cd/Se ratios for quantum dot material outside (A) and inside (B) the E. coli adenine auxotroph at different incubation times. Cd/Se ratios were calculated from the atomic percentages of each element as determined from EDS on thin sections of bacteria incubated with adenine-conjugated CdSe. Histograms were constructed by counting the number of ratios that fell in 0.1 increment bins. Each time point is a total of 20 measurements for A and 18 for B.
TEM coupled with EDS provides more evidence for the internalization of CdSe quantum dots in bacteria. TEM images of thin sections of the E. coli auxotroph incubated with (CdSe)6AP are shown in fig. 4. The dark areas in the figure represent electron “dense” material such as metals. EDS confirms that the dark regions outside the cells have Cd and Se with at a ratio similar to what is measured for CdSe quantum dots alone. Just 15 min into the incubation of the E. coli and quantum dots, black spots are present in the cytoplasm (fig. 4A). These areas are Cd and Se enriched with a ratio similar to whole quantum dots. After 5 hr, excretion of quantum dot material and cell blebbing is in progress (fig. 4B). Dark material after 2 hr of labeling is also Cd and Se enriched but the ratios vary more from the values for whole quantum dots. In contrast to E. coli, TEM images of B. subtilis (not shown) indicate that the bacteria

do not import significant quantities of CdSe until 3-5 hr into incubation, and this quantum dot material is not seen to be excreted or blebbed from the cells. EDS confirms that the material has a Cd/Se ratio similar to whole quantum dots.
A graphical representation following the Cd to Se quantities of dark material outside and inside the E. coli adenine auxotroph over time is shown in fig. 5. Quantum dot material outside the cell shows a narrow distribution of Cd/Se ratios (fig. 5A) that slowly shift to higher Cd quantities over a 2 hr incubation period. The higher average Cd than Se amount is likely due to surface oxidation of the nanocrystals, which results in loss of Se as SeOz desorbs from the surface." CdSe nanocrystals not oxidized should have a 1:l Cd/Se ratio. EDS measurements inside the cell result in CdSe ratios that are relatively close to those of the external quantum dots (fig. 5B), though the distributions are broader with some areas indicating Se or Cd enrichment, especially in the 2 hr sample set.
4. RESULTS
The prospects for using MAA coated CdSe as luminescent cell labels are tempered by the strong emission quenching that occurs in this system. This is indicated by both the steady-state emission spectra and transient emission lifetimes of the MAA solubilized quantum dots (fig. 1A and 1B). When adenine (6AP) is conjugated to the free carboxylic acid groups of (CdSe)MAA, the quantum dots remain quenched (not shown). If cells could remove the MAA coat and enhance the emission, this could prove a convenient sensor following the reaction mechanism presented in the introduction. Unfortunately, no internal labeling of B. subtilis or E. coli was observed with (CdSe)MAA and only observed with (CdSe)6AP, and in the later case the emission remained relatively quenched.
While constructing a sensor based on electron or energy transfer does not appear feasible with this system, the photoinduced increases in CdSe quantum yield under visible/UV light greatly enhances the labeling strength. The exact mechanism for this emission enhancement is still unknown and is a current focus of quantum dot re~earch.~.~~' ' It is speculated that water stabilizes quantum dot surface states, increasing the quantum Coinciding with this enhancement is the physical oxidation of CdSe while exposed to air to form SeOz and the eventual destruction of the outer CdSe shells. Presumably, removal of the SeOz exposes new surface defects and lowers the quantum yield. We generally observe a large increase in quantum yield that occurs concurrently with the blue-shifting of the emission spectrum of the nanocrystals under room light. It may be possible that the oxidation of the surface initially causes some emission enhancement. While surface oxidation occurs in the presence of bacteria, presumably enough of the conjugated MAA-6AP remains associated with the CdSe to still achieve cell labeling.
Internal labeling of B. subtilis and the E. coli adenine auxotroph with CdSe indicates that it is possible to transport quantum dots, or at least quantum dot material, across both Gram positive and Gram negative cell walls; however, there is some skepticism over how this process occurs since bacterial pore sizes are generally small (52 nm).24 It is possible that quantum dots are broken up outside the cells and the fragments pulled in with the adenine, although at least some fragments should be close to whole CdSe - the bacteria emission spectra support a large distribution of quantum dot sizes (up to 5 nm in diameter). The EDS results also suggest that initially internalized material in both cases could be whole quantum dots, since the Cd:Se ratio is close to the range of bare CdSe quantum dots alone.
The rates at which the two types of bacteria are labeled indicate that they may process quantum dots differently. Whether this is a function of the cell wall structure, the bacteria type, or other factors remains to be determined. It is also intriguing that only the E. coli adenine auxotroph and not the wild type, or natural form, is labeled. The auxotroph was chosen because of its inability to synthesize adenine, with the assumption that this might increase the need for obtaining adenine from the environment. The observation that this bacteria takes up (CdSe)6AP only under minimal media conditions (little to no free adenine present) indicates that it is possible to design metabolism-specific labels with quantum dots.
5. CONCLUSIONS
In summary, Gram positive bacteria, B. subtilis, and Gram negative bacteria, E. coli, were labeled with CdSe quantum dots solubilized with mercaptoacetic acid (MAA) and conjugated to adenine (6AP). This was determined using steady- state emission, epifluorescence microscopy, TEM, and EDS. MAA quenches the CdSe emission even when conjugated

to 6AP. No labeling was observed with unconjugated (CdSe)MAA. Labeling strength was improved by performing the incubation under room light, which is known to enhance the luminescence of colloidal CdSe. The internalization methods of the bacteria appear different. B. subtilis is labeled slowly over the course of 3-5 hr, whereas the E. coli adenine auxotroph is labeled within 30 min. No labeling of wild type E. coli was observed, and the auxotroph only internalized quantum dots in minimal media conditions, successfully demonstrating metabolism-specific labeling. Much work remains before bacteria-quantum dot interactions are completely understood. We continue to investigate the potential of CdSe quantum dots as advanced microorganism labels.
ACKNOWLEDGEMENTS
This work was supported by the National Aeronautics and Space Administration under Contract Agreement No. 1238316 issued through the NAI Office. We thank Micheal Wong for the CdSe quantum dot synthesis method and Kenneth Nealson for useful discussions on bacterial labeling with quantum dots.
REFERENCES
1.
2.
3.
4.
5.
6.
7.
8.
9.
Han, M., Gao, X., Su, J. Z. & Nie, S., "Quantum-dot-tagged microbeads for multiplexed optical coding of biomolecules", Nut Biotechnol, 19,63 1-5,2001. Wu, X. et al., "Immunofluorescent labeling of cancer marker Her2 and other cellular targets with semiconductor quantum dots", Nut Biotechnol, 21,41-6,2003. Jaiswal, J. K., Mattoussi, H., Mauro, J. M. & Simon, S. M., "Long-term multiple color imaging of live cells using quantum dot bioconjugates", Nut Biotechnol, 21,47-5 1,2003. Kloepfer, J. A. et al., "Quantum Dots as Strain- and Metabolism-Specific Microbiological Labels", AppZ Environ Microbiol, 69,4205-4213,2003. Murray, C. B., Norris, D. J. & Bawendi, M. G., "Synthesis and Characterization of Nearly Monodisperse CdE (E = S, Se, Te) Semiconductor Nanocrystallites", Journal of the American Chemical Society, 115,8706-87 15,1993. van Sark, W. et al., "Photooxidation and photobleaching of single CdSe/ZnS quantum dots probed by room- temperature time-resolved spectroscopy", Journal of Physical Chemistry B, 105, 828 1-8284, 2001. Aldana, J., Wang, Y. A. & Peng, X. G., "Photochemical instability of CdSe nanocrystals coated by hydrophilic thiols", Journal of the American Chemical Society, 123, 8844-8850,2001. Bawendi, M. G., Carroll, P. J., Wilson, W. L. & Brus, L. E., "Luminescence Properties of Cdse Quantum Crystallites - Resonance between Interior and Surface Localized States", Journal of Chemical Physics, 96,946-954, 1992. Jones, M., Nedeljkovic, J., Ellingson, R. J . , Nozik, A. J. & Rumbles, G., "Photoenhancement of luminescence in colloidal CdSe quantum dot solutions", Journal of Physical Chemistry B, 107, 11346-1 1352,2003.
10. Cordero, S. R., Carson, P. J., Estabrook, R. A., Strouse, G. F. & Buratto, S. K., "Photo-activated luminescence of CdSe quantum dot monolayers", Journal of Physical Chemistry B, 104, 12137-12142, 2000.
11. Katari, J. E. B., Colvin, V. L. & Alivisatos, A. P., "X-Ray Photoelectron-Spectroscopy of Cdse Nanocrystals with Applications to Studies of the Nanocrystal Surface", Journal of Physical Chemistry, 98,4109-41 17, 1994.
12. Dabbousi, B. 0. et al., "(CdSe)ZnS core-shell quantum dots: Synthesis and characterization of a size series of highly luminescent nanocrystallites", Journal of Physical Chemistry B, 101,9463-9475, 1997.
13. Hines, M. A. & GnyotSionnest, P., "Synthesis and characterization of strongly luminescing ZnS- Capped CdSe nanocrystals", Journal of Physical Chemistry, 100,468-47 1, 1996.
14. Quantum Dot Corporation, Qdot Streptavidin Conjugates User Manual, (www.adots.com). 15. Goldman, E. R. et al., "Avidin: A natural bridge for quantum dot-antibody conjugates", Journal of the American
16. Mattoussi, H. et al., "Bioconjugation of highly luminescent colloidal CdSe-ZnS quantum dots with an engineered
17. Mattoussi, H. et al., "Self-assembly of CdSe-ZnS quantum dot bioconjugates using an engineered recombinant
18. Chan, W. C . & Nie, S., "Quantum dot bioconjugates for ultrasensitive nonisotopic detection", Science, 281,2016-
e Chemical Society, 124,6378-6382,2002.
two-domain recombinant protein", Physica Status Solidi B-Basic Research, 224,277-283,2001.
protein", Journal of the American Chemical Society, 122, 12142-12150,2000.
8., 1998.
19. Wang, Y. A., Li, J. J., Chen, H. Y. & Peng, X. G., "Stabilization of inorganic nanocrystals by organic dendrons",
20. Wong, M. S. & Stucky, G. D., "Facile synthesis of nanocrystalline semiconductor quantum dots", Abstracts of
21. Schmelz, O., Mews, A., Basche, T., Herrmann, A. & Mullen, K., "Supramolecular complexes from CdSe
22. Hermanson, G. T., Bioconjugate Techniques, Academic Press, San Diego, 1996. 23. Oneil, M., Marohn, J. & McLendon, G., "Dynamics of Electron-Hole Pair Recombination in Semiconductor
24. Wang, H. W. et al., "Ring-like pore structures of SecA: implication for bacterial protein-conducting channels",
Journal of the American Chemical Society, 124,2293-2298,2002.
Papers of the American Chemical Society, 221, U572-U572,20011
nanocrystals and organic fluorophors", Langmuir, 17,2861-2865,2001.
Clusters", Journal of Physical Chemistry, 94,4356-4363, 1990.
Proc Natl Acad Sci U S A , 100,4221-6,2003.
Copyright © 2022 FDOKUMEN