Etchable plasmonic nanoparticle probes to image and quantify cellular internalization

ARTICLESPUBLISHED ONLINE: 8 JUNE 2014 | DOI: 10.1038/NMAT3982
Etchable plasmonic nanoparticle probes to imageand quantify cellular internalizationGary B. Braun1,2*, Tomas Friman1,2, Hong-Bo Pang1, Alessia Pallaoro2, Tatiana Hurtado de Mendoza1,Anne-Mari A. Willmore3, Venkata Ramana Kotamraju1,2, Aman P. Mann1, Zhi-Gang She1,Kazuki N. Sugahara1, Norbert O. Reich2, Tambet Teesalu1,2,3 and Erkki Ruoslahti1,2*
There is considerable interest in using nanoparticles as labels or to deliver drugs and other bioactive compounds to cellsin vitro and in vivo. Fluorescent imaging, commonly used to study internalization and subcellular localization of nanoparticles,does not allow unequivocal distinction between cell surface-bound and internalized particles, as there is no methodology toturn particles ‘o�’. We have developed a simple technique to rapidly remove silver nanoparticles outside living cells, leavingonly the internalized pool for imaging or quantification. The silver nanoparticle (AgNP) etching is based on the sensitivityof Ag to a hexacyanoferrate–thiosulphate redox-based destain solution. In demonstration of the technique we present aclass of multicoloured plasmonic nanoprobes comprising dye-labelled AgNPs that are exceptionally bright and photostable,carry peptides as model targeting ligands, can be etched rapidly and with minimal toxicity in mice, and that show tumouruptake in vivo.
Designing nanoparticles for therapeutic, diagnostic andtheranostic applications is of pivotal importance inadvancing nanomedicine1,2. Nanoparticles (NPs) enter
cultured cells at rates determined by their surface coating, sizeand shape3. Many of the clinically relevant nanoparticle targetsare intracellular and NPs are typically coated with an effectorlayer to engage cellular receptors and trigger internalization.Cell culture assays are used to gauge the particle binding andinternalization by fluorescent, chemical, radioactive or enzymatictracers. Distinguishing internalized NPs from cell surface-boundparticles is of pivotal importance for assessing the efficacy of NPsas targeting platforms. Disrupting ligand–receptor interactionstypically involves exposing cells to low pH or using a competitiveligand, whichmay have unwanted effects on cell physiology and canbe challenging with high-avidity NPs. Dye-labelled polymers, ironoxide, quantum dots, and gold NPs have been extensively studiedas multivalent tracers, however, their removal requires harshconditions which limit utility (for example, dimethylformamide,strong acid, or iodine4–6).
Plasmonic nanomaterials made from gold (Au) and silver(Ag) are increasingly used for biological applications, particularlymicroscopy, stemming from their size and shape-dependent opticalproperties. Surface plasmons create a localized electromagneticfield, the so-called antenna effect, that leads to surface-enhancedRaman scattering (SERS) and metal-enhanced fluorescence-trackable signals that originate from molecules positioned ator near the surface, or within nanojunctions7–11. Of these twometals, Ag generally yields five- to tenfold more intense signalsthan Au (ref. 12), which on the other hand is more commonlystudied owing to its chemical nobility, ease of synthesis, anddistance-dependent quenching of dyes13. Plasmon coupling can
increase both the absorption and radiative rate of dyes, whilelimiting photo-oxidation, dye self-quenching and excited-statesaturation8. The greatest enhancement is expected fromAgNPs thatare ∼40–100 nm in diameter8, a range suitable for cell targeting;however, fluorescent Ag nanoprobes that bind receptors have notyet been developed.
Here we present a nanoparticle platform that leverages theplasmonic properties of Ag to enable single-particle tracking inboth dark-field and fluorescence modalities, and is paired with amild, non-permeable solution that affords the distinction betweenintra- and extracellularly located AgNPs through a rapid, non-toxic etching step. Our nanoparticle probe comprises a fluorescentdye-labelled polyethylene glycol (PEG) and NeutrAvidin (NA)coating around a fluorescence-enhancing AgNP core (Ag–NA).The NA serves as attachment sites for biotinylated targetingpeptides, as drawn schematically in Fig. 1a. We enlisted C-end rule (CendR) peptides for proof-of-principle delivery intocells. CendR peptides trigger neuropilin-1 (NRP-1)-dependent celland tissue penetration when exposed at the C-terminus of apolypeptide chain2,14. The Ag etching solution consists of a mixtureof two chemical components (Fig. 1b) commonly used for de-staining silver-stained protein bands in polyacrylamide gels or inphotographic emulsions, retasked here for etching AgNPs in abiological setting. The first etching component is a redox agenthexacyanoferrate (HCF), Fe(III)(CN)63−, that oxidizes Ag0 to Ag+,in combination with the second component thiosulphate (TS),S2O3
2−, that ligates and clears away the newly formed Ag+ ions,thereby dissolving the core (Supplementary Figs 1 and 2; refs 15,16).Importantly, HCF and TS are charged and do not readilydiffuse through cell membranes17,18, thus protecting internalizedAgNPs from being etched (Fig. 1). Labelled components released
1Cancer Research Center, Sanford-Burnham Medical Research Institute, La Jolla, California 92037, USA, 2Center for Nanomedicine and Department ofChemistry and Biochemistry, University of California, Santa Barbara, California 93106, USA, 3Laboratory of Cancer Biology, Institute of Biomedicine, Centreof Excellence for Translational Medicine, University of Tartu, Tartu 50411, Estonia. *e-mail: [email protected]; [email protected]
NATUREMATERIALS | ADVANCE ONLINE PUBLICATION | www.nature.com/naturematerials 1© 2014 Macmillan Publishers Limited. All rights reserved.

ARTICLES NATUREMATERIALS DOI: 10.1038/NMAT3982
b
a
c
Targeting peptideFluorescent dye
NA
Ag
Local-field enhancement
Cell membrane
Etch
Etch
EtchPre-etch
Dissolved
Ag internalizedand protected
Ag
Ag+
Ag(S2O3)23−
e−Fe(III)
Fe(II)
−SS
O−
O
O
Ag0 + Fe(III)(CN)63−—> Ag+ + Fe(II)(CN)6
4−
Ag+ + 2S2O32− —> Ag(S2O3)2
3−
Figure 1 | Dye-labelled, peptide-functionalized silver nanoparticles (AgNPs) that are etched for cell internalization and tracking. a, Schematic of AgNPscoated with NeutrAvidin-PEG-thiol (NA) and lipoic-PEG-amine (black lines), onto which fluorescent dyes (stars) are attached, the brightness of the dyes isenhanced by the local plasmonic field. Attachment of biotinylated internalizing peptide RPARPAR forms the complete Ag nanoprobe (R-Ag-NA488). Thesebind to and are taken up by cells, which are treated by exposing to etchant solution to remove extracellular particles. Plasmonic enhancement is lost foretched particles. b, The etching reagents hexacyanoferrate (HCF) and thiosulphate (TS) oxidize and stabilize silver ions, respectively, releasingcomponents into solution and dissolving the core. c, Fluorescence confocal microscopy of cells incubated with R-Ag-NA488 (green) and membrane stain(red) shows how R-Ag-NA488 is retained selectively in cells when etched (right). Endosomal membranes strongly overlap with nanoparticles, appearingas yellow in the overlay. Extracellular nanoparticles appear as green (identified by white arrows) and are selectively removed by etching. Insets showintercellular bridges with several associated R-Ag-NA488 nanoparticles that were determined by etching to have been extracellular. Scale bars, 15µm(main images) and 2µm (insets).
ALBALPALT
AMYTBILCREBUNGLU
TPGLOB
Ag-NAEtchant
0
50
100
30
0.0 0.5 1.0 1.5 2.00
10
20
30
40
50
OR48 8
CF55 5
CF64 7
CF770
OR48 8
CF555
CF64 7CF77 0
0
2
4
6
8
10
10 1010 10
10
1010
20 nm Ag70 nm Ag
Enha
ncem
ent
fact
or (f
old)
Etching rateTime to etch2:1 TS:HCF3:1 TS:HCF
Tim
e to
etc
h (s
)
Etchant (mM HCF)
240
180
120
60
0
Etching rate (% s −1)
Cell
viab
ility
(%) 24 h
48 h
Ag: None NoneNoneR-Ag R-Agx-Ag x-Ag
0Etch (mM): 11
Control
Concentration (varied units) In vivo etch
100
% A
g do
sein
tact
in b
lood
at 6
0 m
in
1 10 100 1,000
a b
c d e
+−10Duration (min): 1111 24−48 h
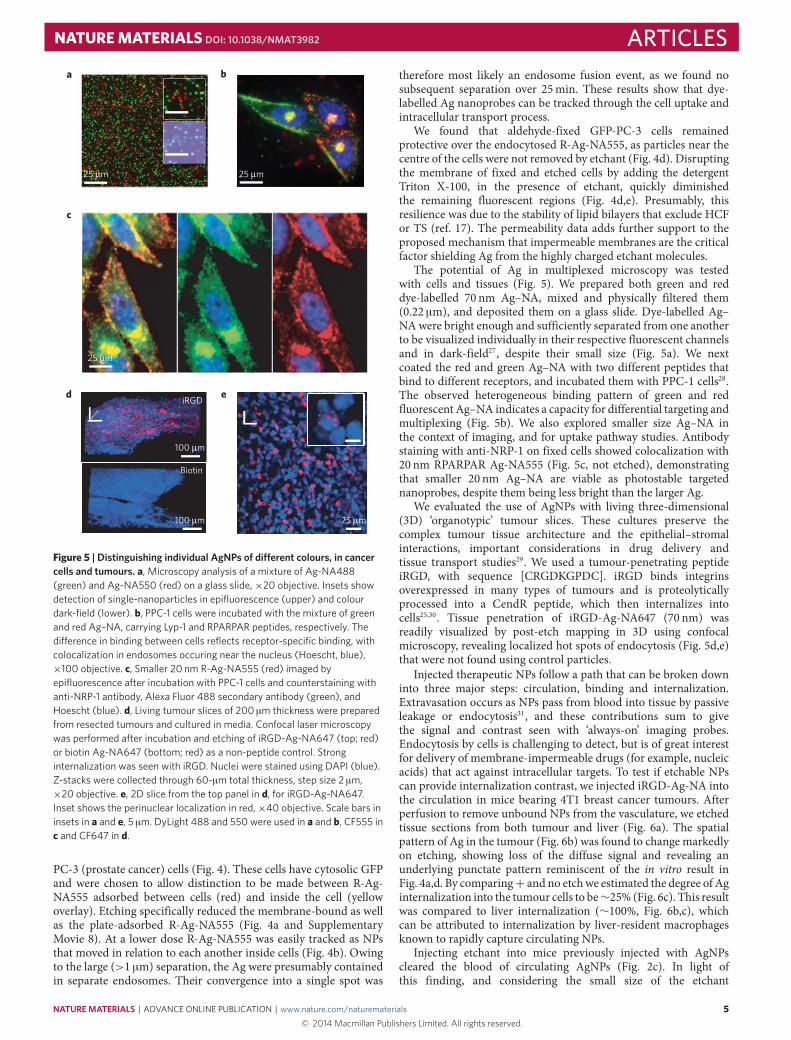
Figure 2 | Nanoparticle characterization and toxicity screening. a, Enhancement factors for several commonly used dyes show a strong dependence onthe size of the Ag particle core. Enhancement factors were calculated from the ratio of fluorescence for unetched and etched Ag–NA-dye conjugates. Onthe x axis is the name of each dye with its approximate peak absorption wavelength in nm. Error bars are standard deviations from replicate wells. OR488,Oregon Green 488; CF dyes from Biotium. b, Etching kinetics for Ag–NA depends linearly on the concentration and the molar ratio of the etchantcomponents thiosulphate:hexacyanoferrate (TS:HCF). The decrease in scattering intensity from the Ag plasmon band on etching was used to calculate arate, and the time to reach 10% of the initial value is plotted. The molar ratio of etchant components was 1:1 TS:HCF except where indicated. Theconcentration of Ag–NA (70 nm diameter core) was kept fixed in all conditions. c, PPC-1 cells with RPARPAR Ag–NA (R-Ag) and etching showed no e�ecton viability at 48 h (resazurin assay) for short-term exposures to etchant. N=6. Values were normalized to the condition of no Ag, no etchant. Ag–NAwithout peptide, x-Ag, does not internalize into cells. The etchant concentration and duration of contact with cells is indicated. d, In vivo blood chemistrywas evaluated 24 h after the injection of x-Ag-NA or etchant. Marker levels were not significantly di�erent from those for a PBS control injection (seeSupplementary Information for additional plots). Error bars are standard deviations N=3–6 mice. e, The etchant was capable of etching pre-injected Ag inmice. Ag was injected into the tail vein, then 20 min later followed by either etchant or PBS injection, and blood was analysed for fluorescence at 60 min.Values were normalized to the percentage of fluorescence at 5 min. Ag had been labelled with CF555 and PEG for blood etching (see SupplementaryInformation). Error bars are standard deviations. N=2. Terms and units in d, GLOB, globulin (g l−1); TP, total protein (g l−1); GLU, glucose (mM); BUN, bloodurea nitrogen (mM); CRE, creatinine (µM); TBIL, total bilirubin (µM); AMY, amylase units/L; ALT, alanine transaminase units/L; ALP, alkaline phosphataseunits/L; ALB, albumin (g l−1).
2 NATUREMATERIALS | ADVANCE ONLINE PUBLICATION | www.nature.com/naturematerials© 2014 Macmillan Publishers Limited. All rights reserved.

NATUREMATERIALS DOI: 10.1038/NMAT3982 ARTICLES
± etch
R-Ag/–etchR-Ag/+etchRA-Ag/–etchRA-Ag/+etchCells only
R-Ag
Inte
rnal
izat
ion
(%)
RA-Ag
R-Ag-NA647
Cell
Fluorescence
Fluo
resc
ence
0 5 10 15
Coun
t
a
be
d
f
c
0
25
50
75
100
+etch−etch
+etch−etch
Etch
SSCFSC (×106)
No etch
Etch
NRP-1 receptor
600
400
200
0101
101
102
103
104
105
106
107
Fluo
resc
ence
101
102
103
104
105
106
107
102 103 104 105 106 107 104 105 106 107
Figure 3 | Flow cytometry with AgNPs. a, Scheme of CendR peptide RPARPAR-dependent R-Ag-NA647 binding to NRP-1 expressing cells. After splittinginto two samples one is etched. b, Fluorescence histograms of cells with Ag-NA647 carrying either of two peptides. Cell-gated plots of internalizingR-Ag-NA647 (red, -etch; blue, +etch) versus non-internalizing control, RPARPARA (RA)-Ag-NA647 (yellow, -etch; green, +etch). Cells without Ag wereincluded as a control (black). Paired± etch is indicated in all panels by the clip icon. c, Internalization into cells was quantified from b as the percentage ofmean signal retained after etching. Error bars (standard deviation) were generated across five separate incubations and cytometric runs. d, Dark-fieldimaging of cell suspensions with R-Ag-NA647 shows that etched cells lose the membrane puncta (Ag) but retain the perinuclear (and red-shifted)scattering colour from internalized Ag. Inset shows cells without AgNPs. Scale bars, 25 µm. e,f, The data collected for R-Ag-NA647 nanoparticles and cellsfrom b plotted as ungated dot plots in fluorescence versus forward scatter (FSC, e) or side scatter (SSC, f). Black-dot plots are from cells-only control. In e,FSC detected cells but the signal did not shift when cells were bound with R-Ag-NA647; only y-axis fluorescence shifts were observed. FSC thus served asa stable gate parameter, indicated by the blue bar, and was used for creating panel b. In f, both SSC and fluorescence increased owing to R-Ag-NA647(red). Etching caused a slight loss in signal from cells (upper-right population), attributed to the etching away of membrane-bound Ag, and a loss of eventsbelow the cell-minimum SSC at∼106 counts was attributed to free R-Ag-NA647 or debris.
from etched AgNPs lose their fluorescence enhancement, furtherreducing the background signal.
Uptake into cells and extracellular etching were characterizedusing fluorescence and dark-field microscopy. CF488 dye-labelledAg–NA carrying the prototypic CendR peptide RPARPAR (R) werevisualized in NRP-1-expressing prostate cancer cells (PPC-1) beforeand after etching (Fig. 1c and Supplementary Figs 3–6; ref. 14).The etchant selectively removed extracellular R-Ag-NA488 (thosebound to the cell surface and the culture plate surface betweencells), whereas the internalized fraction (appearing as yellow) wereprotected by the plasma membrane and remained unaltered inintensity (Fig. 1c and Supplementary Fig. 3). Dark-field imagingrevealed the surviving fraction to consist of, in part, a red-shiftedscattering population of Ag located in the perinuclear region ofthe cells (Supplementary Fig. 3). Surface plasmon oscillations, aresonant source for Rayleigh scattering, are known to plasmonicallycouple8,19 when cores are within one diameter length from eachother. This spectral feature can be a useful indicator of endosomalfusion and consolidation of Ag. Notably, etching of surface Ag fromliving cells could be accomplished in cell culture medium (Fig. 1c).
Pre-labelling the Ag–NA with dyes puts them in accord witha versatile ‘plug and play’ targeting format used in multiplexedassays. We prepared a suite of dye-labelled Ag–NA nanoprobes toexplore their use in multispectral applications, and characterizedthe plasmonically-driven fluorescence enhancement (EF). MetalNPs enhance the photostability and fluorescence intensity of a dyedepending on several factors: the distance from the metal surface(optimally ∼3–10 nm, or quenching dyes if directly touching thesurface; ref. 20); the photophysical properties of attached dyes andlabelling density; spectral overlap between the plasmon resonanceand dye at the wavelength of interest; and the scattering efficiency
of the core—which depends sensitively on composition, diameterand shape8. In Fig. 2a we determined EF by etching dye-labelledsamples at a constant volume, keeping the number of dyes and theirconcentration fixed, and comparing the intensity from attached(unetched) versus the same dye free in solution (etched). TheAg–NA-dye constructs (diagrammed in Fig. 1a with peptides)were ∼5–15 fold brighter before etching, indicating that dyes areenhanced by the local field around 70 nm Ag–NA. This held truefor a range of dyes from the ultraviolet to near-infrared (NIR; Fig. 2aand Supplementary Fig. 7). In contrast, we found that smaller Ag–NA (20 nm, with a similar coating) gave EF values of∼1, consistentwith the predicted 40 nm diameter threshold for enhancement. Thecyanine dyes Cy3, CF555, andDL550 showed the largest EFs, 12± 2(Fig. 2a and Supplementary Fig. 7) for 70 nm Ag–NA, consistentwith an EF value of 12 previously reported using Ag islands onquartz films coatedwithCy3- andCy5-labelled albumin20. Althoughthe current Ag–NA design establishes a broad spectral range on arapidly etched (Fig. 2b) single-core platform, we anticipate that EFin the NIR range could be improved by a judicious tuning of theplasmonic spectral envelope (Supplementary Fig. 1), for example,by using non-spherical Ag cores, which are known to exhibit NIR toinfrared resonance7.
To develop a set of etching techniques we evaluated the toxicityof this etchant in cell cultures and in vivo with mice. Long-term cellviability was not affected by AgNPs or their etching, but decreasedif continuously exposed to high etchant concentrations for 24 h(Fig. 2c and Supplementary Fig. 4). The etchant combination is thusmild, and selective, because AuNPs could not be dissolved owing totheir higher reduction potential (Supplementary Fig. 5; refs 6,21).In addition, it is known that the anti-oxidant ascorbate can reduceHCF and we confirmed that etchant activity is rapidly quenched
NATUREMATERIALS | ADVANCE ONLINE PUBLICATION | www.nature.com/naturematerials 3© 2014 Macmillan Publishers Limited. All rights reserved.
ARTICLES NATUREMATERIALS DOI: 10.1038/NMAT3982
0 100 200 3000
100
200
Time (s)
Inte
nsity
(a.u
.)
External
InternalFix
Re-focus
Etch
Permeabilize
Pre-etch Etch
Δt = 20 s
0
140
120
260
Initial + Fix. + Etch + Perm.
Sing
le c
ell
a
b
c
d
e
Figure 4 | Tracking AgNPs within live cells. a, Epifluorescence microscopy images of GFP-expressing PC-3 cells (green) after binding and endocytosingR-Ag-NA555 (red). These cells express the NRP-1 receptor. R-Ag-NA555 appears red when not associated with the GFP in cells, and these were removedby etching (arrowheads). Nuclei were stained using Hoescht (blue). The yellow colour represents cell-associated R-Ag-NA555, due to spatial overlap withthe cells, indicated by the full arrows. See also Supplementary Movie 8. b, Intracellular tracking was possible by time-lapse epifluorescence imaging when alower amount of R-Ag-NA555 was added with shorter incubation time. This post-etch image shows only a small number of red objects survived etching,and a pre-etch image of a region outside the cells (dashed box) is overlaid to show the representative intensity from R-Ag-NA555 that had adsorbed to thesubstrate. A region inside the cell body (solid box) was chosen for the time series presented in c. c, R-Ag-NA555 moved within the cell and relative to eachother. Each frame advances forward by 20 s, with numbers in frames indicating the elapsed time. The two structures undergo an apparent fusion event at220 s. d, R-Ag-NA555 particles were incubated with PC-3-GFP cells and imaged during the sequential procedure of fixing (fix.), etching andpermeabilization (perm.). Representative regions for R-Ag-NA555 that were internalized (green boxes) and a region of bound but external particles (greyboxes) are shown. e, Time trace of the mean pixel intensity of the regions in d with each reagent added without washing. Rapid drops in intensity were dueto etching of Ag and the gradual downward slope is due to fluorescence photobleaching. Two cells were averaged for this trace. Scale bars, 25 µm (a);10 µm (b); 1 µm (c); 25 µm (d).
(Supplementary Fig. 5), a feature which could enable pulse-chaseexperimental formats22. Clinical blood chemistry analysis of miceinjected with Ag–NA or the etchant showed normal hepaticand kidney function, as measured, for example, by analysis ofalanine aminotransaminase, amylase, and blood urea nitrogenlevels, indicating the general safety of both Ag–NA (ref. 23) andetchant18,32,33 in cell and tumour homing studies (Fig. 2d andSupplementary Fig. 4). However, detailed studies may be needed tofurther explore the potential toxicity. Importantly, the concentrationof etchant we tested was sufficient to etch AgNPs in blood (Fig. 2e).
We evaluated the performance of etchable dye-labelled Ag inflow cytometry. Flow cytometry is a well-established quantitativemethod for the fluorescent detection of cells that has not yet beenused with fluorescent Ag probes, yet should benefit from theirexpectedly high radiative rate and saturation limit20,24. Ag–NA withAlexa Fluor 647 dye were loaded with either RPARPAR (R-Ag-NA647) or RPARPARA (RA-Ag-NA647), a C-terminally blockedcontrol peptide that has negligible affinity to NRP-1 (refs 25,26).A plus/minus etch strategy was implemented with the aim ofquantifying the specific internalization of NPs. Cells were firstincubated with R-Ag-NA647 or RA-Ag-NA647 and then eachsample was split into two parts—one of which was etched to removethe non-internalized fraction (Fig. 3a). Using flow cytometry wefound that the forward scatter (FSC) typically used as an indicatorof cell size was insensitive to Ag-NA647. We therefore choseFSC to gate for cells (applied in Fig. 3b). We then comparedsignals from etched and unetched samples and calculated theinternalized fraction by the mean intensity ratio. Approximately60% of the fluorescence signal from R-Ag-NA647 was not etchable
(that is, ∼60% internalized) after 1 h of incubation with cells.Functionalized with the control peptide, RA-Ag-NA647 showedonly weak binding with complete etchability (∼1% internalized,Fig. 3b,c), consistent with the receptor-binding motif being crucialfor internalization. Robust internalization and etch-protection usingthe peptide RPARPAR was further corroborated by dark-fieldscattering from R-Ag-NA647 inside suspended cells (Fig. 3d).
We found that, unlike most probes commonly used in flowcytometry, binding by Ag-NA647 dramatically altered the sidescatter (SSC) signal from cells, and the effect was proportional tothe fluorescence signal across a wide dynamic range (Fig. 3d,e).Cells without Ag-NA647 did not show this behaviour (black). Thebasis for increased SSC is probably a result of the intense resonantAgNP plasmon scattering light at the 488 nm laser wavelength7
(Fig. 3b and Supplementary Figs 2 and 3). Post-etch dot plotsshowed a disappearance of low-signal events in both SSC andfluorescence, further evidence that non-internalized Ag-NA647were removed (Fig. 3e). Generalizing these results, AgNP SSC couldbe monitored in label-free uptake assays, or as a confirmatoryor ratiometric reference signal, for example, when using pH-sensitive dyes. The proportionality we observe between SSC andfluorescence indicates uniform dye labelling as well as a minimalchange of AF647 fluorescence following endocytosis. These resultsprovide a blueprint for the design and use of AgNPs for flowcytometry applications.
Imaging of probes in live cells is particularly demanding, as itrequires a material to be both bright and photostable. To exploresuch applications we prepared CF555 dye-labelled 70 nm R-Ag-NA555 and allowed them to internalize intoNRP-1 expressingGFP-
4 NATUREMATERIALS | ADVANCE ONLINE PUBLICATION | www.nature.com/naturematerials© 2014 Macmillan Publishers Limited. All rights reserved.
NATUREMATERIALS DOI: 10.1038/NMAT3982 ARTICLES
Biotin
iRGD
a b
c
d e
25 µm
25 µm
25 µm
25 µm
100 µm
100 µm
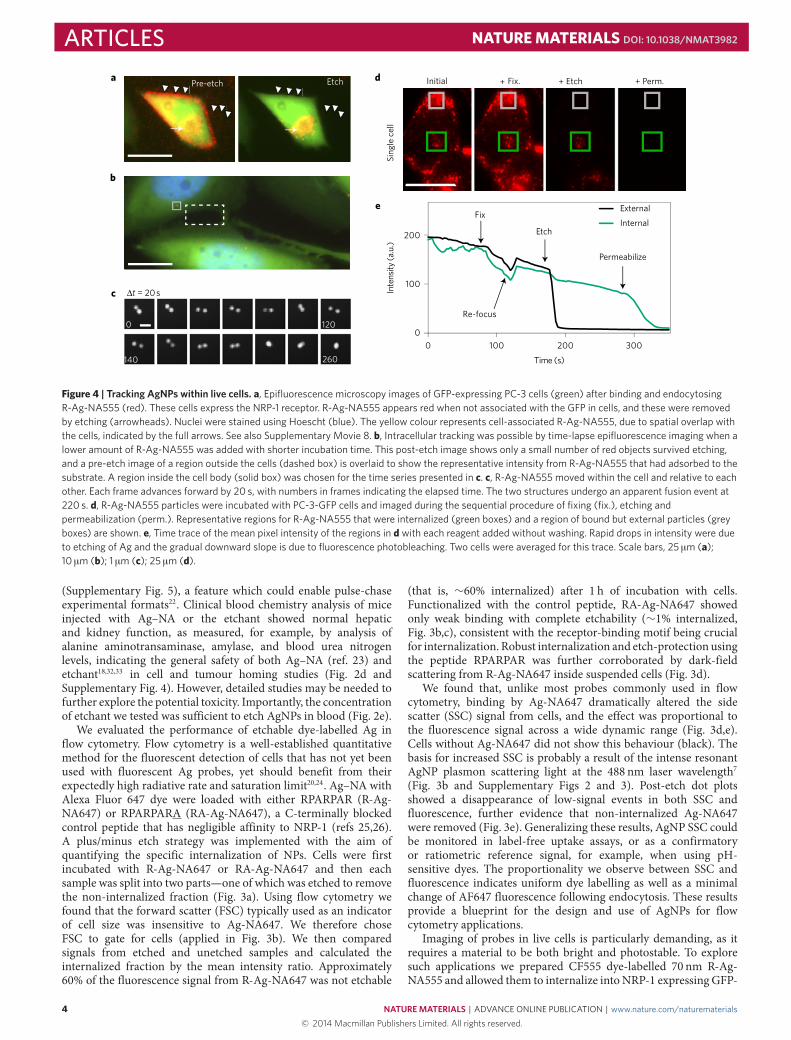
Figure 5 | Distinguishing individual AgNPs of di�erent colours, in cancercells and tumours. a, Microscopy analysis of a mixture of Ag-NA488(green) and Ag-NA550 (red) on a glass slide,×20 objective. Insets showdetection of single-nanoparticles in epifluorescence (upper) and colourdark-field (lower). b, PPC-1 cells were incubated with the mixture of greenand red Ag–NA, carrying Lyp-1 and RPARPAR peptides, respectively. Thedi�erence in binding between cells reflects receptor-specific binding, withcolocalization in endosomes occuring near the nucleus (Hoescht, blue),×100 objective. c, Smaller 20 nm R-Ag-NA555 (red) imaged byepifluorescence after incubation with PPC-1 cells and counterstaining withanti-NRP-1 antibody, Alexa Fluor 488 secondary antibody (green), andHoescht (blue). d, Living tumour slices of 200 µm thickness were preparedfrom resected tumours and cultured in media. Confocal laser microscopywas performed after incubation and etching of iRGD-Ag-NA647 (top; red)or biotin Ag-NA647 (bottom; red) as a non-peptide control. Stronginternalization was seen with iRGD. Nuclei were stained using DAPI (blue).Z-stacks were collected through 60-µm total thickness, step size 2 µm,×20 objective. e, 2D slice from the top panel in d, for iRGD-Ag-NA647.Inset shows the perinuclear localization in red,×40 objective. Scale bars ininsets in a and e, 5 µm. DyLight 488 and 550 were used in a and b, CF555 inc and CF647 in d.
PC-3 (prostate cancer) cells (Fig. 4). These cells have cytosolic GFPand were chosen to allow distinction to be made between R-Ag-NA555 adsorbed between cells (red) and inside the cell (yellowoverlay). Etching specifically reduced the membrane-bound as wellas the plate-adsorbed R-Ag-NA555 (Fig. 4a and SupplementaryMovie 8). At a lower dose R-Ag-NA555 was easily tracked as NPsthat moved in relation to each another inside cells (Fig. 4b). Owingto the large (>1 µm) separation, the Ag were presumably containedin separate endosomes. Their convergence into a single spot was
therefore most likely an endosome fusion event, as we found nosubsequent separation over 25min. These results show that dye-labelled Ag nanoprobes can be tracked through the cell uptake andintracellular transport process.
We found that aldehyde-fixed GFP-PC-3 cells remainedprotective over the endocytosed R-Ag-NA555, as particles near thecentre of the cells were not removed by etchant (Fig. 4d). Disruptingthe membrane of fixed and etched cells by adding the detergentTriton X-100, in the presence of etchant, quickly diminishedthe remaining fluorescent regions (Fig. 4d,e). Presumably, thisresilience was due to the stability of lipid bilayers that exclude HCFor TS (ref. 17). The permeability data adds further support to theproposed mechanism that impermeable membranes are the criticalfactor shielding Ag from the highly charged etchant molecules.
The potential of Ag in multiplexed microscopy was testedwith cells and tissues (Fig. 5). We prepared both green and reddye-labelled 70 nm Ag–NA, mixed and physically filtered them(0.22 µm), and deposited them on a glass slide. Dye-labelled Ag–NAwere bright enough and sufficiently separated from one anotherto be visualized individually in their respective fluorescent channelsand in dark-field27, despite their small size (Fig. 5a). We nextcoated the red and green Ag–NA with two different peptides thatbind to different receptors, and incubated them with PPC-1 cells28.The observed heterogeneous binding pattern of green and redfluorescent Ag–NA indicates a capacity for differential targeting andmultiplexing (Fig. 5b). We also explored smaller size Ag–NA inthe context of imaging, and for uptake pathway studies. Antibodystaining with anti-NRP-1 on fixed cells showed colocalization with20 nm RPARPAR Ag-NA555 (Fig. 5c, not etched), demonstratingthat smaller 20 nm Ag–NA are viable as photostable targetednanoprobes, despite them being less bright than the larger Ag.
We evaluated the use of AgNPs with living three-dimensional(3D) ‘organotypic’ tumour slices. These cultures preserve thecomplex tumour tissue architecture and the epithelial–stromalinteractions, important considerations in drug delivery andtissue transport studies29. We used a tumour-penetrating peptideiRGD, with sequence [CRGDKGPDC]. iRGD binds integrinsoverexpressed in many types of tumours and is proteolyticallyprocessed into a CendR peptide, which then internalizes intocells25,30. Tissue penetration of iRGD-Ag-NA647 (70 nm) wasreadily visualized by post-etch mapping in 3D using confocalmicroscopy, revealing localized hot spots of endocytosis (Fig. 5d,e)that were not found using control particles.
Injected therapeutic NPs follow a path that can be broken downinto three major steps: circulation, binding and internalization.Extravasation occurs as NPs pass from blood into tissue by passiveleakage or endocytosis31, and these contributions sum to givethe signal and contrast seen with ‘always-on’ imaging probes.Endocytosis by cells is challenging to detect, but is of great interestfor delivery of membrane-impermeable drugs (for example, nucleicacids) that act against intracellular targets. To test if etchable NPscan provide internalization contrast, we injected iRGD-Ag-NA intothe circulation in mice bearing 4T1 breast cancer tumours. Afterperfusion to remove unbound NPs from the vasculature, we etchedtissue sections from both tumour and liver (Fig. 6a). The spatialpattern of Ag in the tumour (Fig. 6b) was found to change markedlyon etching, showing loss of the diffuse signal and revealing anunderlying punctate pattern reminiscent of the in vitro result inFig. 4a,d. By comparing+ and no etchwe estimated the degree of Aginternalization into the tumour cells to be∼25% (Fig. 6c). This resultwas compared to liver internalization (∼100%, Fig. 6b,c), whichcan be attributed to internalization by liver-resident macrophagesknown to rapidly capture circulating NPs.
Injecting etchant into mice previously injected with AgNPscleared the blood of circulating AgNPs (Fig. 2c). In light ofthis finding, and considering the small size of the etchant
NATUREMATERIALS | ADVANCE ONLINE PUBLICATION | www.nature.com/naturematerials 5© 2014 Macmillan Publishers Limited. All rights reserved.

ARTICLES NATUREMATERIALS DOI: 10.1038/NMAT3982
Tumour Liver
–etch+etch
+etch +etch
–etch
Ag NP
Cells Ex vivo
Perfuse
In vivoTumour
Blood vessel
Perfuse
(i) (ii)
(iv)(iii)
–etch
+etch–etch
0.5 4 24Time (h)
24 h
Nuclei
−etch+etch
Inject Ag
Cells with Ag
etch etch
Ag
pixe
ls (a
.u)
Ag
pixe
ls (a
.u)
a b c
d e f
Figure 6 | In vivo etching. a, Schematic of in vivo tumour homing, ex vivo and in vivo etching. Stages are: (i) iRGD-Ag-NA homing and extravasation,(ii) tissue perfusion followed by etching ex vivo, or instead, (iii) in vivo etching followed by perfusion, and (iv) tissue with Ag retained in cells. b, Bright-fieldimages of ex vivo 4T1 tumour (left) and liver tissue (right) sections for mice injected with iRGD-Ag-NA following steps i, ii and iv, are presented. Ag wasamplified by autometallography and appeared as dark pixels. Di�use dark pixels (full arrows) were attributed to extracellular Ag, arrowheads point toendosomal Ag. c, Samples from b were quantified for dark Ag pixels per field as a measure of iRGD-Ag-NA in the tissue. d, In vivo etching withMMTV-PyMT tumours. Mice were perfused at 0.5, 4 or 24 h post injection of iRGD-Ag-PEG, and selected mice (+etch) were injected with etchant 10 minbefore perfusion. Shown are representative tumour tissue sections from 4 h. e, Dark-field imaging of Ag amplified section (4 h,−etch) shows strong signals(arrows) consistent with the pattern in the bright-field image of d. Note that this image has no nuclear counterstain and was taken from a separate sectionthan that in d. f, Tumour samples from d were quantified for dark Ag pixels per field, representing the amount of iRGD-Ag-PEG in the tissue for the indicatedcirculation times. Error bars are standard deviations with N > 2 randomly chosen fields per condition in c, N > 4 in f. Scale bars are 100 µm in b,d,e.
molecules, we explored the possibility that AgNPs trapped in theextravascular/extracellular space may also be etched. Indeed, thecomponents TS and HCF are known to distribute through tissueswithout crossing membranes18,32,33, and have been used to estimatethe extracellular fluid volume in mammals18,32. Furthermore, thereaction products comprise stable and soluble compounds (Fig. 1b)that should not interferewith the autometallography used to amplifythe Ag signal for histological analysis.
We developed an in vivo etching strategy that gives circulatingNPs a set amount of time to find their target before chasing with anintravenous bolus of etchant (Fig. 6a, lower pathway). Comparing+/− etchant would then discriminate between accumulation in thetumour (homing) and internalization by cells within the tumour(that is, cell uptake). A possible complication for etching is that partsof the tumour can have dysfunctional local vasculature, impairingdelivery34; however, those regions might also receive fewer AgNPs.We chose the well-studied MMTV-PyMT transgenic mouse model,which has relevance to human breast cancer, particularly the stagesof its progression35. The Ag nanoprobe was modified to carrypolyethylene glycol (PEG)-linked iRGD, instead of NA linked withbiotin iRGD, to more closely resemble therapeutic ‘stealth’ NPs, andto allow repeat injections in an immunocompetent setting36. iRGDis a tumour-specific homing peptide that is converted into a CendRpeptide in tumours. It has been found to increase tumour-homingand extravasation of NPs in several breast cancer models25,37.
Tumour-bearing MMTV-PyMT mice injected with iRGD-Ag-PEG exhibited a heterogeneous homing pattern in the tumour(Figs 6d,e; 4 h, −etch condition), similar to Fig. 6b and otherNP homing studies25,28. Quantifying Ag pixels showed an initialhoming burst (0.5 h, −etch), followed by a doubling between 0.5 hand 4 h, and doubling again by 24 h circulation time (Fig. 6f).Clearance by the reticuloendothelial system of circulating NPs
could explain the decreased homing rate. Notably, relative to non-etched counterparts, mice that received an injection of etchant hada diminished quantity of Ag, irrespective of circulation time foriRGD-Ag-PEG. Assuming the Ag pixels from etched samples weredue to the cell-internalized NPs, we may conclude the following: asignificant amount of iRGD-Ag-PEG internalized as early as 0.5 h(Fig. 6f,+etch), and increased fourfold by 24 h (+etch). The rate ofinternalization (+etch) paralleled the rate of Ag homing (−etch).Comparing +etch and −etch we estimate ∼30% of the homingresulted with internalization by 24 h, similar to the ex vivo tumourresult in Fig. 6c (∼25%, 24 h). Together, these data suggest a newmethod to determine intracellular biodistribution kinetics that usesetchable AgNPs as a model nanosystem for targeted therapeutics.
AgNP probes combine traits of etchability and brightness, inboth fluorescence and scattering imaging modalities, with spectralbarcoding, photostability and sensitivity to the single-particle level.The AgNPs were functionalized with NeutrAvidin for facile loadingof affinity tags, and imaged inside cancer cells in vitro and in vivo.AgNPs also seem particularly promising for flow cytometry, whichwas implemented here to more finely parse receptor specificityand uptake efficiency. As other virus-like particles, AgNPs cancarry a multiplicity of ligands that increase their avidity—shortpeptides, employed in this work, are of particular interest owing totheir specificity and minimal immunogenicity, however, antibodyor aptamer38 targeting elements may be conjugated to AgNPs.Coatings that respond to an electrochemical cue by a shapechange are also possible, including Au–Ag (refs 39–41), redox-sensitive cleavable linkers39,42, and biomolecular nanostructures43–45.Multiplexed detection of internalized Ag should lead to a betterunderstanding of NP-cell interactions and the role of size, shapeand coating during molecular transport through tissue and cells.The recent emergence of NIR and multi-photon excitation systems
6 NATUREMATERIALS | ADVANCE ONLINE PUBLICATION | www.nature.com/naturematerials© 2014 Macmillan Publishers Limited. All rights reserved.

NATUREMATERIALS DOI: 10.1038/NMAT3982 ARTICLESfor in vivomapping provide key design features for engineering theinherently nonlinear optical properties of plasmonic nanoparticles.Taken together, these results illustrate how plasmonic nanoprobesbased on etchable Ag cores will be a powerful tool in studies oftargeted uptake and trafficking from a subcellular to tissue level.
MethodsMaterials. Ag nanoparticles were synthesized and coated as described in theSupplementary Information. Coatings around Ag were based on eitherNeutrAvidin (Ag–NA) protein or PEG-maleimide (Ag-PEG). Amine-reactive dyeswere attached to NA nanoparticles for fluorescence microscopy and flowcytometry (for example, Ag-NA488). Peptides were synthesized with a biotinlabel for loading into the binding pocket of NA. Free cysteine-containing peptideswere prepared as previously described and conjugated to PEG-maleimide14,25. Theetchant was composed of tripotassium hexacyanoferrate (HCF) and sodiumthiosulphate pentahydrate (TS) (Sigma), with a working concentration of1–10mM HCF and TS.
In vitro imaging. Cell imaging experiments were performed in culture plates orglass bottom reservoirs, as described in the Supplementary Information. Typically,biotin-X-RPARPAR-OH was attached to dye-labelled nanoparticles (for example,R-Ag-NA488) and added to PPC-1 or PC3-GFP prostate cancer cells in DMEMculture medium with 10% FBS. In some experiments, cells were washed withHanks buffered saline solution (HBSS, Hyclone). Addition of etchant solution tothe medium removed extracellular Ag. Where indicated, nuclear stain Hoescht(Invitrogen) was added to the media before epifluorescence imaging. Antibodiesused were against NRP-1 (Novus) and Alexa Fluor 488 anti-Rabbit secondaryantibody (Invitrogen).
Flow cytometery. PPC-1 cells were suspended in DMEM with 10 µM t-RNA.Ag-NA647, carrying either biotin-X-RPARPAR-OH (R) orbiotin-X-RPARPARA-OH (RA), was incubated with cells for 1 h. Etchant in PBSwas added to specified samples, followed by centrifugation and resuspension inmedia. Analysis was performed on a BD Accuri C6 Flow Cytometer.
Ex vivo tissue penetration assay. All animal work was approved by theInstitutional Animal Care Committee of the Sanford-Burnham Medical ResearchInstitute. MCF10CA1a human breast cancer cells were inoculated in nude femalemice and grown to ∼1 cm diameter. Tumours were excised and sliced with aLeica VT1200 vibratome at a thickness of ∼400 µm and cultured overnight. Thenext day the tumour slices were incubated with nanoparticles for 2 h at 37 ◦C,washed with PBS, exposed for 1min to etchant in PBS, washed, fixed,permeabilized, DAPI stained, and mounted (ProLong). Confocal microscopy(Olympus) Z-stacks were rendered in 3D perspective. Nanoparticles: Ag-NA647with biotin-X-GGSGGSGG-[CRGDKGPDC]-NH2 (iRGD-Ag-NA647), whereX = aminohexanoic linker and the two cysteine residues were disulphide bonded,or Ag-NA647 with D-biotin (control).
Etching kinetics. Kinetics etching data was collected using a fluorimeter(Horiba) monitoring the 90◦ scattering signal from 70 nm Ag–NA in solution.Excitation and emission were set at 470 nm and 520 nm with 5 nm slit widths.The scattering signal dropped on adding the etchant. The slope was fitted using alinear function and converted to an etch rate in units of the percentage of theinitial signal per second. The time at which the signal was 10% of the initialintensity was plotted by manual examination of the raw data. Etchant reagentstoichiometry was 1:1 unless otherwise specified and the Ag–NA concentrationwas fixed for all experiments.
In vivo homing with ex vivo etching. For in vivo homing experiments 25–50 nmiRGD-Ag-NA was injected by tail vein. Mice were perfused at 24 h under deepanaesthesia (Avertin) and tissues were frozen in liquid nitrogen. Cryosectionswere prepared and fixed in 4% paraformaldehyde in PBS. Etchant was appliedfor 5 s followed by PBS and then water. Aldehyde was blocked and cellspermeabilized in a glycine blocking solution. An LI Silver Enhancement kit(Molecular Probes) was used to amplify Ag signals, and coverslipped. Bright-fieldimages were quantified with ImageJ software (NIH).
In vivo homing and etching. iRGD-Ag-PEG synthesis is describedin the Supplementary Information. Briefly, Ag-PEG-NH2 was backfilledusing the peptide Ac-CCPGCC-NH2 (Lifetein). A linker moleculeNHS-PEG-Maleimide was attached (5 kDa, Jenkem USA)28, followed bycoupling FAM-cys-X-[CRGDKGPDC]-NH2 as in ref. 25. FAM is fluorescein,X = aminohexanoic linker, and brackets indicate the disulphide bond in iRGDbetween the two C residues. The sodium salt of HCF was prepared by sodium ionexchange resin treatment of 0.2M K3Fe(CN)6 solution. Sodium-HCF wascombined with 0.2M Na2S2O3 and 1M NaCl to prepare ∼150mM Na+, 17mM
Fe(CN)63−, and 50mM S2O32− as the etchant. MMTV-PyMT tumour-bearing
mice were injected with iRGD-Ag-PEG, and at a specified time later with etchant,both by tail vein. Tissue sections were fixed, blocked, permeabilized and Agamplified as above. Nuclei were stained using Nuclear Fast Red (Sigma),dehydrated and mounted (DPX, Sigma). An Aperio ScanScope XT scanner andImageJ were used to image and quantify brown-black as positive Ag pixels perfield. For dark-field imaging, samples without nuclear stain were imaged using aLeica DM-IRE2.
Statistical analysis. Values are reported as mean ± s.d. unless otherwisespecified. Statistical analysis was performed with GraphPad Prism using two-wayanalysis of variance.
Supporting Information. Complete experimental procedures as well as figuresshowing additional characterization and cell imaging.
Received 22 May 2013; accepted 14 April 2014;published online 8 June 2014
References1. Tassa, C., Shaw, S. Y. & Weissleder, R. Dextran-coated iron oxide nanoparticles:
A versatile platform for targeted molecular imaging, molecular diagnostics,and therapy. Acc. Chem. Res. 44, 842–852 (2011).
2. Ruoslahti, E. Peptides as targeting elements and tissue penetration devices fornanoparticles. Adv. Mater. 24, 3747–3756 (2012).
3. Chithrani, B. D. & Chan, W. C. Elucidating the mechanism of cellular uptakeand removal of protein-coated gold nanoparticles of different sizes and shapes.Nano Lett. 7, 1542–1550 (2007).
4. Goulet, P. J., Bourret, G. R. & Lennox, R. B. Facile phase transfer of large,water-soluble metal nanoparticles to nonpolar solvents. Langmuir 28,2909–2913 (2012).
5. Moller, J. et al. Dissolution of iron oxide nanoparticles inside polymernanocapsules. Phys. Chem. Chem. Phys. 13, 20354–20360 (2011).
6. Cho, E. C., Xie, J., Wurm, P. A. & Xia, Y. Understanding the role of surfacecharges in cellular adsorption versus internalization by selectively removinggold nanoparticles on the cell surface with a I2/KI etchant. Nano Lett. 9,1080–1084 (2009).
7. Sun, Y. & Xia, Y. Gold and silver nanoparticles: A class of chromophores withcolors tunable in the range from 400 to 750 nm. Analyst 128, 686–691 (2003).
8. Lakowicz, J. R. Radiative decay engineering 5: Metal-enhanced fluorescenceand plasmon emission. Anal. Biochem. 337, 171–194 (2005).
9. Zhang, F. et al. Fabrication of Ag@SiO(2)@Y(2)O(3):Er nanostructures forbioimaging: tuning of the upconversion fluorescence with silver nanoparticles.J. Am. Chem. Soc. 132, 2850–2851 (2010).
10. Mulvihill, M. J., Ling, X. Y., Henzie, J. & Yang, P. Anisotropic etching of silvernanoparticles for plasmonic structures capable of single-particle SERS. J. Am.Chem. Soc. 132, 268–274 (2010).
11. Braun, G. B. et al. Generalized approach to SERS-active nanomaterials viacontrolled nanoparticle linking, polymer encapsulation, and small-moleculeinfusion. J. Phys. Chem. C 113, 13622–13629 (2009).
12. Bharadwaj, P. & Novotny, L. Spectral dependence of single moleculefluorescence enhancement. Opt. Express 15, 14266–14274 (2007).
13. Kim, J. H., Estabrook, R. A., Braun, G., Lee, B. R. & Reich, N. O. Specific andsensitive detection of nucleic acids and RNases using goldnanoparticle–RNA–fluorescent dye conjugates. Chem. Commun.4342–4344 (2007).
14. Teesalu, T., Sugahara, K. N., Kotamraju, V. R. & Ruoslahti, E. C-end rulepeptides mediate neuropilin-1-dependent cell, vascular, and tissue penetration.Proc. Natl Acad. Sci. USA 106, 16157–16162 (2009).
15. Meywald, T., Scherthan, H. & Nagl, W. Increased specificity of colloidal silverstaining by means of chemical attenuation. Hereditas 124, 63–70 (1996).
16. Scheler, C. et al. Peptide mass fingerprint sequence coverage from differentlystained proteins on two-dimensional electrophoresis patterns by matrixassisted laser desorption/ionization-mass spectrometry (MALDI-MS).Electrophoresis 19, 918–927 (1998).
17. Koley, D. & Bard, A. J. Triton X-100 concentration effects on membranepermeability of a single HeLa cell by scanning electrochemical microscopy(SECM). Proc. Natl Acad. Sci. USA 107, 16783–16787 (2010).
18. Cardozo, R. H., Edelman, I. S. & Moore, F. D. Sodium thiosulfate dilution as ameasure of the volume of fluid outside of body cells. Surgical Forum606–611 (1951).
19. Liu, N., Hentschel, M., Weiss, T., Alivisatos, A. P. & Giessen, H.Three-dimensional plasmon rulers. Science 332, 1407–1410 (2011).
20. Malicka, J., Gryczynski, I., Gryczynski, Z. & Lakowicz, J. R. Effects offluorophore-to-silver distance on the emission of cyanine-dye-labeledoligonucleotides. Anal. Biochem. 315, 57–66 (2003).
NATUREMATERIALS | ADVANCE ONLINE PUBLICATION | www.nature.com/naturematerials 7© 2014 Macmillan Publishers Limited. All rights reserved.

ARTICLES NATUREMATERIALS DOI: 10.1038/NMAT3982
21. Burdinski, D. & Blees, M. H. Thiosulfate-and thiosulfonate-based etchants forthe patterning of gold using microcontact printing. Chem. Mater. 19,3933–3944 (2007).
22. Van Duijn, M. M. Ascorbate stimulates ferricyanide reduction in HL-60 cellsthrough a mechanism distinct from the NADH-dependent plasma membranereductase. J. Biol. Chem. 273, 13415–13420 (1998).
23. De Jong, W. H. et al. Systemic and immunotoxicity of silver nanoparticles in anintravenous 28 days repeated dose toxicity study in rats. Biomaterials 34,8333–8343 (2013).
24. Lakowicz, J. R. et al. Radiative decay engineering: 2. Effects of silver island filmson fluorescence intensity, lifetimes, and resonance energy transfer. Anal.Biochem. 301, 261–277 (2002).
25. Sugahara, K. N. et al. Tissue-penetrating delivery of compounds andnanoparticles into tumors. Cancer Cell 16, 510–520 (2009).
26. Teesalu, T., Sugahara, K. N. & Ruoslahti, E. Mapping of vascular ZIP codes byphage display.Methods Enzymol. 503, 35–56 (2012).
27. McFarland, A. D. & Van Duyne, R. P. Single silver nanoparticles as real-timeoptical sensors with zeptomole sensitivity. Nano Lett. 3, 1057–1062 (2003).
28. Roth, L. et al. Transtumoral targeting enabled by a novel neuropilin-bindingpeptide. Oncogene 31, 3754–3763 (2012).
29. Vaira, V. et al. Preclinical model of organotypic culture for pharmacodynamicprofiling of human tumors. Proc. Natl Acad. Sci. USA 107, 8352–8356 (2010).
30. Chen, R. et al. Application of a proapoptotic peptide to intratumorallyspreading cancer therapy. Cancer Res. 73, 1352–1361 (2013).
31. Ruoslahti, E., Bhatia, S. N. & Sailor, M. J. Targeting of drugs and nanoparticlesto tumors. J. Cell Biol. 188, 759–768 (2010).
32. Zweens, J., Frankena, H., Rispens, P. & Zijlstra, W. G. Determination ofextracellular fluid volume in the dog with ferrocyanide. Pflugers Arch. 357,275–290 (1975).
33. Mendel, B. The action of ferricyanide on tumour cells. Am. J. Cancer 30,549–552 (1937).
34. Gillies, R. J., Schornack, P. A., Secomb, T. W. & Raghunand, N. Causes andeffects of heterogeneous perfusion in tumors. Neoplasia 1, 197–207 (1999).
35. Lin, E. Y. et al. Progression to malignancy in the polyoma middle Toncoprotein mouse breast cancer model provides a reliable model for humandiseases. Am. J. Pathol. 163, 2113–2126 (2003).
36. Agemy, L. et al. Targeted nanoparticle enhanced proapoptotic peptide aspotential therapy for glioblastoma. Proc. Natl Acad. Sci. USA 108,17450–17455 (2011).
37. Sugahara, K. N. et al. Coadministration of a tumor-penetrating peptideenhances the efficacy of cancer drugs. Science 328, 1031–1035 (2010).
38. Farokhzad, O. C. et al. Targeted nanoparticle-aptamer bioconjugates forcancer chemotherapy in vivo. Proc. Natl Acad. Sci. USA 103,6315–6320 (2006).
39. Chuntonov, L., Bar-Sadan, M., Houben, L. & Haran, G. Correlating electrontomography and plasmon spectroscopy of single noble metal core-shellnanoparticles. Nano Lett. 12, 145–150 (2012).
40. Gu, H., Yang, Z., Gao, J., Chang, C. K. & Xu, B. Heterodimers ofnanoparticles: Formation at a liquid-liquid interface and particle-specific
surface modification by functional molecules. J. Am. Chem. Soc. 127,34–35 (2005).
41. Pallaoro, A., Braun, G. B. & Moskovits, M. Quantitative ratiometricdiscrimination between noncancerous and cancerous prostate cells based onneuropilin-1 overexpression. Proc. Natl Acad. Sci. USA 108,16559–16564 (2011).
42. Uozumi, J., Ishizawa, M., Iwamoto, Y. & Baba, T. Sodium thiosulfate inhibitscis-diamminedichloroplatinum (II) activity. Cancer Chemother. Pharmacol. 13,82–85 (1984).
43. Koyfman, A. Y. et al. Controlled spacing of cationic gold nanoparticles bynanocrown RNA. J. Am. Chem. Soc. 127, 11886–11887 (2005).
44. Koyfman, A. Y., Braun, G. B. & Reich, N. O. Cell-targeted self-assembled DNAnanostructures. J. Am. Chem. Soc. 131, 14237–14239 (2009).
45. Idili, A., Plaxco, K. W., Vallee-Belisle, A. & Ricci, F. Thermodynamic basis forengineering high-affinity, high-specificity binding-induced DNA clampnanoswitches. ACS Nano 7, 10863–10869 (2013).
AcknowledgementsThis work was supported by US DoD awards W81XWH-10-1-0199 andW81XWH-09-0698; R01 CA152327, R01 CA167174, and CA 030199 (Cancer CenterSupport grant) from the NCI; and by the Defense Advanced Research Projects Agency(DARPA) under Cooperative Agreement HR0011-13-2-0017. The findings and viewsexpressed are those of the authors and do not reflect the official policy or position of theDepartment of Defense or the US Government. Approved for Public Release,Distribution Unlimited. G.B.B. was supported by the Cancer Center of Santa Barbara andby an NIH training grant (T32 CA121949), and A-M.A.W., and T.T. by the EuropeanResearch Council under the European Union’s Seventh Framework Programme(FP/2007-2013)/ERC Starting Grant Agreement No. 291910. The authors thankL. Agemy, R. Chen and M. Moskovits for helpful discussions, A. K-Clark for assistanceand technical support with ICP-MS, F. Zhang for guidance in Ag synthesis, F. Vitti forhelpful discussions on silver amplification, J. Wang for flow cytometry assistance, theNRI-MCDBMicroscopy Facility at UCSB, and Histology and Cellular Imaging cores atthe Sanford-BurnhamMedical Research Institute.
Author contributionsG.B.B., T.T. and E.R. initiated the research and G.B.B., H-B.P., T.F., A.P., T.H.dM.,A-M.A.W., Z-G.S. and A.P.M. designed and performed experiments. K.S., T.T., N.O.R.and E.R. supervised the research. V.R.K. synthesized peptides. G.B.B. and E.R. wrote themanuscript. All authors contributed to analysing data and revising the manuscript.
Additional informationSupplementary information is available in the online version of the paper. Reprints andpermissions information is available online at www.nature.com/reprints.Correspondence and requests for materials should be addressed to G.B.B. or E.R.
Competing financial interestsThe authors declare that K.N.S., V.R.K., T.T. and E.R. have ownership interest (includingpatents) in CendR Therapeutics. E.R. is also founder, chairman of the board of CendRTherapeutics. No potential conflicts of interest were disclosed by the other authors.
8 NATUREMATERIALS | ADVANCE ONLINE PUBLICATION | www.nature.com/naturematerials© 2014 Macmillan Publishers Limited. All rights reserved.
Copyright © 2022 FDOKUMEN