Ultrafast acousto-plasmonic control and sensing in complex nanostructures
Upload
independentCategory
view
0download
0
A Nanocube Plasmonic Sensor forMolecular Binding on MembraneSurfaces
William J. Galush,†,‡ Sarah A. Shelby,§ Martin J. Mulvihill,† Andrea Tao,†,|
Peidong Yang,† and Jay T. Groves*,†,§,⊥
Department of Chemistry, UniVersity of California, Berkeley, California 94720,
Lawrence Berkeley National Laboratory, Berkeley, California 94720, and Howard
Hughes Medical Institute, UniVersity of California, Berkeley, California 94720
Received February 18, 2009; Revised Manuscript Received April 10, 2009
ABSTRACT
Detection and characterization of molecular interactions on membrane surfaces is important to biological and pharmacological research.
Here, silver nanocubes interfaced with glass-supported model membranes form a label-free sensor that measures protein binding to the
membrane. The technique utilizes plasmon resonance scattering of nanocubes, which are chemically coupled to the membrane. In contrast
to other plasmonic sensing techniques, this method features simple, solution-based device fabrication and readout. Static and dynamic protein/
membrane binding are monitored and quantified.
Metal nanostructures can be used for the label-free optical
detection of molecular binding to surfaces. This is due to
strong, environmentally sensitive light scattering caused by
the localized surface plasmon resonance (LSPR) of electrons
at the metal surface.1 Characteristic LSPR spectra exist for
a variety of shapes and configurations of particles,2-7 and
similar to conventional surface plasmon resonance (SPR)
spectrometry, the scattering spectra of the nanostructures are
dependent upon the refractive index of the surrounding
medium, which enables the detection of molecular binding
to or near the nanostructure surface.4,8,9
An application of the sensing capabilities of metal nano-
structures presented here is the detection of protein binding
at phospholipid membrane surfaces. Binding can be observed
in a simple, potentially multiplexed sensor device with a
straightforward readout. The basic sensor considered here
consists of cubic silver nanoparticles (∼100 nm, Figure 1a),
or “nanocubes,” embedded in a glass-supported lipid bilayer
membrane. The nanocubes are deposited onto a glass surface,
after which they are chemically modified with a self-
assembled monolayer (SAM) of alkanethiol. Subsequent
exposure of the surface to lipid vesicles results in formation
of a continuous lipid membrane covering the nanocubes and
the supporting glass substrate, as depicted in Figure 1a.
Experimental justification for this proposed structure is
provided below. Binding of molecular ligands to their
cognate receptors in the membrane alters the scattering
spectra of the nanocubes in a quantifiable manner. In this
implementation, target binding is measured by peak shifts
in the LSPR scattering spectra, which are monitored in real
time using a standard benchtop spectrophotometer. In contrast
to many examples of nanostructured sensors,10-12 this design
is based on bottom-up chemical self-assembly approaches.
Each step of the process, from the chemically mediated
growth of silver nanocubes to the deposition of alkanethiols
and phospholipids on the surface of metal particles, is a
solution-based process; no patterning or lithographic steps
are required. These simple and easily produced devices
provide data comparable to much more complex SPR
instruments.13
There is a pronounced need for analytical technology
capable of probing molecular interactions in a cell membrane
environment. Most biochemical processes involve mem-
branes at some point and, correspondingly, over half of the
one hundred best selling marketed drugs target cellular-
membrane-associated proteins.14,15 To address this need, there
has been significant interest in supported lipid bilayers,16-18
which share many of the same properties as cellular
membranes. In particular, supported membranes retain lateral
fluidity and allow membrane components to rearrange
naturally in response to molecular interactions. Furthermore,
membrane proteins are notoriously difficult to work with
* Corresponding author, [email protected].† Department of Chemistry, University of California.‡ Current address: Early Stage Pharmaceutical Development, Genentech,
Inc., 1 DNA Way, South San Francisco, CA 94080.§ Lawrence Berkeley National Laboratory.| Current address: Institute for Collaborative Biotechnologies, University
of California, Santa Barbara, CA 93106.⊥ Howard Hughes Medical Institute.
NANO
LETTERS
2009Vol. 9, No. 52077-2082
10.1021/nl900513k CCC: $40.75 2009 American Chemical SocietyPublished on Web 04/22/2009
outside of the membrane environment; supported membranes
offer a strategy to handle these. G-protein coupled receptors
provide a case in point and have been screened in a supported
membrane microarray format.19,20 Supported membranes have
also been used to reconstitute protein-protein signaling at
membrane surfaces21 and to imitate one face of cell-cell
junctions at T-cell synapses.22,23 The detection strategy
presented here takes advantage of the unique optical proper-
ties displayed by shaped metal nanocrystals. Silver nanocubes
exhibit a sharp quadripolar LSPR peak that provides a
sensitive gauge of the refractive index in the immediately
surrounding environment and have been characterized both
experimentally and theoretically.6,7,24 At the quadripolar
LSPR wavelength, the electromagnetic field exhibits local-
ized hot spots of amplified intensity which extend ap-
proximately 10 nm beyond the metal surface, with the field
being strongest along the edges and corners of the cube.24
This results in less influence from solution components when
compared with conventional surface plasmon resonance,
which has far longer (200 nm) field penetration depths.25,26
The nanocube LSPR field still extends beyond the ap-
proximately 5 nm thickness of the hybrid bilayer27 to allow
probing of binding at the membrane surface.
The construction of the biosensor begins with drying a
solution of silver nanocubes onto a glass substrate. The
nanocubes are synthesized using the polyol method,6,28,29
capped with poly(vinylpyrrolidone) (PVP), and stored in
ethylene glycol for extended periods of time (up to months)
before use. Nanocubes are first washed extensively with
ethanol to remove residual synthetic reagents. A small droplet
of the colloidal suspension is spread onto a glass microscope
slide, which has been previously cleaned in a 1:4 30% H2O2:
H2SO4 mixture of piranha solution (extremely reactive, use
caution). The droplet is allowed to dry under a N2 atmosphere
for 10 min; air exposure is minimized to avoid silver
oxidation. Slides are then incubated in a hexane solution with
3 mM 1-octanethiol for at least 12 h to form an alkanethiol
SAM over the metal. The slides are subsequently rinsed by
immersion in acetone, 2-propanol, and twice in deionized
water. After drying under N2 for 30 min, the nanoparticle-
covered slides are assembled into a flow chamber using a
silicone gasket (Invitrogen) and a second slide with holes
cut to allow solution exchange within the device (Figure 1b).
Measurements are conducted using regions of substrates with
nanocube densities of approximately 10-100 µm-2, as
estimated by darkfield microscopy.
The extinction spectrum of a nanocube-decorated substrate,
as monitored by a standard spectrophotometer (Cary 100),
is illustrated in Figure 1c. The spectrum is dominated by a
large peak with a maximum at λmax corresponding to the
quadripolar LSPR of the nanocubes.6 At these densities, some
nanocubes interact to form aggregates that appear as brighter
spots by darkfield microscopy (not shown) and in fluores-
cence images following coating by lipid membranes contain-
ing fluorophores for characterization (discussed below and
shown in Figure 2a). The large area illuminated by the
spectrophotometer (∼0.5 cm2) averages the response from
∼108 to 109 nanocubes, with many apparently remaining as
singular particles as judged by the aggregate extinction
spectrum. The resulting integrated signal from the ensemble
of nanocubes may reduce absolute sensitivity compared with
individual particle scattering spectra, as has been argued,30
but it greatly simplifies the comparison of different substrate
preparations, since ensemble averages are far more consistent
than the individual particle properties. This latter point proves
enabling in the present application.
It is possible to directly measure the response of SAM-
coated nanocubes to changes in the surrounding refractive
index (RI) by exposing the sensor to aqueous solutions of
glycerol and tracking the shift in position of λmax relative to
its initial wavelength in water alone. A plot of the shift of
the peak versus the refractive index of the surrounding
glycerol/water solution yields a sensitivity of 165 nm RI-1
(supplementary Figure 1 in Supporting Information). This
Figure 1. (a) Schematic of nanocubes with edge length d embeddedin the membrane substrate. A supported bilayer exists over glass,while a hybrid phospholipid/alkanethiol bilayer is over the silvernanocubes. (b) Representation of the flow chamber device used inthis work. The device is placed in the light path of a spectropho-tometer and allows easy exchange of solution surrounding thesubstrate. (c) Typical spectrum of a membrane-nanocube substrate,exhibiting the prominent quadripolar LSPR peak, λmax, used tomonitor spectral shifts.
2078 Nano Lett., Vol. 9, No. 5, 2009
is comparable to the ∼180-220 nm RI-1 sensitivity reported
for nanometric holes filled with lipid vesicles in a metal film
on glass,31 though less than that of microfabricated metal
nanostructures directly interacting with the solvent.11 It is
likely that further optimization of nanocube homogeneity and
deposition procedures can increase the observed value. Also,
since the evanescent field surrounding the nanocube decays
strongly with distance, some of the potential sensitivity of
the nanocube substrates may be lost due to the alkanethiol/
phospholipid coating. Indeed, shorter chain length alkanethiol
SAMs yield larger peak shifts in response to coating by lipids
(supplementary Figure 2 in Supporting Information) as
described below. The focused sensitivity is, however, an
advantage when the actual targets for sensing are molecular
monolayers.
To form a phospholipid membrane on the nanocube-coated
substrate, the flow chamber is filled with 50 mM Tris, 200
mM NaCl, and pH 7.5 buffer allowed to incubate for 30
min before rinsing with further buffer to remove loosely
adhered particles. A solution of lipid vesicles is injected into
the flow chamber in the Tris buffer and allowed to incubate
for an additional 30 min (shorter incubations than these are
also likely sufficient). During this time, vesicles rupture to
form a supported phospholipid bilayer over the bare glass
regions and a phospholipid monolayer over the alkanethiol-
modified nanocubes (supplementary Figure 3 in Supporting
Information). The bilayer and monolayer portions of the
membrane are continuous, since lipids diffuse freely over
the entire substrate as verified by experimental observations
described below. This structure is similar to that of other
hybrid bilayer membrane systems.32-34 Excess vesicles
remaining on the substrate are washed away with several
milliliters of 25 mM Tris, 100 mM NaCl, pH 7.5 buffer.
The vesicles consist primarily of 1,2-dioleoylphophotadyl-
choline (DOPC) along with 0.5 mol % Texas Red 1,2-
dihexadecanoyl-sn-glycero-3-phosphoethanolamine (TR-
DHPE, for fluorescence imaging) as well as 10 mol % of
(DOGS-NTA-Ni) or 3 mol % 1,2-dipalmitoyl-sn-glycero-
3-phosphoethanolamine-N-(biotinyl) (biotin-PE) as indicated
(TR-DHPE from Invitrogen; all others from Avanti Polar
Lipids). Vesicles are prepared by drying lipids dissolved in
CHCl3 in a round-bottom flask, suspending the dried lipid
film in water, and repeatedly passing the suspension through
a 100 nm pore filter in a high pressure extruder at 50 °C.
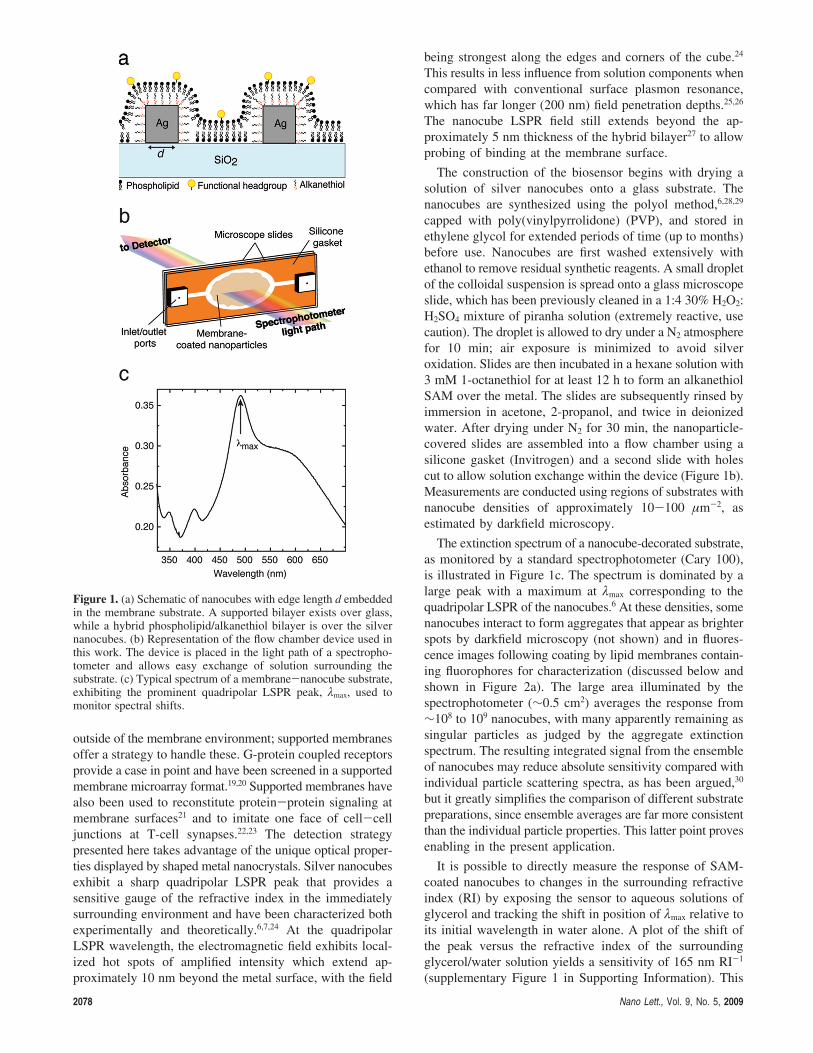
Coating the nanocubes with an alkanethiol SAM is
required to create a laterally fluid, continuous membrane over
the glass and metal substrate surface. This is demonstrated
by FRAP experiments, where fluorophores in a small region
of the substrate surface are bleached under high intensity
illumination in a microscope and recover with time due to
the lateral diffusion of membrane components (Figure 2a).
The nanocubes are clearly visible in the fluorescence images
due to fluorescence enhancement, discussed below. Notably,
when the nanocubes are functionalized with alkanethiol prior
to formation of the supported bilayer, these enhanced regions
of fluorescence bleach and recover in the same time scale
as the bulk of the supported membrane. This confirms that
lipids in the range of the nanocube surface plasmon are
diffusively connected to the rest of the membrane (Figure
2b). When the nanocubes are not functionalized with
alkanethiol SAMs, the surface and initial (t0) FRAP images
look qualitatively the same by microscopy, but the fluores-
cence of the nanocubes does not recover with time (supple-
mentary Figure 4 in Supporting Information). This illustrates
that the lipid material on nanocubes that remain uncoated
by an alkanethiol SAM is not continuous with the surround-
ing bilayer medium. Similar phenomena are well-known in
patterned metal/glass surfaces and have been used as a
method of patterning lipid membranes.35,36 The observation
that nanocubes without SAM coating do produce fluores-
cence enhancement but do not recover provides confirmatory
evidence that the enhancement seen from SAM-coated
nanocubes is resulting from lipids on the nanocube itself and
not the surrounding bilayer. The schematic sketch in Figure
1 is based on this experimental evidence. It should also be
noted that defects in the membrane are sure to exist; we know
only that they are of insufficient density to significantly
interfere with long-range diffusive transport.
Figure 2. (a) Fluorescence recovery after photobleaching (FRAP)experiment of a nanocube-membrane substrate. The lipids bleachedby intense illumination in the microscope as seen at t0 diffuse away,restoring the intensity over both supported and hybrid bilayerregions. Inset shows a wider view with the magnified regionhighlighted. (b) Normalized fluorescence recovery of lipids over ananocube or over glass. An immobile fraction of lipids and limitedobservation time account for the less than full recovery. Glass andnanocube regions recover exponentially (black lines) with half-lives of 5.6 and 6.3 min, respectively. (c) Peak shift of lipid-coatednanocubes. Polynomial fits of the quadripolar peak of the substratesin buffer before coating by lipids (solid line, with raw data shownas gray dots) and after addition of vesicles containing biotinylatedlipids and formation of bilayer/hybrid bilayer on the substrate(dashed line). The substrate is then exposed to 0.03 mg mL-1 bovineserum albumin, resulting in virtually no shift (dotted line). Theaddition of neutravidin, however, causes a substantial peak shiftas the protein binds to biotinylated lipids (dot/dash line). Smallvertical marks on the spectra denote the peak maximum (λmax) ofeach curve.
Nano Lett., Vol. 9, No. 5, 2009 2079

The nanocubes are seen clearly in fluorescence microscopy
images as objects that appear brighter than the surrounding
fluorescent supported bilayer (Figure 2a). There are several
potential causes for the high relative fluorescence intensity.
Nanocubes provide an excess of local surface area compared
to the flat substrate. However, the nanocubes are ap-
proximately 4-fold brighter than would be expected based
purely on the geometry of a monolayer-coated 100 nm cube
(see supplementary note in Supporting Information). One
explanation for this is that it is possible for fluorophores to
energetically couple to nearby plasmonic fields, resulting in
a localized enhancement of fluorescence intensity, even for
fluorophores without good spectral overlap between their
excitation spectrum and the plasmonic scattering profile.37,38
Another possible contributor to the increased intensity is high
local concentrations of lipidated fluorophores induced by the
metal surface potential, the high local curvature of the
membrane on the nanocube, and differences in lipid surface
density, as is observed in other membrane systems.39 All
these factors may exist simultaneously but are not distin-
guishable here and do not affect the sensing technique, which
is not fluorescence-based.
To measure small shifts in the LSPR-derived absorbance
spectrum of the sensor resulting from molecular binding, the
quadripolar absorbance peak is fit to a fifth order polynomial
function over a consistent sampling range. This allows the
precise determination of peak maximum position, and in the
present implementation at least 0.02 nm resolution is
achieved, as discussed below. In contrast to previous
examples of this approach, changes in the peak maximum
position (λmax, Figure 1c) are monitored rather than changes
in the peak centroid position40 or its absorbance,41 both of
which give less consistent data here. This is partly because
the arrays of nanoparticles are randomly ordered, and the
density of particles can vary from one array to another as
well as on a single substrate. The resulting variance in particle
density has a greater impact on the absolute absorbance of
the quadripolar peak than its position, and considering peak
position alone allows for simpler comparisons between sensor
substrates.
The levelofnonspecificbinding to themembrane-nanocube
substrates is extremely low compared with some previous
reports of LSPR-based membrane binding sensors.3 As seen
in Figure 2c, coating an alkanethiol-modified nanocube
substrate with phospholipids (96.5% DOPC, 3% biotin-cap-
PE, 0.5% TR-DHPE) results in a 2.40 nm shift in the
quadripolar peak. Subsequent addition of 0.03 mg mL-1
bovine serum albumin barely shifts the peak position by a
further 0.03 nm. Conversely, the addition of neutravidin,
which specifically binds to biotin-headgroup lipids incorpo-
rated into this membrane composition, results in a 1.26 nm
shift. This constitutes a signal/noise ratio of 42 over
nonspecific binding.
Molecular binding to the membrane surface can also be
monitored dynamically, enabling kinetic analyses. In the
example considered here, DOGS-NTA-Ni lipids provide the
binding functionalitysa membrane receptor for these pur-
posessin a membrane mixture of 89.5% DOPC, 10%
DOGS-NTA-Ni, and 0.5% TR-DHPE. The DOGS-NTA-Ni
lipids bind to a hexahistidine tag at the C-terminus of yellow
fluorescent protein (YFP).42 Other membrane-associated
species including membrane proteins, DNA/RNA, or lipid-
conjugated small molecules can also be readily used in this
configuration.43-45 The graph in Figure 3 (dark squares)
shows the shift in the LSPR peak position, λmax, as YFP
unbinds from a DOGS-NTA-Ni functionalized membrane.
The LSPR shift is directly related to protein density (right
axis) by the fluorescence of YFP, as discussed below. The
unbinding follows a biexponential decay with half-lives of
6.3 ( 0.3 and 320 ( 40 min, measured by the shift in LSPR
peak position. The error reported for these and similar
desorption fits is determined by the uncertainty of a least-
squares fit to a biexponential decay model performed in
OriginPro (OriginLabs). These results are consistent with
previous characterizations of protein/DOGS-NTA-Ni mem-
brane binding which show that polyhistidine-tagged proteins
exist in both loosely bound and tightly bound states. The
two binding states result in two characteristic desorption time
scales, the shorter of which is independent of DOGS-NTA-
Ni density and has previously been measured to be ∼6 min
for other hexahistidine proteins.46 In the absence of DOGS-
NTA-Ni lipids, the supported membrane strongly resists
nonspecific adsorption of the YFP protein and no substantial
peak shift is seen (Figure 3, open squares). The time
resolution of these kinetic measurements is determined only
by the acquisition rate of the spectrophotometer. In this case
it is ∼50 s per spectrum, but much faster rates are possible,
since the scattering-based readout means one may simply
raise illumination intensity to increase signal strength and
acquisition speed.
The LSPR-based measurements are compared to fluores-
cence from YFP on the membrane surface, which is directly
monitored by microscopy in a glass-bottomed 96 well plate
format (Nalge-Nunc). This configuration is chosen to com-
Figure 3. YFP unbinding monitored by LSPR peak shift. Observedshift in λmax position compared with t ) 0 for a nanocube-embeddedbilayer with (dark squares) or without (open squares) DOGS-NTA-Ni lipids. The line is a least-squares fit of the equation y ) A exp[-t/a] + B exp[-t/b] + y0 to the data where y is the shift in λmax andt is time. The indicated triangle denotes the observed peak shiftupon addition of EDTA, which removes all remaining YFP anddefines y0. The remaining terms are found by the fitting procedure.The right-hand axis is the calculated protein density by consideringthe fluorescence of YFP bound to identical bilayers as outlined inthe text.
2080 Nano Lett., Vol. 9, No. 5, 2009

pare the data from the nanocube hybrid membranes to
conventional supported membranes without nanocubes.
Membranes are of the same compositions as those used with
the LSPR measurements and are formed similarly as
described elsewhere.46 After samples are loaded with YFP,
fluorescence microscopy images are taken of different regions
of several replicate bilayers over the course of time, with
manual rinsing of wells between each image acquisition
(Nikon TE-300 equipped with a high-pressure Hg lamp and
Chroma 31001 filter set). The intensity of the fluorescence
microscopy images is proportional to the amount of YFP
on the surface. These data show that YFP desorbs from the
membrane biexponentially with half-lives of 7 ( 1 and 80
( 8 min-1 (Figure 4), which essentially agrees with the
LSPR-based measurements. Variation in the longer half-lives
may result from the slightly different experimental configu-
rations used for experimental convenience.
The fluorescence microscopy images used above also
provide a direct way to estimate the amount of protein bound
to the membrane, and thus the sensitivity of the LSPR assay.
The absolute surface density of protein can be measured
using a set of bilayer calibration standards containing varying
concentrations of BODIPY-DHPE lipid (Invitrogen), which
provide the relationship between fluorescence intensity and
surface density of fluorophore. The intensity of YFP can be
scaled to be directly comparable to that of BODIPY-DHPE,
which allows the density of YFP to be inferred.47 This
analysis shows that initial protein density on the bilayer is
approximately 21000 µm-2 and decreases over the course
of the experiment to approximately 2000 µm-2 (Figure 4).
Since the membranes for fluorescence and LSPR measure-
ments are the same, the fluorescence quantification may be
used for the protein density scale in Figure 3. This direct
mapping is further supported by the similar desorption
kinetics of two membranes (supplementary Figure 5 in
Supporting Information) and illustrates that the LSPR sensor
can read out a wide range of bound protein densities. Thus,
if properly calibrated, LSPR measurements provide a quan-
titative measurement of protein on the sensor surface. In this
case, the change in protein density corresponds to a change
in mass of 120 ng cm-2 and a response factor of ap-
proximately 170 nm cm2 ng-1 for the LSPR measurements.
Replicate sensor substrates made with the same batch of
nanocubes have similar sensitivities.
An estimate of sensor noise is found by considering data
from the negative control bilayer (without DOGS-NTA-Ni),
shown in Figure 3 (open squares), where protein binding to
the membrane does not occur. The first 60 measurements
have a standard deviation of 0.02 nm, which corresponds to
a mass density of 1.5 ng cm-2 by applying the sensitivity of
170 nm cm2 ng-1. This also results in a calculated limit of
detection (3× noise)48 of 4.5 ng cm-2. The 0.02 nm value
also provides an upper limit to the noise of the polynomial
peak fitting method described abovesthe true resolution is
likely much finer. While the limit of detection of supported
bilayers formed in microfabricated nanoscale holes in metal
films on glass is reported to be 0.1 ng cm-2,41 the numbers
quoted for the nanocube membrane sensor here represent
an unoptimized initial observation that is likely to be
surpassed by further sensor development. Fundamentally the
underlying optical physics is the same, so similar sensitivities
are likely achievable in all formats.
Many implementations of nanostructure-based sensors require
complicated nanostructured templates and device fabrication.
Realization of this sensor only requires simple-to-manufacture,
self-assembled nanocube/bilayer detection surfaces, along with
a standard absorbance spectrophotometer. The membrane-coated
nanocube substrates are also potentially very easy to multiplex.
Rather than a dedicated flow chamber as used here, it should
be possible to realize the same basic system using glass-
bottomed 96 well plates and an optical plate reader (e.g., high-
resolution models from Molecular Devices, BMGLabtech, and
Biotek, among others). This allows easy multiplexing and
scalability of the technique, since nanocube deposition, modi-
fication, and membrane coating could all be performed in an
individual well whose spectrum is read out independently and
analyzed as above. The membrane functionality of this tech-
nique allows readout of binding in an environment very different
than that in solution or provided in most standard SPR formats.
Some applications may not require the membrane environment
itself, but membrane resistance to nonspecific binding (espe-
cially of proteins) may still prove useful as a scaffold for
monitoring natively soluble proteins interacting with each other.
Acknowledgment. This work was supported by the
Chemical Sciences, Geosciences, and Biosciences Division,
Office of Basic Energy Sciences, U.S. Department of Energy
under Contract Number DE-AC03-76SF00098 and NIH.
Supporting Information Available: Supporting figures
and note. This material is available free of charge via the
Internet at http://pubs.acs.org.
References(1) Willets, K. A.; Van Duyne, R. P. Annu. ReV. Phys. Chem. 2007, 58,
267–297.(2) Kelly, K.; Coronado, E.; Zhao, L.; Schatz, G. J. Phys. Chem. B 2003,
107, 668–677.
Figure 4. Change in YFP density monitored by fluorescence.Observed change in density of YFP on bilayers with (dark squares)or without (open squares) DOGS-NTA-Ni headgroup lipids. Theline represents a fit as in Figure 3, with y0 corresponding to adecrease in YFP density (-21000 µm-2) resulting in loss of allbound protein.
Nano Lett., Vol. 9, No. 5, 2009 2081

(3) Baciu, C. L.; Becker, J.; Janshoff, A.; Sonnichsen, C. Nano Lett. 2008,8, 1724–1728.
(4) Yonzon, C. R.; Jeoungf, E.; Zou, S. L.; Schatz, G. C.; Mrksich, M.;Van Duyne, R. P. J. Am. Chem. Soc. 2004, 126, 12669–12676.
(5) Prikulis, J.; Hanarp, P.; Olofsson, L.; Sutherland, D.; Kall, M. Nano
Lett. 2004, 4, 1003–1007.(6) Tao, A.; Sinsermsuksakul, P.; Yang, P. D. Angew. Chem., Int. Ed.
2006, 45, 4597–4601.(7) Tao, A.; Sinsermsuksakul, P.; Yang, P. Nat. Nanotechnol. 2007, 2,
435–440.(8) Haes, A.; Chang, L.; Klein, W.; VanDuyne, R. J. Am. Chem. Soc.
2005, 127, 2264–2271.(9) Zhao, J.; Das, A.; Zhang, X.; Schatz, G.; Sligar, S.; VanDuyne, R.
J. Am. Chem. Soc. 2006, 128, 11004–11005.(10) Haes, A. J.; Zou, S. L.; Schatz, G. C.; Van Duyne, R. P. J. Phys.
Chem. B 2004, 108, 6961–6968.(11) Hicks, E. M.; Zhang, X.; Zou, S.; Lyandres, O.; Spears, K. G.; Schatz,
G. C.; Van Duyne, R. P. J. Phys. Chem. B 2005, 109, 22351–22358.(12) Rindzevicius, T.; Alaverdyan, Y.; Dahlin, A.; Hook, F.; Sutherland,
D. S.; Kall, M. Nano Lett. 2005, 5, 2335–2339.(13) Handbook of surface plasmon resonance; Schasfoort, R. B., Tudos,
A. J., Eds.; Royal Society of Chemistry: Cambridge, 2008.(14) Drews, J. Science 2000, 287, 1960–1964.(15) Yildirim, M. A.; Goh, K.-I.; Cusick, M. E.; Barabasi, A.-L.; Vidal,
M. Nat. Biotechnol. 2007, 25, 1119–1126.(16) Sackmann, E. Science 1996, 271, 43–48.(17) Groves, J. T. Curr. Opin. Drug DiscoVery DeV. 2002, 5, 606–612.(18) Tanaka, M.; Sackmann, E. Nature (London) 2005, 437, 656–663.(19) Bieri, C.; Ernst, O. P.; Heyse, S.; Hofmann, K. P.; Vogel, H. Nat.
Biotechnol. 1999, 17, 1105–1108.(20) Fang, Y.; Frutos, A. G.; Lahiri, J. ChemBioChem 2002, 3, 987–991.(21) Gureasko, J.; Galush, W. J.; Boykevisch, S.; Sondermann, H.; Bar-
Sagi, D.; Groves, J. T.; Kuriyan, J. Nat. Struct. Mol. Biol. 2008, 15,452–461.
(22) Groves, J. T.; Dustin, M. L. J. Immunol. Methods 2003, 278, 19–32.(23) Mossman, K. D.; Campi, G.; Groves, J. T.; Dustin, M. L. Science
2005, 310, 1191–1193.(24) Sherry, L. J.; Chang, S. H.; Schatz, G. C.; Van Duyne, R. P.; Wiley,
B. J.; Xia, Y. N. Nano Lett. 2005, 5, 2034–2038.(25) Jung, L.; Campbell, C.; Chinowsky, T.; Mar, M.; Yee, S. Langmuir
1998, 14, 5636–5648.(26) Zhou, Y.; Xu, H.; Dahlin, A. B.; Vallkil, J.; Borrebaeck, C. A. K.;
Wingren, C.; Liedberg, B.; Hook, F. Biointerphases 2007, 2, 6–15.
(27) Leonenko, Z. V.; Finot, E.; Ma, H.; Dahms, T. E. S.; Cramb, D. T.
Biophys. J. 2004, 86, 3783–3793.(28) Fievet, F.; Lagier, J. P.; Blin, B.; Beaudoin, B.; Figlarz, M. Solid State
Ionics 1989, 32-33, 198-–205.(29) Sun, Y.; Xia, Y. Science 2002, 298, 2176–2179.(30) Anker, J. N.; Hall, W. P.; Lyandres, O.; Shah, N. C.; Zhao, J.; Van
Duyne, R. P. Nat. Mater. 2008, 7, 442–453.(31) Dahlin, A. B.; Jonsson, M. P.; Hook, F. AdV. Mater. 2008, 20, 1436-
+.(32) Meuse, C. W.; Niaura, G.; Lewis, M. L.; Plant, A. L. Langmuir 1998,
14, 1604–1611.(33) Kastl, K.; Ross, M.; Gerke, V.; Steinem, C. Biochemistry 2002, 41,
10087–10094.(34) Jackson, B. L.; Nye, J. A.; Groves, J. T. Langmuir 2008, 24, 6189–
6193.(35) Groves, J. T.; Ulman, N.; Boxer, S. G. Science 1997, 275, 651–653.(36) Groves, J. T.; Ulman, N.; Cremer, P. S.; Boxer, S. G. Langmuir 1998,
14, 3347–3350.(37) Haes, A.; Zou, S.; Zhao, J.; Schatz, G.; VanDuyne, R. J. Am. Chem.
Soc. 2006, 128, 10905–10914.(38) Zhang, J.; Fu, Y.; Chowdhury, M. H.; Lakowicz, J. R. J. Phys. Chem.
C 2008, 112, 9172–9180.(39) Sanii, B.; Parikh, A. N. Soft Matter 2007, 3, 974–977.(40) Nenninger, G. G.; Piliarik, M.; Homola, J. Meas. Sci. Technol. 2002,
13, 2038–2046.(41) Dahlin, A. B.; Tegenfeldt, J. O.; Hook, F. Anal. Chem. 2006, 78, 4416–
4423.(42) Ormo, M.; Cubitt, A. B.; Kallio, K.; Gross, L. A.; Tsien, R. Y.;
Remington, S. J. Science 1996, 273, 1392–1395.(43) Salafsky, J.; Groves, J. T.; Boxer, S. G. Biochemistry 1996, 35, 14773–
14781.(44) Yoshina-Ishii, C.; Boxer, S. G. J. Am. Chem. Soc. 2003, 125, 3696–
3697.(45) Parthasarathy, R.; Groves, J. T. Proc. Natl. Acad. Sci. U.S.A. 2004,
101, 12798–12803.(46) Nye, J. A.; Groves, J. T. Langmuir 2008, 24, 4145–4149.(47) Galush, W. J.; Nye, J. A.; Groves, J. T. Biophys. J. 2008, 95, 2512–
2519.(48) Homola, J. Chem. ReV. 2008, 108, 462–493.
NL900513K
2082 Nano Lett., Vol. 9, No. 5, 2009
Copyright © 2022 FDOKUMEN