
Blue phase III widening in CE6-dispersed surface-functionalised CdSe nanoparticles
8
Liquid Crystals, Vol. 37, No. 11, November 2010, 1419–1426 Blue phase III widening in CE6-dispersed surface-functionalised CdSe nanoparticles George Cordoyiannis a,b∗ , Patricia Losada-Pérez a , Chandra Shekhar Pati Tripathi a , Brigita Rožiˇ c b , Uroš Tkalec b , Vassilios Tzitzios c , Eva Karatairi c,d , George Nounesis c , Zdravko Kutnjak b , Igor Muševiˇ c b , Christ Glorieux a , Samo Kralj b,e and Jan Thoen a a Laboratorium voor Akoestiek en Thermische Fysica, Departement Natuurkunde en Sterrenkunde, Katholieke Universiteit Leuven, Leuven, Belgium; b Condensed Matter Physics Department, Jožef Stefan Institute, Ljubljana, Slovenia; c National Centre for Scientific Research ‘Demokritos’, Aghia Paraskevi, Greece; d Department of Materials Science, University of Patras, Patras, Greece; e Department of Physics, University of Maribor, Maribor, Slovenia (Received 28 May 2010; final version received 24 August 2010) The phase transition behaviour of the chiral liquid crystal CE6 doped with spherical surface-functionalised CdSe nanoparticles has been examined by means of high-resolution adiabatic scanning calorimetry and polarising microscopy. The addition of nanoparticles results in an essentially stabilised blue phase III. The phase diagram is displayed upon heating and cooling and the enthalpy changes involved in the conversion between the blue phases are determined. The dispersion of functionalised nanoparticles is prominent for the stabilisation of blue phase III, which is potentially useful for applications, especially if applied on liquid crystals that exhibit blue phases close to room temperature. Keywords: adiabatic scanning calorimetry; polarising microscopy; liquid crystals; blue phases; nanoparticles 1. Introduction More than one century ago, in his famous arti- cle on the properties of cholesterol, F. Reinitzer reported splendid colour phenomena occurring before the solidification of cholesteryl acetate and other cholesterol derivatives [1]. What Reinitzer observed as reflections of green, changing to blue in a sam- ple sandwiched between glass plates was the presence of the, unknown at that time, blue phases (BPs). BPs exist within a narrow temperature range between the isotropic (I) and the cholesteric or chiral nematic (N ∗ ) phase of some chiral liquid crystals [2]. In order of decreasing temperature, three distinct BPs appear, which are classified as blue phase III (BPIII), blue phase II (BPII) and blue phase I (BPI). The BPIII is amorphous, while the BPII and BPI possess simple cubic and body-centred cubic symmetry, respectively [3–6]. These phases have been extensively studied both experimentally, by means of optical [7, 8] and calori- metric techniques [9, 10], and theoretically [11–15]. In addition, phase diagrams have been proposed as a function of chirality. The strength of chirality holds a key role for the existence of a critical point of liquid-gas type in the I–BPIII phase transition [16–18]. Besides the fundamental aspects and critical phenom- ena, BPs exhibit an exceptional potential for applica- tions in photonics and the display industry [19–21]. Nevertheless, their use is hampered due to the narrow temperature range in which they usually appear. As ∗ Corresponding author. Email: [email protected] a consequence, the stabilisation of BPs has been the subject of a broad research interest for several years, in terms of both experimental and theoretical studies [22–32]. Very recently, a pure compound with a wide-range BPIII has been reported, albeit only on cooling [33, 34]. Simultaneously, various efforts have been made to stabilise the BPs in mixtures of liquid crystals and various types of nanoparticles, such as Au, CdSe and aerosils [35, 36]. In this paper we report on the exper- imental results of several mixtures composed of a chiral liquid crystal and CdSe nanoparticles. High- resolution adiabatic scanning calorimetry (ASC) and optical polarising microscopy have been applied for a systematic study of these mixtures. It is demonstrated that the BPIII is greatly stabilised by the presence of nanoparticles, while the BPII gradually disappears and the BPI is rather weakly affected. 2. Materials and methods The liquid crystal S-(+)-4-(2-methylbutyl)phenyl-4- decyloxybenzoate (CE6) was supplied by BDH, UK, stored carefully and used without any further treat- ment. It exhibits all three BPs and, moreover, a smectic A (SmA) phase prior to crystallisation. The chemical formula of CE6 is shown in the top part of Figure 1. As a guide for its transition temperatures we have used the data of previous pure CE6 measurements by ISSN 0267-8292 print/ISSN 1366-5855 online © 2010 Taylor & Francis DOI: 10.1080/02678292.2010.519057 http://www.informaworld.com
-
Upload
independent -
Category
Documents
-
view
1 -
download
0
Transcript of Blue phase III widening in CE6-dispersed surface-functionalised CdSe nanoparticles
Liquid Crystals,Vol. 37, No. 11, November 2010, 1419–1426
Blue phase III widening in CE6-dispersed surface-functionalised CdSe nanoparticles
George Cordoyiannisa,b∗, Patricia Losada-Péreza, Chandra Shekhar Pati Tripathia, Brigita Rožicb, Uroš Tkalecb,Vassilios Tzitziosc, Eva Karatairic,d, George Nounesisc, Zdravko Kutnjakb, Igor Muševicb, Christ Glorieuxa,Samo Kraljb,e and Jan Thoena
aLaboratorium voor Akoestiek en Thermische Fysica, Departement Natuurkunde en Sterrenkunde, Katholieke Universiteit Leuven,Leuven, Belgium; bCondensed Matter Physics Department, Jožef Stefan Institute, Ljubljana, Slovenia; cNational Centre forScientific Research ‘Demokritos’, Aghia Paraskevi, Greece; dDepartment of Materials Science, University of Patras, Patras,Greece; eDepartment of Physics, University of Maribor, Maribor, Slovenia
(Received 28 May 2010; final version received 24 August 2010)
The phase transition behaviour of the chiral liquid crystal CE6 doped with spherical surface-functionalised CdSenanoparticles has been examined by means of high-resolution adiabatic scanning calorimetry and polarisingmicroscopy. The addition of nanoparticles results in an essentially stabilised blue phase III. The phase diagram isdisplayed upon heating and cooling and the enthalpy changes involved in the conversion between the blue phasesare determined. The dispersion of functionalised nanoparticles is prominent for the stabilisation of blue phase III,which is potentially useful for applications, especially if applied on liquid crystals that exhibit blue phases close toroom temperature.
Keywords: adiabatic scanning calorimetry; polarising microscopy; liquid crystals; blue phases; nanoparticles
1. Introduction
More than one century ago, in his famous arti-cle on the properties of cholesterol, F. Reinitzerreported splendid colour phenomena occurring beforethe solidification of cholesteryl acetate and othercholesterol derivatives [1]. What Reinitzer observedas reflections of green, changing to blue in a sam-ple sandwiched between glass plates was the presenceof the, unknown at that time, blue phases (BPs). BPsexist within a narrow temperature range between theisotropic (I) and the cholesteric or chiral nematic(N∗) phase of some chiral liquid crystals [2]. In orderof decreasing temperature, three distinct BPs appear,which are classified as blue phase III (BPIII), bluephase II (BPII) and blue phase I (BPI). The BPIII isamorphous, while the BPII and BPI possess simplecubic and body-centred cubic symmetry, respectively[3–6]. These phases have been extensively studied bothexperimentally, by means of optical [7, 8] and calori-metric techniques [9, 10], and theoretically [11–15].In addition, phase diagrams have been proposed as afunction of chirality. The strength of chirality holdsa key role for the existence of a critical point ofliquid-gas type in the I–BPIII phase transition [16–18].Besides the fundamental aspects and critical phenom-ena, BPs exhibit an exceptional potential for applica-tions in photonics and the display industry [19–21].Nevertheless, their use is hampered due to the narrowtemperature range in which they usually appear. As
∗Corresponding author. Email: [email protected]
a consequence, the stabilisation of BPs has been thesubject of a broad research interest for several years,in terms of both experimental and theoretical studies[22–32].
Very recently, a pure compound with a wide-rangeBPIII has been reported, albeit only on cooling [33,34]. Simultaneously, various efforts have been madeto stabilise the BPs in mixtures of liquid crystals andvarious types of nanoparticles, such as Au, CdSe andaerosils [35, 36]. In this paper we report on the exper-imental results of several mixtures composed of achiral liquid crystal and CdSe nanoparticles. High-resolution adiabatic scanning calorimetry (ASC) andoptical polarising microscopy have been applied for asystematic study of these mixtures. It is demonstratedthat the BPIII is greatly stabilised by the presence ofnanoparticles, while the BPII gradually disappears andthe BPI is rather weakly affected.
2. Materials and methods
The liquid crystal S-(+)-4-(2-methylbutyl)phenyl-4-decyloxybenzoate (CE6) was supplied by BDH, UK,stored carefully and used without any further treat-ment. It exhibits all three BPs and, moreover, a smecticA (SmA) phase prior to crystallisation. The chemicalformula of CE6 is shown in the top part of Figure 1.As a guide for its transition temperatures we haveused the data of previous pure CE6 measurements by
ISSN 0267-8292 print/ISSN 1366-5855 online© 2010 Taylor & FrancisDOI: 10.1080/02678292.2010.519057http://www.informaworld.com
1420 G. Cordoyiannis et al.
CE6 liquid crystal
CdSe nanoparticles
tri-octyl phosphine
oleyl amine
2R ~ 4.5 nm
OO
O
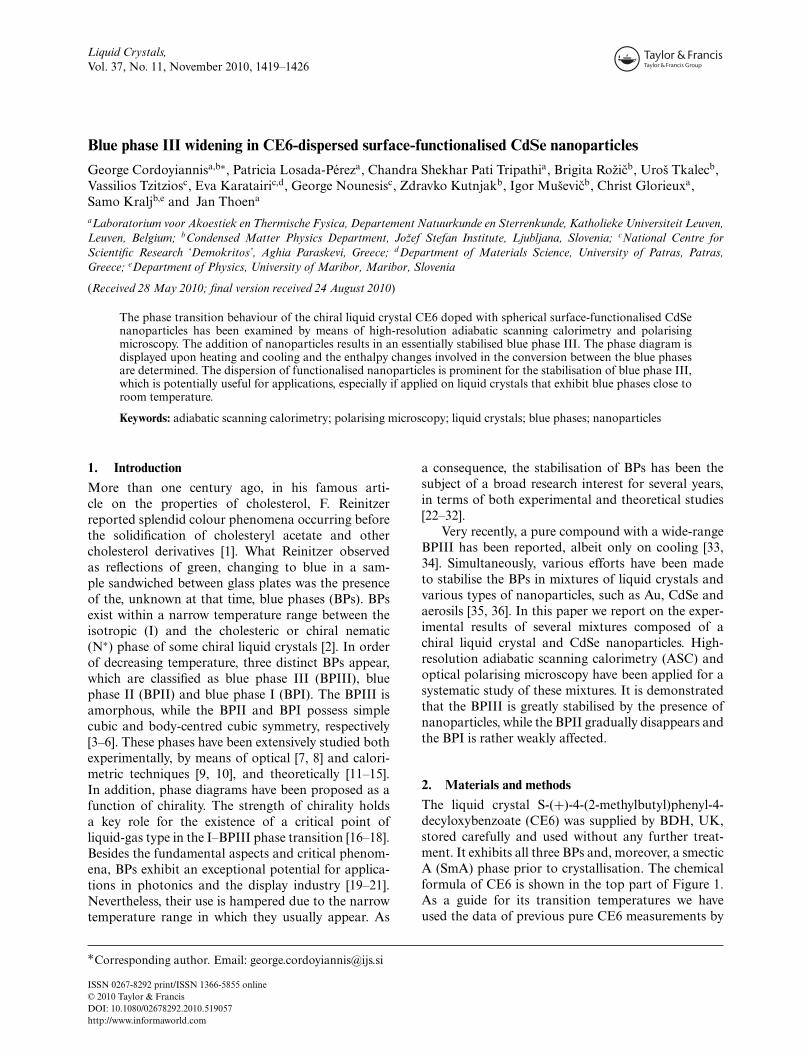
Figure 1. The chemical formula of the liquid crystal CE6is presented in the top part. In the bottom part, a simpleschematic representation of the CdSe nanoparticles surface-treated with oleyl amine and tri-octyl phosphine is shown.The diameter of the nanoparticles core is 2R ∼ 4.5 nm.
means of optical microscopy [37] and ASC [38]. TheCdSe nanoparticles were synthesised at the NationalCentre for Scientific Research ‘Demokritos’. They areof spherical shape and have an average diameter 2R ∼4.5 nm. Their surface was treated with hydropho-bic oleyl amine and tri-octyl phosphine. A simpleschematic representation of these particles is given inthe bottom part of Figure 1, while details on theirsynthesis can be found elsewhere [39]. They are welldispersed in non-polar solvents such us toluene andthey exhibit a narrow size distribution as has beenconfirmed by transmission electron microscopy mea-surements [36, 39].
Apart from the pure CE6, several mixtures withCdSe nanoparticles were prepared, namely x = 0.0005,0.005 and 0.02, where x is the ratio of the mass ofnanoparticles to the mass of CE6. Prior to preparationof the mixture, the solution (in toluene) of the CdSenanoparticles was inserted in an ultrasonic bath for 1 hto eliminate any possible aggregation. Afterwards, theliquid crystal and the nanoparticles were thoroughlymixed for at least 3 days in highly pure toluene, bycontinuous stirring and periodical sonification of thesolution. After the toluene had fully evaporated, thesamples were placed in the calorimetric cells.
Heating and cooling runs on pure CE6 and onall mixtures were carried out using high-resolutionASC. The ASC apparatus was fully computerisedand consisted of four stages, the first being the sam-ple cell and the other three the surrounding shields.For the current measurements the inner stage was a22 g tantalum cell, which contained approximately1.7 g of sample. The heat capacity of the empty cellwas measured in a separate control experiment. Itwas then subtracted from the total heat capacity (ofthe sample and cell) and the result was divided by
the sample mass in order to derive the net specificheat capacity of the sample. Apart from the sam-ple, the cell also contained a stirring ball made ofstainless steel. By continuously changing the incli-nation of the apparatus during the experiment, thestirring ball moved back and forth in order to main-tain the homogeneity of the mixture and to eliminateany temperature gradients within the sample. In orderto reduce the thermal coupling between the variousstages and attain optimal thermal insulation, the spacebetween the cell and the three surrounding shields wasvacuum-pumped.
In ASC, very slow scanning rates can be achieved.In the principal mode of operation (heating or cool-ing), each run yields the temperature dependence ofboth the heat capacity Cp and the enthalpy H. ASCcan easily distinguish between continuous (second-order) and discontinuous (first-order) transitions. Oneimportant feature of this technique is that in its prin-cipal mode of operation it applies a constant heatingor cooling power instead of a constant scanning rate.This leads to a substantial decrease of the scanningrate in the coexistence region of a first-order transi-tion, since the applied power is dissipated not onlyfor the temperature change of the sample but also forthe change between the two coexisting phases. Thedecrease of the scanning rate provides excellent res-olution data and the latent heat can be accuratelydetermined when present. The precision of the tech-nique is better than 2 mJ g−1; hence, it is ideal forstudies of BPs that involve small heat transitions andthe reproduction of the respective phase diagrams.A more detailed description of ASC can be foundelsewhere [40, 41].
Complementary microscopic observations wereperformed in order to obtain images of the BPs ofpure CE6 and one of the larger CdSe concentration.A Nikon Eclipse E600 polarising microscope and aPixelink PL-A741 camera were used. For these mea-surements the samples were sandwiched between glassplates, and then placed on an Instec model STC-200heating stage with a temperature stability of 0.1 K and,subsequently, examined under crossed polarisers.
3. Results and discussion
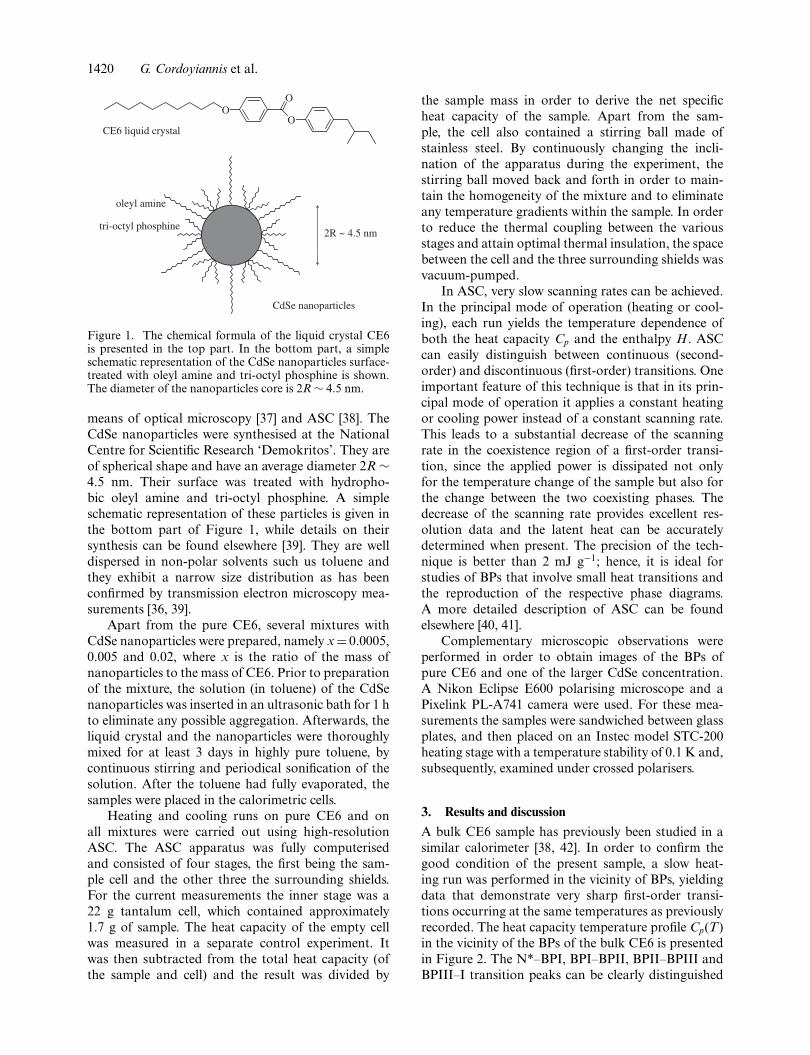
A bulk CE6 sample has previously been studied in asimilar calorimeter [38, 42]. In order to confirm thegood condition of the present sample, a slow heat-ing run was performed in the vicinity of BPs, yieldingdata that demonstrate very sharp first-order transi-tions occurring at the same temperatures as previouslyrecorded. The heat capacity temperature profile Cp(T)in the vicinity of the BPs of the bulk CE6 is presentedin Figure 2. The N*–BPI, BPI–BPII, BPII–BPIII andBPIII–I transition peaks can be clearly distinguished
Liquid Crystals 1421
100000
80000
60000
40000
20000
0
Cp
(Jkg
–1K
–1)
CE6 BPIII−I
BPII−BPIII
BPI−BPIIN*−BPI
317.8 318.0 318.2 318.4 318.6
T (K)
Figure 2. The heat capacity temperature profile Cp(T) for aheating run of pure CE6 in the vicinity of BPs. From left toright (i.e. on increasing the temperature) the N∗–BPI, BPI–BPII, BPII–BPIII and BPIII–I phase transitions can be seen.A slow scanning rate of 0.019 K h−1 was used.
upon raising the temperature. Due to the first-ordercharacter of these transitions, very high effective heatcapacity values are observed in this figure. Afterwards,the mixtures of the above-mentioned concentrationswere measured on cooling and heating. First, a coolingrun was performed down to the SmA phase and thena slower heating run was carried out in a short tem-perature range to obtain high-resolution data allowingfor a precise determination of the enthalpy changesrelated to BPs. In Table 1 information on the typeof run and the scanning rate is given for the mea-surements of pure CE6 and its mixtures with CdSenanoparticles.
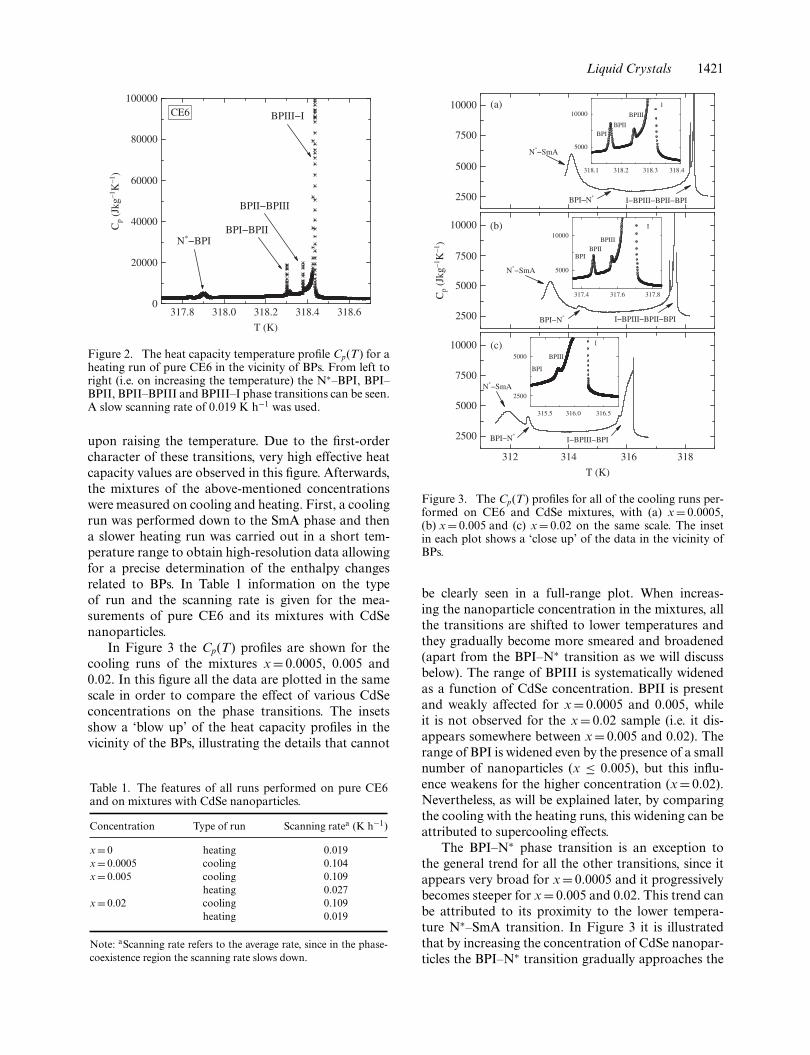
In Figure 3 the Cp(T) profiles are shown for thecooling runs of the mixtures x = 0.0005, 0.005 and0.02. In this figure all the data are plotted in the samescale in order to compare the effect of various CdSeconcentrations on the phase transitions. The insetsshow a ‘blow up’ of the heat capacity profiles in thevicinity of the BPs, illustrating the details that cannot
Table 1. The features of all runs performed on pure CE6and on mixtures with CdSe nanoparticles.
Concentration Type of run Scanning ratea (K h−1)
x = 0 heating 0.019x = 0.0005 cooling 0.104x = 0.005 cooling 0.109
heating 0.027x = 0.02 cooling 0.109
heating 0.019
Note: aScanning rate refers to the average rate, since in the phase-coexistence region the scanning rate slows down.
10000
7500
5000
2500
10000
7500
5000
2500
10000
7500
5000
2500C
p (J
kg–1
K–1
)
(a)
(b)
(c)
10000
5000
10000
5000
5000
BPIII
BPIII
BPIII
BPII
BPII
BPI
BPI
BPI
318.1 318.2 318.3 318.4
BPI−N*I−BPIII−BPII−BPI
N*−SmA
N*−SmA
N*−SmA
317.4 317.6 317.8
2500
315.5 316.0 316.5
BPI−N*
BPI−N* I−BPIII−BPII−BPI
I−BPIII−BPI
312 314 316 318
T (K)
I
Figure 3. The Cp(T) profiles for all of the cooling runs per-formed on CE6 and CdSe mixtures, with (a) x = 0.0005,(b) x = 0.005 and (c) x = 0.02 on the same scale. The insetin each plot shows a ‘close up’ of the data in the vicinity ofBPs.
be clearly seen in a full-range plot. When increas-ing the nanoparticle concentration in the mixtures, allthe transitions are shifted to lower temperatures andthey gradually become more smeared and broadened(apart from the BPI–N∗ transition as we will discussbelow). The range of BPIII is systematically widenedas a function of CdSe concentration. BPII is presentand weakly affected for x = 0.0005 and 0.005, whileit is not observed for the x = 0.02 sample (i.e. it dis-appears somewhere between x = 0.005 and 0.02). Therange of BPI is widened even by the presence of a smallnumber of nanoparticles (x ≤ 0.005), but this influ-ence weakens for the higher concentration (x = 0.02).Nevertheless, as will be explained later, by comparingthe cooling with the heating runs, this widening can beattributed to supercooling effects.
The BPI–N∗ phase transition is an exception tothe general trend for all the other transitions, since itappears very broad for x = 0.0005 and it progressivelybecomes steeper for x = 0.005 and 0.02. This trend canbe attributed to its proximity to the lower tempera-ture N∗–SmA transition. In Figure 3 it is illustratedthat by increasing the concentration of CdSe nanopar-ticles the BPI–N∗ transition gradually approaches the
1422 G. Cordoyiannis et al.
N∗–SmA anomaly. For the x = 0.02 mixture, in par-ticular, the BPI–N∗ transition is already superimposedon the pretransitional wing of the N∗–SmA transition.Hence, the supercooled BP ordering undergoes a tran-sition into an N∗ phase with substantial SmA order,resulting in a much steeper BPI–N∗ peak compared tothe x ≤ 0.005 mixtures.
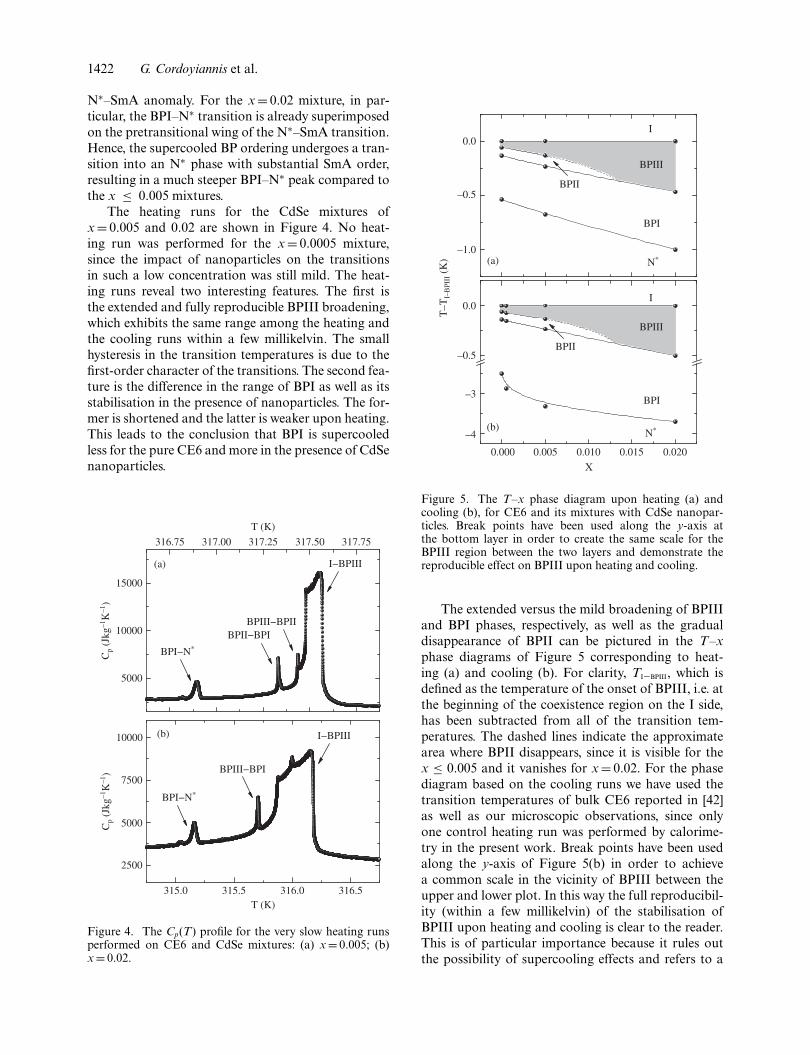
The heating runs for the CdSe mixtures ofx = 0.005 and 0.02 are shown in Figure 4. No heat-ing run was performed for the x = 0.0005 mixture,since the impact of nanoparticles on the transitionsin such a low concentration was still mild. The heat-ing runs reveal two interesting features. The first isthe extended and fully reproducible BPIII broadening,which exhibits the same range among the heating andthe cooling runs within a few millikelvin. The smallhysteresis in the transition temperatures is due to thefirst-order character of the transitions. The second fea-ture is the difference in the range of BPI as well as itsstabilisation in the presence of nanoparticles. The for-mer is shortened and the latter is weaker upon heating.This leads to the conclusion that BPI is supercooledless for the pure CE6 and more in the presence of CdSenanoparticles.
T (K)
Cp
(Jkg
–1K
–1)
Cp
(Jkg
–1K
–1)
15000
10000
10000
7500
5000
2500
5000
316.75 317.00 317.25 317.50 317.75
I−BPIII
I−BPIII
BPIII−BPII
BPIII−BPI
BPII−BPI
BPI−N*
BPI−N*
(a)
(b)
315.0 315.5 316.0 316.5T (K)
Figure 4. The Cp(T) profile for the very slow heating runsperformed on CE6 and CdSe mixtures: (a) x = 0.005; (b)x = 0.02.
0.0
–0.5
–1.0
0.0
–0.5
–3
–4T
–TI–
BPI
II (
K) (a)
(b)
BPII
BPII
BPIII
BPIII
BPI
BPI
N*
N*
I
X
I
0.000 0.005 0.010 0.015 0.020
Figure 5. The T–x phase diagram upon heating (a) andcooling (b), for CE6 and its mixtures with CdSe nanopar-ticles. Break points have been used along the y-axis atthe bottom layer in order to create the same scale for theBPIII region between the two layers and demonstrate thereproducible effect on BPIII upon heating and cooling.
The extended versus the mild broadening of BPIIIand BPI phases, respectively, as well as the gradualdisappearance of BPII can be pictured in the T–xphase diagrams of Figure 5 corresponding to heat-ing (a) and cooling (b). For clarity, TI−BPIII, which isdefined as the temperature of the onset of BPIII, i.e. atthe beginning of the coexistence region on the I side,has been subtracted from all of the transition tem-peratures. The dashed lines indicate the approximatearea where BPII disappears, since it is visible for thex ≤ 0.005 and it vanishes for x = 0.02. For the phasediagram based on the cooling runs we have used thetransition temperatures of bulk CE6 reported in [42]as well as our microscopic observations, since onlyone control heating run was performed by calorime-try in the present work. Break points have been usedalong the y-axis of Figure 5(b) in order to achievea common scale in the vicinity of BPIII between theupper and lower plot. In this way the full reproducibil-ity (within a few millikelvin) of the stabilisation ofBPIII upon heating and cooling is clear to the reader.This is of particular importance because it rules outthe possibility of supercooling effects and refers to a
Liquid Crystals 1423
Table 2. The enthalpy changes involved at the transitions of CE6 and its mixtures with CdSenanoparticles. From left to right the enthalpies of the BPIII–BPII (or direct BPIII–BPI), BPII–BPI and BPI–N∗ transitions are given in units of J g−1.
Sample �HBPIII−BPII �HBPIII−BPI �HBPII−BPI �HBPI−N*
CE6 (x = 0) 0.026 ± 0.003 0.045 ± 0.003 0.075 ± 0.004x = 0.0005 0.023 ± 0.003 0.045 ± 0.003 0.067 ± 0.006x = 0.005 0.022 ± 0.003 0.041 ± 0.006 0.066 ± 0.004x = 0.02 0.051 ± 0.003 0.063 ± 0.004
thermodynamically stable state. For x = 0.02 the BPIIIrange (∼0.48 K on heating and ∼0.50 K on cooling) isextended by almost an order of magnitude comparedto the bulk CE6 (∼0.057 K). Although the absolutevalue of the BPIII range is still small, the stabilisa-tion effect is striking. Hence, if applied on compoundswith wider BP range close to room temperature, thismethod can provide wide-range BPIII which would bepotentially useful for applications.
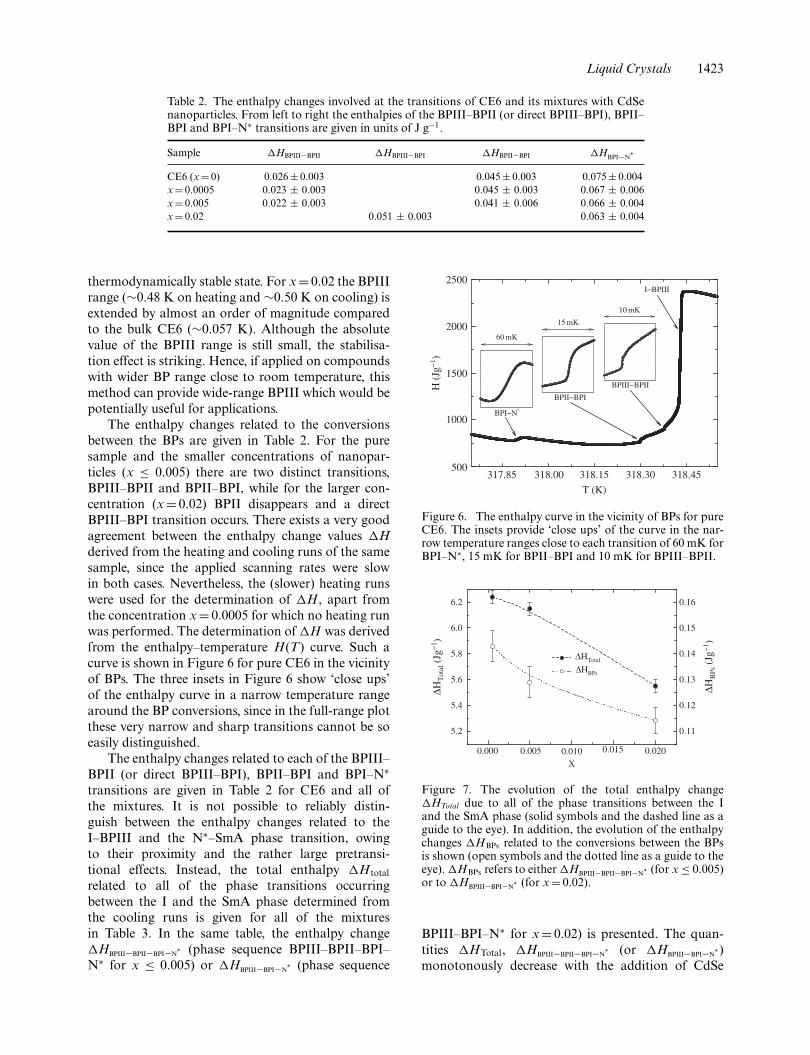
The enthalpy changes related to the conversionsbetween the BPs are given in Table 2. For the puresample and the smaller concentrations of nanopar-ticles (x ≤ 0.005) there are two distinct transitions,BPIII–BPII and BPII–BPI, while for the larger con-centration (x = 0.02) BPII disappears and a directBPIII–BPI transition occurs. There exists a very goodagreement between the enthalpy change values �Hderived from the heating and cooling runs of the samesample, since the applied scanning rates were slowin both cases. Nevertheless, the (slower) heating runswere used for the determination of �H, apart fromthe concentration x = 0.0005 for which no heating runwas performed. The determination of �H was derivedfrom the enthalpy–temperature H(T) curve. Such acurve is shown in Figure 6 for pure CE6 in the vicinityof BPs. The three insets in Figure 6 show ‘close ups’of the enthalpy curve in a narrow temperature rangearound the BP conversions, since in the full-range plotthese very narrow and sharp transitions cannot be soeasily distinguished.
The enthalpy changes related to each of the BPIII–BPII (or direct BPIII–BPI), BPII–BPI and BPI–N∗transitions are given in Table 2 for CE6 and all ofthe mixtures. It is not possible to reliably distin-guish between the enthalpy changes related to theI–BPIII and the N∗–SmA phase transition, owingto their proximity and the rather large pretransi-tional effects. Instead, the total enthalpy �Htotal
related to all of the phase transitions occurringbetween the I and the SmA phase determined fromthe cooling runs is given for all of the mixturesin Table 3. In the same table, the enthalpy change�HBPIII−BPII−BPI−N* (phase sequence BPIII–BPII–BPI–N∗ for x ≤ 0.005) or �HBPIII−BPI−N* (phase sequence
2500
2000
1500
1000
500317.85 318.00 318.15 318.30 318.45
T (K)
H (
Jg−
1 )
60 mK
15 mK
10 mK
I−BPIII
BPI−N*
BPII−BPI
BPIII−BPII
Figure 6. The enthalpy curve in the vicinity of BPs for pureCE6. The insets provide ‘close ups’ of the curve in the nar-row temperature ranges close to each transition of 60 mK forBPI–N∗, 15 mK for BPII–BPI and 10 mK for BPIII–BPII.
6.2
6.0
5.8
5.6
5.4
5.2
ΔHT
otal (
Jg−
1 )
ΔHB
Ps (
Jg−
1 )
ΔHTotal
ΔHBPs
0.000 0.005 0.010X
0.015 0.020
0.16
0.15
0.14
0.13
0.12
0.11
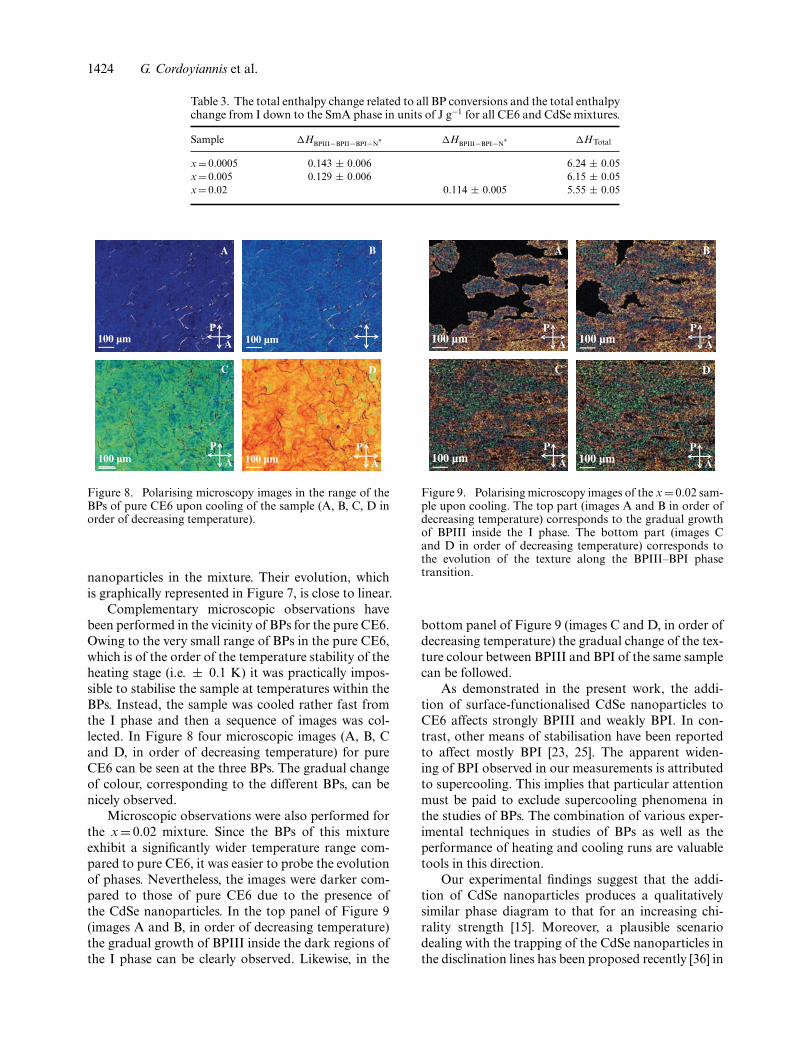
Figure 7. The evolution of the total enthalpy change�HTotal due to all of the phase transitions between the Iand the SmA phase (solid symbols and the dashed line as aguide to the eye). In addition, the evolution of the enthalpychanges �HBPs related to the conversions between the BPsis shown (open symbols and the dotted line as a guide to theeye). �HBPs refers to either �HBPIII−BPII−BPI−N* (for x ≤ 0.005)or to �HBPIII−BPI−N* (for x = 0.02).
BPIII–BPI–N∗ for x = 0.02) is presented. The quan-tities �HTotal, �HBPIII−BPII−BPI−N* (or �HBPIII−BPI−N* )monotonously decrease with the addition of CdSe
1424 G. Cordoyiannis et al.
Table 3. The total enthalpy change related to all BP conversions and the total enthalpychange from I down to the SmA phase in units of J g−1 for all CE6 and CdSe mixtures.
Sample �HBPIII−BPII−BPI−N* �HBPIII−BPI−N* �HTotal
x = 0.0005 0.143 ± 0.006 6.24 ± 0.05x = 0.005 0.129 ± 0.006 6.15 ± 0.05x = 0.02 0.114 ± 0.005 5.55 ± 0.05
A
P100 µm
A
A
P100 µm
B
A
P100 µm
C
A
P100 µm
D
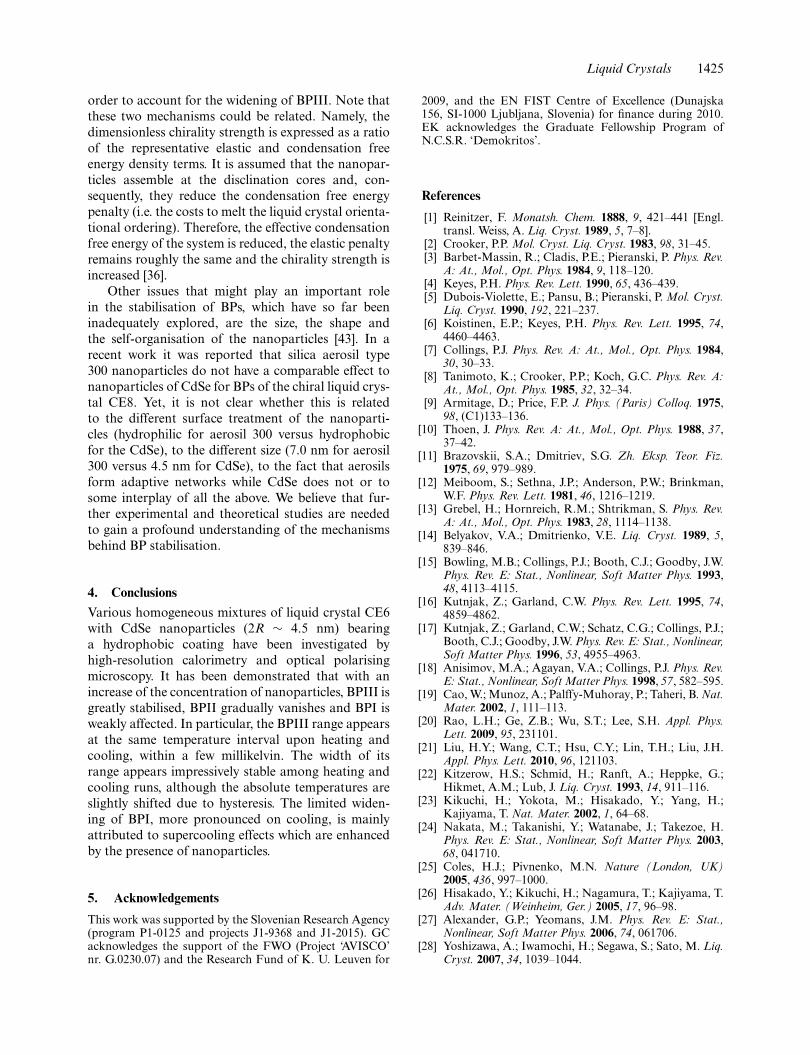
Figure 8. Polarising microscopy images in the range of theBPs of pure CE6 upon cooling of the sample (A, B, C, D inorder of decreasing temperature).
nanoparticles in the mixture. Their evolution, whichis graphically represented in Figure 7, is close to linear.
Complementary microscopic observations havebeen performed in the vicinity of BPs for the pure CE6.Owing to the very small range of BPs in the pure CE6,which is of the order of the temperature stability of theheating stage (i.e. ± 0.1 K) it was practically impos-sible to stabilise the sample at temperatures within theBPs. Instead, the sample was cooled rather fast fromthe I phase and then a sequence of images was col-lected. In Figure 8 four microscopic images (A, B, Cand D, in order of decreasing temperature) for pureCE6 can be seen at the three BPs. The gradual changeof colour, corresponding to the different BPs, can benicely observed.
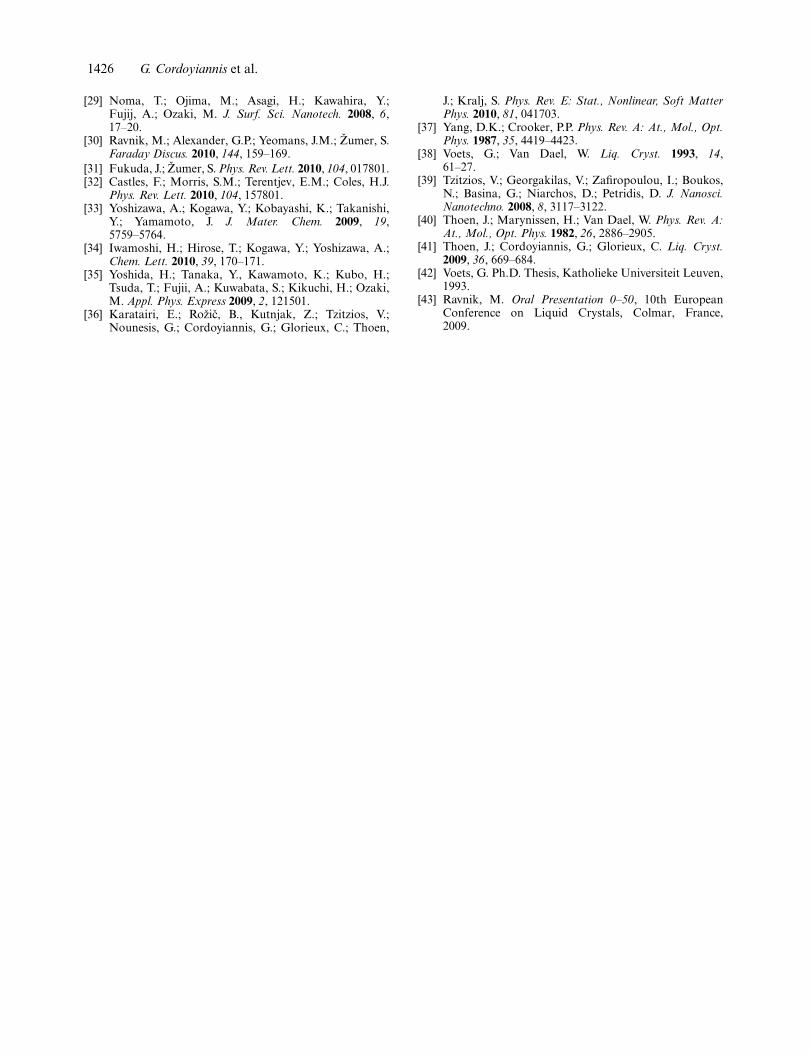
Microscopic observations were also performed forthe x = 0.02 mixture. Since the BPs of this mixtureexhibit a significantly wider temperature range com-pared to pure CE6, it was easier to probe the evolutionof phases. Nevertheless, the images were darker com-pared to those of pure CE6 due to the presence ofthe CdSe nanoparticles. In the top panel of Figure 9(images A and B, in order of decreasing temperature)the gradual growth of BPIII inside the dark regions ofthe I phase can be clearly observed. Likewise, in the
A
P
A
P
A
P
A
P
100 µm 100 µm
100 µm100 µm
A B
C D
Figure 9. Polarising microscopy images of the x = 0.02 sam-ple upon cooling. The top part (images A and B in order ofdecreasing temperature) corresponds to the gradual growthof BPIII inside the I phase. The bottom part (images Cand D in order of decreasing temperature) corresponds tothe evolution of the texture along the BPIII–BPI phasetransition.
bottom panel of Figure 9 (images C and D, in order ofdecreasing temperature) the gradual change of the tex-ture colour between BPIII and BPI of the same samplecan be followed.
As demonstrated in the present work, the addi-tion of surface-functionalised CdSe nanoparticles toCE6 affects strongly BPIII and weakly BPI. In con-trast, other means of stabilisation have been reportedto affect mostly BPI [23, 25]. The apparent widen-ing of BPI observed in our measurements is attributedto supercooling. This implies that particular attentionmust be paid to exclude supercooling phenomena inthe studies of BPs. The combination of various exper-imental techniques in studies of BPs as well as theperformance of heating and cooling runs are valuabletools in this direction.
Our experimental findings suggest that the addi-tion of CdSe nanoparticles produces a qualitativelysimilar phase diagram to that for an increasing chi-rality strength [15]. Moreover, a plausible scenariodealing with the trapping of the CdSe nanoparticles inthe disclination lines has been proposed recently [36] in
Liquid Crystals 1425
order to account for the widening of BPIII. Note thatthese two mechanisms could be related. Namely, thedimensionless chirality strength is expressed as a ratioof the representative elastic and condensation freeenergy density terms. It is assumed that the nanopar-ticles assemble at the disclination cores and, con-sequently, they reduce the condensation free energypenalty (i.e. the costs to melt the liquid crystal orienta-tional ordering). Therefore, the effective condensationfree energy of the system is reduced, the elastic penaltyremains roughly the same and the chirality strength isincreased [36].
Other issues that might play an important rolein the stabilisation of BPs, which have so far beeninadequately explored, are the size, the shape andthe self-organisation of the nanoparticles [43]. In arecent work it was reported that silica aerosil type300 nanoparticles do not have a comparable effect tonanoparticles of CdSe for BPs of the chiral liquid crys-tal CE8. Yet, it is not clear whether this is relatedto the different surface treatment of the nanoparti-cles (hydrophilic for aerosil 300 versus hydrophobicfor the CdSe), to the different size (7.0 nm for aerosil300 versus 4.5 nm for CdSe), to the fact that aerosilsform adaptive networks while CdSe does not or tosome interplay of all the above. We believe that fur-ther experimental and theoretical studies are neededto gain a profound understanding of the mechanismsbehind BP stabilisation.
4. Conclusions
Various homogeneous mixtures of liquid crystal CE6with CdSe nanoparticles (2R ∼ 4.5 nm) bearinga hydrophobic coating have been investigated byhigh-resolution calorimetry and optical polarisingmicroscopy. It has been demonstrated that with anincrease of the concentration of nanoparticles, BPIII isgreatly stabilised, BPII gradually vanishes and BPI isweakly affected. In particular, the BPIII range appearsat the same temperature interval upon heating andcooling, within a few millikelvin. The width of itsrange appears impressively stable among heating andcooling runs, although the absolute temperatures areslightly shifted due to hysteresis. The limited widen-ing of BPI, more pronounced on cooling, is mainlyattributed to supercooling effects which are enhancedby the presence of nanoparticles.
5. Acknowledgements
This work was supported by the Slovenian Research Agency(program P1-0125 and projects J1-9368 and J1-2015). GCacknowledges the support of the FWO (Project ‘AVISCO’nr. G.0230.07) and the Research Fund of K. U. Leuven for
2009, and the EN FIST Centre of Excellence (Dunajska156, SI-1000 Ljubljana, Slovenia) for finance during 2010.EK acknowledges the Graduate Fellowship Program ofN.C.S.R. ‘Demokritos’.
References
[1] Reinitzer, F. Monatsh. Chem. 1888, 9, 421–441 [Engl.transl. Weiss, A. Liq. Cryst. 1989, 5, 7–8].
[2] Crooker, P.P. Mol. Cryst. Liq. Cryst. 1983, 98, 31–45.[3] Barbet-Massin, R.; Cladis, P.E.; Pieranski, P. Phys. Rev.
A: At., Mol., Opt. Phys. 1984, 9, 118–120.[4] Keyes, P.H. Phys. Rev. Lett. 1990, 65, 436–439.[5] Dubois-Violette, E.; Pansu, B.; Pieranski, P. Mol. Cryst.
Liq. Cryst. 1990, 192, 221–237.[6] Koistinen, E.P.; Keyes, P.H. Phys. Rev. Lett. 1995, 74,
4460–4463.[7] Collings, P.J. Phys. Rev. A: At., Mol., Opt. Phys. 1984,
30, 30–33.[8] Tanimoto, K.; Crooker, P.P.; Koch, G.C. Phys. Rev. A:
At., Mol., Opt. Phys. 1985, 32, 32–34.[9] Armitage, D.; Price, F.P. J. Phys. (Paris) Colloq. 1975,
98, (C1)133–136.[10] Thoen, J. Phys. Rev. A: At., Mol., Opt. Phys. 1988, 37,
37–42.[11] Brazovskii, S.A.; Dmitriev, S.G. Zh. Eksp. Teor. Fiz.
1975, 69, 979–989.[12] Meiboom, S.; Sethna, J.P.; Anderson, P.W.; Brinkman,
W.F. Phys. Rev. Lett. 1981, 46, 1216–1219.[13] Grebel, H.; Hornreich, R.M.; Shtrikman, S. Phys. Rev.
A: At., Mol., Opt. Phys. 1983, 28, 1114–1138.[14] Belyakov, V.A.; Dmitrienko, V.E. Liq. Cryst. 1989, 5,
839–846.[15] Bowling, M.B.; Collings, P.J.; Booth, C.J.; Goodby, J.W.
Phys. Rev. E: Stat., Nonlinear, Soft Matter Phys. 1993,48, 4113–4115.
[16] Kutnjak, Z.; Garland, C.W. Phys. Rev. Lett. 1995, 74,4859–4862.
[17] Kutnjak, Z.; Garland, C.W.; Schatz, C.G.; Collings, P.J.;Booth, C.J.; Goodby, J.W. Phys. Rev. E: Stat., Nonlinear,Soft Matter Phys. 1996, 53, 4955–4963.
[18] Anisimov, M.A.; Agayan, V.A.; Collings, P.J. Phys. Rev.E: Stat., Nonlinear, Soft Matter Phys. 1998, 57, 582–595.
[19] Cao, W.; Munoz, A.; Palffy-Muhoray, P.; Taheri, B. Nat.Mater. 2002, 1, 111–113.
[20] Rao, L.H.; Ge, Z.B.; Wu, S.T.; Lee, S.H. Appl. Phys.Lett. 2009, 95, 231101.
[21] Liu, H.Y.; Wang, C.T.; Hsu, C.Y.; Lin, T.H.; Liu, J.H.Appl. Phys. Lett. 2010, 96, 121103.
[22] Kitzerow, H.S.; Schmid, H.; Ranft, A.; Heppke, G.;Hikmet, A.M.; Lub, J. Liq. Cryst. 1993, 14, 911–116.
[23] Kikuchi, H.; Yokota, M.; Hisakado, Y.; Yang, H.;Kajiyama, T. Nat. Mater. 2002, 1, 64–68.
[24] Nakata, M.; Takanishi, Y.; Watanabe, J.; Takezoe, H.Phys. Rev. E: Stat., Nonlinear, Soft Matter Phys. 2003,68, 041710.
[25] Coles, H.J.; Pivnenko, M.N. Nature (London, UK)2005, 436, 997–1000.
[26] Hisakado, Y.; Kikuchi, H.; Nagamura, T.; Kajiyama, T.Adv. Mater. (Weinheim, Ger.) 2005, 17, 96–98.
[27] Alexander, G.P.; Yeomans, J.M. Phys. Rev. E: Stat.,Nonlinear, Soft Matter Phys. 2006, 74, 061706.
[28] Yoshizawa, A.; Iwamochi, H.; Segawa, S.; Sato, M. Liq.Cryst. 2007, 34, 1039–1044.
1426 G. Cordoyiannis et al.
[29] Noma, T.; Ojima, M.; Asagi, H.; Kawahira, Y.;Fujij, A.; Ozaki, M. J. Surf. Sci. Nanotech. 2008, 6,17–20.
[30] Ravnik, M.; Alexander, G.P.; Yeomans, J.M.; Žumer, S.Faraday Discus. 2010, 144, 159–169.
[31] Fukuda, J.; Žumer, S. Phys. Rev. Lett. 2010, 104, 017801.[32] Castles, F.; Morris, S.M.; Terentjev, E.M.; Coles, H.J.
Phys. Rev. Lett. 2010, 104, 157801.[33] Yoshizawa, A.; Kogawa, Y.; Kobayashi, K.; Takanishi,
Y.; Yamamoto, J. J. Mater. Chem. 2009, 19,5759–5764.
[34] Iwamoshi, H.; Hirose, T.; Kogawa, Y.; Yoshizawa, A.;Chem. Lett. 2010, 39, 170–171.
[35] Yoshida, H.; Tanaka, Y., Kawamoto, K.; Kubo, H.;Tsuda, T.; Fujii, A.; Kuwabata, S.; Kikuchi, H.; Ozaki,M. Appl. Phys. Express 2009, 2, 121501.
[36] Karatairi, E.; Rožic, B., Kutnjak, Z.; Tzitzios, V.;Nounesis, G.; Cordoyiannis, G.; Glorieux, C.; Thoen,
J.; Kralj, S. Phys. Rev. E: Stat., Nonlinear, Soft MatterPhys. 2010, 81, 041703.
[37] Yang, D.K.; Crooker, P.P. Phys. Rev. A: At., Mol., Opt.Phys. 1987, 35, 4419–4423.
[38] Voets, G.; Van Dael, W. Liq. Cryst. 1993, 14,61–27.
[39] Tzitzios, V.; Georgakilas, V.; Zafiropoulou, I.; Boukos,N.; Basina, G.; Niarchos, D.; Petridis, D. J. Nanosci.Nanotechno. 2008, 8, 3117–3122.
[40] Thoen, J.; Marynissen, H.; Van Dael, W. Phys. Rev. A:At., Mol., Opt. Phys. 1982, 26, 2886–2905.
[41] Thoen, J.; Cordoyiannis, G.; Glorieux, C. Liq. Cryst.2009, 36, 669–684.
[42] Voets, G. Ph.D. Thesis, Katholieke Universiteit Leuven,1993.
[43] Ravnik, M. Oral Presentation 0–50, 10th EuropeanConference on Liquid Crystals, Colmar, France,2009.