Widening participation, narrowing retention. - CORE
53
University of Bolton UBIR: University of Bolton Institutional Repository Education: Reports Education 2009 Widening participation, narrowing retention. David A. Kitchener University of Bolton, [email protected] This Report is brought to you for free and open access by the Education at UBIR: University of Bolton Institutional Repository. It has been accepted for inclusion in Education: Reports by an authorized administrator of UBIR: University of Bolton Institutional Repository. For more information, please contact [email protected]. Digital Commons Citation Kitchener, David A.. "Widening participation, narrowing retention.." (2009). Education: Reports. Paper 2. http://digitalcommons.bolton.ac.uk/ed_reports/2
-
Upload
khangminh22 -
Category
Documents
-
view
0 -
download
0
Transcript of Widening participation, narrowing retention. - CORE

University of BoltonUBIR: University of Bolton Institutional Repository
Education: Reports Education
2009
Widening participation, narrowing retention.David A. KitchenerUniversity of Bolton, [email protected]
This Report is brought to you for free and open access by the Education at UBIR: University of Bolton Institutional Repository. It has been acceptedfor inclusion in Education: Reports by an authorized administrator of UBIR: University of Bolton Institutional Repository. For more information,please contact [email protected].
Digital Commons CitationKitchener, David A.. "Widening participation, narrowing retention.." (2009). Education: Reports. Paper 2.http://digitalcommons.bolton.ac.uk/ed_reports/2

Widening participation, Narrowing Retention.
June 2009 Dr David Kitchener. Teaching and Learning Fellow

2
Contents Page
1. Introduction 4
2. Widening participation 4
3. Pedagogical innovation 12
3a. Interdisciplinary Inquiry based Learning (IDIBL) 12 3b. Summer schools/Revision weeks 13
i. The Virtual Summer School 13 ii. Sessional summer school/revision weeks 14
3c. Practice Trainer role 14 3d . Personal tutoring 15
3e. Post Graduate Certificate in Teaching and Learning in Higher
Education award 20 3f. Information Literacy 21 4. Support networks 22 4a. Student Liaison Officers (SLOs) 22 4b.Electronic attendance monitoring 23
4c Turnitin 23 Conclusion. 24

3
Tables Page 1a. Young full time first degree entrants 5 1b. Young full time undergraduate entrants 5 2a. Mature full time undergraduate entrants 5 2b. Part time undergraduates 5 3a. Percentage of students aged 21+ 7 3b. Percentage of home students 7 3c. Percentage of overseas students 8 3d. Percentage of female students 8 3e. Percentage of ethnic minority students 8 3f. Percentage of disabled students 9 4a Percentage of full time students failed or withdrawn 9 4b. Percentage of full time students that passed 9 4c. Percentage of part time students failed or withdrawn 10 4d. Percentage of part time students that passed 10 5a. Percentage of graduates with a ‘good’ degree (1st or 2:1) 10 5b. Fail or pass by attendance mode 11 5c. Percentage of part time students that passed, failed, withdrew or collected an interim award in 2007-8 11 6a. Percentage of 2006-7 graduates employed, studying or training 6 months after graduation 11 7a. Percentage of 2007-8 students from the North West (including Bolton) 11 7b. Percentage of 2007-8 students from Bolton 12

4
1. Introduction
This is the second annual report of three examining widening participation and retention issues within the University. The first report (appendix 1) praised staff for their high levels of professionalism and commitment to the student experience though it did highlight certain detrimental issues undermining the successful retention of students and contained a number of recommendations. This second report moves to commenting and celebrating approaches successfully implemented that have contributed to retaining students. The emphasis of this report is very much upon retention rather than widening participation as explained in section 2 below. Inevitably in such a varied and complex institution areas have been unfortunately overlooked, it would be impossible to record every success, so apologies to colleagues who have developed worthy approaches but are not included, no slight is intended. If you feel compelled to contribute please email me at [email protected]. The report’s narrative style tends towards listing simply because there is so much to celebrate and share. I hope you find it informative and a catalyst for further generating new ideas and enhanced practices across the University.
2. Widening participation
Attracting non-traditional learners and engaging them into higher level study is
not a new phenomenon for the University. Before university status was
conferred, the Institute attracted a share of £60,000 funding (HEfCE, 1999) to
establish a partnership of higher and further education institutions within a sub-
region of the North-West of England with the University of Manchester,
Manchester Metropolitan University, Open University, University of Salford and
UMIST to develop an information system to identify existing activities contributing
to widening participation. The QAA (2005) report noted that 31% of our students
were drawn from low participation neighbourhoods, 24.5% were from minority
ethnic backgrounds and 58% were from the North West of England. The
University of Bolton (2007) Access Agreement includes the following revealing
data taken from the 2005/06 cohort which confirms the status of a university
performing at a significantly high level within the sector in attracting learners from
diverse backgrounds and can rightly be described within the report as ‘socially
inclusive’:

5
6
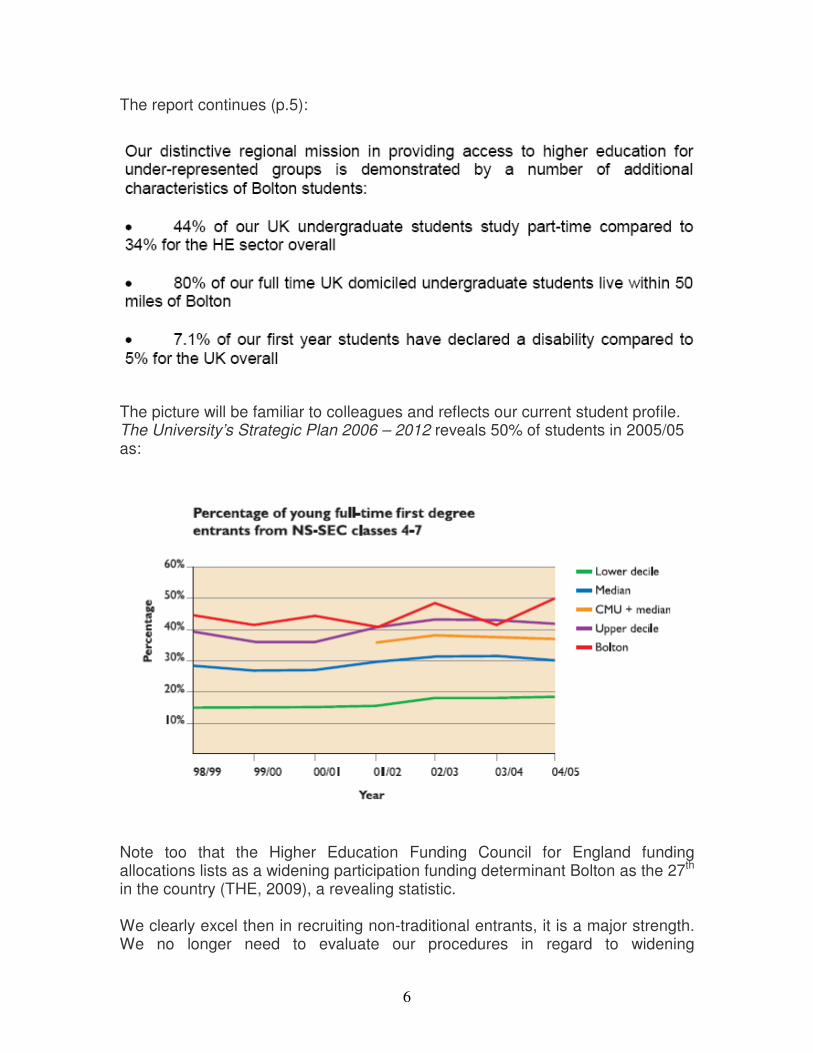
The report continues (p.5):
The picture will be familiar to colleagues and reflects our current student profile. The University’s Strategic Plan 2006 – 2012 reveals 50% of students in 2005/05 as:
Note too that the Higher Education Funding Council for England funding allocations lists as a widening participation funding determinant Bolton as the 27th in the country (THE, 2009), a revealing statistic. We clearly excel then in recruiting non-traditional entrants, it is a major strength. We no longer need to evaluate our procedures in regard to widening

7
participation, we are one of the most successful in the sector, attracting them is not the issue. However, retaining them is hence the comment in the paper’s introduction stating the emphasis will be upon describing successful approaches enhancing retention. Every student who does not successfully complete their studies is for them potentially a negative life experience and in a recessionary period of reduced public expenditure represents a financial loss we can ill afford. Neither scenario is acceptable. To conclude this section before moving onto an examination of pedagogical innovations, it is worth perusing the following tabulated data to get a feel of the context and trends within the University profile of first degree students: Demographic statistics
Table 3a. Percentage of students aged 21+
University BE Eng GCCT BBS AME HSS
2000-1 65 77 57 71 56 67 69
2001-2 65 78 60 66 60 61 70
2002-3 66 80 65 60 62 63 73
2003-4 67 80 61 58 66 65 74
2004-5 67 79 63 56 67 66 73
2005-6 65 80 63 56 63 60 69
2006-7 63 80 61 54 65 58 66
2007-8 61 79 71 54 65 54 62
Table 3b. Percentage of home students
University BE Eng GCCT BBS AME HSS
2000-1 93 91 74 92 95 98 99
2001-2 93 87 72 92 93 98 98
2002-3 92 86 72 92 88 97 98
2003-4 91 89 70 88 86 97 98
2004-5 90 89 67 87 78 98 97
2005-6 89 90 62 83 79 98 96
2006-7 89 91 62 83 78 98 96
2007-8 90 92 68 84 78 97 96

8
Table 3d. Percentage of overseas students
University BE Eng GCCT BBS AME HSS
2000-1 4 4 16 5 4 1 0
2001-2 5 6 20 5 5 1 1
2002-3 5 7 18 6 9 1 1
2003-4 6 7 20 8 11 1 1
2004-5 8 9 25 11 19 1 2
2005-6 9 9 33 15 18 1 3
2006-7 9 8 32 15 19 1 3
2007-8 8 7 28 13 19 1 2
Table 3e. Percentage of female students
University BE Eng GCCT BBS AME HSS
2000-1 50 14 10 22 55 62 78
2001-2 48 14 10 20 56 60 76
2002-3 45 11 10 18 54 60 73
2003-4 46 10 9 16 54 62 73
2004-5 46 10 9 15 52 62 72
2005-6 46 10 11 13 51 60 72
2006-7 45 10 9 10 49 59 71
2007-8 45 11 5 11 52 60 70
Table 3f. Percentage of ethnic minority students
University BE Eng GCCT BBS AME HSS
2000-1 14 7 12 28 22 5 11
2001-2 15 7 13 31 26 8 11
2002-3 17 7 18 28 29 8 12
2003-4 18 7 18 27 35 10 13
2004-5 18 9 16 25 36 11 16
2005-6 18 11 16 23 36 9 18
2006-7 20 13 22 22 40 11 20
2007-8 21 13 27 21 40 12 21

9
Table 3g. Percentage of disabled students
University BE Eng GCCT BBS AME HSS
2000-1 6 6 4 5 5 10 6
2001-2 7 5 5 6 6 11 7
2002-3 8 4 4 7 6 12 9
2003-4 9 6 5 8 6 13 10
2004-5 10 8 6 7 7 16 11
2005-6 11 8 9 10 7 15 11
2006-7 12 9 7 12 8 17 11
2007-8 12 8 6 12 8 18 12
Pass rates by exit cohort
Table 4.a Percentage of full time students failed or withdrawn
University BE Eng GCCT BBS AME HSS
2001-2 37 28 37 69 38 35 24
2002-3 35 22 42 50 43 29 26
2003-4 30 31 31 46 28 24 23
2004-5 36 31 35 42 39 33 31
2005-6 33 46 29 34 34 30 35
2006-7 36 29 24 50 37 34 35
2007-8 33 46 27 39 44 19 32
Table 4b. Percentage of full time students that passed
University BE Eng GCCT BBS AME HSS
2001-2 60 57 57 29 60 63 74
2002-3 61 74 53 42 55 69 73
2003-4 65 65 56 42 70 75 74
2004-5 55 69 58 45 51 62 59
2005-6 61 54 62 59 63 64 59
2006-7 54 59 72 42 55 56 55
2007-8 55 41 71 48 44 67 56

10
Table 4c. Percentage of part time students failed or withdrawn
University BE Eng GCCT BBS AME HSS
2001-2 41 22 48 63 32 56 36
2002-3 40 28 49 42 42 39 43
2003-4 34 17 52 42 26 36 42
2004-5 34 19 24 33 33 42 40
2005-6 38 26 30 37 42 45 43
2006-7 28 21 25 24 28 33 34
2007-8 29 28 25 44 40 30 25
Table 4d. Percentage of part time students that passed
University BE Eng GCCT BBS AME HSS
2001-2 54 73 50 33 64 41 56
2002-3 55 68 49 55 58 53 50
2003-4 62 82 44 50 71 64 49
2004-5 52 77 61 52 55 46 43
2005-6 54 66 65 63 51 48 48
2006-7 62 78 65 68 55 51 54
2007-8 55 71 63 38 50 45 54
Degree class awarded
Table 5 a. Percentage of graduates with a ‘good’ degree (1st or 2:1)
University BE Eng GCCT BBS AME HSS
2001-2 51 46 43 49 42 54 55
2002-3 49 36 38 52 41 54 54
2003-4 51 45 47 47 42 58 54
2004-5 52 42 48 58 41 63 50
2005-6 48 64 41 45 28 56 51
2006-7 54 58 49 53 34 64 58
2007-8 53 54 59 46 42 62 51

11
Table 5b. Fail or pass by attendance mode
Percentage of full time students that passed, failed, withdrew or
collected an interim award in 2007-8
University BE Eng GCCT BBS AME HSS
Passed
55 41 71 48 44 67 56
Failed/
Withdrawn 33 46 27 39 44 19 32
Interim
Award 12 13 2 13 11 14 12
Table 5c. Percentage of part time students that passed, failed, withdrew or
collected an interim award in 2007-8
University BE Eng GCCT BBS AME HSS
Passed
55 71 63 38 50 45 54
Failed/
Withdrawn 29 28 25 44 40 30 25
Interim
Award 15 1 13 13 10 24 21
First destinations of 2006-7 graduates
Table 6a. Percentage of 2006-7 graduates employed, studying or training
6 months after graduation
University BE Eng GCCT BBS AME HSS
Employed/
Studying/Training 77 67 84 84 75 77 78
Home address location of students in 2007-8
Table 7a. Percentage of 2007-8 students from the North West (including
Bolton)
University BE Eng GCCT BBS AME HSS

12
North
West 76 78 53 63 70 82 86
Table 7b. Percentage of 2007-8 students from Bolton
University BE Eng GCCT BBS AME HSS
Bolton 33 21 21 28 38 30 42
Conclusion. One perhaps has to be wary when interpreting simple quantitative data in that it can hide a multitude of variables. However, the data supports the initial commentary of this report in that Bolton is a university very much serving the local community (note that a third are recruited from Bolton), we have significant numbers within ethnic minority and disability categories and that in both full time and part time modes of study last year only just over a half passed.
3. Pedagogical innovation 3a. Interdisciplinary Inquiry Based Learning (IDIBL) The work of Bobbitt (1918) and Tyler (1949) with their emphasis upon curriculum as a body of knowledge to be assimilated, frequently described as the product model, remain a significant influence in UK schooling and indeed higher education, surprisingly so perhaps given the length of time since publication. Specialists are highly regarded as experts and their role is to share the perceived expertise towards a specific learning goal frequently measured by formal assessment as increased competence. A frequent criticism of the product model is its narrowness (Newman and Holzman, 1997; Rogers, 2003) and the tendency to teach towards the prescribed learning outcomes to be assessed possibly enhancing opportunities for high student grading of performance but at the expense of exploration and debate as exemplified by the House of Commons’ Children, Schools and Families Committee (2008) concern of schools teaching towards SATs targets. Such approaches of measuring performance by academic attainment alone might ring familiar bells to colleagues within the higher education sector. The IDIBL approach, characterised by the MA in Learning with Technology, views a content-led curriculum as an additional barrier learners have to overcome and takes a less prescriptive inquiry-led stance which invites negotiated projects and in a sense means learners create their own curriculum,

13
they are the starting point of the learning process, the reverse of the traditional imposed predetermined curriculum. The content, which has a strong action research edge, is largely determined by the learner with the lecturer acting as a facilitator or guide. Learners are invited to create their own learning community and share ideas and thoughts creating opportunities for academic dialogue and reflection. There are measurable learning outcomes but how they are achieved is negotiated and a ‘stitching piece’ approach (varieties of evidence) is encouraged which largely replaces the formal essay. Brown et al (1997) suggests assessment is what students regard as important, it’s what defines them and their academic status, so to change student learning requires a change in assessment methods. This might mean reconsidering whether an essay best reflects learners’ potential, engagement and aptitude. IDIBL also promotes and celebrates conceptual understanding and challenges what one could perhaps describe as the more mechanistic assessment approach of groups of students being graded according to a shared module content (Newstead, 2002). The IDIBL approach may appear radical to some and difficult to implement within some programmes of study but the principles proffered are I feel worth perusing. It challenges firmly held preconceived approaches and moves towards a learning community and away from the passive student being instructed within systems controlled and administered by academic experts (Gibbs et al, 2004). If your appetite is whetted contact either Mark Johnson (3567), Stephen Powell (3669) or indeed any of the Educational Cybernetics team. 3b Summer Schools/Revision weeks
i. The Virtual Summer School
The Public Accounts Committee (2008) reported that in the first year of study nationally 22 per cent of full-time students abandoned their degrees. There are of course a multitude of reasons why students do not return for a second year of study and despite our sustained best efforts there will be those who leave. It is a complex issue but a common feature is disaffection and undermined confidence in academic performance and a long summer break is a time to reflect and perhaps reinforce negative perceptions. Debbie Abdel Nabi in the School of Health and Social Sciences recognised that sustaining engagement of first year students across the summer holiday was a strategy which could challenge self doubt, be a catalyst for renewed motivation and an opportunity to revisit and consolidate first year studies in psychology. Past refresher days were felt to have been too brief and inevitably tended towards generalised or superficial engagement, areas of study being retaught to a group whose individual needs inevitably would differ. An on-line approach could provide a more individualised

14
approach with students choosing their own topics, a type of technological differentiation. The on-line school utilising WEBCT was not a depository of taught sessions’ learning materials but an interactive forum. Exercises were created covering previously taught topics requiring responses and Debbie provided web links plus an audio commentary in places. Students could post responses and had the opportunity to share thoughts with each other. The approach combined revisiting topics in a type of tutorial mode with the tutor as an absent guider. Feedback from students was mostly very positive and the intent is to further utilise the approach for second year psychology students. Debbie can be contacted on extension 3674
ii. Sessional Summer school/revision weeks
Appendix 2 is an appraisal (Kitchener, 2008) of the more traditional revision approach adopted by Schools for the summer of 2008. Summer Schools/Revision weeks do seem to be well received and make a positive impact and appear therefore to be a strategy well worth promoting. Two models emerged from the study, both of which had their merits. The first was a more formal series of taught sessions which focused mainly on study skills. Academic staff provided results tutorials on the 16th and 17th of June and followed this by two study skill/improvement sessions delivered mainly by a Student Liaison Officer. Numbers attending were small but the feedback was overwhelmingly positive. The second was a tutorial approach, students invited to attend being those identified as having a results profile causing concern. This was a far more individualistic approach and centred on reappraising and guiding areas of study requiring further attention. It was interesting to find that when interviewing this group, several had not appreciated they had attended revision sessions and there was therefore no possibility of stigmitisation arising from perceived academic underperformance. 3c. Practice Trainer role The University continues to work as partners with specific organisations to deliver agreed learning programmes to further enhance workforce qualifications. It is an important part of our work and reflects an ethos of proactive rather than passive

15
recruitment and confirms our role as a respected contributor towards the region’s economic well being. Anne-Marie Reid developed a learning partnership with the NHS to deliver a foundation degree based upon recognising, enhancing and accrediting work-based learning. Across the University there are innumerable work-based foundation degrees so in that sense her work is commonplace not revelatory. However, the innovation of her model which has contributed towards very high retention and achievement figures is the pastoral and study support provided within the workplace by the employment of a Practice Trainer seconded to the University for two years The Practice Trainer is an experienced and qualified practitioner who is on hand to support learners on a need-to-know basis. There is no need for students to try and contact university-based tutors for the majority of queries, the Practice Trainer is available at the students’ place of work. Walker et al (2006) in a study of new university lecturers noted pastoral support issues common to many of us of time, availability and opportunities to deal efficiently with specific queries. Anne-Maries model does not usurp the lecturer role but rather complements it by enhancing opportunities for clear and immediate guidance. 3d. Personal tutoring Rickinson (1998) suggests the counselling aspect of personal tutoring to be particularly invaluable at two key points, first year entry and final year completion, danger periods for retention. York and Thomas (2003) in a study of why some higher education intuitions were performing above HEFCE performance indicators for retaining students from lower socio-economic groups included effective personal tutoring as a factor. Cleland et al (2005) found that students needing the greatest support were often reticent in seeking it and that more should be done to identify perceived weaknesses and that the students would benefit from enhancing self-reflection skills. Personal tutoring is therefore a complex issue and whilst few of us would claim enhanced counselling skills we provide advice, support and guidance on an almost daily basis. All of us want our students to succeed and mentoring with additional support outside of teaching time is an integral part of our job. The challenge is where we as individuals draw the line as to what we can effectively achieve and what is beyond our remit or influence? Perhaps the general parameter is we can be most effective within the role of guiding learning and beyond that one refers or defers to specialists. How that is defined is of course problematical.

16
As part of her teaching and learning fellowship role, Debbie Abdel Nabi has reviewed the University’s personal tutoring role; an abridged version with some of the quantitative data removed is reproduced below:
Context
The remit of this fellowship is to research and recommend means of enhancing the experience of all students who enter the University for the first time with particular emphasis on first year full-time undergraduates. The overall aim is to contribute to the retention of students by: a. Developing student Personal / Professional Development Planning
(PDP) across all Schools implementing the recommendations in the review report produced by Frank Goodridge in 2007.
b. Developing & implementing a revised policy on personal tutoring (PT) and gaining approval from relevant University committees so that it can be implemented throughout the academic structure.
The latter was identified as requiring immediate attention, thus addressed first.
Part 1: Review of Current Personal Tutoring Provision at the University Online Staff Survey In order to gain a comprehensive and accurate overview of current PT provision within the university and highlight any diversity in approaches across the five Schools, a nineteen-item online survey1 was developed and distributed to 55 members of academic staff identified as responsible for administration of personal tutoring in various programmes. 39 members of staff fully completed the survey. Results and Conclusions of Staff Survey The results indicated that some commonalities appear to exist: 1. Most (76%) reported that students on their courses were introduced to
their PT in induction week and, generally, this person remains their PT for a student’s entire time at the university (71%)
2. Delivery of personal tutoring is, largely, on a one-to-one (66%) and an ‘as and when needed’ basis
1 The survey incorporated items on a wide range of PT-related issues such as administration, staffing,
structure and content, communication, frequency of contact across levels of a programme, staff training and support and, crucially, the perceived nature and function of personal tutoring within a programme.

17
3. It appears that the majority (79%) of personal tutoring is both proactive (tutor organised) and reactive (student initiated)
4. Almost all staff surveyed considered that their personal tutoring comprises both academic support and pastoral care (92%)
5. 85% of respondents expressed that students received support and advice outside the PT meetings by means of email advice, SLO assistance, website or WebCT support, etc.
There appears, however, to be diversity in the staffing, structure and operation of personal tutoring in the various Schools. For example: 1. Some schools utilise Programme, Year or Module Leaders as the PT for a
cohort of students (68%) the majority of the remainder stating that an assigned member or all members of academic staff (other than those indicated above) act as PT to students on their courses
2. Only 52% reported a structured ‘programme’ of personal tutoring meetings in Year 1
3. The amount of training / guidance given to staff in order that they carry out their role as a PT varies: 52% felt that they had received some form of training, while the remainder considered they had not or were unsure.
4. The amount of time allocated for personal tutoring on staff contact hours differed widely from “less than 7 hours per semester” (44%) to “fifteen hours plus per semester” (22%)
Staff Focus Groups Two staff focus group sessions held early in Semester II of this academic year proved greatly informative, supporting and elaborating the findings of the online survey especially regarding perceived role / function of personal tutoring and staffing issues. The most salient emergent themes related to: 1. The need to define the role of a PT and delineate it from the roles met by
central services and Student Liaison Officers 2. The necessity for staff guidance and or training 3. Concerns re. staffing (workload) 4. The perception of personal tutoring as an (unrecognised / uncredited)
adjunct to teaching and administration workload. Online Student Survey
It was considered highly important that information on student perception of their PT experience (and aspirations for it) were gained. Hence, with the cooperation

18
of Student Data Management, an online survey similar to that distributed to staff 2 was circulated to 9,500 students in mid-March 2009. As of 04/04/09, 277 replies had been gained, 254 of which were from undergraduate students. Responses with complete data sets were input into statistical analysis software (Statistical Package for the Social Sciences – SPSS).
Qualitative Responses The most salient themes to have emerged from the qualitative data thus far include the following: 1. Not all students are aware that they have been allocated a PT or who their
PT is 2. Not all students are aware of the role and function of a PT 3. The students prefer an academic focus to meetings (with, if necessary,
advice on where to get additional support for personal or pastoral issues) 4. A lot of students appear to prefer or want meetings to be organised by
their PT (i.e., proactive organisation) rather than a student-led, reactive model. Comments of the type, “I don’t like to bother them; they’re so busy”, etc, are recurrent
5. Most would like a structured programme of personal tutoring (one that follows an integrated model) for either the first year or to span all years of their course
6. There is notable variation in the experience of with personal tutoring across pathways / Schools.
Comparison of Staff and Student Responses If we compare the responses of staff and students to equivalent items on the two questionnaires interesting similarities (and disparities) in experience, understanding or perception of personal tutoring at the university emerge. The table below highlights this.
Item Theme on Questionnaire
Majority Staff
Response
Majority Student
Response
Who acts as a PT?
Programme Leaders (47%)
Assigned staff
member (59%)
Introduced to PT?
Induction week
(76%)
Induction week
(39%)
2 For the student survey, additional questions were added on whether they would like a structured
programme of meetings across all years of their course and the preferred frequency of such.

19
Same PT for duration of course?
Yes
(71%)
Yes
(50%)
Mode of delivery of personal
tutoring?
One-to-one
(66%)
One-to-one
(47%)
Frequency of meeting?
(Year 1, 2 & 3)
As and when
necessary (36%, 50%, 47%)
As and when
necessary (27%, 47%, 70%)
Proactively tutor-organised,
reactive or both?
Both
(79%)
Both
(41%)
Focus of personal tutoring?
Academic guidance
and personal support (92%)
Academic guidance
and personal support (56%)
Additional support outside PT?
Yes
(68%)
Yes
(46%)
Structured programme of meetings in Year 1?
Yes
(52%)
No / Don’t know
(72%)
Although the percentage comprising the most popular staff / student response varies on a number of issues, the greatest variation occurs between staff and student reports of whether a structured programme of PT meetings occurs in Year 1 and who acts as student PTs. Most student respondents seem to have the impression that no structured programme of PT meetings exists / existed in Year 1 of their course and that their PT is an assigned member of academic staff. In contrast, the majority of staff reported that a structured Year 1 schedule of meetings is provided and that Programme or Module Leaders are more commonly employed to act as PT for a year / module cohort. These differences might, of course, be simply attributable to lack of student awareness on these particular issues.

20
Debbie’s research raises interesting issues worth perusing. It would appear there are vagaries in the status of personal tutoring. Campbell and Nutt (2008) use the term ‘academic advising’ to describe the process as a critical role to foster student engagement suggesting it moves away from input to outcomes. Thomas and Hixenbaugh (2006) suggest students from working class backgrounds may be reticent in contacting personal tutors and benefit from a more structured approach which prioritised relationships. York and Longden (2004) see a strong correlation between enhanced retention and quality personal tutoring and HEFCE (2002) has from the start of the widening agenda strategy noted the importance of personal tutoring as an approach increasing retention. The evidence is overwhelming that it improves retention and we as a university have made a strong start. Given the student profile provided at the start of this report it is likely that personal tutoring will become even more significant and important to the way we support. 3e. Post Graduate Certificate in Teaching and Learning in Higher Education award The learning experience of students is a multi-faceted affair containing any amount of diverse factors but if there is one element that has the most influence it is surely and unsurprisingly the quality of professional engagement. As a general statement of intent for the sector, HEFCE (2008:21) note as a strategic aim:
'The pressures of global competition and the diversity of needs met by HE mean that the sector has to be increasingly flexible and responsive ... We are encouraging and providing incentives for provision that offers learners flexibility about when and where they study, including part-time and workplace learning, and harnesses new technologies to support learning wherever and however it occurs.'
Andrea and Gosling (2005) suggest the increased demands placed upon universities requires a reappraisal of approaches and interestingly questions the historical separation of research and teaching, a point explored further by Jenkins et al (2003) who evangelise about the need for research to link more strongly into teaching, an interesting point given our success in our increased research grant for 2009/10. Johnson (2001) rejects the notion of academic standards being compromised by widening participation, what is required is more effective and flexible approaches to teaching and learning. Johnstone and Simpson (2002:4) describe a ‘Remedialist’ model adopted by some universities which essentially means those institutions that are;
Committed to students’ remedial support as they have admitted students with lower entry qualifications than survivalist

21
institutions and therefore likely to generate more ‘false positives’ and a considerably lower retention rate. However, that support is generally offered reactively – students are still expected to identify their own weaknesses and to be able to ask for help.
All of the above hint at the complexities but the absolute necessity to view teaching and learning as central to a universities success and prosperity. The new Post Graduate Certificate in Teaching and Learning in Higher Education award is one more piece in the pedagogical jigsaw.
Marnet (2007) sees the new award as being designed to:
• Allow the competent use of a wide repertoire of teaching and assessment methods participants
• Support lecturers in the teaching problems they face • Increase an understanding of teaching and learning processes • Help lecturers make appropriate and informed decisions about course
design and the choice of teaching' learning and assessment methods • To foster the habit of reflective teaching and of professionalism in
evaluating and improving teaching
At Bolton we have widened the registration sphere to support those who currently have a significant role in teaching and/or supporting learning, not just lecturers. There is an expectation that all new appointees to the University who have such a role will study for the award which represents a strategic move towards recognising, celebrating and accrediting learning as a catalyst to further enhance standards of student engagement across the University. Those who would be exempt from taking the award would be those holding the following qualifications:
• Teacher training with QTS
• An SVUK endorsed full FE teaching qualification (or approved legacy qualification)
• AN HEA accredited qualification at the same level and with the same focus as the PG certificate.
There are three modules spread over 18 months:
• Teaching and Supporting Student Learning in Higher Education
• Curriculum Design and Assessment in Higher Education
• Professional Academic Practice in Action.
The programme combines theory and practice informed by teaching observations and has a strong, robust reflective theme.
Full details can be obtained fro Sue Burkinshaw on extension 3655.

22
3f. Information Literacy The Chartered Institute of Library and Information Professionals (2008:1) definition is “Information literacy is knowing when and why you need information, where to find it, and how to evaluate, use and communicate it in an ethical manner.” Lloyd (2006) also views it as more than a set of acquired skills but rather as a further means of gleaning insight with a critical and analytical edge. By September 2009 a summary of the framework is planned to be included in each programme handbook, explaining what resources/help will be available. The framework is to be used as a guide to including/embedding information literacy skills into each programme of study within a University wide structure of support for study skills supporting Grafstein’s (2002) stance that the responsibility of teaching information literacy should not simply rest with the library but should be shared across the institution. Lupton (2004) sees tensions between academic teaching and the student need to uncover information effectively and perhaps there is an occasional assumption that undergraduates come equipped with such skills. We can all recount experiences of students being under-prepared for the rigour of academic study, particularly in the ability to filter information and critically evaluate. This new strategy will be an invaluable addition to our portfolio of approaches. For more details contact Shirley Ward (3553)
4. Support networks
4a. Student Liaison Officers (SLOs) Formerly Student Support Officers, then Student Experience Officers and now Student Liaison Officers, these are the University’s specialists in understanding retention issues. Their remit is to provide support via student interviews, workshops, more recently attendance monitoring though this is not a primary role (see 4.b. below), contacting students, researching the student experience and reporting back to Schools and committees via reports and guiding students to internal and external services. Each SLO is attached to a School and their service complements the work of academics and their expertise should be viewed as an additional layer of support for us all. It is important to appreciate that improving retention is a responsibility of all employees and Student Liaison

23
Officers should not be utilised as a service we automatically refer students to, the SLOs work at an equal level to us all. As outlined in the appendix 1 report which preceded this one, the high degree of expertise and professionalism across all parts of the University is a cause for celebration and reflects our high standards and expertise. The SLOs are a significant contributor to these qualities and working with them can only further enhance performance. They also run staff developments events mostly linked to issues of widening participation and retention. The contacts details are:
• Kay Loxham (3347). School of Games Computing & Creative Technologies
• Debra Elliot (3595). School of Built Environment and Engineering
• James Gaskell (3229). School of Arts, Media and Education
• Jacquie Parkinson-Jones (3585). Health and Social Sciences
• Sloane Stewart (3259). Bolton Business School. 4b.Electronic attendance monitoring
The function or intent of recording attendance is perhaps a contentious issue. Is it a process of academic policing, an undermining of freedom to study or not, a supportive process that efficiently identifies students potentially at risk of underachievement or even failure or simply as aspect of sound professional practice? Whatever your stance, a University strategy of monitoring attendance is evolving with the intent to improve levels of engagement and enhance retention. With the growth of electronic choices for learning it is debateable as to how important students physically being present is yet studies suggest it does make a difference. Colby (2004) found a strongly significant relationship between attainment and attendance. Other studies (Vidler, 1980; Jones, 1984; Brocato, 1989; Launius, 1997; Thomas and Higbee, 2000; Martinez, 2001) all note that lecture attendance reflects positively on higher academic achievement. There are a multitude of reasons why students don’t attend (Fleming, 1995) but in a highly mechanistic funding methodology no success equates to no money so all strategies that improve performance are important (hence this report!). Electronic monitoring might be an additional administrative procedure but the evidence is overwhelming that scrutinising attendance is productive. 4c Turnitin

24
Turnitin is the plagiarism detection software adopted by the University. It is perhaps unusual to include a section on what essentially amounts to identifying academic cheating but it is included because its application by us is intended to guide rather than initially penalise. The intent is prevention by early identification rather than the instigation immediately of punitive measures. Files are sent before final submission to the Turnitin site and scanned and colour coded from red which is highly suspect to none which indicates no plagiarism Students are expected to perform the scan themselves and they and the tutor will receive a report. This means that there is the opportunity for the student to rectify unintentional oversights such as omitting inverted commas when quoting and produce a script which reflects their own work. When used correctly it reduces complicated searches by tutors suspecting plagiarism and therefore saves time thus reducing the possibility of false accusations and difficult resulting scenarios and puts the onus upon the student to ensure submitted scripts reflect their own endeavours. Used in this manner it maintains academic standards by efficient scrutiny whilst avoiding the possibility of confrontation which is supportive. Conclusion. Profuse apologies to colleagues who have read this far but haven’t received a mention. In an organisation as varied and complex as a university it is inevitable that aspects have not been included in a summative report of this size. If you feel there is a pedagogical innovation that should have been added, by all means email me the details ([email protected]). The innovations explored here build upon a plethora of established good practice and reflect our commitment to engaging a student profile with a significant range of developmental needs. Higher education has certainly changed since the 1992 Further and Higher Education Act instigated a market-led entrepreneurial model. Government policies insisted that higher education student numbers should rise which has resulted in the recruitment of students with increasingly diverse needs. Gorard et al (2006) suggested that teaching methods had insufficiently adapted to meet such needs. This report contradicts this assertion. The Public Accounts Committee (2009) notes that with the notable exception of the Russell Group, widening participation is increasing in many universities. We are such a university. Hockings, (2008:15) suggest success is significantly enhanced by ‘teacher engagement with diversity and inclusivity’ and this is reflected in part by innovative pedagogical approaches. We are again such a university.

25
References Andrea, V. and Gosling, A. (2005), Improving Teaching and Learning in Higher Education: A whole Institution Approach. Milton Keynes: OUP Bobbitt, F. (1918), The Curriculum, Boston: Houghton Mifflin. Brocato, J. (1989), How much does coming to class matter? Some evidence of class attendance and grade performance. Educational Research Quarterly. 13(3), 2-6 Brown, G., Bull, J. and Pendlebury, M. (1997), Assessing Student Learning in Higher Education. London and New York: Routledge. Campbell, S. M., & Nutt, C. L. (2008), Academic advising in the new global century: Supporting student engagement and learning outcomes achievement. Peer Review, 10 (1), 4–7. Chartered Institute of Library and Information Professionals (2008), Information Literacy: Definition. http://www.cilip.org.uk/policyadvocacy/learning/informationliteracy/definition/default.htm (accessed 6th June 2009) Cleland, J., Arnold, R. and Chesser, A. (2005), Failing finals is often a surprise for the student but not the teacher: identifying difficulties and supporting students with academic difficulties. Medical Teacher, 27(6), 504-508. Colby, J, (2004), Attendance and Attainment: a comparative study. Birmingham: School of Computing and Information. University of Central England. Fleming, N. (1995), Attendance: Why don’t they attend? Part 2, Discussion paper. Lincoln: Lincoln University Education Unit. Gibbs, P., Angelides, P. and Michaelides, P. (2004) ‘Preliminary thoughts on a praxis of higher education teaching.’ Teaching in Higher Education, 9, 183-194. Gorars, S., Smith, E., May, H., Thomas, L. Adnett, N. and Slack, l. (2006), Review of Widening Participation research: addressing barriers to participation in higher education. London: HEFCE.

26
Grafstein, A. (2002), A discipline-based approach to information literacy. The Journal of Academic Librarianship, 28 (4), 197-204 HEFCE (1999), Widening participation: special funding programme 1998-99. London: Higher Education Funding Agency.
HEFCE (2002), Successful student diversity. Case studies of practice in learning and teaching and widening participation. London: Higher Education Funding Agency.
Hockings, C., Cooke, S., Bowl, M., Yamasita, H. and McGinty, S. (2008), Learning and Teaching for Social Diversity and Difference. Swindon: ESRC. House of Commons (2008), Children, Schools and Families Committee. Testing and Assessment. Third Report of the session 2007-08. London: The Stationery Office Ltd. Jenkins, A., Breen, R. and Lindsay R., (2005), Reshaping Teaching in Higher Education. London: Kogan Page. Johnstone, V., (2001), ‘By Accident or Design? Exchange 1 pp 9-11 Milton Keynes: Open University Johnstone, V. and Simpson, O, (2002), ‘Retentioneering.’ Higher Education in the UK. Attitudinal Barriers to Addressing Student Retention in Universities. Cambidge: Open University in the East of England. Jones, C.H. (1984), Interaction of absences and grades in a college course. Journal of Psychology 116: 133-36 Kitchener, D.A. (2008), An Appraisal of the 2008 University of Bolton Summer Schools. Internal paper. Launius, M.H. (1997), College student attendance: Attitudes and academic performance. College Student Journal 32: 86-92 Lloyd, A. (2006), Information literacy landscapes: an emerging picture. Journal of Documentation, 62 (5), 570-583 Lupton, M. (2004) The learning connection: information literacy and the student experience. Adelaide: Auslib Press. Marnet, O., (2007), Reflections on Teaching in Higher Education. London: The Higher Education Academy.

27
Martinez, P. (2001), Improving student retention and achievement. What do we know and what do we need to find out? London: Learning and Skills Development Agency. Newman, F. and Holzman, L. (1997) The End of Knowing. A new developmental way of learning. London: Routledge Newstead, S. (2002), ‘Examining the examiners: why are we so bad at assessing students?’ Psychology Learning and Teaching, 2 (2), 70-75 Public Accounts Committee, (2008), Staying the course: the retention of students on higher education courses. London: The Stationery Office Ltd. Public Accounts Committee, (2009), Public Accounts Committee - Fourth Report Widening participation in higher education. London: The Stationery Office Ltd. QAA (2005), University of Bolton Intuitional Audit. London: The Quality Assurance Agency for Higher Education Rickinson, B. (1998), The relationship between undergraduate student counseling and successful degree completion. Studies in Higher Education, 23 (1), 95-102. Rogers, A. (2003), What is the difference? A new critique of adult learning and teaching. Leicester: NIACE THE (2009), Reversal of Fortunes. London: Times Higher Education. 5th – 11th March 2009. Thomas, P.V. and Higbee, J.L. (2000), The relationship between involvement and success in developmental algebra. Journal of College Reading and Learning, 30(2), 222-32 Thomas, L. and Hixenbaugh, P. (2006) (eds.), Personal Tutoring in Higher Education, Stoke on Trent: Trentham Books. Tyler, R. W. (1949), Basic Principles of Curriculum and Instruction, Chicago: University of Chicago Press. Vidler, D.C. (1980), Curiosity, academic performance, and class attendance. Psychological Reports 47: 589-90 Walker, C., Greaves, A. and Grey, J. (2006), A study of the difficulties of care and support in new university teachers' work. Journal of Educational Studies.12 (3), 347-363.

28
York, M. and Longden, B. (2004) Retention and success in higher education, Maidenhead: SRHE and Open University Press.
York, M. and Thomas, L. (2003), Improving the Retention of Students from Lower Socio-economic Groups. Journal of Higher Education Policy and Management, 25 (1), 63-74

29
Appendix 1
An investigation into widening participation and retention.
Interim Report.
Presented to The University of Bolton Annual Learning and Teaching Conference June 2008 David Kitchener

30
Contents
Page
Introduction. 4 Background 4 University of Bolton context 6 Study findings. 9 Recommendations. 11 Conclusion. 12

31
Tables Page 1. School listings of withdrawn students 6 2. Numbers withdrawn cross-referenced to highest entry qualification. 9

32
Introduction. The Manchester Evening News headline of the 20th of February ‘Students in a hurry – to leave’ highlighted the University’s predicament coming bottom of the House of Commons’ public accounts committee retention league table. Whilst clearly an unacceptable statistic, it hides Bolton’s enviable reputation as an institution committed to widening participation, the University’s Strategic Plan 2006 – 2012 data succinctly highlighting the considerable achievements of the university, particularly the increased number of registrations. The high percentage of young full time first degree entrants from NS-SEC classes 4-7 attracted to Bolton should be a cause of celebration, proving our commitment to widening participation, but this is masked by the disappointing retention figures. This interim report presents the initial findings arising from the author’s teaching and learning fellowship remit to examine factors negatively impacting upon retention and begin to proffer solutions. Quantitative data sourced from Student Data Management is juxtaposed with qualitative data taken from various sources by the author from committees, groups and forums attended and reflect a section of students’ perceptions. Background
Government support for higher education expansion is not a new phenomenon. Yeo (1997) noted even then three times as many full-time teachers in HE as there were students in 1960 including more HE students in further education colleges than there were university students at the time of the Robbins Report in 1963. To confirm the growth, by 1997 the UK had more postgraduate students (about 300,000) than there were undergraduates in the early 1960s (about 270,000) and the proportion of women students doubled from under 25 per cent to 50 per cent (Williams, 1997). The first feelers of a move towards widening participation can be traced back to the Report of the Robins Committee, Floud (1963:52) one of the contributors suggesting "There is no iron law of the national intellect imposing an upper limit on the educational potential of the population. What only the few could do yesterday the many can do today.” Hoggart (1996:42) held a similar position stating that the expansion of HE "confirmed that there was far more talent in the country than we had guessed or were willing, out of class-and-culture meanness, to recognize.” Entry to HE too reflected the growing number taking appropriate entry qualifications. It is remarkable that the first A Level exams were held in 1951 and there were only 36,677 candidates; by 1985 the comparable figure had increased
33
tenfold to 379,503 (DES, Higginson Report, 1988:47). The A Level exam was developed with not more than 10% of the population in mind but by 1995 44% of young people up to the age of 21 had obtained two A Levels or vocational equivalents and the national target for the year 2000 was 60% (Dearing, 1996, para. 8.5). Numbers certainly had grown and participation widened across social groupings (Davies et al, 1994) but it was the prime minister’s speech (Blair, 2004) that he wanted 50 per cent of 18 to 30-year-olds in higher education by 2010 which set the agenda for massive change. Any remnants of higher education as the preserve of the middle classes had ended. The recent growth has been significant. The Statistical First Release (SFR) produced by the Higher Education Statistics Agency (HESA) in collaboration with statisticians from the Department for Innovation, Universities and Skills, the Welsh Assembly Government, the Scottish Executive (Scottish Government) and the Department for Employment and Learning Northern Ireland provides details of student enrolments and qualifications obtained by higher education (HE) students at HE institutions (HEIs) in the United Kingdom (UK) for the academic year 2006/07. It is worth pausing and reviewing the data (I’ve only included the English HEIs figures):
• The total number of HE enrolments at English HEIs stood at 1,957,195 in 2006/07, an increase of 1% from 2005/06. Postgraduate enrolments increased by 2% and undergraduate enrolments increased by 1% between 2005/06 and 2006/07.
• 1,187,635 of all enrolments were full-time, an increase in numbers of 1% since 2005/06. The number of part-time enrolments grew by 1% from 2005/06.
• The number of full-time first year enrolments decreased by 2% between 2005/06 and 2006/07 whereas part-time first year enrolments increased by 1% over the same period.
• Between 2005/06 and 2006/07, the number of enrolments of UK domiciled students showed no percentage change (from 1,660,630 to 1,666,310). The number of all other European Union (EU) domiciled students increased by 6% (from 84,185 to 89,140) and the number of Non-EU domiciled students increased by 5% (from 191,610 to 201,740).
• In 2006/07 there were 262,375 first degree graduates compared to 260,630 in 2005/06, an increase of 1%.
• Of those gaining a first degree in 2006/07, 12% obtained a first class honours award and 47% obtained an upper second class honours award.
• 56% of first degree graduates in 2006/07 were women, the same as in 2005/06.
• 11,000 students were awarded a foundation degree in 2006/07, compared to 8,820 in 2005/06, an increase of 25%.

34
• 167,875 students obtained HE qualifications at postgraduate level in 2006/07, an increase of 2% from 2005/06.
Clearly there has been a huge growth in HE student numbers and the sector has become characterised by an entrepreneurial, market-led ethos. Competition for registrations is intense and funding is heavily tiered towards retaining students and importantly ameliorating success. The next section juxtaposes the University’s position to the situation nationally and highlights the challenges inherent in the new context. University of Bolton context
For 2005-06 full-time undergraduates, the published HESA performance indicators show that 32% of the University’s students failed to complete compared to the benchmark of 23%. The table below listing retention data by School suggests similar figures for this academic year are likely: Table 1. School listings of withdrawn students Full Time Year 1 First Degree
School Status 2006/7 6th May 2008 Last Month
H O OC H O OC
AME DS 6 2 1 0 2 1 0
W 46.84 27.5 0 0 25.5 0 0
AME Total 52.84 29.5 1 0 27.5 1 0
BBS DS 8.5 5 3 0 3 3 0
W 16 25.5 0 0 22.5 0 0
BBS Total 24.5 30.5 3 0 25.5 3 0
BEE DS 8 2 0 0 1 0 0
W 13.16 13 0 0 12 0 0
BEE Total 21.16 15 0 0 13 0 0
BLI DS 1 0 1 0 0 1 0
W 3 4 0 0 4 0 0
BLI Total 4 4 1 0 4 1 0
CMR DS 0 0 0 0 0 0 0
W 0 0 0 0 0 0 0
CMR Total 0 0 0 0 0 0 0
GCC DS 8 1 0 0 1 0 0
W 30.5 20 0 0 18 0 0
GCC Total 38.5 21 0 0 19 0 0
HSS DS 18.5 17 3 0 17 3 0
W 48.5 43 0 0 40 0 0
HSS Total 67 60 3 0 57 3 0
Grand Total 208 160 8 0 146 8 0

35
Full Time Other
School Status 2006/7 6th May 2008 Last Month
H O OC H O OC
AME DS 17 21.5 2 0 20.5 2 0
W 69.58 96.7 2.3 0 93.7 2.3 0
AME Total 86.58 118.2 4.3 0 114.2 4.3 0
BBS DS 17 8 7 1 7 5 1
W 59 34.5 19 0 33.5 17 0
BBS Total 76 42.5 26 0 40.5 22 1
BEE DS 9 8.5 5 0 7.5 5 0
W 43.42 63.3 6.7 0 63.3 5.7 0
BEE Total 52.42 71.8 11.7 0 70.8 10.7 0
BLI DS 10 4 6 0 4 6 0
W 11.5 12 12 0 13 11 0
BLI Total 21.5 16 18 0 17 17 0
CMR DS 0 0 1 0 0 1 0
W 2 0 0 0 0 0 0
CMR Total 2 0 1 0 0 1 0
GCC DS 17.5 17.5 0 0 17.5 0 0
W 43.5 58 13 0 52 11 0
GCC Total 61 75.5 13 0 69.5 11 0
HSS DS 39.5 42.5 0 0 40.5 0 0
W 101 91.5 6 0 86.5 6 0
HSS Total 140.5 134 6 0 127 6 0
Grand Total 440 458 80 1 439 72 1
Part Time
School Status 2006/7 6th May 2008 Last Month
H O OC H O OC
AME DS 48 25.2 1 0 24.2 1 0
W 117.66 89.9 0 1 88.9 0 1
AME Total 165.66 115 1 1 113.1 1 1
BBS DS 56.67 10 0 17 10 0 12
W 121.83 80 0 92 76 0 84
BBS Total 178.5 90 0 109 86 0 96
BEE DS 65 50.8 4 0 47.8 4 0
W 166.84 182 9 0 181.1 9 0
BEE Total 231.84 232.9 13 0 228.9 13 0
BLI DS 3 2 0 3 2 0 3
W 5 6 1 0 6 1 0
BLI Total 8 8 1 3 8 1 3
CMR W 1 2 0 0 2 0 0
CMR Total 1 2 0 0 2 0 0

36
GCC DS 12 3 0 3 3 0 2
W 45 14 0 20 13 0 17
GCC Total 57 17 0 23 16 0 19
HSS DS 67.33 61 0 0 54 0 0
W 151.67 146 1 0 138 1 0
HSS Total 219 207 1 0 192 1 0
Grand Total 861 671.9 16 136 646 16 119
In the data presented as FTEs, 208 Full Time Year 1 undergraduates therefore did not complete their studies last year against an apparently improved168 by May 2008 though one has to be cautious as June’s exam boards might add to withdrawals and we do not of course know how many students will return in September. Full Time Other has already risen from last year (440 against 458 Home and 80 Overseas) though Part Time is apparently improving (861 in 2006/07 compared to 823.9 by May 2008). This not only represents a significant financial loss to the University but also a loss of life aspirations for a considerable number of people and one wonders what effects this will have on their lives. As noted in the introduction, the University populace is in part characterised by its ability to attract non-traditional learners and there is a possibility that negative retention issues might in part be informed by low entry level qualifications. The table following shows the numbers of students who had withdrawn by entry qualification at the 14th of December 2007 census and includes those that failed to reenrol from the previous year: Table 2. Numbers withdrawn cross-referenced to highest entry qualification.
Qualification Description No. % of total Qualification Description No. % of total
Higher degree of UK HEI 62 3.5% Foundation course at HE level 5 0.3%
PgD/Cert exc. PGCE 30 1.7% Other HE qualification of less than degree standard 6 0.3%
PGCE with QTS 10 0.6% A' level equivalent not specified elsewhere 7 0.4%
PGCE without QTS 17 1.0% NVQ/SVQ level 3 324 18.5%
Other postgrad qual not specified elsewhere 4 0.2% ONC/OND 92 5.3%
First degree of UK HEI 282 16.1% Foundation course at FE level 10 0.6%
Graduate of EU Institution 4 0.2% Accredited ACCESS course (validated by QAA) 45 2.6%
Graduate of other overseas institution 56 3.2% Unaccredited ACCESS course (not validated by QAA) 3 0.2%
Foundation degree 11 0.6% Baccalaureate 1 0.1%
Graduate equivalent not elsewhere specified 1 0.1% ACCESS course prior to 2001 2 0.1%
OU Credits 1 0.1% GCSE 'O' level/SCE 'O' grades only 122 7.0%
Other credits from UK HEI 9 0.5% Other non-advanced qualification 157 9.0%
Cert/Dip of education 22 1.3% Mature student admitted on previous experience 3 0.2%
HNC/HND 148 8.5% Other non-UK Qualification level not known 138 7.9%
Dip HE 27 1.5% Student has no formal qualification 35 2.0%
GNVQ/GSVQ level 4 7 0.4% Professional qualifications 104 5.9%
NVQ/SVQ level 4 3 0.2% TOTAL 1748
The data indicates that almost 24% of the total loss represents students declaring at entry ‘O’ levels, ‘other non-advanced qualification’, ‘professional qualifications’ and ‘no formal qualifications.’

37
The above quantitative data bluntly suggests that if entry qualifications were raised fewer students would leave. However, as well as raising difficult ethical issues of the propriety of such a strategy and subsequent issues of widening participation, the research findings in the next section suggest the reasons are far more complex. Study findings. As noted in the introduction, the data accrued for the study was drawn from several sources and is presented thematically to help provide clarity, to create a format which elucidates strands and importantly to ensure confidentiality, sources of information being therefore non-attributable. The findings should not be viewed or interpreted as representing policy and practices at the University as a whole. Reading should be tempered by an appreciation that the study’s remit is to uncover issues negatively impacting upon retention and inevitably therefore there is a critical tone. There is obviously an enormous amount of good practice which reflects and informs a high quality of student experience for the majority. This section concentrates on the difficulties and inevitably therefore raises difficult concerns. However, if retention is to be enhanced, some of these issues will need to be addressed.
1. Academic staff attitudes towards students’ developmental needs. There appears to be instances of staff perceptions of students’ specific needs being unaddressed. Examples include weak inductions, students not being aware of their personal tutor or the role thereof, impatience towards individuals, and a general unawareness of specific areas of learning that need to be addressed.
2. Student assessment at entry Some students appear to have been given misleading or incorrect information on the nature of their course and their subsequent expectations are misconceived. In addition, there is a lack of initial and diagnostic assessment to measure developmental needs, an issue particularly applying to overseas students.
3. The University ‘climate.’ There is evidence that Bolton does not feel like a ‘real’ university to some students. This is difficult to quantify because many have no such comparable experience. However, points raised include the lack of crèche facilities, a degree from Bolton is not always perceived as being as good as from another

38
university, some inevitably find it difficult to settle in, there is too much time between lectures and generally facilities are considered less than adequate. 4. Pedagogical approaches. This is perhaps the mostly widely expressed concern. Experiences negatively impacting upon the student learning experience uncovered by the study include: a. Cramped room space. b. Feeling intimidated in large lecture theatre deliveries. Many students with
non-traditional qualifications are more confident working in small group sessions which act as a catalyst for debate and feel incapable of assimilating the level of information conferred in a lecturer-led delivery style.
c. Literacy needs, particularly amongst overseas students, is insufficiently addressed. This relates back to the point above about assessment.
d. Essay feedback is insufficiently identifying to the student areas to be addressed. Students sometimes feel demoralised by the feedback comments which are occasionally overtly negative. There are instances too of students not being made aware of their results until their transcripts are forwarded following exam boards.
e. Timetables are not always accurately composed. f. Students missing lectures do not always have opportunities to catch up. g. Emails to tutors are not always answered and tutorial opportunities are
sometimes insufficient. h. Students are not always clear as to the assessment criteria for
assignments or the protocol guidelines. i. There is a perception amongst a few that some lecturers mark more
generously than others stemming from differing tutor expectations. j. Module assessment deadlines overlap suggesting tutors are not co-
ordinating dates effectively. This leads to periods of frenetic student activity rather than a steady, planned timetable of learning.
5. Student support The following does not apply to either the disability service or the Student Experience Officers, both services being highly commended by many. General support issues arising and causing concern is another significant finding and includes: a. The aforementioned feedback concerns insufficiently detail what support
requirements are deemed necessary. b. Tutorial sessions are felt by a few to be unhelpful. c. As noted above, some are unsure as to their personal tutor. They
therefore are in a quandary as to who to approach for help.

39
d. Student Experience Officer roles are sometimes misconstrued and referrals are not always within their job remit.
e. Study skills sessions are insufficiently dovetailed into programmes. Also, there is a lack of ‘drop-in’ sessions, especially ones offering practical help in essay construction and Harvard referencing conventions. This concern is particularly evident, though not confined to, overseas students.
f. Overseas students were not always able to gain advice and therefore respond sufficiently to the requirements of Home Office visa renewal claims.
g. The counselling service was cited frequently as excellent though there were concerns from some students that it was too small to meet demand. Students unsurprisingly were occasionally reticent in availing themselves of the service because of stigma perceptions.
h. Student absence monitoring appears to be inconsistent. Registers are not always completed and it is not always clear who should follow up persistent absentees.
Recommendations. The research project is at an early stage and firm recommendations should be interpreted only as a first attempt to unravel the complexities that are beginning to emerge. It is highly likely more data will be gleaned to provide further insights. At this point in the exercise therefore, it is inevitable the recommendations presented should be cautiously generalised and act as a catalyst for further investigation. With the above provisos accepted, it is suggested as a starting point that consideration be given to:
a. Establishing a clearer entry procedure with induction points repeated. Guidance on the content of courses should be more specific.
b. Students be better informed as to their personal tutor. c. Programme leaders should integrate more tutorial times. These periods
could also be useful developmental sessions detailing more specifically assignment feedback.
d. Initial and diagnostic assessments should be rigorous and widespread. e. Module assessment criteria needs reinforcing and clarifying. f. Study skills, particularly for overseas students, should be expanded. g. Attendance be monitored more carefully and frequent absentees
contacted by personal tutors.

40
A last overarching point which needs further investigation is to reflect upon how teaching and learning can be delivered more flexibly to recognise and respond to a student populace with increasingly diverse developmental needs. It is important to reiterate again the above represents issues noted by the author as likely to be undermining retention. Their inclusion is not meant in any way to be viewed as reflecting general practice across the University. Conclusion. This report represents an interim stage within the first year of the fellowship project. Its findings are based upon data accrued from a variety of sources which now needs further investigation. It is intended to be read as a first attempt to unravel issues negatively impacting upon retention and is written with an appreciation that it raises more questions than answers. Throughout there has been an attempt to temper with caution the findings and not make bold statements. However, it is already clear that certain practices within the University would at least benefit from review and careful consideration.
References
Blair, T. (2004) The prime minister's speech to the IPPR think-tank and Universities UK joint conference on higher education reform. London. Davies P, Williams J, Webb S, Green P and Thompson A. (1994) "Mission Possible? Institutional Factors in Patterns of Alternative Entry to Higher Education", Scottish Journal of Adult and Continuing Education, Vol 1, No 2, 18-28. Dearing R (1996) Review of Qualifications for 16-19 Year Olds: Full Report, London: SCAA
Department of Education and Science (1988) Advancing A Levels, London: HMSO (Higginson Report).
Floud J (1963) "Memorandum submitted to Committee on Higher Education", Evidence – Part Two, London: HMSO, Cmnd 2154-XII, 45-57.
Hoggart R (1996) The Way We Live Now, London: Pimlico.

41
Williams G (1977) Editorial, Higher Education Quarterly, Vol. 51, No 1, January, 1-5. Yeo S (1997) Paper from a Seminar on Widening Participation in Higher Education held on 27 March 1997. London: Goldsmiths.
Appendix 2 Introduction. This report provides an appraisal of the 2008 University summer schools to determine their efficacy as an instrument to meet students’ developmental needs. Their introduction is not a new approach but one that has been encouraged to be developed to further increase retention rates. The University has an enviable reputation within the HE sector as a supporter of widening participation. The University’s Strategic Plan 2006 – 2012 notes the high percentage of young full time first degree entrants from NS-SEC classes 4-7 but retaining categories of students traditionally unlikely to undertake degree level study and who may be under-prepared for academic rigour remains a challenge. Table 1 below numerates the situation and informs the challenge for the University. Though it will quickly be seen there has been improvements in student retention, the overall pattern over the two academic years indicates similar trends at a level which needs to be addressed further. Table 1. Retention data comparison of end of academic years 2007 to 2008
UG = First Degree only
Full-time 1st. Year U/G Students
School
Full-time 1st
year U/G loss 2006-
07
1st yr. F/T U/G
Actual Studen
ts @ end of
07
Loss as %
of total students 2007
1st yr. F/T U/G
Actual Studen
ts @ 31 Jul
08
Target loss
(max.) 2008
(Benchmark = 14%)
W & DS @ 31 Jul
08
Loss as % of total
students 2008
AME 52.8 307.4 14.7 261.3 37 37.9 12.7
BBS 24.5 181.5 11.9 191 27 39.5 17.1
BEE 21.16 154 12.1 172.7 24 19.1 10.0
BLI 4 23 14.8 19 3 5 20.8
CMR 0 0 0.0 0 0 0 0.0

42
GCC 38.5 228.5 14.4 262.5 37 27.5 9.5
HSS 67 399.5 14.4 383.5 54 68 15.1
TOTAL 207.96 1293.9 1290 181 197
Full-time: all others
School
Other F/T loss 2006-
07
Other F/T
Actual Studen
ts @ end of
07
Loss as %
of total students 2007
Other F/T
Actual Studen
ts @ 31 Jul
08
Target loss
(max.) 2008
(Benchmark = 14%)
W & DS @ 31 Jul
08
Loss as % of total
students 2008
AME 86.6 579.46 13.0 947 133 134.5 12.4
BBS 76 395 16.1 524 73 71 11.9
BEE 52.4 409 11.4 692 97 87.5 11.2
BLI 21.5 134.67 13.8 186.5 26 37 16.6
CMR 2 26 7.1 48 7 2 4.0
GCC 61 330.33 15.6 489 68 91.5 15.8
HSS 140.5 857.5 14.1 1049 147 157.5 13.1
TOTAL 440 2731.96 3935.5 551 581
Part-time Students
School
Part-time loss
2006/07
P/T Actual Studen
ts @ end of
07
Loss as %
of total students 2007
P/T Actual Studen
ts @ 31 Jul
08
Target loss
(max.) 2008
(Benchmark = 14%)
W & DS @ 31 Jul
08
Loss as % of total
students 2008
AME 165.6 1059.3 13.5 998.9 140 142.6 12.49
BBS 178.5 1639.8 9.8 1227 172 235.5 16.10
BEE 231.8 1269.8
6 15.4 1285.6 180 268.9 17.30
BLI 8 67.5 10.6 110 15 13 10.57
CMR 1 7 12.5 5 1 2 28.57
GCC 57 374 13.2 156.5 22 43 21.55
HSS 219 1151.5 16.0 1180 165 242 17.02
TOTAL 860.9 5568.96 4963 695 947
• last year students in the last semester of their course on a non standard academic year (Feb. enrollers) were categorised as part time

43
** The BEE student numbers are up because there are a number of Engineering withdrawals which were categorised as GCC last year *** The 2006/7 numbers now include the written off from students who did not return after the 2005/6 summer break.
Summer schools are one small part in the jigsaw of enhancing student retention and as will be seen a mostly positive strategy. However, it is important to note that the scope and depth of the investigation is somewhat limited because of a lack of data forthcoming from Schools. After numerous requests for information it would appear only the Business School and the School of Arts, Media and Education had records of attendance. Methodology A simple questionnaire (appendix A) of 25 questions inviting via a Likert scale of 1 to 5 levels of statement agreement was used via telephone contact followed by an opportunity for interviewees to contribute an opinion on any aspect of the summer schools. Complete confidentiality was assured at the start of the interview and it was made clear they could refuse to partake or withdraw at any stage. Responses to statements were recorded simply as ticks so there is no record of individuals against statements. The research design and implementation was approved by the School of Arts, Media and Education’s Ethics Committee. It is accepted that the Likert approach invites apparent quantitative tabulation via a more subjective and therefore qualitative judgment from respondents and therefore reliability and validity can be compromised (Bañuelas, and Antony, 2007). Allen et al (2007) also note issues of addressing neutrality (scored as 3 on my version) which alludes to a level of agreement which the interviewee may not have felt. Heine et al (2002) suggest there are difficulties in a formal pro forma of recognising cultural differences, an area not considered in this study. Whilst recognising such limitations the data collated and presented here from a small sample base is offered as an indicative appraisal that manages to tease out trends and issues. The next section tabulates by School the responses juxtaposed with a short commentary. Results.
1. The Bolton Business School Academic staff provide results tutorials on the 16th and 17th of June and two study skill/improvement sessions, a traditional approach of taught sessions over a prescribed time which attracted 17 students some of whom attended more than one session. Sessions were delivered by Ruth Coward, the Arts, Media and Education Student Experience Officer and divided into Preparing for Exams and Preparing for Assignments, both choices available on the same day and split

44
between morning and afternoon. Appendix B is the flyer given to students who were also reminded of the sessions via email. To appraise the efficacy of the taught sessions, 13 replies via telephone interviews were recorded. Two students declined to be interviewed and one student could not be contacted. Table 2 below provides a summation of responses against each question.
Table 2. Business School Summer School feedback
Rate the items below using the following scale:
1-Strongly disagree, 2-Disagree, 3-Unsure, 4-Agree, 5-Strongly agree
I. OUTCOMES Scale
1 2 3 4 5
Number of scores against each question:
1. The Summer School broadened my understanding of concepts and principles in my field of study.
0 2 3 5 3
2. The Summer School improved my ability to successfully complete assignments.
0 1 3 4 5
3.The Summer School significantly improved my study skills 0 1 3 4 5
4. I am clear as to why my studies were not meeting the course requirements
0 0 3 0 10
5.The material presented in the Summer School was relevant to my studies
0 0 2 6 5
6. I feel confident my level of academic performance has been improved
0 0 3 6 4
7. With the new skills I have learnt I would expect my grades to improve.
0 0 2 9 2
8. I have practiced at home some of the skills taught 0 0 3 5 5
II. LECTURES Scale
9.Staff provided examples of good practice 0 0 3 6 4
10.Staff were aware of my specific needs 0 0 3 10 0
11.There were opportunities to discuss my specific needs. 0 0 8 5 0
12.The sessions reflected the things I need to improve upon. 0 0 4 4 5
13. The level of the sessions was appropriate to my needs. 0 0 3 6 4

45
14. My intellectual curiosity was stimulated 0 0 3 5 5
15. The sessions were long enough. 0 0 2 2 9
16. The learning materials were well organised. 0 0 3 4 6
17. I was able to broach any subject relevant to my needs 0 0 5 5 3
18. Staff were readily available for Q&A outside the taught periods 0 0 11 1 1
COMMUNICATION Scale
19. I was given sufficient notification to make plans to attend 0 0 0 2 11
20. With the new skills I have learnt I would expect my grades to improve.
0 0 0 4 9
21. I was clear of the times and dates of the sessions 0 0 0 1 12
VIII. OVERALL SATISFACTION Scale
22 Overall general support was good. 1 0 0 8 4
23. The Summer School was well organised. 1 0 0 8 4
24. The Summer School addressed my study needs. 0 0 3 6 4
25. Overall, the Summer School met my expectations. 0 0 3 6 4
IX. COMMENTS
26. What suggestions do you have for improving the summer school?
“More on exam techniques” “Children unattended and bored between sessions” “Not subject specific enough. Too general” “More subject specific sessions” “The sessions really helped me to understand what I was doing wrong” Commentary It is a credit to the staff that “4. I am clear as to why my studies were not meeting the course requirements” with a 10 score against the highest level agreement correlates strongly to “7. With the new skills I have learnt I would expect my grades to improve” with a 9 score to a level of 4 assent. Clear evidence here of developmental needs being recognised and responded to. This is further

46
collaborated by “7. With the new skills I have learnt I would expect my grades to improve” with 9 of the 13 scoring at the highest 5.Oddly, “The Summer School broadened my understanding of concepts and principles in my field of study” did not score as well but when this apparent anomaly was queried, respondents felt that the question appertained to specialist subject knowledge rather than generic study skills. It was good to note many were practicing the new found skills at home. The Communication section indicates strongly that students were well informed of the times and dates of the sessions. It was perhaps unfair after so many positive scores that the invitation to comment mostly produced negativity. The “More subject specific sessions” was shared by several who wanted what amounted essentially to subject revision sessions. Ruth Coward produced her own appraisal of the sessions she delivered, figure 1 below, which mostly complements and reinforces the results of this study: Figure 1. BBS Summer School Workshops Feedback
0
1
2
3
4
5
6
7
8
9
10
Excellent Very good Good Fair Poor
General view of workshop
Level of engagement / interest

47
0
2
4
6
8
10
12
14
Yes No Not sure
workshop will improve academicperformance
workshop has improved study skills /knowledge
workshop has improved confidence instudy skills
0
2
4
6
8
10
12
14
16
Yes No
Would you recommend
workshop to friends
Would like to be contacted
about further sessions
The School also helpfully forwarded a list of 96 students who attended academic counseling, 10 of whom attended the taught sessions. Interestingly, 8 didn’t receive counseling but still attended the workshops. Lastly, in addition to the workshops, tutors were available for two days in the summer to offer advice on the basis of the “make good sheets” sent out to referred and deferred students.
2. The School of Arts, Media and Education
Results The School adopted a more flexible model than the Business School with sessions mixing email correspondence with individual tutorials and taught

48
classes. When interviewing students, several had to be prompted to appreciate they had taken part perhaps not recognising the summer school as a separate entity but rather the contact was seen a continuum of good practice within their studies. This perception was reinforced by one tutor who maintained email contact throughout the summer and found that the majority of students who had work to complete were in contact. The School’s approach was strongly content-based with elements of study skills taught but the emphasis was upon reinforcing subject knowledge. The closeness to the end of the second semester teaching to the revision sessions provided continuity to the student learning experience emphasised by several interviewed who had no idea they had attended revision sessions, their perception being they were just receiving further guidance as was usual throughout the year. The transcript of results were examined as part of this study and they clearly showed this was a targeted group needing significant additional guidance, the majority having failed at least one module and several were borderline passes for a third classification. Such an approach has considerable merits as a sensitive approach which avoids the stigmitisation of failure but the occasional lack of appreciation that this was an organised revision opportunity questions the extent the sessions were communicated. Lastly, and it might be coincidental, but as a cohort they were much harder to contact than the Business School’s because several had part time jobs, the NatWest (2008) study suggesting four in ten students will have to work part-time in order to support their university studies confirming the trend. It’s worth noting too Callender’s (2006) correlation of the negative effects of part time employment on degree success. 24 students were recorded as attending one or more of the sessions, individual and/or group. Three telephoned had no recollection of the event whatsoever, one declined to be interviewed and three were unavailable which equates to 17 interviews. Because approaches were very much individualised, statement 18 was not considered. Table 3 below tabulates the responses
Table 3. Arts, Media and Education Summer School feedback form
Rate the items below using the following scale:
1-Strongly disagree, 2-Disagree, 3-Unsure, 4-Agree, 5-Strongly agree
I. OUTCOMES Scale
1 2 3 4 5
1. The Summer School broadened my understanding of concepts 0 2 2 6 7

49
and principles in my field of study.
2. The Summer School improved my ability to successfully complete assignments.
0 0 2 6 9
3.The Summer School significantly improved my study skills 0 2 3 6 6
4. I am clear as to why my studies were not meeting the course requirements
0 0 0 4 13
5.The material presented in the Summer School was relevant to my studies
0 0 3 4 10
6. I feel confident my level of academic performance has been improved
0 2 3 5 7
7. With the new skills I have learnt I would expect my grades to improve.
0 0 4 5 8
8. I have practiced at home some of the skills taught 0 0 5 5 7
II. LECTURES Scale
9.Staff provided examples of good practice 0 0 1 6 10
10.Staff were aware of my specific needs 0 0 1 7 9
11.There were opportunities to discuss my specific needs. 0 0 0 7 10
12.The sessions reflected the things I need to improve upon. 0 0 2 7 8
13. The level of the sessions was appropriate to my needs. 1 0 2 7 7
14. My intellectual curiosity was stimulated 0 2 2 8 5
15. The sessions were long enough. 0 0 1 6 10
16. The learning materials were well organised. 0 0 1 6 10
17. I was able to broach any subject relevant to my needs 0 0 1 6 10
18. Staff were readily available for Q&A outside the taught periods
COMMUNICATION Scale
19. I was given sufficient notification to make plans to attend 0 4 5 6 2
20. With the new skills I have learnt I would expect my grades to improve.
0 2 2 4 9
21. I was clear of the times and dates of the sessions 0 4 5 4 4

50
VIII. OVERALL SATISFACTION Scale
22 Overall general support was good. 0 2 1 7 7
23. The Summer School was well organised. 0 2 3 6 6
24. The Summer School addressed my study needs. 0 2 4 6 5
25. .Overall, the Summer School met my expectations. 0 2 4 6 5
IX. COMMENTS
26. What suggestions do you have for improving the summer school?
“Left felt feeling my work was rubbish”. Able now to link the practical aspects to the theory”. Good. Helped. Better understanding of what I needed to do.” “Feel more confident now” Commentary. One disaffected student’s negativity stands out and slightly skews what was obviously for the majority a very successful exercise. The high 13 at a level 5 score for “4. I am clear as to why my studies were not meeting the course requirements” strongly suggests students are more focused on what is required of them which is supported by the 10 agreeing to “5.The material presented in the Summer School was relevant to my studies” at a level 5 of agreement. This also suggests the strength of the sessions were the emphasis upon individualised approaches. The ‘lectures’ category also scores high with a succession of 10s at the highest level agreement reflecting what must have been a planned approach organised around recognised areas of developmental need. It is ironic and almost perverse therefore that ‘Overall Satisfaction’, though very positive, didn’t score higher. Findings The evidence is strong that both Schools’ revision weeks, though delivered to slightly different formats, have been enormously beneficial to the students. There is a strong theme in both sets of data of students being engaged and staff being supportive. In both cases too, it is clear that students have been identified as needing additional support, the Business School supplementing the generic study skills elements with tutorials and counseling but also offering help to referred and deferred students. Arts, Media and Education adopted a similar approach though their emphasis was upon revisiting areas of need and providing individual guidance, study skills possibly being addressed but not as a separate activity.

51
In terms of enhancing retention, the high scoring statements “20. With the new skills I have learnt I would expect my grades to improve” and 4. I am clear as to why my studies were not meeting the course requirements” for both cohorts bodes well for the future. Students would now seem to have a fuller understanding of areas of study to be addressed and one would expect them to carry such insights into the future. What is perhaps disappointing is the low attendance for both Schools. Table 1 at the start of this paper indicates a level of support need beyond these sessions. However, to balance this apparent discrepancy, this study found evidence of staff providing email support in their own time which served the same purpose as the formalised sessions. It would be a reasonable conclusion to suggest other Schools provided comprehensive and highly effective summer school sessions but sadly none were able to provide names of attendees so their value could not be evaluated. The School of Health and Social Sciences provided a revision schedule (appendix C) which lists a very wide range of specialist sessions but student names apparently were left unrecorded. Conclusion The remit of this study was to investigate across the University the effectiveness of the summer schools in supporting students mostly designated as vulnerable in terms of academic attainment. Its findings have been limited to data from two Schools though both indicate the sessions are of significant value to students. It would seem from the 30 telephone interviews that only one student has decided to leave. One cannot be sure whether the other 29 were in danger of departing but the fact that they mostly found the summer school experience positive strongly suggests the sessions were worthwhile and will have raised self esteem. It is reasonable therefore to surmise that they should be considered as a highly effective mechanism to enhance retention. Recommendations.
• Summer schools should be promoted more extensively and widely
• All deferred and referred students should be invited to attend.
• They should be viewed as a continuum of the student experience, not an ‘add-on’ at the end of the academic year
• Staff should maintain records of attendance as part of the process of tracking student progress

52
References Allen, I. Elene., and Seaman, C. A., (2007). Likert Scales and Data Analyses. Quality Progress, 40, 64-65 Bañuelas, R. and Antony, J. (2007). Application of Stochastic Analytic Hierarchy Process within a Domestic Appliance Manufacturer. The Journal of the Operational
Research Society, 58, 29-39. Callender, C for Universities UK (2006), Part time students and part time study in higher education in the UK. Strand 3: a survey of students’ attitudes and experiences of part time study and its costs 2005/06. London: Universities UK. Heine, S., Lehman, D.R., Kaiping, P. and Greenholz, J. (2002), What's wrong with cross-cultural comparisons of subjective Likert scales?: The reference-group effect. Journal of personality and social psychology. vol. 82, no6, pp. 903-918 NatWest (2008), Student Living Index. London: NatWest Bank