A Widening Generational Divide? Assessing the Age Gap in ...
264
Department of Political and Social Sciences A Widening Generational Divide? Assessing the Age Gap in Voter Turnout Between Younger and Older Citizens Kaat Smets Thesis submitted for assessment with a view to obtaining the degree of Doctor of Political and Social Sciences of the European University Institute Florence, March 2010
-
Upload
khangminh22 -
Category
Documents
-
view
1 -
download
0
Transcript of A Widening Generational Divide? Assessing the Age Gap in ...

Department of Political and Social Sciences
A Widening Generational Divide?Assessing the Age Gap in Voter Turnout
Between Younger and Older Citizens
Kaat Smets
Thesis submitted for assessment with a view to obtaining the degree of Doctor of Political and Social Sciences of the European University Institute
Florence, March 2010

EUROPEAN UNIVERSITY INSTITUTE
Department of Political and Social Sciences
A Widening Generational Divide?
Assessing the Age Gap in Voter Turnout Between
Younger and Older Citizens
Kaat Smets
Thesis submitted for assessment with a view to obtaining the degree ofDoctor of Political and Social Sciences of the European University Institute
Examining board:Prof. Alexander H. Trechsel, European University Institute (Supervisor)Prof. Andre Blais, Universite de Montreal (External supervisor)Prof. Mark N. Franklin, European University InstituteProf. Marc Hooghe, Catholic University Leuven
c© 2010, Kaat SmetsNo part of this thesis may be copied, reproduced ortransmitted without prior permission of the author
SMETS, Kaat (2010), A Widening Generational Divide? Assessing the Age Gap in Voter Turnout Between Younger and Older Citizens European University Institute
DOI: 10.2870/15899

0.4pt0pt
ii
SMETS, Kaat (2010), A Widening Generational Divide? Assessing the Age Gap in Voter Turnout Between Younger and Older Citizens European University Institute
DOI: 10.2870/15899

Abstract
This thesis departs from the observation that in some countries such as Canadathe age gap in voter turnout between younger and older citizens is widening. Itdoes so because of a rapid turnout decline among the youngest electoral cohorts.These findings prompt the following question: What are trends in the age gap invoter turnout between younger and older citizens in other Western democracies,and how can these trends be accounted for?
Plotting over-time age differences for ten countries, this thesis shows that agepatterns in voter turnout are far from generic. Evidence of a widening genera-tional divide is found in Canada, Denmark, Great Britain, Norway, and the UnitedStates. The age gap in Finland, Germany, Italy, the Netherlands and Sweden, onthe hand, turns out to be relatively stable or even trendless through time.
Turning from description to explanation, this thesis presents a novel hypoth-esis to account for declining turnout levels among young voters. Combining thelife-cycle and cohort/generation approaches to age differences in political participa-tion, the later maturation hypothesis examines the idea that the timing of certainlife-cycle events that are considered important for the development of political par-ticipation varies from one generation to the next. Since key events such as leavingschool, starting a first job, getting married and starting a family nowadays takeplace at a higher average age than they used to, later maturation should be ableto explain turnout decline among young voters at least partially.
Based on data from the British Election Studies from 1964 to 2005, this thesisshows that delays in the timing of life-cycle events are indeed negatively relatedto individual level youth voter turnout. Attendance of religious services, levelsof political interest, turnout at previous elections, perceived party differences andstrength of party identification also explain over-time differences in youth voterturnout. The largest share of individual level youth turnout is, however, accountedfor by turnout trends in the rest of the electorate.
iii
SMETS, Kaat (2010), A Widening Generational Divide? Assessing the Age Gap in Voter Turnout Between Younger and Older Citizens European University Institute
DOI: 10.2870/15899

At the aggregate level later maturation is also shown to explain part of thewidening of the age gap. The political-institutional context, however, explainsbetween-country differences best.
iv
SMETS, Kaat (2010), A Widening Generational Divide? Assessing the Age Gap in Voter Turnout Between Younger and Older Citizens European University Institute
DOI: 10.2870/15899

Acknowledgements
Unlike some others perhaps, writing a doctoral dissertation is certainly not some-thing that I have aspired from a young age onwards. On the contrary, I struggledthrough the last year of primary school as well as the first years of high school.School – in my view as a teenager – was surely a waste of time. Stepping down onelevel in high school turned out to be my saving. I ended up studying journalismand enjoyed my work as a journalist for a regional newspaper afterwards.
I was still very young when I started my first full time job and the letter thatI received stating that I would need to work another ‘44 years and 3 months untilmy legal pension age’ certainly spurred the decision to go back to school. Studyinglaw would mean another four years in post-secondary education, political sciencejust two. The choice was easily made.
Somehow, however, finishing my master studies in political science still did notsatisfy me as I was determined to show myself that I was able to conquer the nextacademic level as well. The thesis that you find yourself reading at this moment isthe fruit of this determination (although those that know me would probably saythat stubbornness might be an appropriate label as well...).
Surely if I could start over right now this thesis would have looked differently.However, making mistakes is part of the learning process that comes with studyingat any given level. Likewise this thesis might have turned out better if I had workedon it for another year. That is, however, not the exercise. This thesis is the bestthat I could come up within the four years and under the circumstances that weregiven to me. My personal goal has therefore been satisfied. All I can hope now isthat some of my work will be of interest to the rest of the academic communityand that I will be able to do something that is somehow relevant to society withthe knowledge that I have gathered.
During the past four years Alex Trechsel has kept an eye on me and the progressthat I made while I worked on the thesis. Belonging to his first cohort of EUIsupervisees, I hope that it has been a positive experience for him as well. One ofthe advantages of having a younger supervisor is surely that he or she can still
v
SMETS, Kaat (2010), A Widening Generational Divide? Assessing the Age Gap in Voter Turnout Between Younger and Older Citizens European University Institute
DOI: 10.2870/15899

vividly remember what it was like to write a dissertation. Alex has always providednothing but his full support for me to be able to live PhD experience to the fullest.The occasional supervision session at the Blu Bar in Le Cure or the pizzeria inSan Domenico are characteristics of his style that I will think back about with asmile.
Andre Blais also deserves a very special thank you. When I was looking togain extra experience abroad, he invited me to stay at his research chair instantly– e-mailing me back within 12 hours after I had come up with the courage to askif I could come and visit. My stay in Montreal has been one of the highlights ofmy career as a doctoral student. Moreover it was a wonderful personal experience.With Andre as my external co-supervisor I was as lucky as to always receiveinstant feedback and have someone by my side who would truly think through myquestions and problems. The experience has inspired me about the kind of mentorthat I hope to be to my own students later on.
Of my other two jury members, I would like to thank Mark Franklin for neverfailing to make time for me when I was puzzled about how to proceed or stuckwith my statistical analyses. Although receiving his advice and comments was notalways as easy, my thesis has improved a lot because of them. I am also thankfulto Marc Hooghe for taking the time and effort to be one of my jury members.Before I started as a PhD student at the EUI, I discussed my research proposalwith him in Leuven. Marc being part of my defense committee makes the circleround.
There are many other people without whom I would not be where I am rightnow. Be it because they provided me with inspiration, help, or with a listening ear.Some people deserve extra special attention, however. Rik, without whom I wouldnot have embarked on this journey (and who read this thesis from front to back:mijn dank is groot! ). Even though we decided that we had to go our separateways, I am very happy that we’re still in each other’s life as friends. EvelyneI want to thank for sharing the whole adventure with me: highs, lows, laughing,joking, complaining and all. We’ll have to keep seeing each other, because it seemsthat we never got around to half of our plans. Ale deserves thanks for draggingme through the summer of 2008 and being my rock on several other occasions.Stefano made sure to check in several times a day to see whether I was still alivewhile I was working in a slightly self-destructive manner to get this thesis done. Iam ever so grateful to whoever kept bringing him on my path over the past twoyears.
Then there are many people who I have been lucky to meet over the pastyears and who have been important in some way or another. They are too manyto mention, but the following people certainly deserve to be named here: Bea-trijs, Gabriella, Marie-Ange, Alessandra, Francoise, Fiamma, Antonella, Loredana,
vi
SMETS, Kaat (2010), A Widening Generational Divide? Assessing the Age Gap in Voter Turnout Between Younger and Older Citizens European University Institute
DOI: 10.2870/15899

Cinzia and Gjovalin who helped me on various occasions and made my life at theEUI easier and more pleasant; my friends and colleagues Yvette, Christel, Chris,Michael, Patryk, Bruno, Masha, Igor, Carolien, Sergi, Elias, Till, Chiara, Anja,and Gema; as well as all the wonderful people I was lucky to meet and work withduring my stay at the CRCES: Sebastien (and the FoNN and the FcoDHH), Peter,Jiyoon, Frederick, Eugenie, Pascal, Christophe, Patrick, Simon, Silvina, Agnieszka,Henry and Romain. Dave I would like to thank for the speedy language correctionof my thesis.
Everyone mentioned here has pitched in in their own sort of way and I amgrateful for this. My friends and family in the Netherlands and Belgium deservethe last lines, however. They never complained about my absence and did their fairshare of trouble shooting taking care of business for me at home. Sigrid, Walter,Lente en Inden; oma en opa; opa; Lotte, Daan en Anke, moeke en vake: bedanktvoor alles!
Kaat Smets
Firenze, January 2010
vii
SMETS, Kaat (2010), A Widening Generational Divide? Assessing the Age Gap in Voter Turnout Between Younger and Older Citizens European University Institute
DOI: 10.2870/15899

viii
SMETS, Kaat (2010), A Widening Generational Divide? Assessing the Age Gap in Voter Turnout Between Younger and Older Citizens European University Institute
DOI: 10.2870/15899

Contents
1 Introduction 1
1.1 Point of Departure: The Canadian case . . . . . . . . . . . . . . . . 3
1.2 Research justification and specification . . . . . . . . . . . . . . . . 7
1.3 Structure of the thesis . . . . . . . . . . . . . . . . . . . . . . . . . 10
2 Age differences in political participation 15
2.1 The age gap in political participation . . . . . . . . . . . . . . . . . 16
2.1.1 Life-cycle effect . . . . . . . . . . . . . . . . . . . . . . . . . 16
2.1.2 Cohort and generation effects . . . . . . . . . . . . . . . . . 21
2.1.3 Period effect . . . . . . . . . . . . . . . . . . . . . . . . . . . 29
2.2 Declining turnout among young adults explained . . . . . . . . . . . 33
2.2.1 An alienated youth? . . . . . . . . . . . . . . . . . . . . . . 34
2.2.2 What is wrong with electoral politics? . . . . . . . . . . . . 37
2.3 Theoretical framework, hypotheses, and research design . . . . . . . 41
3 Trends in age differences in voter turnout 51
3.1 Data . . . . . . . . . . . . . . . . . . . . . . . . . . . . . . . . . . . 52
3.2 Younger versus older voters through time . . . . . . . . . . . . . . . 53
ix
SMETS, Kaat (2010), A Widening Generational Divide? Assessing the Age Gap in Voter Turnout Between Younger and Older Citizens European University Institute
DOI: 10.2870/15899

Contents
3.3 Following cohorts through time . . . . . . . . . . . . . . . . . . . . 62
3.4 Conclusion and discussion . . . . . . . . . . . . . . . . . . . . . . . 69
4 Later maturation and turnout trends among young citizens 73
4.1 The life-cycle model: in need of an update or overdue? . . . . . . . 75
4.2 Data . . . . . . . . . . . . . . . . . . . . . . . . . . . . . . . . . . . 84
4.3 Comparing life-cycle’s . . . . . . . . . . . . . . . . . . . . . . . . . 88
4.4 Turnout by life-cycle indicators . . . . . . . . . . . . . . . . . . . . 92
4.5 Conclusion and discussion . . . . . . . . . . . . . . . . . . . . . . . 103
5 Later maturation versus alternative explanations of youth turnout
decline 107
5.1 Turnout decline among young voters: a brief recap of theoretical
explanations . . . . . . . . . . . . . . . . . . . . . . . . . . . . . . . 109
5.2 Later maturation versus (other) resource and mobilization factors . 115
5.3 Later maturation versus campaign-related factors . . . . . . . . . . 123
5.4 Later maturation versus competitiveness indicators . . . . . . . . . 133
5.5 Later maturation versus alternatives: bringing everything together . 139
5.6 Conclusion and discussion . . . . . . . . . . . . . . . . . . . . . . . 147
6 Shifting perspectives: the age gap at the aggregate level 149
6.1 A summary of trends in the age gap . . . . . . . . . . . . . . . . . . 150
6.2 Trends in the age gap through time and space: a theoretical expla-
nation . . . . . . . . . . . . . . . . . . . . . . . . . . . . . . . . . . 153
6.2.1 Changes in characteristics of voters . . . . . . . . . . . . . . 153
6.2.2 Changes in characteristics of elections . . . . . . . . . . . . . 154
x
SMETS, Kaat (2010), A Widening Generational Divide? Assessing the Age Gap in Voter Turnout Between Younger and Older Citizens European University Institute
DOI: 10.2870/15899

Contents
6.2.3 Hypotheses . . . . . . . . . . . . . . . . . . . . . . . . . . . 159
6.3 Data and methods . . . . . . . . . . . . . . . . . . . . . . . . . . . 160
6.3.1 Data . . . . . . . . . . . . . . . . . . . . . . . . . . . . . . . 160
6.3.2 Methodological issues . . . . . . . . . . . . . . . . . . . . . . 162
6.4 Results . . . . . . . . . . . . . . . . . . . . . . . . . . . . . . . . . . 164
6.5 Conclusion and discussion . . . . . . . . . . . . . . . . . . . . . . . 171
7 Conclusion and discussion 175
7.1 Findings . . . . . . . . . . . . . . . . . . . . . . . . . . . . . . . . . 177
7.2 Implications . . . . . . . . . . . . . . . . . . . . . . . . . . . . . . . 181
Appendices 184
A Description of the data sets used 185
B Additional information and analyses chapter four 191
B.1 A note on the multiple imputation of missing data . . . . . . . . . . 191
B.2 Summary statistics chapter four . . . . . . . . . . . . . . . . . . . . 195
B.3 Additional models chapter four . . . . . . . . . . . . . . . . . . . . 200
C Additional information and analyses chapter five 207
C.1 Summary statistics chapter five . . . . . . . . . . . . . . . . . . . . 207
C.2 Additional models chapter five . . . . . . . . . . . . . . . . . . . . . 215
C.3 Analyses with a full sample of the electorate . . . . . . . . . . . . . 220
D Additional information and analyses chapter six 223
D.1 Description and origin of the variables . . . . . . . . . . . . . . . . 223
D.2 Additional analyses chapter six . . . . . . . . . . . . . . . . . . . . 226
xi
SMETS, Kaat (2010), A Widening Generational Divide? Assessing the Age Gap in Voter Turnout Between Younger and Older Citizens European University Institute
DOI: 10.2870/15899

Contents
References and bibliography 228
xii
SMETS, Kaat (2010), A Widening Generational Divide? Assessing the Age Gap in Voter Turnout Between Younger and Older Citizens European University Institute
DOI: 10.2870/15899

List of Tables
3.1 Global summary of the data . . . . . . . . . . . . . . . . . . . . . . 53
3.2 Summarizing trends in the age gap, 1960s-2000s . . . . . . . . . . . 70
4.1 Availability of life-cycle indicators, BES 1964-2005 . . . . . . . . . . 86
4.2 Turnout by life-cycle indicators for young voters aged 35 years or
less, BES 1964-2005 . . . . . . . . . . . . . . . . . . . . . . . . . . . 97
5.1 Availability of alternative indicators, BES 1964-2005 . . . . . . . . 113
5.2 Later maturation versus (other) resource and mobilization indica-
tors: expected effects . . . . . . . . . . . . . . . . . . . . . . . . . . 119
5.3 Turnout by later maturation versus resources and mobilization in-
dicators for young voters aged 35 years or less, BES 1964-2005 . . . 121
5.4 Later maturation versus campaign-related indicators: expected effects130
5.5 Turnout by later maturation versus campaign indicators for young
voters aged 35 years or less, BES 1964-2005 . . . . . . . . . . . . . 131
5.6 Later maturation versus competitiveness indicators: expected effects 135
5.7 Turnout by later maturation versus competitiveness indicators for
young voters aged 35 years or less, BES 1964-2005 . . . . . . . . . . 137
xiii
SMETS, Kaat (2010), A Widening Generational Divide? Assessing the Age Gap in Voter Turnout Between Younger and Older Citizens European University Institute
DOI: 10.2870/15899

List of Tables
5.8 Turnout by later maturation versus alternatives for young voters
aged 35 years or less - mean turnout older votes excluded, BES
1964-2005 . . . . . . . . . . . . . . . . . . . . . . . . . . . . . . . . 142
5.9 Explaining turnout decline among young British voters after 1990 . 143
5.10 Turnout by later maturation versus alternatives for young voters
aged 35 years or less - mean turnout older votes included, BES
1964-2005 . . . . . . . . . . . . . . . . . . . . . . . . . . . . . . . . 146
6.1 Modelling the age gap in voter turnout (without lagged dependent
variable), 1960s-2000s . . . . . . . . . . . . . . . . . . . . . . . . . . 166
6.2 Modelling the age gap in voter turnout (with lagged dependent vari-
able), 1960s-2000s . . . . . . . . . . . . . . . . . . . . . . . . . . . . 170
B.1 Missing data in chapter four and five . . . . . . . . . . . . . . . . . 192
B.2 Summary statistics chapter five BES 1964-2005, subsample ≤35 years195
B.3 Summary statistics chapter five BES 1964, subsample ≤35 years . . 195
B.4 Summary statistics chapter five BES 1966, subsample ≤35 years . . 196
B.5 Summary statistics chapter five BES 1970, subsample ≤35 years . . 196
B.6 Summary statistics chapter five BES 1974 (Feb.), subsample ≤35
years . . . . . . . . . . . . . . . . . . . . . . . . . . . . . . . . . . . 196
B.7 Summary statistics chapter five BES 1974 (Oct.), subsample ≤35
years . . . . . . . . . . . . . . . . . . . . . . . . . . . . . . . . . . . 197
B.8 Summary statistics chapter five BES 1979, subsample ≤35 years . . 197
B.9 Summary statistics chapter five BES 1983, subsample ≤35 years . . 197
B.10 Summary statistics chapter five BES 1987, subsample ≤35 years . . 198
B.11 Summary statistics chapter five BES 1992, subsample ≤35 years . . 198
xiv
SMETS, Kaat (2010), A Widening Generational Divide? Assessing the Age Gap in Voter Turnout Between Younger and Older Citizens European University Institute
DOI: 10.2870/15899

List of Tables
B.12 Summary statistics chapter five BES 1997, subsample ≤35 years . . 198
B.13 Summary statistics chapter five BES 2001, subsample ≤35 years . . 199
B.14 Summary statistics chapter five BES 2005, subsample ≤35 years . . 199
B.15 Turnout by life-cycle indicators for young voters aged 35 years or
less, BES 1964-2005 (before imputation of missing indicators) . . . 200
B.16 Turnout by life-cycle indicators for young voters aged 35 years or
less, BES 1964-2005 (maturation index with 4 items) . . . . . . . . 201
B.17 Turnout by life-cycle indicators for young voters aged 35 years or
less, BES 1964-2005 (maturation index with 5 items) . . . . . . . . 202
B.18 Turnout by life-cycle indicators for young voters aged 35 years or
less, BES 1964-2005 (birth cohorts instead of age variable) . . . . . 203
B.19 Turnout by life-cycle indicators for young voters aged 35 years or
less, BES 1964-2005 (decades instead of period dummy) . . . . . . . 204
B.20 Turnout by maturation for young voters aged 35 years or less, BES
1964-2005 (with period*maturation interaction term) . . . . . . . . 205
C.1 Summary statistics chapter six BES 1964-2005, subsample ≤35 years207
C.2 Summary statistics chapter six BES 1964, subsample ≤35 years . . 208
C.3 Summary statistics chapter six BES 1966, subsample ≤35 years . . 208
C.4 Summary statistics chapter six BES 1970, subsample ≤35 years . . 209
C.5 Summary statistics chapter six BES 1974 (Feb.), subsample ≤35 years209
C.6 Summary statistics chapter six BES 1974 (Oct.), subsample ≤35
years . . . . . . . . . . . . . . . . . . . . . . . . . . . . . . . . . . . 210
C.7 Summary statistics chapter six BES 1979, subsample ≤35 years . . 210
C.8 Summary statistics chapter six BES 1983, subsample ≤35 years . . 211
xv
SMETS, Kaat (2010), A Widening Generational Divide? Assessing the Age Gap in Voter Turnout Between Younger and Older Citizens European University Institute
DOI: 10.2870/15899

List of Tables
C.9 Summary statistics chapter six BES 1987, subsample ≤35 years . . 211
C.10 Summary statistics chapter six BES 1992, subsample ≤35 years . . 212
C.11 Summary statistics chapter six BES 1997, subsample ≤35 years . . 212
C.12 Summary statistics chapter six BES 2001, subsample ≤35 years . . 213
C.13 Summary statistics chapter six BES 2005, subsample ≤35 years . . 213
C.14 Turnout by later maturation versus resources and mobilization indi-
cators for young voters aged 35 years or less, BES 1964-2005 (before
imputation of missing indicators) . . . . . . . . . . . . . . . . . . . 215
C.15 Turnout by later maturation versus campaign indicators for young
voters aged 35 years or less, BES 1964-2005 (before imputation of
missing indicators) . . . . . . . . . . . . . . . . . . . . . . . . . . . 216
C.16 Turnout by later maturation versus competitiveness indicators for
young voters aged 35 years or less, BES 1964-2005 (before imputa-
tion of missing indicators) . . . . . . . . . . . . . . . . . . . . . . . 217
C.17 Turnout by maturation index versus alternatives for young voters
aged 35 years or less - mean turnout of older voters excluded, BES
1964-2005 (before the imputation of missing indicators) . . . . . . . 218
C.18 Turnout by life-cycle indicators versus alternatives for young voters
aged 35 years or less - mean turnout of older voters included, BES
1964-2005 (before imputation of missing indicators) . . . . . . . . . 219
C.19 Individual level variables for explaining turnout, BES 1964-2005 . . 220
C.20 Turnout by Individual Level Variables, BES 1964-2005 . . . . . . . 221
C.21 Turnout by Individual Level Variables (young 35), BES 1964-2005 . 222
xvi
SMETS, Kaat (2010), A Widening Generational Divide? Assessing the Age Gap in Voter Turnout Between Younger and Older Citizens European University Institute
DOI: 10.2870/15899

List of Tables
D.1 Modelling the age gap in voter turnout (mean age at 1st marriage),
1960s-2000s . . . . . . . . . . . . . . . . . . . . . . . . . . . . . . . 226
D.2 Modelling turnout among young voters (aged ≤35 years), 1960s-2000s227
D.3 Modelling turnout among older voters (aged >35 years), 1960s-2000s228
xvii
SMETS, Kaat (2010), A Widening Generational Divide? Assessing the Age Gap in Voter Turnout Between Younger and Older Citizens European University Institute
DOI: 10.2870/15899

List of Tables
xviii
SMETS, Kaat (2010), A Widening Generational Divide? Assessing the Age Gap in Voter Turnout Between Younger and Older Citizens European University Institute
DOI: 10.2870/15899

List of Figures
1.1 Canadian trends in turnout by cohort . . . . . . . . . . . . . . . . . 4
2.1 The life-cycle of political participation (schematic) . . . . . . . . . . 17
2.2 Theoretical framework as derived from the literature reviewed (schematic) 43
3.1 The age gap in turnout for ten Western democracies, 1960s-2000s . 54
3.2 Turnout by birth cohort for nine Western democracies, 1960s-2000s 64
4.1 The life-cycle of political participation (updated) . . . . . . . . . . 77
4.2 Turnout by age group before and after 1990, BES 1964-2005 . . . . 89
4.3 Average maturation score by age group before and after 1990, BES
1964-2005 . . . . . . . . . . . . . . . . . . . . . . . . . . . . . . . . 91
4.4 Predicted probability of turnout based on model 2a, BES 1964-2005 102
6.1 The age gap in turnout for ten Western democracies, 1960s-2000s . 151
xix
SMETS, Kaat (2010), A Widening Generational Divide? Assessing the Age Gap in Voter Turnout Between Younger and Older Citizens European University Institute
DOI: 10.2870/15899

List of Figures
xx
SMETS, Kaat (2010), A Widening Generational Divide? Assessing the Age Gap in Voter Turnout Between Younger and Older Citizens European University Institute
DOI: 10.2870/15899

Chapter 1
Introduction
Over the past two hundred years, gradual lowering of the minimum voting age has
increased the franchise to ever-younger citizens (see Katz, 1997 for an overview).
Seemingly curious, it is precisely these young cohorts that make least use of their
right to vote. There is, however, nothing new about this: young adults are often
considered notorious non-voters as they have for a long time been known to turn
out at lower levels than older age groups (Nie, Verba and Kim, 1974; Topf, 1995b;
Galston, 2001; Gidengil et al., 2003).
Recent research suggests that although young adults have long been identified
as the group of the electorate least likely to vote, turnout among young cohorts is
declining rapidly. It does so at a much faster pace than the turnout among older
age groups. In other words, not only do today’s young adults turn out to vote at
much lower levels than their parents and grandparents did when they were young,
the age gap in turnout between younger and older voters is widening as well.
The above-described trends have been particularly well documented in Canada
(Gidengil et al., 2003; Pammett and LeDuc, 2003; Johnston, Matthews and Bit-
tner, 2007) and Great Britain (Phelps, 2004, 2006). The question of whether
similar trends exist in other western democracies as well, so far, remains unan-
1
SMETS, Kaat (2010), A Widening Generational Divide? Assessing the Age Gap in Voter Turnout Between Younger and Older Citizens European University Institute
DOI: 10.2870/15899

swered. Moreover, it is unclear what processes can explain over-time trends in the
age gap in political participation as well as the turnout decline among younger
voters which is causing this divide. Combining the above, this research focuses on
the following central research question:
- What are the trends in the age gap in voter turnout between younger and
older citizens, and how can these trends be accounted for?
This thesis aims to make a contribution to (youth) political participation re-
search in a twofold way. Central to this research is the presumed gap in turnout
levels between younger and older age groups. Trends in the difference in turnout
between younger and older citizens are, first, assessed longitudinally and country-
comparatively. The focus of the research will be on advanced industrial Western
democracies. Secondly, after having observed patterns in the age gap in turnout,
competing hypotheses concerning explanations for these trends are put to the test.
Also central throughout this thesis will be a novel yet intuitive explanation for
declining turnout levels among young voters. Fully rooted in the life-cycle and
cohort/generation models of age differences in political participation, the later
maturation hypothesis examines the idea that by going through life-cycle events
that are considered to be important for the development participation at an older
average age, young citizens are nowadays less inclined to turn out to vote than
young people of the past. In other words, the later maturation hypothesis combines
age and generation effects by reasoning that different cohorts and generations have
different patterns of ageing. These different patterns of ageing cause differences in
participation levels. Although later maturation is by no means considered the sole
explanation of turnout decline among young voters, this thesis strongly focusses
2
SMETS, Kaat (2010), A Widening Generational Divide? Assessing the Age Gap in Voter Turnout Between Younger and Older Citizens European University Institute
DOI: 10.2870/15899
Chapter 1. Introduction
on the idea that changed patterns of maturation should at least partially explain
declining levels of turnout among younger voters. The later maturation hypothesis
will be introduced in detail in the next chapter setting out the the theoretical
framework of the thesis.
Before dedicating a few words to the justification of this research at the end of
this introductory chapter, the Canadian research on which this project builds, and
by which the central research question was inspired, deserves attention. Taking
the Canadian case as a point of departure allows us to get a better understanding
of the research puzzle and also sets out the main contours of the debate.
1.1 Point of Departure: The Canadian case
In 2008, the Canadian federal elections recorded an historically low turnout rate
with slightly fewer than 59% of the electorate casting a vote. From 1945 up to
1988, an average of 75% of the registered voters still turned up at the polls in
Canada. After this period, turnout rates for the federal elections began to fall,
with the turnout rates of 2008 the lowest ever recorded.
The Canadian drop in voter turnout since 1988 is not the result of an overall
lack of participation by the Canadian electorate: Turnout decline has mainly been
caused by young people born after 1970 staying away from the polling booth (Blais
et al., 2002; Rubenson et al., 2004; Gidengil et al., 2003; Pammett and LeDuc,
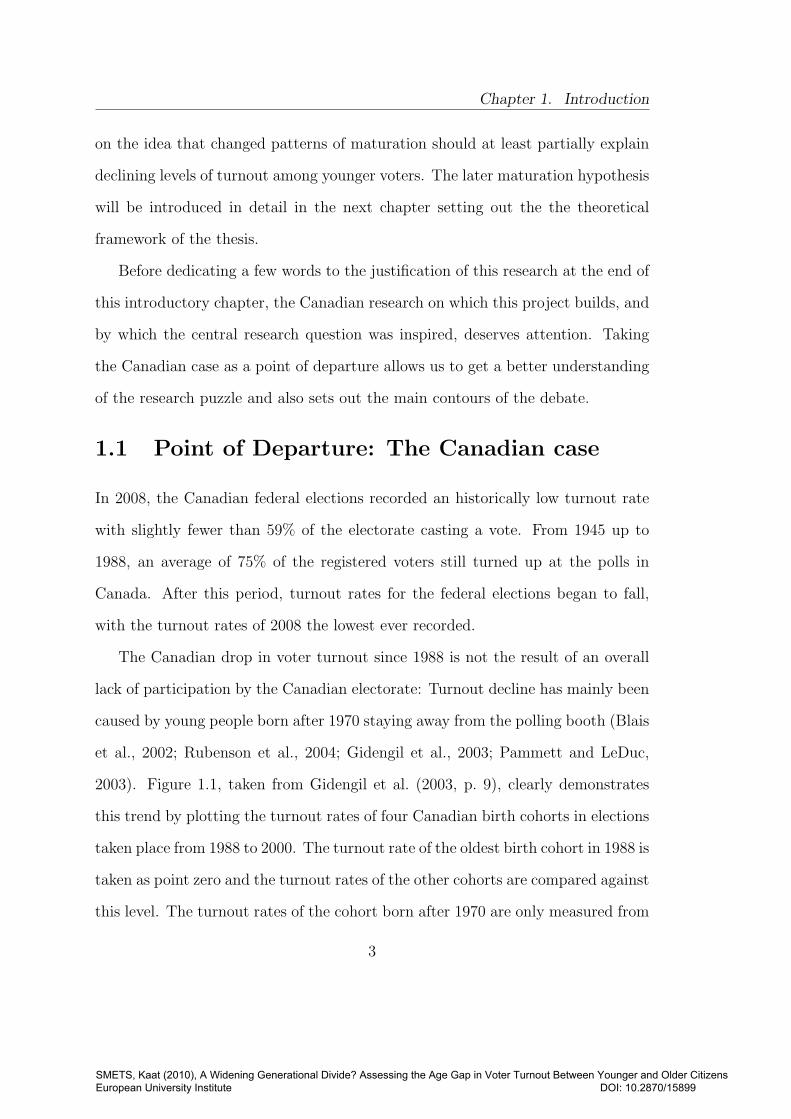
2003). Figure 1.1, taken from Gidengil et al. (2003, p. 9), clearly demonstrates
this trend by plotting the turnout rates of four Canadian birth cohorts in elections
taken place from 1988 to 2000. The turnout rate of the oldest birth cohort in 1988 is
taken as point zero and the turnout rates of the other cohorts are compared against
this level. The turnout rates of the cohort born after 1970 are only measured from
3
SMETS, Kaat (2010), A Widening Generational Divide? Assessing the Age Gap in Voter Turnout Between Younger and Older Citizens European University Institute
DOI: 10.2870/15899

1.1. Point of Departure: The Canadian case
1993 onwards, as this was the first opportunity for citizens of this age group to
vote.
source: (Gidengil et al., 2003, p. 9)
Figure 1.1: Canadian trends in turnout by cohort
Figure 1.1 visualizes the described drop in general turnout levels, as well as the
larger contribution of the youngest age groups to the decline. For each observed
birth cohort after the one that includes citizens born before 1945 participation
rates have dropped through time. The decline for the oldest three birth cohorts
has, however, only been marginal between 1988 and 2000. The same cannot be
said for the turnout rate of citizens born after 1970. This youngest age group shows
a clear and steep decline in turnout behaviour between 1993 and 2000, marking
the beginning of what seems to be a widening generational divide (Gidengil et al.,
2003).
Whether similar trends in the age gap in voter turnout as in Canada exist
in other advanced industrial democracies so far remains largely unknown. An
exception is the work of Phelps (2004, p. 244) that demonstrates that there are
considerable differences in the turnout patterns of various birth cohorts in Britain.
4
SMETS, Kaat (2010), A Widening Generational Divide? Assessing the Age Gap in Voter Turnout Between Younger and Older Citizens European University Institute
DOI: 10.2870/15899
Chapter 1. Introduction
The first aim of this research is, therefore, to explore over-time patterns in the
age difference in turnout in a cross-national setting. Questions to be answered
include the following: Do we find evidence of a widening generational divide in
other advanced industrial democracies besides Canada? If so, is this pattern also
caused by rapidly declining turnout levels among young people? In a second step,
explanations for observed trends will be assessed. What can explain why contem-
porary youth turns out at much lower levels than their parents or grandparents
did when they were young? Possible between-country differences in the age gap
also deserve attention.
Even with regard to the Canadian case the answers to some of these questions
are still to be explored. To my knowledge, no studies exist that research over-time
changes in the age gap. Several studies have, however, researched the age gap
apparent in the 2000 Canadian federal elections (i.e. the age gap at a single point
in time). A quick review of these studies provides an idea of where to start looking
for indicators that can explain over-time changes in the age gap. Summarizing,
four types of explanations have been tested to explain the gap in voter turnout
between people under and those of and above the age of 30 in the Canadian
federal elections of 2000: socio-demographic features, political system variables,
measurements of political cynicism, and lastly political knowledge and interest.
Where it is usually assumed that young people refrain from participating in
electoral forms of political participation, such as voting in elections, because they
are alienated from the political system (see e.g. Henn, Weinstein and Wring, 2002),
young Canadians were actually found to be less cynical than their older counter-
parts (Gidengil et al., 2003; Blais et al., 2002; Rubenson et al., 2004; O’Neill,
2003). Young people’s lack of political interest and political knowledge was found
5
SMETS, Kaat (2010), A Widening Generational Divide? Assessing the Age Gap in Voter Turnout Between Younger and Older Citizens European University Institute
DOI: 10.2870/15899

1.1. Point of Departure: The Canadian case
to be able to account for part of the gap in turnout between younger and older
age groups (Blais et al., 2002; Rubenson et al., 2004). Howe (2003), moreover, not
only shows that in Canada the age gap in political knowledge increases with each
successive cohort, he also notes that political knowledge becomes a more impor-
tant indicator for political participation. Together, these factors could, thus, be
used to explain the widening generational divide in turnout levels.
Blais et al. (2002) and Rubenson et al. (2004) also looked at the influence of
political system variables, such as identification with a party, mobilization and
the perceived party competition. Young Canadians did identify themselves less
frequently with a political party than older age groups. In addition, they had
been contacted and asked to vote fewer times by political parties than older birth
cohorts. Since both variables were found to have a positive effect on voter turnout,
they explain part of the age gap in the 2000 Canadian federal elections. Perception
of party competition was not found to have an influence on turnout.
By far the largest part of the 2000 Canadian age gap in voter turnout between
those under and those of or older than 30 years could be accounted for by socio-
demographic factors (Rubenson et al., 2004). In fact, almost a third of the turnout
difference between younger and older voters could be explained by the fact that
young voters share traits that are known to decrease the probability of turnout,
such as low income, low levels of religiosity, low rates of marriage, etc.
Although the above studies focus on one point in time, they provide a spring-
board for exploring over-time change in the age gap in voter turnout. The next
chapter will provide an extended overview of theoretical explanations for age dif-
ferences in political participation. Moreover, it explores how rapidly declining
turnout levels among young cohorts during the last two decades are explained in
6
SMETS, Kaat (2010), A Widening Generational Divide? Assessing the Age Gap in Voter Turnout Between Younger and Older Citizens European University Institute
DOI: 10.2870/15899

Chapter 1. Introduction
the literature. Before turning to the theoretical framework of this thesis, let us
briefly inquire into why it is valuable to study the turnout differences between
cohorts and/or generations.
1.2 Research justification and specification
‘Democracy is not just a spectator sport - it requires the active involve-ment of its citizens’ (Dalton, 2000, p. 57).
The manner in which people participate in politics is fundamental for the way a
political system functions. In classical and contemporary theories of democracy,
political participation is seen as a way of protecting private interests while simul-
taneously making sure that good government is practised (see Held 1996; Pateman
1970). It is, therefore, not difficult to guess why many academics have and have
had an interest in the question of how and why people come to participate in poli-
tics. As the primary mechanism with which to implement the principle of popular
sovereignty, electoral participation in particular has received scholarly attention.
This thesis focuses on age differences in turnout. Canadian research shows
that there is increasing divergence between the turnout levels of younger and older
voters. This divergence is primarily caused by a turnout decline among young
adults. Young voters grow into older voters. Unless the losses are made up as
young people age, participation trends of young people can thus provide a preview
of the future functioning of democracy (Sigel and Hoskin, 1981).
Firstly, if low levels of turnout among young adults persist as these citizens age,
overall levels of turnout are at stake. Opinions differ on whether mass political
participation is a good thing for democracy (see Barnes and Kaase, 1979, p. 28-31
7
SMETS, Kaat (2010), A Widening Generational Divide? Assessing the Age Gap in Voter Turnout Between Younger and Older Citizens European University Institute
DOI: 10.2870/15899

1.2. Research justification and specification
and Kriesi, 2005, p. 2-6 for an overview of this discussion). Political inactivity can
be seen as a consequence of contentment about the way politics is functioning, as
well as a sign of aversion and apathy towards politics.
Low levels of participation are, however, often seen as a problem for democracy.
Lower bases can be a sign of declining support for democracy and rejection of
the political system and is often seen as a sign of growing distrust and cynicism
(Armingeon, 1994; IDEA, 1999; Henn, Weinstein and Wring, 2002; Franklin, 2004).
If each new cohort entering the electorate is more alienated and disaffected with
democracy than their parents or grandparents were when they were young, in the
long run support for the democratic system could reach alarmingly low levels.
Since elections are based on the principle of equality (one man, one vote), low
turnout among certain groups in society makes the operation of electoral democ-
racy unequal. This may endanger both legitimacy and representation (Lutz and
Marsh, 2007).1 Low levels of participation among younger people can – both in
the short and in the long term – lead to selective representation. This, in its
turn, could lead to young adult’s interests not being taken into account in policy
making processes. The solution to this problem is, of course, relatively simple.
By partaking in the political decision-making process young people could easily
make themselves more visible to politicians. However, young cohorts may either
not care (see the argument above) or there may be something more structural that
prevents them from participating in the political process.
Because young people are presumed not yet to be set in their political ways, it is
believed that social, cultural, political and historical changes have a higher impact
1While the view that low turnout constitutes a democratic dilemma with regard to equal rep-resentation is widely held, empirical evidence for this assumption is scarce indeed. For exceptionssee: Pettersen and Rose (2007); Rosema (2007); Rubenson et al. (2007).
8
SMETS, Kaat (2010), A Widening Generational Divide? Assessing the Age Gap in Voter Turnout Between Younger and Older Citizens European University Institute
DOI: 10.2870/15899

Chapter 1. Introduction
on this age group than on older adults whose political orientations were shaped
years before. Focussing on young adults, in this sense, provides an indication of
what is going on in the electorate at large. To understand current and future trends
in political behaviour it thus is fundamental to focus on young people (Hooghe,
2004, p. 333; Stolle and Hooghe, 2004, p. 423; Franklin, 2004).
Although considerations of democratic health are an implicit reason for study-
ing age differences in turnout and changes in turnout levels among young people,
the aim of this thesis is not to make normative judgments on the (future) state
of the democratic system. The focus of this study is on explaining past trends.
By assessing different mechanisms through which turnout develops over the life
span, an educated guess can be made about future developments in voter turnout
towards the end of this thesis. Emphasis, however, will be on explaining rather
than on predicting.
This thesis focuses solely on voter turnout. It is generally assumed that in many
Western democracies citizens are withdrawing from traditional forms of political
participation. Voter turnout is declining, party membership is at an all-time low,
and people, in general, are thought to be disengaged from traditional politics.
Many scholars, however, support the idea that political participation is simply
becoming less institutional and more individual as people tend to turn to more
activist forms of political participation, such as demonstrating, signing petitions,
and buying or boycotting products. In this perspective, it is the political behaviour
of young people that seems to be most affected by the new patterns of political
participation that have emerged over the last decades (see e.g. Amna, Munck and
Zetterberg, 2004; Dekker, 2002; Norris, 2003; Topf, 1995a).
9
SMETS, Kaat (2010), A Widening Generational Divide? Assessing the Age Gap in Voter Turnout Between Younger and Older Citizens European University Institute
DOI: 10.2870/15899

1.3. Structure of the thesis
Researching turnout instead of a broader battery of forms of political partici-
pation, is however justified, as the question why young people are less involved in
traditional forms of political participation than previous generations still requires
an answer. Voter turnout receives most attention of all traditional forms of partic-
ipation and this bias in the literature is by no means surprising. Voting has been,
and still is, the most exercised form of political participation (Topf, 1995b, p. 31).
Moreover, and more important for this research, it is a rather uniform act, which
increases its comparability (Hooghe and Kavadias, 2005, p. 9).
It should be noted that this research will not be aimed at factors that deter-
mine the direction of electoral participation of young people (i.e. what party they
vote for). In line with Milbrath (1965), I argue that decisions about the direction
of political participation are not the same as the question whether or not to partic-
ipate at all. Even though an interesting line of research, focusing on party choice
as well as on turnout would very much expand and complicate this research.
1.3 Structure of the thesis
In this introductory chapter the central research question and main goals of this
thesis as well as its origin have been discussed. Very briefly this research centers
around age differences in voter turnout and turnout decline among younger voters.
The aim is to both describe and explain overtime trends in the age gap in voter
turnout and it is assumed that – as observed in Canada – changes in young people’s
turnout levels play a disproportionate role in movements of the age gap. In addition
to identifying the research puzzle, in this first chapter a justification for the research
to be conducted has been provided. The next chapter will present an overview
of the literature on age differences in turnout. We will look into the theoretical
10
SMETS, Kaat (2010), A Widening Generational Divide? Assessing the Age Gap in Voter Turnout Between Younger and Older Citizens European University Institute
DOI: 10.2870/15899

Chapter 1. Introduction
mechanisms accounting for the age gap in political participation and address how
young citizen’s increasing abstention from participation in electoral politics can
be explained. Although the two issues overlap, they are usually explained with a
different battery of explanatory indicators.
After reviewing the literature, the main hypotheses to be assessed in this the-
sis will be identified. Particular attention will be paid to the later maturation
hypothesis that is central throughout this research. The later maturation hy-
pothesis explains young people’s abstention by arguing that different generations
experience certain life-cycle events at a different average age. Because this aver-
age age has increased overtime, as people stay in school longer, start their first
job later, postpone marriage, put off starting a family, etc., a larger proportion of
young citizens can be expected to abstain. Fully rooted in the life-cycle and gen-
eration theory of political participation, the later maturation hypothesis provides
an intuitive – yet original – explanation for (part of) the turnout decline among
young voters. The second chapter also discusses the research design of the thesis.
It provides an overview of the data to be used and touches upon estimation issues
and other methodological considerations.
In the next chapter the first aim of this thesis will be addressed. This third
chapter provides an overview of over-time age differences in voter turnout in ten
advanced Western democracies. The main finding is that, contrary to conventional
wisdom, age patterns in voter turnout differ greatly from country to country.
Evidence of a widening generational divide is found in Canada, Denmark, Great
Britain, Norway, and the United States. Movement of the age gap in the latter
four countries, just like in Canada, is largely caused by the turnout pattern of
younger voters. The age gap in Finland, Germany, Italy, the Netherlands, and
11
SMETS, Kaat (2010), A Widening Generational Divide? Assessing the Age Gap in Voter Turnout Between Younger and Older Citizens European University Institute
DOI: 10.2870/15899

1.3. Structure of the thesis
Sweden on the other hand, turns out to be relatively stable or simply trendless
over time. These descriptive findings prompt two questions: What can explain
over-time trends in the age gap (or more specific: how do we explain overtime
turnout decline among young adults) and how do we account for the between-
country differences?
In the fourth chapter we turn from description to explanation as the question
to what extent later maturation can account for the turnout decline among young
voters – which in its turn causes patterns of a widening generational divide – as
observed in some countries in chapter three is assessed. Using individual level
data from the British Election Studies, an index of characteristics of maturation is
created. Average scores of young people on this maturation index – as expected –
are found to decline overtime, indicating a trend towards later maturation. Since
maturation itself is positively related to turnout among young adults, later matu-
ration has a negative impact on the turnout levels of younger citizens. Although
effects should not be exaggerated, analyses demonstrate that life-cycle delays can
account for roughly 10% of the overtime decline in turnout among young adults
in Great Britain.2
Although it takes a central position in this thesis, the later maturation hypoth-
esis is by no means the only hypothesis that can be derived from the literature to
explain overtime turnout decline among young people. These alternative explana-
tions to turnout decline take a central place in the fifth chapter. By confronting
them with the later maturation hypothesis, two aims are served. First, it provides
an overview of as wide a range as possible of mechanisms that can explain the
2After controlling for other explanatory factors in the subsequent chapter, later maturationis still found to explain 7,3% of pre/post 1990 differences in youth voter turnout in Great Britain.
12
SMETS, Kaat (2010), A Widening Generational Divide? Assessing the Age Gap in Voter Turnout Between Younger and Older Citizens European University Institute
DOI: 10.2870/15899

Chapter 1. Introduction
turnout decline among younger voters. Secondly, it allows us to see how well the
later maturation hypothesis behaves in a better specified environment. The results
of the chapter indicate that the results of the fourth chapter are robust. Matu-
ration plays a positive and highly significant role in all estimated models. Since
we know that the proportion of young adults that has experienced an x number
of life-cycle events by a certain age is declining overtime, later maturation can be
concluded to play a role in the lower turnout levels of young people. Apart from
indicators of maturation, factors such as attendance of religious services, politi-
cal interest, turnout at previous elections, perceived differences between political
parties, and strength of party identification are also found to significantly explain
over-time differences in youth voter turnout. The most important indicator of
youth voter turnout in Great Britain is, however, turnout the average turnout
level of the rest of the electorate. This indicate that turnout levels of younger and
older voters go hand in hand.
In order to provide an additional robustness check of the later maturation
hypothesis, the sixth chapter assesses its validity at the aggregate level. With
data from 10 countries spanning a period between 1960 and 2003, the maturation
hypothesis is contrasted with other aggregate level explanatory factors of age dif-
ferences in voter turnout. These are mostly characteristics of elections, related to
the electoral system and the party system. Taking the actual age gap as the de-
pendent variable, in this chapter too later maturation is observed to explain part
of the widening age differences in voter turnout. Political-institutional variables
were found to best explain between-country differences.
13
SMETS, Kaat (2010), A Widening Generational Divide? Assessing the Age Gap in Voter Turnout Between Younger and Older Citizens European University Institute
DOI: 10.2870/15899

1.3. Structure of the thesis
14
SMETS, Kaat (2010), A Widening Generational Divide? Assessing the Age Gap in Voter Turnout Between Younger and Older Citizens European University Institute
DOI: 10.2870/15899

Chapter 2
Age differences in politicalparticipation
Age differences in political participation represent a common feature of demo-
cratic polities. Recently, however, researchers have identified what seems to be
the beginning of a widening generational divide in voter turnout in Canada. This
widening of the age gap is mainly caused by the changes in the turnout pattern of
young Canadians. Although turnout levels are declining among both younger and
older citizens, they do so much more rapidly among young adults. This causes the
difference in turnout between younger and older voters to become larger.
Differences in levels of political participation between younger and older voters
have received scholarly attention for many decades. This chapter reviews how the
existence of the age gap in political participation is explained in the literature.
Particular attention will be paid to whether and how over-time changes in the
difference in participation between younger and older citizens are accounted for.
The second part of the chapter focuses on theoretical explanations of turnout
decline among younger voters through time. Although very much related to the
question of why there is an age gap in voter turnout to begin with, the question why
15
SMETS, Kaat (2010), A Widening Generational Divide? Assessing the Age Gap in Voter Turnout Between Younger and Older Citizens European University Institute
DOI: 10.2870/15899

2.1. The age gap in political participation
young people are less inclined to turn out to vote than their parents or grandparents
did when they were young is usually considered separately, and is answered with
a different battery of explanatory factors.
2.1 The age gap in political participation
Generally, three types of mechanisms are used to explain age differences in political
participation: age (here referred to as life-cycle), period and cohort/generation
effects. All types of explanation focus on the question whether or not political
participation levels vary over the life span, and why distinct participatory patterns
between age groups emerge.
This section discusses how each of the mechanisms perceives the way in which
age differences in levels of political participation come about, as well as the differ-
ences and similarities between the approaches. As we will see, making a theoretical
distinction between the mechanisms is easier than disentangling them empirically.
Since the interest of this thesis is in over-time changes in the age gap in turnout,
this time dimension will receive special attention.
2.1.1 Life-cycle effect
According to the age effect – as the name already suggests – participation levels
increase with age. Young people are therefore expected to turn out at lower levels
than older citizens and this explains why we observe an age gap. Age in itself
does however not necessarily affect political involvement. Rather than the number
of years that have passed, it is more likely the experience that comes with age
that influences behaviour. The political life-cycle theory is based on precisely the
assumption that participation levels rise over the life span as people grow older and
16
SMETS, Kaat (2010), A Widening Generational Divide? Assessing the Age Gap in Voter Turnout Between Younger and Older Citizens European University Institute
DOI: 10.2870/15899

Chapter 2. Age differences in political participation
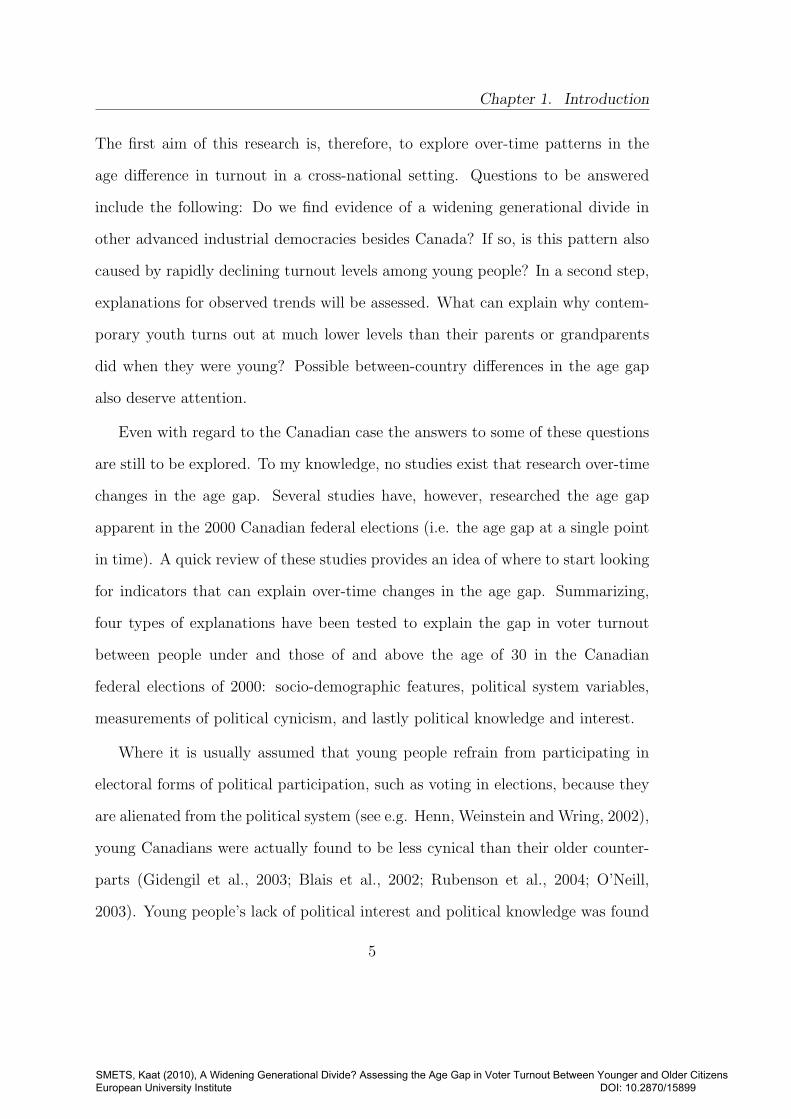
experience certain life events. Hence, the theory specifies why turnout patterns
change as people age. As such, it perceives the relationship between age and
political participation to be curvilinear rather than linear (see figure 2.1).
Figure 2.1: The life-cycle of political participation (schematic)
Young people, it is argued in the life-cycle theory, participate less in politics
because of their low attachment to civic life, a characteristic that is fuelled by
young people still going through education, being occupied with finding a partner,
trying to establish a career, having higher mobility, dealing with the psychological
transformation into adulthood, etc. Together these characteristics lead young
people to be politically inexperienced and to have little political interest, skills
and knowledge (i.e. to have few political resources). This, in its turn, makes
political participation both more difficult and less meaningful to this age group
(Strate et al., 1989, p. 443; Jankowski and Strate, 1995, p. 91).
17
SMETS, Kaat (2010), A Widening Generational Divide? Assessing the Age Gap in Voter Turnout Between Younger and Older Citizens European University Institute
DOI: 10.2870/15899

2.1. The age gap in political participation
In middle-age, participation rates are thought to stabilise at a higher level as
people leave the parental home, buy a house, get a full-time job, start a family,
settle down in a community, etc. Even though many of these processes demand
time, they are associated with activities (involvement in organizations, associa-
tions, the community, etc.) that tend to enhance political participation due to
increased motivation, mobilisation, skills, and pressure (Strate et al., 1989, p. 444;
Lane, 1959, p. 218; Kinder, 2006). All in all, the middle-aged seem to have the
best cards to understand politics and their part in it (Jankowski and Strate, 1995,
p. 91), which is most likely the reason why this stage of the political life-cycle is
often used as a base against which to compare the political participation levels of
younger and older citizens (Braungart and Braungart, 1986, p. 210).
The participation rates of older age groups, namely, tend to fall under the
influence of, for example, health problems, retirement and declining family income.
In sum, it is a more general disengagement from social life that leads to a lower
attachment to political life (Cutler and Bengtson, 1974, p. 163). Note that it is
extremely difficult to isolate some of the above-mentioned effects from changes
in the composition of the electorate. Older birth cohorts have lower educational
levels than younger ones. As such, this is a potential explanatory factor of older
people’s lower levels of turnout that falls outside the life-cycle argument per se.
Secondly, a large share of the elderly live alone which means that the potential
motivation by a politically active spouse falls away. Also, the ratio of women to
men increases with age, and women have traditionally participated less in politics
than men (see Strate et al., 1989, p. 444; Kohli and Kunemund, 2005, p. 351-352;
and also Goerres, 2007). In short, composition effects may account for part of
18
SMETS, Kaat (2010), A Widening Generational Divide? Assessing the Age Gap in Voter Turnout Between Younger and Older Citizens European University Institute
DOI: 10.2870/15899

Chapter 2. Age differences in political participation
the pattern in age differences in turnout that we observe and should therefore be
considered.
The life-cycle argument seems to fit well with observed participatory rates in
conventional or traditional forms of political participation such as voter turnout.
A curvilinear relationship is indeed shown to exist between age and turnout in
Western European countries (Norris, 2003; Stolle and Hooghe, 2005a; Garcıa Al-
bacete, 2009). Moreover, the relationship between age and and turnout is found
to be largely the same in Western democracies (IDEA, 1999, p. 24).
So far, the political life-cycle has mostly been conceived as a static curvilinear
relationship. However, we do not know whether the life-cycle of political partic-
ipation really exists, or whether its shape differs across time and space. In fact,
if the shape of the political life-cycle is indeed static through time, the life-cycle
argument cannot account for changes in turnout differences between younger and
older citizens as the distance between the two age groups would remain stable
through time (see Kimberlee, 2002, p. 88 for a similar argumentation). In other
words, in order for life-cycle events to be able to account for over-time change in
the age gap, generations or cohorts must differ with regard to the timing at which
they experience such events.
In recent years a de-institutionalization and de-standardization of the family,
educational and occupational life-cycle has been identified in the sociological lit-
erature (Kohli, 2003, p. 532-533; Mayer, 2004, p. 172). Similar patterns of hetero-
geneity are likely to have taken place in the political life-cycle too: It is generally
assumed that most events that are characteristic of the early and middle stages of
the life-cycle have moved to a higher average age. Moreover, individual pathways
19
SMETS, Kaat (2010), A Widening Generational Divide? Assessing the Age Gap in Voter Turnout Between Younger and Older Citizens European University Institute
DOI: 10.2870/15899

2.1. The age gap in political participation
tend to be much more varied than they were in the past (European Commission,
2001a, p. 9). In the new millennium, young people stay in school longer because
of their higher educational levels, have extended co-habitation with – as well as
longer financial dependence on – their parents, and consequently face postponed
full entry into the labour market (Pirie and Worcester, 1998; Billari and Wilson,
2001; European Commission, 2001b; Billari and Kohler, 2002; Furstenberg, Jr.
et al., 2003; Kennedy, 2004; OECD, 2007). Summarizing, today’s young cohorts
no longer marry and set up house in their early twenties. Instead most events that
define ‘maturation’ or ‘adulthood’ are experienced later on in life.
The above-described trends give reason to believe that the shape of the political
life-cycle as it has so far been perceived may no longer fit with reality. Seemingly
facing more and/or extended start-up problems than young people of previous
generations, political participation patterns of today’s youth can be expected to
have been affected. The life-cycle mechanism produces age differences in political
participation, but in order for it to produce overtime changes in age differences
in turnout cohorts need to experience life-cycle events at a different pace. More
sharply put: if the movement of several characteristics of the political life-cycle to
a higher average age does not translate into changes in turnout patterns of young
people, we have serious reasons to doubt the over-time validity of the life-cycle
model.
The idea that later maturation may have negatively affected young citizen’s
turnout rates has, to my knowledge, not yet been assessed in the youth turnout
literature. Its assessment is, however, not only justified from a theoretical per-
spective but also from an empirical one. As may be recalled from the previous
chapter, the largest part of the 2000 age gap in voter turnout was explained by
20
SMETS, Kaat (2010), A Widening Generational Divide? Assessing the Age Gap in Voter Turnout Between Younger and Older Citizens European University Institute
DOI: 10.2870/15899

Chapter 2. Age differences in political participation
socio-demographic factors. One of the main contributions of this thesis is to assess
the extent to which over-time changes in the timing of experiencing certain life-
cycle events – mostly measured through the usual battery of background variables
in individual level research – can account for over-time changes in the age gap in
turnout and (rapidly) declining turnout levels among young adults.
2.1.2 Cohort and generation effects
The political life-cycle approach neglects the fact that certain social, cultural and
historical events can influence political participation rates. For this we turn to
the cohort and generation mechanisms. Common within these approaches is the
idea that it is not so much the dynamics of biological ageing that make one grow
into political life, but that social, cultural and historical factors shape the political
participatory patterns of a cohort or generation (De Graaf, 1999; Braungart and
Braungart, 1986). Historical differences and social change are, thus, considered to
be the decisive factors that account for age differences in political participation.
The main problematic feature of the generation and cohort approaches lies in
the overlapping meaning and use of the terms generation and cohort. A cohort is
usually referred to as a group of people born at the same time in history, sharing
social and historical experiences, for example, the 1980s cohort (Braungart and
Braungart, 1986, p. 207; Jankowski and Strate, 1995, p. 92; Alwin, Hofer and
McCammon, 2006, p. 22). A political generation also consists of a group of people
born at the same time in history, although this cohort becomes aware of its unique
social and political situation, e.g. the 1960s generation (Braungart and Braungart,
1986, p. 207; Lane, 1959, p. 219; De Graaf, 1999, p. 261). The term generation is,
however, also used to refer to lineage age groups such as parent or child generations
21
SMETS, Kaat (2010), A Widening Generational Divide? Assessing the Age Gap in Voter Turnout Between Younger and Older Citizens European University Institute
DOI: 10.2870/15899
2.1. The age gap in political participation
(Braungart and Braungart, 1986, p. 207). Each of these three concepts, related
to the cohort and generation approaches, is linked with political participation in
a different way.
The lineage politics perspective, first, stresses the importance of socialisation
on political participation. Younger generations, it is argued, learn political skills
by looking at and learning from their parents or grandparents, even though the
socialisation efforts of the parent generation are not necessarily direct, intended,
or intensive (Braungart and Braungart, 1986, p. 214). Over time changes in age
differences in political participation, if we follow this line of thought, should be
caused by changes in the way parents socialise their children. The literature gives
no indication of such changes in parental socialization3 and I do not consider this
a very plausible explanation for over-time trends as observed in Canada.Turnout
among older voters (i.e. the parents of the younger citizens) indeed is declining,
however, not even closely to the same extent as among young adults. Therefore,
other factors must be at work to explain the rapid decrease in turnout among young
cohorts. Also, measurement issues seem problematic here as data that would allow
for assessing changes in political socialization is hard to come by.
Although not directly linked to the lineage politics perspective to age differ-
ences in political participation, other socializing agents than the parents are also
frequently mentioned to influence young people’s political behaviour. Friends and
the school environment in particular are thought to do so, as the young are still
susceptible to chance because they have not yet developed their own habits of
political participation (Lane, 1959; Plutzer, 2002; Hooghe and Stolle, 2003; Nor-
3In fact, Corbetta (2009) demonstrates that in Italy the socialization effect from father toson with reference to party choice is perfectly stable through time.
22
SMETS, Kaat (2010), A Widening Generational Divide? Assessing the Age Gap in Voter Turnout Between Younger and Older Citizens European University Institute
DOI: 10.2870/15899

Chapter 2. Age differences in political participation
ris, 2003). Obviously, rapidly declining turnout among young people increases the
likelihood that any young voter will have more non-voting peers. This may cause
a snowball effect of abstention. Data on electoral behavior of respondent’s peers
is, however, hard to find at best. Some election studies do inquire whether respon-
dents discuss politics with friends. The problem, however, is that even though a
decline in the frequency of discussing politics may cause a decline in turnout, we
would want to understand why politics is being discussed less often with peers.
This would imply a shift to a different dependent variable and is hence beyond the
scope of this research.
The cohort politics perspective, secondly, gives political significance to the fact
that some people are born in the same period in history and will, therefore, exp-
rience certain meaningful social, cultural, political and historical events at the
same stage of their life. This causes them to participate at different levels than
people in other age groups that have experienced different events. Since young
people are still in the formative stage of political learning and have no political
behaviour pattern to fall back on, they are more likely to be strongly affected
by these events than older age groups (Braungart and Braungart, 1986; Plutzer,
2002). The list of social, cultural and political events that are argued to have a
potential impact on youth participation is too long to go into detail here, but will
be discussed later on in the chapter.
The political generation perspective, thirdly, also focuses on social and political
events. According to the political generation approach, people become active in
politics when a birth cohort becomes aware of the fact that it shares certain specific
social and cultural experiences. Social change thus makes new generations develop
their own ways to participate in politics (Braungart and Braungart, 1986; Cutler
23
SMETS, Kaat (2010), A Widening Generational Divide? Assessing the Age Gap in Voter Turnout Between Younger and Older Citizens European University Institute
DOI: 10.2870/15899

2.1. The age gap in political participation
and Bengtson, 1974; O’Neill, 2003). Political generations, however, do not develop
easily because of the awareness factor. That is to say, it is unusual for people of
a birth cohort to both realize that they have a common political interest and to
focus on this by striving for political change. Some scholars already think it is too
much to assume ordinary citizens can form a comprehensive political (world)view
(Kinder, 2006, p. 1906).
Very much linked to the cohort and period approaches just described is the
political learning perspective. This mechanism intended to explain age differences
in political participation has lately drawn a lot of attention from scholars. The
main argument of the political learning approach is that people learn the habit
of either voting or non-voting in the early stages of their adult life, and that past
behaviour predicts present behaviour (Green and Shachar, 2000; Kanazawa, 2000;
Bendor, Diermeier and Ting, 2003; Gerber, Green and Shachar, 2003; Fowler, 2006;
Aldrich, Taylor and Wood, 2007).4
Crucial in the learning approach to political participation is the distinction
made between factors that influence a persons starting level of political participa-
tion (i.e. whether someone will vote at his or her first opportunity) and factors that
influence the chances that someone will become a habitual voter (referred to as
inertia) (Plutzer, 2002). Earlier mentioned explanatory factors such as resources,
mobilisation processes, socialisation processes, and social, cultural and historical
events are considered to have a differential impact on those that have and those
that have not yet acquired the habit to participate or abstain.
4Although the notion that the frequency with which a behaviour has been performed is a goodpredictor of future action is not being disputed, in the psychological literature a discussion takesplace on how actions precisely become routinized (e.g. through stimulous or through automaticactivation and spontaneity) and what role the frequency of past behaviour exactly plays (see e.g.Ajzen, 2002.)
24
SMETS, Kaat (2010), A Widening Generational Divide? Assessing the Age Gap in Voter Turnout Between Younger and Older Citizens European University Institute
DOI: 10.2870/15899

Chapter 2. Age differences in political participation
The learning mechanism, therefore, adopts a dynamic approach in which the
relationship between age and political participation is one of interactions between
explanatory factors of political participation and two age groups: young voters
who are in the process of developmental transition and older voters who already
have established the habit of voting or non-voting. Plutzer (2002, p. 44) explains
the political learning perspective with the example of someone aged forty with
a higher than average income. Based on this information we would expect this
person to have a higher than average level of political participation. What if a
couple of years later the same person loses his job and has to take on one that earns
an average wage? If voting is a habit that is acquired in young adulthood, a change
in income is not likely to influence this person’s level of political participation. The
other approaches to explain age differences in political participation do not have
built-in mechanisms to control for such a habit.
How long does it take then to become a habitual voter? Franklin (2004) and
Franklin, Lyons and Marsh (2004) suggest that the key to the answer to this
question can be found in the literature on party choice. Butler and Stokes (1974)
found that after 13 years (i.e. three elections) people’s likelihood to vote for a
certain party stabilizes. After this, the chance that someone will vote for a different
party decreases significantly. The same cut-off point is used with reference to
political participation. People are thought to establish the habit of voting or non-
voting within the first three elections they experience.5 From the fourth election
onwards chances become small that people will deviate from their habit (Franklin,
5Aldrich, Taylor and Wood (2007) work with a threshold of five elections, arguing thatpsychologists use the same cut off point in their research.
25
SMETS, Kaat (2010), A Widening Generational Divide? Assessing the Age Gap in Voter Turnout Between Younger and Older Citizens European University Institute
DOI: 10.2870/15899

2.1. The age gap in political participation
2004; Franklin, Lyons and Marsh, 2004). Disruptions in the habit of (non)voting
are, however, not completely excluded (Plutzer, 2002; Strate et al., 1989).
The mechanism of demographical replacement (i.e. people entering and leaving
the electorate) makes that incoming cohorts voting at different rates than estab-
lished cohorts cause over-time changes in turnout levels (Franklin, 2004; Franklin,
Lyons and Marsh, 2004; Gerber, Green and Shachar, 2003). Extending this line of
thought, young adults are responsible for a widening or narrowing of the age gap
overtime.
We need to ask ourselves, however, what is it that makes incoming cohorts vote
at different rates? Mark Franklin’s book on turnout in established democracies
is by far the most elaborate contribution on the learning effect of voting. Trying
to explain turnout decline in general, Franklin argues that changes in turnout
are primarily due to the ways in which incoming voters react to the character
of an election (Franklin, 2004, p. 65). Apart from features of particular elections,
delayed effects from past changes (e.g. changes in electoral laws) also affect turnout
change. In sum, according to Franklin, there are two ways in which conventional
models of voter turnout are misspecified. The first is in attempting to measure
effects on all voters that apply particularly to the younger ones. The second is the
failure to take account of long-term factors that played a role in the socialization
of established voters (Franklin, 2004, p. 80).
What are these long-term and short-term factors influencing youth voter turnout
precisely? Starting with the long term, the effects of the lowering of the minimum
voting age from 21 to 18 in the 1970s are argued to still be visible (Franklin, 2004,
p. 61-68). Knowing that age and turnout are positively related, we can expect
an 18 year old to have a lower probability of turning out to vote than a 21 year
26
SMETS, Kaat (2010), A Widening Generational Divide? Assessing the Age Gap in Voter Turnout Between Younger and Older Citizens European University Institute
DOI: 10.2870/15899
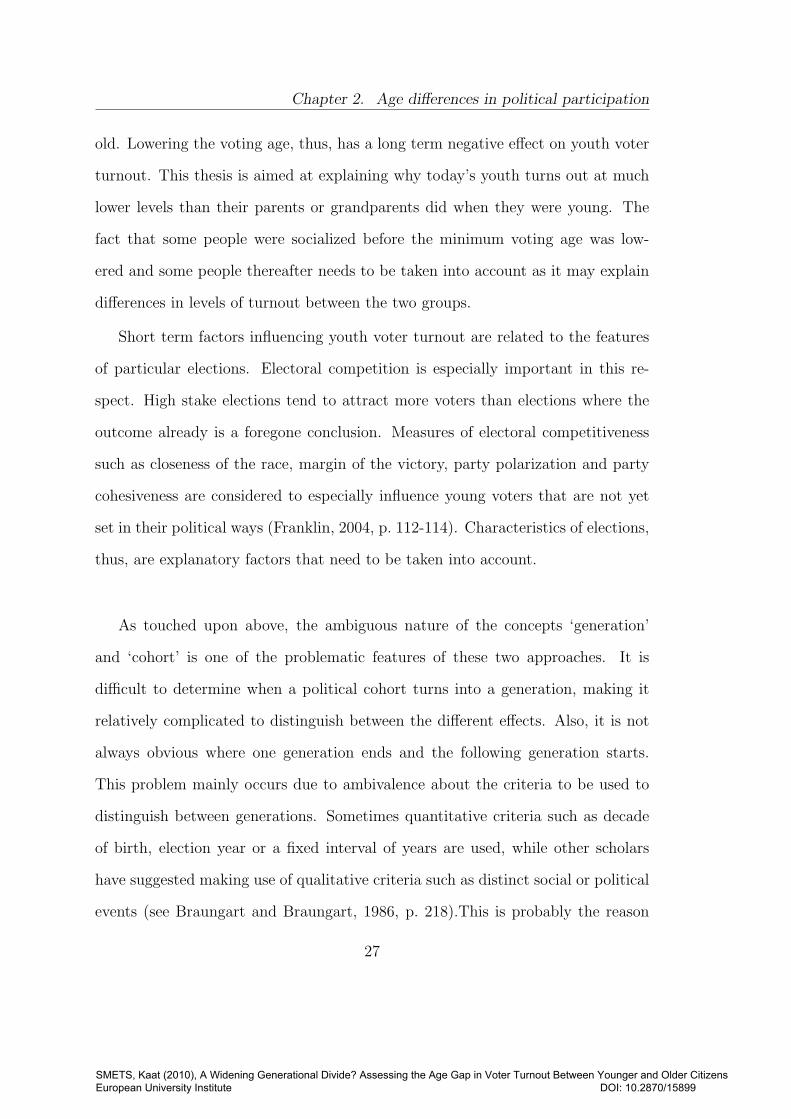
Chapter 2. Age differences in political participation
old. Lowering the voting age, thus, has a long term negative effect on youth voter
turnout. This thesis is aimed at explaining why today’s youth turns out at much
lower levels than their parents or grandparents did when they were young. The
fact that some people were socialized before the minimum voting age was low-
ered and some people thereafter needs to be taken into account as it may explain
differences in levels of turnout between the two groups.
Short term factors influencing youth voter turnout are related to the features
of particular elections. Electoral competition is especially important in this re-
spect. High stake elections tend to attract more voters than elections where the
outcome already is a foregone conclusion. Measures of electoral competitiveness
such as closeness of the race, margin of the victory, party polarization and party
cohesiveness are considered to especially influence young voters that are not yet
set in their political ways (Franklin, 2004, p. 112-114). Characteristics of elections,
thus, are explanatory factors that need to be taken into account.
As touched upon above, the ambiguous nature of the concepts ‘generation’
and ‘cohort’ is one of the problematic features of these two approaches. It is
difficult to determine when a political cohort turns into a generation, making it
relatively complicated to distinguish between the different effects. Also, it is not
always obvious where one generation ends and the following generation starts.
This problem mainly occurs due to ambivalence about the criteria to be used to
distinguish between generations. Sometimes quantitative criteria such as decade
of birth, election year or a fixed interval of years are used, while other scholars
have suggested making use of qualitative criteria such as distinct social or political
events (see Braungart and Braungart, 1986, p. 218).This is probably the reason
27
SMETS, Kaat (2010), A Widening Generational Divide? Assessing the Age Gap in Voter Turnout Between Younger and Older Citizens European University Institute
DOI: 10.2870/15899

2.1. The age gap in political participation
why the generation and cohort effects are sometimes treated as one (see De Graaf,
1999; Braungart and Braungart, 1986; Jennings, 1987).
What is often found in the literature is a mix of different elements from the
cohort and generation perspectives described above. In this thesis too the terms
generation and cohort will be used interchangeably. The term cohort will usually
be used to refer to people born in the same group of years (i.e. as in birth cohorts).
With the term generation lineage differences as in child/parent/grandparent gener-
ations are emphasized. The key idea of either concept, however, is that experienc-
ing certain social, cultural and historical events can influence political participation
rates.
Since citizens that enter the electorate are born against a different socio, cul-
tural, historical background than voters that leave the electorate, the turnout
difference between younger and older voters can change. Hence, the idea of demo-
graphic replacement is crucial to the cohort and generation approach when trying
to explain over-time trends in the age gap. In this respect, there is overlap with
the life-cycle approach when trying to explain the same phenomenon. We estab-
lished above that it is very likely that different electoral cohorts experience certain
life-cycle events at different moments in their life. The mechanism of people en-
tering and leaving the electorate (this time with different life experiences) is thus
also in this approach the motor behind over-time change in age differences in voter
turnout.
Different cohorts have different characteristics. In combination with the natural
process of demographic replacement, these characteristics (life, social, cultural and
historical experiences) can explain why there is something of an age gap in voter
turnout and why this gap can become narrower or wider over time.
28
SMETS, Kaat (2010), A Widening Generational Divide? Assessing the Age Gap in Voter Turnout Between Younger and Older Citizens European University Institute
DOI: 10.2870/15899

Chapter 2. Age differences in political participation
2.1.3 Period effect
There is one more mechanism – the period effect – that is also often mentioned
in discussions of differences in political participation between age groups. These
period effects are major events, such as the presence of war, that affect the popu-
lation as a whole, and not just certain age, regional, gender, education or income
cohorts (De Graaf, 1999, p. 261; Norris, 2003, p. 9; Cutler and Bengtson, 1974,
p. 165; Alwin, Hofer and McCammon, 2006, p. 21). Since everybody – young or
old – is considered to be influenced simultaneously it is very difficult to see how
period effects should bring forward over-time movements of the age gap.
The only way in which period effects can account for the overtime narrowing
or widening of the age gap in political participation – once again – is through
demographical replacement. If war, for example, leads to a long-term decrease
in turnout levels among the electorate as a whole, these turnout levels will only
start to rise again as new cohorts that have not experienced this war enter the
electorate. In this case, the age gap would become smaller from the moment the
post-war children enter the electorate.
The given example could – and perhaps should – also be described in terms
of a war and post-war generation or cohort. Because of the overlap between co-
hort, generation and period effects, the remainder of this thesis will emphasize
the importance of social, cultural and historical experiences rather than talk in
terms of period effects. In the strictest sense of the definition period effects – i.e.
events that affect the electorate as a whole – cannot, however, influence over-time
movements of the age gap.
29
SMETS, Kaat (2010), A Widening Generational Divide? Assessing the Age Gap in Voter Turnout Between Younger and Older Citizens European University Institute
DOI: 10.2870/15899

2.1. The age gap in political participation
Summarizing what has so far been discussed, young age groups have always
had deviant participatory behaviour from older age groups. Age differences in
turnout – the most common example – are generally explained by three main
mechanisms: the life-cycle effect, the cohort and generation effects, and the period
effect. The approaches are not as mutually exclusive or different as may appear
at first sight. To start with, all types of explanation focus on the same basic
questions: whether or not political participation levels vary over the life span, and
why distinct participatory patterns emerge between age groups. Secondly, all three
approaches assume that young adulthood is a crucial stage in the formation of later
patterns of political participation. Young adults, it is thought, are not yet set in
their political ways and, as such, are more easily influenced by external factors
(see also Sears and Levy, 2003, p. 91; Flanagan and Sherod, 1998, p. 448-449).
How far do age, period and cohort mechanisms help to answer the question
why today’s youth turns out at lower levels than their parents or grandparents did
when they were young? I would like to argue that the mechanism as such cannot
help to answer this question at all. Whether participation is a matter of aging
or a habit acquired at a young age is useful to attempt to predict future levels
of political participation, but it does not provide an answer to the question why
turnout among young adults changes overtime. Canadian and British research
suggests that it is young voter’s turnout levels that act as a catalyst for over-
time changes in the age gap. Instead of focusing on the mechanisms that explain
the development of participation over the life span, it is much more useful to
concentrate on the dynamics behind the mechanisms to shed light on overtime
youth turnout decline.
30
SMETS, Kaat (2010), A Widening Generational Divide? Assessing the Age Gap in Voter Turnout Between Younger and Older Citizens European University Institute
DOI: 10.2870/15899

Chapter 2. Age differences in political participation
As discussed above, the age-period-cohort mechanisms differ in their view of
why young people abstain from political participation. Crucial to explaining trends
in the age gap with the three mechanisms is the idea of demographic replacement.
Incoming electoral cohorts differ from established ones and this creates movement
in the age gap as well as in general turnout patterns. The key question is what
makes these incoming cohorts different.
According to the life-cycle approach, side-effects of maturation lead to young
people’s disengagement from political life. It is a central focus in this thesis to see
to what extent later maturation (i.e. experiencing certain life events at a higher
average age) can account for the drop in turnout among young citizens. In the
lineage politics perspective socialisation processes are seen as the crucial factors
that make people grow into political life. We discussed that having more non-voters
among one’s peers is likely to increase the probability of abstention. It remains
to be seen, however, why more young people refrain from voting. The political
learning approach, thirdly, focuses on the influence of characteristics of elections.
Especially indicators of electoral competitiveness are considered to affect young
adults’ decision to turn out or not. Over-time changes in competitiveness, but also
in electoral rules, could explain why turnout among young people has decreased in
the last decades. Other socio-cultural and historical events and experiences, lastly,
may also explain why young people’s turnout declines. These type of events are
central in the cohort and period approaches, but have not yet been specified. We
will return to these below.
Before discussing explanations for over-time differences in youth participation,
a few more words on age, period and cohort effects are necessary. As argued above,
knowing whether participation over the life span is a matter of either of the three
31
SMETS, Kaat (2010), A Widening Generational Divide? Assessing the Age Gap in Voter Turnout Between Younger and Older Citizens European University Institute
DOI: 10.2870/15899
2.1. The age gap in political participation
effects does not help to explain what it is about aging, cohorts or periods that
makes participation of young people change over time. However, in order to try
to say something about future participation among young people it is important
to take the different approaches into account.
The most problematic feature of age-related research is that it is, in fact, im-
possible to empirically separate age effects from period and cohort effects (and vice
versa) because the three are exact linear functions of each other (A = P−C) (Cut-
ler and Bengtson, 1974; Elder, 1975; De Graaf, 1999; Glenn, 2005; Wass, 2007).
There is no real solution to this problem, except to rely on theoretical assumptions
(Riley, 1973; Glenn, 2005) and to try to model the different effects as precisely as
possible. Franklin (2004), for example, does so by assessing his hypotheses at the
individual, cohort and aggregate level. There are also specific statistical methods
available in order to distinguish between age, period and cohort effects as best as
possible (see e.g. Neundorf, 2008). Inferring from the large amount of literature
on the topic it seems that age, period and cohort/generation effects are often at
work simultaneously.
All in all, from this literature overview on age differences in turnout, three
dynamics have been identified that – from a theoretical perspective at least – may
account for declining turnout levels among younger voters and over-time changes
in the age gap in voter turnout. The first involves transformations of the political-
life cycle. Due to their higher educational levels, many characteristics of the early
and middle stage of the political life-cycle have moved to a higher average age.
This can be expected to have had its consequences on the electoral behaviour of
young adults. Secondly, changes in electoral competitiveness, that arguably have a
magnified effect on younger voters, may have caused turnout decline among young
32
SMETS, Kaat (2010), A Widening Generational Divide? Assessing the Age Gap in Voter Turnout Between Younger and Older Citizens European University Institute
DOI: 10.2870/15899

Chapter 2. Age differences in political participation
adults. Lastly, changes in electoral rules may explain over-time trends in youth
voter turnout levels. As each election a new group of young people enters the
electorate, distinct turnout patterns among these young people that come of age
cause changes in the age gap between younger and older citizens. Demographic
replacement is, thus, a crucial element regardless of the dynamics that are used to
explain youth turnout decline. Beside the dynamics discussed here, other social,
cultural and historical events have been argued to have spurred changes in youth
turnout patterns. They are the focus of the next section.
2.2 Declining turnout among young adults ex-
plained
Declining turnout levels among young adults have caused concern in many Western
democracies. Numerous explanations have been given in the literature to explain
this changing pattern of youth voter turnout. Although very much related to
the question why young people turn out at lower levels than older cohorts in
general (i.e. why there is something as an age gap in turnout), the question why
today’s young adults are less inclined to make their way to the polling booth than
their parents and grandparents when they were young, is usually answered with
a different battery of explanatory factors. In this section the most commonly
mentioned reasons for increasing abstention among young citizens are reviewed.
In the previous section we identified three dynamic processes that could be
used to explain the rapidly declining turnout levels among young people. The first
is later maturation, the second refers to changes in electoral rules, and the third
is declining electoral competition. Turnout change can thus be explained through
changes in characteristics of voters and changes in characteristics of elections. The
33
SMETS, Kaat (2010), A Widening Generational Divide? Assessing the Age Gap in Voter Turnout Between Younger and Older Citizens European University Institute
DOI: 10.2870/15899

2.2. Declining turnout among young adults explained
literature on turnout decline among young adults, however, tends to emphasize
that it is something about young people that makes them abstain nowadays.
2.2.1 An alienated youth?
While voting and abstention are individual acts, the phenomena are usually dis-
cussed in aggregate terms. ‘It [turnout] is a feature of an electorate, not a voter’
(Franklin, 2004, p. 16). As such, individual level characteristics, societal character-
istics and characteristics of elections can arguably affect turnout levels (Franklin,
2004; Fieldhouse, Tranmer and Russell, 2007). The number of explanations for
declining levels of voter turnout addressed in the literature is, therefore, vast.
Nonetheless, when it comes to the decline in turnout among young adults, the an-
swer to the question why young people do not vote seems fairly unanimous. Both
public opinion and experts contend that young people’s abstention is the fruit of
their alienation, disengagement, disinterest, apathy, cynicism, and scepticism from
and towards political actors, political institutions and politics in general.
Canadian and European research shows that young people are indeed among
the least interested and least knowledgeable of the electorate (Blais et al., 2002;
Rubenson et al., 2004; Norris, 2003).6 Howe (2003), moreover, not only shows that
in Canada the gap in political knowledge increases with each successive cohort,
6Caution is needed with regard to the concepts of political interest, political knowledge, andpolitical participation. First, political interest is argued to be a dimension of political engagementin a similar fashion as political participation is a dimension of the same concept. The proximity ofthe two concepts is a potential problem (Rubenson et al., 2004, p. 417). Secondly, related to thefirst problem, there is a problem of causality, as the relationship between interest and knowledgecan be argued to work in two directions. Interest provides an incentive to acquire politicalknowledge, however, someone who has political knowledge will be more likely to be interested inpolitics (Rubenson et al., 2004, p. 417; Howe, 2003, p. 22; Brady, Verba and Schlozman, 1995,p. 271). Kriesi (2005, chapter 4) in his study shows that political awareness, in part, is a functionof political interest (motivation) and level of education (competence). Age, in its turn, indicatesthe combination of motivation and competence.
34
SMETS, Kaat (2010), A Widening Generational Divide? Assessing the Age Gap in Voter Turnout Between Younger and Older Citizens European University Institute
DOI: 10.2870/15899

Chapter 2. Age differences in political participation
he also notes that political knowledge becomes a more important indicator for
political participation. Also in line with conventional wisdom, young people are
found to have low levels of trust and low levels of confidence in politicians (Henn,
Weinstein and Wring, 2002; O’Toole, 2004; Pirie and Worcester, 1998).
On the other hand, even though it is often assumed that young people refrain
from participating in conventional forms of political participation, such as voting in
elections, because they are alienated from the political system, young Canadians
were actually found to be less cynical than their older counterparts (Gidengil
et al., 2003; Blais et al., 2002; Rubenson et al., 2004; O’Neill, 2003). Norris (2003)
has found similar results for Europe. Based on the European Social Survey of
2002, she argues that in Europe people under the age of 30, in comparison with
older age groups, have a stronger sense of both internal and external political
efficacy.7 Qualitative studies among young people alone do, however, show the
internal efficacy of young people to be rather low (Henn, Weinstein and Wring,
2002; O’Toole, 2004). Hence, even though young people’s levels of political efficacy
may be higher than those of their older counterparts, this does not directly imply
that young people’s levels of efficacy are high to begin with.
That young people are found to show commitment to the political system, while
they have little interest in politics, low levels of trust, and minimal levels of political
knowledge may seem counter-intuitive and contradictory. The use of a narrow (or
electoral-oriented) conception of ‘the political’ in most research on (youth) political
participation is, however, believed to play a role in this. Survey research imposes
7Internal efficacy usually refers to the level to which people think they can influence thegovernment or policy outcomes. External efficacy, on the other hand, is used to indicate in howfar people think a government is responsive to their interests (see e.g. Norris, 2003, p. 14 andAmna, Munck and Zetterberg, 2004, p. 4).
35
SMETS, Kaat (2010), A Widening Generational Divide? Assessing the Age Gap in Voter Turnout Between Younger and Older Citizens European University Institute
DOI: 10.2870/15899

2.2. Declining turnout among young adults explained
a certain idea of what is political on respondents. However, that what political
scientist, politicians or adults hold to be political is not necessarily the same as
young people’s political experience (O’Toole et al., 2003, p. 46; O’Toole, 2003,
p. 73-74; O’Toole, 2004, p. 3; Henn, Weinstein and Forrest, 2005, p. 557; Henn,
Weinstein and Wring, 2002, p. 169).
That young people have a wider conception of ‘the political’ is by now is a
fairly uncontested assumption. For example, results from a seven-nation study
show that young people consider both voting and social-movement related activ-
ities important indicators of good citizenship (Torney-Purta and Amadeo, 2003,
p. 270). Young people are often found to take the lead in petitioning, buying and
boycotting products, demonstrating and participating in illegal protests (Topf,
1995a; Dekker, 2002; Norris, 2003; Amna, Munck and Zetterberg, 2004; Stolle
and Hooghe, 2005b; Gidengil et al., 2003; Teorell, Sum and Tobiasen, 2007). If
young people turn to these non-electoral forms of political participation because
they are closer connected to their conception of the political, it seems wrong to
automatically equate abstention from electoral politics with general apathy and
non-participation (O’Toole et al., 2003, p. 46; O’Toole, 2003, p. 74; Gauthier, 2003,
p. 265).
Findings suggest that while younger people are sceptical about political insti-
tutions, politicians and political parties, they are nonetheless committed to the
democratic process and certainly not as apathetic and disinterested as they are
often thought to be (IDEA, 1999; European Commission, 2001a). Young people,
however, seem increasingly interested in issues that may fall outside the politi-
cal sphere per se, such as moral, life-style, environmental and international issues
(Braungart and Braungart, 1986; Henn, Weinstein and Wring, 2002; O’Toole, 2004;
36
SMETS, Kaat (2010), A Widening Generational Divide? Assessing the Age Gap in Voter Turnout Between Younger and Older Citizens European University Institute
DOI: 10.2870/15899

Chapter 2. Age differences in political participation
Pirie and Worcester, 1998; Henn, Weinstein and Forrest, 2005). These political
issues are subsequently discussed with family and friends (Henn, Weinstein and
Wring, 2002). All in all, it seems that young people are not so much apathetic from
and disinterested in politics in general, but more that they are sceptical toward,
disengaged and alienated from electoral politics.
2.2.2 What is wrong with electoral politics?
The question that remains to be answered is why young people show such low
levels of interest, knowledge, and trust in electoral politics (Hooghe, 2004, p. 338)?
The fact that young people are turning to less institutional and more individual
forms of political participation such as protest activity and political consumerism
is more likely a consequence than a cause of young people’s disengagement from
formal politics. Higher levels of alienation, disengagement, disinterest, etc. can be
linked to both the life-cycle and the cohort/generation model. The political life-
cycle model assumes that political involvement changes as people grow older and
experience certain life events. If the proportion of young people that experiences
certain key events declines because of later maturation, this would explain low(er)
levels of political interest among young voters. On the same token, elections
that are not competitive at all are obviously also not very likely to spark young
people’s interest. What other reasons can explain young people’s disengagement
from electoral politics?
What we are looking for are explanations that focus specifically on young people
and, thus, do not apply to the electorate as a whole. Secondly, there has to be an
element of change over-time. Only through change we can explain why turnout
patterns of incoming cohorts have shown a decline over the last couple of years
37
SMETS, Kaat (2010), A Widening Generational Divide? Assessing the Age Gap in Voter Turnout Between Younger and Older Citizens European University Institute
DOI: 10.2870/15899

2.2. Declining turnout among young adults explained
(which in its turn generally explains changes in the age gap). The changes that
we are looking for need not, however,necessarily have taken place very recently.
The fact that the declining turnout patterns of young people have been mostly
visible during the last two decades, could, as we saw previously, also be the delayed
consequence of changing patterns in habit formation. Most countries, for example,
are currently still reaping the dampening effects on turnout of the lowering of the
minimum voting age around the 1970s. In this respect it is interesting to see
that in some countries, such as Switzerland and Germany, cantons and lander at
the subnational level have nonetheless recently lowered the voting age to 16 years
for local and subnational elections (Bazler Zeitung, 06.05.2007). The government
of the Swiss Canton of Bern is also considering to lower the voting age from 18
to 16 years (Tagesanzeiger, 04.05.2007), and even at national level lowering the
minimum voting age is being discussed (Neue Zuricher Zeitung, 07.05.2007).
Why young people are less interested and have less political knowledge than
previous generations at the same stage of their life course, is not a new question
(see Kimberlee, 2002 for a useful overview). Wattenberg (2008), for example,
suggests a link with young peoples (lacking) habits of following political news.
Due to changes in the media landscape, Wattenberg argues, young people are
becoming socialized in a different way leading younger cohorts to be increasingly
disinterested in media coverage on politics. This, in its turn, has lead to growing
disinterest and lower levels of political knowledge among young people in politics.
The problem with this theoretical explanation is that it is very difficult to measure
the described changes in the media landscape as well as the changed patterns of
media consumption among younger voters.
38
SMETS, Kaat (2010), A Widening Generational Divide? Assessing the Age Gap in Voter Turnout Between Younger and Older Citizens European University Institute
DOI: 10.2870/15899

Chapter 2. Age differences in political participation
At societal level, two major explanations for the increasing disinterest and
lack of knowledge of young people in politics are individualisation/declining social
capital, and modernization. The two theories overlap to some extent. According
to the modernisation theory, put forward by Ronald Inglehart and others, social
and economic prosperity, such as increasing educational levels, rising standards
of living, etc., have led to political change in post-industrial societies (Inglehart,
1997, chapter 6). The reason for the decline in voter turnout among young people,
according to the modernization theory, is their decreasing party loyalties. Political
parties, these days, are still polarized along the class and economic cleavages that
were present during the time they were established. Older birth cohorts can still
identify with these cleavages, however, higher educated young citizens do not relate
to these issues anymore. Instead young people, who grew up in a postmaterialist
era of economic prosperity, are found to be interested in cultural and quality-of-life
issues, and demand more active forms of political participation in which they can
use their knowledge. Postmaterialist, who are more present among the youngest
birth cohorts in society, take survival for granted and, therefore, have more time to
devote themselves to abstract issues such as politics. They do so in a non-electoral
instead of an electoral way, however (Inglehart, 1997, p. 307-315).
Robert Putnam (2000), on the other hand, argues that trends of individuali-
sation taking place in modern societies lead to a decline in social capital as social
networks break down. Associational life has decreased over the last decades, and
through this an important mobilizing factor for political participation is becom-
ing extinct. Again, especially young people are thought to be affected by this
trend. Their political ways are not yet fixed and this makes young citizens more
perceptible to external influences.
39
SMETS, Kaat (2010), A Widening Generational Divide? Assessing the Age Gap in Voter Turnout Between Younger and Older Citizens European University Institute
DOI: 10.2870/15899

2.2. Declining turnout among young adults explained
We should also be aware, however, of the fact that demographic changes in
Western European societies may have an influence on young people’s levels of po-
litical interest, knowledge and participation. Electorates do not consist of the same
individuals from election to election, and the effect of this changing composition
of the electorate on (youth) turnout levels tends to be easily overlooked (Franklin,
2001, p. 320). In this respect, the simultaneous decline in birth rates and increas-
ing proportion of older cohorts in many Western European democracies is leading
to a larger political weight of elderly in these societies. Their large number makes
older people more visible to political actors and institutions, which, in its turn,
puts an emphasis on the issues that older cohorts find important (Schmitter and
Trechsel, 2004; Kohli and Kunemund, 2005; Topf, 1995b). Young people and the
issues they are interested in appear to be increasingly overlooked as a consequence
of this and recent qualitative research seems to confirm the consequences of this
change in the demographical composition of the electorate. Young people identify
the contemporary political style as being slow, formal, distant, and uninspiring
(Hazekamp and Heymann, 1993, p. 94; O’Toole, 2004, p. 8; O’Toole, 2003, p. 81;
Henn, Weinstein and Forrest, 2005, p. 562-563). Moreover, politicians, according
to young people, do not encourage young citizens to take an interest in politics
(Henn, Weinstein and Wring, 2002, p. 176), but neither do young people feel
politicians take an interest in them as their expertise on certain topics is rarely
acknowledged (O’Toole, 2004, p. 13; Bessant, 2004). Summarizing, formal politics
is increasingly dominated by older adults who do not represent and respond to
young peoples style and interests (Gauthier, 2003, p. 269).
Several studies, lastly, put forward the withdrawal of the state-theory to explain
young peoples disinterest in formal politics. In this theory it is argued that nation
40
SMETS, Kaat (2010), A Widening Generational Divide? Assessing the Age Gap in Voter Turnout Between Younger and Older Citizens European University Institute
DOI: 10.2870/15899

Chapter 2. Age differences in political participation
states are losing political power to supranational institutions such as for example
the European Union, but also to regional and even local political powers. If nation
states have less to decide on, why would voters be motivated to turn out to vote
at national elections? Although this trend affects the motivation of all voters,
especially young people who have not yet established the habit to turn out to
vote are vulnerable to abstention because of this trend (Gauthier, 2003; Pirie and
Worcester, 1998; O’Toole, 2004; Henn, Weinstein and Wring, 2002).
2.3 Theoretical framework, hypotheses, and re-
search design
In the previous two sections the literature was reviewed with regard to two ques-
tions relevant for the central research question dealt with in this thesis. The first
question focuses on the age gap in voter turnout. It is a well established fact
that young people turn out at lower levels than older cohorts and three mech-
anisms for how to account for this age gap were discussed: the life-cycle effect,
cohort/generation effects, and the period effect. Even though the three mecha-
nisms give indications as to how patterns of political participation develop over
the life span, they do not – as such – provide an answer to the question why young
people nowadays turn out at lower levels than their parents and grandparents did
when they were young. The dynamics behind age, period and cohort effects prove
much more useful to answer this question. Two such dynamics in specific were
identified: the idea that later maturation may cause turnout decline among young
people, and the notion that characteristics of elections, especially indicators of
electoral competition, have caused young people to turn out at ever lower levels
41
SMETS, Kaat (2010), A Widening Generational Divide? Assessing the Age Gap in Voter Turnout Between Younger and Older Citizens European University Institute
DOI: 10.2870/15899

2.3. Theoretical framework, hypotheses, and research design
(see figure 2.2 for a schematic overview of the theoretical explanations found in
the literature reviewed).
With the idea in mind that changes in the age gap are most likely explained
by changing patterns in turnout among incoming cohorts, the second section of
this chapter further investigated the question of how declining levels of turnout
among young adults can be explained. Both quantitative and qualitative studies
show that electoral politics has apparently lost its attractiveness to young people:
levels of political interest and knowledge among young adults are lower than ever,
young people regard the contemporary political style as slow, formal, distant, and
uninspiring, and level of political trust among young cohorts is generally low.
Why young people feel detached from electoral politics is a question to which
different answers have been proposed. Changes in media habits, declining social
capital, value changes, changing composition of the electorate and the withdrawal
of the state from the national level were mentioned in this respect.
This aim of this thesis is twofold. First, it still needs to be established whether
over-time patterns in the age gap in turnout are similar or not in different countries.
As mentioned in the first chapter, we know that turnout among young people
has rapidly declined in Canada and that turnout patterns between cohorts differ
greatly in Great Britain. For other countries trends are less clear.
42
SMETS, Kaat (2010), A Widening Generational Divide? Assessing the Age Gap in Voter Turnout Between Younger and Older Citizens European University Institute
DOI: 10.2870/15899

Fig
ure
2.2:
Theo
reti
cal
fram
ewor
kas
der
ived
from
the
lite
ratu
rere
vie
wed
(sch
emat
ic)
43
SMETS, Kaat (2010), A Widening Generational Divide? Assessing the Age Gap in Voter Turnout Between Younger and Older Citizens European University Institute
DOI: 10.2870/15899

2.3. Theoretical framework, hypotheses, and research design
Supposing that we find similar patterns in all countries, in a second step,
explanations for these trends need to be assessed. The literature review from the
previous sections of this chapter provides the basis for these explanations. Basically
all clusters of theories can be hypothesized to have a direct and negative effect
on turnout levels. They may, however, also influence levels of political interest,
political knowledge and feelings of inclusiveness in the electoral process which – in
their turn – affect turnout levels.
Although some theoretical explanations are applicable to both younger and
older voters, they are still thought to influence the younger voters most as these
are not yet set in their political ways. Below the theoretical explanations that will
be focussed on primarily will be discussed. Selection depends on various factors
such as originality, availability of data, and relative weight in the literature on
youth political participation.
This thesis will primarily pay particular attention to the idea that later matu-
ration may (partly) be responsible for turnout decline among young adults. The
assumption is that many events characteristic of the first and middle stages of
the political life-cycle have moved to a higher average age. This leads to a lower
proportion of young citizens nowadays to have fully ‘matured’ or adopted a va-
riety of adult roles. Since life-cycle events at young age are positively related to
turnout, a lower proportion of young adults with mature characteristics should
lead to lower turnout among this age group. The later maturation hypothesis is
unique in combining age and generation effects by reasoning that different cohorts
experience life-cycle events at different moments in their life span. Although rather
straightforward and intuitive, to my knowledge, the idea of life-cycle delays and
44
SMETS, Kaat (2010), A Widening Generational Divide? Assessing the Age Gap in Voter Turnout Between Younger and Older Citizens European University Institute
DOI: 10.2870/15899

Chapter 2. Age differences in political participation
later maturation has not yet been linked to turnout decline among young voters
in the literature.8 It is a central aim of this thesis to investigate this link.
As discussed above, individual level characteristics are but one group of indica-
tors found to influence voter turnout. Starting with the work of Franklin (2004),
the interplay between characteristics of elections and generational replacement
has received a great deal of scholarly attention in recent years (see also Franklin,
Lyons and Marsh, 2004). Making the link to institutionalism, the context in which
elections are held is considered of crucial importance. However, since many insti-
tutional features are stable through time and thus cannot explain turnout decline,
the focus should be on characteristics that change from election to election.
In short, the decision of individuals to vote (or not) should be seen as a by-
product of this context or character of elections. In particular in this respect, com-
petitiveness of elections is seen as an important contextual indicator of turnout.
Any research trying to explain turnout decline should thus include both individual
level and macro level indicators. This thesis will therefore also research the hy-
pothesis that characteristics of elections influence turnout. It will be particularly
interesting to see whether both life-cycle delays and electoral characteristics are
accountable for over-time trends, or whether the two explanations are mutually
exclusive. The literature, however, provides no indications that the two hypotheses
cannot coincide.
Where possible other theoretical explanations will also be touched upon. In
the fifth chapter of this thesis, for example, the later maturation hypothesis will be
8The idea that the interplay life-course development and socio-historical influences needs totaken into account when researching the the relationship between age and politics has, nonethe-less, already been brought up decades ago (see e.g. Elder, 1975, p. 168, and Braungart andBraungart, 1986, p. 220).
45
SMETS, Kaat (2010), A Widening Generational Divide? Assessing the Age Gap in Voter Turnout Between Younger and Older Citizens European University Institute
DOI: 10.2870/15899

2.3. Theoretical framework, hypotheses, and research design
assessed in light of all other available indicators of youth voter turnout available
in the British Election Studies on which the empirical analyses are based.
Summarizing, this thesis will test – at at minimum – two competing hypothe-
ses accounting for over-time differences in the age gap caused by declining levels
of turnout among young citizens. One of these hypotheses deals with character-
istics of voters, the other with characteristics of elections. More precise working
hypotheses will be formulated in the chapters dealing with the assessment of the
later maturation hypothesis and the hypothesis concerning changes in electoral
characteristics. Before turning to the empirical part of this thesis, a few words on
the research design are, however, in order.
Since both individual level and macro level hypotheses were identified for as-
sessment, the level of analysis will change accordingly on a chapter-by-chapter ba-
sis. Since this research has two comparative dimensions – over-time and between-
country – a quantitative approach seems most evident and hypotheses will there-
fore be assessed through secondary analysis of existing data.
Panel data, allowing for the following of the same respondents over time, is
best suited to distinguish different age effects (Hooghe, 2004, p. 336; Glenn, 2005)
and would be especially useful to assess the later maturation hypothesis. To my
knowledge there is, however, no such panel data available that contains the relevant
indicators and is composed of sufficient waves to allow for a relatively large time
dimension. The time span of the data is of the essence as we assume a.) that certain
transformations in the life-cycle have been set in motion in the 1960s, 1970s, and b.)
that, for example, certain institutional changes implemented decades ago may still
have their effect on current turnout levels due to the mechanism of demographical
46
SMETS, Kaat (2010), A Widening Generational Divide? Assessing the Age Gap in Voter Turnout Between Younger and Older Citizens European University Institute
DOI: 10.2870/15899

Chapter 2. Age differences in political participation
replacement. I, therefore, rely on the best alternative to assess my hypotheses:
repeated cross-sectional election surveys.
Since the different chapters of this thesis serve different purposes, the data used
for the assessment of hypotheses will change on a chapter by chapter basis. The
following chapter, focusing on establishing between-country differences in over-
time trends in the a gap, makes use of national election surveys conducted in
ten Western democracies: Canada, Denmark, Finland, Germany, Great Britain,
Italy, the Netherlands, Norway, Sweden and the United States. These are the ten
countries in which election studies have more or less continuously been conducted
from the 1960s, 1970s onwards.
The choice to focus on advanced industrial democracies, apart from data avail-
ability, is based on the idea that explanatory mechanisms for over-time changes
in levels of youth political participation are specific to Western democracies. For
example, the societal changes that are here hypothesized to account for changes
in the age at which people experience certain life-cycle events are an exclusive
Western phenomenon. By focusing on certain events that are specific to advanced
industrial societies, generalisation in the broadest sense is indeed not feasible.
However, improving our knowledge of the mechanisms at work in a smaller set
of countries seems a more desirable idea than making a weak attempt to explain
worldwide phenomena.
A problematic feature of the most similar systems design is, as John Stuart Mill
already pointed out in 1843, that it is hard to find cases that indeed are similar
(see Lijphart, 1971). Most of the time cases are different in more respects than
that they are similar. In fact, we could ask ourselves whether it ever is possible
to construct a most similar systems design. In line with the work of Barnes and
47
SMETS, Kaat (2010), A Widening Generational Divide? Assessing the Age Gap in Voter Turnout Between Younger and Older Citizens European University Institute
DOI: 10.2870/15899

2.3. Theoretical framework, hypotheses, and research design
Kaase (1979), it is important to realize to what extent we believe the countries
under study to be similar and to which extent we do not. In the case of the
ten countries under study in chapters three and six, the differences between the
countries are more likely to be found in the political and institutional sphere than
with regard to the individual level characteristics of the citizens.
That said, between-country differences in individual characteristics of citizens
of interest in this research are in fact not too well-documented. The later matura-
tion hypothesis that is central in this thesis is based on the idea that individuals
face certain life-cycle events at a higher average and that this trend can be related
to youth turnout decline. While conventional wisdom suggests that this trend has
generally taken place in all Western democracies, very little is known about even-
tual between-country differences in the age at which certain life-cycle events are ex-
perienced (see Iacovou (2002) for an exception). Longitudinal country-comparative
data is even harder to find.
The fourth chapter focuses on the effect of later maturation on turnout decline.
Although this hypothesis should ideally be assessed in a country-comparative set-
ting, there are two considerations to take into account when it comes to data
choice. Firstly, there needs to be a trend that can be explained. If turnout does
not decline, there is also no need to test explanations for over-time decreases in
turnout among younger voters. Since we will see in chapter four that not all coun-
tries show evidence of a widening generational divide, this limits the number of
countries to focus on. A second, not unimportant consideration is availability of
data. After comparing the questionnaires of the different available election stud-
ies, it appeared the British Election Studies included by far the most life-cycle
indicators. Being a country that demonstrates a widening generational divide due
48
SMETS, Kaat (2010), A Widening Generational Divide? Assessing the Age Gap in Voter Turnout Between Younger and Older Citizens European University Institute
DOI: 10.2870/15899

Chapter 2. Age differences in political participation
to rapidly declining turnout levels among young voters, the chapter on the impact
of later maturation on turnout focusses solely on the British case.
Pooling the British Elections Studies – or any other cross-sectional studies
for that matter – does not come without problems and concessions to be made.
Answering categories for relevant variables had to be scaled down to the lowest
common denominator, a process that pertains loss of information. Other potential
problematic features include over-time changes in the wording of the questions, the
fact that placement of questions within the questionnaire differed over-time and
space and that different sampling techniques were used (see Przeworski and Teune,
1966; Przeworski and Teune, 1970; Kuechler, 1987; Jowell, 1998; van Deth, 1998;
Braun, 2003; van de Vijver, 2003; and Blasius and Thiessen, 2006 for a discussion).
Most importantly, however, functional equivalence – one of the most impor-
tant concepts in comparative research – does not seem to be at stake here in this
research. Chapter three, where we compare trends in different countries is based
on solely two variables: age and individual level voter turnout. Since voting is the
most uniform act of political participation (Hooghe and Kavadias, 2005, p. 9), a
lack of functional equivalence can hardly be a problem in this chapter. Chapter
four, which provides an assessment of the later maturation hypothesis, is based
on British data only. This decreases the chance of functional inequivalence. Sec-
ondly, the type of variables that we will work with (mostly background variables
measured at the individual level) in most instances do not pose problems of in-
equivalence (Braun and Mohler, 2003). The minimum requirement of the use of
random samples is also met (Hader and Gabler, 2003).
In the last chapter of this thesis the focus will shift from the individual to the
aggregate level again. By doing so the chapter serves two goals. The first is to
49
SMETS, Kaat (2010), A Widening Generational Divide? Assessing the Age Gap in Voter Turnout Between Younger and Older Citizens European University Institute
DOI: 10.2870/15899

2.3. Theoretical framework, hypotheses, and research design
assess what can account for movements of the age gap through time approaching
the phenomenon from an election-to-election perspective. The second aim, closely
related to the first one, is to attempt to explain between-country differences in
trends in the age gap. The chapter again uses election study data from ten coun-
tries to measure the dependent variable. The independent variables used in the
analyses come from different sources, however. The data used in this thesis will
be discussed in more detail in the chapters to come.
50
SMETS, Kaat (2010), A Widening Generational Divide? Assessing the Age Gap in Voter Turnout Between Younger and Older Citizens European University Institute
DOI: 10.2870/15899

Chapter 3
Trends in age differences in voterturnout
This thesis started from the observation that in Canada and Great Britain turnout
levels among young people are declining much more rapidly than the turnout
levels among older age groups. As a consequence, the age gap in voter turnout
is widening. Whether similar age patterns in voting behaviour exist in other
countries, so far, remains unknown. One of the aims of this thesis is to fill this gap
in the literature. As such, this chapter address the first part of the central research
question of this thesis: What are the trends in the age gap in voter turnout between
younger and older voters? The focus of this chapter is on advanced industrial
democracies.
In the first part of the chapter the age gap itself will be central as trends in the
difference in turnout patterns between younger and older voters will be plotted and
described for ten countries. Following, in the second part of the chapter, a more
in-depth glance at over-time trends in age differences in voter turnout will be will
be taken by tracking turnout patterns of different birth cohorts through time. The
current chapter focuses exclusively on describing trends and identifying between-
51
SMETS, Kaat (2010), A Widening Generational Divide? Assessing the Age Gap in Voter Turnout Between Younger and Older Citizens European University Institute
DOI: 10.2870/15899

3.1. Data
country differences. Explanations for over-time and between-country differences
will be dealt with in later chapters.
The key finding of this chapter is that despite the fact that youth voter turnout
is often discussed in general terms, age patterns in voter turnout differ greatly from
country to country. As expected, there where evidence of a widening generational
divide is found, this trend is largely caused by turnout patterns among younger
voters. Turnout levels of younger and older voters usually move in the same
direction, but young adult’s turnout patterns often represent a magnified version
of trends going on in the electorate at large. Lastly, youth voter turnout is found
to be particularly low in countries where the overall turnout patterns are also low.
3.1 Data
This chapter focuses on trends in age differences in voter turnout. Data for this
chapter comes from national election surveys conducted in ten Western democra-
cies: Canada, Denmark, Finland, Germany, Great Britain, Italy, the Netherlands,
Norway, Sweden, and the United States. These are the ten Western democracies
for which election studies have more or less continuously been conducted since the
1960s or 1970s onwards. The latter is important as it allows us to look at age
differences in voter turnout over as large a time span as possible. Summarizing,
the findings in this section stem from individual level data on electoral behaviour
and its predictors in 112 elections held between 1960 and 2006 in ten countries.9
(See table 3.1 for a global summary of the data.)
9In fact, a higher number of elections was held in these countries between the starting date ofthe election study series in each country and present time. The following data was not available:Denmark 1973 (no age variable), Denmark 2001, 2005, 2007 (not (yet) released), Italy 1976, 1979(no election studies), Sweden 2006 (no age variable). Not yet available when the research forthis chapter was conducted: Canada 2008, Finland 2007, Germany 2005, United States 2008.
52
SMETS, Kaat (2010), A Widening Generational Divide? Assessing the Age Gap in Voter Turnout Between Younger and Older Citizens European University Institute
DOI: 10.2870/15899

Chapter 3. Trends in age differences in voter turnout
Country Period No. of electionsCanada ’65-’06 13Denmark ’71-’98 11Finland ’72-’03 9Germany ’69-’02 10Great Britain ’64-’05 11Italy ’72-’06 8The Netherlands ’71-’06 12Norway ’65-’05 11Sweden ’60-’02 14United States ’60-’04 1210 countries period covered:’60-’06 112 elections
Table 3.1: Global summary of the data
Although the American National Election Studies (ANES) relate data on both
midterm and presidential elections, only the latter are used in the descriptive
analyses of this chapter as the US presidential elections have the more similar
status to the parliamentary elections held in the other nine countries. A concise
description of the origins of the data can be found in appendix A.
3.2 Younger versus older voters through time
Focussing on the age gap in voter turnout, figure 3.1 plots the average turnout (in
percentages) of two age groups through time: voters younger aged 35 years or less
versus voters aged more than 35 years.10 Each graph in the figure shows over-time
trends for a different country.
10Different cut-off points of age were tried. Naturally, the higher the chosen cut-off point,the smaller the differences in turnout between younger and older voters. Differences, as it were,become flattened out. The choice for a cut-off point at the age of 35 is prompted by twotheoretical arguments. The first is that it seems reasonable to assume that most voters by theage of 35 have made the transition from the first to the middle stage of the life-cycle. Secondly,by the age of 35 most voters should have been able to face three elections. This is the numberof elections it is argued to take to establish a habit to vote or not.
53
SMETS, Kaat (2010), A Widening Generational Divide? Assessing the Age Gap in Voter Turnout Between Younger and Older Citizens European University Institute
DOI: 10.2870/15899

Fig
ure
3.1:
The
age
gap
intu
rnou
tfo
rte
nW
este
rndem
ocr
acie
s,19
60s-
2000
s
54
SMETS, Kaat (2010), A Widening Generational Divide? Assessing the Age Gap in Voter Turnout Between Younger and Older Citizens European University Institute
DOI: 10.2870/15899

figu
re3.
1co
nti
nu
ed
55
SMETS, Kaat (2010), A Widening Generational Divide? Assessing the Age Gap in Voter Turnout Between Younger and Older Citizens European University Institute
DOI: 10.2870/15899

figu
re3.
1co
nti
nu
ed
56
SMETS, Kaat (2010), A Widening Generational Divide? Assessing the Age Gap in Voter Turnout Between Younger and Older Citizens European University Institute
DOI: 10.2870/15899

Chapter 3. Trends in age differences in voter turnout
By subtracting the average turnout of the oldest age group from the average
turnout of the youngest voters, we can calculate the difference in turnout levels
between the two groups. The more negative the number, the wider the age gap
(whereby young people participate less than older age groups). A difference of
zero, on the other hand, means that younger and older citizens have the same
level of turnout.
Also reported in each graph is the official turnout as a percentage of the elec-
torate. For all European countries and Canada this level is based on turnout as
reported in the voter turnout database of the International Institute for Democracy
and Electoral Assistance (IDEA). Data for the United States come from MacDon-
ald and Popkin’s United States Elections Project (see McDonald and Popkin, 2001
for a description). Data in all graphs has been adjusted for sampling errors and
over-reporting of turnout (based on the above-mentioned measurements of official
turnout levels).
Starting with some general observations, the first thing to be noticed from
the ten graphs reported in figure 3.1 is the between-country difference in trends.
Over-time turnout patterns for Canada, Denmark, Great Britain, Norway, and the
United States show evidence of a widening generational divide. In Germany, Italy,
the Netherlands, Sweden and the United States the age gap is, however, relatively
stable through time. Finland has a pattern of its own and cannot be said to either
have a stable or a widening trend.
What all countries do have in common is that movements in the age gap, apart
from a few exceptions, are caused by changing turnout patterns among the younger
age group. Young people’s turnout patterns are often a magnified representation
of older people’s turnout patterns. If turnout among older voters goes up, turnout
57
SMETS, Kaat (2010), A Widening Generational Divide? Assessing the Age Gap in Voter Turnout Between Younger and Older Citizens European University Institute
DOI: 10.2870/15899

3.2. Younger versus older voters through time
among younger voters in many instances will go up even more. If turnout among
older voters goes down, turnout among younger voters will oftentimes decline at
an even faster pace. This means that widening or narrowing trends in the age gap
are mostly set in motion by changes in young people’s turnout patterns and not by
shifts in older voter’s turnout behaviour. This makes sense in light of the discussion
of the literature in chapter two. Here we observed that all theoretical mechanisms
concerning age differences in political participation contend that young adulthood
is a crucial stage in the formation of participation patterns. Young adults, it
is thought, are not yet set in their political ways and, as such, are more easily
influenced by external factors.
Another general observation to be made from the graphs is that there where
general turnout levels go down, younger voters seem to have a disproportionate
share in this turnout decline compared to older voters. Another way to put it is
that youth turnout levels are particularly low in countries where general turnout
levels are also low. This finding is in line with the research of e.g. IDEA (1999),
Blais et al. (2002), Gidengil et al. (2003), Franklin (2004) and Fieldhouse, Tranmer
and Russell (2007).
Turning to the graphs on a country-by-country basis, as expected, we find
evidence of a widening generational divide in Canada. Basically, the time span
under investigation (1965-2006) can be divided into two periods. In the first period,
up to 1980, the age gap was relatively stable, usually moving within a range of a
5-10 percentage point difference between younger and older voters.11 After 1980,
however, the age gap widened, ranging around a 20 percentage point difference
11Note that the turnout difference is always to the disadvantage of the younger voters (i.e. inthe sense that young adults vote less than older age groups) unless explicitly mentioned otherwise.
58
SMETS, Kaat (2010), A Widening Generational Divide? Assessing the Age Gap in Voter Turnout Between Younger and Older Citizens European University Institute
DOI: 10.2870/15899

Chapter 3. Trends in age differences in voter turnout
in turnout levels between younger and older voters. The 2000 and 2006 elections
even recorded a 30 percentage point difference in turnout. The widening of the
age gap coincides with a decline in the overall Canadian turnout level noticeable
from the 1980 elections onwards (although the last two elections in 2004 and 2006
did show a slight increase in general turnout levels).
In Denmark general turnout levels have been relatively stable. Nonetheless,
the country shows signs of a widening generational divide. When drawing an
imaginary line from the first recorded time point to the last one, we can observe
that the age gap has increased by 10 percentage points between 1971 and 1998.
Although the magnitude of the over-time movement of the age gap may not come
close to resembling that of Canada, the widening of the age gap is unmistakably
visible from the data.
Finland is an outlier within the group of countries recorded here. First of all,
turnout differences between younger and older voters increased steadily from the
1970s to the 1990s, which is earlier than the increase in the age gap in voter turnout
found in any of the other countries. Another way in which Finland is an extreme
case is in the non-linearity of the over-time trend. The age gap widened from the
early 1970s to the early 1990s, but thereafter this we find that turnout levels among
younger and older voters move in each other’s direction. The difference in turnout
among younger and older voters is still a good 20 percentage points though. In the
last election recorded, the Finnish age gap seems to widen again. The year 1975
is an outlier within an outlier. After weighting for over-reporting in turnout, the
average turnout among young voters in this year was over 50 percentage points
lower than among older citizens. This percentage is an effect of a reported turnout
of 100% among older voters that distorts the weighting process.
59
SMETS, Kaat (2010), A Widening Generational Divide? Assessing the Age Gap in Voter Turnout Between Younger and Older Citizens European University Institute
DOI: 10.2870/15899

3.2. Younger versus older voters through time
For Germany over-time trends in the age gap are fairly stable. Differences in
turnout patterns between younger and older voters were smallest in 1969, 1982
and 1987 when they ranged around a 0 to 5 percentage point difference. In the
elections of 1972 the difference even turned positive as young adults turned out at
slightly higher levels than the electorate aged more than 35 years. After 1987 the
age gap became a little larger in the range of a 10 to 15 percentage point difference.
We can, however, not speak of a general trend here as similar differences in the
turnout patterns between young and old were recorded in 1976 and 1980. The
slight widening of the age gap after 1987 seems to coincide with a more general
decline in turnout, dropping from an average of 85-90% to around 80% after this
election year.
Great Britain is the European country that shows over-time turnout patterns
most similar to those observed in Canada. The age gap in turnout was fairly
stable in Great Britain up until the election of 1992 (ranging between a 15 to
20 percentage point difference in turnout levels of younger and older voters), but
steadily started to widen after this election year with the biggest difference of
almost 35 percentage points recorded in 2005. The observed trend in the age gap
goes together with a general decline in turnout. It should, however, be noted that
with the exception of the 2005 elections turnout not only dropped quite steadily
among the youngest voters, but also among those aged more than 35 years.
Over-time patterns in the age gap for Norway resemble those of Canada and
Great Britain, although there are also some differences. To start with the similar-
ities, the age gap in turnout in Norway starts to widen from 1989 onwards after
a period of relative stability from the beginning of our measurement in 1965. In
recent years the turnout difference between younger and older voters has averaged
60
SMETS, Kaat (2010), A Widening Generational Divide? Assessing the Age Gap in Voter Turnout Between Younger and Older Citizens European University Institute
DOI: 10.2870/15899

Chapter 3. Trends in age differences in voter turnout
around 20 percentage points. It should, however, be noted that turnout, generally
speaking, is much higher in Norway than in Canada and Great Britain. Moreover,
the general decline in turnout in the period after 1989 in Norway is much smaller
than in either Canada or Great Britain (around 5 percentage points).
Contrary to Great Britain and Norway, the Netherlands and Sweden show
exceptionally stable patterns in the age gap. Although the age gap is slightly
wider in the Netherlands than in Sweden, the two countries show remarkably
similar patterns. Up until the middle (Sweden) and end (the Netherlands) of the
1970s a narrowing trend of the age gap is to be observed, after which relative
stability sets in.
The turnout difference between younger and older voters in Italy is almost
not apparent. Sometimes younger voters have higher turnout levels, in other elec-
tions those aged more than 35 years do. The difference, however, never exceeds
5 percentage points. Italy, without a doubt, has the most stable age gap in voter
turnout from all countries under research in this chapter.
In the United States, lastly, the age gap has gradually become larger over time
and the trend line is therefore more linear than in other countries. The turnout
difference between younger and older voters has generally been somewhat larger
than in other countries, increasing from around 10 percentage points in the first
election years to 20 percentage points in later years. General turnout levels in the
United States are also lower than in most other countries. Recent turnout levels in
Canada and Great Britain do, however, compare with those in the United States.
61
SMETS, Kaat (2010), A Widening Generational Divide? Assessing the Age Gap in Voter Turnout Between Younger and Older Citizens European University Institute
DOI: 10.2870/15899

3.3. Following cohorts through time
3.3 Following cohorts through time
After having taken a glance at simple age differences in turnout by tracking the
age gap, in this second part of the chapter we will dig deeper and take a more
in-depth look at age differences by focusing on turnout patterns of different co-
horts. The later maturation theory that is central throughout this thesis combines
age and cohort effects by reasoning that different cohorts and generations have
different patterns of ageing. These different patterns of ageing cause cohorts to
have different participation levels. It is therefore useful to look at the over-time
development of participation patterns of different cohorts in addition to simple
turnout difference between younger and older voters.
Figure 3.2 shows over-time turnout patterns by cohort for the same countries
as in figure 3.1 except Denmark. The election studies of this country include a
grouped instead of a continuous age variable. This makes it impossible to identify
the birth year of the respondent based on which the cohorts are constructed.
Information on the birth year is missing in a few other instances as well: Canada
1972, Finland 1972 and 1987, and the Netherlands 1989.
Cohorts are defined by the birth decade of the respondent.12 Each graph shows
the turnout patterns of those respondents born in the 1930s through to the 1980s.
This roughly corresponds to starting with those respondents that were young in
the 1960s and/or 1970s. As in the previous figure data in all the graphs has been
adjusted for sampling errors and over-reporting of turnout. Note that in some
12Electoral cohorts were considered as well but decided against for two reasons. First, us-ing electoral cohorts yields an even smaller n per cohort than birth cohorts already do in someinstances – especially the sample size in the first recorded election year of the given birth co-hort may be very small indeed. Secondly, from a visual perspective plotting birth cohorts isadvantageous over plotting electoral cohorts as it reduces the number of lines in each of thegraphs.
62
SMETS, Kaat (2010), A Widening Generational Divide? Assessing the Age Gap in Voter Turnout Between Younger and Older Citizens European University Institute
DOI: 10.2870/15899

Chapter 3. Trends in age differences in voter turnout
election years the sample size for a given birth cohort is rather small and that this
may distort the results.
Naturally, looking at the graphs presented below is not going to help us under-
stand why certain birth cohorts have deviant levels of turnout from others. It does,
however, provide a first step towards identifying more precisely where changes in
age differences in voter turnout com from.
Starting with some general observations, once again we can clearly see a differ-
ence in over-time trends between the countries under study in this chapter. Based
on the description of the graphs plotting over-time trends in the age gap, it is
no surprise that in Canada, Great Britain, Norway, but also in the United States
turnout levels of the different cohorts vary extensively. Most of these were the
countries for which we observed a widening of the age gap and/or in which gen-
eral turnout levels were found to be low. In Italy, Germany, the Netherlands and
Sweden turnout levels of cohorts are much more alike as can be expected based on
the finding that the age gap in these countries was fairly stable over time.
Conventional wisdom holds that over the years incoming cohorts have voted at
ever lower levels. Although this claim is best assessed when using electoral cohorts,
birth cohorts can be made use off as well. The findings in figure 3.2 in part support
this claim. Although it is certainly not true that each incoming birth cohort has a
lower turnout level than the previous one, there seems to be an overall downward
trend with regard to the entry level turnout of birth cohorts.
63
SMETS, Kaat (2010), A Widening Generational Divide? Assessing the Age Gap in Voter Turnout Between Younger and Older Citizens European University Institute
DOI: 10.2870/15899

Fig
ure
3.2:
Turn
out
by
bir
thco
hor
tfo
rnin
eW
este
rndem
ocr
acie
s,19
60s-
2000
s
64
SMETS, Kaat (2010), A Widening Generational Divide? Assessing the Age Gap in Voter Turnout Between Younger and Older Citizens European University Institute
DOI: 10.2870/15899

figu
re3.
2co
nti
nu
ed
65
SMETS, Kaat (2010), A Widening Generational Divide? Assessing the Age Gap in Voter Turnout Between Younger and Older Citizens European University Institute
DOI: 10.2870/15899

figu
re3.
2co
nti
nu
ed
66
SMETS, Kaat (2010), A Widening Generational Divide? Assessing the Age Gap in Voter Turnout Between Younger and Older Citizens European University Institute
DOI: 10.2870/15899
Chapter 3. Trends in age differences in voter turnout
Moreover, the graphs seem to confirm the notion that in those countries where
large movements of the age gap were found, declining patterns of turnout among
the youngest birth cohorts seem to play a larger role in this. Another general
observation is that in many instances turnout levels of cohorts move in the same
direction. Although turnout also changes over-time among older cohorts, such
changes are much more defined among younger birth cohorts. Changes in younger
cohort’s turnout levels are, in other words, often a magnified representation of
changes in older voter’s turnout levels. As always, however, there are exceptions
to the rule.
Turning to a country-by-country description, the Canadian graph in figure 3.2
clearly shows how from 1979/1980 onwards age differences in voter turnout have
increased. Turnout levels of citizens born before 1960 is high over time. Turnout
levels among those born in the 1960s is somewhat lower, but stable through time.
However, among those born in the 1970s or the 1980s turnout patterns are both
low and highly volatile. These findings are entirely in line with the Canadian
research on the age gap discussed in the introductory chapter.
Great Britain shows a fairly similar pattern to that found in Canada. There are
two differences, however. Firstly between-cohort differences in turnout patterns
in Britain start to diverge a little later than in Canada: from 1990 onwards.
Basically all birth cohorts from the 1960s onwards show low and volatile turnout
patterns. The second difference is that before the divergence in Britain set in,
turnout differences between cohorts – although fairly stable – were somewhat larger
than in Canada to begin with.
Norway too shows great differences in turnout patterns between cohorts. It is
one of the countries where the notion of ever lower turnout levels among incoming
67
SMETS, Kaat (2010), A Widening Generational Divide? Assessing the Age Gap in Voter Turnout Between Younger and Older Citizens European University Institute
DOI: 10.2870/15899

3.3. Following cohorts through time
cohorts is best visible. In 1989 and 1993 turnout levels of the two youngest birth
cohorts have a different direction than older voter’s turnout patterns. Whereas
turnout among the older birth cohorts goes up, turnout levels among the youngest
cohorts goes down in these two election years.
In the United States turnout differences between cohorts have always been
large compared to most other countries. Each cohort does, however, shows to age
in a fairly similar way. Nonetheless, incoming birth cohorts turn out at ever lower
levels in the United States. This is the reason why we found a gradually widening
age gap for the United States in figure 3.1.
Germany and the Netherlands show remarkably similar between-cohort pat-
terns, just as those for Italy and Sweden are also comparable. In any case, these
are the four countries for which turnout differences between birth cohorts are
clearly smallest. Italy – as expected based on the graph in figure 3.1 – displays
hardly any turnout differences between cohorts. Turnout is stable and high for
all birth cohorts. In Sweden the differences are slightly more profound as there
seems to be a marginal increase in between-cohort turnout differences after 1979.
In country-comparative terms these between-cohort differences can, however, be
disregarded. In the Netherlands and Germany turnout differences between cohorts
are again somewhat larger than in Sweden. Overtime turnout patterns of cohorts
also tend to go up and down a bit more. Compared to Canada, Great Britain, and
Norway, however, levels of volatility in turnout levels of birth cohorts in Sweden,
the Netherlands and Germany are very small indeed.
Finland, lastly and as already noted, has a pattern of its own. The first thing to
notice is that compared to other countries turnout differences between cohorts are
very large. From the graph in figure 3.2 it also becomes clear how there were large
68
SMETS, Kaat (2010), A Widening Generational Divide? Assessing the Age Gap in Voter Turnout Between Younger and Older Citizens European University Institute
DOI: 10.2870/15899

Chapter 3. Trends in age differences in voter turnout
between-cohort differences in the mid-1970s that then became smaller and went up
and down some more afterwards. Again it should be noted that an exceptionally
high reported turnout level among the oldest birth cohorts in 1975 may distort
the picture somewhat for Finland.
3.4 Conclusion and discussion
The aim of this chapter was to take an in-depth look at over-time trends in age
differences in voter turnout. In recent years, a widening generational divide has
been observed in Canada and Great Britain. The widening of this gap is caused
by turnout levels among young citizens declining much more rapidly than turnout
levels among older age groups. As identified in the introductory chapter of this
thesis these findings prompt two questions: What are the trends in the age gap in
other countries, and how can these trends be accounted for?
Focusing on the first question, in this chapter the age gap in voter turnout was
plotted for ten Western democracies for which election study data was roughly
continuously available from the 1960s/1970s onwards: Canada, Denmark, Finland,
Germany, Great Britain, Italy, the Netherlands, Norway, Sweden and the United
States. The first and most obvious observation from the graphs in this chapter
is that there are clear between-country differences in trends in the age gap in
voter turnout. Five countries - Canada, Denmark, Great Britain, Norway, and the
United States – showed evidence of a widening generational divide. Differences in
turnout levels between younger and older voters, on the other hand, turned out to
be fairly stable through time in Germany, the Netherlands, and Sweden and even
remarkably stable in Italy. Finland turned out to be an outlier, both in terms of
69
SMETS, Kaat (2010), A Widening Generational Divide? Assessing the Age Gap in Voter Turnout Between Younger and Older Citizens European University Institute
DOI: 10.2870/15899

3.4. Conclusion and discussion
trends and the magnitude of the turnout differences between younger and older
voters. Table 3.2 provides a summary of the minimum and maximum scores of
the each gap in all ten countries and describes the over–time trends. For those
countries with a (relatively) stable age gap, the percentage point range within
which the age gap is stable is also noted.
Country Min. (%) Max. (%) Mean (%) TrendCanada 5,12 27,93 15,66 wideningDenmark 2,3 11,1 6,91 wideningFinland 13,23 51,95 23,96 trendlessGermany -5,33 15,18 4,4 stable (5-10 p.p. range)Great Britain 9,93 28,63 15,94 wideningItaly -4,7 3,2 -0,78 stable (5 p.p. range)the Netherlands 3,92 17,94 9,41 stable (15 p.p. range)Norway 2,99 21 13,24 wideningSweden 0,89 13,44 6,34 stable (10 p.p. range)United States 9,93 22,68 17,45 widening
Table 3.2: Summarizing trends in the age gap, 1960s-2000s
Movements in the age gap, apart from a few exceptions, were shown to be
caused by changing turnout patterns among young people in all countries. Also,
it was noticed that whenever overall turnout levels go down, young voters have a
disproportionate share in this compared to older voters. Moreover, youth turnout
levels are lowest in countries where general turnout levels are also low.
In the second part of the chapter, turnout trends by birth cohort were dis-
cussed and the same between-country differences were observed as for the age gap.
Although starting levels of turnout were not found to drop with every new incom-
ing cohort, there indeed seems to be a trend towards a decline in the entry level
turnout of incoming cohorts. This pattern is particularly evident in Norway and
in the United States.
70
SMETS, Kaat (2010), A Widening Generational Divide? Assessing the Age Gap in Voter Turnout Between Younger and Older Citizens European University Institute
DOI: 10.2870/15899

Chapter 3. Trends in age differences in voter turnout
Although the graphs discussed in this chapter show us over-time trends in age
differences in voter turnout and give an idea of between-country differences, they
do not provide an answer to the question why in some countries young people
develop distinct patterns of turnout. We will turn to this question in the next
chapters. Central questions to be answered still are: What causes the age gap to
widen or narrow? Why do incoming cohorts turn out at ever lower levels? What
can explain that we observe different trends in the age gap from one country to
the other?
71
SMETS, Kaat (2010), A Widening Generational Divide? Assessing the Age Gap in Voter Turnout Between Younger and Older Citizens European University Institute
DOI: 10.2870/15899

3.4. Conclusion and discussion
72
SMETS, Kaat (2010), A Widening Generational Divide? Assessing the Age Gap in Voter Turnout Between Younger and Older Citizens European University Institute
DOI: 10.2870/15899

Chapter 4
Later maturation and turnouttrends among young citizens
In the previous chapter the first central research question of this thesis was ad-
dressed by taking an in-depth look at the over-time trends in the age gap in voter
turnout in ten advanced industrial democracies. It was established that in some
Western democracies turnout among young adults has declined rapidly in recent
years, leading to a widening generational divide between younger and older voters.
One of the central aims of the remainder of this thesis is to assess what causes this
over-time drop in turnout among young voters.
The political life-cycle model predicts low levels of turnout among young people
as this age group faces pre-occupations outside the political sphere that lead to
low attachment to civic life. In terms of the life-cycle model, a decline in turnout
levels among young adults means that this age group nowadays faces more and/or
extended ‘start-up’ problems than the young cohorts that entered the electorate
before them.
Based on findings in the sociological literature and circumstantial evidence, it
seems plausible to reason that the political life-cycle of young people of today is
73
SMETS, Kaat (2010), A Widening Generational Divide? Assessing the Age Gap in Voter Turnout Between Younger and Older Citizens European University Institute
DOI: 10.2870/15899

indeed not similar to the life-cycle of their parents and grandparents when they
were young. Higher educational levels have resulted in young people staying in
school longer, starting their first job later, getting married later, starting a family
at a higher average age, etc.
The central focus of this chapter is to establish the extent to which these delays
in experiencing certain life-cycle events can account for changed turnout patterns
among young adults. Despite frequent references in the literature to the political
life-cycle and cohort/generation models, changes in the timing at which different
cohorts face life-cycle events – to my knowledge – have never been tied to youth
turnout decline. This gap in the literature will be addressed in the current chapter
by focusing on Great Britain – one of the countries that has seen a widening of
the age gap due to a steady drop in turnout among younger voters.
Empirical analyses in this chapter support the notion that later maturation
plays a role in the turnout decline among young British voters in recent decades.
As predicted by the life-cycle theory, maturation is found to be a strong and
significant predictor of individual level youth voter turnout. Levels of maturation
among young Brits have, however, declined over time. This means that recent
cohorts have experienced fewer life-cycle events that are considered to be important
catalyzers of turnout than the generations before them. Hence, later maturation
can be linked to declining turnout levels among young adults. All in all, later
maturation is found to explain roughly 10% of the turnout difference among young
voters before and after 1990.
74
SMETS, Kaat (2010), A Widening Generational Divide? Assessing the Age Gap in Voter Turnout Between Younger and Older Citizens European University Institute
DOI: 10.2870/15899

Chapter 4. Later maturation and turnout trends among young citizens
4.1 The life-cycle model: in need of an update
or overdue?
According to the life-cycle argument young adults vote less than older citizens
because they are faced with ‘start-up’ problems. Young people, it is argued, par-
ticipate less in politics given their low attachment to civic life, a characteristic
that is fuelled by young people still going through education, being occupied with
finding a partner, trying to establish a career, having higher mobility, dealing with
the psychological transformation into adulthood, etc. In middle-age, participation
rates are thought to stabilise at a higher level as people experience certain life-
cycle events such as leaving the parental home, buying a house, getting a full-time
job, starting a family, settling down in a community, etc. Even though many of
these processes demand time, they are associated with activities (involvement in
organizations, associations, the community, etc.) that tend to enhance political
participation due to increased motivation, mobilisation, skills, and pressure (Strate
et al., 1989, p. 444; Lane, 1959, p. 218; Kinder, 2006).
So far, the political life-cycle has mostly been conceived as a static curvilinear
relationship. However, we do not know whether the life-cycle of political par-
ticipation really exists, or whether its shape differs across time and space. The
life-cycle model as such cannot explain over-time trends in turnout patterns be-
tween younger and older voters. That is, if life-cycle events take place at the same
age for every cohort (meaning that the shape of the political life-cycle is identi-
cal for different generations), the turnout gap between younger and older citizens
should remain stable (see Kimberlee, 2002, p. 88 for a similar argumentation).13
13Naturally, this implies that we suppose that the impact of maturation on turnout is stablethrough time. There are no indications from the literature that this would not be the case.
75
SMETS, Kaat (2010), A Widening Generational Divide? Assessing the Age Gap in Voter Turnout Between Younger and Older Citizens European University Institute
DOI: 10.2870/15899

4.1. The life-cycle model: in need of an update or overdue?
There are, however, reasons to believe that the life-cycle of today’s young adults
is not the same as the life-cycle of young people of the past.
Due to their higher educational levels, young people nowadays stay in school
longer, have extended co-habitation with – as well as longer financial dependence
on – their parents, and face postponed full entry into the labor market (see Pirie
and Worcester, 1998; Billari and Wilson, 2001; European Commission, 2001b; Bil-
lari and Kohler, 2002; Furstenberg, Jr. et al., 2003; Kennedy, 2004; OECD, 2007).
In other words, there seems to be a delay in the transition from the first to the
middle stage of the political life-cycle as people experience key life-cycle events at
a higher average age.
If the life-cycle mechanism is indeed to work as described above, the trend
toward later maturation can be expected to have an impact on turnout levels of
younger cohorts. It should be able to explain at least part of the over-time decline
in turnout among young people observed in the previous chapters.
The interesting question is thus how the initial stage of the life-cycle of con-
temporary young cohorts is proportionate to the same life-cycle stage of older gen-
erations, and how this affects participation patterns of the former cohort. From a
pure life-cycle perspective, a delay in the initial stage of young people’s life-cycle
‘merely’ indicates a delay in turnout patterns. As soon as young people start
making the transition into the middle stage of the life-cycle (whether delayed or
not), their participation rates should reach high(er) levels. That is, the life-cycle
theory does not indicate that delays or disruptions in the early life-cycle stage
have a lasting (reducing) impact on turnout. Later maturation, therefore, does
not necessarily have to lead to a rapid overall decline of general turnout levels.
The delayed life-cycle effect is indicated by the grey line in figure 4.1.
76
SMETS, Kaat (2010), A Widening Generational Divide? Assessing the Age Gap in Voter Turnout Between Younger and Older Citizens European University Institute
DOI: 10.2870/15899

Chapter 4. Later maturation and turnout trends among young citizens
Figure 4.1: The life-cycle of political participation (updated)
How likely it is that delays or disruptions of the life-cycle do not alter people’s
turnout patterns in later life is an altogether different question. As was pointed
out in chapter two, some scholars argue that turning out to vote is a matter of
habit (see e.g. Green and Shachar, 2000; Kanazawa, 2000; Plutzer, 2002; Ben-
dor, Diermeier and Ting, 2003; Gerber, Green and Shachar, 2003; Franklin, 2004;
Franklin, Lyons and Marsh, 2004; Fowler, 2006; Aldrich, Taylor and Wood, 2007).
Experiencing little political activity in the early stages of the life-cycle, according
to this theory, decreases the likelihood of turning out to vote in later life. Sub-
sequently, experiencing more and/or extended start-up problems at the beginning
of the political life-cycle, makes it highly unlikely that young citizens will develop
political habits at a later stage of life. Turnout levels, then, will stay lower during
the whole life span causing a continuous decline in overall turnout levels.
77
SMETS, Kaat (2010), A Widening Generational Divide? Assessing the Age Gap in Voter Turnout Between Younger and Older Citizens European University Institute
DOI: 10.2870/15899

4.1. The life-cycle model: in need of an update or overdue?
Although the latter is a very plausible scenario, the scope of this chapter is
not to test the two competing hypotheses. Whether participation is a matter of
aging or a habit acquired at a young age is useful to try to predict future levels
of political participation, but it does not provide an answer to the question why
turnout levels among young adults have changed overtime. As may be recalled
from the introductory chapter, the primary aim of this thesis is to explain observed
trends, and not to predict future levels of turnout. The mechanisms that explain
the development of participation over the life span are, therefore, only partially
useful to answer the research question central in this thesis. Instead, it is much
more helpful to concentrate on the dynamics behind the mechanisms.
Delays in the life-cycle, as far as I am concerned, may just as well lead to
young people establishing a habit of abstention as characteristics of elections or
other social, cultural or historical events do. Whether this is the case or not,
however, cannot be assessed since we cannot compare the life span development of
voter turnout of contemporary young adults to the life span participation patterns
of young people of the past. Today’s youth is only just experiencing the early
stages of their political life-cycle. The future participation levels of these young
citizens are only to be guessed at.
Summarizing, the main argument put forward in this chapter (and indirectly
also in the remainder of this thesis) is that it seems reasonable to expect that these
days due to a delay in the timing of certain life-cycle events a higher proportion
of young people compared to a couple of decades ago is still in education, is not
married, has not yet established a family, has not started their first real job, is not
a home owner, etc. If the mechanisms of the life-cycle model work as expected, this
should have an unfavourable effect on youth turnout levels through time. More
78
SMETS, Kaat (2010), A Widening Generational Divide? Assessing the Age Gap in Voter Turnout Between Younger and Older Citizens European University Institute
DOI: 10.2870/15899

Chapter 4. Later maturation and turnout trends among young citizens
sharply put: if the movement of several characteristics of the political life-cycle to
a higher average age does not translate into changes in turnout patterns of young
people, we have serious reasons to doubt the over-time validity of the life-cycle
model.
Since it is possible to see how indicators of the life-cycle (education, marital
status, home ownership, etc.) differ in their influence on the probability of turning
out to vote for young people of the past and contemporary youth, the impact of
later maturation on youth voter turnout can fairly easily be tested.
Summarizing, the following hypotheses will be assessed:
- Hypothesis 1: Life-cycle events monitoring the transition from the first to
the middle stage of the political life-cycle have gradually moved to a higher
average age.
- Hypothesis 2: The over-time movement of political life-cycle indicators to a
higher average age has a negative effect on the turnout levels of young adults
and should, thus, at least in part, be able to explain rapidly declining turnout
trends among this age group.
The above hypotheses should first and foremost be seen as a test of the over-
time validity of the life-cycle model by linking it to some very well-documented
trends in the age distribution of some of its most important indicators. The later
maturation hypothesis is by no means considered to give a full explanation for
the observed trends in youth voter turnout. There are two reasons why effects of
later maturation on youth voter turnout are expected to be small. First of all,
it is generally known that individual level demographics such as the ones central
79
SMETS, Kaat (2010), A Widening Generational Divide? Assessing the Age Gap in Voter Turnout Between Younger and Older Citizens European University Institute
DOI: 10.2870/15899

4.1. The life-cycle model: in need of an update or overdue?
in the life-cycle model only marginally influence voter turnout. On top of this,
the explanatory value of such individual level variables diminishes over-time (Pen-
nings, 2002). Secondly, as pointed out in chapter two, there are several alternative
explanations for declining turnout levels among young voters. Changes in media
habits, associational membership, and values, but also changes in electoral rules
and the competitiveness of elections are examples of such alternative explanations.
The same goes for attitudinal indicators such as e.g. political knowledge, politi-
cal interest, political efficacy, trust, etc. Such alternatives should be included in
a fully specified model of turnout. The aim of this chapter is, however, not to
explain as much variation as possible, but to provide the best possible test of the
later maturation hypothesis. Subsequent chapters will focus on the alternative
explanations.
Before turning to the empirical assessment of the hypothesis central in this
chapter, it should be noted that despite frequent references to the life-cycle model
in the literature, relatively little is known about the influence that each possible life
event has on individual’s levels of turnout. As mentioned in the literature review
in chapter two, empirical research often uses age as a proxy for the life-cycle stage
a respondent is in. Frequently mentioned obstacles of involvement in politics in
young life are: being in education, finding a partner, establishing a career, finding
a partner, and high mobility. People are considered to enter the middle life-cycle
stage through leaving the parental home, marriage (or cohabitation), starting a
family and home ownership. Before turning to a description of the data and the
analyses, we will briefly review the way each single life-cycle event is expected to
influence voter turnout. The acquisition of an ‘adult role’ is what ties the events
together.
80
SMETS, Kaat (2010), A Widening Generational Divide? Assessing the Age Gap in Voter Turnout Between Younger and Older Citizens European University Institute
DOI: 10.2870/15899

Chapter 4. Later maturation and turnout trends among young citizens
Leaving school is one of the first steps towards entering the adult world. Being
in school, from a theoretical perspective, thus, is seen as a first stage life-cycle
characteristic: a start-up problem that causes these citizens to be too pre-occupied
with externalities to get involved in political affairs (Wolfinger and Rosenstone,
1980; Strate et al., 1989; Jankowski and Strate, 1995; Highton and Wolfinger, 2001).
Empirical research paints a different picture, however. Studies that have researched
the effect of ‘being in education’ on individual level turnout, find a positive and
significant relationship between the two variables (Wolfinger and Rosenstone, 1980;
Highton and Wolfinger, 2001; Tenn, 2007). An explanation for this finding is that
young people that are still in school find themselves in a much more stimulating
environment than their non school-going peers. Since theory and empirical findings
contradict one another, the direction of the hypothesized effect between having a
student status or not and turnout can be twofold.
At some point after leaving high school most people leave the parental home
(Elder, 1985). Some take up a temporary residence in the city where they study,
others settle down more permanently. Not many studies have researched the ef-
fect of leaving the parental home on turnout. From an adult role perspective,
leaving the parental home should foster turnout. Highton and Wolfinger (2001),
nonetheless, found turnout among those that left the parental home to be lower
than among those that had not taken the adult step of moving out. Controlling
for confounding factors such as residential stability (discussed in more detail be-
low), the relationship between leaving the parental home and turnout is, however,
positive.
Settling down in a community goes hand in hand with residential stability.
Students especially are not considered to be tied to one place. This is parti-cularly
81
SMETS, Kaat (2010), A Widening Generational Divide? Assessing the Age Gap in Voter Turnout Between Younger and Older Citizens European University Institute
DOI: 10.2870/15899
4.1. The life-cycle model: in need of an update or overdue?
problematic in countries where electoral registration is the responsibility of the
voter (Highton and Wolfinger, 2001). The need to constantly re-register is a burden
that often leads to people abstaining. In this chapter, which solely focuses on Great
Britain, residential stability may thus be of lesser importance for youth voter
turnout as the voter registration process is in the hands of the government. Home
ownership, just like residential stability, is considered to strengthen community
ties (Lane, 1959; Jankowski and Strate, 1995).
After leaving school getting a job is often the next step towards assuming
adult roles (Lane, 1959; Elder, 1975; Jankowski and Strate, 1995). The work
environment is considered a place of political socialization in various ways – both
direct and indirect (Sigel, 1989). Certain jobs bring citizens directly in touch with
socio-political issues. Having a job, secondly, puts certain demands on citizens
(e.g. time-consciousness, punctuality, ability to follow written instructions, etc.).
Moreover, certain occupations come with a certain status. This status brings
with it a diversity of resources, skills, knowledge and prestige. The demands of
joining the work force may either trigger political interest directly, or – just like
occupational status – increase skills that are useful for participation in politics as
well (see also Verba and Nie, 1972 and Brady, Verba and Schlozman, 1995). The
work environment, lastly, is also considered to influence political interest because
workers are easily mobilized. These mobilization efforts can be expected to trigger
interest in socio-political issues. Overall, in the long run, having a job is therefore
expected to boost turnout.
Marriage and starting a family, lastly, are also considered to boost turnout in
the long run (Elder, 1975, 1985). Stoker and Jennings (1995) consider two ways in
which marital transitions are considered to affect participation. Firstly, marriage
82
SMETS, Kaat (2010), A Widening Generational Divide? Assessing the Age Gap in Voter Turnout Between Younger and Older Citizens European University Institute
DOI: 10.2870/15899
Chapter 4. Later maturation and turnout trends among young citizens
leads to changes in life circumstances. It often has practical consequences such as
changing styles of living, places of residence and perhaps even employment and
occupation. The second perspective focuses on the mediating function of a spouse.
Partners can learn from and influence each other. In other words, married citizens
may benefit from the potential motivation of a politically active spouse. Denver
(2008) adds a third explanation by arguing that married citizens adhere to more
traditional values. This may lead to married people to be more likely to conform
to the idea of good citizenship and consider voting and political engagement a civic
duty. In this study marriage and cohabitation are treated as one. First, both social
and legal boundaries between cohabitation and marriage are fuzzy (see Thornton,
Axinn and Xie, 2007, p. 80-81). Second, practical consequences as well as benefits
of a politically active spouse are present in a similar fashion among both cohabiting
and married couples. Having children – to conclude with – increases the awareness
of social needs, such as education, health, playgrounds, and even the responsibility
to perform as a citizen model (Lane, 1959). It can also be interpreted as a sign of
stability, and therefore, stronger links to the community.
For all the above-mentioned events discussed a distinction needs to be made
between short term and long term effects. Although leaving education, moving out
of the parental home, starting a full-time job, residential stability, home ownership,
marriage and having children all boost turnout in the long run, the short-term
effects are likely to be exactly the opposite. Transitions in and out of new roles
lead to a period of lesser stability. Attention will be deflected away from politics
and political participation will thus be discouraged instead of encouraged (see
Kinder, 2006, p. 1097, but also Stoker and Jennings, 1995, p. 425).
83
SMETS, Kaat (2010), A Widening Generational Divide? Assessing the Age Gap in Voter Turnout Between Younger and Older Citizens European University Institute
DOI: 10.2870/15899

4.2. Data
4.2 Data
The aim of this to chapter is to assess the extent to which later maturation can
explain the over-time decline in turnout levels among young citizens as observed
in chapter three. Panel data, allowing for the following of the same respondents
through time, would be most suited to track the impact of life-cycle changes on
turnout and distinguish different age effects (Hooghe, 2004, p. 336; Glenn, 2005).
To my knowledge, there is however no such panel data available that contains the
relevant indicators and is composed of sufficient waves to allow for a relatively large
time dimension. I, therefore, rely on the best alternative to assess my hypotheses:
individual level repeated cross-sectional election surveys.
Apart from the presence of a trend that can be explained, a requirement with
regard to the data is that a fair amount of life-cycle indicators is included. Ideally,
we would like to know whether young respondents have left education, whether
they have a partner, have a full-time job, live away from their parents, have res-
idential stablility, and own their own home. Attempts to create a multi-country
data set based on repeated cross-section election surveys stranded because of an
insufficient number of available life-cycle indicators. The effort did show that from
the countries researched in the previous chapter, Great Britain stands head and
shoulders above the other countries when it comes to the inclusion of life-cycle
indicators in the election surveys – only an indicator keeping track of whether a
respondent left the parental home or not is missing.
Though not perfect, British data allow for the best possible alternative to
investigate the later maturation hypothesis. Moreover, from the ten countries for
which the age gap was investigated, Great Britain is the one where over-time trends
84
SMETS, Kaat (2010), A Widening Generational Divide? Assessing the Age Gap in Voter Turnout Between Younger and Older Citizens European University Institute
DOI: 10.2870/15899

Chapter 4. Later maturation and turnout trends among young citizens
resembled those of Canada most. After an almost completely stable pattern in the
age gap, from the 1990s onwards a widening trend becomes evident. Although
turnout levels of older voters declined as well, the shift was clearly caused a by a
steeper decline in turnout among younger voters (see the graph for Great Britain
in figure 3.1). The question that merits an answer is how this steep(er) decline in
turnout among young voters can be explained. Put another way, we should ask
ourselves what it is that causes young people these days to turn out at lower levels
than their parents and grandparents did when they were young?
The central hypothesis of this chapter focuses on the effects of later maturation,
i.e. life-cycle events taking place at a higher average age. Due to later maturation
the proportion of young adults that, let us say, by the age of 35 that has acquired a
diversity of adult roles has declined. Since the acquisition of adult roles – according
to the life-cycle theory – is thought to be positively related to voter turnout, later
maturation among young adults can be expected to cause a drop in turnout among
this age group.
Table 4.1 provides an overview of the life-cycle indicators available in all 12
British Election Studies conducted from 1964 to 2005.14 Appendix A, in addition,
includes an overview of the exact studies used as well as their origin. All life-cycle
indicators that would ideally be included are available, with the exception of a
variable that identifies whether a young respondent still lives in with his or her
parents or not.
14Summary statistics of all indicators included in this chapter can be found in appendix B.
85
SMETS, Kaat (2010), A Widening Generational Divide? Assessing the Age Gap in Voter Turnout Between Younger and Older Citizens European University Institute
DOI: 10.2870/15899

feb
oct
1964
1966
1970
1974
1974
1979
1983
1987
1992
1997
2001
2005
Age
(0=
18-
1=
35ye
ars)
Not
ined
ucat
ion
(0,
1=
left
educ
atio
n)M
arri
ed/c
ohab
itin
g(0
,1
=m
arri
ed/c
ohab
itin
g)C
hild
ren
MM
(0,
1=
has
child
(ren
))H
ome
owne
rshi
pM
(0,
1=
owns
hom
e)R
esid
enti
alst
abili
tyM
MM
(in
year
s)(1
/3)
Wor
ks(0
,1
=ha
sjo
b)no
te:
Min
dica
tes
vari
able
ism
issi
ng;
()in
dica
tes
the
prop
orti
onof
the
sam
ple
for
whi
chth
ein
dica
tor
ism
issi
ngif
the
vari
able
isno
tco
mpl
etel
ym
issi
ng
Tab
le4.
1:A
vailab
ilit
yof
life
-cycl
ein
dic
ator
s,B
ES
1964
-200
5
86
SMETS, Kaat (2010), A Widening Generational Divide? Assessing the Age Gap in Voter Turnout Between Younger and Older Citizens European University Institute
DOI: 10.2870/15899

Chapter 4. Later maturation and turnout trends among young citizens
The variable ‘not in education’ is based on a question asking the respondent’s
age when leaving (full-time) education. In some instances, a separate category
was included for those still in education. For the earlier election years, however,
the question concerning the age at which the respondent left education referred to
primary or secondary education only. In these instances, a proxy was calculated
based on the age and educational level of the respondent. For all respondents
with a post-secondary educational level, three years were added to the age the
respondent left secondary education. Three is the minimum number of years it
takes to complete a bachelor degree in Great Britain and the measure, therefore,
is a fairly conservative estimate of the period a respondent was in post-secondary
education. If a respondent was younger than the computed school leaving age or
had an age equal to it, he or she was counted to still be in education.
It should be noted that no respondents were identified as being in education
anymore in both 1964 and 1966. The lack of respondents in education in these
election years is not as peculiar as may seem at first sight. In the 1964 and 1966
elections the minimum voting age in Great Britain was still 21 years. The fact that
there are, therefore, no respondents under the age of 21 included in the election
surveys in these two years is probably what accounts for the lack of respondents
in education.
Whether a respondent has children is a question that is only asked in the
earlier election years. In subsequent years, instead, the number of young people
in the household was enquired after. Usually, the threshold was put at the age of
18 years, but two instances the question referred to young people aged less than
16 (1987) or less than 15 (1983) years. When dealing with young respondents,
it is impossible to distinguish between siblings and own children with a question
87
SMETS, Kaat (2010), A Widening Generational Divide? Assessing the Age Gap in Voter Turnout Between Younger and Older Citizens European University Institute
DOI: 10.2870/15899

4.3. Comparing life-cycle’s
phrased like this. To avoid this mix-up, only children in the household of married,
cohabiting, divorced, widowed, or separated respondents where counted as being
the respondent’s own. No references to children are available for the February
1974 and 1983 elections.
A question asking after the respondent’s marital status was used to create a
dummy variable identifying those respondents that were either married or cohab-
iting with their partner. The dichotomous variable referring to home ownership,
was derived from a question asking the respondent whether their home was owned
or rented. A question on the respondent’s job status was used to identify the
respondents with a (full-time) job.
A measure of residential stability of respondents, lastly, is based on a question
asking the respondent after the number of years he or she lived in the neighborhood
or area. This question was, however, missing from the 1983 and 1992 questionnaire
and was only posed to two-thirds of the respondents in 2001.
4.3 Comparing life-cycle’s
In order to assess the later maturation hypothesis, the first thing that needs to be
established is whether it is indeed true that there are over-time changes in matu-
ration. There are various suggestions to this in the literature (see e.g. Pirie and
Worcester, 1998; Billari and Wilson, 2001; European Commission, 2001b; Billari
and Kohler, 2002; Furstenberg, Jr. et al., 2003; Kennedy, 2004; OECD, 2007), but
most research focuses on one or two life-cycle indicators at the time. Moreover,
there are relatively little comparative studies and even fewer that combine com-
pare trends between countries over a substantial period of time. In this section a
88
SMETS, Kaat (2010), A Widening Generational Divide? Assessing the Age Gap in Voter Turnout Between Younger and Older Citizens European University Institute
DOI: 10.2870/15899

Chapter 4. Later maturation and turnout trends among young citizens
broader overview of over-time changes in life-cycle events will be provided for the
British case at least.
The first and most simple way to get an indication of whether we are looking
in the right direction to explain the over-time turnout pattern of young people in
Britain is by assessing changes in participation patterns over the life span. For
this purpose turnout was plotted by age group for the time span for which data
is available (i.e. 1964-2005). Turnout was averaged per age-group for both the
period before and after 1990. This is the year after which turnout began to drop
drastically in Great Britain, especially so among younger voters.
Figure 4.2: Turnout by age group before and after 1990, BES 1964-2005
Figure 4.2 clearly shows that life span participation patterns have changed
over-time. Not only does turnout begin to climb from a much lower level after
1990, it also does so until a higher age than before. Although an interesting fact in
itself, the latter finding is not very relevant to the central question of this thesis.
The observation that there are clear over-time differences in the turnout levels
of young voters is an encouraging finding with regard to the hypothesis that is
89
SMETS, Kaat (2010), A Widening Generational Divide? Assessing the Age Gap in Voter Turnout Between Younger and Older Citizens European University Institute
DOI: 10.2870/15899

4.3. Comparing life-cycle’s
assessed in this chapter. Whether these differences in turnout may or may not be
caused by changes maturation patterns we can, however, not tell from figure 4.2.
Calculating period differences, we see that in the elections from 1992 up until
2005 the average turnout of young citizens (aged 35 years or less) was 53,9%.
During the elections from 1964 to 1987 this average was still 66,2%, meaning that
the change in average turnout of young voters before and after 1990 was 12,3
percentage points (t=32,71; p<.0001). We will return to this average difference
later on in this and the next chapter chapter.
A second and more direct way to investigate over-time changes in maturation
is to look at over-time changes in scores on life-cycle indicators. For this purpose
a maturation index was created based on the life-cycle indicators available in the
British Election Studies from 1964 to 2005.15 One point each could be scored for
having the following characteristics:
- Having left education
- Being married or cohabiting
- Having children
- Owning a home
- Having long residential stability (>3 years)16
- Having a job
15Different indexes were constructed. The choice for a six item index is prompted by theoret-ical arguments discussed above and empirical reasons: A maturation index consisting of the sixitems proposed yields a larger Cronbach’s α than both a five scale index that leaves out havingleft education, and four scale index leaving out having left education and working (.39 versus.30 and .21 respectively). Moreover, some of the variables not included in the four and five itemindexes do reach statistical significance in the models presented below. Models estimated withthe four and five item index are included in the appendix B for comparison (see tables B.16 andB.17).
16Since the variable measuring residential stability was categorical in 1964, 1966 and 1970 thecut-off was placed at 2 years in these election years.
90
SMETS, Kaat (2010), A Widening Generational Divide? Assessing the Age Gap in Voter Turnout Between Younger and Older Citizens European University Institute
DOI: 10.2870/15899
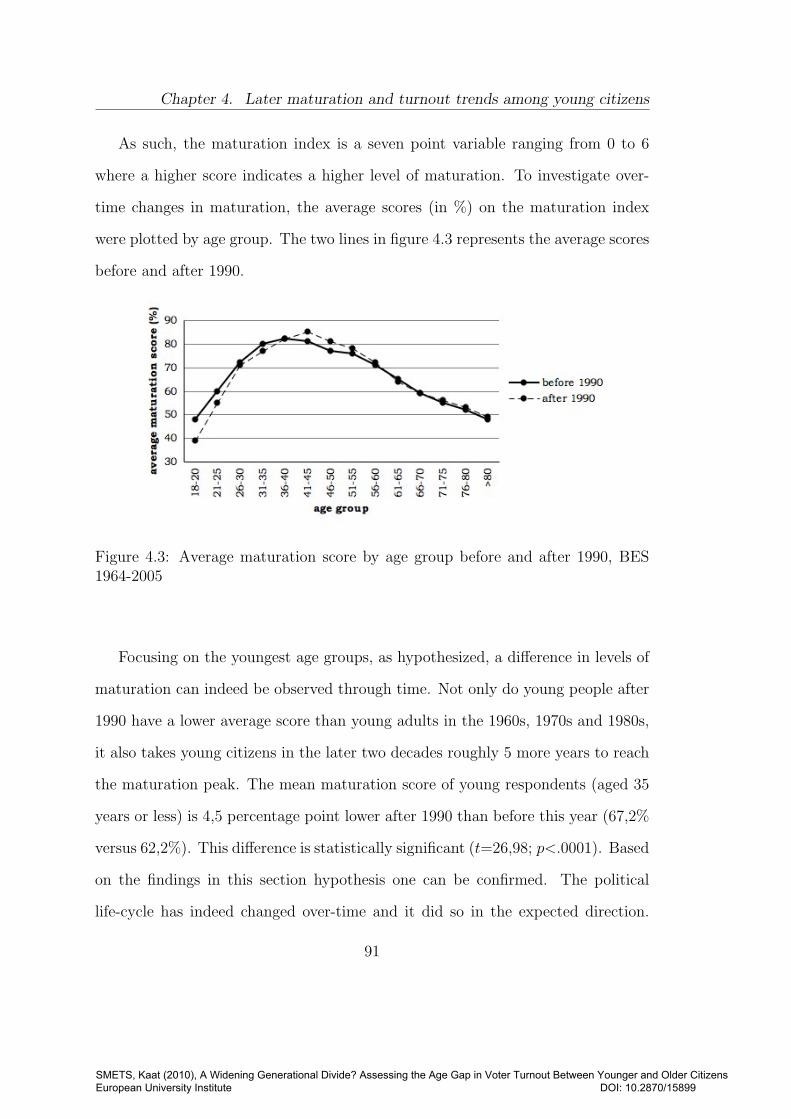
Chapter 4. Later maturation and turnout trends among young citizens
As such, the maturation index is a seven point variable ranging from 0 to 6
where a higher score indicates a higher level of maturation. To investigate over-
time changes in maturation, the average scores (in %) on the maturation index
were plotted by age group. The two lines in figure 4.3 represents the average scores
before and after 1990.
Figure 4.3: Average maturation score by age group before and after 1990, BES1964-2005
Focusing on the youngest age groups, as hypothesized, a difference in levels of
maturation can indeed be observed through time. Not only do young people after
1990 have a lower average score than young adults in the 1960s, 1970s and 1980s,
it also takes young citizens in the later two decades roughly 5 more years to reach
the maturation peak. The mean maturation score of young respondents (aged 35
years or less) is 4,5 percentage point lower after 1990 than before this year (67,2%
versus 62,2%). This difference is statistically significant (t=26,98; p<.0001). Based
on the findings in this section hypothesis one can be confirmed. The political
life-cycle has indeed changed over-time and it did so in the expected direction.
91
SMETS, Kaat (2010), A Widening Generational Divide? Assessing the Age Gap in Voter Turnout Between Younger and Older Citizens European University Institute
DOI: 10.2870/15899

4.4. Turnout by life-cycle indicators
Overall, young adults nowadays mature at a different pace than their parents and
grandparents when they were young. Societal trends that have long been regarded
conventional wisdom are hereby assessed in conjunction and confirmed. Young
people, nowadays, have lower starting levels of maturation and it also takes them
more time to reach the maturation peak.
Although the observations in this section are no proof that later maturation
leads to declining turnout patterns among young voters, the findings in figure 4.3
are encouraging. We can see a clear difference in maturation levels before and
after 1990, just as we find a clear shift in turnout patterns among young voters
from this point onwards (see figure 3.1 for Britain in chapter three). The next step
is to identify in how far changes in the life-cycle indicators can explain over-time
turnout trends among younger voters in Britain
4.4 Turnout by life-cycle indicators
Although national election surveys are designed to include a representative sample
of the electorate as a whole, subsequent analyses will be performed on a young
subset of the electorate only.17 There are several reasons for doing so. Firstly,
recent trends in the age gap are mostly caused by changes in the turnout pattern
of young voters. Hence, it makes sense to try to understand what makes the
participation patterns of today’s young adults different from young adults of the
past.
Secondly, the later maturation hypothesis central to this chapter applies to
young voters only. Although the hypothesis assumes that certain life-cycle events
17Models based on a representative sample of the whole electorate, are estimated for the sakeof comparison in the framework of the next chapter (see appendix C).
92
SMETS, Kaat (2010), A Widening Generational Divide? Assessing the Age Gap in Voter Turnout Between Younger and Older Citizens European University Institute
DOI: 10.2870/15899

Chapter 4. Later maturation and turnout trends among young citizens
are experienced at a later average age, which may suggest increasing the upper age
bound, the more important assumption is that the proportion of young citizens
that has matured by a certain age will have dropped through time because of life-
cycle delays. We found evidence for this in the previous section. What needs to
be assessed at this point is whether the drop in the proportion of ‘mature’ young
adults can explain (part of) the turnout decline for this age group. This, at least,
is what we would expect based on the life-cycle theory.
Focusing on young people alone, thirdly, eliminates some problems regarding
the age variable. Previously it was established that it was not only the first stage
of the life-cycle that has changed: a larger proportion of senior citizens was found
to be active after 1990 than in the years before. This interesting observation is,
however, not related to either the research puzzle or the later maturation hypoth-
esis. It is therefore is better to avoid the risk of finding mixed effects and focus on
young adults only.
Below, several analyses will be presented. Individual level turnout is the de-
pendent variable in all models. Since this variable has a dichotomous nature, and
therefore violates assumptions of OLS regression, logit analyses will be applied (see
Long, 1997; Powers and Xie, 2000; Long and Freese, 2006). Because it is reasonable
to expect that the standard errors for given election years are related to one an-
other, robust standard errors clustered by election are specified. By clustering the
standard errors not only the assumption of identically distributed standard errors
is relaxed (as is the case when estimating ‘ordinary’ Huber-White robust stan-
dard errors), but also the assumption of independence of the observations (Gould,
Pitblado and Sribney, 2006, p. 12-13; Stata Corporation, 2007b, p. 268-276). To
put it simply, clustered standard errors allow for a degree of dependence between
93
SMETS, Kaat (2010), A Widening Generational Divide? Assessing the Age Gap in Voter Turnout Between Younger and Older Citizens European University Institute
DOI: 10.2870/15899

4.4. Turnout by life-cycle indicators
the standard errors: a violation of assumptions that is very likely to occur when
pooled individual level cross-sectional data is used.
The analyses presented below consist of three steps. In the first step, a model
will be estimated with the young subset of the electorate (those aged 35 years or
less) including age and a period dummy that identifies the elections taken place
after 1990 as the independent variables. This is the time point from which turnout
among young adults started to decline rapidly.
In the next step the maturation index is added to the model. The relationship
between the index variable and turnout is expected to be positive: the higher the
level of maturation, the higher the likelihood that a respondent will turn out to
vote. In the third step the maturation index will be replaced with the separate
life-cycle indicators. This is done because we cannot assume all indicators to
influence turnout equally. By estimating a model with the individual life-cycle
indicators the differences between the indicators become apparent. Each of the
individual life-cycle indicators on which the maturation index is based is expected
to be positively related to turnout.
The focus of this chapter is on two trends simultaneously. Our first interest is to
explain youth turnout trends through time. The second goal is to explain turnout
differences between younger and older voters. To serve this second purpose, both
model two and three will be estimated twice: once as described above and once
adding a variable that measures the average turnout of older voters (aged more
than 35 years). This variable, thus, is a constant within a certain election year.
Through the inclusion of the average turnout of older voters, we can take account
of the difference between younger and older voters (see Fieldhouse, Tranmer and
Russell (2007) for an example of this technique). If significant, this variable shows
94
SMETS, Kaat (2010), A Widening Generational Divide? Assessing the Age Gap in Voter Turnout Between Younger and Older Citizens European University Institute
DOI: 10.2870/15899

Chapter 4. Later maturation and turnout trends among young citizens
us that young citizen’s turnout is partly a function of processes that are going on
in the electorate at large. In other words, the turnout levels of young voters in
this case largely follow the turnout pattern of older voters. Including the average
turnout of older voters, moreover, makes it possible to establish whether life-cycle
changes influence turnout among young voters regardless of other factors that
influence turnout levels. The variable is expected to be highly significant as the
previous chapter showed that turnout levels of different generations often move in
conjunction, especially so in Great Britain.
Both the coefficient for the age variable and the coefficient for the period
dummy should become smaller once the life-cycle indicators are included in the
model. The life-cycle model predicts that turnout increases with age, due to cer-
tain events taking place during the life span of most of these citizens. Controlling
for such events should therefore reduce the impact of the variable age itself. A sim-
ilar logic applies for the period dummy. If part of the difference in young adult’s
turnout levels before and after 1990 is to be explained by later maturation or life-
cycle delays, adding life-cycle indicators to the model should reduce the magnitude
of the period effect. In a perfectly specified model, the coefficients for both age
and the period dummy should even be explained away. This, however, is not likely
to happen as we will not estimate a fully specified model of voter turnout in this
chapter.
There are no theoretical reasons to expect an increased influence of life-cycle
events on youth turnout through time. Moreover, expectations regarding the im-
pact of life-cycle events on the period dummy should not be exaggerated for three
reasons. First, we are dealing with simple socio-economic background indicators.
Second, the trend towards later maturation has been a gradual process and not
95
SMETS, Kaat (2010), A Widening Generational Divide? Assessing the Age Gap in Voter Turnout Between Younger and Older Citizens European University Institute
DOI: 10.2870/15899

4.4. Turnout by life-cycle indicators
something that can be specifically linked to the period before and after 1990.
Lastly, as identified in chapter two, there are many other theoretical explanations
for youth turnout decline.
As mentioned before, analyses will be performed on a subset of the electorate
aged 35 years or less. The choice for this specific age cut-off is based on the
following considerations: When plotting average scores on the maturation index
in figure 4.3, one can establish that the average score of those aged 31 to 35 is
about 7 percentage points higher than the average score for people in the 26 to 30
category. Drawing the line at the age of 30 is, thus, perhaps too early. Although
maturation does not reach its peak until the age of 41 to 45, a cut-off above the
age of 35 would probably start to get too much out of line with earlier research.
Moreover, it might endanger the conception of being ‘young’ – although this is
obviously a subjective matter.
As shown in figure 4.1 not all indicators of interest are available in all election
years. Because this missing variable problem affects the robustness of the results,
the choice was made to impute the missing data through a multiple imputation
method. Doing so yields a constant N over all models, which increases compara-
bility. Appendix B describes the considerations and the details of the imputation
process. Moreover, the appendix shows the results of the models in this chapter
as estimated before missing data was imputed. Lastly, in order facilitate compa-
rability between the different models once more all variables were standardized to
vary between 0 and 1.
Table 4.2 shows the results of logistic regression analyses. Model 1 is the
base model from which we can detect the impact of life-cycle changes on young
adults’ voter turnout. It shows no particularities. The age variable is positive and
96
SMETS, Kaat (2010), A Widening Generational Divide? Assessing the Age Gap in Voter Turnout Between Younger and Older Citizens European University Institute
DOI: 10.2870/15899

model 1 model 2a model 2b model 3a model 3bb/(se) b/(se) b/(se) b/(se) b/(se)
Age 0.786*** 0.380*** 0.410*** 0.586*** 0.655***(0.113) (0.120) (0.104) (0.125) (0.105)
Post 1990 -0.539** -0.473* -0.117 -0.551** -0.182(0.254) (0.253) (0.135) (0.260) (0.130)
Maturation index 1.083*** 1.000***(0.250) (0.233)
Not in education -0.250*** -0.300***(0.084) (0.089)
Married 0.156* 0.164*(0.083) (0.090)
Children 0.032 -0.046(0.076) (0.071)
Home ownership 0.557*** 0.558***(0.098) (0.093)
Residential stability 0.042 0.033(0.156) (0.160)
Works 0.123** 0.109*(0.058) (0.061)
Average turnout >35 7.781*** 8.212***(1.397) (1.420)
Constant 0.276*** -0.233 -6.372*** 0.102 -6.366***(0.069) (0.143) (1.180) (0.134) (1.194)
Log-likelihood -6362.74 -6313.45 -6229.97 -6261.48 -6170.66Pseudo R2 0.021 0.029 0.042 0.037 0.050N 9762 9762 9762 9762 9762note: b coefficients from logit analyses with robust s.e.’s clustered by electionin parentheses; * p<0.10, ** p<0.05, *** p<0.01
Table 4.2: Turnout by life-cycle indicators for young voters aged 35 years or less,BES 1964-2005
97
SMETS, Kaat (2010), A Widening Generational Divide? Assessing the Age Gap in Voter Turnout Between Younger and Older Citizens European University Institute
DOI: 10.2870/15899

4.4. Turnout by life-cycle indicators
significant, the period dummy negative and significant. Adding the maturation
index to the model, we find that this indicator has a positive and significant effect
on individual level voter turnout. This is in line with the life-cycle hypothesis.
Using the separate life-cycle indicators instead of the maturation index in model
3a, we can identify variation in the impact of the different indicators. Home own-
ership is accountable for the largest share of the impact of the maturation index,
followed by having left education, being married or cohabiting, and work. Contra-
dictory to the theoretical expectations of the life-cycle model, leaving education
has a negative effect on young people’s turnout. According to the life-cycle argu-
ment, being in education is one of the start-up problems characteristic of the early
stages of life. Leaving education should, therefore, boost turnout. Instead, the
analyses in table 4.2 indicate the existence a negative and significant relationship
between being not being in education and individual level turnout. Although con-
tradictory to the life-cycle hypothesis, these results are in line with the research
of Wolfinger and Rosenstone 1980; Highton and Wolfinger 2001 and Tenn 2007,
who find a positive relationship between being in education and turnout. People
that are still in school find themselves in a much more stimulating environment
than their non school-going peers, hence the negative relationship between leaving
education and turnout.
Working and being married or cohabiting were also found to have the expected
positive effect on turnout. The magnitude of the coefficients is smallest for having
a job, which is also only weakly significant. Two life-cycle indicators that do not
reach statistical significance are having children and residential stability. That
the latter variable shows up not being significant is not entirely surprising as we
already established above that residential stability is more likely to play a role in
98
SMETS, Kaat (2010), A Widening Generational Divide? Assessing the Age Gap in Voter Turnout Between Younger and Older Citizens European University Institute
DOI: 10.2870/15899

Chapter 4. Later maturation and turnout trends among young citizens
countries where voter registration is in the hands of the citizens. This is not the
case in Great Britain.
Adding average turnout of older voters in models 2b and 3b does not change
much for the variables described above. No directions change and all variables –
except for work – remain statistically significant. This is encouraging news for the
later maturation hypothesis. The coefficient for average turnout of older voters is,
however, significant in both models. This means that, apart from being guided by
maturation, turnout among young voters is also a function of trends in the elec-
torate at large. This finding is not surprising. In the previous chapter we already
established that younger and older voter’s turnout levels often moved in similar
directions, especially so in Great Britain. Since all variables were standardized to
vary between 0 and 1 the magnitudes of the coefficients can be compared. Both
model 2b and 3b show that the average turnout of older voters explains the largest
share of the turnout among young voters. In the next chapter we will dig deeper
and take a look at what factors may explain youth turnout patterns in addition
to the indicators modelled here.
As hypothesized the magnitude of the age variable drops with the inclusion of
a variable or variables that measure life-cycle events that are otherwise captured
by the age variable itself.18 The difference in magnitude between models 1 and 3
is smaller than the difference in magnitude between models 1 and 2. It thus seems
that it is rather the interplay between different life-cycle events that accounts for
the age effect than that each single life-cycle event is of significant importance. The
18Table B.18 shows what happens when birth cohorts instead of an age variable are modelled.We see that with every birth cohort after those born in the 1950s turnout decreases. Maturationexplains part of the turnout levels of the 1960s, the 1970s, and the 1980s birth cohort (see model2a).
99
SMETS, Kaat (2010), A Widening Generational Divide? Assessing the Age Gap in Voter Turnout Between Younger and Older Citizens European University Institute
DOI: 10.2870/15899

4.4. Turnout by life-cycle indicators
age variable remains statistically significant at the p<.01 level in all instances,
meaning that there remain some age effects among young voters that are not
captured by the life-cycle events modelled. As mentioned above, it was however
not expected that this variable would become insignificant as we neither include
all possible life-cycle indicators nor estimate a fully specified model of youth voter
turnout beyond the life-cycle explanation.
The period dummy, lastly, drops marginally in magnitude after the inclusion of
the maturation index in model 2a and increases slightly after the inclusion of the
separate life-cycle events in model 3a. In the models including the average turnout
of older voters, the period dummy is explained away entirely.19 This means that
maturation does not explain a substantial part of the pre/post 1990 difference in
turnout among younger voters, but that other trends not captured in the model
do. We will return to the predictive power of the maturation index later in this
and the next chapter.
The findings from this chapter do not necessarily contradict the later matura-
tion hypothesis. On the contrary, maturation has a positive and significant effect
on turnout and we know that average levels of maturation have gone down through
time. This allows us to conclude that later maturation plays a part in the turnout
decline among younger voters in recent decades.20 The pre/post 1990 difference,
however, is mostly explained by events affecting the electorate at large, as can be
read from the highly significant coefficient for the average turnout of older voters.
19When using dummy’s for each decade instead of a pre/post 1990 variable, we see that thematuration index seems to do a somewhat better job at explaining turnout levels in the 2000s(see model 2a in table B.19).
20Models not presented in this chapter show that the influence of maturation on youth turnoutis constant through time. An interaction effect between the maturation index and the perioddummy does not reach statistical significance (see table B.20 in appendix B).
100
SMETS, Kaat (2010), A Widening Generational Divide? Assessing the Age Gap in Voter Turnout Between Younger and Older Citizens European University Institute
DOI: 10.2870/15899

Chapter 4. Later maturation and turnout trends among young citizens
The pseudo R2 (McFadden) for the different models is low indeed, with only 2
to 5% of the variation in the models explained. Since the models presented are far
from fully specified, such a low fit between the observed data and the estimated
regression line can be expected. Better specification is something that will be
worked in the next chapter. Also, the type of variables modelled here are known
to have an indirect effect on turnout only and this may also partially explain
the low amount of variance explained. The R2-statistics should, however, not be
interpreted as a measure of the (weak) influence of maturation on turnout (King,
1986).
Since coefficients of logit analyses are difficult to interpret, predicted probabil-
ities were calculated to get a clearer idea of the fit of the models. A first way to
assess the impact of later maturation on turnout is to see how much higher turnout
would have been had the average maturation score of young adults not gone down
after 1990. Calculating these differences, earlier we saw that the average matura-
tion score of young citizens went down from .670 before 1990 to .622 after 1990.
If the average maturation score had stayed at .67, turnout after 1990 would have
been 1,3 percentage point higher based on model 2a (Pr(y=1) of .556 versus .543).
This means that 1,3 percent of the 12,3 percentage point turnout difference among
young voters before and after 1990 can be explained by later maturation. This is
roughly 10% of the pre/post 1990 turnout gap.
Also interesting is to see what levels of turnout the models presented in this
chapter predict for people with different levels of maturation. Figure 4.4 displays
the expected positive relationship between maturation and turnout based on model
2a. Predicted turnout levels after 1990 are lower than those before 1990 for all
levels of maturation. While the gap in turnout among young voters before and
101
SMETS, Kaat (2010), A Widening Generational Divide? Assessing the Age Gap in Voter Turnout Between Younger and Older Citizens European University Institute
DOI: 10.2870/15899

4.4. Turnout by life-cycle indicators
after 1990 was 12,3%, model 2a predicts an average turnout difference of 11,2%.
Based on this we can conclude that model 2a predicts approximately 9% of the
turnout gap before and after 1990. This is along the lines of what we found above.
Figure 4.4: Predicted probability of turnout based on model 2a, BES 1964-2005
All in all, the findings in this chapter point towards the confirmation of hypoth-
esis two. Changes in maturation can indeed explain part of the turnout decline
among young voters. The explanatory power of later maturation may not be ex-
ceptionally large, but this was also expected based on theoretical assumptions.
Later maturation, here based on six relatively simple socio-demographic indica-
tors, is found to explain 9 to 10% of the turnout difference among young voters
before and after 1990 in Great Britain.
102
SMETS, Kaat (2010), A Widening Generational Divide? Assessing the Age Gap in Voter Turnout Between Younger and Older Citizens European University Institute
DOI: 10.2870/15899

Chapter 4. Later maturation and turnout trends among young citizens
4.5 Conclusion and discussion
According to the life-cycle theory, turnout increases as citizens age and experience
certain life-cycle events. Findings in the sociological literature as well as circum-
stantial evidence suggest that over the past decades many life-cycle events have
moved to a higher average age. The aim of this chapter has been to assess the
impact of such later maturation on turnout levels of young adults. With this a
previously overlooked explanation of turnout decline among young voters was put
to the test.
Using data from the British Election Studies, an index of maturation charac-
teristics was created. Average scores of young people on this maturation index
were found to decline over-time, indicating evidence of later maturation. Matu-
ration itself – as expected based on the life-cycle explanation to age differences
in voter turnout – was found to be positively related to turnout. Combining the
two facts, we can conclude that later maturation has a negative impact on the
turnout levels of young citizens. Fewer young people nowadays have gone through
life-cycle events that are of importance for turnout. This has a negative effect on
the turnout levels of this age group.
That maturation is a significant indicator of turnout, does not automatically
imply that later maturation explains a substantial part of youth turnout decline.
Nonetheless, around 9-10% of the turnout difference before and after 1990 in
Britain was found to be explained through later maturation. Turnout levels among
older voters, indeed, play a more important role for turnout among young adults
than maturation does. It remains to be seen if the differences between younger
and older voters can be better explained through alternative factors such as other
103
SMETS, Kaat (2010), A Widening Generational Divide? Assessing the Age Gap in Voter Turnout Between Younger and Older Citizens European University Institute
DOI: 10.2870/15899
4.5. Conclusion and discussion
resource and mobilization factors, attitudinal variables, and characteristics of elec-
tions. One of the aims of the next chapter is to see whether we can better pin
point what makes younger voters different from older voters in a better specified
model of youth voter turnout.
Not all life-cycle indicators assessed in this chapter were found to have an equal
impact on youth turnout in elections. Home ownership and having left education
were found to be the most important indicators. The latter variable, however,
had an unexpected impact on turnout among young adults. While the life-cycle
model predicts that being in education leads to lower turnout levels, it was actually
leaving school that was found to have a negative effect on turnout. This finding is
in line with previous research that finds there to be a positive relationship between
going to school and turnout in elections as students are argued to be more easily
mobilized to participate in politics that their non-school going peers. Having a job
and being married were also found to have a significant effect on turnout. In all
models estimated the maturation index, however, outperformed the separate life-
cycle indicators. This testifies to the importance of the interplay between different
life-cycle events.
Naturally, the results from this chapter apply to Great Britain only. The life-
cycle model is, however, regarded as quasi universal and age patterns in political
participation tend to be largely the same in Western democracies. In this sense the
findings in this chapter could be regarded as illustrative of processes that are taking
place in other countries as well. That said, we do not know too much about the
between-country differences in the way in which citizens mature. At the individual
level comparisons between countries are, however, hard to accomplish due to a lack
104
SMETS, Kaat (2010), A Widening Generational Divide? Assessing the Age Gap in Voter Turnout Between Younger and Older Citizens European University Institute
DOI: 10.2870/15899

Chapter 5. Later maturation versus alternative explanations
of indicators. Later on in this thesis, however, we will put the later maturation to
the test in a country-comparative setting as we move to the aggregate level.
Although the percentage of variance explained by the models was found to be
rather small, analyses show that life-cycle delays can indeed account for part of
the decline in turnout among young adults in Britain over the last decades. The
life-cycle model – with these findings in mind – is behaving exactly as expected.
Previous research, therefore, seems to have failed to link certain logical conse-
quences of societal trends to turnout decline among young voters. The next step
is to see whether the later maturation hypothesis still holds after adding alternative
explanations for declining youth voter turnout to the analyses.
105
SMETS, Kaat (2010), A Widening Generational Divide? Assessing the Age Gap in Voter Turnout Between Younger and Older Citizens European University Institute
DOI: 10.2870/15899

4.5. Conclusion and discussion
106
SMETS, Kaat (2010), A Widening Generational Divide? Assessing the Age Gap in Voter Turnout Between Younger and Older Citizens European University Institute
DOI: 10.2870/15899

Chapter 5
Later maturation versusalternative explanations of youthturnout decline
This thesis aims to contribute to the literature on youth voter turnout in several
ways. The main innovation of this research is the formulation and assessment
of a new hypothesis to explain over-time changes in youth turnout levels. This
later maturation hypothesis was described and has been put to the test in the
previous chapter. It was demonstrated that the consequences of later maturation
can indeed account for part of the turnout decline among young voters in Great
Britain. This turnout decline among young adults, in its turn, is the motor behind
the widening age gap between younger and older voters.
The later maturation hypothesis is, however, certainly not the only theoretical
explanation to turnout change among young people through time (see figure 2.2).
The goal of the current chapter is to assess the extent to which these alternative
theories play a role in the turnout decline among young adults in Great Britain.
In addition, this chapter explores if and to what extent later maturation is still
accountable for youth turnout decline after taking into account these alternative
107
SMETS, Kaat (2010), A Widening Generational Divide? Assessing the Age Gap in Voter Turnout Between Younger and Older Citizens European University Institute
DOI: 10.2870/15899

explanations. Although some overlap between later maturation and other expla-
nations of declining youth voter turnout is expected to exist, there is no reason
why the later maturation hypothesis and others should be mutually exclusive.
Following the previous chapter, hypotheses will be assessed with individual
level repeated cross-sectional election surveys from Great Britain. This country
witnessed a widening of the age gap. Although a function of turnout among both
younger and older voters, movements of the age gap are mostly set in motion by
changing turnout levels among young voters. The British Election Studies used for
this chapter include both life-cycle variables and the relevant alternative indicators
(see appendix A for an overview of the studies used as well as their origin). This
allows for the best possible comparison of the various explanations of youth turnout
decline.
Three groups of indicators are central in this chapter: resource and mobiliza-
tion variables, campaign-related variables, and electoral competitiveness variables.
Each of these groups of indicators will be modelled against the life-cycle indicators
from the previous chapter in order to test the robustness of the later maturation
hypothesis under more demanding circumstances.
Because a larger number of variables is used and more hypotheses need to
be described, the set up of this chapter is slightly different from the previous one.
After a brief recap of the theoretical framework discussed in chapter two, the three
groups of variables identified above will be discussed one at the time in different
sections. In each section relevant working hypotheses are identified and data will
be described. Accordingly, the cluster of indicators central in the section will
be modeled against indicators of later maturation as used and described in the
108
SMETS, Kaat (2010), A Widening Generational Divide? Assessing the Age Gap in Voter Turnout Between Younger and Older Citizens European University Institute
DOI: 10.2870/15899

Chapter 5. Later maturation versus alternative explanations
previous chapter. The chapter ends with the empirical assessment of a full model
of voter turnout in which variables from all three clusters are brought together.
The findings of this chapter show that – as expected based on the literature –
other factors than maturation indeed play a role in youth voter turnout. Political
interest and strength of party identification play an important role in turnout
among young adults, just as turnout in previous elections and perceived differences
between parties do. Perhaps somewhat surprisingly attendance of religious services
is also found to play a large role in the turnout decline among young Brits.
Notwithstanding the the importance of these factors for turnout, maturation
is among the most important indicators of turnout even in a fully specified model
of voter turnout. This finding, thus, confirms the results of the analyses in of the
previous chapter that life-cycle delays play a role in the over-time decline in turnout
among young voters in Britain. Even in better specified circumstances, however,
average turnout among older voters remains by far the strongest explanatory factor
of youth turnout. This indicates that young people’s decision to turn out to vote
or abstain is very sensitive to turnout trends in the electorate at large.
5.1 Turnout decline among young voters: a brief
recap of theoretical explanations
In chapter two theoretical explanations for turnout decline among young voters
were reviewed. The first and foremost observation was that experts and public
opinion alike blame youth turnout decline on the alienation, disengagement, disin-
terest, apathy, cynicism, and scepticism of young citizens from and towards elec-
toral politics and its actors. The question remains, however: What is it that causes
contemporary young adults to feel so detached from electoral politics?Several hy-
109
SMETS, Kaat (2010), A Widening Generational Divide? Assessing the Age Gap in Voter Turnout Between Younger and Older Citizens European University Institute
DOI: 10.2870/15899

5.1 Turnout decline among young voters: a brief recap of theory
potheses have been put forward and the aim of this section is to identify those
hypotheses that can be assessed with data from the British Election Studies that
will be used in this chapter.
Wattenberg (2008) links the disinterest and knowledge gap of young adults to
changes in the media landscape. Commercialization of the media has had conse-
quences for both the content and form of all items broadcasted. This, in its turn,
has lead to a different socialization experience of contemporary young adults and
can subsequently explain the growing disinterest and lack of knowledge among
young people in (electoral) politics. At the individual level this hypothesis can
be assessed through indicators on the use of media for the collection of political
information. Unfortunately, the British Election Studies do not include such indi-
cators in an over-time comparable fashion. Tests of the influence of the media on
turnout decline among young citizens will therefore have to be left to the future
when more appropriate data is available.
At the societal level, decreasing party loyalties and declining social capital are
mentioned as two factors that can account for youth turnout decline. Inglehart
(1997) argues that social and economic prosperity have lead to a shift of priorities.
Political parties are still polarized along cleavages that were present at the time
these parties were established. Young citizens, however, have moved on and are
interested in different issues. This leads them to have difficulties identifying with
electoral politics and its actors. Questions regarding strength of party identifica-
tion can be used to grasp how youth turnout levels may have changed through
time because of changes in party attachment.
Putnam (2000), on the other hand, links declining youth voter turnout to the
decline of associational life. With this decline in social capital, political partic-
110
SMETS, Kaat (2010), A Widening Generational Divide? Assessing the Age Gap in Voter Turnout Between Younger and Older Citizens European University Institute
DOI: 10.2870/15899

Chapter 5. Later maturation versus alternative explanations
ipation is deprived of one of its most important mobilizing factors. The British
Election Studies generally do not include many questions on associational life of
respondents, which makes it difficult to assess this hypothesis at the individual
level in this chapter. Church attendance and union membership are the only two
association-related indicators included on a regular basis in the British Election
Studies. They will be included in later analyses.
Demographic changes in Western Europe are also mentioned as influencing
youth participation levels. Due to the obsolescence of Western societies, the po-
litical weight of older voters has increased over time. Their larger number makes
older citizens more visible to political actors and institutions, which, in its turn,
puts an emphasis on the issues that older cohorts find important (Schmitter and
Trechsel, 2004; Kohli and Kunemund, 2005; Topf, 1995b). Young people and the
issues they are interested in, thus, appear to be increasingly overlooked by political
actors. In order to assess this hypothesis, we would need information on the ex-
tent to which parties focus on different sub groups of their electorate. This type of
information naturally not available in the British Election Studies as these studies
are designed with a focus on voters and abstainers. It would, however, make an
interesting research project in itself and should be considered as a possible future
undertaking.
111
SMETS, Kaat (2010), A Widening Generational Divide? Assessing the Age Gap in Voter Turnout Between Younger and Older Citizens European University Institute
DOI: 10.2870/15899

feb
oct
1964
1966
1970
1974
1974
1979
1983
1987
1992
1997
2001
2005
Res
ourc
ean
dm
obiliz
atio
nva
riab
les:
Gen
der
(0,
1=
mal
e)E
duca
tion
alle
vel
*(0
=lo
w,
0,5
=m
iddl
e,1
=hi
gh)
Inco
me
(0=
low
,0,
5=
mid
dle,
1=
high
)So
cial
clas
sM
(1/2
)(0
=no
tm
iddl
ecl
ass,
1=
mid
dle
clas
s)R
elig
ion
M(0
=no
tre
ligio
us,
1=
relig
ious
)C
hurc
hat
tend
ance
MM
MM
(0=
neve
r,1
=se
vera
lti
mes
aw
eek)
Uni
onm
embe
rshi
pM
(0,
1=
mem
ber)
note
:co
ntin
ued
onne
xtpa
ge
112
SMETS, Kaat (2010), A Widening Generational Divide? Assessing the Age Gap in Voter Turnout Between Younger and Older Citizens European University Institute
DOI: 10.2870/15899

feb
oct
1964
1966
1970
1974
1974
1979
1983
1987
1992
1997
2001
2005
Cam
pai
gn-r
elat
edva
riab
les:
Ret
rosp
ecti
veec
osi
t(s
elf)
M(0
=w
orse
offno
w,
0,5
=sa
me,
1=
bett
eroff
now
)P
rosp
ecti
veec
osi
t(s
elf)
MM
(0=
wor
seoff
futu
re,
0,5
=sa
me,
1=
bett
eroff
futu
re)
Pol
itic
alin
tere
stM
MM
(0=
not
inte
rest
ed,
1=
very
muc
hm
uch
inte
rest
ed)
Stre
ngth
part
yi.d
.(0
=no
pid,
1=
very
stro
ngpi
d)P
erce
ived
part
ydi
ffere
nce
M(2
/3)
(0=
agr
eat
deal
,1
=no
tm
uch)
Vot
edin
last
elec
tion
?(t−
1)M
(1/6
)(0
=di
dno
tvo
te,
1=
vote
d)Y
oung
init
iati
on(0
=1s
tvo
teat>
21ye
ars,
1=
1st
vote
at>
18ye
ars
)C
omp
etit
iven
ess
vari
able
s:M
argi
nof
vict
ory
(con
st.
leve
l)(0
=1
-1
=75
%)
Mar
gin
ofvi
ctor
y(c
ount
ryle
vel)
(0=
1-
1=
15%
)M
ajor
ity
stat
us(c
ount
ryle
vel)
(0=
2-
1=
15%
)no
te:
cont
inue
dfr
omla
stpa
ge;
Min
dica
tes
vari
able
ism
issi
ng;
()in
dica
tes
the
prop
orti
onof
the
sam
ple
for
whi
chth
ein
dica
tor
ism
issi
ngif
the
vari
able
isno
tco
mpl
etel
ym
issi
ng;
*in
dica
tes
vari
able
isno
tav
aila
ble
for
all
resp
onde
nts
Tab
le5.
1:A
vailab
ilit
yof
alte
rnat
ive
indic
ator
s,B
ES
1964
-200
5
113
SMETS, Kaat (2010), A Widening Generational Divide? Assessing the Age Gap in Voter Turnout Between Younger and Older Citizens European University Institute
DOI: 10.2870/15899

5.1. Turnout decline among young voters: a brief recap of theoreticalexplanations
Lastly, the ‘withdrawal of the state’ hypothesis stipulates that young peo-
ple’s declining turnout levels can be explained due to nations states increasingly
loosing power to political institution at different levels (i.e. to regional govern-
ments and/or the European Union). Although this trend affects the motivation
of all voters, especially young people who have not yet established the habit to
vote are vulnerable to abstention because of this trend (Gauthier, 2003; Pirie and
Worcester, 1998; O’Toole, 2004; Henn, Weinstein and Wring, 2002). Although this
hypothesis is difficult to test at the individual level in a single country, the lesson
to learn is that over-time changes in the political institutional environment also
need to be taken into account.
Table 5.1 provides an overview of the availability of indicators central in this
chapter in the twelve British Election Studies carried out between 1964 and 2005.
In the following sections these variables will be discussed in groups as we focus
on clusters of resource and mobilization variables, campaign-related factors and
measures of political competitiveness. Since assessment of hypotheses depends on
the availability and measurement of data, precise working hypotheses will not be
formulated until later in the different sections.
As in the previous chapter, all models estimated are adjusted for sampling er-
rors and over-reporting of turnout. Moreover, all variables have been standardized
to range between 0 and 1 in order to increase comparability and missing values
were dealt with through a multiple imputation method (see both the previous
chapter and appendix B for more information). Appendix C includes the models
of this chapters as estimated before the missing data was imputed.
114
SMETS, Kaat (2010), A Widening Generational Divide? Assessing the Age Gap in Voter Turnout Between Younger and Older Citizens European University Institute
DOI: 10.2870/15899

Chapter 5. Later maturation versus alternative explanations
5.2 Later maturation versus (other) resource and
mobilization factors
Starting with resource and mobilization factors, gender, educational level, income,
social class, religion, church attendance, and union membership are considered.
These indicators are present in practically all individual level analyses of voter
turnout. To understand their influence on electoral participation, we have to go
back to the resource model of political participation originally developed by Verba
and Nie (1972). The basic idea behind this model is that political participation
is an act dominated by resources, particularly time, money and skills. Money, of
course, being of lesser importance with regard to the act of voting than with regard
to, for example, buying or boycotting products for political reasons or making a
campaign donation. Simply put, those with high levels of education, a high income,
and a high social status etc. are more likely to have a wider range of resources
and are, thus, more likely to turn out to vote (Brady, Verba and Schlozman, 1995,
p. 273).
The resource model of political participation in later years has been joined by
the mobilization model that centres around the idea that citizens are mobilized
to participate in politics by parties, candidates, interest groups and new social
movements (Rosenstone and Hansen, 1993). Politicians and parties (e.g.) mobilize
citizens because it is in their best interest to encourage people to turn out to vote.
Mobilization usually takes place through social networks and is mainly focused on
reducing the costs of political participation by providing cues to process political
information, arranging transportation to the polling booth, etc.
115
SMETS, Kaat (2010), A Widening Generational Divide? Assessing the Age Gap in Voter Turnout Between Younger and Older Citizens European University Institute
DOI: 10.2870/15899

5.2. Later maturation versus (other) resource and mobilization factors
It is only a small step from the mobilization model to the sociological model (see
Stolle and Hooghe, 2004; Hooghe, 2004; Stolle, Hooghe and Micheletti, 2005; and
Putnam, 2000). This model assumes that people participate in politics because
their family, friends, etc. mobilize them to do so. Associational life, therefore, is a
crucial element to turnout according to the sociological model. In the end it is a
sense of duty that explains why people comply with the pressure of their peers to
participate in politics. People vote because they think it is their moral obligation
to do so.
In this section, the following resource variables are considered: gender, educa-
tional level, income and social class. Because of their different role in society (e.g.
being the breadwinner, having the right to vote) men have long been considered
to have more resources and are, therefore, known to turn out more than women.
Recent research suggests that the gender gap in turnout has gradually disappeared
through the demographical replacement of the electorate as with every new elec-
toral cohort entering the electorate, the gender gap has become smaller (see e.g.
Inglehart and Norris, 2003; Childs, 2004). Especially among young people – the
sub-group of the electorate of interest in this chapter – we would thus expect to
find gender differences in turnout not to exist.
Educational level was reduced to a three scale variable identifying respondents
with a low (primary school only), middle (secondary education) and high (post-
secondary) educational level. For the year 2001 the difference between secondary
and post-secondary educational level could only be made for respondents included
in the top-up sample (roughly 700 out of 3000 respondents). Given the high
number of respondents overall, this is not expected to cause any problems. For
2005 people with a low educational level could not be identified based on questions
116
SMETS, Kaat (2010), A Widening Generational Divide? Assessing the Age Gap in Voter Turnout Between Younger and Older Citizens European University Institute
DOI: 10.2870/15899

Chapter 5. Later maturation versus alternative explanations
referring to the educational level. A proxy is used by coding everyone leaving school
at the age of 15 or earlier as having a low educational level. Education increases
citizen’s political resources as higher educated people eventually are considered to
have more time, money and skills to participate in politics. In fact, education is
one of the most constant and strongest indicators of individual level voter turnout
(Sondheimer and Green, 2010).
Lacking a measurement of personal income, we have to rely on household in-
come for our measurement of personal wealth and resources. Household income
is perhaps not the best indicator to measure income among young people as we
do not know whether such young respondents are living independently or not. It
is therefore not entirely clear whether we measure young people’s own income or
that of their entire family. On the other hand, household income is perhaps much
more indicative of the economic class and status of young respondents that still
live at home than personal income is (Blais and Loewen, 2009). Household income,
available in all election years, was recoded into a scale ranging from ‘low’ to ‘high’.
Income has repeatedly been proven to be positively related to voter turnout.
Social class is the last resource variable included in the analyses. The idea
is that citizens with white collar jobs have more resources which should increase
their probability of turning out to vote. Variables referring to the respondent’s own
perception of social class (not included in 1966, available for half of the sample in
1970) have been recoded into a dummy identifying respondents that indicate they
belong to the middle class.21 People identifying with the middle class are expected
to vote more compared to those belonging to the working class or compared to
those that feel they do not belong to any social class.
21Upper class is not a category in most British Election Studies.
117
SMETS, Kaat (2010), A Widening Generational Divide? Assessing the Age Gap in Voter Turnout Between Younger and Older Citizens European University Institute
DOI: 10.2870/15899

5.2. Later maturation versus (other) resource and mobilization factors
Turning to mobilization and socialization factors of voter turnout religion,
church attendance, and union membership are examined. Religion, firstly, is a
dichotomous variable identifying respondents that indicate they belong to a reli-
gion. The variable was not included in the election study for the February 1974
elections. Church attendance, on the other hand, is a seven point semi-interval
variable ranging from ‘never attends religious services/not religious’ to ‘attends
religious services several times a week’. In both instances, a positive relationship
with voter turnout is expected. The two variables practically measure the same
thing: however, the mobilization and socialization characteristics of religion are
better captured with the church attendance variable. Church attendance is missing
from the British Election Studies in the following election years: February 1974,
2001 and 2005.
Union membership, lastly, is available in all election surveys and was recoded
into a dummy identifying the union members. Union members are generally
thought to be mobilized to participate in politics. Therefore, a positive rela-
tionship with turnout is expected. In how far this relationship will be statistically
significant for young people is a different question, however. It is generally known
that union membership is in decline, particularly among young voters.
Although they are not direct life-cycle indicators, some of the variables consid-
ered in this section (educational level, income and union membership) have a clear
link with the different life-cycle stages. If young citizens, for example, have a high
educational level they are more likely to have spent a lot of time in education. An
increase in income just like union membership are only expected when the tran-
sition from the first to the second stage of the political life-cycle is set in motion.
118
SMETS, Kaat (2010), A Widening Generational Divide? Assessing the Age Gap in Voter Turnout Between Younger and Older Citizens European University Institute
DOI: 10.2870/15899

Chapter 5. Later maturation versus alternative explanations
Therefore, these variables may influence the way the life-cycle indicators from the
previous chapters behave. For example, the impact of the maturation index vari-
able on turnout among young adults could decrease after the inclusion of resource
and mobilization variables because some of the maturation effects overlap with the
newly included variables. Table 5.2 summarizes the expectations with regard to
the performance of the background variables. Both the direction of the effect on
individual level turnout itself as well as possible effects on the performance of the
life-cycle indicators are listed.
Variable Expected effect Expected effecton turnout on maturation
Gender n.s. noneEducational level positive weakening
Household income positive weakeningMiddle class positive none
Religious positive noneChurch attendance positive noneUnion membership positive weakening
Table 5.2: Later maturation versus (other) resource and mobilization indicators:expected effects
All analyses in this chapter will be presented in a similar fashion. As pointed
out above, this chapter serves two aims. The first one is to assess what indicators
other than the life-cycle variables central in the previous chapter can account
for the decline in youth voter turnout. In doing so, we want to better explain
the pre/post 1990 turnout difference among young British voters and increase
our understanding of the ways in which younger voter’s turnout is distinct from
turnout levels of the rest of the electorate. The second aim of the analyses in this
119
SMETS, Kaat (2010), A Widening Generational Divide? Assessing the Age Gap in Voter Turnout Between Younger and Older Citizens European University Institute
DOI: 10.2870/15899

5.2. Later maturation versus (other) resource and mobilization factors
chapter is to investigate the performance of the later maturation hypothesis when
it is competing with alternative explanations.
Starting from the models estimated in the previous chapter, each regression
table presented here includes models 2a and 3a from table 4.2 in chapter four.
Model 2a is the model that includes the maturation index, whereas in model 3a
the separate life-cycle indicators were used. The average turnout of voters aged
more than 35 years is not included in these models. This is because we saw that the
inclusion of this variable resulted in the period dummy no longer being statistically
significant. Since explaining the pre/post 1990 turnout difference among young
voters in Great Britain is one of the aims of this chapter, we need to be able
to see what variables other than older voter’s turnout levels influence this over-
time turnout difference. It is therefore important to not yet include the average
turnout of older voters as the variance to be explained in the pre/post 1990 turnout
difference among young voters would immediately disappear. Towards the end of
the chapter, when a fully specified model of youth voter turnout is estimated we
will return to average turnout of older voters.
In order to test how the resource and mobilization variables central in this sec-
tion perform in competition with the later maturation hypothesis, two new models
are estimated below (see table 5.3). In model 4a the resource and mobilization
variables are added to model 2a from the previous chapter, in model 4b this cluster
of variables is added to model 3a from the previous chapter.
Turning to the results of the analyses, we see that – contrary to expectations –
gender does show to have a (weakly) statistically significant effect on voter turnout
among young adults in model 4a (but not in model 4b). Moreover, it also has a
120
SMETS, Kaat (2010), A Widening Generational Divide? Assessing the Age Gap in Voter Turnout Between Younger and Older Citizens European University Institute
DOI: 10.2870/15899

model 2a model 4a model 3a model 4bb/(se) b/(se) b/(se) b/(se)
Age 0.380*** 0.320*** 0.586*** 0.488***(0.120) (0.120) (0.125) (0.123)
Post 1990 -0.473* -0.302 -0.551** -0.359(0.253) (0.226) (0.260) (0.225)
Maturation index 1.083*** 0.869***(0.250) (0.272)
Not in education -0.250*** -0.105(0.084) (0.095)
Married/cohabiting 0.156* 0.089(0.083) (0.085)
Children 0.032 0.054(0.076) (0.069)
Home ownership 0.557*** 0.433***(0.098) (0.097)
Residential stability 0.042 0.175(0.156) (0.157)
Works 0.123** 0.034(0.058) (0.081)
Gender -0.129* -0.123(0.071) (0.076)
Educational level 0.506*** 0.420***(0.134) (0.137)
Religious 0.096 0.091(0.078) (0.072)
Church attendance 0.696*** 0.677***(0.102) (0.097)
Union membership 0.261*** 0.282***(0.090) (0.091)
Household income 0.402*** 0.340**(0.133) (0.136)
Middle class 0.128** 0.084(0.063) (0.067)
Constant -0.233 -0.787*** 0.102 -0.487***(0.143) (0.169) (0.134) (0.160)
Log-likelihood -6313.45 -6181.25 -6261.48 -6159.56Pseudo R2 0.029 0.050 0.037 0.053N 9762 9762 9762 9762note: b coefficients from logit analyses with robust s.e.’s clusteredby election in parentheses; * p<0.10, ** p<0.05, *** p<0.01
Table 5.3: Turnout by later maturation versus resources and mobilization indica-tors for young voters aged 35 years or less, BES 1964-2005
121
SMETS, Kaat (2010), A Widening Generational Divide? Assessing the Age Gap in Voter Turnout Between Younger and Older Citizens European University Institute
DOI: 10.2870/15899

5.2. Later maturation versus (other) resource and mobilization factors
negative sign meaning that young men are less likely to turn out to vote than
women. This is an interesting observation, however, it is beyond the scope of this
research to try to explain this finding.
Educational level, as expected has a highly significant and positive impact on
turnout. Church attendance is, however, the most important background variable
among young voters in Britain. In this respect it is unfortunate that the British
Election Studies have not included other indicators of associational life on a regular
basis as it would be interesting to see to what extent participation in other societal
organizations mobilizes and socializes citizens to turn out to vote.
Considering oneself to be part of the middle class is also positively and sig-
nificantly related to turnout among young adults (in model 4a only though), just
as union membership and household income are. This leaves only the variable
identifying a respondent to be religious (or not) not to turn up significant. The
overlap with church attendance most likely plays a role in this.
All resource and mobilization variables perform largely the same way in the
model with the maturation index and in the model with the separate life-cycle
indicators. The only exceptions are the variables ‘gender’ and ‘middle class’ that
loose statistical significance in model 4b. The same two variables were already
found to be only weakly significant in the model including the maturation index
(model 4a).
In support of the later maturation hypothesis, the maturation index is still a
strong and significant indicator of turnout among young adults after the inclusion
of resource and mobilization variables. When separate life-cycle events are used,
however, most indicators of maturation lose statistical significance after the inclu-
sion of resource and mobilization factors. As we will find throughout the remainder
122
SMETS, Kaat (2010), A Widening Generational Divide? Assessing the Age Gap in Voter Turnout Between Younger and Older Citizens European University Institute
DOI: 10.2870/15899

Chapter 5. Later maturation versus alternative explanations
of the chapter as well, only home ownership remains statistically significant. Most
notably, having left education – while being highly significant in model 4a – no
longer has a significant effect on youth voter turnout after the inclusion of resource
and mobilization variables. This is most likely because the effect of the variable
is cancelled out by the inclusion of the educational level of the respondent. Being
married and working also lose statistical significance after the inclusion of these
variables. These two indicators were however less significant in the first place (see
model 3a).
Perhaps surprisingly, the period dummy immediately looses its statistical signif-
icance after the inclusion of the resource and mobilization variables. This indicates
that although before and after 1990 differences in turnout among young voters are
not totally captured by the life-cycle events alone, relatively simple background in-
dicators taken together can. Rubenson et al. (2004) also found socio-demographic
factors to play an important role in explaining the 2000 age gap in voter turnout
in Canada.
5.3 Later maturation versus campaign-related fac-
tors
In this section the impact of campaign-related factors on turnout will be consid-
ered. These are largely (but not necessarily) short term factors that are thought to
be taken into consideration by the voter in order to decide whether to turn out to
vote or not in the forthcoming election. The following variables are discussed: po-
litical interest, strength of party identification, perceived party differences, turnout
at previous elections, retrospective evaluation of the personal economic situation
and, lastly, prospective evaluation of the personal economic situation. Young initi-
123
SMETS, Kaat (2010), A Widening Generational Divide? Assessing the Age Gap in Voter Turnout Between Younger and Older Citizens European University Institute
DOI: 10.2870/15899

5.3. Later maturation versus campaign-related factors
ation is also included in this section, even though it is neither a campaign-related
variable nor does it refer to short term effects. The indicator seems to fit this
cluster of variables better than the other two discussed in this chapter, however.
To get an insight into the way the above-mentioned indicators are related to
voter turnout, we have to refer back to rational choice models of political partici-
pation. These models, whose origins lie in the 1950s, come in different forms. They
all stress the fact that there is a decisive cost-benefit factor to voting (whereby
benefits should outweigh cost in order for a person to turn out to vote), but mainly
disagree on the type of benefits voting brings. The neo-classical rational choice
approach, developed by Anthony Downs (1957), assumes that people are driven
by economic self-interest. In other words, it is desired, concrete benefits that guide
people in their choice to vote or abstain. To rightly estimate the perceived benefits
of voting implies that the voter has accurate information on the political system,
the policy positions of the parties and/or candidates, etc. If the perceived benefits
outweigh the costs of voting, called utility maximizing in rational choice jargon, it
is assumed that people will make the trip to the polling booth.
However, what concrete benefits can a rational citizen expect to gain from
voting when it is widely known that the chance that a single vote will influence
the outcome of an election is virtually non-existent? Taking the effort to register,
making the trip to the polling booth, informing oneself, etc. are all costs of voting
that, according to the neo-classical rational choice approach, no rational voter
should want to involve himself in. Nevertheless, millions of people do in fact turn
out to vote in elections.
A great deal of ink has been spilled trying to resolve this riddle. Of the many
theoretical explanations put forward (for overviews see Andrain and Apter, 1995;
124
SMETS, Kaat (2010), A Widening Generational Divide? Assessing the Age Gap in Voter Turnout Between Younger and Older Citizens European University Institute
DOI: 10.2870/15899

Chapter 5. Later maturation versus alternative explanations
Laver, 1997; Blais, 2000), perhaps the most widely known is the rational choice
structural approach put forward by Riker and Ordeshook (1968). According to this
adaption of the original Downsian rational choice approach, people are driven to
vote by values, norms and socio-political structures. Citizens may get something
out of casting a vote by fulfilling a civic duty, affirming a partisan choice, etc. This
intrinsic satisfaction of voting leads to non-material and non-outcome dependent
benefits that give a ‘rational’ explanation to the act of voting despite the almost
non-existing chance of single-handedly influencing the outcome of the election.22
From intrinsic satisfaction it is a small step to the psychological model of
voter turnout, which centers around the psychological involvement of people in
the process of voting. The higher this involvement, the more likely a citizen is
considered to turn out to vote. Very much in line with the rational choice structural
approach, the psychological model assumes that those who are e.g. interested in
politics will receive greater satisfaction or benefits from voting. Moreover, those
that are interested in politics are also more likely to know more about it. As such it
is relatively easy to become politically informed and make a cost-benefit calculation
of turnout. All these factors are considered to boost turnout. As mentioned in
chapter two, the last word has not been said about the causal direction of the
relationship between concepts such as political interest and political knowledge.
Interest provides and incentive to acquire political knowledge, however, someone
who has political knowledge is more likely to be interested in politics as well
22See here the difference between broad and narrow definitions of the concept of politicalrationality. Some scholars claim that the rational choice structural approach is not a ‘pure’rational choice approach as it includes more elements than economic costs and benefits (see e.g.Blais, 2000; Blais, Young and Lapp, 2000).
125
SMETS, Kaat (2010), A Widening Generational Divide? Assessing the Age Gap in Voter Turnout Between Younger and Older Citizens European University Institute
DOI: 10.2870/15899
5.3. Later maturation versus campaign-related factors
(Rubenson et al., 2004, p. 417; Howe, 2003, p. 22; Brady, Verba and Schlozman,
1995, p. 271).
Psychological involvement in politics and elections can be measured with the
British Election Studies through a variable that indicates the amount of interest
a respondent claims to have in politics. Where possible interest in politics in
general was used as an indicator, however, in some instances interest in the political
campaign was used as a proxy. A four point scale was constructed ranging from
respondents claiming to have ‘no political interest’ to those indicating to be ‘very
much’ interested in politics. No questions on political interest were included in
the election surveys of 1983, 1987, and 1992. A positive relationship is expected
to exist between political interest and turnout.
Individual level political indicators such as strength of party identification and
perceived party differences can be linked to voter turnout in a similar way as
psychological variables. A person who identifies with a party is much more likely
to be interested in and knowledgeable about what is going on in politics. Therefore
the information costs for such a person are lower, which increases the likelihood
of turnout. The way in which a respondent identifies with a political party is
measured with a four point scale that runs from ‘no party identification’ to ‘a very
strong party identification’.
The manner in which respondents perceive differences between political parties
is measured with a three point scale variable that runs from ‘a great deal of differ-
ence’ to ‘not much difference’. Perceived differences between parties can arguably
both boost and decrease turnout. The greater the differences between the parties,
the clearer the options are for the voter and the easier it is for a citizen to decide
to turn out to vote or not. On the other hand, diversity can lead to complexity
126
SMETS, Kaat (2010), A Widening Generational Divide? Assessing the Age Gap in Voter Turnout Between Younger and Older Citizens European University Institute
DOI: 10.2870/15899

Chapter 5. Later maturation versus alternative explanations
and higher information costs, which in its turn should decrease turnout. At the
aggregate level, similar arguments exist with regard to the number of parties that
run in an election. This will be discussed in more detail in the next chapter.
Turnout in the previous election (t-1 ) is the last short term political indicator
the be assessed in this chapter. Past behaviour predicts current behaviour as
those who have already made a cost-benefit calculation in the past will have fewer
difficulties doing so in the future. The variable measuring previous turnout has
a dichotomous nature, identifying those respondents that voted in the previous
parliamentary election.
Young initiation, lastly, is also included in the analysis. The variable takes
into account the long term effects of the lowering of the voting age and identifies
those people that came of age after the lowering of the minimum voting age to 18
years in 1969. Along the lines of the political learning perspective, the idea is that
those who were socialized when the minimum voting age was still up at 21 had a
higher likelihood of turning out to vote in their first elections and therefore also in
subsequent ones. Given the way in which it is coded, the young initiation variable
should have a negative impact on youth voter turnout.
The third group of short term factors considered in this section are related
to the economy. That the (perception of) the national economic situation has
an impact on how citizens vote is a fairly uncontested assumption. However,
one’s perceived personal economic situation can obviously also have an impact on
whether someone turns out to vote or not.
Part of a government’s job is to manage the nation’s economy. Experiencing
economic strain, therefore, may make citizens blame the government for their
situation and mobilize them to the polling booth to vote the government out of
127
SMETS, Kaat (2010), A Widening Generational Divide? Assessing the Age Gap in Voter Turnout Between Younger and Older Citizens European University Institute
DOI: 10.2870/15899

5.3. Later maturation versus campaign-related factors
office (Schlozman and Verba, 1979, p. 12-19; Lipset, 1969, p. 187). In other words,
those that perceive the economic situation pessimistically will turn out to vote
in order to punish the incumbent. The benefits of voting in this case outweigh
the costs and citizens will turn out to vote. The alternative hypothesis stipulates
that economic suffering withholds people from participating in politics. Someone
who has, for example, just lost his job is more likely to be pre-occupied with
personal economic well-being than with remote concerns like politics. Economic
strain in this sense is argued to reduce a person’s capacity to participate in politics
(Rosenstone, 1982). In this instance, the costs outweigh the benefits and a rational
citizen will choose not to turn out and vote.
There are two questions that need further discussion. The first is: do voters
look forward or do they look back? In the first instance, voters will decide to turn
out based on their expectations. These expectations are based on citizen’s exper-
tise and information on e.g. policies that are on offer. The purely retrospective
voter will look at the successes and failures of both government and opposition and
base their decision to turn out on this (van der Brug, van der Eijk and Franklin,
2007, p. 3). There seems to be a general consensus that both prospective and
retrospective elements of economic evaluation play a role in turnout (Evans, 2004,
p. 136).
The other question is whether citizens decide to turn out to vote based on the
state of their own finances or based on that of the nation’s economy. Unfortunately,
however, the British Election Studies only include questions on the respondent’s
perception of the national economic situation in half of the studies conducted
between 1964 and 2005. We will take into account the influence of the national
128
SMETS, Kaat (2010), A Widening Generational Divide? Assessing the Age Gap in Voter Turnout Between Younger and Older Citizens European University Institute
DOI: 10.2870/15899

Chapter 5. Later maturation versus alternative explanations
economic situation in the next chapter where the analysis shifts to the aggregate
level.
The British Elections Studies held between 1964 and 2005 do include the re-
spondents retrospective and prospective evaluation of the personal economic situ-
ation. Retrospective evaluation is measured with a three point scale variable that
ranges from ‘worse off now’ to ‘better off now’ with ‘things have stayed the same’
as the middle category. The other economic indicator measures the prospective
economic evaluation of the respondent’s personal situation. The variable has the
same categories as the other economic indicator, but then oriented towards the
future. As discussed above, both variables can be argued to either have a positive
or a negative effect on individual level turnout. Retrospective economic evalua-
tion is not available in the 1987 British election survey; the prospective economic
evaluation variable is not available for 1987 and 1992.
Now that the relation between the different political and economic indicators
and turnout has been discussed, what influence can these factors be expected to
have on the behaviour of the life-cycle indicators modelled in the previous chapter?
Since political interest is clearly linked to the later maturation hypothesis, adding
this variable to the models from the previous chapter may weaken the effect of
the life-cycle indicators. Life events such as finishing education, getting married,
having children, buying a house, starting a first job, etc. are namely thought to
trigger political interest, which in its turn is supposed to boost turnout. On the
same token, if voting is a habit previous turnout may overrule the negative effects
of later maturation on turnout among young adults.
129
SMETS, Kaat (2010), A Widening Generational Divide? Assessing the Age Gap in Voter Turnout Between Younger and Older Citizens European University Institute
DOI: 10.2870/15899

5.3. Later maturation versus campaign-related factors
Variable Expected effect Expected effecton turnout on maturation
Interest positive weakeningParty i.d. strength positive none
Perceived party difference pos. or neg. noneVoted at t-1 positive none or weakening
Young initiation negative noneRetrospective perception of personal eco. sit. pos. or neg. none
Prospective perception of personal eco. sit. pos. or neg. none
Table 5.4: Later maturation versus campaign-related indicators: expected effects
With regard to the other variables, there are no real indications that individual
level political indicators and economic indicators would interfere in any sort of
way with the performance of the life-cycle variables from the previous chapter.
Table 5.4 gives an overview of the expected effects of short term campaign-related
variables on turnout as well as on the performance of life-cycle indicators.
As in the previous section, the indicators central here are added to models 2a
and 3a from the previous chapter. This way it is not only possible to see what indi-
cators other than the life-cycle indicators have an impact on youth voter turnout,
it also provides an impression of how well the later maturation hypothesis behaves
in better specified circumstances. Moreover, it allows us to see whether campaign-
related factors can explain more of the pre/post turnout difference among young
voters in Britain. Table 5.5 shows the results of the logit analyses.
Political interest, strength of party identification and turnout in previous elec-
tions all turn up positive and significant. This is as expected. The coefficient
for the respondent’s perception of the differences between political parties is neg-
ative. The more positive the value of the variable, the smaller the respondent
perceives differences between the parties to be. A negative coefficient thus implies
130
SMETS, Kaat (2010), A Widening Generational Divide? Assessing the Age Gap in Voter Turnout Between Younger and Older Citizens European University Institute
DOI: 10.2870/15899

model 2a model 5a model 3a model 5bb/(se) b/(se) b/(se) b/(se)
Age 0.380*** -0.384* 0.586*** -0.231(0.120) (0.202) (0.125) (0.197)
Post 1990 -0.473* -0.268 -0.551** -0.314(0.253) (0.267) (0.260) (0.269)
Maturation index 1.083*** 0.951***(0.250) (0.277)
Not in education -0.250*** -0.035(0.084) (0.112)
Married/cohabiting 0.156* 0.077(0.083) (0.105)
Children 0.032 0.073(0.076) (0.086)
Home ownership 0.557*** 0.427***(0.098) (0.105)
Residential stability 0.042 -0.033(0.156) (0.232)
Works 0.123** 0.063(0.058) (0.073)
Interest 1.354*** 1.273***(0.203) (0.209)
Strength party id 1.296*** 1.326***(0.123) (0.115)
Perceived party differences -0.480*** -0.454***(0.145) (0.139)
Voted t− 1 0.990*** 0.984***(0.105) (0.106)
Young initiation -0.045 -0.083(0.222) (0.218)
Retrospective eco. evaluation 0.121 0.095(0.100) (0.103)
Prospective eco. evaluation -0.033 -0.001(0.103) (0.101)
Constant -0.233 -1.553*** 0.102 -1.289***(0.143) (0.311) (0.134) (0.299)
Log-likelihood -6313.45 -5509.74 -6261.48 -5495.72Pseudo R2 0.029 0.152 0.037 0.154N 9762 9762 9762 9762note: b coefficients from logit analyses with robust s.e.’s clusteredby election in parentheses; * p<0.10, ** p<0.05, *** p<0.01
Table 5.5: Turnout by later maturation versus campaign indicators for youngvoters aged 35 years or less, BES 1964-2005
131
SMETS, Kaat (2010), A Widening Generational Divide? Assessing the Age Gap in Voter Turnout Between Younger and Older Citizens European University Institute
DOI: 10.2870/15899

5.3. Later maturation versus campaign-related factors
that the smaller the respondent perceives the differences between the parties, the
lower turnout will be. Apparently similarity increases complexity. High complex-
ity implies higher information costs, and these costs – in their turn – appear to be
the reason young voters are less inclined to turn out to vote when the differences
between parties are perceived to be small.
Neither of the variables tapping the influence of economic evaluation on turnout
reaches statistical significance. Being socialized after the lowering of the voting age
– as tapped with the variable ‘young initiation’ – is not found to have an impact
on youth voter turnout either.
The maturation index remains highly significant after the inclusion of the
campaign-related indicators (see model 5a). In the model with the separate life-
cycle indicators (model 5b) the variables having left education, work, and be-
ing married/cohabiting are no longer statistically significant after the inclusion of
short-term campaign indicators. This is exactly as we noted in the previous sec-
tion with the resource and mobilization variables. Comparing the magnitude of
the coefficients, we see that political interest, party identification, and turnout at
previous elections each play a large role in youth voter turnout. Political interest
and party i.d. are stronger predictors than maturation and previous turnout, the
latter two being about as important. These findings are in line with the work of
Blais and Loewen (2009, p. 6) who find that political factors exert more influence
on the decision of young Canadians to turn out or abstain than socio-demographic
factors do.
As in the last section, the period dummy looses statistical significance after
the inclusion of the variables of interest in the section. This indicates that the
campaign-related factors modelled here also play a role in the turnout decline
132
SMETS, Kaat (2010), A Widening Generational Divide? Assessing the Age Gap in Voter Turnout Between Younger and Older Citizens European University Institute
DOI: 10.2870/15899

Chapter 5. Later maturation versus alternative explanations
among younger voters before and after 1990 in Britain. Also interesting is the
fact that the variable age becomes much less significant after including political
interest, party i.d., perceived differences between the parties and turnout at pre-
vious elections. Lastly, it should be noted that the inclusion of campaign-related
indicators gives a real boost to the pseudo R2. The explained variance goes up
from 3-4% to 15% when this cluster of indicators is included.
5.4 Later maturation versus competitiveness in-
dicators
The last group of indicators to be discussed in this chapter are non-individual
political indicators that capture part of the characteristics of elections. Although
such contextual indicators are more commonly included in aggregate level analyses,
there is evidence that political behaviour at the individual level is also influenced
by characteristics of elections – especially by the competitiveness of these elections
(see e.g. Franklin, 2004 and Fieldhouse, Tranmer and Russell, 2007).
The idea that competitiveness of elections is related to turnout of individuals
finds its origin in rational choice theory. In this section two concepts related to
electoral competitiveness are central: the closeness of the race and the likelihood of
coalition formation. Starting with the latter, when the probability that a coalition
will have to be formed after an election is high voters can anticipate that the
chances that policies of personal importance will be implemented are slimmer.
Therefore, when the probability of coalition formation is high, turnout should
arguably be lower (Franklin, 2004, p. 112). The likelihood of coalition formation
is measured by calculating the majority status of the largest party. This is the
simple difference between the vote share of the largest party and 50 percent.
133
SMETS, Kaat (2010), A Widening Generational Divide? Assessing the Age Gap in Voter Turnout Between Younger and Older Citizens European University Institute
DOI: 10.2870/15899

5.4. Later maturation versus competitiveness indicators
The degree of closeness of an election is related to the likelihood that votes can
affect an election’s outcome. The closer the race, the higher the probability that
a single vote will make the difference and thus the higher turnout will be.23 The
closeness of elections can be measured in more than one way. The most frequently
used option is to calculate the simple difference between the vote share of the first
party and the vote share of the second party, further referred to as the margin
of the victory. Although this measure oversimplifies the notion of closeness in a
multi-party setting, it performs well in (quasi) two-party systems like the British
one.24 The margin of the victory at the national level is computed based on data
from the UK Electoral Commission (Tetteh, 2008, p. 11).
Although national level competitiveness measures are usually considered to
suffice in PR systems, this is not the case in countries with single-member districts.
As Johnston, Matthews and Bittner (2007) and Blais and Lago (2009) point out,
voters in first past the post systems are likely to (also) take into account the
closeness of the race in their constituency when deciding to turn out to vote or not.
Measures of the closeness of the race at the constituency level should, therefore,
be modelled alongside the very same measures at the national level.
Since the British Election Studies contain information on the constituency
a respondent lives in, the impact of competitiveness at the constituency level
on individual level voter turnout can indeed be modelled. In order to obtain
constituency level measures of competitiveness, in a first step data on the vote
23As Franklin (2004, p. 112) points out, voters do not, of course, take into account the actualcloseness of the race, but the expected closeness. Nonetheless, ex-post measures of the closenessof the race are much more often used than ex-ante measures based on opinion poll data as thelatter are harder to find.
24Different measures of the closeness of elections were tried (for a useful overview see Endersby,Galatas and Rackaway, 2002; Grofman and Selb, 2009). None of the alternative measures,however, outperformed the simple difference measure of competitiveness.
134
SMETS, Kaat (2010), A Widening Generational Divide? Assessing the Age Gap in Voter Turnout Between Younger and Older Citizens European University Institute
DOI: 10.2870/15899

Chapter 5. Later maturation versus alternative explanations
shares of parties at the constituency level was gathered for each election year.
These vote shares are available from the following sources: Caramani (2000); Crewe
and Fox (1984); Morgan (2001); Electoral Commission (2006). In the next step,
information on the competitiveness of the elections at the constituency level was
merged with the individual level data from the British Election Studies.
Just as for the national level, margin of the victory at the constituency level
is measured through the simple difference between the vote share of the first and
the second party. After merging individual and constituency level data, compet-
itiveness indicators become available for almost all of the respondents in the on
average 200-250 constituencies included in each of the twelve waves of the British
Election Studies used for this chapter.25
Table 5.4 summarizes the expected directions of the relationship between the
competitiveness measures and turnout. There are no indications from the liter-
ature that competitiveness of elections in any sort of way influences the way in
which life-cycle events influence voter turnout.
Variable Expected effect Expected effecton turnout on maturation
Margin of victory country level negative noneMargin of victory constituency level level negative none
Majority status country level negative none
Table 5.6: Later maturation versus competitiveness indicators: expected effects
25Note that the sample size will nonetheless drop slightly with the inclusion of the compet-itiveness indicators as full information is missing in some election years due to discrepanciesbetween the different sources.
135
SMETS, Kaat (2010), A Widening Generational Divide? Assessing the Age Gap in Voter Turnout Between Younger and Older Citizens European University Institute
DOI: 10.2870/15899

5.4. Later maturation versus competitiveness indicators
Table 5.7 shows the results of the logit analyses in which the competitiveness
indicators are modelled against the maturation indicators. Neither in the model
with the competitiveness indicators, nor in the model with the separate life-cycle
indicators do any of the measures of competitiveness reach statistical significance.
The inclusion of measures of competitiveness does not render changes in the
performance of the later maturation indicators. In fact, contrary to findings else-
where in this chapter, the separate life-cycle indicators remain performing as before
after the inclusion of alternative indicators of turnout (see model 6b).
This findings in this section seem to contradict the relationship between com-
petitiveness and turnout that others have established. There are several reasons
why the results of this study may differ from others.
First, although various studies have established a relationship between com-
petitiveness of elections and voter turnout, there tends to be variation in the level
of analysis. Some studies have studied the impact of competitiveness at the ag-
gregate level focussing on general turnout levels (see e.g. Blais and Dobrzynska
1998 and Franklin, Lyons and Marsh 2004). In other instances the impact of com-
petitiveness on turnout was assessed using cohort-years as the level of analysis
(Franklin and Wessels, 2002). The variation in the level of analysis renders a true
comparison difficult.
136
SMETS, Kaat (2010), A Widening Generational Divide? Assessing the Age Gap in Voter Turnout Between Younger and Older Citizens European University Institute
DOI: 10.2870/15899

model 2a model 6a model 3a model 6bb/(se) b/(se) b/(se) b/(se)
Age 0.380*** 0.371*** 0.586*** 0.581***(0.120) (0.120) (0.125) (0.119)
Post 1990 -0.473* -0.420 -0.551** -0.493*(0.253) (0.258) (0.260) (0.256)
Maturation index 1.083*** 1.079***(0.250) (0.240)
Not in education -0.250*** -0.266***(0.084) (0.084)
Married/cohabiting 0.156* 0.126(0.083) (0.084)
Children 0.032 0.053(0.076) (0.082)
Home ownership 0.557*** 0.569***(0.098) (0.093)
Residential stability 0.042 -0.097(0.156) (0.171)
Works 0.123** 0.129**(0.058) (0.058)
Margin of the victory (const. level) -0.186 -0.111(0.136) (0.142)
Margin of the victory (country level) -0.006 -0.112(0.164) (0.165)
Majority status (country level) -0.374 -0.488(0.344) (0.352)
Constant -0.233 -0.010 0.102 0.437**(0.143) (0.185) (0.134) (0.188)
Log-likelihood -6313.45 -6267.20 -6261.48 -6213.33Pseudo R2 0.029 0.030 0.037 0.038N 9762 9704 9762 9704note: b coefficients from logit analyses with robust s.e.’s clusteredby election in parentheses; * p<0.10, ** p<0.05, *** p<0.01
Table 5.7: Turnout by later maturation versus competitiveness indicators for youngvoters aged 35 years or less, BES 1964-2005
137
SMETS, Kaat (2010), A Widening Generational Divide? Assessing the Age Gap in Voter Turnout Between Younger and Older Citizens European University Institute
DOI: 10.2870/15899
5.4. Later maturation versus competitiveness indicators
With reference to the studies that did research the relationship between com-
petitiveness and turnout at the individual level, two differences stand out. First,
there is variation in the choice of countries where the impact of electoral competi-
tiveness on individual level turnout is measured. Mark Franklin (2004, chapter six)
reports is findings based on the German Election Studies. Fieldhouse, Tranmer
and Russell (2007), on the other hand, base their findings on the European Social
Survey of 2002 including 22 countries.26
In this chapter, data from the British Election Studies was used. As was
established in chapter two, turnout patterns among young voters differ greatly
from one country to another. This may be a reason why different variables turn
up significant and others do not.
Although Fieldhouse et al. find electoral competitiveness to have an impact on
youth voter turnout with a model that bears great similarities to the one estimated
in this chapter, Franklin uses a different approach to research the relationship
between competitiveness and youth voter turnout. Taking a random sample of
the electorate as a whole (instead of a young sub set), he uses an interaction
term to establish the effect of electoral competitiveness on youth voter turnout.
The different approach taken in this chapter can, however, not account for the
dissimilarities in the findings.
Just as in table 5.7, the two measures of electoral competitiveness (majority
status and margin of the victory) are not found to have a statistically significant
impact on turnout of (new) voters when random samples of the British electorate as
26Although Great Britain is included in this study, between-country differences are not a focalpoint of this research.
138
SMETS, Kaat (2010), A Widening Generational Divide? Assessing the Age Gap in Voter Turnout Between Younger and Older Citizens European University Institute
DOI: 10.2870/15899

Chapter 5. Later maturation versus alternative explanations
a whole are used (see table C.20 in appendix C).27 Since new voters only constitute
a small part of the electoral and are often underrepresented in election studies, the
very same model was repeated with an interaction term identifying those voters
aged 35 years or less. In this model, the interaction between young voters and
majority status is found to be weakly significant (see table C.21).
The findings in appendix C boost confidence in the results of the models in
this chapter. In the next chapter we will assess whether indicators of electoral
competitiveness influence turnout better when it is researched at the aggregate
level.
5.5 Later maturation versus alternatives: bring-
ing everything together
In the previous sections different explanations for turnout (decline) among young
voters were discussed and modelled against the later maturation hypothesis as
assessed in the previous chapter. The impact of such resource and mobilization
variables, campaign-related variables and indicators of electoral competitiveness
on individual level turnout among young voters in Britain was found to vary. In
this section, we will bring all alternatives together to see how the indicators behave
in an environment that is as fully specified as possible based on the British Election
Studies from 1964 to 2005.
Central throughout this thesis is the hypothesis that later maturation may
explain part of the turnout decline among young voters over time. In the previ-
27The models presented in table C.20 and C.21 build on the models in which all previouslysignificant indicators are brought together. These models are presented in the next section ofthis chapter. While estimating the models attention was paid to staying as true as possible tothe models from Franklin (2004, chapter six).
139
SMETS, Kaat (2010), A Widening Generational Divide? Assessing the Age Gap in Voter Turnout Between Younger and Older Citizens European University Institute
DOI: 10.2870/15899

5.5. Later maturation versus alternatives: bringing everything together
ous chapter we established that although the later maturation hypothesis cannot
explain all of the pre/post 1990 turnout differences among young voters it was
found to explain roughly 9-10% of the turnout decline among young voters in this
period. The question that remained was, however, whether the later maturation
hypothesis would still hold under better specified circumstances. Moreover, we
were interested to see what characteristics of voters or characteristics of elections
could better explain the turnout difference among young voters before and after
1990 and also aimed to see whether we could better specify what distinguishes
young voters from older voters.
The current chapter addresses this question by modelling life-cycle indicators
against alternative explanations of voter turnout. In this last section, all findings
from previous sections are brought together. Instead of running a final analysis
with all possible variables, I focus on those variables that were statistically signifi-
cant in the previous analyses of this chapter. Tables 5.8 and 5.10 show the results
of the final analyses. The models in table 5.8 are run without the average turnout
of older voters excluded, whereas the models in table 5.10 do include the average
turnout of those aged more than 35 years.
Starting with table 5.8, five models are presented. Models 1, 2a and 3a were
estimated in the previous chapter. They form the basis on which comparisons can
be made. In models 7a and 7b all resource and mobilization variables, campaign-
related variables, and indicators of electoral competitiveness that were previously
found to be statistically significant are added to model 2a and 3a respectively.
The resource and mobilization variables all behave pretty much as before. We
still find a gender gap in turnout, with men voting less than women. Education,
as expected, has a positive and significant effect on turnout. Church attendance
140
SMETS, Kaat (2010), A Widening Generational Divide? Assessing the Age Gap in Voter Turnout Between Younger and Older Citizens European University Institute
DOI: 10.2870/15899

Chapter 5. Later maturation versus alternative explanations
and union membership are also still found to be positively related to youth voter
turnout. Social class and household income, on the other hand, are not longer
found to reach statistical significance in the fully specified models.
Confirming the results from section 5.3, political interest, strength of party
identification and turnout in previous elections have a positive and significant on
voter turnout even in better specified circumstances. The perceived difference
between the parties is also still found to influence turnout levels among young
voters.
Judging by the magnitude of the coefficients (see model 7a), political interest
and party identification explain most of the variance in turnout among young
voters. Next in line are the maturation index and turnout in previous elections.
These two variables more or less have the same impact on youth voter turnout.
As we established in the previous models in this chapter, when using separate
life-cycle indicators instead of the maturation index (see model 7b) the only life-
cycle event indicator that remains significant under better specified circumstances
is home ownership.
Overall, including alternative indicators of voter turnout boosts the pseudo
R2 significantly from 3-4% in the models with the maturation variables alone to
17% in the fully specified models. The log-likelihood also decreases as the models
become better specified.
The results in this section confirm that our earlier findings regarding the later
maturation hypothesis are robust. Later maturation explains part of the turnout
decline among young voters after 1990 in Britain even when controlling for other
explanatory factors of youth voter turnout. These other factors play a role in the
turnout decline among young British voters as well, however.
141
SMETS, Kaat (2010), A Widening Generational Divide? Assessing the Age Gap in Voter Turnout Between Younger and Older Citizens European University Institute
DOI: 10.2870/15899

model 1 model 2a model 7a model 3a model 7bb/(se) b/(se) b/(se) b/(se) b/(se)
Age 0.786*** 0.380*** -0.400** 0.586*** -0.226(0.113) (0.120) (0.159) (0.125) (0.166)
Post 1990 -0.539** -0.473* -0.160 -0.551** -0.211(0.254) (0.253) (0.198) (0.260) (0.199)
Maturation index 1.083*** 0.882***(0.250) (0.307)
Not in education -0.250*** 0.009(0.084) (0.129)
Married/cohabiting 0.156* 0.049(0.083) (0.096)
Children 0.032 0.055(0.076) (0.083)
Home ownership 0.557*** 0.368***(0.098) (0.109)
Residential stability 0.042 0.105(0.156) (0.220)
Works 0.123** 0.078(0.058) (0.097)
Gender -0.239*** -0.240***(0.072) (0.078)
Educational level 0.368** 0.291(0.178) (0.177)
Church attendance 0.666*** 0.658***(0.120) (0.119)
Union membership 0.189** 0.199**(0.089) (0.093)
Household income 0.192 0.154(0.149) (0.150)
Middle class -0.082 -0.115(0.073) (0.077)
Interest 1.321*** 1.273***(0.174) (0.181)
Strength party id 1.339*** 1.357***(0.122) (0.115)
Perceived party difference -0.449*** -0.430***(0.147) (0.143)
Voted (t-1) 0.945*** 0.946***(0.113) (0.114)
Constant 0.276*** -0.233 -1.838*** 0.102 -1.610***(0.069) (0.143) (0.274) (0.134) (0.286)
Log-likelihood -6362.74 -6313.45 -5446.52 -6261.48 -5440.37Pseudo R2 0.021 0.029 0.163 0.037 0.164N 9762 9762 9762 9762 9762
note: b coefficients from logit analyses with robust s.e.’s clustered by election in parentheses;* p<0.10, ** p<0.05, *** p<0.01
Table 5.8: Turnout by later maturation versus alternatives for young voters aged35 years or less - mean turnout older votes excluded, BES 1964-2005
142
SMETS, Kaat (2010), A Widening Generational Divide? Assessing the Age Gap in Voter Turnout Between Younger and Older Citizens European University Institute
DOI: 10.2870/15899

Chapter 5. Later maturation versus alternative explanations
In order to give an impression of the magnitude of the impact of later mat-
uration on turnout decline among young British voters in comparison to other
predictors, table 5.9 shows predicted probabilities calculated based on model 7a.
The second and third column from the left show the average scores of the five
most important variables from model 7a in table 5.8 both before and after 1990.28
Moving to the right, the table shows how much higher turnout would have been
in the post 1990 years had these five indicators stayed at their pre-1990 average.
Comparing this to the predicted probability of turnout based on the post-1990 av-
erage scores, we can establish the impact each variable has on the 12,3 percentage
point pre/post 1990 turnout decline among young voters (see section 4.3 of the
previous chapter).
Average score Pr(y=1) after 1990
Variable before after with <‘90 with >‘90 difference % gap (12,3%)1990 1990 mean score mean score in % explained
Maturation index ,670 ,622 ,654 ,645 0,9 7,3Political interest ,590 ,579 ,647 ,643 0,4 3,3Party id strength ,535 ,430 ,655 ,623 3,2 26,0Perceived party diff. ,413 ,463 ,652 ,647 0,5 4,1Church attendance ,240 ,094 ,657 ,635 2,2 17,9Total ,657 ,583 7,4 60,2
note: based on the five variables with the largest slope coefficient in model 7a.
Table 5.9: Explaining turnout decline among young British voters after 1990
Going from low to high, we see that political interest accounts for 3,3% of
the turnout difference among young Brits before and after 1990. This may seem
surprisingly low given the large magnitude of the slope coefficient for this variable,
but makes sense in light of the fact that the average political interest among
young citizens has hardly declined. Next, we see that perceived differences between
parties (up with 5 percentage points) accounts for 4.1% of the turnout gap.
28Turnout at previous elections is left out of consideration for tautological reasons.
143
SMETS, Kaat (2010), A Widening Generational Divide? Assessing the Age Gap in Voter Turnout Between Younger and Older Citizens European University Institute
DOI: 10.2870/15899

5.5. Later maturation versus alternatives: bringing everything together
Later maturation is the third most important variable accounting for 7,3% of
the pre/post 1990 turnout difference among young voters before and after 1990.
Before any controls were included, later maturation was found to explain between
9 and 10% of the turnout gap (see previous chapter). Although the effect of
later maturation is slightly weaker in a more fully specified model of youth voter
turnout, the index is still among the more important predictors of turnout decline
in Great Britain.
The list is topped, however, by church attendance and strength of party iden-
tification. The magnitude of the slope coefficient for church attendance is not
exceptionally large. Nonetheless, in combination with a stark decline in those who
attend religious services regularly, church attendance accounts for 17,9% of the
drop in turnout among young British voters. Strength of party identification has
also declined much after 1990. Moreover, the slope coefficient for this variable is
large. It is therefore not surprising that strength of party identification accounts
for a quarter of the difference in turnout among young voters before and after
1990. Taking everything together, the five variables reported here (later matura-
tion, political interest, strength of party identification, perceived party differences,
and church attendance) account for over 60% of the drop in youth voter turnout
after 1990 in Great Britain.
This leaves us with one question that still needs to be answered: can we better
explain in what way young people are different from older voters with a better
specified model of voter turnout? In order to attempt to answer this question,
the models in table 5.8 were estimated once again this time including the average
turnout of older voters. If we are able to better put a finger on the differences
144
SMETS, Kaat (2010), A Widening Generational Divide? Assessing the Age Gap in Voter Turnout Between Younger and Older Citizens European University Institute
DOI: 10.2870/15899

Chapter 5. Later maturation versus alternative explanations
between older and younger voters, the magnitude of the coefficient of this variable
should decrease after the inclusion of alternative indicators of youth voter turnout.
Table 5.10 shows the results of this exercise. Models 1, 2b, and 3b are taken
from the previous chapter. Models 8a and 8b are the same as models 7a and 7b in
this chapter, but also include the mean turnout among older voters. The first thing
to notice is that the inclusion of this variable does not change all that much. Those
variables that were significant in models 7a and 7b are still significant in models
8a and 8b. Average turnout among older voters is, however, still a very strong
indicator of youth voter turnout even when alternative indicators to maturation
are modelled. In fact, it still is the variable that whose slope coefficient is largest in
magnitude when explaining young adults’ voter turnout. This implies that turnout
levels among young voters are largely a function of the turnout levels among older
voters.
Although controlling for other factors reduces the impact of older voters turnout
levels on those of young adults, it seems that the British Election Studies do not
seem to allow us to put a finger on what it is exactly that makes the two age groups
distinct. This conclusion is also confirmed by the non-significant interaction terms
in table C.20 and C.21 (see appendix C) in which models similar to the ones in
this section are estimated on a sample of the whole electorate. We will return to
the implication of this finding in the conclusion of this thesis.
145
SMETS, Kaat (2010), A Widening Generational Divide? Assessing the Age Gap in Voter Turnout Between Younger and Older Citizens European University Institute
DOI: 10.2870/15899

model 1 model 2b model 8a model 3b model 8bb/(se) b/(se) b/(se) b/(se) b/(se)
Age 0.786*** 0.410*** -0.371** 0.655*** -0.166(0.113) (0.104) (0.150) (0.105) (0.150)
Post 1990 -0.539** -0.117 0.086 -0.182 0.043(0.254) (0.135) (0.132) (0.130) (0.127)
Maturation index 1.000*** 0.856***(0.233) (0.310)
Not in education -0.300*** -0.031(0.089) (0.132)
Married/cohabiting 0.164* 0.065(0.090) (0.101)
Children -0.046 -0.002(0.071) (0.087)
Home ownership 0.558*** 0.383***(0.093) (0.111)
Residential stability 0.033 0.116(0.160) (0.228)
Works 0.109* 0.076(0.061) (0.095)
Gender -0.244*** -0.249***(0.074) (0.080)
Educational level 0.397** 0.314*(0.173) (0.175)
Church attendance 0.498*** 0.481***(0.108) (0.108)
Union membership 0.176** 0.182**(0.086) (0.088)
Household income 0.156 0.104(0.142) (0.145)
Middle class -0.067 -0.105(0.071) (0.076)
Interest 1.339*** 1.285***(0.163) (0.168)
Strength party id 1.312*** 1.332***(0.120) (0.113)
Perceived party difference -0.425*** -0.404***(0.143) (0.137)
Voted (t-1) 0.945*** 0.947***(0.113) (0.114)
Average turnout ≤35 7.781*** 5.892*** 8.212*** 6.216***(1.397) (1.514) (1.420) (1.473)
Constant 0.276*** -6.372*** -6.479*** -6.366*** -6.480***(0.069) (1.180) (1.185) (1.194) (1.179)
Log-likelihood -6362.74 -6229.97 -5409.12 -6170.66 -5399.44Pseudo R2 0.021 0.042 0.169 0.050 0.171N 9762 9762 9762 9762 9762
note: b coefficients from logit analyses with robust s.e.’s clustered by election in parentheses;* p<0.10, ** p<0.05, *** p<0.01
Table 5.10: Turnout by later maturation versus alternatives for young voters aged35 years or less - mean turnout older votes included, BES 1964-2005
146
SMETS, Kaat (2010), A Widening Generational Divide? Assessing the Age Gap in Voter Turnout Between Younger and Older Citizens European University Institute
DOI: 10.2870/15899

Chapter 5. Later maturation versus alternative explanations
5.6 Conclusion and discussion
Just as the previous one this chapter centred around the idea that delays in expe-
riencing certain life-cycle events that are considered to be important for political
participation may partly explain turnout decline among young voters. Whereas
the previous chapter concentrated on providing the best possible test of the later
maturation hypothesis, the aim of this chapter was to assess its robustness and
validity under more demanding circumstances. In addition, the chapter was aimed
at identifying other indicators of youth voter turnout – specifically those variables
that could explain part of the turnout difference before and after 1990 that was
not yet explained away in the previous chapter.
Starting with the first question, the later maturation hypothesis has passed the
test. Delays experiencing life-cycle events cannot fully explain the pre/post 1990
turnout difference among young British voters. Nonetheless, we can conclude that
later maturation indeed plays a role in the turnout decline among young voters in
Britain in recent decades. Maturation is among the most important indicators of
youth voter turnout. It is positively related to turnout. Since we established in the
previous chapter that a smaller proportion of young people nowadays matures by
the age of 35, later maturation can thus be concluded to have a negative effect on
youth voter turnout. The impact of maturation on turnout among young voters
is robust under various circumstances. In the most fully specified model possible
based on the British Election Studies from 1964 to 2005, later maturation explains
7.5% of turnout decline among young British voters after 1990.
From all life-cycle indicators modelled, home ownership proves to be the most
important indicator. This result is somewhat surprising as the literature hardly
147
SMETS, Kaat (2010), A Widening Generational Divide? Assessing the Age Gap in Voter Turnout Between Younger and Older Citizens European University Institute
DOI: 10.2870/15899

5.6. Conclusion and discussion
pays attention to the impact of owning a home on (youth) turnout. Nonetheless,
the result is robust over all models estimated in this chapter.
As far as alternative indicators are concerned, attendance of religious services
and strength of party identification were found to be among the strongest pre-
dictors of youth voter turnout. Next in line are maturation, perceived differences
between the parties and political interest. Turnout at previous elections also plays
a role in turnout decline. Modelling a combination of maturation, resource, mobi-
lization, and campaign-related factors explains the steep decline in turnout among
young British voters before and after 1990. Nonetheless, the most important indi-
cator of youth turnout is the average turnout among older voters. This indicates
that youth turnout patterns largely mirror trends that are going on in the elec-
torate at large.
148
SMETS, Kaat (2010), A Widening Generational Divide? Assessing the Age Gap in Voter Turnout Between Younger and Older Citizens European University Institute
DOI: 10.2870/15899

Chapter 6
Shifting perspectives: the age gapat the aggregate level
In the previous two chapters the age gap in voter turnout has been approached
from an individual level perspective. While voting and abstention are indeed
individual acts, the phenomena are also frequently researched at the aggregate
level. In this chapter the focus shifts from the individual to the aggregate level. In
doing so it aims to assess explanations for the age gap in voter turnout not only
in a longitudinal but also in a country-comparative way. Using time-series cross-
sectional analysis, the impact of both characteristics of voters and characteristics
of elections on the age gap are assessed. As throughout earlier chapters of this
thesis, the later maturation hypothesis will once again take a central position. By
changing the level of analysis, the robustness of the hypothesis can be examined.
This chapter starts with a summary of trends in the age gap. Subsequently,
the literature will be reviewed to see what aggregate level indicators can possibly
explain over time trends in the turnout difference between younger and older vot-
ers. After describing the data and discussing methodological issues, hypotheses
will be assessed using time-series cross-section analyses. Based on data for 106
149
SMETS, Kaat (2010), A Widening Generational Divide? Assessing the Age Gap in Voter Turnout Between Younger and Older Citizens European University Institute
DOI: 10.2870/15899

6.1. A summary of trends in the age gap
elections in 10 countries, the analyses in this chapter show that both characteris-
tics of voters and characteristics of elections play a role in trends in the age gap
in voter turnout.
6.1 A summary of trends in the age gap
This thesis departed from the observation that in Canada and Great Britain
turnout levels among young adults are declining much more rapidly than the
turnout levels of older age groups. Consequentially, the age gap in voter turnout in
these countries is widening. In chapter three it was established that the trend to-
wards a widening generational divide is not generic. Figure 6.1 summarizes trends
in the age gap voter turnout in two graphs: one for countries with an ever bigger
growing gap and one for countries in which the age gap is relatively stable or shows
no observable trend. The age gap is defined as the difference between the aver-
age turnout level of younger (aged ≤35 years) and older voters (aged >35 years).
Notice, however, that throughout this chapter - as opposed to chapter three - the
more positive the score, the larger the turnout difference, and the higher the age
gap.
From the ten advanced industrial democracies for which continuous election
studies are available, there are five countries that have experienced a widening of
the age gap throughout the years: Canada, Denmark, Great Britain, Norway, and
the United States. The pattern of over-time trends was, however, not identical in
all five countries. In both Norway and Great Britain the age gap was relatively
stable until the 1990s, whereas after this year the turnout differences between
younger and older voters started to increase. In Canada, the widening trend set
in about a decade earlier than in Norway and Great Britain. In Denmark, the
150
SMETS, Kaat (2010), A Widening Generational Divide? Assessing the Age Gap in Voter Turnout Between Younger and Older Citizens European University Institute
DOI: 10.2870/15899

Figure 6.1: The age gap in turnout for ten Western democracies, 1960s-2000s
151
SMETS, Kaat (2010), A Widening Generational Divide? Assessing the Age Gap in Voter Turnout Between Younger and Older Citizens European University Institute
DOI: 10.2870/15899

6.1. A summary of trends in the age gap
difference in turnout between younger and older voters has also widened over
time. The gap is, however, smaller than in the other four countries. In the United
States, lastly, the widening of the age gap was more gradual and the trend line
therefore shows a relatively linear pattern.
Finland is an outlier in the set of countries under research here.29 First of all,
turnout differences between younger and older voters reached a peak between the
1970s and 1990, which is earlier than the increase in the age gap in voter turnout
found in any of the other countries. Another way in which Finland is an extreme
case is in the non-linearity of the over-time trend. The age gap widens from the
early 1970s to the early 1990s, but after this we find that turnout levels among
younger and older voters move in each other’s direction. The difference in turnout
among younger and older voters is still a good 20 percentage points though. In
the last election recorded, the Finnish age gap seems to widen again.
This leaves us with four countries in which the age gap is (relatively) stable over
time: Germany, Italy, the Netherlands and Sweden. In Germany there seems to
be a trend towards a widening of the age gap, however, when drawing a line from
the first to the last data point we find an almost straight line. Italy reportedly has
the smallest age gap of all countries. It repeatedly has years in which the average
turnout of young voters is even higher than the average turnout of older voters.
Sweden and the Netherlands, respectively, hold a place between the Italian and
German extremes.
29The year 1975 is an outlier within an outlier. After weighting for over-reporting in turnout,the average turnout among young voters in this year was over 50 percentage points lower thanamong older citizens. This difference is an effect of a reported turnout of 100% among older vot-ers. The latter distorts the weighting process and I have, therefore chosen to use the unweightedturnout difference for this election year in the subsequent analyses.
152
SMETS, Kaat (2010), A Widening Generational Divide? Assessing the Age Gap in Voter Turnout Between Younger and Older Citizens European University Institute
DOI: 10.2870/15899

Chapter 6. Shifting perspectives: the age gap at the aggregate level
Two questions rise from the findings discussed here: What can explain over-
time trends in the age gap and how do we account for the between-country dif-
ferences? The remainder of this chapter attempts to address these two questions
from an aggregate level perspective.
6.2 Trends in the age gap through time and space:
a theoretical explanation
Voter turnout can be explained by numerous factors. Roughly speaking, char-
acteristics of individuals, societal characteristics, and characteristics of elections
can arguably affect turnout levels (Franklin, 2004; Fieldhouse, Tranmer and Rus-
sell, 2007). Aggregate level research of voter turnout usually focuses on societal
and electoral characteristics as explanatory factors. When it comes to over-time
trends in turnout among young citizens and these young citizens’ share in over-
time trends in the age gap, the characteristics of voters themselves should however
not be over-looked.
6.2.1 Changes in characteristics of voters
In the life-cycle model of political participation it is argued that young adults vote
less than older age groups because they are faced with ‘start-up’ problems: pre-
occupations outside the political sphere that lead to low attachment to civic life.
In terms of the life-cycle theory, turnout decline among young voters indicates that
today’s young people face more or extended start-up problems than their parents
and grandparents did when they grew up (Kimberlee, 2002, p. 87).
153
SMETS, Kaat (2010), A Widening Generational Divide? Assessing the Age Gap in Voter Turnout Between Younger and Older Citizens European University Institute
DOI: 10.2870/15899
6.2. Trends in the age gap through time and space: a theoretical explanation
Throughout this thesis it has been argued that there are reasons to believe that
the shape of the political life-cycle as it has so far been perceived may no longer
fit with reality. Seemingly facing more and/or extended start-up problems than
young people of previous generations, political participation patterns of today’s
youth can be expected to have been affected.
The later maturation hypothesis explains young people’s abstention by arguing
that different generations experience certain life-cycle events at a different average
age. Because this average age has increased overtime, as people stay in school
longer, start their first job later, postpone marriage, put off starting a family, etc.,
a larger proportion of young citizens can be expected to abstain. More sharply
put: if the movement of several characteristics of the political life-cycle to a higher
average age does not translate into changes in turnout patterns of young people,
we would have serious reasons to doubt the over-time validity of the life-cycle
model.
As we saw in the previous chapters, at the individual level later maturation
indeed explains part of the over-time decline in turnout levels among young adults
in Great Britain. The main focus of this chapter is to test validity of the later
maturation hypothesis when it is assessed at the aggregate level. In doing so the
robustness of the hypothesis can be assessed.
6.2.2 Changes in characteristics of elections
Although one of the central claims of this chapter is that characteristics of vot-
ers deserve to be given consideration in aggregate level research on youth voter
turnout, other explanatory factors of turnout change among young adults can be
154
SMETS, Kaat (2010), A Widening Generational Divide? Assessing the Age Gap in Voter Turnout Between Younger and Older Citizens European University Institute
DOI: 10.2870/15899

Chapter 6. Shifting perspectives: the age gap at the aggregate level
identified in the literature. Since over-time movements in the age gap are largely
accounted for by changes in young voters’ turnout levels, these alternative expla-
nations need to be considered as well.
In chapter two of this thesis, the idea of voting as a habit has been addressed.
Contrary to the life-cycle mechanism, in which participation is considered to vary
over the life span, the habitual voting approach contends that people learn the
habit of either voting or non-voting in the early stages of their adult life. Butler
and Stokes (1974) found that after 13 years (i.e. three elections) citizen’s likelihood
to vote for a certain party stabilizes. After this, the chance that someone will vote
for a different party decreases significantly. The same cut-off point can be used
with reference to political participation. People establish the habit of voting or
non-voting within the first three elections they experience, from the fourth election
onwards chances decrease that people will deviate from their habit (Franklin, 2004;
Franklin, Lyons and Marsh, 2004).
In short, in every election certain short term factors are thought to influence
young citizen’s turnout levels more than the turnout levels among older voters as
the latter group has already established a habit to vote or abstain. These short
term factors are related to the features of particular elections. Franklin (2004)
and Franklin, Lyons and Marsh (2004) have repeatedly argued for the importance
of electoral competition in this respect. High stake elections tend to attract more
voters than elections where the outcome already is a foregone conclusion. Measures
of electoral competitiveness such as closeness of the race, margin of the victory,
and party polarization are considered to especially influence young voters that are
not yet set in their political ways (Franklin, 2004, p. 112-114).
155
SMETS, Kaat (2010), A Widening Generational Divide? Assessing the Age Gap in Voter Turnout Between Younger and Older Citizens European University Institute
DOI: 10.2870/15899

6.2. Trends in the age gap through time and space: a theoretical explanation
The idea that the decision (not) to participate in politics is a by-product of the
political system in which people live, is one that is prevalent in the study of voter
turnout. Especially in cross-national research of voting behavior, the political-
institutional context has proven a strong indicator of explaining differences in levels
of voter turnout (see, for example, Gray and Caul, 2000; Norris, 2002; Franklin,
2004). The battery of political and institutional variables used in turnout research
is vast and largely comprises four clusters of variables related to the electoral
system, the party system, legal rules and vote facilitating rules (see Blais and
Dobrzynska, 1998; Blais, Massicotte and Dobrzynska, 2003; Geys, 2006; Blais, 2007
for useful overviews). To what extent can these political-institutional indicators –
apart from the measures of political competitiveness discussed above – be related
to the age gap in voter turnout?30
By far the most often used institutional variable in comparative research of
voter turnout is the electoral system. The idea is that the more proportional
electoral systems are, the higher feelings of efficacy and motivation among voters
will be (Norris, 2002, p. 64; Gray and Caul, 2000, p. 1096). In proportional
systems, as the term suggests, the distribution between the number of votes a party
receives and the allocated number of seats in parliament is much more proportional
than in majoritarian or plurality systems (Geys, 2006, p. 650-651). Since the
translation of votes into seats is so much less precise in these latter two electoral
systems, the number of wasted votes is higher (Evans, 2004, p. 157; Franklin,
2004, p. 15). This, in its turn, decreases the probability of a voter influencing the
outcome of elections.
30Legal rules that determine who can vote or who has to vote (as under compulsory voting)will not be considered here due to a lack of variation in the sample under research.
156
SMETS, Kaat (2010), A Widening Generational Divide? Assessing the Age Gap in Voter Turnout Between Younger and Older Citizens European University Institute
DOI: 10.2870/15899

Chapter 6. Shifting perspectives: the age gap at the aggregate level
However, there is also a mobilisation component to the influence of the elec-
toral system on voter turnout. Under PR systems districts are much more likely
to be competitive, with multiple members running for office. This leads parties
to have a higher incentive to campaign and mobilize people in all districts. In
plurality and majoritarian systems, with their much more common single-member
districts, parties might more easily give up on trying to do so (Blais, 2006, p. 113;
Geys, 2006, p. 651; Evans, 2004, p. 157). Counterarguments are that majoritar-
ian electoral systems are easier to understand for voters. Also, PR systems often
lead to coalition governments, which decreases the probability that a voter’s policy
preferences will be implemented. Nonetheless, numerous studies have confirmed
that voter turnout is indeed higher in more proportional systems (Blais and Carty,
1990, p. 179; Geys, 2006, p. 651).
Many other electoral system or party system indicators used in compara-
tive research on voter turnout can be directly linked to the above discussion.
(Dis)proportionality, district magnitude, district size, and district competitiveness
were already touched upon. The number of parties or candidates was also brought
up. The more parties there are, the higher the number of options a voter will
have, the more likely it is that a voter will find a party he or she can identify
with, and the more parties will mobilise people to turn out and vote. On the other
hand, fractionalisation leads to complexity and increased information costs. Also,
chances of the formation of coalition governments is higher, which in its turn de-
creases the chances that the party of one’s choice will be in government or will be
able to implement its policies (Blais, 2006, p. 118; Geys, 2006, p. 649-650; Evans,
2004, p. 158-159). As can be seen, these are familiar arguments. It is, therefore,
not clear whether it is the electoral system or the party system that plays a role
157
SMETS, Kaat (2010), A Widening Generational Divide? Assessing the Age Gap in Voter Turnout Between Younger and Older Citizens European University Institute
DOI: 10.2870/15899

6.2. Trends in the age gap through time and space: a theoretical explanation
here, since it is widely known that PR systems produce more parties than ma-
joritarian or plurality systems (Norris, 2002, p. 69; Blais, 2006, p. 118). Party
system features, such as, the size of the largest party (i.e. its majority status), the
saliency of elections, polarisation, and whether coalitions are formed, on the same
token have a direct link with the electoral system.
Another group of political institutional variables focuses on the responsiveness
of the political system. Whether the legislature can dismiss the executive (dubbed
executive responsiveness) differs between political systems. In parliamentary sys-
tems the head of government (the prime minister, premier, or chancellor) is se-
lected and can be dismissed by the legislature. In presidential systems, on the
other hand, the head of government is chosen by the people and cannot be sent
home by the representative legislature (Franklin, 2004, p. 232; Norris, 2002, p. 72).
Another way to assess the responsiveness of a system is by looking at the number
of legislative chambers a political system has. Where power is shared between
two chambers, the lower house will have a less decisive role because it does not
take decisions single-handedly (Gray and Caul, 2000, p. 1097; Blais, 2000, p. 114).
Also, the greater the party discipline, the higher the transparency for the voter
and the more likely he or she is to turn out to vote.
Vote facilitating rules, lastly, can also be seen as institutional measures to
motivate and mobilise people. Examples are holiday or weekend voting; postal,
proxy, advance, or e-voting; the placement of special polling booths (for example
in/around shopping centres); and spreading elections over a couple of days. All
these provisions are aimed at lowering the costs of voting.
Since political institutional features – other than short term factors related to
electoral competitiveness – are known to be particularly stable over time, it is
158
SMETS, Kaat (2010), A Widening Generational Divide? Assessing the Age Gap in Voter Turnout Between Younger and Older Citizens European University Institute
DOI: 10.2870/15899

Chapter 6. Shifting perspectives: the age gap at the aggregate level
difficult to relate them to over-time trends in the age gap. Also, both younger and
older voters need to deal with the same provisions. Nonetheless, electoral system
features, party system features, and vote facilitating rules may account for some of
the between-country differences and will therefore be included as control variables.
Although short term characteristics of elections can be argued to influence
the age gap in voter turnout, most other political institutional variables are not
expected to do so. Systemic features such as proportionality and responsiveness of
the electoral system, as well as vote facilitating rules are exceptionally stable over
time. Hence, it is difficult to see how these factors should influence the turnout
changes among young voters that cause movements of the age gap.
6.2.3 Hypotheses
Summarizing, two core hypotheses can be identified to explain over-time differences
in the age gap. The first focuses on differences in the timing at which different
generations face life-cycle events that are considered to boost political participa-
tion. The second hypothesis explains the turnout difference between younger and
older voters by focusing on short term characteristics of elections. These short
term influences – mainly measures of electoral competitiveness – are thought to
particularly influence the turnout patterns of young adults as they are not yet set
in their political ways. The following hypotheses will be assessed:
- Hypothesis 1: The later young adults mature, the wider the age gap.
- Hypothesis 2: The more competitive elections are, the smaller the age gap.
159
SMETS, Kaat (2010), A Widening Generational Divide? Assessing the Age Gap in Voter Turnout Between Younger and Older Citizens European University Institute
DOI: 10.2870/15899

6.3. Data and methods
Because political institutional indicators play such a vital role in explaining
between-country differences in voter turnout, electoral system features, party sys-
tem features, and vote facilitating rules will be modelled in the analyses presented
below. The following hypotheses are assessed regarding the relationship of these
factors with the age gap in voter turnout:
- Hypothesis 3: The more proportional an electoral system is, the smaller theage gap.
- Hypothesis 4: The more responsive a political system is, the smaller the agegap.
- Hypothesis 5: The more vote facilitating rules, the smaller the age gap.
Since the main interest of this thesis is in assessing the validity of the later
maturation hypothesis, characteristics of elections will mostly be treated as control
factors. Especially long term characteristics are expected to explain between-
country differences rather than the age gap.
6.3 Data and methods
6.3.1 Data
The analyses in this chapter are based on an aggregate level data including in-
formation on 112 elections held in ten countries between 1960 and 2006: Canada,
Denmark, Finland, Germany, Great Britain, Italy, the Netherlands, Norway, Swe-
den and the United States. These are the ten Western democracies for which
election studies have more or less continuously been conducted since the 1960s
and 1970s onwards. Election studies were necessary to be able to calculate the
160
SMETS, Kaat (2010), A Widening Generational Divide? Assessing the Age Gap in Voter Turnout Between Younger and Older Citizens European University Institute
DOI: 10.2870/15899

Chapter 6. Shifting perspectives: the age gap at the aggregate level
dependent variable in all analyses: the age gap in voter turnout. This age gap is
calculated by subtracting the average turnout of young voters (aged ≤35 years)
from the average turnout of older voters (aged >35 years) in each election year.
The independent variables used in the analyses presented below come from
different sources. Measures from Franklin (2004) - who kindly made his data set
available - were taken as a point of departure. Maturation is measured through
average years of schooling in the population aged 15 years or over, mean age of
women at first childbirth, and mean age of women (below the age of 50) at first
marriage.
Electoral competition is measured through a number of indicators. Majority
status refers to the difference between the vote share of the largest party and 50
percent. Margin of the victory is measured as the simple difference between the
vote share of the first and the second party. Both measures come from Franklin
(2004) and were supplemented by the record of recent elections published on a
yearly basis in the European Journal of Political Research. Polarization was cal-
culated as the distance between the most left and the most right party position at
the time of the election (see Crepaz, 1990; Franklin, 2004). Party positions were
taken from the Comparative Manifesto’s Project (Budge et al., 2001; Klingemann
et al., 2006).31
A number of indicators take account of electoral system and party system fea-
tures. Electoral systems were classified into proportional or majoritarian/plural/
mixed using the Franklin (2004) data, and where necessary supplemented by
data from the Institute for Democracy and Electoral Assistance (IDEA). Data
31For a discussion of the pro’s and con’s of using the Comparative Manifesto Data to refer toparty positions, I refer to Benoit, Laver and Mikhaylov (2009).
161
SMETS, Kaat (2010), A Widening Generational Divide? Assessing the Age Gap in Voter Turnout Between Younger and Older Citizens European University Institute
DOI: 10.2870/15899

6.3. Data and methods
on (dis)proportionality was taken from Gallagher and Mitchell (2008) who use the
least suares measure of disproportionality between votes and seats as defined by
Laakso and Taagepera (1979). The same source was consulted for the measure of
effective number of parties (ENEP).
Responsiveness of the electoral system is measured through bicameralism and
party discipline. Both are dichotomous variables: one identifies countries where
power is shared between two houses; the other identifies countries with a strong
party discipline.
The ease of voting through vote facilitating rules, lastly, is measured through
the presence or absence of mail, advance and proxy voting. The variable assumes
the value 0 when none of the options is available, 0.33 when one option is available,
0.66 when two options are available and 1 when all three are available (see Blais,
Massicotte and Dobrzynska, 2003). Appendix D contains a description of the
variables used for the analyses in this chapter as well as refers to their origin.
6.3.2 Methodological issues
The nature and complexity of the data used in this chapter supposes several prob-
lematic features. Time-series cross-sectional (TSCS) data is characterized by re-
peated observations in fixed units. For the data used here, the countries are the
units and the elections that take place within those countries are the repeated ob-
servations. The spatial and temporal properties of the data make that we should
be careful to use techniques such as ordinary least squares (OLS) regression anal-
ysis, because assumptions regarding the independence and distribution of errors
for this method are likely to be violated. Violation of assumptions makes OLS
162
SMETS, Kaat (2010), A Widening Generational Divide? Assessing the Age Gap in Voter Turnout Between Younger and Older Citizens European University Institute
DOI: 10.2870/15899

Chapter 6. Shifting perspectives: the age gap at the aggregate level
inefficient, but more importantly, it increases the risk of incorrect standard errors
being reported (Baum, 2006; McDaniel, 2007).
Three types of errors may occur (for a discussion see Stimson, 1985; Beck and
Katz, 1995; Beck, 2001; Baum, 2006). The first is panel heteroskedasticity, mean-
ing that the variance of the errors may differ from country to country. Secondly,
we run the risk of temporal correlation. The width of the age gap usually does
not differ too much from year to year within a country. In accordance with the
idea that past behavior predicts present behavior, much of the age gap at a given
election can therefore be predicted from magnitude of the age gap at previous at
the previous election (Franklin, 2004, p. 126). Lastly, spatial correlation can cause
problems. This occurs when errors for one country are correlated with the errors
for other countries.
Over the past decades, several methods have been developed to deal with time-
series cross-sectional data. The problem of panel heteroskedasticity will be dealt
with by calculating panel corrected standard error’s. This is done based on the
assumption that the disturbances are by default heteroskedastic and contempora-
neously correlated across panels. Temporal and spatial correlation, moreover, can
be modelled by including dichotomous variables tracking the different periods and
countries (Beck, 2001, p. 1261). This least squares dummy variable estimation,
also known as fixed effects, allows for unit heterogeneity in the intercepts, while
‘fixing’ country differences in the estimation of the parameters of the independent
variables. Fixed effects models thus assume that slope coefficients are constant
over both units and time (Baum, 2006, p. 220). Because tests for first order se-
rial correlation (Wooldridge, 2002, p. 282-283; Drukker, 2003) indicate that such
temporal correlation is indeed a problem in the data, Prais-Winsten models are
163
SMETS, Kaat (2010), A Widening Generational Divide? Assessing the Age Gap in Voter Turnout Between Younger and Older Citizens European University Institute
DOI: 10.2870/15899

6.4. Results
estimated. This transformation allows the estimation of time-series regressions in
the presence of auto-correlated errors (Stata Corporation, 2007a, p. 337-338).
Post-estimation tests for autocorrelation and panel heteroskedasticity will be
used to compare the behaviour of the different models estimated in this chapter.
6.4 Results
The analyses in this section serve two aims. After summarizing trends in the age
gap through time and space in the beginning of this chapter, two research questions
were identified: What can explain over-time trends in the age gap and how do
we account for the between-country differences? Two potential explanations for
over-time movements of the age gap were discerned from the literature. The first
focusses on differences in life-cycle patterns between generations, the second on the
competitiveness of elections. To single out between-country differences, electoral
system features, party system features, and vote facilitating rules are modelled as
well.
In order to track over-time changes in the age gap, a time trend variable was
created. This trend variable ranges from 0 for the first available election in a
country to 1 for the last available election in a country. For example, if there are
11 election years in a country, the first year is coded as 0, the next year as .1,
the tenth year as .9 and the last year as 1, etc. If independent variables in the
regression model explain over-time trends perfectly, this trend variable should be
explained away.
Since the Comparative Manifesto Data set used to calculate the polarization
of the party system – with the exception of the UK – runs to 2003, the analyses
164
SMETS, Kaat (2010), A Widening Generational Divide? Assessing the Age Gap in Voter Turnout Between Younger and Older Citizens European University Institute
DOI: 10.2870/15899

Chapter 6. Shifting perspectives: the age gap at the aggregate level
in this section comprise elections up until this election year only. This means the
base sample size is reduced from 112 to 106 elections.
Two models are presented in this this section. Table 6.1 gives the results
of GLS regression models with panel corrected standard errors that are further
corrected for time-serial dependencies. The models also include country dummies
as excluding these leads to models that are heteroskedastic (analyses not shown
here). Table 6.2 shows models estimated in a similar fashion to those in table 6.1
this time including a lagged dependent variable. In both cases, the Netherlands is
chosen as the reference category with regard to the country dummies because it
holds a median position with reference to trends in the age gap. If independent
variables in the model explain between-country differences in trends in the age
gap, the country dummies should become statistically insignificant.
Although estimated with slightly different techniques both tables include the
same models. Model 1 only includes the time trend variable and country dum-
mies. It is the base model against which all later models can be compared. In
a second step, maturation variables are added to the model. The next model,
model 3, includes measures of political competitiveness. In the last model (model
4) electoral system features, party system features, and vote facilitating rules are
added. This latter group of variables mostly serves as control and is expected to
explain between-country differences rather than the age gap.
Model one in table 6.1 shows the time trend variable to be positive and signif-
icant. This is as expected. Although not all countries evidenced the exact same
trend, overall, the age gap in turnout has widened. Adding maturation indicators
in model two results in two positive and significant variables. Both average years
of schooling and average age at first childbirth have the expected effect on the age
165
SMETS, Kaat (2010), A Widening Generational Divide? Assessing the Age Gap in Voter Turnout Between Younger and Older Citizens European University Institute
DOI: 10.2870/15899

model 1 model 2 model 3 model 4b/(se) b/(se) b/(se) b/(se)
Time trend 8.212*** -1.653 -1.298 -1.332(0.953) (2.849) (2.840) (2.808)
Average years of schooling 1.624*** 1.689*** 1.694***(0.516) (0.515) (0.560)
Average age at 1st child 1.241* 1.106* 1.118*(0.654) (0.661) (0.639)
Majority status 0.039 0.074(0.122) (0.168)
Margin of the victory 0.064 0.069(0.078) (0.078)
Polarisation 0.016 0.012(0.051) (0.053)
PR-system 0.000(0.000)
Disproportionality 0.028(0.069)
Eff. number of parties -0.255(1.047)
Bicameralism -41.276**(16.185)
Party discipline 6.644(4.955)
Ease of voting -0.764(19.452)
Canada 5.167** 4.173* 3.677 3.304(2.212) (2.269) (2.519) (2.664)
Denmark -3.198 -1.857 -2.945 -44.233***(2.442) (2.832) (2.970) (15.321)
Finland 9.377*** 11.312*** 10.838*** -30.498*(3.604) (3.498) (3.420) (15.770)
Germany -5.281** -5.184** -5.050** -5.146**(2.347) (2.392) (2.494) (2.577)
Italy -9.519*** -6.303** -6.548** 0.000(2.519) (2.660) (2.617) (0.000)
Norway 3.118 5.291* 4.332 4.351(2.598) (2.837) (2.965) (2.937)
Sweden -3.331 -3.108 -4.237 -4.141(2.264) (2.397) (3.021) (3.018)
United Kingdom 6.463** 9.677*** 9.655*** 9.220***(2.800) (3.091) (3.184) (3.314)
United States 8.128*** 8.330*** 8.417** 14.367***(2.236) (3.133) (3.399) (5.370)
Constant 5.573*** -36.798** -35.267** 0.000(1.817) (16.224) (15.957) (0.000)
R2 0.580 0.620 0.641 0.644χ2 405.9 419.1 485.0 531.7p 0.000 0.000 0.000 0.000ρ .257 .239 .206 .199Breusch-Godfrey test (3 df) 9.20** 9.58** 9.42** 9.2**ARCH test (3 df) 4.03 5.17 5.32 4.94N 106 106 106 106
note: b coefficients from Prais-Winsten analysis with pcse in parentheses;reference category: the Netherlands; * p<0.10, ** p<0.05, *** p<0.01
Table 6.1: Modelling the age gap in voter turnout (without lagged dependentvariable), 1960s-2000s
166
SMETS, Kaat (2010), A Widening Generational Divide? Assessing the Age Gap in Voter Turnout Between Younger and Older Citizens European University Institute
DOI: 10.2870/15899

Chapter 6. Shifting perspectives: the age gap at the aggregate level
gap. The higher the number of years citizens spends in school, the wider the age
gap. On the same token, the higher the average age at first childbirth, the wider
the age gap. Because mean age of marriage and mean age at childbirth are highly
correlated (r=.83) they were not modelled simultaneously.32
In model three, indicators of electoral competitiveness are added. None of the
measures modelled reaches statistical significance. Although majority status, mar-
gin of the victory and polarization have been shown to be related to turnout in
general, the model presented here provides no evidence that these variables are
related to the turnout differences between younger and older voters as well. Hy-
pothesis two, therefore, needs to be rejected. Analyses not presented here show
that modelling competitiveness measures alone (i.e. without indicators of matu-
ration) does not change much, although the majority status variable does reach
statistical significance. Analyses in appendix D show that majority status does
have an impact on levels of turnout among older voters (see model 3 in table D.3).
Including electoral system features, party system features, and vote facilitating
rules in model four, does not change anything about the findings in the previous
models. The maturation indicators are still statistically significant, unlike the mea-
sures of electoral competitiveness. Interestingly enough, the dichotomous variable
identifying countries with a proportional electoral system, is dropped from the
model due to collinearity. Most likely the lack of variance between the country
dummies and the electoral system variable plays a role here.
The only additional variable turning up statistically significant in model 4 is
bicameralism. The variable has an unexpected direction, however. Where power is
32Analyses not presented here (see table D.1 in appendix D) show that mean the mean ageat the first marriage does not reach statistical significance if it is modelled instead of the meanage at first childbirth. The electoral system – instead – does reach statistical significance.
167
SMETS, Kaat (2010), A Widening Generational Divide? Assessing the Age Gap in Voter Turnout Between Younger and Older Citizens European University Institute
DOI: 10.2870/15899

6.4. Results
shared between two legislative chambers, turnout is expected to be lower, since the
lower house is assumed to play a less decisive role in decision-making. Although
this goes for both younger and older voters, low turnout among young voters results
in a wider age gap. According to model four, however, the presence of a bicameral
system leads to a smaller age gap. Perhaps not too much should be made of these
results as the variable can also be seen as a dummy variable singling out Denmark
and Finlandsince these are the only two countries with a unicameral system.
The measure comprising vote facilitating rules shows to be negatively related
to the age gap. The more voting is facilitated, the smaller the age gap. This
is following our expectations: however, the variable does not manage to reach
statistical significance here.
As far as the between-country differences are concerned, each subsequent model
seems to do a better job at explaining these. The last model including electoral
system features, party system features, and vote facilitating rules does the best
job as this model shows the largest amount of non-significant country dummies of
all the models presented in table 6.1.
Focussing on model fit and post-estimation test, we see that the explained
variance between the four different models does not differ greatly. The R2 goes
up from .58 to .64 from model one to model four. Panel corrected standard errors
and country-dummies take care of the heteroskedastic nature of the data as is
indicated by the ARCH tests that show none of the models has significant problems
of this kind (Kennedy, 2003, p. 147). The Durbin-Watson test for first-order
autocorrelation (as indicated by ρ) indicates the absence of such a problem (see
Baum, 2006, p. 156-157). The Breusch-Godfrey test, on the other hand, does
168
SMETS, Kaat (2010), A Widening Generational Divide? Assessing the Age Gap in Voter Turnout Between Younger and Older Citizens European University Institute
DOI: 10.2870/15899

Chapter 6. Shifting perspectives: the age gap at the aggregate level
indicate problems with higher order autocorrelation (Kennedy, 2003, p. 149; Baum,
2006, p. 156).
Although coefficients remain unbiased in the presence of autocorrelation, this
violation of assumptions does render the estimated standard errors to be biased.
This leads to an increased chance of rejecting the null hypothesis even if it is in
fact true (type I error). In order to try to get a grip on this problems, the models
in table 6.1 are estimated again this time adding a lagged dependent variable to
the right hand side of the regression equation. This models are shown in table 6.2.
Starting with the post-estimation statistics, we see that including a lagged de-
pendent variable solves the problem of higher order autocorrelation. The Breusch-
Godfrey test statistics indicate that the margin of error is 5%, which is reasonable
given the sample size.
Comparing coefficients between the models in table 6.1 and table 6.2, we see
that the variable measuring the average age of women at the birth of their first
child looses significance after the inclusion on measures of electoral competitiveness
in model 2. Bicameralism no longer reaches statistical significance when modelled
alongside a lagged dependent variable (model 4). Apart from these two exceptions,
none of the other variables included in the models of table 6.1 changes statistical
significance with the inclusion of a lagged dependent variable on the right hand
side.
Somewhat surprising perhaps, the lagged dependent variable does not turn up
statistically significant. This is most likely due to the fact that the time trend
variable and the previous age gap variable overlap.
Just as in table 6.1 the time trend variable looses statistical significance after
the inclusion of the later maturation variables. Moreover, between-country differ-
169
SMETS, Kaat (2010), A Widening Generational Divide? Assessing the Age Gap in Voter Turnout Between Younger and Older Citizens European University Institute
DOI: 10.2870/15899

model 1 model 2 model 3 model 4b/(se) b/(se) b/(se) b/(se)
Time trend 7.079*** -1.016 -0.395 -0.332(1.511) (3.570) (3.595) (3.584)
Average years of schooling 1.070** 1.117** 1.299**(0.536) (0.534) (0.563)
Average age at 1st child 1.296* 1.131 1.039(0.706) (0.762) (0.745)
Majority status 0.010 0.186(0.128) (0.172)
Margin of the victory 0.068 0.117(0.079) (0.079)
Polarisation 0.018 0.008(0.054) (0.056)
PR-system 0.000(0.000)
Disproportionality 0.005(0.064)
Eff. number of parties -1.320(1.083)
Bicameralism 2.500(5.427)
Party discipline 6.238(4.877)
Ease of voting -7.120(20.396)
Previous age gap 0.230 0.136 0.145 0.192(0.150) (0.154) (0.154) (0.159)
Canada 4.834** 5.004** 4.085* 2.976(1.926) (2.075) (2.440) (2.602)
Denmark -1.575 -0.084 -1.366 0.000(2.168) (2.596) (2.806) (0.000)
Finland 8.323** 10.753*** 10.285*** 11.880***(3.498) (3.786) (3.812) (4.087)
Germany -3.638 -3.691 -3.874 -4.112(2.297) (2.444) (2.652) (2.721)
Italy -7.456*** -6.261** -6.477** 0.000(2.788) (2.711) (2.770) (0.000)
Norway 4.137** 6.514** 5.178* 4.937*(1.871) (2.538) (2.829) (2.732)
Sweden -2.228 -1.772 -3.418 -3.465(2.054) (2.244) (2.917) (2.804)
United Kingdom 6.028** 9.790*** 9.224*** 8.214**(2.457) (3.116) (3.276) (3.449)
United States 7.644*** 9.934*** 9.367*** 13.655**(2.004) (3.022) (3.398) (5.652)
Constant 3.196* -35.782* -33.002* -34.729*(1.677) (18.466) (19.217) (19.022)
R2 0.695 0.696 0.707 0.715χ2 1853.2 51.1 1787.1 67.7p 0.000 0.000 0.000 0.000Breusch-Godfrey test (3 df) 4.49 6,86* 7,00* 7,46*ARCH test (3 df) 5.35 4,49 4,75 4,48N 96 96 96 96
note: b coefficients from Prais-Winsten analysis with pcse in parentheses;reference category: the Netherlands; * p<0.10, ** p<0.05, *** p<0.01
Table 6.2: Modelling the age gap in voter turnout (with lagged dependent vari-able), 1960s-2000s
170
SMETS, Kaat (2010), A Widening Generational Divide? Assessing the Age Gap in Voter Turnout Between Younger and Older Citizens European University Institute
DOI: 10.2870/15899
Chapter 6. Shifting perspectives: the age gap at the aggregate level
ences seem to be affected mostly by systemic variables as is indicated by some of
the country dummies loosing statistical significance in model 4.
The results in this chapter provide support for the later maturation hypothesis
also when it is assessed at the aggregate level. Nonetheless, there are several rea-
sons why we should be careful not to exaggerate in the interpretation of the findings
from this chapter. First, the later maturation hypothesis is assessed through solely
two indicators. In an ideal situation indicators of average age at first home own-
ership, average age when leaving the parental home, average age at first full time
job, etc. should also be included in the analyses. Future research could focus on
attempting to gather such information in a cross-country and cross-time fashion.
A second word of caution is related to the relatively low n of this study. Even
though all information on the age gap that seems to be available at this point in
time is included in this chapter, increasing the sample size would boost confidence
in the results.
6.5 Conclusion and discussion
Recent research suggests that in some countries, such as Canada and Great Britain,
turnout among young adults is declining rapidly. It does so at a much faster pace
than the turnout decline among older voters. As a result, the age gap in voter
turnout becomes wider. Chapter three of this thesis already showed that the trend
towards a widening generational divide is not generic. Using national elections
studies conducted between the 1960s-1970s and 2006, this earlier chapter showed
that five out of ten countries under research evidence a widening of the age gap:
Canada, Denmark, Great Britain, Norway, and the United States. The pattern
171
SMETS, Kaat (2010), A Widening Generational Divide? Assessing the Age Gap in Voter Turnout Between Younger and Older Citizens European University Institute
DOI: 10.2870/15899

6.5. Conclusion and discussion
of over-time trends was, however, not exactly identical in all five countries, and
differed both in magnitude and with regard to the time point in which the age
gap began to widen. From the remaining five countries, four – Germany, Italy, the
Netherlands and Sweden – showed a (relatively) stable difference in turnout levels
among younger and older voters. Finland, lastly, showed a pattern of its own with
an age gap that is both high in magnitude and goes both up and down over time.
These descriptive findings prompt two questions: What can explain over-time
trends in the age gap and how do we account for the between-country differences?
Taking the literature on age differences in political participation as a point of
departure, two core hypotheses were identified. The first focused on characteristics
of voters, by arguing that the political life-course differs between generations. Due
to higher educational levels, young people nowadays spend more time in school,
have extended co-habitation with – as well as longer financial dependence on –
their parents, and consequently face postponed full entry into the labour market.
This trend towards later maturation – in terms of the life-cycle model – should
result in lower turnout among young voters and can therefore be argued to explain
the widening of the age gap.
The second hypothesis focused on characteristics of elections. Rooted in the
idea that voting is a habit acquired in early adulthood, short term factors such
as electoral competitiveness arguably have an impact on turnout levels of young
citizens. The higher the stake in the elections, the more likely it is that young
adults will be prompted to turn out to vote. Older voters, however, are considered
more immune to such factors as they have already established the habit to vote
or abstain. Since movements of the age gap are largely accounted for by changes
172
SMETS, Kaat (2010), A Widening Generational Divide? Assessing the Age Gap in Voter Turnout Between Younger and Older Citizens European University Institute
DOI: 10.2870/15899

Chapter 6. Shifting perspectives: the age gap at the aggregate level
in young voter’s turnout levels, characteristics of elections could explain trends in
the age gap.
Based on data on 106 elections held in Western democracies between the 1960s-
1970s and 2003, this chapter shows that later maturation indeed has a positive
effect on the age gap. The later young people mature, the larger the turnout
difference between younger and older voters. Measures of electoral competitiveness
were, however, not found to have a significant effect on the age gap. The political-
institutional context, lastly, was found to reduce between-country differences.
This chapter, thus, provides support for a novel hypothesis explaining turnout
decline among young voters and turnout differences between young adults and
older voters. Fully rooted in the life-cycle and cohort/generation models of political
participation, the later maturation hypothesis makes a case for linking the effects of
a postponement in the time at which life-cycle events are experienced to a decline
in political participation among young voters. Individual level findings can now
be strengthened with results from aggregate level analyses. What weight should
exactly be given to the results from the individual level and the aggregate level
analyses is something that will be touched upon in the concluding chapter.
173
SMETS, Kaat (2010), A Widening Generational Divide? Assessing the Age Gap in Voter Turnout Between Younger and Older Citizens European University Institute
DOI: 10.2870/15899

6.5. Conclusion and discussion
174
SMETS, Kaat (2010), A Widening Generational Divide? Assessing the Age Gap in Voter Turnout Between Younger and Older Citizens European University Institute
DOI: 10.2870/15899

Chapter 7
Conclusion and discussion
That young people turn out at lower levels than older voters is a well-established
fact. Literature from the first half of this decade suggests, however, that in some
countries the turnout difference between younger and older voters has increased.
This widening of the age gap is caused by rapidly declining turnout levels among
young voters. Although turnout decreases among older voters as well, the pace
with which the younger half of the electorate abstains is much higher.
The trends described are well-documented for Canada and the literature sug-
gests that similar patterns in age differences in voter turnout are apparent in Great
Britain. Whether other advanced industrial democracies have experienced simi-
lar changes in the turnout difference between younger and older voters – up until
now – was not clear however. Moreover, systematic research on what factors can
account for these over-time differences in the age gap was lacking. Starting from
these observations this thesis has aimed to answer the following central research
question: What are the trends in the age gap in voter turnout between younger
and older citizens, and how can these trends be explained?
Using the above-mentioned Canadian research as a point of departure, several
sub-questions were identified. The first interest of this thesis was to see whether
175
SMETS, Kaat (2010), A Widening Generational Divide? Assessing the Age Gap in Voter Turnout Between Younger and Older Citizens European University Institute
DOI: 10.2870/15899

we could find evidence of a widening generational divide in other advanced indus-
trial democracies besides Canada. If so, was this pattern also caused by rapidly
declining turnout levels among young people? Moreover, what could explain that
contemporary youth turns out at much lower levels than their parents and grand-
parents did when they were young? Possible between-country differences in the
gap were considered as well.
In order to assess trends in the age gap in voter turnout, this thesis has sought
explanation in both characteristics of voters and characteristics of elections. Par-
ticular attention was paid to a novel explanation to youth turnout decline: the
later maturation hypothesis. Young people’s abstention from politics is often ex-
plained by the fact that in early life people face obstacles that prevent them from
becoming integrated in society, getting involved in socio-political affairs, and – as
a result –participating in politics. As people leave education, leave the parental
home, start their first jobs, get married, have children, and settle down, citizens
are almost naturally expected to make it to the polling booth.
Over the years, all life-cycle events mentioned are, however, known to have
moved to a higher average age. This delay in experiencing certain life-cycle events
should have consequences for youth voter turnout. Although fully rooted in widely
used theories to explain age differences in voter turnout, the idea that the way in
which people age or mature has changed through time has – to my knowledge –
never been linked to youth turnout decline before. In this thesis the later matu-
ration hypothesis has been put to the test, contrasted with other explanations of
youth turnout decline, and has been assessed at different levels of analysis.
176
SMETS, Kaat (2010), A Widening Generational Divide? Assessing the Age Gap in Voter Turnout Between Younger and Older Citizens European University Institute
DOI: 10.2870/15899
Chapter 7. Conclusion and discussion
7.1 Findings
Starting with the first part of the central research question of this thesis, chapter
three focused on describing trends in the age gap in voter turnout. Using election
studies data from ten Western democracies, the most notable finding was the
variety in trends in the age gap between countries. Half of the countries shows
signs of an over-time widening of the turnout gap between younger and older
voters. Four countries, on the other hand, show to have a fairly stable or even a
remarkably stable age gap. Overtime trends in one country – Finland – do not fit
any of the above descriptions. Here the age gap is found to be both highly volatile
through time and large in magnitude. The fact that the age gap is stable in some
countries does not necessarily suggest that overall turnout levels do not go down
in these countries. It simply means that the turnout levels of younger and older
voters move in the same direction and at the same rate. Nonetheless, the age gap
is usually larger in countries that have lower general turnout levels.
Turnout patterns of younger and older voters were largely found to move into
the same direction. Young people’s turnout levels, however, usually represent a
magnified picture of turnout trends in the electorate at large. It are these magnified
turnout patterns that cause the age gap to widen or to narrow. Although starting
levels of turnout were not found to drop with every new incoming cohort, there
indeed seems to be a trend towards a decline in entry turnout levels of cohorts.
Overall, the findings from the third chapter prompt three questions: What causes
the age gap to widen? Why do incoming cohorts turn out at ever lower levels?
What can explain why we observe differences in trends in the age gap from one
country to the other?
177
SMETS, Kaat (2010), A Widening Generational Divide? Assessing the Age Gap in Voter Turnout Between Younger and Older Citizens European University Institute
DOI: 10.2870/15899

7.1. Findings
Focusing on the first two questions, chapter four of this thesis attempted to
provide the best possible test of the later maturation hypothesis. Based on data
from the British Elections Studies from 1964 to 2005, it was first established that
a larger proportion of young people nowadays indeed has not experienced all life-
cycle events that are characteristic for making the transition from the first to the
second stage of the political life-cycle. Although the impact of later maturation
on youth turnout decline should not be blown out of proportion, maturation was
consistently found to be a strong predictor of turnout among young adults. Mat-
uration has a positive effect on turnout of young voters. A smaller proportion of
‘mature’ young adults, thus, leads to lower turnout levels among this age group.
In other words, maturation has always played a role in youth voter turnout. The
impact of maturation on youth turnout has not changed through time. What has
changed are the levels of maturation.
From the different life-cycle events measured there was one that behaved counter-
hypothetically. In the literature, being in education is one of the ‘start-up’ prob-
lems frequently mentioned to keep young people away from the polling booth.
Leaving education should thus boost turnout levels. Instead, this thesis showed
that leaving education is negatively related to turnout. This finding is in line with
earlier research that puts the relationship between student status and voting to
the test. Home ownership, being married or cohabiting, and having a job were
also found to be positively related to youth voter turnout with the first variable
playing the largest role from all life-cycle events mentioned. Residential stabil-
ity and having children were not found to be significantly related to youth voter
turnout. Residential stability, however, mostly plays a role in countries where
voter registration is in the hands of the electorate. This is not the case in Great
178
SMETS, Kaat (2010), A Widening Generational Divide? Assessing the Age Gap in Voter Turnout Between Younger and Older Citizens European University Institute
DOI: 10.2870/15899

Chapter 7. Conclusion and discussion
Britain as voter registration is a responsibility of the authorities. The fact that
having children was found not to play a role in youth voter turnout can perhaps
be explained by a high correlation with being married and cohabiting.
From all indicators, the average turnout of older voters explains the largest
part of over-time decline in turnout levels among British young voters. This is
not surprising in light of the findings from the descriptive chapter that ups and
downs in turnout of younger and older voters often go hand in hand. The higher
turnout levels among older voters, the higher turnout among younger voters will
be. The lower turnout levels among older voters, the lower turnout among young
citizens will be. It is also interesting that a combined index of life-cycle events
always outperformed the individual life-cycle indicators. This indicates that it is
the interplay between different life-cycle events that is important rather than their
individual effect.
The next chapter, number five, served two aims simultaneously. The first was
to assess the impact of other explanations than the later maturation hypothesis on
youth voter turnout. By modelling these alternatives against maturation, more-
over, the validity of the later maturation hypothesis was put to the test. Three
groups of variables were taken into account: resource and mobilization variables,
campaign-related variables, and competitiveness variables. Variables from most
groups were found to explain youth voter turnout. Political interest, strength of
party identification, and turnout at the previous elections are especially impor-
tant in this respect. The turnout decline among young British voters after 1990
was best explained by strength of party identification, attendance of religious ser-
vices, later maturation, the perceived differences between the parties, and political
interest.
179
SMETS, Kaat (2010), A Widening Generational Divide? Assessing the Age Gap in Voter Turnout Between Younger and Older Citizens European University Institute
DOI: 10.2870/15899

7.1. Findings
Notwithstanding the impact of other variables on youth voter turnout matu-
ration remained a positive and significant indicator of turnout in all models esti-
mated. In fact, it has consistently been found to be among the most important
explanatory factors of turnout and was found to explain over 7% of the turnout
decline among young voters in Great Britain after 1990.
In the last chapter of this thesis the focus shifted from the individual to the
aggregate level. Because of this, the actual age gap could now be used as a de-
pendent variable. As in the previous chapters, the later maturation hypothesis
was assessed and contrasted with other possible explanations of the age gap. The
latter were mostly indicators of electoral competitiveness. While the life-cycle
event indicators immediately explain away the over-time trends in turnout, elec-
toral competitiveness was found not to influence the turnout difference between
younger and older voters. Between-country differences were best explained by the
political-institutional context.
Comparing results from the individual and aggregate level chapters, there are
several reasons why the findings from the aggregate level chapter should not be
exaggerated. First of all, due to lack of data availability the test of the later
maturation hypothesis is based on fewer indicators than in the individual level
chapter. Ideally other indicators of maturation than average years of schooling
and average age of women at the birth of their first child should be included in the
analyses. Future research should focus on finding time-series cross-section data on
indicators such as average age when leaving the parental home, average age when
starting the first full-time job, and average age when buying the first house. Only
then the individual level and aggregate level analysis become really comparable.
180
SMETS, Kaat (2010), A Widening Generational Divide? Assessing the Age Gap in Voter Turnout Between Younger and Older Citizens European University Institute
DOI: 10.2870/15899

Chapter 7. Conclusion and discussion
Another reason not to stretch the findings from the aggregate level chapter
is the fact that is analyses are based on a relatively small sample. Although all
countries and years for which data was available are included, there are only 106
election-year combinations to work with at the moment. The individual level
studies are – obviously – based on larger sample sizes.
Finally, research outside the framework of this thesis largely confirms the find-
ings in the individual level chapters (see Neundorf, Smets and Garcıa Albacete,
2009). Analysing the impact of life-cycle events on the development of political
interest with a 23 wave panel study, we find that although maturation matters in
general the impact that each event has on the development of political interest
is very low. These results overlap with the findings in chapter four and five that
the separate life-cycle indicators do a worse job at explaining youth voter turnout
than the combination of several life-cycle events.
7.2 Implications
If anything, this thesis once again shows that turnout cannot be predicted by a
single (set of) variable(s). Various factors play a role, but none of these is the fac-
tor explaining why youth voter turnout goes down. Previous studies have failed
to take into account over-time changes in some of the most frequently mentioned
indicators of turnout among younger voters. Highly intuitive, the later matura-
tion hypothesis, deserved attention and empirical assessment. In this thesis it has
been established that the movement of certain life-cycle events to a higher average
age has and has had a negative impact on youth voter turnout. Later matura-
tion is however not the only explanatory factor of youth political participation.
Political interest, strength of party identification, turnout at previous elections,
181
SMETS, Kaat (2010), A Widening Generational Divide? Assessing the Age Gap in Voter Turnout Between Younger and Older Citizens European University Institute
DOI: 10.2870/15899
7.2. Implications
perceived differences between political parties, attendance of religious services,
but also turnout levels among older voters are important explanatory factors of
turnout (decline) among young adults.
What does this imply for the future? As pointed out in figure 4.1, there are two
possible scenarios: either young people will catch up and reach the high turnout
levels of the generations before them, or – along the lines of the habitual voting
approach – abstention in young life will lead to low(er) levels of participation in
later life. The first option is probably a slightly naıve interpretation of the life-
cycle model of political participation. The life-cycle theory argues that turnout
goes up and down when experiencing certain life-cycle events. The literature does
not describe what could or should happen if life-cycle patterns change over-time or
what happens if young people’s starting levels of turnout drop over-time. It is not
difficult to imagine, however, that such trends will have an impact on how the life-
cycle model behaves. If every incoming cohort has lower starting levels of turnout
than the previous one, each new electoral cohort will have to take up turnout levels
by an extra notch while aging in order to catch up with previous generations. This
is not a very plausible scenario, especially not since we established that younger
generations mature at a different pace than older generations did when they were
young.
Do the findings in this thesis imply that turnout levels among the generations
that are now young will always stay low? I believe there is no denying that an
element of habituation plays a role in turnout and I therefore think it is quite
plausible that in countries such as Canada and Great Britain we will find that
general turnout levels will go down because younger cohorts do not catch up. In
fact, I think this is precisely what we have witnessed in these countries. What we
182
SMETS, Kaat (2010), A Widening Generational Divide? Assessing the Age Gap in Voter Turnout Between Younger and Older Citizens European University Institute
DOI: 10.2870/15899

Chapter 7. Conclusion and discussion
will see is most likely in a combination of the two mechanisms. Young people’s
turnout levels will catch up to some extent as they age, but on the other hand the
first electoral experiences are of crucial importance. If turnout is extremely low in
these years, it is almost impossible for cohorts to catch up.
One of the reasons why we worry about youth political participation is because
they give us a glimpse of the future functioning of democracy. Low levels of
participation are problematic with a view to representation and legitimacy. What
could governments do to possibly get more young voters to the polls?
Given that there are various factors that drive young citizens to the polling
booth, we cannot assume that reasons of abstention are the same for all non-
voters. This has implications for the way in which participation can or should
be stimulated. If there is neither a single cause for abstention nor a single factor
explaining youth turnout, then it is unreasonable to hope that one single policy
change will suddenly encourage all young abstainers to turn out to vote.
When it comes to maturation, we saw that having left education and home
ownership were the most influential life-cycle events. Maturation as such is hard
to influence, but life-cycle events can be influenced and stimulated one-by-one.
It is, for example, not unthinkable for a government to come up with ways to
stimulate home ownership among young people. However, the more plausible way
to go about is probably to try to stimulate levels of political interest, make young
people more knowledgeable about politics so that they can better judge differences
between parties, etc. In this respect, I believe it would be interesting to see what a
well thought through civic learning program in light of upcoming elections would
do to boost youth voter turnout. This could possibly be done in combination with
183
SMETS, Kaat (2010), A Widening Generational Divide? Assessing the Age Gap in Voter Turnout Between Younger and Older Citizens European University Institute
DOI: 10.2870/15899

7.2. Implications
lowering the minimum voting age, so that incoming cohorts would be more likely
to face their first election when they are still in school.
Research on the effects of civic education show that students are knowledge-
able about socio-political issues that affect them directly. The amount of civic
education, as well as its recency matter for political knowledge of young citizens.
Moreover, they learn best when a variety of issues is touched upon and when
current events are discussed regularly (Niemi and Junn, 1998).
Since turnout levels of younger and older voters go hand in hand, an alternative
route would be to not only try to increase turnout levels among young voters but
rather aim at the electorate as a whole when attempting to stimulate turnout
levels.
As far as future directions of research are concerned, this thesis shows the need
for more longitudinal data that is aimed at young people specifically. Comparing
young voters to young non-voters is crucial to our understanding of the question
why young citizens abstain. Election survey data as used in this thesis allows for
such a comparison but is simultaneously limited by the fact that young citizens
are often underrepresented in these studies.
Qualitative researchers, moreover, have claim that youth research all too often
focuses on what politicians, political scientists, journalists and the general public
think about politics. The true opinion of young people themselves is ill-grasped in
this way. Although surveys with closed questions allow us to touch upon several
issues, asking young people about their opinion in an open ended framework is also
highly valuable. Our understanding of what drives young citizens to the polling
booth would greatly benefit from mixed-method research.
184
SMETS, Kaat (2010), A Widening Generational Divide? Assessing the Age Gap in Voter Turnout Between Younger and Older Citizens European University Institute
DOI: 10.2870/15899

Appendix A
Description of the data sets used
Several sources were used to construct the data sets with which the analyses inthis thesis were performed. Below follows a concise description of the files thatwere made use of and where they can be found.
Chapter three
National Election Surveys
Canada
• Canadian National Election Study 1965Source: ICPSR study number 7225;http://www.icpsr.umich.edu/cocoon/ICPSR/STUDY/07225.xml
• Canadian Federal Election Study 1968Source: ICPSR study number 7009;http://www.icpsr.umich.edu/cocoon/ICPSR/STUDY/07009.xml
• Canadian National Election Study 1972Source: ICPSR study number 7410;http://www.icpsr.umich.edu/cocoon/ICPSR/STUDY/07410.xml
• Canadian National Election Study 1974Source: ICPSR study number 7379;http://www.icpsr.umich.edu/cocoon/ICPSR/STUDY/07379.xml
185
SMETS, Kaat (2010), A Widening Generational Divide? Assessing the Age Gap in Voter Turnout Between Younger and Older Citizens European University Institute
DOI: 10.2870/15899

• Canadian National Elections and Quebec ReferendumPanel Study 1974-1979-1980Source: ICPSR study number 8079;http://www.icpsr.umich.edu/cocoon/ICPSR/STUDY/08079.xml
• Canadian Election Study 1984Source: Institute for Social Research; http://www.isr.yorku.ca/home.html
• Canadian Election Study 1988Source: Institute for Social Research; http://www.isr.yorku.ca/home.html
• Canadian Election Study 1993Source: Institute for Social Research; http://www.isr.yorku.ca/home.html
• Canadian Election Study 1997Source: http://ces-eec.mcgill.ca/
• Canadian Election Study 2000Source: http://ces-eec.mcgill.ca/
• Canadian Election Study 2004Source: http://ces-eec.mcgill.ca/
Denmark
• Cumulative file 1971-1998Source: European Voter Database, Zentralarchiv (see Thomassen, 2005);https://info1.za.gesis.org/cei/evoter.asp
Finland
• Finnish Voter Barometers 1973-1990: Combined DataSource: Finnish Social Science Data Archive (FSD 2276);http://www.fsd.uta.fi/english/data/background/elections.html
• Finnish National Election Study 1991Source: Finnish Social Science Data Archive (FSD 1018);http://www.fsd.uta.fi/english/data/background/elections.html
• Finnish Voter Barometer August-September 1996Source: Finnish Social Science Data Archive (FSD 1032);http://www.fsd.uta.fi/english/data/background/elections.html
186
SMETS, Kaat (2010), A Widening Generational Divide? Assessing the Age Gap in Voter Turnout Between Younger and Older Citizens European University Institute
DOI: 10.2870/15899

Appendix A. Description of the data sets used
• Parliamentary Elections 1999Source: Finnish Social Science Data Archive (FSD 1042);http://www.fsd.uta.fi/english/data/background/elections.html
• Finnish National Election Study 2003Source: Finnish Social Science Data Archive (FSD 1260);http://www.fsd.uta.fi/english/data/background/elections.html
Germany
• Cumulative file 1969-1998Source: European Voter Database, Zentralarchiv (see Thomassen, 2005);https://info1.za.gesis.org/cei/evoter.asp
• German Election Study 2002Source: Comparative Study of Electoral Systems database;http://www.cses.org
Great Britain
• Cumulative file 1964-2001Source: European Voter Database, Zentralarchiv;https://info1.za.gesis.org/cei/evoter.asp
• British Election Study 2005Source: http://www.essex.ac.uk/bes/Default.htm
Italy
• Italian National Election Study 1972Source: ITANES/Istituto Carlo Cattaneo;http://www.itanes.org
• Italian National Election Study 1985Source: ITANES/Istituto Carlo Cattaneo;http://www.itanes.org
• Italian National Election Study 1990Source: ITANES/Istituto Carlo Cattaneo;http://www.itanes.org
187
SMETS, Kaat (2010), A Widening Generational Divide? Assessing the Age Gap in Voter Turnout Between Younger and Older Citizens European University Institute
DOI: 10.2870/15899

• Italian National Election Study 1992Source: ITANES/Istituto Carlo Cattaneo;http://www.itanes.org
• Italian National Election Study 1994Source: ITANES/Istituto Carlo Cattaneo;http://www.itanes.org
• Italian National Election Study 1996Source: ITANES/Istituto Carlo Cattaneo;http://www.itanes.org
• Italian National Election Study 2001Source: ITANES/Istituto Carlo Cattaneo;http://www.itanes.org
• Italian National Election Study 2006Source: ITANES/Istituto Carlo Cattaneo;http://www.itanes.org
The Netherlands
• Cumulative file 1971-1998Source: European Voter Database, Zentralarchiv;https://info1.za.gesis.org/cei/evoter.asp
• Dutch Parliamentary Election Study 1989Source: Data Archiving and Networked Services (DANS) / Steinmetz archive;http://www.dans.knaw.nl
• Dutch Parliamentary Election Study 2002-2003Source: Data Archiving and Networked Services (DANS) / Steinmetz archive;http://www.dans.knaw.nl
• Dutch Parliamentary Election Study 2006Source: Data Archiving and Networked Services (DANS) / Steinmetz archive;http://www.dans.knaw.nl
188
SMETS, Kaat (2010), A Widening Generational Divide? Assessing the Age Gap in Voter Turnout Between Younger and Older Citizens European University Institute
DOI: 10.2870/15899

Appendix A. Description of the data sets used
Norway
• Cumulative file 1965-1997Source: European Voter Database, Zentralarchiv;https://info1.za.gesis.org/cei/evoter.asp
• Norwegian Election Study 2001Source: Comparative Study of Electoral Systems database;http://www.cses.org
• Norwegian Election Study 2005Source: Norwegian Social Science Data Services (NSD);http://www.nsd.uib.no/nsd/english/index.html
Sweden
• Cumulative file 1960-1998Source: European Voter Database, Zentralarchiv;https://info1.za.gesis.org/cei/evoter.asp
• Swedish Election Study 2002Source: Comparative Study of Electoral Systems database;http://www.cses.org
United States
• American National Election Studies, cumulative file 1948-2004Source: http://www.electionstudies.org
Other data bases
• IDEA Voter Turnout DatabaseSource: http://www.idea.int/vt
• McDonald & Popkin’s United States Elections Project DataSource: http://elections.gmu.edu/voter turnout.htm
189
SMETS, Kaat (2010), A Widening Generational Divide? Assessing the Age Gap in Voter Turnout Between Younger and Older Citizens European University Institute
DOI: 10.2870/15899

Chapter four and five
Great Britain
•Political Change in Britain 1963-1970study number: 044•Political Change in Britain 1969-1970study number: 1093•British Election Study February 1974 - Cross-Section Surveystudy number: 359•British Election Study October 1974 - Cross-Section Surveystudy number: 666•British Election Study May 1979 - Cross-Section Surveystudy number: 1533•British General Election Study 1983 - Cross-Section Surveystudy number: 2005•British General Election Study 1987 - Cross-Section Surveystudy number: 2568•British General Election Study 1992 - Cross-Section Surveystudy number: 2981•British General Election Study 1997 - Cross-Section Surveystudy number: 3887•British General Election Study 2001 - Cross-Section Surveystudy number: 4619Source: All available from https://www.data-archive.ac.uk
•British General Election Study 2005Source: http://www.essex.ac.uk/bes/2005/Survey%20with%20Mailback.htm
190
SMETS, Kaat (2010), A Widening Generational Divide? Assessing the Age Gap in Voter Turnout Between Younger and Older Citizens European University Institute
DOI: 10.2870/15899

Appendix B
Additional information andanalyses chapter four
B.1 A note on the multiple imputation of miss-
ing data
Handling missing data raises both conceptual difficulties and computational chal-lenges. The default way in which most statistical packages approach the miss-ing values problem – through listwise deletion or complete case analyses – canyield bias, is inefficient, and is therefore considered unreliable. In general, twoapproaches to handling missing data are recommended in the literature: maxi-mum likelihood (ML) and multiple imputation (MI) (Schafer and Graham, 2002;Raghunathan, 2004).
There are different types of missing data. Unit non-response occurs when theentire data collection procedure fails because respondents e.g. refuse to participate.Item non-response occurs when data is partially missing because a respondent e.g.did not answer all questions in the survey. Although part of the missing dataproblem in the fourth and fifth chapter of this thesis is due to item non-response,the more pressing problem is that certain variables were simply not included incertain waves of the British Election Studies. Using listwise deletion causes thesample size in the analyses in the fourth and fifth chapter to vary between 9762 and2589. This renders comparison of results between the different models difficult.
Table B.1 below lists all the variables used in the analyses for the fourth and thefifth chapter, their N , the percentage of missing values (as a proportion of a totalN of 9762), and the main reason for the lack of data. If no reason is given, datais missing due to item non-response. The variable with the largest percentage ofmissing values is political interest, which was not measured in 4 out of 12 electionsurveys.
191
SMETS, Kaat (2010), A Widening Generational Divide? Assessing the Age Gap in Voter Turnout Between Younger and Older Citizens European University Institute
DOI: 10.2870/15899

Varia
ble
n%
of
Mis
sin
gR
easo
nfo
rIm
pu
tati
on
valu
es
mis
sin
gn
ess
com
man
dV
ote
9762
Age
(sta
nd
ard
ized
)9762
Po
st1
99
0d
um
my
9762
Ma
tura
tio
nin
dex
(sta
nd
ard
ized
)5211
46.6
2se
ein
dic
ato
rsb
elow
pass
ivel
yIn
edu
cati
on
9692
.72
logit
/au
glo
git
Ma
rrie
d9758
.04
logit
Ch
ild
(ren
)7630
21.8
4n
.i.
in1974
(feb
),1992
logit
Ho
me
ow
ner
ship
9182
5.9
4n
.i.
in1966
logit
Res
iden
tia
lst
abi
lity
(sta
nd
ard
ized
)6785
30.5
n.i.
in1983,
1992;
on
lyp
ose
dto
1/2
of
the
sam
ple
in2001
regre
ss
Wo
rks
9755
.07
logit
Ave
rage
turn
ou
t>
35
yea
rs(s
t.)
9762
Gen
der
9762
Ed
uca
tio
na
lle
vel
(sta
nd
ard
ized
)9551
2.1
6m
logit
/au
glo
git
Ho
use
ho
ldin
com
e(s
tan
da
rdiz
ed)
8511
12.8
1m
logit
Mid
dle
cla
ss8203
15.9
7n
.i.
in1966;
on
lyp
ose
dto
1/2
of
the
sam
ple
in1970
logit
Rel
igio
us
8741
10.4
6n
.i.
in1974
(feb
)lo
git
Ch
urc
ha
tten
da
nce
(sta
nd
ard
ized
)6765
30.7
n.i.
in1974
(feb
an
doct
),2001,
2005
olo
git
Un
ion
mem
bers
hip
8838
9.4
7n
.i.
in1966
logit
Po
liti
cal
inte
rest
(sta
nd
ard
ized
)5976
38.7
8n
.i.
in1983,
1987,
1992
olo
git
Pa
rty
i.d
.st
ren
gth
(sta
nd
ard
ized
)9261
5.1
3olo
git
Per
ceiv
edpa
rty
diff
eren
ce(s
t.)
8875
9.0
9on
lyp
ose
dto
2/3
of
the
sam
ple
in2001
olo
git
Vo
ted
inp
revi
ou
sel
ecti
on
s?(t
-1)
7793
20.1
7on
lyp
ose
dto
1/6
of
the
sam
ple
in2001
logit
Yo
un
gin
itia
tio
n9762
Ret
rosp
ecti
veec
o.
eva
lua
tio
n(s
t.)
8312
14.8
5n
.i.
in1987
mlo
git
Pro
spec
tive
eco
.ev
alu
ati
on
(st.
)6935
28.9
6n
.i.
in1987,
1992
mlo
git
Note
:n
.i.
=n
ot
incl
ud
ed;
matu
rati
on
ind
exis
an
ad
dit
ive
scale
-th
ere
isn
oel
ecti
on
yea
rin
wh
ich
the
per
centa
ge
of
mis
sin
gvalu
esact
ually
reach
es47%
Tab
leB
.1:
Mis
sing
dat
ain
chap
ter
four
and
five
192
SMETS, Kaat (2010), A Widening Generational Divide? Assessing the Age Gap in Voter Turnout Between Younger and Older Citizens European University Institute
DOI: 10.2870/15899

Appendix B. Additional information and analyses chapter four
The higher percentage of missing values on the maturation index is misleadingas there is no single year in which indeed such a high number of indicators ismissing. The percentage, therefore, is an effect of the variable being an additivescale.
The percentage of missing values in the sample used is quite high for certainvariables. This calls for an imputation method with a high level of efficiency.Suppose Q is a real value and Q an estimated value. While treating missingdata in a sample we want to make sure that the bias between estimated and thetrue values is small. Moreover, we want the variance and standard deviation ofthe estimated values to be small. Bias and variance are often combined into onemeasure called mean square error, which is the squared distance (Q−Q)2 betweenthe estimated and the real values over repeated samples. The mean square erroris equal to the squared bias plus the variance. Bias, variance, and the mean errordescribe the behaviour of an estimate. However, we also want to be confidentabout the measures of uncertainty that we report and estimate the true Q with aprobability of a certain predefined rate (Schafer and Graham, 2002, p. 149).
Multiple imputation (MI) is a method for handling missing data that solves theproblem of uncertainty that many single imputation methods face. MI replaceseach missing value by a list of m>1 simulated values and as such produces mplausible alternative versions of the complete data set. Each of the m data sets isestimated in the same fashion by a complete data method. Estimates of parametersof interest are subsequently averaged to give a single estimate. Standard errors arecomputed according to the ‘Rubin rules’ (see below), allowing for between- andwithin-imputation components of variation in the parameter estimates.
MI does not need many rounds of estimation to reach a high level of efficiency.Rubin (1987) developed with the following way to calculate the efficiency of anestimate based on an m number of imputation (see equation B.1):
eff = (1 + λ/m)−1 (B.1)
where the efficiency is a function of the rate of the missing information (λ) and thenumber of imputations (m). For example, with roughly 40% of missing information(as is the case with political interest), m = 5 imputations will yield results thatare 100/(1 + .08) = 92.6% efficient. A rule of thumb for selection of the number ofimputation rounds is that the confidence coefficient for the worst-case parameter(in this case political interest) should be at least 95% (Royston, 2004, p. 239).This means that in this particular case more than five rounds of imputation aredesirable. Seven rounds of imputation yield an efficiency of 95% for the politicalinterest variable. Therefore, m is set to seven for the imputation procedure usedto handle missing data for the data set used in chapter four and five of this thesis.
193
SMETS, Kaat (2010), A Widening Generational Divide? Assessing the Age Gap in Voter Turnout Between Younger and Older Citizens European University Institute
DOI: 10.2870/15899

B.1. A note on the multiple imputation of missing data
The ice command in Stata is used to execute the multiple imputation process (seeRoyston, 2004, 2005a,b).
As mentioned above, multiple imputation creates a small number of data sets(in this case seven), each of which has the missing values suitably imputed (themost right-hand column in table B.1 shows the imputation command for eachvariable). The next step is to analyze each complete data set independently andsummarize the results of these independent estimations. Coefficients are simplyaveraged. Summarizing the standard errors requires a bit more work (see equa-tion B.2 taken from Rubin (1987)):
s =
√um +
m+ 1
mbm (B.2)
where um is the mean of the standard error’s, and bm is the variance of the estimatesacross the imputations. The micombine command in Stata combines the estimatesfrom the m analyses using Rubin’s rules (Royston, 2004, 2005a,b).
194
SMETS, Kaat (2010), A Widening Generational Divide? Assessing the Age Gap in Voter Turnout Between Younger and Older Citizens European University Institute
DOI: 10.2870/15899

Appendix B. Additional information and analyses chapter four
B.2 Summary statistics chapter four
Summary statistics pooled data set (1964-2005) - before imputation
Variable Mean Std. Dev. Min. Max. NVote 0.754 0.431 0 1 9762Age (standardized) 0.539 0.297 0 1 9762Post 1990 dummy 0.346 0.476 0 1 9762Maturation index (standardized) 0.662 0.221 0 1 5211Not in education (standardized) 0.945 0.227 0 1 9692Married 0.603 0.489 0 1 9758Children 0.455 0.498 0 1 7630Home ownership 0.601 0.49 0 1 9182Residential stability (standardized) 0.147 0.215 0 1 6785Works 0.700 0.458 0 1 9755Average turnout >35 years (proportion) 0.784 0.037 0.681 0.823 9762
Table B.2: Summary statistics chapter five BES 1964-2005, subsample ≤35 years
Summary statistics by election year - before imputation
Variable Mean Std. Dev. Min. Max. NVote 0.842 0.365 0 1 438Age (standardized) 0.596 0.258 0.18 1 438Post 1990 dummy 0 0 0 0 438Maturation index (standardized) 0.728 0.163 0.333 1 414Not in education (standardized) 1 0 1 1 434Married 0.788 0.409 0 1 438Children 0.616 0.487 0 1 438Home ownership 0.452 0.498 0 1 434Residential stability (standardized) 0.476 0.378 0 1 423Works 0.686 0.465 0 1 433Average turnout >35 years (proportion) 0.799 0 0.799 0.799 438note: no respondents identified as being in education
Table B.3: Summary statistics chapter five BES 1964, subsample ≤35 years
195
SMETS, Kaat (2010), A Widening Generational Divide? Assessing the Age Gap in Voter Turnout Between Younger and Older Citizens European University Institute
DOI: 10.2870/15899

B.2. Summary statistics chapter four
Variable Mean Std. Dev. Min. Max. NVote 0.761 0.427 0 1 543Age (standardized) 0.558 0.255 0.18 1 543Post 1990 dummy 0 0 0 0 543Maturation index (standardized) 0Not in education (standardized) 1 0 1 1 535Married 0.777 0.417 0 1 543Children 0.632 0.483 0 1 543Home ownership 0Residential stability (standardized) 0.42 0.385 0 1 529Works 0.696 0.46 0 1 543Average turnout >35 years (proportion) 0.801 0 0.801 0.801 543note: no respondents identified as being in education; home ownership not included
Table B.4: Summary statistics chapter five BES 1966, subsample ≤35 years
Variable Mean Std. Dev. Min. Max. NVote 0.744 0.437 0 1 602Age (standardized) 0.454 0.301 0 1 602Post 1990 dummy 0 0 0 0 602Maturation index (standardized) 0.578 0.171 0 1 597Not in education (standardized) 0.942 0.235 0 1 599Married 0.618 0.486 0 1 602Children 0.047 0.211 0 1 602Home ownership 0.477 0.5 0 1 602Residential stability (standardized) 0.198 0.181 0 0.714 600Works 0.706 0.456 0 1 602Average turnout >35 years (proportion) 0.778 0 0.778 0.778 602
Table B.5: Summary statistics chapter five BES 1970, subsample ≤35 years
Variable Mean Std. Dev. Min. Max. NVote 0.830 0.376 0 1 743Age (standardized) 0.524 0.276 0 1 743Post 1990 dummy 0 0 0 0 743Maturation index (standardized) 0Not in education (standardized) 0.96 0.197 0 1 742Married 0.669 0.471 0 1 743Children 0Home ownership 0.506 0.5 0 1 743Residential stability (standardized) 0.053 0.069 0 0.344 735Works 0.729 0.445 0 1 743Average turnout >35 years (proportion) 0.823 0 0.823 0.823 743note: children not included
Table B.6: Summary statistics chapter five BES 1974 (Feb.), subsample ≤35 years
196
SMETS, Kaat (2010), A Widening Generational Divide? Assessing the Age Gap in Voter Turnout Between Younger and Older Citizens European University Institute
DOI: 10.2870/15899

Appendix B. Additional information and analyses chapter four
Variable Mean Std. Dev. Min. Max. NVote 0.783 0.412 0 1 789Age (standardized) 0.51 0.285 0 1 789Post 1990 dummy 0 0 0 0 789Maturation index (standardized) 0.666 0.203 0 1 764Not in education (standardized) 0.962 0.192 0 1 786Married 0.703 0.457 0 1 789Children 0.552 0.498 0 1 785Home ownership 0.523 0.5 0 1 776Residential stability (standardized) 0.052 0.066 0 0.344 780Works 0.734 0.442 0 1 789Average turnout >35 years (proportion) 0.787 0 0.787 0.787 789
Table B.7: Summary statistics chapter five BES 1974 (Oct.), subsample ≤35 years
Variable Mean Std. Dev. Min. Max. NVote 0.783 0.413 0 1 631Age (standardized) 0.574 0.291 0 1 631Post 1990 dummy 0 0 0 0 631Maturation index (standardized) 0.787 0.157 0.333 1 462Not in education (standardized) 0.948 0.223 0 1 631Married 0.698 0.46 0 1 629Children 0.806 0.396 0 1 464Home ownership 0.554 0.497 0 1 628Residential stability (standardized) 0.108 0.111 0 0.387 631Works 0.729 0.445 0 1 631Average turnout >35 years (proportion) 0.817 0 0.817 0.817 631
Table B.8: Summary statistics chapter five BES 1979, subsample ≤35 years
Variable Mean Std. Dev. Min. Max. NVote 0.765 0.424 0 1 1393Age (standardized) 0.502 0.314 0 1 1393Post 1990 dummy 0 0 0 0 1393Maturation index (standardized) 0Not in education (standardized) 0.952 0.214 0 1 1390Married 0.570 0.495 0 1 1392Children 0.44 0.497 0 1 1377Home ownership 0.666 0.472 0 1 1385Residential stability (standardized) 0Works 0.686 0.464 0 1 1392Average turnout >35 years (proportion) 0.782 0 0.782 0.782 1393note: residential stability not included
Table B.9: Summary statistics chapter five BES 1983, subsample ≤35 years
197
SMETS, Kaat (2010), A Widening Generational Divide? Assessing the Age Gap in Voter Turnout Between Younger and Older Citizens European University Institute
DOI: 10.2870/15899

B.2. Summary statistics chapter four
Variable Mean Std. Dev. Min. Max. NVote 0.815 0.388 0 1 1245Age (standardized) 0.501 0.303 0 1 1245Post 1990 dummy 0 0 0 0 1245Maturation index (standardized) 0.683 0.209 0 1 1189Not in education (standardized) 0.935 0.246 0 1 1202Married 0.55 0.498 0 1 1245Children 0.425 0.495 0 1 1241Home ownership 0.713 0.453 0 1 1244Residential stability (standardized) 0.117 0.105 0 0.699 1235Works 0.714 0.452 0 1 1245Average turnout >35 years (proportion) 0.789 0 0.789 0.789 1245
Table B.10: Summary statistics chapter five BES 1987, subsample ≤35 years
Variable Mean Std. Dev. Min. Max. NVote 0.827 0.379 0 1 1136Age (standardized) 0.539 0.302 0 1 1136Post 1990 dummy 1 0 1 1 1136Maturation index (standardized) 0Not in education (standardized) 0.933 0.25 0 1 1132Married 0.551 0.498 0 1 1135Children 0Home ownership 0.676 0.468 0 1 1133Residential stability (standardized) 0Works 0.702 0.458 0 1 1136Average turnout >35 years (proportion) 0.813 0 0.813 0.813 1136note: children not included; residential stability not included
Table B.11: Summary statistics chapter five BES 1992, subsample ≤35 years
Variable Mean Std. Dev. Min. Max. NVote 0.666 0.472 0 1 1078Age (standardized) 0.583 0.291 0 1 1078Post 1990 dummy 1 0 1 1 1078Not in education (standardized) 0.618 0.251 0 1 1073Married 0.507 0.5 0 1 1078Children 0.401 0.49 0 1 1078Home ownership 0.59 0.492 0 1 1074Residential stability (standardized) 0.089 0.104 0 0.366 1077Works 0.677 0.468 0 1 1078Average turnout >35 years (proportion) 0.788 0 0.788 0.788 1078
Table B.12: Summary statistics chapter five BES 1997, subsample ≤35 years
198
SMETS, Kaat (2010), A Widening Generational Divide? Assessing the Age Gap in Voter Turnout Between Younger and Older Citizens European University Institute
DOI: 10.2870/15899

Appendix B. Additional information and analyses chapter four
Variable Mean Std. Dev. Min. Max. NVote 0.545 0.498 0 1 743Age (standardized) 0.593 0.298 0 1 743Post 1990 dummy 1 0 1 1 743Maturation index (standardized) 0.617 0.266 0 1 366Not in education (standardized) 0.904 0.294 0 1 743Married 0.502 0.5 0 1 743Children 0.394 0.489 0 1 743Home ownership 0.573 0.495 0 1 742Residential stability (standardized) 0.081 0.097 0 0.505 366Works 0.65 0.477 0 1 743Average turnout >35 years (proportion) 0.681 0 0.681 0.681 743note: residential stability only partially included
Table B.13: Summary statistics chapter five BES 2001, subsample ≤35 years
Variable Mean Std. Dev. Min. Max. NVote 0.61 0.488 0 1 421Age (standardized) 0.631 0.283 0 1 421Post 1990 dummy 1 0 1 1 421Maturation index (standardized) 0.662 0.252 0 1 346Not in education (standardized) 0.919 0.273 0 1 421Married 0.556 0.497 0 1 421Children 0.457 0.499 0 1 359Home ownership 0.641 0.48 0 1 421Residential stability (standardized) 0.09 0.102 0 0.366 409Works 0.71 0.455 0 1 420Average turnout >35 years (proportion) 0.714 0 0.714 0.714 421
Table B.14: Summary statistics chapter five BES 2005, subsample ≤35 years
199
SMETS, Kaat (2010), A Widening Generational Divide? Assessing the Age Gap in Voter Turnout Between Younger and Older Citizens European University Institute
DOI: 10.2870/15899

B.3. Additional models chapter four
B.3 Additional models chapter four
model 1 model 2a model 2b model 3a model 3bb/(se) b/(se) b/(se) b/(se) b/(se)
Age 0.786*** 0.443*** 0.468*** 0.748*** 0.758***(0.113) (0.134) (0.138) (0.214) (0.215)
Post 1990 -0.539** -0.335 -0.120 -0.627*** -0.419***(0.254) (0.219) (0.127) (0.181) (0.094)
Maturation index 1.086*** 0.971***(0.308) (0.286)
Not in education -0.285* -0.299*(0.169) (0.171)
Married 0.186*** 0.185***(0.066) (0.068)
Children -0.064 -0.094(0.099) (0.102)
Home ownership 0.622*** 0.623***(0.094) (0.097)
Residential stability 0.338* 0.315(0.203) (0.209)
Works 0.045 0.043(0.064) (0.065)
Average turnout >35 6.496*** 4.110***(1.707) (1.490)
Constant 0.276*** -0.282* -5.374*** 0.039 -3.186**(0.069) (0.164) (1.409) (0.158) (1.243)
Log-likelihood -6362.74 -5751.58 -5708.21 -3335.75 -3326.94Pseudo R2 0.021 0.025 0.032 0.046 0.048N 9762 8969 8969 5211 5211note: b coefficients from logit analyses with robust s.e.’s clusteredby election in parentheses; * p<0.10, ** p<0.05, *** p<0.01
Table B.15: Turnout by life-cycle indicators for young voters aged 35 years or less,BES 1964-2005 (before imputation of missing indicators)
200
SMETS, Kaat (2010), A Widening Generational Divide? Assessing the Age Gap in Voter Turnout Between Younger and Older Citizens European University Institute
DOI: 10.2870/15899

model 1 model 2a model 2b model 3a model 3bb/(se) b/(se) b/(se) b/(se) b/(se)
Age 0.786*** 0.388*** 0.411*** 0.565*** 0.620***(0.113) (0.127) (0.113) (0.132) (0.112)
Post 1990 -0.539** -0.481* -0.123 -0.544** -0.174(0.254) (0.252) (0.133) (0.255) (0.126)
Maturation index (4 items) 0.891*** 0.835***(0.224) (0.214)
Married 0.144* 0.147*(0.084) (0.088)
Children 0.006 -0.071(0.071) (0.064)
Home ownership 0.572*** 0.572***(0.097) (0.092)
Residential stability 0.033 0.022(0.156) (0.160)
Average turnout >35 7.803*** 8.163***(1.423) (1.398)
Constant 0.276*** -0.033 -6.210*** -0.027 -6.503***(0.069) (0.107) (1.174) (0.099) (1.149)
Log-likelihood -6362.74 -6308.37 -6224.22 -6266.71 -6176.62Pseudo R2 0.021 0.030 0.043 0.036 0.050N 9762 9762 9762 9762 9762note: b coefficients from logit analyses with robust s.e.’s clusteredby election in parentheses; * p<0.10, ** p<0.05, *** p<0.01
Table B.16: Turnout by life-cycle indicators for young voters aged 35 years or less,BES 1964-2005 (maturation index with 4 items)
201
SMETS, Kaat (2010), A Widening Generational Divide? Assessing the Age Gap in Voter Turnout Between Younger and Older Citizens European University Institute
DOI: 10.2870/15899

model 1 model 2a model 2b model 3a model 3bb/(se) b/(se) b/(se) b/(se) b/(se)
Age 0.786*** 0.367*** 0.391*** 0.543*** 0.604***(0.113) (0.117) (0.102) (0.130) (0.110)
Post 1990 -0.539** -0.475* -0.118 -0.539** -0.171(0.254) (0.253) (0.134) (0.257) (0.127)
Maturation index (5 items) 1.067*** 1.003***(0.235) (0.227)
Married 0.139* 0.144*(0.082) (0.087)
Children 0.022 -0.058(0.077) (0.070)
Home ownership 0.562*** 0.565***(0.098) (0.094)
Residential stability 0.032 0.021(0.157) (0.161)
Works 0.085 0.064(0.062) (0.061)
Average turnout >35 7.789*** 8.138***(1.420) (1.381)
Constant 0.276*** -0.152 -6.311*** -0.075 -6.520***(0.069) (0.124) (1.189) (0.107) (1.160)
Log-likelihood -6362.74 -6302.56 -6219.01 -6265.11 -6175.74Pseudo R2 0.021 0.031 0.043 0.036 0.050N 0.276*** -0.152 -6.311*** -0.075 -6.520***note: b coefficients from logit analyses with robust s.e.’s clusteredby election in parentheses; * p<0.10, ** p<0.05, *** p<0.01
Table B.17: Turnout by life-cycle indicators for young voters aged 35 years or less,BES 1964-2005 (maturation index with 5 items)
202
SMETS, Kaat (2010), A Widening Generational Divide? Assessing the Age Gap in Voter Turnout Between Younger and Older Citizens European University Institute
DOI: 10.2870/15899

model 1 model 2a model 2b model 3a model 3bb/(se) b/(se) b/(se) b/(se) b/(se)
Born in 1940s -0.020 0.029 0.021 -0.010 -0.016(0.166) (0.151) (0.133) (0.153) (0.139)
Born in 1950s -0.163 -0.056 -0.038 -0.154 -0.127(0.155) (0.141) (0.138) (0.162) (0.159)
Born in 1960s -0.389*** -0.192* -0.088 -0.376*** -0.262**(0.100) (0.098) (0.090) (0.121) (0.111)
Born in 1970s -0.979*** -0.660*** -0.314** -0.912*** -0.567***(0.218) (0.242) (0.158) (0.244) (0.163)
Born in 1980s -1.569*** -1.101*** -0.515* -1.489*** -0.907***(0.368) (0.373) (0.310) (0.366) (0.315)
Post 1990 0.159 0.018 0.069 0.093 0.136(0.263) (0.269) (0.164) (0.255) (0.152)
Maturation index 1.053*** 1.153***(0.202) (0.217)
Not in education -0.331*** -0.278***(0.106) (0.096)
Married 0.164* 0.212**(0.086) (0.097)
Children 0.029 0.020(0.076) (0.073)
Home ownership 0.586*** 0.586***(0.091) (0.090)
Residential stability -0.006 0.008(0.192) (0.190)
Works 0.118** 0.123**(0.054) (0.059)
Average turnout >35 6.468*** 6.088***(0.905) (0.838)
Constant 0.815*** 0.027 -5.201*** 0.599*** -4.350***(0.069) (0.156) (0.805) (0.155) (0.740)
Log-likelihood -6334.17 -6279.49 -6234.68 -6219.16 -6180.31Pseudo R2 0.025 0.034 0.041 0.043 0.049N 9762 9762 9762 9762 9762note: reference category: born in 1930s; b coefficients from logit analyses with robust s.e.’sclustered by election in parentheses;* p<0.10, ** p<0.05, *** p<0.01
Table B.18: Turnout by life-cycle indicators for young voters aged 35 years or less,BES 1964-2005 (birth cohorts instead of age variable)
203
SMETS, Kaat (2010), A Widening Generational Divide? Assessing the Age Gap in Voter Turnout Between Younger and Older Citizens European University Institute
DOI: 10.2870/15899

model1 model 2a model 2b model 3a model 3bb/(se) b/(se) b/(se) b/(se) b/(se)
Age 0.797*** 0.411*** 0.421*** 0.639*** 0.654***(0.105) (0.106) (0.106) (0.104) (0.102)
1970s -0.024 0.039 0.032 -0.016 -0.016(0.093) (0.100) (0.087) (0.114) (0.106)
1980s -0.005 0.035 0.138 -0.091 0.028(0.101) (0.111) (0.109) (0.130) (0.132)
1990s -0.113 -0.018 -0.018 -0.169 -0.159(0.229) (0.221) (0.162) (0.231) (0.172)
2000s -0.995*** -0.876*** -0.153 -1.049*** -0.264(0.042) (0.057) (0.339) (0.090) (0.358)
Maturation index 1.037*** 1.001***(0.239) (0.232)
Not in education -0.331*** -0.278***(0.106) (0.096)
Married 0.164* 0.212**(0.086) (0.097)
Children 0.029 0.020(0.076) (0.073)
Home ownership 0.586*** 0.586***(0.091) (0.090)
Residential stability -0.006 0.008(0.192) (0.190)
Works 0.118** 0.123**(0.054) (0.059)
Average turnout >35 6.468*** 6.088***(0.905) (0.838)
Constant 0.815*** 0.027 -5.201*** 0.599*** -4.350***(0.069) (0.156) (0.805) (0.155) (0.740)
Log-likelihood -6334.17 -6279.49 -6234.68 -6219.16 -6180.31Pseudo R2 0.025 0.034 0.041 0.043 0.049N 9762 9762 9762 9762 9762note: reference category: 1960s; b coefficients from logit analyses with robust s.e.’sclustered by election in parentheses;* p<0.10, ** p<0.05, *** p<0.01
Table B.19: Turnout by life-cycle indicators for young voters aged 35 years or less,BES 1964-2005 (decades instead of period dummy)
204
SMETS, Kaat (2010), A Widening Generational Divide? Assessing the Age Gap in Voter Turnout Between Younger and Older Citizens European University Institute
DOI: 10.2870/15899

model 1b/(se)
Age 0.392***(0.120)
Post 1990 -0.777***(0.215)
Maturation index 0.844***(0.284)
Maturation*Post 1990 0.483(0.424)
Constant -0.083(0.160)
Log-likelihood -6310.25Pseudo R2 0.029N 9762note: robust s.e.’s clustered by election in parentheses;* p<0.10, ** p<0.05, *** p<0.01
Table B.20: Turnout by maturation for young voters aged 35 years or less, BES1964-2005 (with period*maturation interaction term)
205
SMETS, Kaat (2010), A Widening Generational Divide? Assessing the Age Gap in Voter Turnout Between Younger and Older Citizens European University Institute
DOI: 10.2870/15899

B.3. Additional models chapter four
206
SMETS, Kaat (2010), A Widening Generational Divide? Assessing the Age Gap in Voter Turnout Between Younger and Older Citizens European University Institute
DOI: 10.2870/15899

Appendix C
Additional information andanalyses chapter five
C.1 Summary statistics chapter five
Summary statistics pooled data set (1964-2005) - before imputation
Variable Mean Std. Dev. Min. Max. NGender 0.481 0.5 0 1 9762Educational level (standardized) 0.553 0.305 0 1 9551Household income (standardized) 0.478 0.359 0 1 8511Middle class 0.184 0.387 0 1 8203Religious 0.587 0.492 0 1 8741Church attendance (standardized) 0.215 0.301 0 1 6765Union membership 0.274 0.446 0 1 8838Interest (standardized) 0.587 0.283 0 1 5976Party id strength (standardized) 0.525 0.305 0 1 9261Party difference (standardized) 0.399 0.352 0 1 8875Voted in previous elections? (t-1) 0.687 0.464 0 1 7793Retrospective eco. evaluation (st.) 0.452 0.376 0 1 8312Prospective eco. evaluation (st.) 0.486 0.379 0 1 6935Margin of the victory const. level (st.) 0.278 0.185 0 1 9700Margin of the victory country level (st.) 0.519 0.334 0 1 9762Majority status country level (st.) 0.463 0.213 0 1 9762
Table C.1: Summary statistics chapter six BES 1964-2005, subsample ≤35 years
207
SMETS, Kaat (2010), A Widening Generational Divide? Assessing the Age Gap in Voter Turnout Between Younger and Older Citizens European University Institute
DOI: 10.2870/15899

C.1. Summary statistics chapter five
Summary statistics by election year - before imputation
Variable Mean Std. Dev. Min. Max. NGender 0.486 0.5 0 1 438Educational level (standardized) 0.148 0.266 0 1 430Household income (standardized) 0.5 0.272 0 1 394Middle class 0.155 0.363 0 1 438Religious 0.953 0.211 0 1 429Church attendance (standardized) 0.33 0.29 0 1 434Union membership 0.249 0.433 0 1 438Interest (standardized) 0.687 0.257 0.333 1 434Party id strength (standardized) 0.664 0.301 0 1 428Party difference (standardized) 0.379 0.408 0 1 413Voted in previous elections? (t-1) 0.447 0.498 0 1 421Retrospective eco. evaluation (st.) 0.601 0.317 0 1 435Prospective eco. evaluation (st.) 0.735 0.328 0 1 379Margin of the victory const. level (st.) 0.255 0.191 0.018 0.879 430Margin of the victory country level (st.) 0 0 0 0 438Majority status country level (st.) 0.308 0 0.308 0.308 438
Table C.2: Summary statistics chapter six BES 1964, subsample ≤35 years
Variable Mean Std. Dev. Min. Max. NGender 0.521 0.5 0 1 543Educational level (standardized) 0.235 0.373 0 1 530Household income (standardized) 0.568 0.259 0 1 479Middle class 0Religious 0.956 0.205 0 1 525Church attendance (standardized) 0.335 0.29 0 1 533Union membership 0Interest (standardized) 0.644 0.257 0.333 1 542Party id strength (standardized) 0.656 0.311 0 1 526Party difference (standardized) 0.469 0.411 0 1 522Voted in previous elections? (t-1) 0.779 0.416 0 1 452Retrospective eco. evaluation (st.) 0.554 0.356 0 1 541Prospective eco. evaluation (st.) 0.651 0.36 0 1 509Margin of the victory const. level (st.) 0.266 0.214 0.008 0.941 534Margin of the victory country level (st.) 0.357 0 0.357 0.357 543Majority status country level (st.) 0 0 0 0 543note: social class and union membership not included
Table C.3: Summary statistics chapter six BES 1966, subsample ≤35 years
208
SMETS, Kaat (2010), A Widening Generational Divide? Assessing the Age Gap in Voter Turnout Between Younger and Older Citizens European University Institute
DOI: 10.2870/15899
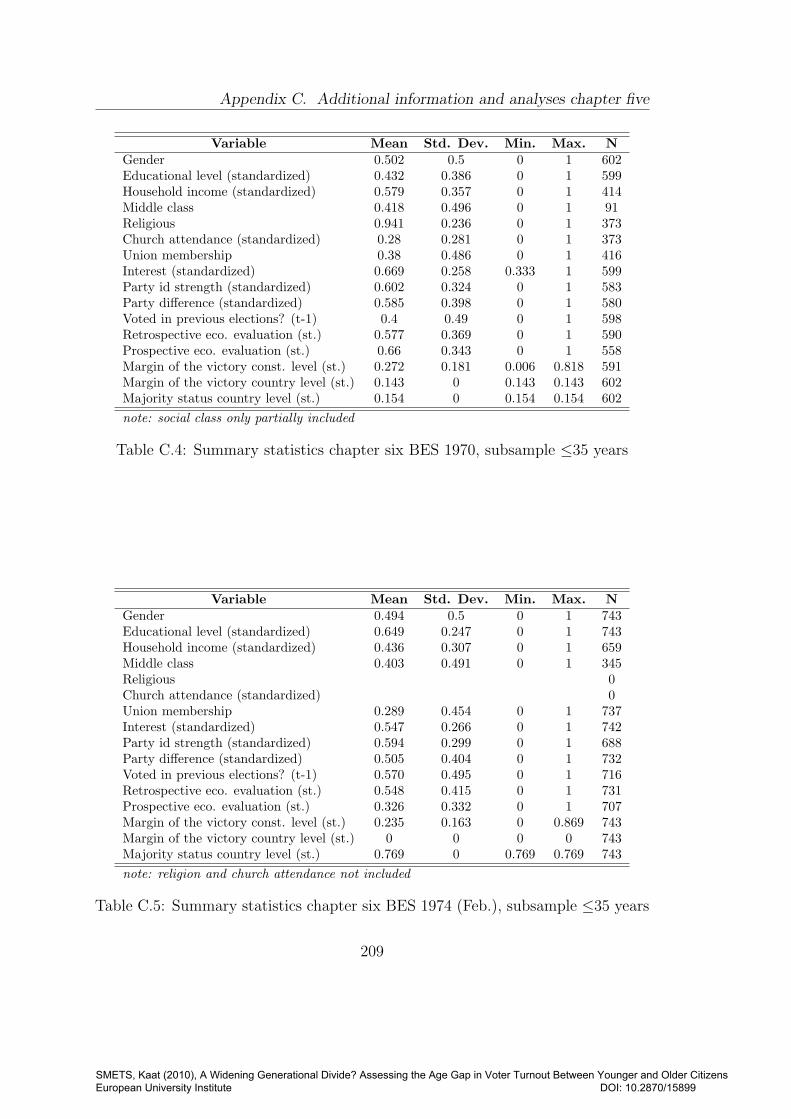
Appendix C. Additional information and analyses chapter five
Variable Mean Std. Dev. Min. Max. NGender 0.502 0.5 0 1 602Educational level (standardized) 0.432 0.386 0 1 599Household income (standardized) 0.579 0.357 0 1 414Middle class 0.418 0.496 0 1 91Religious 0.941 0.236 0 1 373Church attendance (standardized) 0.28 0.281 0 1 373Union membership 0.38 0.486 0 1 416Interest (standardized) 0.669 0.258 0.333 1 599Party id strength (standardized) 0.602 0.324 0 1 583Party difference (standardized) 0.585 0.398 0 1 580Voted in previous elections? (t-1) 0.4 0.49 0 1 598Retrospective eco. evaluation (st.) 0.577 0.369 0 1 590Prospective eco. evaluation (st.) 0.66 0.343 0 1 558Margin of the victory const. level (st.) 0.272 0.181 0.006 0.818 591Margin of the victory country level (st.) 0.143 0 0.143 0.143 602Majority status country level (st.) 0.154 0 0.154 0.154 602note: social class only partially included
Table C.4: Summary statistics chapter six BES 1970, subsample ≤35 years
Variable Mean Std. Dev. Min. Max. NGender 0.494 0.5 0 1 743Educational level (standardized) 0.649 0.247 0 1 743Household income (standardized) 0.436 0.307 0 1 659Middle class 0.403 0.491 0 1 345Religious 0Church attendance (standardized) 0Union membership 0.289 0.454 0 1 737Interest (standardized) 0.547 0.266 0 1 742Party id strength (standardized) 0.594 0.299 0 1 688Party difference (standardized) 0.505 0.404 0 1 732Voted in previous elections? (t-1) 0.570 0.495 0 1 716Retrospective eco. evaluation (st.) 0.548 0.415 0 1 731Prospective eco. evaluation (st.) 0.326 0.332 0 1 707Margin of the victory const. level (st.) 0.235 0.163 0 0.869 743Margin of the victory country level (st.) 0 0 0 0 743Majority status country level (st.) 0.769 0 0.769 0.769 743note: religion and church attendance not included
Table C.5: Summary statistics chapter six BES 1974 (Feb.), subsample ≤35 years
209
SMETS, Kaat (2010), A Widening Generational Divide? Assessing the Age Gap in Voter Turnout Between Younger and Older Citizens European University Institute
DOI: 10.2870/15899

C.1. Summary statistics chapter five
Variable Mean Std. Dev. Min. Max. NGender 0.51 0.5 0 1 789Educational level (standardized) 0.626 0.245 0 1 787Household income (standardized) 0.468 0.308 0 1 709Middle class 0.172 0.378 0 1 785Religious 0.573 0.495 0 1 787Church attendance (standardized) 0Union membership 0.299 0.458 0 1 783Interest (standardized) 0.553 0.264 0 1 787Party id strength (standardized) 0.581 0.293 0 1 740Party difference (standardized) 0.441 0.395 0 1 783Voted in previous elections? (t-1) 0.796 0.403 0 1 765Retrospective eco. evaluation (st.) 0.315 0.321 0 1 768Prospective eco. evaluation (st.) 0.286 0.314 0 1 747Margin of the victory const. level (st.) 0.248 0.192 0.003 0.915 789Margin of the victory country level (st.) 0.214 0 0.214 0.214 789Majority status country level (st.) 0.692 0 0.692 0.692 789note: church attendance not included
Table C.6: Summary statistics chapter six BES 1974 (Oct.), subsample ≤35 years
Variable Mean Std. Dev. Min. Max. NGender 0.48 0.5 0 1 631Educational level (standardized) 0.675 0.25 0 1 629Household income (standardized) 0.658 0.319 0 1 546Middle class 0.169 0.375 0 1 616Religious 0.461 0.499 0 1 625Church attendance (standardized) 0.295 0.257 0 1 625Union membership 0.344 0.475 0 1 628Interest s 0.539 0.261 0 1 630Party id strength (standardized) 0.536 0.302 0 1 604Party difference (standardized) 0.475 0.257 0 1 560Voted in previous elections? (t-1) 0.799 0.401 0 1 482Retrospective eco. evaluation (st.) 0.261 0.329 0 1 612Prospective eco. evaluation (st.) 0.274 0.33 0 1 590Margin of the victory const. level (st.) 0.283 0.181 0.006 1 631Margin of the victory country level (st.) 0.429 0 0.429 0.429 631Majority status country level (st.) 0.308 0 0.308 0.308 631
Table C.7: Summary statistics chapter six BES 1979, subsample ≤35 years
210
SMETS, Kaat (2010), A Widening Generational Divide? Assessing the Age Gap in Voter Turnout Between Younger and Older Citizens European University Institute
DOI: 10.2870/15899

Appendix C. Additional information and analyses chapter five
Variable Mean Std. Dev. Min. Max. NGender 0.499 0.5 0 1 1393Educational level (standardized) 0.684 0.249 0 1 1374Household income (standardized) 0.475 0.346 0 1 1362Middle class 0.204 0.403 0 1 1366Religious 0.589 0.492 0 1 1388Church attendance (standardized) 0.164 0.277 0 1 1389Union membership 0.313 0.464 0 1 1310Interest (standardized) 0Party id strength (standardized) 0.502 0.302 0 1 1290Party difference (standardized) 0.283 0.232 0 1 1244Voted in previous elections? (t-1) 0.784 0.412 0 1 1083Retrospective eco. evaluation (st.) 0.332 0.33 0 1 1338Prospective eco. evaluation (st.) 0.356 0.331 0 1 1284Margin of the victory const. level (st.) 0.253 0.141 0 0.674 1388Margin of the victory country level (st.) 1 0 1 1 1393Majority status country level (st.) 0.462 0 0.462 0.462 1393note: political interest not included
Table C.8: Summary statistics chapter six BES 1983, subsample ≤35 years
Variable Mean Std. Dev. Min. Max. NGender 0.488 0.5 0 1 1245Educational level (standardized) 0.607 0.218 0 1 1127Household income (standardized) 0.488 0.367 0 1 1080Middle class 0.189 0.392 0 1 1226Religious 0.539 0.499 0 1 1244Church attendance (standardized) 0.177 0.311 0 1 1239Union membership 0.292 0.455 0 1 1151Interest (standardized) 0Party id strength (standardized) 0.493 0.299 0 1 1152Party difference (standardized) 0.231 0.214 0 1 1145Voted in previous elections? (t-1) 0.782 0.413 0 1 958Retrospective eco. evaluation (st.) 0Prospective eco. evaluation (st.) 0Margin of the victory const. level (st.) 0.303 0.182 0.002 0.857 1237Margin of the victory country level (st.) 0.786 0 0.786 0.786 1245Majority status country level (st.) 0.462 0 0.462 0.462 1245note: political interest, economic evaluation not included
Table C.9: Summary statistics chapter six BES 1987, subsample ≤35 years
211
SMETS, Kaat (2010), A Widening Generational Divide? Assessing the Age Gap in Voter Turnout Between Younger and Older Citizens European University Institute
DOI: 10.2870/15899

C.1. Summary statistics chapter five
Variable Mean Std. Dev. Min. Max. NGender 0.473 0.499 0 1 1136Educational level (standardized) 0.527 0.301 0 1 1135Household income (standardized) 0.429 0.367 0 1 974Middle class 0.14 0.347 0 1 1118Religious 0.562 0.496 0 1 1134Church attendance (standardized) 0.192 0.319 0 1 1094Union membership 0.247 0.432 0 1 1133Interest (standardized) 0Party id strength (standardized) 0.511 0.275 0 1 1100Party difference (standardized) 0.301 0.344 0 1 1111Voted in previous elections? (t-1) 0.758 0.429 0 1 862Retrospective eco. evaluation (st.) 0.383 0.354 0 1 1085Prospective eco. evaluation (st.) 0Margin of the victory const. level (st.) 0.285 0.182 0 0.834 1115Margin of the victory country level (st.) 0.5 0 0.5 0.5 1136Majority status country level (st.) 0.462 0 0.462 0.462 1136note: political interest, prospective economic evaluation not included
Table C.10: Summary statistics chapter six BES 1992, subsample ≤35 years
Variable Mean Std. Dev. Min. Max. NGender 0.46 0.499 0 1 1078Educational level (standardized) 0.545 0.289 0 1 1072Household income (standardized) 0.472 0.445 0 1 954Middle class 0.17 0.375 0 1 1073Religious 0.523 0.5 0 1 1076Church attendance (standardized) 0.172 0.297 0 1 1078Union membership 0.214 0.411 0 1 1078Interest (standardized) 0.581 0.3 0 1 1078Party id strength (standardized) 0.467 0.29 0 1 1050Party difference (standardized) 0.477 0.351 0 1 1044Voted in previous elections? (t-1) 0.666 0.472 0 1 909Retrospective eco. evaluation (st.) 0.536 0.38 0 1 1064Prospective eco. evaluation (st.) 0.651 0.353 0 1 1027Margin of the victory const. level (st.) 0.335 0.22 0.003 0.989 1078Margin of the victory country level (st.) 0.857 0 0.857 0.857 1078Majority status country level (st.) 0.385 0 0.385 0.385 1078
Table C.11: Summary statistics chapter six BES 1997, subsample ≤35 years
212
SMETS, Kaat (2010), A Widening Generational Divide? Assessing the Age Gap in Voter Turnout Between Younger and Older Citizens European University Institute
DOI: 10.2870/15899
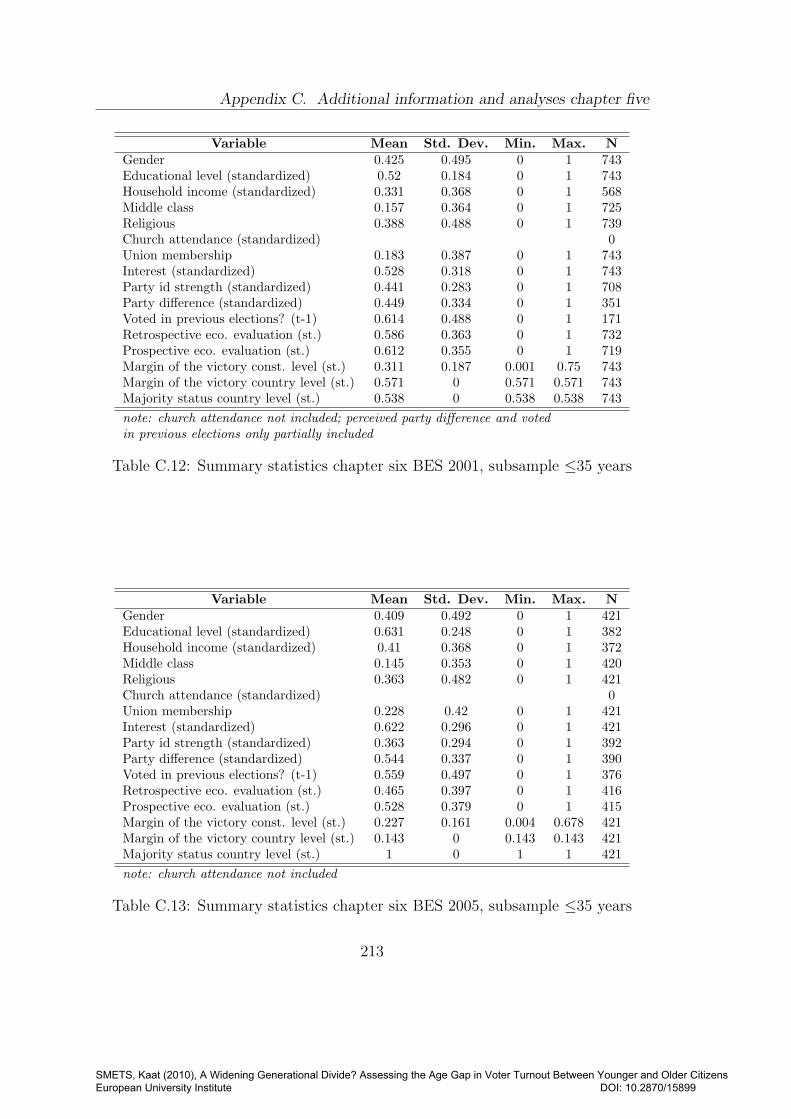
Appendix C. Additional information and analyses chapter five
Variable Mean Std. Dev. Min. Max. NGender 0.425 0.495 0 1 743Educational level (standardized) 0.52 0.184 0 1 743Household income (standardized) 0.331 0.368 0 1 568Middle class 0.157 0.364 0 1 725Religious 0.388 0.488 0 1 739Church attendance (standardized) 0Union membership 0.183 0.387 0 1 743Interest (standardized) 0.528 0.318 0 1 743Party id strength (standardized) 0.441 0.283 0 1 708Party difference (standardized) 0.449 0.334 0 1 351Voted in previous elections? (t-1) 0.614 0.488 0 1 171Retrospective eco. evaluation (st.) 0.586 0.363 0 1 732Prospective eco. evaluation (st.) 0.612 0.355 0 1 719Margin of the victory const. level (st.) 0.311 0.187 0.001 0.75 743Margin of the victory country level (st.) 0.571 0 0.571 0.571 743Majority status country level (st.) 0.538 0 0.538 0.538 743note: church attendance not included; perceived party difference and votedin previous elections only partially included
Table C.12: Summary statistics chapter six BES 2001, subsample ≤35 years
Variable Mean Std. Dev. Min. Max. NGender 0.409 0.492 0 1 421Educational level (standardized) 0.631 0.248 0 1 382Household income (standardized) 0.41 0.368 0 1 372Middle class 0.145 0.353 0 1 420Religious 0.363 0.482 0 1 421Church attendance (standardized) 0Union membership 0.228 0.42 0 1 421Interest (standardized) 0.622 0.296 0 1 421Party id strength (standardized) 0.363 0.294 0 1 392Party difference (standardized) 0.544 0.337 0 1 390Voted in previous elections? (t-1) 0.559 0.497 0 1 376Retrospective eco. evaluation (st.) 0.465 0.397 0 1 416Prospective eco. evaluation (st.) 0.528 0.379 0 1 415Margin of the victory const. level (st.) 0.227 0.161 0.004 0.678 421Margin of the victory country level (st.) 0.143 0 0.143 0.143 421Majority status country level (st.) 1 0 1 1 421note: church attendance not included
Table C.13: Summary statistics chapter six BES 2005, subsample ≤35 years
213
SMETS, Kaat (2010), A Widening Generational Divide? Assessing the Age Gap in Voter Turnout Between Younger and Older Citizens European University Institute
DOI: 10.2870/15899

C.1. Summary statistics chapter five
214
SMETS, Kaat (2010), A Widening Generational Divide? Assessing the Age Gap in Voter Turnout Between Younger and Older Citizens European University Institute
DOI: 10.2870/15899

Appendix C. Additional information and analyses chapter five
C.2 Additional models chapter five
model 2a model 4a model 3a model 4bb/(se) b/(se) b/(se) b/(se)
Age 0.443*** 0.307 0.748*** 0.593***(0.134) (0.200) (0.214) (0.119)
Post 1990 -0.335 0.055 -0.627*** -0.445***(0.219) (0.268) (0.181) (0.076)
Maturation index 1.086*** 1.159**(0.308) (0.517)
Not in education -0.285* -0.606**(0.169) (0.269)
Married/cohabiting 0.186*** 0.220*(0.066) (0.116)
Children -0.064 0.009(0.099) (0.137)
Home ownership 0.622*** 0.712***(0.094) (0.158)
Residential stability 0.338* 0.406(0.203) (0.490)
Works 0.045 0.023(0.064) (0.179)
Gender -0.222*** -0.236**(0.069) (0.093)
Educational level 0.404** 0.558**(0.162) (0.222)
Religious 0.073 0.176(0.111) (0.156)
Church attendance 0.398*** 0.225(0.098) (0.156)
Union membership 0.134* 0.018(0.081) (0.066)
Household income 0.282 0.064(0.172) (0.257)
Middle class 0.179** 0.239**(0.084) (0.102)
Constant -0.282* -0.730*** 0.039 0.029(0.164) (0.197) (0.158) (0.100)
Log-likelihood -5751.58 -2910.66 -3335.75 -1560.16Pseudo R2 0.025 0.034 0.046 0.059N 8969 4724 5211 2589note: b coefficients from logit analyses with robust s.e.’s clusteredby election in parentheses; * p<0.10, ** p<0.05, *** p<0.01
Table C.14: Turnout by later maturation versus resources and mobilization indi-cators for young voters aged 35 years or less, BES 1964-2005 (before imputationof missing indicators)
215
SMETS, Kaat (2010), A Widening Generational Divide? Assessing the Age Gap in Voter Turnout Between Younger and Older Citizens European University Institute
DOI: 10.2870/15899

C.2. Additional models chapter five
model 2a model 5a model 3a model 5bb/(se) b/(se) b/(se) b/(se)
Age 0.443*** -0.183 0.748*** -0.183(0.134) (0.275) (0.214) (0.316)
Post 1990 -0.335 -0.259** -0.627*** -0.208(0.219) (0.119) (0.181) (0.144)
Maturation index 1.086*** 1.078***(0.308) (0.275)
Not in education -0.285* -0.027(0.169) (0.190)
Married/cohabiting 0.186*** 0.212(0.066) (0.141)
Children -0.064 0.027(0.099) (0.154)
Home ownership 0.622*** 0.572***(0.094) (0.107)
Residential stability 0.338* 0.582(0.203) (0.399)
Works 0.045 -0.104(0.064) (0.075)
Interest 1.308*** 1.178***(0.181) (0.198)
Strength party id 1.268*** 1.230***(0.112) (0.141)
Perceived party differences -0.315*** -0.432***(0.110) (0.129)
Voted t− 1 0.954*** 1.078***(0.152) (0.157)
Young initiation -0.058 -0.112(0.136) (0.152)
Retrospective eco. evaluation 0.383*** 0.281***(0.077) (0.078)
Prospective eco. evaluation -0.055 0.144(0.168) (0.112)
Constant -0.282* -1.881*** 0.039 -1.608***(0.164) (0.310) (0.158) (0.255)
Log-likelihood -5751.58 -2245.79 -3335.75 -1685.41Pseudo R2 0.025 0.135 0.046 0.148N 8969 3984 5211 2980note: b coefficients from logit analyses with robust s.e.’s clusteredby election in parentheses; * p<0.10, ** p<0.05, *** p<0.01
Table C.15: Turnout by later maturation versus campaign indicators for youngvoters aged 35 years or less, BES 1964-2005 (before imputation of missing indica-tors)
216
SMETS, Kaat (2010), A Widening Generational Divide? Assessing the Age Gap in Voter Turnout Between Younger and Older Citizens European University Institute
DOI: 10.2870/15899

Appendix C. Additional information and analyses chapter five
model 2a model 6a model 3a model 6bb/(se) b/(se) b/(se) b/(se)
Age 0.443*** 0.436*** 0.748*** 0.723***(0.134) (0.133) (0.214) (0.195)
Post 1990 -0.335 -0.293 -0.627*** -0.613***(0.219) (0.208) (0.181) (0.099)
Maturation index 1.086*** 1.075***(0.308) (0.296)
Not in education -0.285* -0.310*(0.169) (0.180)
Married/cohabiting 0.186*** 0.212***(0.066) (0.082)
Children -0.064 -0.061(0.099) (0.103)
Home ownership 0.622*** 0.600***(0.094) (0.103)
Residential stability 0.338* 0.404(0.203) (0.264)
Works 0.045 0.050(0.064) (0.065)
Margin of the victory (const. level) -0.172 -0.077(0.157) (0.240)
Margin of the victory (country level) -0.002 0.352**(0.154) (0.142)
Majority status (country level) -0.310 -0.292*(0.341) (0.160)
Constant -0.282* -0.090 0.039 0.056(0.164) (0.195) (0.158) (0.188)
Log-likelihood -5751.58 -5708.63 -3335.75 -3309.19Pseudo R2 0.025 0.026 0.046 0.049N 8969 8907 5211 5184note: b coefficients from logit analyses with robust s.e.’s clusteredby election in parentheses; * p<0.10, ** p<0.05, *** p<0.01
Table C.16: Turnout by later maturation versus competitiveness indicators foryoung voters aged 35 years or less, BES 1964-2005 (before imputation of missingindicators)
217
SMETS, Kaat (2010), A Widening Generational Divide? Assessing the Age Gap in Voter Turnout Between Younger and Older Citizens European University Institute
DOI: 10.2870/15899
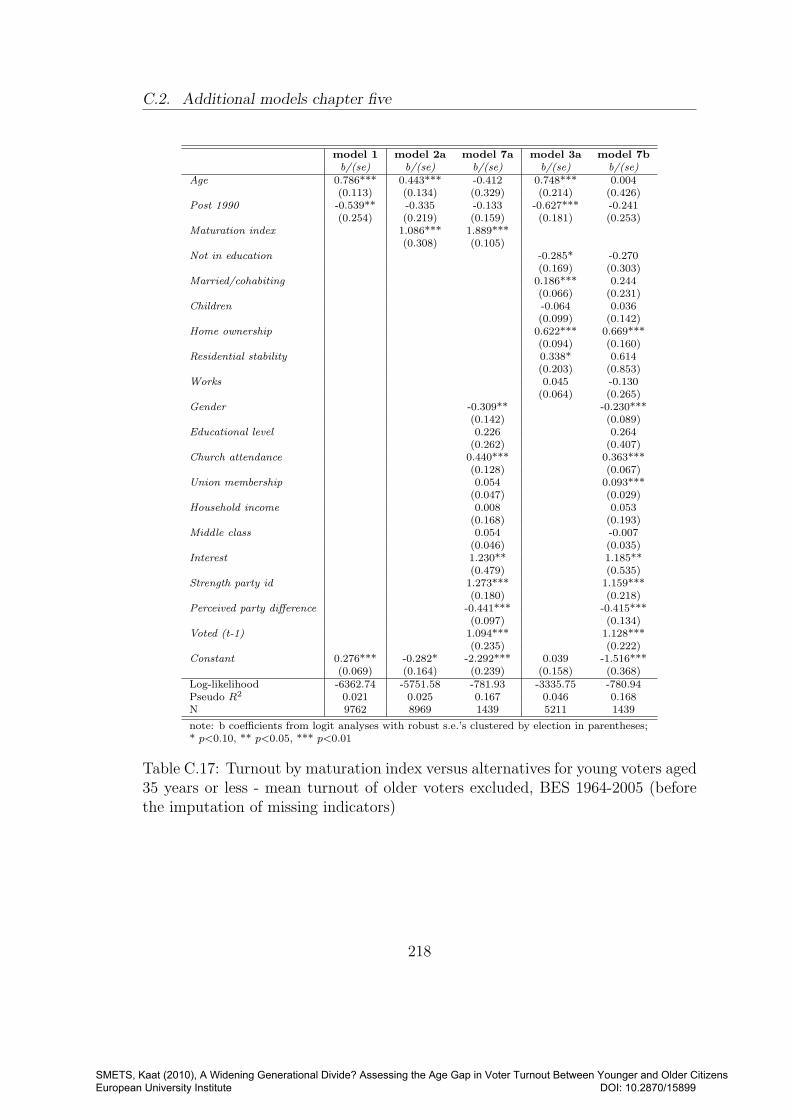
C.2. Additional models chapter five
model 1 model 2a model 7a model 3a model 7bb/(se) b/(se) b/(se) b/(se) b/(se)
Age 0.786*** 0.443*** -0.412 0.748*** 0.004(0.113) (0.134) (0.329) (0.214) (0.426)
Post 1990 -0.539** -0.335 -0.133 -0.627*** -0.241(0.254) (0.219) (0.159) (0.181) (0.253)
Maturation index 1.086*** 1.889***(0.308) (0.105)
Not in education -0.285* -0.270(0.169) (0.303)
Married/cohabiting 0.186*** 0.244(0.066) (0.231)
Children -0.064 0.036(0.099) (0.142)
Home ownership 0.622*** 0.669***(0.094) (0.160)
Residential stability 0.338* 0.614(0.203) (0.853)
Works 0.045 -0.130(0.064) (0.265)
Gender -0.309** -0.230***(0.142) (0.089)
Educational level 0.226 0.264(0.262) (0.407)
Church attendance 0.440*** 0.363***(0.128) (0.067)
Union membership 0.054 0.093***(0.047) (0.029)
Household income 0.008 0.053(0.168) (0.193)
Middle class 0.054 -0.007(0.046) (0.035)
Interest 1.230** 1.185**(0.479) (0.535)
Strength party id 1.273*** 1.159***(0.180) (0.218)
Perceived party difference -0.441*** -0.415***(0.097) (0.134)
Voted (t-1) 1.094*** 1.128***(0.235) (0.222)
Constant 0.276*** -0.282* -2.292*** 0.039 -1.516***(0.069) (0.164) (0.239) (0.158) (0.368)
Log-likelihood -6362.74 -5751.58 -781.93 -3335.75 -780.94Pseudo R2 0.021 0.025 0.167 0.046 0.168N 9762 8969 1439 5211 1439
note: b coefficients from logit analyses with robust s.e.’s clustered by election in parentheses;* p<0.10, ** p<0.05, *** p<0.01
Table C.17: Turnout by maturation index versus alternatives for young voters aged35 years or less - mean turnout of older voters excluded, BES 1964-2005 (beforethe imputation of missing indicators)
218
SMETS, Kaat (2010), A Widening Generational Divide? Assessing the Age Gap in Voter Turnout Between Younger and Older Citizens European University Institute
DOI: 10.2870/15899

Appendix C. Additional information and analyses chapter five
model 1 model 2a model 8a model 3a model 8bb/(se) b/(se) b/(se) b/(se) b/(se)
Age 0.786*** 0.468*** -0.338 0.758*** 0.033(0.113) (0.138) (0.338) (0.215) (0.434)
Post 1990 -0.539** -0.120 -1.003*** -0.419*** -1.079***(0.254) (0.127) (0.270) (0.094) (0.408)
Maturation index 0.971*** 1.847***(0.286) (0.074)
Not in education -0.299* -0.334(0.171) (0.258)
Married/cohabiting 0.185*** 0.211(0.068) (0.247)
Children -0.094 0.091(0.102) (0.130)
Home ownership 0.623*** 0.661***(0.097) (0.158)
Residential stability 0.315 0.323(0.209) (0.758)
Works 0.043 -0.137(0.065) (0.266)
Gender -0.306** -0.216**(0.140) (0.088)
Educational level 0.626 0.559(0.445) (0.394)
Church attendance 0.383*** 0.334***(0.138) (0.084)
Union membership 0.068** 0.112***(0.028) (0.011)
Household income 0.060 0.101(0.130) (0.158)
Middle class 0.031 -0.028(0.043) (0.032)
Interest 1.057** 1.030**(0.423) (0.446)
Strength party id 1.233*** 1.144***(0.204) (0.229)
Perceived party difference -0.450*** -0.424***(0.088) (0.126)
Voted (t-1) 1.177*** 1.201***(0.196) (0.175)
Average turnout ≤35 6.496*** -39.027*** 4.110*** -36.047***(1.707) (10.392) (1.490) (8.389)
Constant 0.276*** -5.374*** 29.144*** -3.186** 27.664***(0.069) (1.409) (8.303) (1.243) (6.878)
Log-likelihood -6362.74 -5708.21 -777.33 -3326.94 -777.75Pseudo R2 0.021 0.032 0.172 0.048 0.172N 9762 8969 1439 5211 1439
note: b coefficients from logit analyses with robust s.e.’s clusteredby election in parentheses; * p<0.10, ** p<0.05, *** p<0.01
Table C.18: Turnout by life-cycle indicators versus alternatives for young votersaged 35 years or less - mean turnout of older voters included, BES 1964-2005(before imputation of missing indicators)
219
SMETS, Kaat (2010), A Widening Generational Divide? Assessing the Age Gap in Voter Turnout Between Younger and Older Citizens European University Institute
DOI: 10.2870/15899

C.3. Analyses with a full sample of the electorate
C.3 Analyses with a full sample of the electorate
Variable Correlation Noteswith voting
Resource variables:Age (0 = 18 - 1 = 97 years or over) .120***Gender (0, 1 = male) -.002Married/cohabiting (0, 1 = yes) .092***Education (0, 1 = higher) .021***Social class (0, 1 = middle class) .045***Household income* (0, 1 = higher) .067***Union membership (0, 1 = member) .050***Maturation index (0, 1 = higher) .113***
Mobilization variables:Union membership (0, 1 = yes) .050***Religion (0, 1 = yes) .095***Church attendance (0, 1 = > once a week) .108***Urban •
Campaign variables:Political interest (0-1 = very much) .210***Party identification (0-1 = very strong) .242***Perceived party diff. (0 - 1 = not much) • -.124***Party sympathy •
Character of elections variables:Majority status, percent (0 = 2 - 1 = 15) -.014***Margin of the victory, percent (0 = 1 - 1 = 15) -.032***Time since last elections (0 = 2 - 1 = 5) .012***
Linkage variables:Voted at previous election (0, 1 = yes) .334***Member of new cohort (0,1 = yes) -.084*** Entered electorate since last electionEstablished voter (0,1 = yes) .084*** Entered electorate before last electionYoung initiation (0, 1 = yes) -.148*** Entered electorate after the lowering
of the voting age in 1969
• not available in BES/not included in Franklin (2004); * p<0.10, ** p<0.05, *** p<0.01
Table C.19: Individual level variables for explaining turnout, BES 1964-2005
220
SMETS, Kaat (2010), A Widening Generational Divide? Assessing the Age Gap in Voter Turnout Between Younger and Older Citizens European University Institute
DOI: 10.2870/15899

Model A Model B Model Cb b b
Age 1.297*** 1.409*** 0.568***Gender -0.188*** -0.205*** -0.182***Educational level 0.333*** 0.311*** 0.261***Middle class 0.008 0.023 0.012Household income 0.180** 0.189* 0.124Union membership 0.244*** 0.249*** 0.194***Maturation index 1.295*** 1.412*** 1.053***Religious 0.049 0.034 -0.028Church attendance 0.663*** 0.664*** 0.621***Interest 1.275*** 1.270*** 1.113***Party id strength 1.559*** 1.564*** 1.141***Perceived party differences -0.384*** -0.398*** -0.368***
New * gender 0.109 0.107New * educational level 0.353* 0.550**New * middle class -0.182 -0.169New * hh income -0.044 -0.036New * union membership -0.024 -0.027New * maturation index -0.268 0.273New * religion 0.114 0.168New * church attendance -0.058 -0.045New * interest 0.076 0.377New * party id strength -0.060 0.356New * perceived party differences 0.114 0.266*
Majority status 0.222Margin of the victory -0.057New * majority status -0.646New * margin of the victory 0.190Young initiation -0.201Voted in previous elections 1.451***Constant -2.119*** -2.224*** -2.405***Log-likelihood -16400 -16400 -15500Pseudo R2 0.136 0.137 0.185N 32252 32252 32252Note: b coefficients from logit analyses with robust s.e.’s clusteredby election; * p<0.10, ** p<0.05, *** p<0.01
Table C.20: Turnout by Individual Level Variables, BES 1964-2005
221
SMETS, Kaat (2010), A Widening Generational Divide? Assessing the Age Gap in Voter Turnout Between Younger and Older Citizens European University Institute
DOI: 10.2870/15899

Model A Model B Model Cb b b
Age 1.297*** 0.975*** -0.099Gender -0.188*** -0.145** -0.116*Educational level 0.333*** 0.253** 0.173*Middle class 0.008 0.060 0.062Household income 0.180** 0.108 0.053Union membership 0.244*** 0.225*** 0.176**Maturation index 1.295*** 1.446*** 0.892***Religious 0.049 0.082 0.030Church attendance 0.663*** 0.628*** 0.603***Interest 1.275*** 1.219*** 1.048***Party id strength 1.559*** 1.530*** 1.144***Perceived party differences -0.384*** -0.295*** -0.293***
Aged <35 yrs * gender -0.109 -0.109Aged <35 yrs * educational level 0.235 0.317*Aged <35 yrs * middle class -0.133 -0.149Aged <35 yrs * hh income 0.135 0.113Aged <35 yrs * union membership 0.026 0.010Aged <35 yrs * maturation index -0.408 -0.376Aged <35 yrs * religion -0.077 -0.070Aged <35 yrs * church attendance 0.112 0.076Aged <35 yrs * interest 0.143 0.305Aged <35 yrs * party id strength 0.071 0.155Aged <35 yrs * perceived party diff. -0.240** -0.126
Majority status 0.230Margin of the victory -0.056Aged <35 yrs * majority status -0.406*Aged <35 yrs * margin of the vict. -0.013Young initiation -0.177Voted in previous elections 1.316***Constant -2.119*** -2.021*** -1.866***Log-likelihood -16400 -16400 -15600Pseudo R2 0.136 0.138 0.180N 32252 32252 32252Note: b coefficients from logit analyses with robust s.e.’s clusteredby election; * p<0.10, ** p<0.05, *** p<0.01
Table C.21: Turnout by Individual Level Variables (young 35), BES 1964-2005
222
SMETS, Kaat (2010), A Widening Generational Divide? Assessing the Age Gap in Voter Turnout Between Younger and Older Citizens European University Institute
DOI: 10.2870/15899

Appendix D
Additional information andanalyses chapter six
D.1 Description and origin of the variables
• Age gapDifference in the average turnout of younger (≤35 years) and older voters(>35 years). Data is adjusted for sampling errors and over-reporting ofturnout.Source(s): see appendix A.
• Average years of schoolingAverage years of schooling in the total population aged 15 years or over (seeBarro and Lee, 2001) Source(s): Quality of Government (QoG) Time-Seriesand Cross-Section Dataset; http://www.qog.pol.gu.se
• CoalitionDichotomous variable that identifies elections for which the outcome resultedin a coalition government.Source(s): based on indicator in the Cross-National Time-Series Data Archive(CNTS); http://www.databanksinternational.com/
• DisproportionalityLeast suares measure of disproportionality between votes and seats (seeLaakso and Taagepera, 1979). Data for Italy 1994, 1996, and 2001 refersto list votes and seats only.Source(s): (Gallagher and Mitchell, 2008).
223
SMETS, Kaat (2010), A Widening Generational Divide? Assessing the Age Gap in Voter Turnout Between Younger and Older Citizens European University Institute
DOI: 10.2870/15899

D.1. Description and origin of the variables
• Effective number of parties at the electoral level (ENEP)Measure of the effective number of parties based on the vote share (seeLaakso and Taagepera, 1979)). Data for Italy 1994, 1996, and 2001 refers tolist votes and seats only.Source(s): (Gallagher and Mitchell, 2008).
• Electoral systemDummy variables.Source(s): (Franklin, 2004); IDEA Voter Turnout Database (see appendixA).
• GDP per capitaIn constant US$ (2000).Source(s): World Development Indicators; http://www.worldbank.org
• Majority statusSimple difference between the vote share of the largest party and 50 percent.Source(s): (Franklin, 2004); supplemented by the record of recent electionspublished in the European Journal of Political Research.
• Margin of the victorySimple difference between the vote share of the first and second party.Source(s): (Franklin, 2004); supplemented by the record of recent electionspublished in the European Journal of Political Research.
• Mean age women at first childbirthSource(s): (OECD, 2006, p. 45), (Council of Europe, 2004, p. 81), (Councilof Europe, 2005, p. 87), (OECD, 2007, p. 31) United Nations DemographicYearbook/UNECE Statistical Division Database.
• Mean age women at first marriage (below 50 years)Indicator refers to the median age for women at first marriage in the UnitedStates.Source(s): (OECD, 2006, p. 49), (Council of Europe, 2004, p. 60), (Coun-cil of Europe, 2005, p. 68), United Nations Demographic Yearbook/UNECEStatistical Division Database, U.S. Bureau of the Census.
• Party disciplineDichotomous variable that identifies countries with a strong party discipline.Source(s): (Franklin, 2004)
• Size of electorate (in millions)Source(s): IDEA Voter Turnout Database; McDonald & Popkin’s UnitedStates Elections Project Data (see appendix A).
224
SMETS, Kaat (2010), A Widening Generational Divide? Assessing the Age Gap in Voter Turnout Between Younger and Older Citizens European University Institute
DOI: 10.2870/15899

Appendix D. Additional information and analyses chapter six
225
SMETS, Kaat (2010), A Widening Generational Divide? Assessing the Age Gap in Voter Turnout Between Younger and Older Citizens European University Institute
DOI: 10.2870/15899

D.2. Additional analyses chapter six
D.2 Additional analyses chapter six
model 1 model 2 model 3 model 4b/(se) b/(se) b/(se) b/(se)
Time trend 8.212*** -0.392 -0.415 -0.663(0.953) (2.743) (3.075) (3.162)
Average years of schooling 1.417** 1.518*** 1.522***(0.559) (0.577) (0.581)
Average age at 1st marriage 0.726 0.660 0.703(0.512) (0.561) (0.572)
Majority status 0.081 0.151(0.113) (0.157)
Margin of the victory 0.093 0.105(0.075) (0.070)
Polarisation 0.018 0.017(0.052) (0.054)
PR-system -7.851**(3.125)
Disproportionality 0.019(0.061)
Eff. number of parties -0.480(1.086)
Bicameralism -9.590**(4.072)
Party discipline -5.205(12.703)
Ease of voting 0.870(19.262)
Canada 5.167** 3.096 2.970 -5.192**(2.212) (2.226) (2.571) (2.273)
Denmark -3.198 -4.016* -5.056* -14.236***(2.442) (2.429) (2.691) (3.531)
Finland 9.377*** 10.036*** 9.478*** 0.000(3.604) (3.341) (3.309) (0.000)
Germany -5.281** -5.269** -4.740* -4.835*(2.347) (2.339) (2.484) (2.562)
Italy -9.519*** -7.032*** -7.306*** -12.089(2.519) (2.643) (2.742) (12.786)
Norway 3.118 2.695 1.961 1.975(2.598) (2.322) (2.574) (2.596)
Sweden -3.331 -4.688** -5.681* -5.639*(2.264) (2.279) (3.024) (3.038)
United Kingdom 6.463** 7.555*** 8.224*** 0.000(2.800) (2.681) (2.940) (0.000)
United States 8.128*** 7.183** 8.044** -5.535(2.236) (2.866) (3.498) (11.367)
Constant 5.573*** -20.637** -22.193** 0.000(1.817) (10.191) (11.163) (0.000)
R2 0.580 0.636 0.649 0.648χ2 405.9 562.2 580.0 1367.9p 0.000 0.000 0.000 0.000ρ .257 .196 .180 .185N 106 106 106 106
note: b coefficients from Prais Winsten pcse analysis; * p<0.10, ** p<0.05,*** p<0.01; results for country dummies are not presented
Table D.1: Modelling the age gap in voter turnout (mean age at 1st marriage),1960s-2000s
226
SMETS, Kaat (2010), A Widening Generational Divide? Assessing the Age Gap in Voter Turnout Between Younger and Older Citizens European University Institute
DOI: 10.2870/15899

Appendix D. Additional information and analyses chapter six
model 1 model 2 model 3 model 4b/(se) b/(se) b/(se) b/(se)
Time trend -15.432*** 0.858 -0.194 -0.317(1.607) (3.673) (3.495) (3.347)
Average years of schooling -2.196*** -2.252*** -1.745**(0.743) (0.803) (0.794)
Average age at 1st child -2.443*** -1.967*** -2.035***(0.747) (0.726) (0.720)
Majority status -0.229 -0.207(0.141) (0.226)
Margin of the victory -0.135 -0.115(0.093) (0.102)
Polarisation 0.030 0.002(0.064) (0.064)
PR-system 20.254***(4.186)
Disproportionality -0.038(0.088)
Eff. number of parties -0.212(1.294)
Bicameralism 17.542***(5.223)
Party discipline -1.175(6.518)
Ease of voting -29.838(25.748)
Constant 82.469*** 158.857*** 151.729*** 128.749***(2.650) (19.596) (18.250) (17.891)
R2 0.840 0.859 0.862 0.867χ2 954.3 1748.6 1376.0 1075.4p 0.000 0.000 0.000 0.000ρ .317 .238 .252 .239N 106 106 106 106note: b coefficients from Prais Winsten pcse analysis; * p<0.10, ** p<0.05,*** p<0.01; results for country dummies are not presented
Table D.2: Modelling turnout among young voters (aged ≤35 years), 1960s-2000s
227
SMETS, Kaat (2010), A Widening Generational Divide? Assessing the Age Gap in Voter Turnout Between Younger and Older Citizens European University Institute
DOI: 10.2870/15899

D.2. Additional analyses chapter six
model 1 model 2 model 3 model 4b/(se) b/(se) b/(se) b/(se)
Time trend -7.279*** -0.841 -1.436 -1.611(1.168) (2.406) (2.032) (1.908)
Average years of schooling -0.575 -0.552 -0.011(0.619) (0.607) (0.485)
Average age at 1st child -1.189** -0.900** -0.951**(0.470) (0.408) (0.423)
Majority status -0.183** -0.116(0.090) (0.135)
Margin of the victory -0.073 -0.044(0.055) (0.061)
Polarisation 0.045 0.014(0.042) (0.036)
PR-system 0.000(0.000)
Disproportionality -0.013(0.053)
Eff. number of parties -0.562(0.718)
Bicameralism 6.935*(3.539)
Party discipline 5.579(4.961)
Ease of voting -31.589*(18.020)
Constant 88.080*** 121.712*** 117.243*** 119.444***(1.315) (12.208) (10.415) (10.294)
R2 0.874 0.876 0.863 0.868χ2 1175.0 1253.3 1716.2 1389.5p 0.000 0.000 0.000 0.000ρ .320 .301 .215 .183N 106 106 106 106note: b coefficients from Prais Winsten pcse analysis; * p<0.10, ** p<0.05,*** p<0.01; results for country dummies are not presented
Table D.3: Modelling turnout among older voters (aged >35 years), 1960s-2000s
228
SMETS, Kaat (2010), A Widening Generational Divide? Assessing the Age Gap in Voter Turnout Between Younger and Older Citizens European University Institute
DOI: 10.2870/15899

Bibliography
Ajzen, Icek. 2002. “Residual Effects of Past on Later Behavior: Habituationand Reasoned Action Perspectives.” Personality and Social Psychology Review6(2):107–122.
Aldrich, John H., Ashley Taylor and Wendy Wood. 2007. “Repeated Turnout asa Habit.” Paper presented at the 65th Annual Meeting of the Midwest PoliticalScience Association. Ghicago (IL), April 12-15.
Alwin, Duane F., Scott M. Hofer and Ryan J. McCammon. 2006. Modeling theEffects of Time: Integrating Demographic and Developmental Perspectives. InHandbook of Aging and the Social Sciences, ed. Robert H. Binstock and Linda K.George. 6th ed. San Diego, CA: Academic Press.
Amna, Erik, Ingrid Munck and Par Zetterberg. 2004. “Meaningful Participation?Political Efficacy of Adolescents in 24 Countries.” Paper presented at the ECPRJoint Sessions of Workshops. Uppsala, April 13-18.
Andrain, Charles F. and David E. Apter. 1995. Political Protest and Social Change.Analyzing Politics. Houndmills: MacMillan Press.
Armingeon, Klaus. 1994. “Grunde und Folge geringer Wahlbeteiligung.” KolnerZeitschrift fur Soziologie und Sozialpsychologie 46(1):43–64.
Barnes, Samuel H. and Max Kaase. 1979. Political Action. Mass Participation inFive Western Democracies. Beverly Hills, CA: Sage Publications.
Barro, Robert J. and Jong-Wha Lee. 2001. “International Data on EducationalAttainment: Updates and Implications.” Oxford Economic Papers 3:541–563.
Baum, Christopher F. 2006. An Introduction to Modern Econometrics Using Stata.College Station, TX: Stata Press.
Bazler Zeitung. 06.05.2007. “Kanton Glarus entscheidet sich fur Stimmrechtsalter16.”.
229
SMETS, Kaat (2010), A Widening Generational Divide? Assessing the Age Gap in Voter Turnout Between Younger and Older Citizens European University Institute
DOI: 10.2870/15899

Bibliography
Beck, Nathaniel. 2001. “Time-Series-Cross-Sectional Data: What Have WeLearned in the Past Few Years?” Annual Review of Political Science 4:271–293.
Beck, Nathaniel and Jonathan N. Katz. 1995. “What to do (and not to do) withTime-Series Cross-Section Data.” American Political Science Review 89(3):634–647.
Bendor, Jonathan, Daniel Diermeier and Michael Ting. 2003. “A BehaviouralModel of Turnout.” American Political Science Review 97(2):261–280.
Benoit, Kenneth, Michael Laver and Slava Mikhaylov. 2009. “Treating Words asData with Error: Uncertainty in Text Statements of Policy Positions.” AmericanJournal of Political Science 53(2).
Bessant, Judith. 2004. “Mixed Messages: Youth Participation and DemocraticPractice.” Australian Journal of Political Science 39(2):387–404.
Billari, Francesco C. and Chris Wilson. 2001. “Convergence Towards Diversity?Cohort Dynamics in the Transition to Adulthood in Contemporary WesternEurope.” MPIDR Working Paper WP 2001-39; Rostock: Max Planck Institutefor Demographic Research.
Billari, Francesco C. and Hans-Peter Kohler. 2002. “Patterns of Lowest-Low Fertil-ity in Europe.” MPIDR Working Paper 2002-40; Rostock: Max Planck Institutefor Demographic Research.
Blais, Andre. 2000. To Vote or not to Vote? The Merits and Limits of RationalChoice Theory. Pittsburgh: The University of Pittsburgh Press.
Blais, Andre. 2006. “What Affects Voter Turnout?” Annual Review of PoliticalScience 9:111–125.
Blais, Andre. 2007. Turnout in Elections. In Oxford Handbook of Political Behavior,ed. Russell J. Dalton and Hans-Dieter Klingemann. Oxford: Oxford UniversityPress pp. 621–635.
Blais, Andre and Agnieszka Dobrzynska. 1998. “Turnout in Electoral Democra-cies.” European Journal of Political Research 33(2):239–261.
Blais, Andre, Elisabeth Gidengil, Richard Nadeau and Neil Nevitte. 2002. “Gen-erational Change and the Decline of Political Participation: the Case of VoterTurnout in Canada.” Paper presented at the workshop ’Citizenship on Trial: In-terdisciplinary Perspectives on Political Socialization of Adolescents’, Montreal,June 20-21.
230
SMETS, Kaat (2010), A Widening Generational Divide? Assessing the Age Gap in Voter Turnout Between Younger and Older Citizens European University Institute
DOI: 10.2870/15899

Bibliography
Blais, Andre and Ignacio Lago. 2009. “A General Measure of District Competi-tiveness.” Electoral Studies 28(1):94–100.
Blais, Andre, Louis Massicotte and Agnieszka Dobrzynska. 2003. “Why is TurnoutHigher in Some Countries than in Others?” Ottawa: Elections Canada.
Blais, Andre and Peter Loewen. 2009. “Youth Electoral Engagement in Canada.”Ottawa: Elections Canada.
Blais, Andre and R. K. Carty. 1990. “Does Proportional Representation FosterVoter Turnout?” European Journal of Political Research 18(2):167–181.
Blais, Andre, Robert Young and Miriam Lapp. 2000. “The Calculus of Voting:An Empirical Test.” European Journal of Political Research 37(2):181–201.
Blasius, Jorg and Victor Thiessen. 2006. “Assessing Data Quality and Con-struct Comparability in Cross-National Surveys.” European Sociological Review22(3):229–242.
Brady, Henry E., Sidney Verba and Kay Schlozman. 1995. “Beyond SES: AResource Model of Political Participation.” American Political Science Review89(2):271–294.
Braun, Michael. 2003. Errors in Comparative Survey Research: An Overview. InCross-Cultural Survey Methods, ed. Janet A. Harkness, Fons J. R. van de Vijverand Peter Ph. Mohler. Hoboken, NJ: Wiley-Interscience.
Braun, Michael and Peter Ph. Mohler. 2003. Background Variables. In Cross-Cultural Survey Methods, ed. Janet A. Harkness, Fons J. R. van de Vijver andPeter Ph. Mohler. Hoboken, NJ: Wiley-Interscience.
Braungart, Richard G. and Margaret M. Braungart. 1986. “Life-course and Gen-erational Politics.” Annual Review of Sociology 12:205–231.
Budge, Ian, Hans-Dieter Klingemann, Andrea Volkens, Judith L. Bara and EricTanenbaum. 2001. Mapping Policy Preferences. Estimates for Parties, Electors,and Governments 1945-1998. Oxford: Oxford University Press.
Butler, David and Donald Stokes. 1974. Political Change in Britain. The Evolutionof Electoral Choice. Vol. 2 London: MacMillan.
Caramani, Daniele. 2000. Elections in Western Europe Since 1815. Electoral Re-sults by Constituencies. The Societies of Europe. London: MacMillan Reference.
231
SMETS, Kaat (2010), A Widening Generational Divide? Assessing the Age Gap in Voter Turnout Between Younger and Older Citizens European University Institute
DOI: 10.2870/15899

Bibliography
Childs, Sarah. 2004. “A British Gender Gap? Gender and Political Participation.”The Political Quarterly 75(4):422–424.
Corbetta, Piergiorgio. 2009. “Da padre a figlio: la continuita del voto in italiafra generazioni.” Paper presented at the 13th Annual Meeting of the SocietaItaliana di Scienze Politiche, Rome, September 17-19.
Council of Europe. 2004. “Recent Demographic Developments in Europe.”Directorate-General of Social Cohesion, Strasbourg: Council of Europe Pub-lishing.
Council of Europe. 2005. “Recent Demographic Developments in Europe.”Directorate-General of Social Cohesion, Strasbourg: Council of Europe Pub-lishing.
Crepaz, Markus M. L. 1990. “The Impact of Party Polarization and Postmaterial-ism on Voter Turnout.” European Journal of Political Research 18(2):183–205.
Crewe, Ivor and Anthony Fox. 1984. British Parliamentary Constituencies. AStatistical Compendium. London: Faber and Faber Limited.
Cutler, Neal E. and Vern L. Bengtson. 1974. “Age and Political Alienation: Mat-uration, Generation and Period Effects.” Annals of the American Academy ofPolitical and Social Science 415(Political Consequences of Aging):160–175.
Dalton, Russell J. 2000. The Decline of Party Identifications. In Parties withoutPartisans: Political Change in Advanced Industrial Democracies, ed. Russell J.Dalton and Martin P. Wattenberg. Oxford: Oxford University Press.
De Graaf, Nan Dirk. 1999. “Event History Data and Making a History out ofCross-Sectional Data.” Quality and Quantity 33(3):261–276.
Dekker, Paul. 2002. “Sterkere democraten, zwakkere democratie? Veranderingenin politieke betrokkenheid en participatie 1970-2000.” B en M, tijdschrift voorbeleid, politiek en maatschappij 29(2):55–66.
Denver, David. 2008. “Another Reason to Support Marriage? Turnout and theDecline of Marriage in Britain.” British Journal of Politics and InternationalRelations 10(4):666–680.
Downs, Anthony. 1957. An Economic Theory of Democracy. New York: Harper-Collins.
Drukker, David M. 2003. “Testing for Serial Correlation in Linear Panel-DataModels.” The Stata Journal 3(2):168–177.
232
SMETS, Kaat (2010), A Widening Generational Divide? Assessing the Age Gap in Voter Turnout Between Younger and Older Citizens European University Institute
DOI: 10.2870/15899

Bibliography
Elder, Glen H. Jr. 1975. “Age Differentiation and the Life Course.” Annual Reviewof Sociology 1:165–190.
Elder, Glen H. Jr. 1985. Perspectives on the Life Course. In Life Course Dynamics.Trajectories and Transitions, 1968-1980, ed. Glen H. Jr. Elder. Ithaca: CornellUniversity Press pp. 23–49.
Electoral Commission. 2006. “Election 2005: constituencies, candidates and re-sults.” London: the UK Electoral Commission.
Endersby, James W., Steven E. Galatas and Chapman B. Rackaway. 2002. “Close-ness Counts in Canada: Voter Participation in the 1993 and 1997 Federal Elec-tions.” The Journal of Politics 64(2):610–631.
European Commission. 2001a. “A New Impetus for European Youth.” EuropeanCommission White Paper (COM(2001) 681 final); Brussels: European Union.
European Commission. 2001b. “Young Europeans in 2001. Results of a EuropeanOpinion Poll.” Eurobarometer Special Survey 151. Directorate-General for Ed-ucation and Culture ‘Youth’ Unit; Brussels: European Union.
Evans, Jocelyn A. J. 2004. Voters & Voting. An Introduction. London: Sage.
Fieldhouse, Edward, Mark Tranmer and Andrew Russell. 2007. “Something AboutYoung People or Something About Elections? Electoral Participation of YoungPeople in Europe: Evidence From A Multilevel Analysis of the European SocialSurvey.” European Journal of Political Research 46(6):707–822.
Flanagan, Constance A. and Lonnie R. Sherod. 1998. “Youth Political Develop-ment: An Introduction.” Journal of Social Studies 54(3):447–456.
Fowler, James H. 2006. “Habitual Voting and Behavioral Turnout.” The Journalof Politics 68(2):335–344.
Franklin, Mark N. 2001. “How Structural Factors Cause Turnout Variations atEuropean Parliament Elections.” European Union Politics 2(3):309–328.
Franklin, Mark N. 2004. Voter Turnout and the Dynamics of Electoral Competitionin Established Democracies Since 1945. Cambridge, MA: Cambridge UniversityPress.
Franklin, Mark N. and Bernhard Wessels. 2002. “Learning (Not) To Vote: theGenerational Basis of Turnout Decline in Established Democracies, With Im-plications for the Study of Party Choice.” Paper presented at the 98th AnnualMeeting of the American Political Science Association.
233
SMETS, Kaat (2010), A Widening Generational Divide? Assessing the Age Gap in Voter Turnout Between Younger and Older Citizens European University Institute
DOI: 10.2870/15899

Bibliography
Franklin, Mark N., Patrick Lyons and Michael Marsh. 2004. “Generational Basisof Turnout Decline in Established Democracies.” Acta Politica 39(2):115–151.
Furstenberg, Jr., Frank F., Sheela Kennedy, Vonnie C. McCloyd, Ruben G. Rum-baut and Richard A. Settersten, Jr. 2003. “Between Adolescence and Adulthood:Expectations about the Timing of Adulthood.” Research Network Working Pa-per No. 1; The Network on Transitions into Adulthood and Public Policy.
Gallagher, Michael and Paul Mitchell. 2008. The Politics of Electoral Systems.Oxford: Oxford University Press.
Galston, William A. 2001. “Political Knowledge, Political Engagement, and CivicEducation.” Annual Review of Political Science 4:217–234.
Garcıa Albacete, Gema M. 2009. “Life-Cycle and Political Participation. Do YoungPeople Participate Differently Due to A Delayed Transition Into Adulthood?”Paper presented at the 8th Dutch-Flemish Politicologenetmaal. Nijmegen, theNetherlands, May 28-29.
Gauthier, Madeleine. 2003. “The Inadequacy of Concepts: The Rise of YouthInterest in Civic Participation in Quebec.” Journal of Youth Studies 6(3):265–276.
Gerber, Alan S., Donald P. Green and Ron Shachar. 2003. “Voting May Be Habit-Forming: Evidence from a Randomized Field Experiment.” American Journalof Political Science 47(3):540–550.
Geys, Benny. 2006. “Explaining Voter Turnout: A Review of Aggregate-LevelResearch.” Electoral Studies 25(4):637–663.
Gidengil, Elisabeth, Neil Nevitte, Andre Blais and Richard Nadeau. 2003. “TurnedOff or Tuned Out? Youth Participation in Politics.” Electoral Insight 5(2):9–14.
Glenn, Norval D. 2005. Cohort Analysis. Quantitative Applications in the SocialSciences no.5 2 ed. Thousand Oaks, CA: Sage.
Goerres, Achim. 2007. “Why Are Older People More Likely to Vote? The Impactof Ageing on Electoral Turnout in Europe.” British Journal of Politics andInternational Relations 9(1):90–121.
Gould, William, Jeffrey Pitblado and William Sribney. 2006. Maximum LikelihoodEstimation with Stata. 3 ed. College Station, TX: Stata Corp. LP.
234
SMETS, Kaat (2010), A Widening Generational Divide? Assessing the Age Gap in Voter Turnout Between Younger and Older Citizens European University Institute
DOI: 10.2870/15899

Bibliography
Gray, Mark and Miki Caul. 2000. “Declining Voter Turnout in Advanced Indus-trial Democracies, 1950 to 1997. The Effects of Declining Group Mobilization.”Comparative Political Studies 33(9):1091–1122.
Green, Donald P. and Ron Shachar. 2000. “Habit Formation and Political Be-haviour: Evidence of Consuetude in Voter Turnout.” British Journal of PoliticalScience 30(4):561–573.
Grofman, Bernard and Peter Selb. 2009. “A Fully General Index of PoliticalCompetition.” Electoral Studies 28(2):291–296.
Hader, Sabine and Siegfried Gabler. 2003. Sampling and Estimation. In Cross-Cultural Survey Methods, ed. Janet A. Harkness, Fons J. R. van de Vijver andPeter Ph. Mohler. Hoboken, NJ: Wiley-Interscience.
Hazekamp, Jan L. and Fanny V. Heymann. 1993. “Tussen skateboardbaan enstadhuis; politieke participatie van jongeren in de praktijk.” Sociale interventie2(3):91–99.
Held, David. 1996. Models of Democracy. 2nd ed. Cambridge: Polity Press.
Henn, Matt, Mark Weinstein and Dominic Wring. 2002. “A Generation Apart?Youth and Political Participation in Britain.” British Journal of Politics andInternational Relations 4(2):167–192.
Henn, Matt, Mark Weinstein and Sarah Forrest. 2005. “Uninterested Youth?Young People’s Attitudes towards Party Politics in Britain.” Political Studies53(3):556–578.
Highton, Benjamin and Raymond E. Wolfinger. 2001. “The First Seven Years ofthe Political Life Cycle.” American Journal of Political Science 45(1):202–209.
Hooghe, Marc. 2004. “Political Socialization and the Future of Politics.” ActaPolitica 39(4):331–341.
Hooghe, Marc and Dietlind Stolle. 2003. “Age Matters: Life-cycle and CohortDifferences in the Socialisation Effect of Voluntary Participation.” EuropeanPolitical Science 2(3):49–57.
Hooghe, Marc and Dimokritos Kavadias. 2005. “Determinants of Future Willing-ness to Vote. A Comparative Analysis of 14 Year Olds in 28 Countries.” Paperpresented at the 3rd ECPR General Conference. Budapest, September 8-10.
Howe, Paul. 2003. “Electoral Participation and the Knowledge Deficit.” ElectoralInsight 5(2):20–25.
235
SMETS, Kaat (2010), A Widening Generational Divide? Assessing the Age Gap in Voter Turnout Between Younger and Older Citizens European University Institute
DOI: 10.2870/15899

Bibliography
Iacovou, Maria. 2002. “Regional Differences in the Transition to Adulthood.”Annals of the American Academy of Political and Social Science 580:40–69.
IDEA. 1999. Youth Voter Participation. Involving Today’s Young in Tomorrow’sDemocracy. Stockholm: International Institute for Democracy and ElectoralAssistance (IDEA).
Inglehart, Ronald. 1997. Modernization and Postmodernization. Cultural, Eco-nomic and Political Change in 43 Societies. Princeton, NJ: Princeton UniversityPress.
Inglehart, Ronald and Pippa Norris. 2003. Rising Tide: Gender Equality andCultural Change Around the World. Cambridge, MA: Cambridge UniversityPress.
Jankowski, Thomas B. and John M. Strate. 1995. “Modes of Participation overthe Adult Life Span.” Political Behaviour 17(1):89–106.
Jennings, M. Kent. 1987. “Residues of a Movement: the Aging of the AmericanProtest Generation.” American Political Science Review 81(2):367–382.
Johnston, Richard, J. Scott Matthews and Amanda Bittner. 2007. “Turnout andthe Party System in Canada, 1988-2004.” Electoral Studies 26(4):735–745.
Jowell, Roger. 1998. “How Comparative is Comparative Research.” Working PaperNumber 66; Oxford: Centre for Research into Elections and Social Trends -CREST.
Kanazawa, Satoshi. 2000. “A New Solution to the Collective Action Problem: TheParadox of Voter Turnout.” American Sociological Review 65(3):433–442.
Katz, Richard S. 1997. Democracy and Elections. Oxford: Oxford UniversityPress.
Kennedy, Peter. 2003. A Guide to Econometrics. 5th ed. Malden, MA: BlackwellPublishings.
Kennedy, Sheela. 2004. “Education and the Timing of Marriage and Childbear-ing: A Comparative Study.” Paper presented at the Annual Meeting of thePopulation Association of America. Boston, MA: April 1-3.
Kimberlee, Richard H. 2002. “Why Don’t British Young People Vote at GeneralElections?” Journal of Youth Studies 5(1):85–98.
236
SMETS, Kaat (2010), A Widening Generational Divide? Assessing the Age Gap in Voter Turnout Between Younger and Older Citizens European University Institute
DOI: 10.2870/15899

Bibliography
Kinder, Donald R. 2006. “Politics and the Life Cycle.” Science 312(5782):1905–1908.
King, Gary. 1986. “How Not to Lie with Statistics: Avoiding Common Mis-takes in Quantitative Political Science.” American Journal of Political Science30(3):666–687.
Klingemann, Hans-Dieter, Andrea Volkens, Judith L. Bara, Ian Budge andMichael D. McDonald. 2006. Mapping Policy Preferences II. Estimates for Par-ties, Electors, and Governments in Eastern Europe, European Union and OECD1990-2003. Oxford: Oxford University Press.
Kohli, Martin. 2003. Der institutionalisierte Lebenslauf: ein Blick zuruck undnach vorn. In Entstaatlichung und soziale Sicherheit. Verhandlungen des 31.Kongresses der Deutschen Gesellschaft fur Soziologie in Leipzig 2002, ed. JuttaAllmendinger. Opladen: Leske + Budrich.
Kohli, Martin and Harald Kunemund. 2005. Gegenwart und Zukunft des Genera-tionenkonflikts. In Die zweite Lebenshalfte. Gesellschaftliche Lage und Partizipa-tion im Spiegel des Alters-Survey, ed. Martin Kohli and Harald Kunemund. 2nded. Wiesbaden: VS Verlag fur Sozialwissenschaften.
Kriesi, Hanspeter. 2005. Direct Democratic Choice. The Swiss Experience. Land-ham: Lexington Books.
Kuechler, Manfred. 1987. “The Utility of Surveys for Cross-National Research.”Social Science Research 16(3):229–244.
Laakso, Markku and Rein Taagepera. 1979. “‘Effective’ Number of Parties. A Mea-sure with Application to West Europe.” Comparative Political Studies 12(1):3–27.
Lane, Robert E. 1959. Political Life. Why People Get Involved in Politics. Toronto:The Free Press of Glencoe.
Laver, Michael. 1997. Private Desires, Political Action. An Invitation to the Poli-tics of Rational Choice. London: Sage Publications.
Lijphart, Arend. 1971. “Comparative Politics and the Comparative Method.”American Political Science Review 65(3):682–693.
Lipset, Seymour Martin. 1969. Political Man. London: Heinemann.
Long, J. Scott. 1997. Regression Models for Categorical and Limited DependentVariables. Thousand Oaks, CA: Sage.
237
SMETS, Kaat (2010), A Widening Generational Divide? Assessing the Age Gap in Voter Turnout Between Younger and Older Citizens European University Institute
DOI: 10.2870/15899
Bibliography
Long, J. Scott and Jeremy Freese. 2006. Regression Models for Categorical Vari-ables Using Stata. College Station, TX: Stata Press.
Lutz, Georg and Michael Marsh. 2007. “Introduction: Consequences of LowTurnout.” Electoral Studies 26(3):539–547.
Mayer, Karl Ulrich. 2004. “Whose Lives? How History, Societies, and InstitutionsDefine and Shape Life Courses.” Research in Human Development 1(3):161–187.
McDaniel, Timothy. 2007. “Regression Analysis II.” Course pack ICPSR SummerProgram Ann Arbor, MI.
McDonald, Michael P. and Samuel L. Popkin. 2001. “The Myth of the VanishingVoter.” American Political Science Review 95(4):963–974.
Milbrath, Lester W. 1965. Political Participation? How and Why Do People GetInvolved in Politics? Chicago, IL: Rand McNally & Co.
Morgan, Bryn. 2001. “General Election Results, 7 June 2001.” House of CommonsResearch Paper 01/54; Social and General Statistics Section. London: House ofCommons Library.
Neue Zuricher Zeitung. 07.05.2007. “Bern will das Stimmrechtsalter senken. Ju-gendliche sollen mit 16 jahren stimmen in wahlen durfen.”.
Neundorf, Anja. 2008. “Is It Just the Age or the Nature of Times? Age, Cohort andthe Effect of the Collapse of State Socialism on the Satisfaction with Democ-racy of Young Europeans.” Paper presented at ‘Youth and Politics: StrangeBedfellows? Comparative Perspectives on Political Socialization’. Bruges, 3-4thJuly.
Neundorf, Anja, Kaat Smets and Gema M. Garcıa Albacete. 2009. “Dissectingthe Political Life-Cycle. A Latent Growth Model of the Impact of Life-CycleEvents on Political Interest.” Paper presented at the 8th Dutch-Flemish Politi-cologenetmaal, Nijmegen, the Netherlands, May 28-29.
Nie, Norman H., Sidney Verba and Jae-On Kim. 1974. “Political Participationand the Life Cycle.” Comparative Politics 6(3):319–340.
Niemi, Richard G. and Jane Junn. 1998. Civic Education. What Makes StudentsLearn? New Haven, NJ: Yale University Press.
Norris, Pippa. 2002. Democratic Phoenix. Reinventing Political Activism. Cam-brdige, MA: Cambridge University Press.
238
SMETS, Kaat (2010), A Widening Generational Divide? Assessing the Age Gap in Voter Turnout Between Younger and Older Citizens European University Institute
DOI: 10.2870/15899

Bibliography
Norris, Pippa. 2003. “Young People & Political Activism: From the Politics ofLoyalties to the Politics of Choice?” Paper presented at The Council of EuropeSymposium: ”Young people and democratic institutions: from disillusionmentto participation”. Strasbourg: November 27-28.
OECD. 2006. “Societies at a Glance. OECD Social Indicators – 2006 Edition.”Secretary General of the OECD; Paris: OECD Publishing.
OECD. 2007. “Babies and Bosses: Reconciling Work and Family Life. A Synthe-sis of Findings for OECD Countries.” Secretary General of the OECD; Paris:OECD Publishing.
O’Neill, Brenda. 2003. “Examining Declining Electoral Turnout Among Canada’sYouth.” Electoral Insight 5(2):15–19.
O’Toole, Therese. 2003. “Engaging with Young People’s Conception of the Polit-ical.” Children’s Geographies 1(1):71–90.
O’Toole, Therese. 2004. “Explaining Young People’s Non-Participation: Towardsa Fuller Understanding of the Political.” Paper presented at the ECPR JointSessions of Workshops. Uppsala, April 13-18.
O’Toole, Therese, Michael Lister, Dave Marsh, Su Jones and Alex McDonagh.2003. “Tuning Out or Left Out? Participation and Non-Participation AmongYoung People.” Contemporary Politics 9(1):45–61.
Pammett, Jon H. and Lawrence LeDuc. 2003. “Confronting the Problem of De-clining Voter Turnout Among Youth.” Electoral Insight 5(2):3–8.
Pateman, Carol. 1970. Participation and Democratic Theory. Cambridge, MA:Cambridge University Press.
Pennings, Paul. 2002. Voters, Elections and Ideology in European Democracies.In Comparative Democratic Politics. A Guide to Contemporary Theory and Re-search, ed. Hans Keman. London: Sage.
Pettersen, Per Arnt and Lawrence E. Rose. 2007. “The Dog That Didn’t Bark:Would Increased Electoral Turnout Make a Difference?” Electoral Studies26(3):574–588.
Phelps, Edward. 2004. “Young Citizens and Changing Electoral Turnout, 1964-2001.” The Political Quarterly 75(3):238–248.
239
SMETS, Kaat (2010), A Widening Generational Divide? Assessing the Age Gap in Voter Turnout Between Younger and Older Citizens European University Institute
DOI: 10.2870/15899
Bibliography
Phelps, Edward. 2006. “Young Adults and Electoral Turnout in Britain: Towardsa Generational Model of Political Participation.” SEI Working Paper 92; Sussex:Sussex European Institute.
Pirie, Madsen and Robert M. Worcester. 1998. “The Millennial Generation.”London: Adam Smith Institute.
Plutzer, Eric. 2002. “Becoming a Habitual Voter: Inertia, Resources, and Growthin Young Adulthood.” American Political Science Review 96(1):41–56.
Powers, Daniel A. and Yu Xie. 2000. Statistical Methods for Categorical DataAnalysis. San Diego: Academic Press.
Przeworski, Adam and Henry Teune. 1966. “Equivalence in Cross-National Re-search.” The Public Opinion Quarterly 30(4):551–568.
Przeworski, Adam and Henry Teune. 1970. The Logic of Comparative So-cial Inquiry. Comparative Studies in Behavioural Science. New York: Wiley-Interscience.
Putnam, Robert D. 2000. Bowling Alone. The Collapse and Revival of AmericanCommunity. Simon & Schuster.
Raghunathan, Trivellore E. 2004. “What Do We Do with Missing Data? Some Op-tions for Analysis of Incomplete Data.” Annual Review of Public Health 25:99–117.
Riker, William H. and Peter C. Ordeshook. 1968. “A Theory of the Calculus ofVoting.” American Political Science Review 62(1):25–42.
Riley, Matilda W. 1973. “Aging and Cohort Succession: Interpretations and Mis-interpretations.” The Public Opinion Quarterly 37(1):35–49.
Rosema, Martin. 2007. “Low Turnout: Threat to Democracy or Blessing in Dis-guise? Consequences of Citizens’ Varying Tendencies to Vote.” Electoral Studies26(3):612–623.
Rosenstone, Steven J. 1982. “Economic Adversity and Voter Turnout.” AmericanJournal of Political Science 26(1):25–46.
Rosenstone, Steven J. and John Mark Hansen. 1993. Mobilization, Participationand Democracy in America. New York, NJ: MacMillan.
Royston, Patrick. 2004. “Multiple Imputation of Missing Values.” The Stata Jour-nal 4(3):227–241.
240
SMETS, Kaat (2010), A Widening Generational Divide? Assessing the Age Gap in Voter Turnout Between Younger and Older Citizens European University Institute
DOI: 10.2870/15899

Bibliography
Royston, Patrick. 2005a. “Multiple Imputation of Missing Values: Update.” TheStata Journal 5(2):188–201.
Royston, Patrick. 2005b. “Multiple Imputation of Missing Values: Update of ice.”The Stata Journal 5(4):527–536.
Rubenson, Daniel, Andre Blais, Patrick Fournier, Elisabeth Gidengil and NeilNevitte. 2004. “Accounting for the Age Gap in Turnout.” Acta Politica39(4):407–421.
Rubenson, Daniel, Andre Blais, Patrick Fournier, Elisabeth Gidengil and NeilNevitte. 2007. “Does Low Turnout Matter? Evidence From the 2000 CanadianFederal Election.” Electoral Studies 26(3).
Rubin, Donald B. 1987. Multiple Imputation for Nonresponse in Surveys. NewYork, NJ: Wiley & Sons.
Schafer, Joseph L. and John W. Graham. 2002. “Missing Data: Our View of theState of the Art.” Psychological Methods 7(2):147–177.
Schlozman, Kay Lehman and Sidney Verba. 1979. Injury to Insult. Unemployment,Class, and Political Response. Cambridge, MA: Harvard University Press.
Schmitter, Philippe C. and Alexander H. Trechsel, eds. 2004. The Future of Democ-racy in Europe. Trends, Analyses and Reforms. Strasbourg: Council of EuropePublishing.
Sears, David O. and Sheri Levy. 2003. Childhood and Adult Political Development.In Oxford Handbook of Political Psychology, ed. David O. Sears, Leonie Huddyand Robert Jervis. Oxford: Oxford University Press.
Sigel, Roberta S. 1989. Part II Introduction: The World of Work. In PoliticalLearning in Adulthood. A Sourcebook of Theory and Research, ed. Roberta S.Sigel. Chicago, IL: The University of Chicago Press.
Sigel, Roberta S. and Marilyn B. Hoskin. 1981. The Political Involvement ofAdolescents. Brunswick, NJ: Rutgers University Press.
Sondheimer, Rachel M. and Donald P. Green. 2010. “Using Experiments to Esti-mate the Effects of Education on Voter Turnout.” American Journal of PoliticalScience 54(1):174–189.
Stata Corporation. 2007a. Stata User’s Guide. Longitudinal/Panel Data. Release10. College Station, TX: Stata Corp. LP.
241
SMETS, Kaat (2010), A Widening Generational Divide? Assessing the Age Gap in Voter Turnout Between Younger and Older Citizens European University Institute
DOI: 10.2870/15899

Bibliography
Stata Corporation. 2007b. Stata User’s Guide. Release 10. College Station, TX:Stata Corp. LP.
Stimson, James A. 1985. “Regression in Space and Time: A Statistical Essay.”American Journal of Political Science 29(4):914–947.
Stoker, Laura and M. Kent Jennings. 1995. “Life-Cycle Transitions and Politi-cal Participation: The Case of Marriage.” American Political Science Review89(2):421–433.
Stolle, Dietlind and Marc Hooghe. 2004. “The Roots of Social Capital: Attitudinaland Network Mechanisms in the Relation between Youth and Adult Indicatorsof Social Capital.” Acta Politica 39(4):422–441.
Stolle, Dietlind and Marc Hooghe. 2005a. “Review Article: Inaccurate, Excep-tional, One-Sided or Irrelevant? The Debate about the Alleged Decline of SocialCapital and Civic Engagement in Western Societies.” British Journal of PoliticalScience 35(1):149–167.
Stolle, Dietlind and Marc Hooghe. 2005b. “Shifting Inequalities? Patterns ofExclusion and Inclusion in Emerging Forms of Political Participation.” BritishJournal of Political Science .
Stolle, Dietlind, Marc Hooghe and Michele Micheletti. 2005. “Politics in the Su-permarket: Political Consumerism as a Form of Political Participation.” Inter-national Political Science Review 26(3):245–269.
Strate, John M., Charles J. Parrish, Charles D. Elder and Coit Ford. 1989. “LifeSpan Civic Development and Voting Participation.” American Political ScienceReview 83(2):443–464.
Tagesanzeiger. 04.05.2007. “SP fordert Stimmrechtsalter 16.”.
Tenn, Steven. 2007. “The Effect of Education on Voter Turnout.” Political Analysis15(4):446–464.
Teorell, Jan, Paul Sum and Mette Tobiasen. 2007. Participation and PoliticalEquality. An Assessment of Large-Scale Democracy. In Citizenship and Involve-ment in European Democracies. A Comparative Analysis, ed. Jan W. Van Deth,Jose Ramon Montero and Anders Westholm. London: Routledge.
Tetteh, Edmund. 2008. “Election Statistics: UK 1918-2007.” House of CommonsResearch Paper 08/12, Social and General Statistics Section. London: House ofCommons Library.
242
SMETS, Kaat (2010), A Widening Generational Divide? Assessing the Age Gap in Voter Turnout Between Younger and Older Citizens European University Institute
DOI: 10.2870/15899

Bibliography
Thomassen, Jacques. 2005. Introduction. In The European Voter. A Compara-tive Study of Modern Democracies, ed. Jacques Thomassen. Oxford: OxfordUniversity Press.
Thornton, Arland, William G. Axinn and Yu Xie. 2007. Marriage and Cohabita-tion. Chicago, IL: The University of Chicago Press.
Topf, Richard. 1995a. Beyond Electoral Participation. In Citizens and the State,ed. Hans-Dieter Klingemann. Oxford: Oxford University Press.
Topf, Richard. 1995b. Electoral Participation. In Citizens and the State, ed. Hans-Dieter Klingemann. Oxford: Oxford University Press.
Torney-Purta, Judith and Jo-Ann Amadeo. 2003. “A Cross-National Analysis ofPolitical and Civic Involvement Among Adolescents.” PS: Political Science &Politics 36(2):269–274.
van de Vijver, Fons J. R. 2003. Bias and Equivalence: Cross-Cultural Perspectives.In Cross-Cultural Survey Methods, ed. Janet A. Harkness, Fons J. R. van deVijver and Peter Ph. Mohler. Hoboken, NJ: Wiley-Interscience.
van der Brug, Wouter, Cees van der Eijk and Mark N. Franklin. 2007. The Econ-omy and the Vote. Economic Conditions and Elections in Fifteen Countries.Cambridge, MA: Cambridge University Press.
van Deth, Jan W. 1998. Equivalence in Comparative Research. In ComparativePolitics. The Problem of Equivalence, ed. Jan W. van Deth. London: Routledgepp. 1–19.
Verba, Sidney and Norman H. Nie. 1972. Participation in America. PoliticalDemocracy and Social Equality. New York: Harper & Row.
Wass, Hanna. 2007. “The Effects of Age, Generation and Period on Turnout inFinland 1975-2003.” Electoral Studies 26(3):648–659.
Wattenberg, Martin P. 2008. Is Voting for Young People? New York, NJ: PearsonLongman.
Wolfinger, Raymond E. and Steven J. Rosenstone. 1980. Who votes? New Haven,NJ: Yale University Press.
Wooldridge, Jeffrey M. 2002. Econometric Analysis of Cross Section and PanelData. Cambridge, MA: MIT Press.
243
SMETS, Kaat (2010), A Widening Generational Divide? Assessing the Age Gap in Voter Turnout Between Younger and Older Citizens European University Institute
DOI: 10.2870/15899