High-density lipoprotein proteome dynamics in human endotoxemia
Upload
independentCategory
view
3download
0
RESEARCHARTICLE
The proteome and transcriptome analysis of Bacillussubtilis in response to salicylic acid
Nguyen Van Duy1, Ulrike M�der2, Ngoc Phuong Tran3, Jean-Francois Cavin3,Le Thi Tam1, Dirk Albrecht1, Michael Hecker1 and Haike Antelmann1
1 Institute for Microbiology, Ernst-Moritz-Arndt-University of Greifswald, Greifswald, Germany2 Center for Functional Genomics, Ernst-Moritz-Arndt-University of Greifswald, Greifswald, Germany3 Laboratoire de Microbiologie UMR UB/INRA 1232, ENSBANA, Universit� de Bourgogne, Dijon, France
Phenolic acids that are present in plant–soil ecosystems can be considered as toxins whichinduce specific stress responses in microorganisms. In this paper, we have analyzed the globalresponse of the soil bacterium Bacillus subtilis to salicylic acid using proteomics and tran-scriptomics. The results demonstrate that salicylic acid caused predominantly the induction ofthe SigmaB-dependent general stress response in B. subtilis which is not related to the acidicconditions. Treatment of B. subtilis with growth-inhibitory concentrations of 4 mM salicylic acidcaused protein damage in B. subtilis as reflected by the induction of the CtsR and Spx regulons.Both phenolic acid decarboxylases (pads) of B. subtilis padC and bsdBCD (yclBCD) were inducedby 4 mM salicylic acid that were previously shown to be involved in decarboxylation and detoxi-fication of different phenolic acids. Deletion of the putative LysR-type regulator encoded by thedivergently transcribed bsdA (yclA) gene upstream of the bsdBCD operon revealed that BsdA isthe transcriptional activator of bsdBCD expression in response to salicylic acid. Phenotype anal-ysis of bsdA and padC single and double mutants demonstrated that both pads confer resistanceto salicylic acid in B. subtilis.
Received: September 19, 2006Revised: November 24, 2006Accepted: December 4, 2006
Keywords:Bacillus subtilis / Phenolic acid decarboxylases / Salicylic acid / Transcriptome
698 Proteomics 2007, 7, 698–710
1 Introduction
The soil-dwelling bacterium Bacillus subtilis is regarded as amodel organism for physiological studies of Gram-positivebacteria. Different stress-, starvation- or antibiotic-responsivestimulons were classified into specifically and generallyinduced regulons by the comparative proteome and tran-scriptome analyses of B. subtilis wild-type with mutants in
central regulatory genes. This complex dataset of expressionprofiles is a prerequisite to predict the target and resistancemechanisms of B. subtilis in response to new antimicrobials,xenobiotics, or aromatic compounds. The completion of thisdataset of expression profiles in response to other com-pounds present in the habitat of B. subtilis is important forthe understanding of the adaptation and detoxificationmechanisms of microorganisms in general.
Phenolic acids such as ferulic, p-coumaric, and caffeicacids are lignin-related aromatic acids which bind the com-plex lignin polymer to the hemicellulose and cellulose in theplant cell walls [1]. In plant–soil ecosystems, these cell wallpolymers are degraded by hemicellulases, which are pro-duced by several fungi and bacteria, and the phenolic acidsare released as free acids [2]. Phenolic acids are natural toxinswhich inhibit the growth and cause specific stress responsesin microorganisms which allow adaptation and confer resis-
Correspondence: Dr. Haike Antelmann, Institute for Microbiol-ogy, Ernst-Moritz-Arndt-University of Greifswald, F.-L.-Jahn-Strasse 15, D-17487 Greifswald, GermanyE-mail: [email protected]: 149-3834-864202
Abbreviations: MIC, minimal inhibitory concentration; pad, phe-nolic acid decarboxylase
DOI 10.1002/pmic.200600706
ª 2007 WILEY-VCH Verlag GmbH & Co. KGaA, Weinheim www.proteomics-journal.com

Proteomics 2007, 7, 698–710 Microbiology 699
tance to these compounds [3–6]. For example, ferulic acidinduces virulence gene expression in Agrobacterium tumefa-ciens and proton pumps are induced in response to cinnamicacid in Saccharomyces cerevisiae [7, 8]. However, phenolicacids can also serve as the sole carbon-energy source in otherbacteria such as Pseudomonas and Acinetobacter calcoaceticus[9, 10]. Thus, the catabolism of phenolic acids is essential forthe biodegradation of plant wastes in the soil. The degrada-tion of phenolic acids mainly involves inducible microbialphenolic acid decarboxylases (pads) which play significantroles in the detoxification of aromatic compounds in the soil,water, and sediments contaminated with benzene-derivativesof industrial origin [11]. Pads are considered as specific stressresponse to overcome the phenolic acid toxicity. In B. subtilis,there are two inducible pads involved in the detoxification ofphenolic acids. PadC catalyzes the detoxification of p-cou-maric, ferulic, and caffeic acids and induction of the padCgene was shown to be regulated by the PadR repressor [12,13]. A recent phylogenetic study revealed the presence of asecond microbial conserved hydroxybenzoate decarboxylaseencoded by the yclBCD operon that was renamed as bsdBCD[14]. The bsdBCD gene cluster encodes an inducible vanillatedecarboxylase of B. subtilis as shown by the activity measure-ments [14]. The presence of more than two inducible padswas also reported for the lactic acid bacterium Lactobacillusplantarum [15].
To the best of our knowledge, there are no reports on theglobal change of gene expression in response to phenolicacids in B. subtilis. Thus, the main goal of the present studywas to investigate the gene expression profile of B. subtilis inresponse to salicylic acid using the transcriptome and pro-teome approaches. The results demonstrate the induction ofthe SigmaB-dependent general stress response by salicylicacid which was not connected to the acidic conditions. Inaddition, both pads (PadC and BsdBCD) involved in adapta-tion and detoxification of aromatic acids were shown to berequired for resistance to salicylic acid. Furthermore, somegenes of unknown functions were specifically induced bysalicylic acid which could be involved in salicylic acid detox-ification.
2 Materials and methods
2.1 Bacterial strains and growth conditions
The bacterial strains used were B. subtilis 168 (trpC2) [16],DbsdA (trpC2, yclA::pMutin4; Emr); BS783 (trpC2,padC::Cmr); and DbsdADpadC (trpC2, yclA:pMutin4;Emr
padC::Cmr). Escherichia coli strain DH5a was used for stand-ard cloning procedures [17, 18]. B. subtilis strains were culti-vated under vigorous agitation at 377C in Belitsky minimalmedium as described previously [19]. E. coli was grown inLuria-Bertani broth medium (LB). The following antibioticswere used: ampicillin at 100 mg/mL in E. coli, erythromycinand chloramphenicol at 5 mg/mL in B. subtilis.
2.2 DNA techniques and mutant construction
Procedures for DNA purification, restriction, ligation, aga-rose gel electrophoresis, and transformation of E. coli andB. subtilis were carried out as described previously [20]. TheDbsdA mutant was constructed by the EU consortium by anintegration of the nonreplicating pMutin4 plasmid in thetarget gene via a single crossover recombination [21].
To construct the B. subtilis DpadC mutant (BS783), a320 bp DNA fragment was amplified by PCR correspondingto the DNA region located 299 bp upstream and 20 bpdownstream of the padC start codon using the primers PadC-for (50 TGTAGAATTCAAACAGCAGATCATGAACTG 30)containing an EcoRI site and PadC-rev (50 ATGCGGATCGA-TAAAGTTTTCCATCTTACACAC 30) containing a BamHIsite. The amplified fragment was cleaved with EcoRI andBamHI and cloned into the corresponding sites of plasmidpJM783, which was kindly provided by Marta Perego(Scripps Research Clinic Institute, La Jolla, CA) [22], result-ing in pJPADZ. The B. subtilis DpadC mutant (BS783) wasobtained by a Campbell-type integration (single cross-over)of pJPADZ into the padC region of the chromosome andselected on LB agar with 5 mg/L chloramphenicol. Correctintegration of plasmids or resistance markers into the chro-mosome of B. subtilis was verified by Southern blotting. TheDpadC mutant lacked the functional padC promoter andshowed no pad activity according to previously describedassays [15]. In addition, no padC specific transcript wasdetected in response to phenolic acids using RNA of theDpadC mutant as revealed by Northern blot experiments(data not shown). The DpadCDbsdA double mutant was con-structed by transforming the DpadC mutant (BS783) withchromosomal DNA of the DbsdA mutant. Northern blotexperiments verified that neither transcription of padC nortranscription of the bsdBCD operon occurred in thisDpadCDbsdA double mutant.
2.3 Minimal inhibitory concentration assays, growthcurves, and viable counts
The minimal inhibitory concentration (MIC) of salicylic acidwas defined as the lowest concentration that inhibited visiblegrowth (4 mM salicylic acid) which was determined in 5 mLtest tubes at different dilutions as described previously [23].For growth and viability experiments different concentrationsof salicylic acid (2–8 mM) were added to exponentially grow-ing cultures at an OD at 500 nm (OD500) of 0.4. Appropriatedilutions were plated on LB plates, incubated overnight at377C and counted for colony forming units (CFU/mL).
2.4 Preparation of the cytoplasmicL-[35S]methionine-labeled protein fraction
Cells grown in minimal medium to an OD500 of 0.4 werepulse-labeled for 5 min each with 10 mCi of L-[35S]methioninepermL before (control) and after 10 min, 20 min, and 30 min
ª 2007 WILEY-VCH Verlag GmbH & Co. KGaA, Weinheim www.proteomics-journal.com

700 N. V. Duy et al. Proteomics 2007, 7, 698–710
of exposure to 4 mM salicylic acid (16MIC). Preparation ofthe cytoplasmic L-[35S]methionine-labeled protein fractionwas performed as described previously [23].
2.5 2-DE and image analysis
The protein content was determined using the Bradfordassay [24] and 80 mg of L-[35S]methionine-labeled proteinextract was separated by 2-D PAGE using the nonlinear IPGsin the pH range 4–7 (Amersham Biosciences, Uppsala,Sweden) and a Multiphor II apparatus (Amersham Pharma-cia Biotech) as described previously [23]. For identification ofthe proteins by MS, nonradioactive protein samples of200 mg were separated by preparative 2-D PAGE and the 2-Dgels were stained with Colloidal CBB (Amersham Bio-sciences). The quantitative image analysis was performedwith the Decodon Delta 2D software (http://www.deco-don.com) as described previously [23]. Proteins showing aninduction of at least twofold during the L-[35S]methioninepulse in two independent experiments were designated asmarker proteins.
2.6 Protein identification by MALDI-TOF-TOF MS
Spot cutting from Colloidal CBB-stained 2-D gels, trypticdigestion of the proteins, and spotting of the resulting pep-tides onto the MALDI-targets (Voyager DE-STR, PerSeptiveBiosystems) were performed using the Ettan Spot HandlingWorkstation (Amersham Biosciences), according to thestandard protocol described previously [25]. The MALDI-TOF-TOF measurement of spotted peptide solutions wascarried out on a Proteome-Analyzer 4700 (Applied Biosys-tems, Foster City, CA, USA) as described previously [25].
2.7 Transcriptome analysis
Isolation of total RNA was performed using the KingFisher(Thermo Electron, Dreieich, Germany) and the MagNA PureLC RNA Isolation Kit I (Roche Diagnostics, Penzberg, Ger-many). RNA concentration and quality were determinedwith the Bioanalyzer 2100 (Agilent Technologies, Berlin,Germany) according to the instructions of the manufacturer.Generation of fluorescence-labeled cDNA and hybridizationwith B. subtilis whole-genome microarrays (Eurogentec)were performed according to the instructions of the manu-facturer as described previously [26]. The fluorescenceintensities of the two dyes were detected via the ScanArray�
Express scanner (PerkinElmer Life and Analytical Sciences,Rodgau-J�gesheim, Germany) using the ScanArray� Ex-press image analysis software. For each condition, duplicatesof microarray experiments were performed.
2.8 Northern blot experiments
Total RNA of the B. subtilis strains was isolated from cellsbefore and after the exposure of the cells to salicylic acid by
the acid phenol method as described in [27]. Northern blotanalyses were performed as described previously [28].Hybridizations specific for yclB and padC were conductedwith the digoxigenin-labeled RNA probes synthesized invitro with T7 RNA polymerase from T7 promoter containinginternal PCR products of yclB and padC using the followingprimers, respectively:
yclB-T7 for (50 TGAAACTCGTTGTCGGAATG 30),yclB-T7 rev (50 CTAATACGACTCACTATAGGGAGAAT-
GGTGCCCATTTTCGTAAG 30),padC-T7 for (50 GAAAACGGATGGGAATACGA 30),padC-T7 rev (50 CTAATACGACTCACTATAGGGAGAG-
CGCGAATATCGTCTGTCAT 30).
3. Results and discussion
3.1 Growth curves, viable counts, and pHmeasurements for salicylic acid in B. subtilis 168
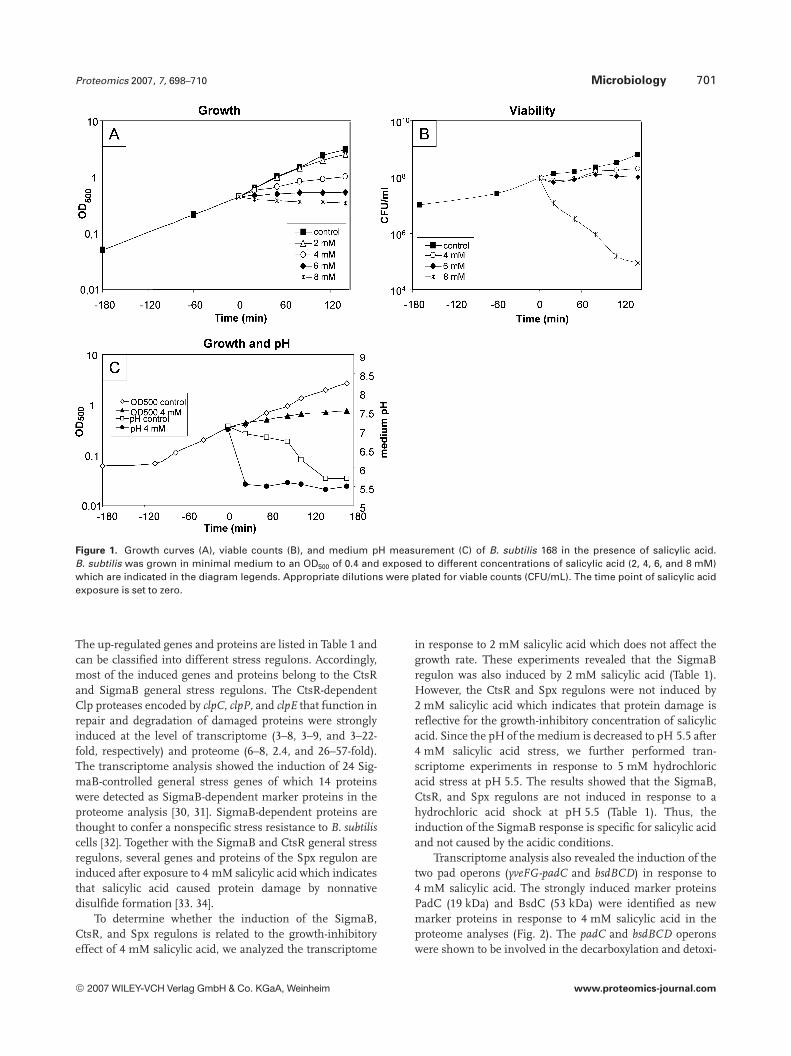
The natural concentration range of salicylic acid in unculti-vated soil and soil from the rhizosphere of maize is approxi-mately 114–140mg per 100 g of soil (10 mM) [29]. The MIC ofsalicylic acid in B. subtilis was determined as 4 mM whichcaused a half-maximal growth rate (Fig. 1A). Thus, the con-tent of salicylic acid present in soil accounts for 0.25% of theconcentration required to inhibit the growth of B. subtilis.Viability assays revealed that the number of cells does notdecrease after treatment with 4 mM salicylic acid (Fig. 1B).However, concentrations of 6 mM salicylic acid completelyinhibited the growth and 8 mM salicylic acid decreased sig-nificantly the number of viable cells. These results indicatethat 8 mM salicylic acid is toxic for B. subtilis (Figs. 1A and B).It has been demonstrated in other studies that phenolic acidssuch as p-coumaric acid were also toxic for L. plantarum [12].The pH of the medium is decreased from 7.5 to 5.5 after4 mM salicylic acid exposure which implies that salicylic acidimposes acid stress to the cells (Fig. 1C). Thus, it might bethat the toxicity of higher concentrations of salicylic acid iscaused by a further pH downshift.
3.2. Expression profile of B. subtilis 168 in response tosalicylic acid
To investigate the changes in the gene expression profile inresponse to salicylic acid, transcriptome, and proteomeanalyses were performed after different times of exposure to4 mM salicylic acid stress (10, 20, and 30 min). Genes andproteins with induction ratios of at least threefold in twotranscriptome experiments and twofold in two proteomeexperiments were considered as significantly up-regulated.The transcriptome analysis revealed the induction of 95genes corresponding to 75 transcriptional units after 10 minof salicylic acid stress (Table 1). The analysis of the proteinsynthesis profile showed the induction of 43 marker proteinsafter 10–30 min in response to 4 mM salicylic acid (Fig. 2).
ª 2007 WILEY-VCH Verlag GmbH & Co. KGaA, Weinheim www.proteomics-journal.com
Proteomics 2007, 7, 698–710 Microbiology 701
Figure 1. Growth curves (A), viable counts (B), and medium pH measurement (C) of B. subtilis 168 in the presence of salicylic acid.B. subtilis was grown in minimal medium to an OD500 of 0.4 and exposed to different concentrations of salicylic acid (2, 4, 6, and 8 mM)which are indicated in the diagram legends. Appropriate dilutions were plated for viable counts (CFU/mL). The time point of salicylic acidexposure is set to zero.
The up-regulated genes and proteins are listed in Table 1 andcan be classified into different stress regulons. Accordingly,most of the induced genes and proteins belong to the CtsRand SigmaB general stress regulons. The CtsR-dependentClp proteases encoded by clpC, clpP, and clpE that function inrepair and degradation of damaged proteins were stronglyinduced at the level of transcriptome (3–8, 3–9, and 3–22-fold, respectively) and proteome (6–8, 2.4, and 26–57-fold).The transcriptome analysis showed the induction of 24 Sig-maB-controlled general stress genes of which 14 proteinswere detected as SigmaB-dependent marker proteins in theproteome analysis [30, 31]. SigmaB-dependent proteins arethought to confer a nonspecific stress resistance to B. subtiliscells [32]. Together with the SigmaB and CtsR general stressregulons, several genes and proteins of the Spx regulon areinduced after exposure to 4 mM salicylic acid which indicatesthat salicylic acid caused protein damage by nonnativedisulfide formation [33. 34].
To determine whether the induction of the SigmaB,CtsR, and Spx regulons is related to the growth-inhibitoryeffect of 4 mM salicylic acid, we analyzed the transcriptome
in response to 2 mM salicylic acid which does not affect thegrowth rate. These experiments revealed that the SigmaBregulon was also induced by 2 mM salicylic acid (Table 1).However, the CtsR and Spx regulons were not induced by2 mM salicylic acid which indicates that protein damage isreflective for the growth-inhibitory concentration of salicylicacid. Since the pH of the medium is decreased to pH 5.5 after4 mM salicylic acid stress, we further performed tran-scriptome experiments in response to 5 mM hydrochloricacid stress at pH 5.5. The results showed that the SigmaB,CtsR, and Spx regulons are not induced in response to ahydrochloric acid shock at pH 5.5 (Table 1). Thus, theinduction of the SigmaB response is specific for salicylic acidand not caused by the acidic conditions.
Transcriptome analysis also revealed the induction of thetwo pad operons (yveFG-padC and bsdBCD) in response to4 mM salicylic acid. The strongly induced marker proteinsPadC (19 kDa) and BsdC (53 kDa) were identified as newmarker proteins in response to 4 mM salicylic acid in theproteome analyses (Fig. 2). The padC and bsdBCD operonswere shown to be involved in the decarboxylation and detoxi-
ª 2007 WILEY-VCH Verlag GmbH & Co. KGaA, Weinheim www.proteomics-journal.com

702 N. V. Duy et al. Proteomics 2007, 7, 698–710
Figure 2. The dual-channelimage of the protein synthesispattern of B. subtilis 168 before(green image) and 10 min afterthe exposure to 4 mM salicylicacid (red image). Cytoplasmicproteins were labeled withL-[35S]methionine and separatedby 2-D PAGE as described inSection 2. Image analysis of theautoradiograms was performedusing the Decodon Delta 2Dsoftware. Proteins that are syn-thesized at increased levels inresponse to salicylic acid in atleast two independent experi-ments are indicated by redlabels and listed in Table 1.
fication of phenolic acids to less toxic vinyl phenol derivates[12, 14]. PadC was shown to display substrate-specificity fordecarboxylation of ferulic, p-coumaric, and caffeic acid [12].The bsdBCD operon catalyzed the specific detoxification ofvanillate [14]. However, no induction of padC and bsdBCDwas observed after exposure to 2 mM salicylic acid whichindicates that these decarboxylases are induced by growth-inhibitory concentrations of salicylic acid only. Salicylic acidseems to be decarboxylated to phenol by both phenylacrylicacid decarboxylases in B. subtilis. Phenol induced a classicalheat shock signature in B. subtilis as revealed by the induc-tion of the HrcA, SigmaB, and CtsR regulons [23]. In con-trast, the HrcA regulon is not induced after salicylic acidstress which indicates that salicylic acid caused no heat shocksignature in B. subtilis. Interestingly, the heat specific chap-erones were also not induced in response to acid stress in thecyanobacterium Synechocystis [35].
Exposure to 4 mM salicylic acid resulted further in theinduction of the bacitracin resistance determinant bcrC(4–8-fold) which encodes an undecaprenyl pyrophosphatephosphatase [36]. Thus, it seems that exposure to 4 mMsalicylic acid also affects the cell wall of B. subtilis. Finally,many genes and operons of unknown functions weresignificantly up-regulated by 4 mM salicylic acid. Of these
the yhcC gene was strongly induced by 2–4 mM salicylicacid (3–19-fold). In addition, the yuiAB operon, ynfC, andyfmP were strongly up-regulated by 4 mM salicylic acid(8–15-fold) and less strongly by 2 mM salicylic acid (2–3-fold). These genes could be involved in the specificdetoxification of salicylic acid. The yolF gene was inducedby 2–4 mM salicylic acid as well as hydrochloric acidstress. The remaining genes of unknown functions areinduced by 4 mM salicylic acid only (Table 1). These couldeither function in the detoxification of higher concentra-tions of salicylic acid or repair of salicylic acid-inducedprotein damage. The ybcF gene encodes a putative car-bonic anhydrase which could be involved in the hydrationof carbon dioxide resulting from the salicylic acid de-carboxylation to form a bicarbonate, and thus function inpH homeostasis.
The reduced growth rate in response to 4 mM sali-cylic acid caused the stringent response as indicated bythe repression of genes involved in translation such asgenes encoding ribosomal proteins [37]. In addition,other growth-phase-regulated genes are repressed bysalicylic acid that are involved in ATP generation, themetabolism of purine, pyrimidine, coenzymes, and cellwall turnover (Table 2).
ª 2007 WILEY-VCH Verlag GmbH & Co. KGaA, Weinheim www.proteomics-journal.com

Proteomics 2007, 7, 698–710 Microbiology 703
Table 1. Induction profile in response to salicylic acid (Sal) and hydrochloric acid (HCl) at pH 5.5 in B. subtilisa)
Regulon Gene Transcriptome Proteome Function/ Similarity
4 mM Sal 2 mM Sal 5 mM HCl 4 mM Sal
CtsR clpE 22.4 2.5 25.7 56.9 ATP-dependent Clp protease-like (class III stress gene)sB clpP 8.9 2.8 2.6 3.0 2.4 ATP-dependent Clp protease proteolytic subunit
clpC 7.7 2.5 8.1 5.9 Class III stress response-related ATPase
SigmaB ydaD 3.8 15.7 2.3 5.4 17.9 Similar to alcohol dehydrogenaseydaE 2.8 16.9 2.1 4.2 Similar to spore coat polysaccharide biosynthesis proteinydaG 2.6 5.4 General stress proteinysnF 9.0 8.0 UnknownyflT 5.2 17.7 3.0 11.3 8.6 9 General stress proteingsiB 14.2 16.7 3.1 18.5 6.6 78.4 General stress proteingtaB 5.9 6.5 UTP-glucose-1-phosphate uridylyltransferaseohrB 17.9 19.6 3.0 10.5 5.5 6.3 Organic hydroperoxide resistance proteinyfkM 12.5 8.5 2.7 7.2 5.5 7.9 Similar to peptidase C56ydaP 4.0 6.5 2.1 4.8 5.4 3.7 Similar to pyruvate oxidasegspA 6.7 5.0 2.5 4.1 4.6 7.9 General stress proteinyhdN 2.6 4.0 3.1 3.6 Similar to aldo/keto reductase
sW yceH 2.0 6.5 18.8 Similar to toxic anion resistance proteindps 2.2 3.5 2.1 4.4 2.7 5.3 Stress- and starvation-induced DNA binding proteincsbD 20.8 16.5 2.8 8.3 UnknownybyB 9.2 17.0 3.5 5.7 UnknownywsB 6.6 3.4 Similar to N-acetylmuramoyl-L-alanine amidaseyflG 6.2 3.7 Similar to methionine aminopeptidaseyflH 6.4 5.3 UnknownyvgN 5.7 6.2 Similar to dehydrogenase
s, RelA yvyD 5.6 3.1 7.6 7.6 Similar to sigma-54 modulating factor of gram-negative bacteriaywzA 4.7 10.6 2.5 5.4 Similar to transglycosylase-associated proteinyxaB 4.0 5.6 Similar to exopolysaccharide biosynthesis proteinkatE 3.4 4.0 Catalase 2
Spx yjbH 8.0 3.1 Similar to dithiol-disulfide isomerasesD nfrA 10.0 4.0 2.7 3.6 FMN-containing NADPH-linked nitro/flavin reductase
ywnF 7.8 4.8 UnknownsB trxA 6.8 4.9 Thioredoxin
yuaE 6.4 8.2 2.5 3.0 5.1 6.1 UnknownIolR iolS 5.5 3.0 6.2 7.4 Myo-inositol catabolism
yrzG 4.0 3.2 Similar to serine/threonine protein kinasesyhfK 3.9 3.3 3.3 Similar to nucleoside-diphosphate-sugar epimeraseyitW 3.8 4.1 Similar to adenine-specific DNA methylaseyfiC 3.8 6.4 Similar to ABC transporter (ATP-binding protein)pepF 3.0 2.7 4.2 6.8 Oligoendopeptidase FyojG 3.0 3.5 Similar to LMBE-related proteinyhcX 3.0 4.1 Similar to acetyltransferaseytzB 5.3 12.9 2.9 4.8 Unknown
PadR padC 11.4 2.4 8.3 13.0 Phenolic acid decarboxylase (pad)yveF – 3.9 Similar to unknown proteinsyveG 12.9 3.9 Similar to unknown proteins
BsdA bsdB 35.5 – Similar to phenylacrylic acid decarboxylasebsdC 10.8 8.3 7.9 14.9 Similar to 4-hydroxybenzoate decarboxylase subunit CbsdD 19.1 14.1 Similar to 4-hydroxybenzoate decarboxylase subunit D
Others abrB 3.6 5.1 Pleiotropic regulator of transition state genesamhX 2.7 – 3.9 3.9 Amidohydrolase
sX, sM bcrC 7.7 3.6 Bacitracin resistance protein
ª 2007 WILEY-VCH Verlag GmbH & Co. KGaA, Weinheim www.proteomics-journal.com

704 N. V. Duy et al. Proteomics 2007, 7, 698–710
Table 1. Continued
Regulon Gene Transcriptome Proteome Function/ Similarity
4 mM Sal 2 mM Sal 5 mM HCl 4 mM Sal
CymR cysK 13.5 5.2 4.4 4.9 Cysteine synthetase AfdhD 4.2 3.0 Formate dehydrogenase accessory proteinmoaA 4.7 4.2 Molybdenum cofactor biosynthesis protein AgcvT 2.6 2.9 4.8 3.2 Probable aminomethyltransferaselevD 3.2 6.2 PTS fructose-specific enzyme IIA componentndhF 4.3 4.6 NADH dehydrogenase subunit 5
(CcpA,sL/RocR)
rocA 4.9 3.7 Pyrroline-5 carboxylate dehydrogenaserocD 3.7 3.7 Ornithine–oxo-acid transaminasesalA(ybaL)
3.8 4.1 5.0 7.2 Mrp family regulator of the extracellular alkaline protease
TnrA, ureA 9.1 7.2 3.4 3.0 Urease (gamma subunit)CodY ureB 8.7 7.3 3.7 3.3 Urease (beta subunit)
ureC 6.2 5.1 2.7 2.1 7.2 13.7 Urease (alpha subunit)ybcC 4.2 7.6 Similar to unknown proteinsybcD 4.6 7.7 Similar to unknown proteinsybcF 5.4 9.6 Similar to carbonic anhydraseybcH 2.0 10.6 UnknownybcI 3.1 8.6 Similar to unknown proteinsybfA 5.4 10.7 Similar to MarR-type transcriptional regulatorybfB 5.0 4.6 Similar to permease of the major facilitator superfamily
CodY ybgE 4.2 6.5 Branched-chain amino acid aminotransferaseydaQ 3.2 3.5 UnknownyfhJ 9.2 3.2 Similar to catalase (peroxidase I)yfmP – 14.7 2.6 2.5 19.0 30.1 Similar to MerR-type transcriptional regulatoryhaA 4.0 5.7 Similar to aminoacylaseyhcC 3.1 19.2 15.7 18.3 UnknownyhcW 3.3 5.3 Similar to phosphoglycolate phosphataseyhzC 4.3 6.5 UnknownyjcF 3.9 4.8 Similar to acetyltransferase, GNAT familyyjcG 4.5 5.8 3.2 4.0 Similar to 2’-5’ RNA ligaseyjcH 4.6 5.3 Similar to Acetyl esteraseylbP 4.7 4.4 Similar to GCN5-related N-acetyltransferaseyneT 3.8 4.6 2.6 4.5 Similar to CoA binding domain family proteinynfC 8.5 7.2 2.6 2.6 UnknownyolF 7.8 9.5 3.2 3.5 4.3 2.5 Similar to unknown proteins
sM yqjL 6.5 3.5 Putative hydrolaseyrhI 5.0 5.0 Similar to TetR/AcrR-type transcriptional regulatoryrhJ 7.4 5.0 Similar to cytochrome P450yrhK 4.1 3.2 UnknownyuiA 14.5 11.3 3.3 2.6 UnknownyuiB 12.0 7.6 3.1 2.3 Similar to unknown proteins from B. subtilisyuiC 4.7 3.7 UnknownyvdT 7.0 3.6 Similar to TetR/AcrR-type transcriptional regulatorywfI 8.6 3.0 4.0 4.8 Similar to chlorite dismutaseyxaC 3.9 3.6 Similar to murein hydrolase export regulatoryxiE 6.6 3.0 Similar to universal stress family protein
a)All the genes with induction factors of at least threefold in two transcriptome experiments and proteins with protein synthesis ratios of atleast twofold in two proteome experiments after 10 min in response to 4 mM salicylic acid were listed and classified according to pre-viously described regulons (HrcA, sB, CtsR, Spx) [30, 31, 33]. The induction ratios of these genes are also shown for the 10 min time pointafter exposure to 2 mM salicylic acid in two transcriptome experiments. To determine which genes are induced by acid shock, the inductionratios of these genes are shown for the 10 min point after exposure to 5 mM hydrochloric acid stress at pH 5.5 in two transcriptomeexperiments. The main regulator of the induced genes is shown in bold-face. The gene function or similarity is derived from the SubtiListdatabase (http://genolist. pasteur.fr/SubtiList/index.html).
ª 2007 WILEY-VCH Verlag GmbH & Co. KGaA, Weinheim www.proteomics-journal.com

Proteomics 2007, 7, 698–710 Microbiology 705
Table 2. Repression of genes after 10 min in response to 4 mM salicylic acid in B. subtilisa)
Regulon Operon Gene Induction ratios Function/Similarity
Membrane bioenergetics (electron transport chain and ATP synthase)
RelA atp operon atpA 0.22 0.18 ATP synthase (subunit alpha)atpB 0.21 0.30 ATP synthase (subunit a)atpC 0.37 0.30 ATP synthase (subunit epsilon)atpD 0.46 0.13 ATP synthase (subunit beta)atpE 0.23 0.31 ATP synthase (subunit c)atpF 0.26 0.34 ATP synthase (subunit b)atpG 0.18 0.22 ATP synthase (subunit gamma)atpH 0.22 0.23 ATP synthase (subunit delta)atpI 0.29 0.33 ATP synthase (subunit i)
Cell wallwapA-yxxG wapA 0.31 0.29 Cell wall-associated protein precursor
Transport/ binding proteins and lipoproteins
opuAA_AB_AC opuAA 0.24 0.28 Glycine betaine ABC transporter (ATP-binding protein)opuAB 0.60 0.33 Glycine betaine ABC transporter (permease)opuAC 0.24 0.32 Glycine betaine ABC transporter (glycine betaine-binding)
PurR xpt-pbuX pbuX 0.25 0.04 Xanthine permeaseyfiY 0.15 0.12 Similar to iron (III) dicitrate transport permeaseyhaQ 0.25 0.33 Similar to ABC transporter (ATP-binding protein)
YtrA ytrABCDEF ytrB 0.50 0.38 Similar to ABC transporter (ATP-binding protein)ytrC 0.37 0.35 Putative cell membrane channel proteinytrD 0.40 0.17 Putative cell membrane channel proteinytrE 0.27 0.11 Similar to ABC transporter (ATP-binding protein)ytrF 0.25 0.19 Putative periplasmic lipoproteinyvrC 0.30 0.24 Similar to iron-binding protein
pyr operon pyrP 0.25 0.26 Uracil permease
Metabolism of nucleotides
PurR pur operon purB 0.20 0.04 Adenylosuccinate lyasepurC 0.28 0.05 Phosphoribosylaminoimidazole succinocarboxamide synthetasepurD 0.37 0.13 Phosphoribosylglycinamide synthetasepurE 0.22 0.04 Phosphoribosylaminoimidazole carboxylase IpurF 0.13 0.06 Glutamine phosphoribosylpyrophosphate amidotransferasepurH 0.25 0.09 Phosphoribosylaminoimidazole carboxy formyl formyltransferasepurK 0.25 0.05 Phosphoribosylaminoimidazole carboxylase IIpurL 0.18 0.03 Phosphoribosylformylglycinamidine synthetase IIpurM 0.16 0.06 Phosphoribosylaminoimidazole synthetasepurN 0.19 0.08 Phosphoribosylglycinamide formyltransferasepurQ 0.22 0.04 Phosphoribosylformylglycinamidine synthetase IpurS 0.33 0.10 Required for phosphoribosylformylglycinamidine synthetase activity
PyrR pyr operon pyrAA 0.19 0.11 Carbamoyl-phosphate synthetase (glutaminase subunit)pyrAB 0.32 0.09 Carbamoyl-phosphate synthetase (catalytic subunit)pyrB 0.24 0.16 Aspartate carbamoyltransferasepyrC 0.31 0.16 DihydroorotasepyrD 0.41 0.09 Dihydroorotate dehydrogenase (catalytic subunit)pyrK 0.35 0.11 Dihydroorotate dehydrogenase (electron transfer subunit)pyrE 0.45 0.14 Orotate phosphoribosyltransferasepyrF 0.50 0.11 Orotidine 5’-phosphate decarboxylase
RelA gcaD-prs-ctc prs 0.26 0.14 Phosphoribosylpyrophosphate synthetase
Metabolism of amino acids
(yqeGH-aroD-yqeIJKLM) aroD 0.31 0.25 Shikimate 5-dehydrogenasenadD (yqeJ) 0.42 0.26 Nicotinic acid mononucleotide adenylyltransferaseyqeG 0.42 0.35 Similar to unknown proteinsyqeH 0.42 0.28 Similar to unknown proteins
ª 2007 WILEY-VCH Verlag GmbH & Co. KGaA, Weinheim www.proteomics-journal.com

706 N. V. Duy et al. Proteomics 2007, 7, 698–710
Table 2. Continued
Regulon Operon Gene Induction ratios Function/Similarity
yqeI 0.40 0.33 Similar to unknown proteinsyqeK 0.38 0.23 Putative phosphataseyqeL 0.29 0.27 Similar to unknown proteinsyqeM 0.47 0.27 Similar to unknown proteins
Metabolism of carbohydratesackA 0.25 0.16 Acetate/propionate kinase
yoaDCB yoaD 0.24 0.21 Similar to phosphoglycerate dehydrogenaseyoaC 0.20 0.19 Similar to xylulokinaseyoaB 0.18 0.19 Similar to alpha-ketoglutarate permease
Metabolism of coenzymes
BirA bioWAFDBI bioI 0.23 0.34 Cytochrome P450 enzymebioA 0.26 0.39 Adenosylmethionine–8-amino-7-oxononanoate transaminasebioB 0.17 0.29 Biotin synthetasebioD 0.20 0.30 Dethiobiotin synthetasebioF 0.26 0.33 8-Amino-7-oxononanoate synthasebioW 0.28 0.49 6-Carboxyhexanoate-CoA ligaselipA 0.22 0.29 Probable lipoic acid synthetase
Transcription regulation
pyr operon pyrR 0.18 Transcriptional attenuation of the pyrimidine operonytrABCDEF ytrA 0.46 0.26 Similar to transcriptional regulator (GntR family)
RNA modification
ylqD-trmD-rimM trmD 0.29 0.47 tRNA methyltransferaserimM 0.29 0.29 Probable 16S rRNA processing proteinylqD 0.18 0.25 Similar to unknown proteins
Ribosomal proteins
RelA rplB 0.35 0.19 Ribosomal protein L2rplC 0.38 0.20 Ribosomal protein L3rplD 0.40 0.19 Ribosomal protein L4rplJ 0.55 0.31 Ribosomal protein L10rplN 0.53 0.30 Ribosomal protein L14rplP 0.49 0.28 Ribosomal protein L16rplV 0.42 0.20 Ribosomal protein L22rplW 0.36 0.26 Ribosomal protein L23rpmC 0.39 0.27 Ribosomal protein L29rpsC 0.45 0.19 Ribosomal protein S3rpsD 0.46 0.32 Ribosomal protein S4rpsG 0.41 0.26 Ribosomal protein S7rpsJ 0.42 0.22 Ribosomal protein S10rpsL 0.37 0.24 Ribosomal protein S12rpsQ 0.47 0.28 Ribosomal protein S17rpsS 0.40 0.21 Ribosomal protein S19
Unknown function
(yxiF-yxzC-yxiGH-yxzG) yxiF 0.27 0.28 UnknownyxiG 0.35 0.25 UnknownyxiH 0.27 0.32 UnknownyxzC 0.45 0.31 UnknownyxzG 0.28 0.25 Unknown
yxiJI yxiI 0.29 0.28 UnknownyxiJ 0.34 0.28 UnknownyxiK 0.29 0.26 Unknown
yxiM-deaD yxiM 0.37 0.26 UnknownyjhA 0.25 0.12 Putative lipoprotein
ª 2007 WILEY-VCH Verlag GmbH & Co. KGaA, Weinheim www.proteomics-journal.com

Proteomics 2007, 7, 698–710 Microbiology 707
Table 2. Continued
Regulon Operon Gene Induction ratios Function/Similarity
ykoF 0.26 0.16 Unknown; thiamin/HMP-binding family proteinyukCBA-yueB* yueB 0.24 0.13 Unknown
yukA 0.28 0.26 UnknownyukB 0.30 0.22 UnknownyukC 0.22 UnknownyxaI 0.27 0.19 Unknown
a)All the genes which were repressed at least threefold at the 10 min time points after the exposure to 4 mM salicylic acid in two inde-pendent transcriptome experiments are listed. The repressed genes were classified according to previously described regulons [37]. Themain regulator of the repressed genes is shown in bold-face. The gene function or similarity is derived from the SubtiList database (http://genolist.pasteur.fr/SubtiList/index.html).
Figure 3. Northern blot analyses and transcriptional organization of the yveFG–padC (A) and yclBCD (bsdBCD) (B) operons in the wild-typeand yclA (bsdA) mutant in response to 4 mM salicylic acid. For Northern blot experiments 5 mg RNA each were applied, isolated from theB. subtilis strains before (co) and at different times (10, 20, 30 min) after the exposure to 4 mM salicylic acid. The arrows point toward thesizes of the yveFG–padC and bsdBCD specific transcripts.
3.3 Transcription of the padC and bsdBCD operonsinvolved in the decarboxylation of salicylic acid
The transcriptome analysis revealed the strong induction ofthe pads padC (11-fold) and bsdBCD (10–36-fold) by 4 mMsalicylic acid. Northern blot experiments were performedusing padC and bsdB specific RNA probes to determine thesizes of the padC and the bsdBCD specific mRNAs. The padCspecific transcript corresponds to a size of 1 kb (Fig. 3A)which is larger than the previously mapped padC specifictranscript of 620 bp [12]. The size of the padC specific mRNAin our studies indicates that padC is cotranscribed togetherwith the upstream yveF and yveG genes (90 bp and 285 bp)which was verified by Northern blots using yveF and yveG
specific RNA probes (data not shown). In addition, the yveGgene was found to be 13-fold induced in the transcriptomeexperiments which confirms that yveFG–padC constitute atricistronic operon. This Northern blot result is in accor-dance with recent primer extension experiments whichmapped the transcriptional start point approximately 550 bpupstream of the padC start codon [38].
In the case of the bsdBCD operon, a single transcript ofapproximately 2.7 kb was detected which was absent in non-induced cells and increased strongly after different times(10–30 min) of exposure to salicylic acid (Fig. 3B). The size ofthis transcript points towards the expected size of thebsdBCD operon. The DNA sequence of the bsdBCD regionrevealed that a putative LysR-type transcriptional regulator is
ª 2007 WILEY-VCH Verlag GmbH & Co. KGaA, Weinheim www.proteomics-journal.com

708 N. V. Duy et al. Proteomics 2007, 7, 698–710
Figure 4. Analysis of the growth curves and viable counts of B. subtiliswild type and bsdA (A) padC (B), sB (C) and bsdA–padCmutants (D)in response to salicylic acid. B. subtilis strains were grown in minimal medium to an OD500 of 0.4 and treated with 2, 4 and 6 mM salicylicacid for the growth experiments and 4 mM salicylic acid for the viability assays. The time point of salicylic acid exposure is set to zero.Appropriate dilutions were plated for viable counts (CFU/mL).
ª 2007 WILEY-VCH Verlag GmbH & Co. KGaA, Weinheim www.proteomics-journal.com
Proteomics 2007, 7, 698–710 Microbiology 709
encoded by the upstream yclA gene which is transcribedopposite to the bsdBCD operon (Fig. 3B). Northern blotexperiments with a yclAmutant suggested that YclA could bea positive regulator of bsdBCD expression in response tosalicylic acid since transcription of the bsdBCD operon wassignificantly reduced in the yclAmutant. Thus, the yclA genewas renamed as bsdA since it encodes the transcriptionalactivator of the bsdBCD operon after salicylic acid. The diver-gent orientation is also observed for the regulatory genes ofother pad systems such as padR encoding the repressor ofpadA in Lactococcus plantarum and Bacillus pumilus [13].Exceptions are the padC and padR genes of B. subtilis whichare not located in each other’s vicinity [12]. In contrast toBsdA, most of the other regulators of the pad systems aredescribed as transcriptional repressors. Thus, it will beinteresting to analyze the mechanisms of bsdBCD operonactivation by BsdA in response to phenolic acids.
3.4 Growth and viability of bsdA, padC, bsdA–padC,and �B mutants after salicylic acid exposure
We further investigated whether the bsdBCD operon, padC,or the alternative stress sigma factor sB is essential for thegrowth and viability in response to salicylic acid in B. subtilis.For this purpose, DbsdA, DpadC, DsigB single mutants andthe DbsdADpadC double mutant were subjected to 2, 4, and6 mM salicylic acid and the growth curve and number ofviable counts were monitored. As reflected in Fig. 4, thegrowth and viability of the DbsdA, DpadC, and DsigB singlemutants were similar to the wild-type after exposure to sali-cylic acid (Fig. 4A–C). However, the deletion of both pads(PadC and BsdBCD) resulted in a cessation of growth andreduced significantly the number of viable counts in re-sponse to 4 mM salicylic acid (Fig. 4D). This indicates thatboth pads confer resistance to salicylic acid in B. subtilis andone pad system is able to compensate the lost of the otherone.
4 Conclusion
In the present study, we have investigated the global geneexpression profile of B. subtilis in response to salicylic acidby transcriptomics and proteomics. The results showedthat salicylic acid caused the induction of the SigmaB-de-pendent general stress response which was not connectedto the acidic conditions. Furthermore, both pads, padC,and bsdBCD involved in the decarboxylation of phenolicacids were identified as salicylic acid resistance determi-nants in B. subtilis. The proteomic and transcriptomicsignatures in response to salicylic acid complement thecatalog of expression profiles for B. subtilis and can beused to define the mode of actions of unknown xenobio-tics, antibiotics, or antimicrobials in B. subtilis. Finally,some genes of unknown functions including yfmP, yhcC,ynfC, yolF, and yuiAB are specifically induced by salicylic
acid. These could be candidate genes for future studies onphysiology and metabolism in response to phenolic acidsin B. subtilis.
We thank the Decodon company for support with the Deco-don Delta 2D software and Marta Perego (Scripps ResearchClinic Institute, La Jolla, CA) for providing the pJM783 vector.This work was supported by a scholarship of the “Ministry ofEducation and Training of Vietnam” (MOET) to N.V.D andL.T.T., and grants from the Deutsche Forschungsgemeinschaft,the Bundesministerium f�r Bildung und Forschung, the Fondsder Chemischen Industrie, the Bildungsministerium of the coun-try Mecklenburg-Vorpommern (EMAU 0202120) and EuropeanUnion grants (LSHG-CT-2004-503468) to M. H.
5 References
[1] de Vries, R. P., Michelsen, B., Poulsen, C. H., Kroon, P. A. etal., Appl. Environ Microbiol. 1997, 63, 4638–4644.
[2] Christov, L. P, Prior, B. A., Enzyme Microb. Technol. 1993, 15,460–475.
[3] Clausen, M., Lamb, C. J., Megnet, R., Doerner, P. W., Gene1994, 142, 107–112.
[4] Goodey, A. R., Tubb, R. S., J. Gen. Microbiol. 1982, 128,2615–2620.
[5] Lambert, L. A., Abshire, K., Blankenhorn, D., Slonczewski, J.L., J. Bacteriol. 1997, 179, 7595–7599.
[6] Zaldivar, J., Ingram, L. O., Biotechnol. Bioeng. 1999, 66, 203–210.
[7] Kalogeraki, V. S., Zhu, J., Eberhard, A., Madsen, E. L.,Winans, S., Mol. Microbiol. 1999, 34, 512–522.
[8] Chambel, A., Viegas, C. A., Sa-Correia, I., Int. J. Food Micro-biol. 1999, 50, 173–179.
[9] Diaz, E., Ferrandez, A., Prieto, M. A., Garcia, J. L., Microbiol.Mol. Biol. Rev. 2001, 65, 523–569.
[10] Lynd, L. R., Weimer, P. J., van Zyl, W. H., Pretorius, I. S.,Microbiol. Mol. Biol. Rev. 2002, 66, 506–577.
[11] Londry, K. L., Fedorak, P. M., Can. J. Microbiol. 1992, 38, 1–11.
[12] Cavin, J.-F., Dartois, V., Divi�s, C., Appl. Environ. Microbiol.1998, 64, 1466–1471.
[13] Gury, J., Barthelmebs, L., Tran, N. P., Divi�s, C., Cavin, J.-F.,Appl. Environ. Microbiol. 2004, 70, 2146–2153.
[14] Lupa, B., Lyon, D., Gibbs, M. D., Reeves, R. A., Wiegel, J.,Genomics 2005, 86, 342–351.
[15] Barthelmebs, L., Divi�s, C., Cavin, J.-F., Appl. Environ.Microbiol. 2000, 66, 3368–3375.
[16] Anagnostopoulos, C., Spizizen, J., J. Bacteriol. 1961, 81,741–746.
[17] Studier, F. W., Rosenberg, A. H., Dunn, J. J., Dubendorff, J.W.,Methods Enzymol. 1990, 185, 60–89.
[18] Sambrook, J., Fritsch, E. F., Maniatis, T., Molecular Cloning:A Laboratory Manual, Cold Spring Harbor Laboratory Press,Cold Spring Harbor, New York 1989.
ª 2007 WILEY-VCH Verlag GmbH & Co. KGaA, Weinheim www.proteomics-journal.com

710 N. V. Duy et al. Proteomics 2007, 7, 698–710
[19] St�lke, J., Hanschke, R., Hecker, M., J. Gen. Microbiol. 1993,139, 2041–2045.
[20] Dartois, V, D�barbouill�, M., Kunst, F., Rapoport, G., J. Bac-teriol. 1998, 180, 1855–1861.
[21] Kobayashi, K., Ehrlich, S. D., Albertini, A., Amati, G. et al.,Proc. Natl. Acad. Sci. USA 2003, 100, 4678–4683.
[22] Pergo, M., in: Sonenshein, A. L., Hoch, J. A., Losick, R. (Eds.),Bacillus Subtilis and Other Gram-Positive Bacteria-Bio-chemistry, Physiology and Molecular Genetics, ASM,Washington 1993, pp. 615–624.
[23] Tam, L. T., Eymann, C., Albrecht, D., Sietmann, R. et al., En-viron. Microbiol. 2006, 8, 1408–1427.
[24] Bradford, M. M. Anal. Biochem. 1976, 72, 248–254.
[25] Eymann, C., Dreisbach, A., Albrecht, D., Bernhardt, J. et al.,Proteomics 2004, 4, 2849–2876.
[26] J�rgen, B., Tobisch, S., Wumpelmann, M., Gordes, D. et al.,Biotechnol. Bioeng. 2005, 92, 277–298.
[27] Majumdar, D., Avissar, Y. J., Wyche, J. H., BioTechniques1991, 11, 94–101.
[28] Wetzstein, M., V�lker, U., Dedio, J., L�bau, S. et al., J. Bac-teriol. 1992, 174, 3300–3310.
[29] Pareek, R. P., Gaur, A. C., Plant and Soil 1973, 39, 441–444.
[30] Petersohn, A., Brigulla, M., Haas, S., Hoheisel, J. D. et al., JBacteriol. 2001, 183, 5617–5631.
[31] Price, C. W., Fawcett, P., Ceremonie, H., Su, N. et al., Mol.Microbiol. 2001, 41, 757–774.
[32] Hecker, M., V�lker, U., Adv. Microb. Physiol. 2001, 44, 35–91.
[33] Nakano, S., Kuster-Schock, E., Grossman, A. D., Zuber, P.,Proc. Natl. Acad. Sci. USA 2003, 100, 13603–13608.
[34] Zuber, P., J Bacteriol. 2004, 186, 1911–1918.
[35] Kurian, D., Phadwal, K., Maenpaa, P., Proteomics 2006, 6,3614–3624.
[36] Cao, M., Helmann, J. D., J. Bacteriol. 2002, 184, 6123–6129.
[37] Eymann, C., Homuth, G., Scharf, C., Hecker, M., J. Bacteriol.2002, 184, 2500–2520.
[38] Tran, P. N., Barthelmebs, L., Gury, J., Cavin, J.-F., VIIth Sym-posium on Lactic Acid Bacteria: Genetics, Metabolism andApplications. 2005, Egmond aan Zee, The Netherlands.
ª 2007 WILEY-VCH Verlag GmbH & Co. KGaA, Weinheim www.proteomics-journal.com
Copyright © 2022 FDOKUMEN