Whole-cell response of the pennate diatom Phaeodactylum tricornutum to iron starvation
Upload
independentCategory
view
2download
0
GALL
EYPR
OOF
RESEARCHARTICLE
Proteome signatures for stress and starvationin Bacillus subtilis as revealed by a 2-D gel imagecolor coding approach
Le Thi Tam, Haike Antelmann, Christine Eymann, Dirk Albrecht, J�rg Bernhardtand Michael Hecker
Institut f�r Mikrobiologie, Ernst-Moritz-Arndt-Universit�t Greifswald, Greifswald, Germany
In this paper we have defined proteome signatures of Bacillus subtilis in response to heat, salt,peroxide, and superoxide stress as well as after starvation for ammonium, tryptophan, glucose,and phosphate using the 2-D gel-based approach. In total, 79 stress-induced and 155 starvation-induced marker proteins were identified including 50% that are not expressed in the vegetativeproteome. Fused proteome maps and a color coding approach have been used to define stress-specific regulons that are involved in specific adaptative functions (HrcA for heat, PerR and Furfor oxidative stress, RecA for peroxide, CymR and S-box for superoxide stress). In addition, star-vation-specific regulons are defined that are involved in the uptake or utilization of alternativenutrient sources (TnrA, sL/BkdR for ammonium; tryptophan-activated RNA-binding attenuationprotein for tryptophan; CcpA, CcpN, sL/AcoR for glucose; PhoPR for phosphate starvation). Thegeneral stress or starvation proteome signatures include the CtsR, Spx, sL/RocRn, sB, sH, CodY,sF, and sE regulons. Among these, the Spx-dependent oxidase NfrA was induced by all stressconditions indicating stress-induced protein damages. Finally, a subset of sH-dependent proteins(sporulation response regulator, YvyD, YtxH, YisK, YuxI, YpiB) and the CodY-dependent aspartylphosphatase RapA were defined as general starvation proteins that indicate the transition to sta-tionary phase caused by starvation.
Received: February 8, 2006Revised: April 26, 2006Accepted: May 11, 2006
Keywords:Bacillus subtilis / Color coding / Proteome signatures / Starvation / Stress
Proteomics 2006, 6, 0000–0000 1
1 Introduction
The proteome obtained by the high resolution 2-D proteinelectrophoresis reflects the physiological state of a cell [1, 2].From a physiological point of view there are two main pro-teomes in microorganisms – the proteomes of growing and
nongrowing cells. The proteome of growing cells provides astable “vegetative core proteome” with a variable portion thatis determined by definite growth conditions. In the vegeta-tive proteome of Bacillus subtilis 745 proteins were identifiedusing the 2-D gel-based approach. These include more than40% of the predicted vegetative proteomes in the standardpH range 4–7 and most of the proteins involved in the cen-tral metabolic pathways [3]. Gel-free proteome approachessuch as 2-D-LC and MS/MS (2-D LC-MS/MS) resulted in theidentification of 814 proteins in the vegetative proteome ofB. subtilis including 473 new proteins not detected using the2-D gel-based approach [4].
In contrast, “proteome signatures” reflect changes of theproteome in response to physiological changes of B. subtilis,such as after exposure to different stress or starvation condi-tions [1, 2]. Proteome signatures include all specifically and
Correspondence: Dr. Haike Antelmann, Institut f�r Mikrobiologie,Ernst-Moritz-Arndt-Universit�t Greifswald, F.-L.-Jahn-Str. 15, D-17487 Greifswald, GermanyE-mail: [email protected]: 149-3834-864202
Abbreviations: AcsA, acetyl-CoA synthetase; BMM, Belitskyminimal medium; Spo0A, sporulation response regulator; TRAP,tryptophan-activated RNA-binding attenuation protein
DOI 10.1002/pmic.200600100
Figs. 2, 3, 4, 5, 6, 7 and 8 = 4C
VCH Auftr.-Nr. 32745 Vers.: 6.06 1. Papierlauf Seite 1 – hg –S : / 3D / v c h / _ p ro t e om i c s / p r _ 0 6 _ 1 6 / p r _ 0 01 0 0 . 3 d Proteomics Montag, den 19. 06. 06, 12 Uhr 28
ª 2006 WILEY-VCH Verlag GmbH & Co. KGaA, Weinheim www.proteomics-journal.com

2 L. Thi Tam et al. Proteomics 2006, 6, 0000–0000
GALL
EYPR
OOF
generally induced marker proteins that are representative forone stress or starvation condition. Specific marker proteinsare induced by one specific stimulus only whereas generalmarker proteins are induced by multiple stimuli. These pro-teome signatures are useful for the prediction of the physio-logical state of the cell. In several studies proteome sig-natures were established in B. subtilis for heat, cold, salt, oxi-dative, and disulfide stress as well as in response to glucose,phosphate, and amino acid starvation [5–12]. Proteome sig-natures include for example the PerR-dependent oxidativestress-specific proteins KatA, AhpC, and AhpF [12]; the Spx-dependent proteins NfrA, TrxA, and Tpx for disulfide stress[11]; the HrcA-dependent chaperones DnaK and GroEL forheat shock [2]; the carbon catabolite-controlled proteins MalAand AcoB for glucose starvation [6]; and the PhoPR-depend-ent proteins PstS and TuaD for phosphate starvation [5, 7]. Inaddition, proteome signatures were defined in response todifferent antibiotics which are useful to predict the mode ofaction and the target of new antibiotics or antimicrobialsubstances [13, 14].
In this paper, we have complemented the vegetativeproteome map of B. subtilis by the proteome map of B. sub-tilis in response to stress and starvation using the 2-D gel-based approach. For that purpose we have analyzed thecytoplasmic proteome of 35S-methionine-labeled B. subtiliscells in response to heat, salt, hydrogen peroxide, and para-quat stress as well as after ammonium, tryptophan, glucoseand phosphate starvation. The resulting proteome maps ofB. subtilis after stress and starvation comprises 201 markerproteins identified in the standard pH range 4–7 thatinclude 83 stress- and starvation-specific marker proteinswhich are absent in the vegetative proteome map and118 proteins which exhibit a basal expression level in grow-ing cells [3]. The 2-D gel images from different time pointsof all stress or starvation experiments were combined by animage fusion approach in a stress-or starvation-fused pro-teome map reflecting specific and general proteome sig-natures.
2 Materials and methods
2.1 Bacterial strains and culture conditions
Cells of B. subtilis 168 (trpC2) [15] were cultivated under vig-orous agitation at 377C in Belitsky minimal medium (BMM)as described previously [16]. The stress experiments wereperformed by the exposure of exponentially growing cells atan OD500 of 0.4–487C (for heat shock), 6% NaCl (for saltstress), 116 mM H2O2, or 100 mM paraquat (for oxidativestress) (Fig. 1a). Glucose starvation was provoked by cultiva-tion in BMMwithout citrate (BOC) and 0.05% w/v instead of0.2% glucose. For the ammonium, tryptophan, or phosphatestarvation experiments, cells were grown in BMM containing0.7 mM instead of 15 mM (NH4)2SO4, 4 mM instead of80 mM tryptophan, or 0.2 mM instead of 1 mM KH2PO4,
Figure 1. (a) Growth curves of B. subtilis 168 in response to heat,salt, hydrogen peroxide, and paraquat stress. B. subtilis wasgrown in minimal medium to an OD500 of 0.4, and labeled beforeand at different times after heat shock (5, 10, and 20 min) orexposure to salt, hydrogen peroxide, and paraquat stress (10, 20,and 30 min) as indicated by arrows (1, 2, 3). (b) Growth curves ofB. subtilis 168 in response to ammonium, tryptophan, glucoseand phosphate starvation. B. subtilis was grown under differentstarvation conditions and labeled during the exponential growthphase for control (co), at the transition phase (1) and 10, 30, and60 min after transition to stationary phase (2, 3, and 4) as indi-cated by arrows.
respectively. In each starvation experiment the stationaryphase was reached at an OD at 500 nm (OD500) of about 1(Fig. 1b).
2.2 Preparation of the cytoplasmicL-[35S]methionine-labeled protein fraction
Cells grown in minimal medium were pulse-labeled for5 min each with 10 mCi/mL of L-[35S]methionine at an OD500
of 0.4 (for control), at different times (5, 10, 20, and 30 min)
ª 2006 WILEY-VCH Verlag GmbH & Co. KGaA, Weinheim www.proteomics-journal.com
VCH Auftr.-Nr. 32745 Vers.: 6.06 1. Papierlauf Seite 2 – hg –S : / 3D / v c h / _ p ro t e om i c s / p r _ 0 6 _ 1 6 / p r _ 0 01 0 0 . 3 d Proteomics Montag, den 19. 06. 06, 12 Uhr 31

Proteomics 2006, 6, 0000–0000 Microbiology 3
GALL
EYPR
OOF
after stress exposure or during transition phase and 10, 30,and 60 min after transition to stationary phase caused byammonium, tryptophan, glucose, or phosphate starvation.L-[35S]methionine incorporation was stopped after 5 min byaddition of 1 mg/mL of chloramphenicol and an excess ofcold L-methionine (10 mM) on ice. Two independent experi-ments were performed for each stress or starvation condi-tion. The cells were disrupted by ultrasonication, and thesoluble protein fraction was separated from the cell debris bycentrifugation. Incorporation of L-[35S]methionine wasmeasured by precipitation of aliquots of protein extracts with10% TCA on filter papers, as described previously [17].
2.3 2-DE
The protein content was determined using the Bradfordassay [18], and 80 mg of the L-[35S]methionine-labeled proteinextract was separated by 2-DE (2-D PAGE) using the non-linear IPG in the pH range 4–7 (Amersham Biosciences) anda Multiphor II apparatus (Amersham Pharmacia Biotech) asdescribed previously [17]. The gels were stained with SyproRuby, dried on filter paper and exposed to phosphor screens(Molecular Dynamics, Sunnyvale, California) which wereread out with a Phosphor Imager SI instrument (MolecularDynamics) [17]. For identification of the proteins by MS,nonradioactive protein samples of 200 mg were separated bypreparative 2-D PAGE. The resulting 2-D gels were fixed in40% v/v ethanol, 10% v/v acetic acid and stained with Col-loidal CBB (Amersham Biosciences).
2.4 Quantitative image analysis
Quantitative image analysis was performed with the DECO-DON Delta2D software (http://www.decodon.com) which isbased on the dual channel image analysis technique pio-neered in 1999 [17]. Using this software, the 2-D gel imagesfrom stress and starvation experiments were aligned to areference image (control) by using a warp transformation. Toavoid incomplete groups of matching spots a fused 2-D gelwas created for spot detection. For preparing such a fusiongel, all 2-D gel images from each single stress or starvationexperiments were combined using the spot preserving“union fusion” algorithm of Delta2D [19]. Spot detection wasperformed in the fusion gel containing all spots present inany gel of one stress or starvation experiment according tothe automatically suggested parameters for backgroundsubtraction, average spot size, and spot sensitivity. Theresulting spot shapes were reviewed and manually edited inthe fusion gel if necessary. This reviewed spot mask serves asa spot detection consensus for all gel images of the stress orstarvation experiment, and was applied to the individual gelsto guide the spot detection and quantitation. This enablesspot quantitation in all gels at the same locations resulting in100% matching and in a reliable analysis of completeexpression profiles. Normalization was performed by calcu-lating the quantity of each single spot in percentage related
to the total spot quantity per gel. Proteins showing an induc-tion of at least two-fold compared to the control during theL-[35S]methionine pulse in any time point of the two inde-pendent stress or starvation experiments were designated asstress-or starvation-induced marker proteins that are listedand classified in Table 1.
2.5 Color coding
The fused images including either the different stress pro-teome maps (for all time points after heat, salt, hydrogenperoxide, and paraquat stress) or the different starvationproteome maps (for all times during the transition to sta-tionary phase after ammonium, tryptophan, glucose andphosphate starvation) and the corresponding controls werecombined using the union fusion approach of the Delta2Dsoftware to generate fused proteome maps for all stress orstarvation conditions (Figs. 2, 4). The induced marker pro-teins were color coded according to their expression profilesby the Delta2D software as indicated in the figure legends.
2.6 Protein identification by MALDI-TOF-TOF MS
Spot cutting from Colloidal Coomassie-stained 2-D gels,tryptic digestion of the proteins and spotting of the resultingpeptides onto MALDI-targets (Voyager DE-STR, PerSeptiveBiosystems) were performed using the Ettan Spot HandlingWorkstation (Amersham Biosciences, Uppsala, Sweden),according to the standard protocol described previously [3].The MALDI-TOF-TOF measurement of spotted peptidesolutions was carried out on a Proteome-Analyzer 4700(Applied Biosystems, Foster City, CA, USA) and proteinidentification was performed using the MASCOT searchengine (Matrix Science, London, UK) as described previously[3].
3 Results
3.1 Fused proteome maps for stress and starvationand color codes
Growing B. subtilis cells were exposed for 5–30 min to differ-ent stress conditions (heat, salt, hydrogen peroxide, andparaquat stress) that except for heat shock result in adecreased growth rate (Fig. 1a). The different starvationresponses were provoked by growing the cells with limitingamounts of ammonium, tryptophan, glucose, or phosphate,respectively, that result in the transition to stationary phase atan OD500 of 1.0 (Fig. 1b). Starved cells were labeled at thetransition phase and 10–60 min after transition to stationaryphase. The fused images combining either the differenttimes of all particular stress proteome maps or the differenttime points of all particular starvation proteome maps weregenerated using the union fusion approach of Delta2D. Allmarker proteins induced specifically by one stimulus or
ª 2006 WILEY-VCH Verlag GmbH & Co. KGaA, Weinheim www.proteomics-journal.com
VCH Auftr.-Nr. 32745 Vers.: 6.06 1. Papierlauf Seite 3 – hg –S : / 3D / v c h / _ p ro t e om i c s / p r _ 0 6 _ 1 6 / p r _ 0 01 0 0 . 3 d Proteomics Montag, den 19. 06. 06, 12 Uhr 31

4 L. Thi Tam et al. Proteomics 2006, 6, 0000–0000
GALL
EYPR
OOF
Table
1.Protein
synthes
isratiosofm
arke
rproteinsforstress
andstarva
tionin
B.s
ubtilis
a)
Gene
orop
eron
Protein
Regu
lonAm
moniu
mTryptophan
Glucose
Phosphate
Heat
Salt
H 2O 2
Paraquat
Function/sim
ilarityb
)
t010
3060
t010
3060
t010
3060
t010
3060
510
2010
2030
1020
3010
2030
Stress
proteo
mesign
atures
HrcA
regu
lon
HrcA
-grpE-dn
aKJ
GrpE
HrcA
4,23,6
1,0He
at-shock
protein
(activa
tiono
fDnaK)
DnaK
HrcA
4,93,3
1,6Cla
ssIh
eat-s
hock
protein
(mole
cular
chaperone)
GroE
SLGroE
LHrcA
19,1
19,1
7,8Cla
ssIh
eat-s
hock
protein
(chaperone)
GroE
SHrcA
3,2–
–Cla
ssIh
eat-s
hock
protein
(chaperone)
CtsR
regu
lon
ClpE*
CtsR
343,6
56,8
5,31,2
15,6
21,7
ATP-dependentC
lpprotease-lik
eClp
PCtsR,s
B6,6
7,61,7
2,45,9
6,8AT
P-dependentC
lpprotease
proteolyticsubunit
CtsR-m
csAB
-clp
C-radA
-yac
KClp
CCtsR,s
B23,4
16,8
1,519,2
22,2
36,5
Class
IIIstr
essr
esponse-related
ATPa
se
PerR
regu
lon
AhpC
FAh
pCPe
rR4,9
4,22,3
11,2
11,7
18,0
Alkylhydroperoxid
ereductase
(small
subunit)
AhpF
PerR
3,12,6
1,29,3
12,0
11,2
Alkylhydroperoxid
ereductase
(large
subunit)
KatA
PerR,s
E2,9
4,73,5
2,92,0
2,54,5
5,313,6
3,90,3
107,4
147,7
139,7
Vegetativec
atala
se1
MrgA
PerR
15,4
2,11,6
6,35,6
5,6Metalloregula
tionD
NA-bind
ingstr
ess
protein
Furr
egulon
DhbA
CEBF
DhbA
*Fur
10,4
1,70,9
8,513,8
9,7Ba
cillibactin
siderophore
biosynthesis
DhbC
*Fur
4,02,1
0,62,8
4,22,8
Bacillibactin
siderophore
biosynthesis
DhbE
*Fur
23,4
6,70,6
14,2
20,2
14,2
Bacillibactin
siderophore
biosynthesis
DhbB
*Fur
48,0
9,32,2
19,6
33,1
27,5
Bacillibactin
siderophore
biosynthesis
FeuA
lipo *
Fur
5,12,6
0,6AB
C-tra
nsporte
rbind
ingprotein
(ba-
cillibactin
ande
nterobactin
uptake)
YclQ
lipo
Fur
1,21,0
0,7AB
C-tra
nsporte
rbind
ingprotein
(siderophoreu
ptake)
YcgT
*Fur,Sp
x1,7
1,41,0
2,12,1
2,4sim
ilartot
hioredoxin
reductase
YfiYl
ipo*
Fur
1,51,1
0,8AB
Ctra
nsporte
rbind
ingprotein
(schiz
okinin,arthrobactinuptake)
YxeB
lipo *
Fur
13,6
1,91,7
12,2
12,3
9,0AB
Ctra
nsporte
rbind
ingprotein
(ferrioxam
ineuptake)
YwbLMN
YwbM
*Fur
2,90,9
1,03,6
7,46,8
Eleme
ntalFe
transport(ye
astFTS
3homo
log)
SOSregu
lon
RecA
RecA
/LexA
5,96,5
4,9MultifunctionalS
OSrepairregulator
ª 2006 WILEY-VCH Verlag GmbH & Co. KGaA, Weinheim www.proteomics-journal.com
VCH Auftr.-Nr. 32745 Vers.: 6.06 1. Papierlauf Seite 4 – hg –S : / 3D / v c h / _ p ro t e om i c s / p r _ 0 6 _ 1 6 / p r _ 0 01 0 0 . 3 d Proteomics Montag, den 19. 06. 06, 12 Uhr 31

Proteomics 2006, 6, 0000–0000 Microbiology 5
GALL
EYPR
OOF
Table
1.Continued
Gene
orop
eron
Protein
Regu
lonAm
moniu
mTryptophan
Glucose
Phosphate
Heat
Salt
H 2O 2
Paraquat
Function/sim
ilarityb
)
t010
3060
t010
3060
t010
3060
t010
3060
510
2010
2030
1020
3010
2030
UvrBA
UvrB**
RecA
/LexA
2,62,9
2,3Excin
uclea
seAB
C(su
bunit
B)
CymRan
dS-bo
xregu
lons
CysK
CymR
(YrzC
)4,7
0,72,3
Cyste
inesynthetase
AMetE
S-bo
x2,8
1,93,2
Cobalam
in-ind
ependent
methion
inesynthase
YitJ
S-bo
x3,2
1,33,4
Similartoh
omocysteine
s-me
thyltransferase
YrrT-m
tn-yrhAB
YrhB
**CymR
(YrzC
)5,6
1,52,7
Cysta
thion
inegamm
a-lya
seYxeIJK
LMNO
PQYxeP
**CymR
(YrzC
)6,2
1,93,4
Peptida
se,M
20/M
25/M
40family
YxeK
**CymR
(YrzC
)2,0
1,72,2
Similartom
onooxygenase
Spxregu
lon
HemE
HYHe
mHSp
x5,0
2,61,1
2,02,0
2,0Ferro
chela
tase
IolABC
DEFG
HIJ
IolS
IolR,
Spx
2,82,5
0,53,0
2,93,6
1,82,1
0,90,9
Myo-in
ositolcatabolism
NfrA-ywc
HNfrA
Spx
3,20,8
1,30,6
1,23,2
2,30,7
0,73,9
5,94,2
FMN-contain
ingNA
DPH-linkedn
itro/
flavin
reductase
SodA
Spx,sB
5,87,7
1,73,3
4,23,8
Superoxid
edism
utase
Tpx
Spx
1,13,1
2,81,6
2,61,1
1,12,0
2,43,1
Thiol
peroxid
ase
TrxA
Spx,sB
2,42,5
2,7Thior
edoxin
YfjR
Spx
3,01,1
1,11,8
2,52,5
Dehydrogenasep
recursor
YhfIJ
KYh
fKSp
x2,7
––
1,53,0
3,2Nu
cleoside
-diph
osphate-sugar
epimerase
YjbCD
YjbC
Spx,sM
,sB
2,72,7
2,93,3
1,43,7
4,04,2
1,81,9
6,6Sim
ilartoN
-acetyltra
nsferase
YjbG
Spx
3,34,7
4,13,5
2,31,1
1,32,9
3,53,2
Oligo
endopeptida
seFh
omolo
gYp
wASp
x–
––
2,3Sim
ilartoc
arboxypeptida
seYq
iGSp
x3,5
2,01,3
2,30,9
0,72,8
1,61,7
ProbableNA
DH-dependent
flavin
oxido
reductase
YuaE
Spx,sE
,Cod
Y9,8
10,3
32,0
29,6
0,81,0
1,53,2
1,31,4
48,3
2,91,4
0,25,2
6,26,2
Unknow
nYu
gJSp
x2,3
0,90,9
3,82,7
3,2ProbableNA
DH-dependent
butanol
dehydrogenase1
TnrA
regu
lon
AsnZ
(yccC
)As
nZ**
TnrA1
7,63,6
6,07,1
Similartoa
sparagina
seCa
hTn
rA1
16,6
24,1
13,3
25,0
13,4
17,7
25,9
32,3
1,08,1
8,515,6
7,61,3
2,9Ce
phalo
sporinCdeacetyla
seDp
pABC
DEDp
pA**
TnrA1,C
odY
5,98,0
6,85,8
3,23,6
5,76,5
D-ala
nyl-a
minopeptida
seGlnR
AGlnA
TnrA2,G
lnR2,5
2,33,0
3,0Glutam
inesynthetase
OppA
BCDE
FOp
pAlipo
TnrA1
3,75,6
12,0
8,6Oligo
peptide
ABCtra
nsporte
r(bin
ding
protein
)Op
pDTn
rA1
––
–3,0
Oligo
peptide
ABCtra
nsporte
r(ATP
-bind
ingprotein
)Pu
cJKLM
PucL**
TnrA1,s
E ,PucR
4,15,1
26,7
18,3
Urica
se
ª 2006 WILEY-VCH Verlag GmbH & Co. KGaA, Weinheim www.proteomics-journal.com
VCH Auftr.-Nr. 32745 Vers.: 6.06 1. Papierlauf Seite 5 – hg –S : / 3D / v c h / _ p ro t e om i c s / p r _ 0 6 _ 1 6 / p r _ 0 01 0 0 . 3 d Proteomics Montag, den 19. 06. 06, 12 Uhr 31
6 L. Thi Tam et al. Proteomics 2006, 6, 0000–0000
GALL
EYPR
OOF
Table
1.Continued
Gene
orop
eron
Protein
Regu
lonAm
moniu
mTryptophan
Glucose
Phosphate
Heat
Salt
H 2O 2
Paraquat
Function/sim
ilarityb
)
t010
3060
t010
3060
t010
3060
t010
3060
510
2010
2030
1020
3010
2030
TasA
TasA
sTn
rA1,s
H2,1
3,62,8
2,6Translo
cation-dependenta
ntimicr
obial
sporec
omponent
UreA
BCUreC
TnrA1,C
odY,
sH,P
ucR
19,4
74,9
24,9
12,2
2,22,2
2,62,9
Urease
(alph
asubunit)
Vpr
Vprs *
TnrA1,s
H9,3
21,8
12,6
7,7Mino
rextr
acellula
rserine
protease
YxbB
-A.yx
nB-
asnH
-yxaM
YxbB
**Tn
rA1,C
odY
9,511,2
10,7
12,4
6,26,8
8,610,0
2,34,8
3,17,8
Similartom
ethyltransfe
rase
sLRe
gulon(1
BkdR
,Roc
R,Ac
oR)
BkdR
-ptb-bcd
-buk-
Bcd
CodY
,sL ,B
kdR
9,012,3
14,4
7,9Leucine
dehydrogenase
-lpdV
-bkdAA
/AB/B
BkdA
ACo
dY,s
L ,Bk
dR10,0
6,01,3
0,9Branched-chainalp
ha-ketoa
ciddehydrogenaseE
1Su
bunit
(2-oxois
ovale
rate
dehydro-
genase
alpha
subunit)
LpdV
CodY
,sL ,B
kdR
5,84,6
1,01,2
Branched-chainalp
ha-ketoa
ciddehydrogenaseE
3Su
bunit
(dihy
drolipoam
idedehydrogenase)
RocA
BCRo
cACo
dY,s
L ,Roc
R,Cc
pA23,7
11,6
0,60,3
1,31,4
13,0
12,4
2,15,9
4,91,1
Pyrro
line-5c
arboxylated
ehydrogenase
RocD
EFRo
cDCo
dY,s
L ,Roc
R,Cc
pA3,6
3,82,5
1,20,8
1,16,7
3,9Ornithin
eaminotra
nsferase
RocD
EFRo
cFCo
dY,s
L ,Roc
R,Cc
pA4,9
2,50,9
0,70,8
0,41,7
5,3Argin
ase
RocG
CodY
,sL ,C
cpA
1,01,6
2,512,7
Glutam
ated
ehydrogenase
(majo
r)Ac
oABC
LAc
oA*
CodY
,sL ,A
coR
0,70,6
1,116,8
Acetoin
dehydrogenaseE
1com
p.(TPP
-dep.a
subunit)
AcoB
*Co
dY,s
L ,Aco
R0,7
0,50,3
14,0
Acetoin
dehydrogenaseE
1com
p.(TPP
-dep.b
subunit)
AcoC
*Co
dY,s
L ,Aco
R0,6
0,75,4
264,8
Acetoin
dehydrogenaseE
2com
ponent
(dihy
drolipoam
ideacetyltrans-
ferase)
AcoL*
CodY
,sL ,A
coR
1,00,8
1,022,7
Acetoin
dehydrogenaseE
3com
ponent
(dihy
drolipoam
idedehydrogenase)
TRAP
regu
lon
PabB
ACPa
bA**
TRAP
,RelA
38,4
35,7
32,5
22,8
Para-aminobenzoate
synthase
Glutam
ineam
idotra
nsferase
(subunit
B)TrpE
DCFB
ATrpE
**TR
AP25,0
22,8
31,6
31,8
Anthranilates
ynthase
TrpD
**TR
AP11,7
11,3
10,7
8,2An
thranilatep
hosphorib
osyltrans-
ferase
ª 2006 WILEY-VCH Verlag GmbH & Co. KGaA, Weinheim www.proteomics-journal.com
VCH Auftr.-Nr. 32745 Vers.: 6.06 1. Papierlauf Seite 6 – hg –S : / 3D / v c h / _ p ro t e om i c s / p r _ 0 6 _ 1 6 / p r _ 0 01 0 0 . 3 d Proteomics Montag, den 19. 06. 06, 12 Uhr 31

Proteomics 2006, 6, 0000–0000 Microbiology 7
GALL
EYPR
OOF
Table
1.Continued
Gene
orop
eron
Protein
Regu
lonAm
moniu
mTryptophan
Glucose
Phosphate
Heat
Salt
H 2O 2
Paraquat
Function/sim
ilarityb
)
t010
3060
t010
3060
t010
3060
t010
3060
510
2010
2030
1020
3010
2030
TrpB
**TR
AP8,5
8,311,8
11,1
Tryptophan
synthase
(betas
ubunit)
TrpA
**TR
AP15,0
14,5
16,2
14,5
Tryptophan
synthase
(alph
asubunit)
CodY
regu
lon
AcsA
*Co
dY,C
cpA
5,06,4
9,35,3
1,14,5
13,4
21,8
1,63,7
5,75,4
Acetyl-Co
Asynthetase
AmhX
AmhX
CodY
4,24,2
3,73,4
3,42,6
3,83,8
0,41,0
9,1Am
idohydrola
seAp
pDFA
AppD
**Co
dY,R
elA,
CcpA
3,73,1
4,56,7
4,44,2
4,93,2
Oligo
peptide
ABCtra
nsporte
r(ATP
-bind
ingprotein
)Cit
BCo
dY,C
cpC,
CcpA
2,44,3
2,63,9
Aconitate
hydratase
Hag
CodY
0,74,1
4,02,1
Flagellin
protein
IlvD
CodY
1,61,9
2,62,8
Dihydroxy-aciddehydratase
RapA
-phrA
RapA
**Co
dY,R
elA,
CcpA
8,06,9
8,813,5
5,25,4
10,8
17,9
1,51,8
3,67,0
1,79,8
8,34,2
Response
regulator
asparta
tephosphatase
YurJ**
CodY
,TnrA2
2,63,2
1,10,4
19,3
19,3
13,3
9,3Multiples
ugar
ABCtra
nsporte
r(ATP
-bind
ingprotein
)Yu
rPON
ML
YurP
CodY
,TnrA2
3,84,3
3,41,4
1,72,3
2,11,3
Similartog
lutam
ine-fructose-6-
phosphatet
ransam
inase
YurO
lipo **
CodY
,TnrA2
4,36,7
6,72,2
9,810,1
10,9
6,1Sim
ilartom
ultiples
ugar-bind
ingprotein
YurL
CodY
,TnrA2
8,27,4
8,63,9
Similartor
ibokin
ase
YxbC
DYxbC
CodY
,RelA
,PerR6,5
8,99,5
11,0
1,54,0
3,67,8
3,81,5
1,1Sim
ilartou
nknown
protein
s
CcpA
regu
lon
BglPH
-yxiE
BglH*
CcpA
0,96,7
2,40,9
Beta-gluc
osida
seCit
Z-icd
-mdh
CitZ
CcpA
,Spx
3,34,0
6,95,4
3,42,8
3,44,0
0,91,8
1,62,9
Citrate
synthase
II(majo
r)GlpFK
GlpK
CcpA
,sE
0,87,0
2,811,9
Glycerolkin
ase
LicBC
AHLic
H*Cc
pA1,2
54,5
19,2
3,76-Ph
ospho-beta-gluc
osida
seMalA
MalA
CcpA
,Cod
Y0,9
1,57,9
57,3
6-Ph
ospho-alp
ha-gluc
osida
seMalL
MalL
**Cc
pA3,9
6,00,3
0,5Maltose-ind
uciblea
lpha-glu
cosid
ase
RbsRKD
ACB
RbsA
*Cc
pA1,2
15,3
5,424,9
RiboseA
BCtra
nsporte
rRb
sKCc
pA1,3
2,51,4
5,2Rib
okina
seYsiB
YsiB
CcpA
0,70,4
1,15,5
0,72,9
3,86,6
Similarto3
-hydroxbutyryl-Co
Adehydratase
YvdG
HIYvdG
lipo **
CcpA
0,90,9
0,411,3
Maltose/ma
ltodextr
in-bin
dingp
rotein
CcpN
regu
lon
GapB
GapB
*Cc
pN1,0
1,15,0
25,6
Glycerald
ehyde-3-phosphate
dehydrogenase
PckA
CcpN
1,20,5
1,117,2
Phosphoenolpy
ruvate
carboxykina
se
PhoP
Rregu
lon
TuaA
BCDE
FGH
TuaD
*Ph
oPR,
sF22,0
19,4
17,6
12,8
Biosynthesisof
teich
uronicacid
ª 2006 WILEY-VCH Verlag GmbH & Co. KGaA, Weinheim www.proteomics-journal.com
VCH Auftr.-Nr. 32745 Vers.: 6.06 1. Papierlauf Seite 7 – hg –S : / 3D / v c h / _ p ro t e om i c s / p r _ 0 6 _ 1 6 / p r _ 0 01 0 0 . 3 d Proteomics Montag, den 19. 06. 06, 12 Uhr 31

8 L. Thi Tam et al. Proteomics 2006, 6, 0000–0000
GALL
EYPR
OOF
Table
1.Continued
Gene
orop
eron
Protein
Regu
lonAm
moniu
mTryptophan
Glucose
Phosphate
Heat
Salt
H 2O 2
Paraquat
Function/sim
ilarityb
)
t010
3060
t010
3060
t010
3060
t010
3060
510
2010
2030
1020
3010
2030
TuaH
**Ph
oPR,
sF1,0
7,90,9
1,0Biosynthesisof
teich
uronicacid
PhoP
RPh
oPPh
oPR,
sE,C
cpA
1,93,2
3,84,4
Two-comp
onentresponser
egula
torfor
phosphater
egula
tion
PhoB
-ydh
FPh
oBs *
PhoP
R,sE
xAlkalinep
hosphatase
IIIPh
oDs *
PhoP
Rx
Alkalinep
hosphatase/phos-
phodies
terases
PstBA/BB
*Pho
PRx
PhosphateA
BCtra
nsporte
r(ATP
-bind
ingprotein
)PstSAC
/BA/BB
PstS
s *Ph
oPR
53,2
66,2
119,1
152,9
PhosphateA
BCtra
nsporte
r(phosphate
bindin
gprotein)
YdhF
s *Ph
oPR,
sE9,3
13,2
23,4
16,3
Lipoprotein
sBRe
gulon
Ctc
sB0,6
3,119,2
1,1x
4,2–
–19,2
22,2
36,5
Generalstre
ssprotein
Dps
sB2,4
1,61,7
3,50,6
3,02,3
0,61,1
1,81,7
2,02,8
1,91,2
9,19,6
7,1Stress-a
ndsta
rvation
-inducedD
NAbin
dingp
rotein
GsiB
sB1,5
3,12,8
2,40,5
0,257,8
5,51,2
1,63,9
2,350,4
43,8
21,2
1,123,6
37,6
Generalstre
ssprotein
GspA
*sB
0,51,1
9,11,7
1,54,1
3,53,4
19,4
15,4
2,50,5
5,72,0
Generalstre
ssprotein
GtaB
sB0,7
0,911,8
4,72,1
2,44,2
1,48,7
11,9
7,05,5
6,24,1
Glucosyla
tiono
fteic
hoicacid
KatE
sB0,8
0,57,9
2,7x
0,44,4
7,5Ca
talas
e2Na
dEsB
0,91,0
4,10,9
2,21,9
1,63,7
6,14,8
NADbio
synthesis
RsbR
STUV
W-
sigB-rsbX
RsbW
sB0,6
1,73,7
1,01,0
1,41,4
2,01,8
1,20,5
13,2
13,6
12,9
Anti-sfactor
ofsB
SigB
sB1,0
1,25,1
7,00,8
1,13,2
1,73,7
2,01,2
12,8
13,3
10,8
Generalstre
sssfactor
YcdFG
YcdF
sB2,3
––
0,83,6
4,7Sim
ilartog
lucose1
-dehydrogenase
YceC
DEFG
HYc
eCsW
,sB
10,7
11,0
12,3
Similartot
ellurium
resis
tancep
rotein
YceD
sW,s
B5,0
5,62,1
Similartot
ellurium
resis
tancep
rotein
YceH
sW,s
B2,1
1,51,6
2,55,3
6,9Sim
ilartotoxicanion
resis
tancep
rotein
YfhM
sW,s
B3,8
5,318,6
16,1
1,01,6
14,7
4,92,0
4,58,6
5,02,5
3,910,2
Similartoe
poxid
ehydrolas
eYd
aDEFG
YdaD
*sB
x0,4
13,4
4,0Ox
idoreductase
YdaE
*sB
9,39,1
8,38,7
10,2
5,28,8
6,00,4
3,68,7
1,41,8
3,25,4
2,7Probablesporec
oatp
olysaccharid
ebio
synthesis
protein
YdaG
sB0,8
1,04,6
0,7x
2,93,4
2,53,9
2,09,3
Generalstre
ssprotein
YdaP
YdaP
sB1,9
3,44,1
4,12,8
9,58,4
Similartop
yruvateo
xidase
YdaT
SYd
aT*
sB1,5
1,67,0
0,5Un
know
nYd
bD*
sBx
Similartom
anganese-containing
catalas
eYfkM
sB0,5
4,314,5
3,41,8
9,15,8
3,25,9
5,22,7
11,8
18,6
20,3
Generalstre
ssprotein
YfmA
-yflT
YflT
sB0,6
4,018,1
2,2x
Generalstre
ssprotein
YhdN
sB3,1
2,52,5
4,16,4
5,02,0
3,84,8
3,0Sim
ilartoa
ldo/ke
toreductase
ª 2006 WILEY-VCH Verlag GmbH & Co. KGaA, Weinheim www.proteomics-journal.com
VCH Auftr.-Nr. 32745 Vers.: 6.06 1. Papierlauf Seite 8 – hg –S : / 3D / v c h / _ p ro t e om i c s / p r _ 0 6 _ 1 6 / p r _ 0 01 0 0 . 3 d Proteomics Montag, den 19. 06. 06, 12 Uhr 31

Proteomics 2006, 6, 0000–0000 Microbiology 9
GALL
EYPR
OOF
Table
1.Continued
Gene
orop
eron
Protein
Regu
lonAm
moniu
mTryptophan
Glucose
Phosphate
Heat
Salt
H 2O 2
Paraquat
Function/sim
ilarityb
)
t010
3060
t010
3060
t010
3060
t010
3060
510
2010
2030
1020
3010
2030
YkzA
sB0,3
1,622,1
2,1x
1,50,6
15,4
12,2
30,7
50,1
Similartoo
rganichydroperoxide
resis
tancep
rotein
YocK
*sB
0,51,3
12,6
1,8x
11,6
17,6
19,4
Similartog
eneralstr
essp
rotein
YvaA
sB5,1
4,42,6
Similartoo
xidoreductase
YsnF
sB0,4
2,615,3
7,42,2
1,78,5
27,4
22,3
3,76,5
4,89,7
31,6
Unknow
n
sHRe
gulon
FtsAZ
FtsA
sH,C
cpA
4,84,5
4,03,9
Require
dfor
septum
form
ation
durin
gsporula
tion
MinC
DMinD
sH5,9
8,06,8
5,83,2
3,65,7
6,51,0
2,93,0
5,3Ce
ll-divisio
ninhibitor(septum
placeme
nt)
RapG
-phrG
RapG
**sH
6,55,2
5,36,6
3,74,2
8,710,9
2,18,7
7,94,4
Response
regulator
asparta
tephos-
phatase
Spo0A
sH,R
elA,C
odY
6,76,2
7,46,3
3,62,5
4,03,0
0,91,0
0,92,0
1,72,9
3,04,0
Two-comp
onentresponser
egula
torfor
initiationo
fsporulation
SpoIIAA/AB
-sigF
SigF**
sH3,0
4,59,9
10,8
0,82,2
2,33,1
0,53,0
6,26,0
Sporula
tionf
orespore-specificsfactor
SpoV
GsH
,RelA
10,3
8,03,2
2,66,4
12,113,1
3,11,8
4,23,8
3,1Re
quire
dfor
sporec
ortexs
ynthesis
SpoV
S**
sH0,8
17,124,1
16,6
Require
dfor
dehydratation
ofthes
pore
core
YisK
sH3,5
2,81,4
0,74,7
4,84,5
3,30,7
1,24,6
17,3
1,84,2
4,12,7
5-Ox
o-1,2
,5-tricarboxilic
-3-pentenacid
decarboxyla
seYp
iABF
-qcrAB
CYp
iB**
sH,R
elA,S
px3,4
3,06,5
5,16,0
4,35,9
4,41,0
5,36,0
2,81,3
5,25,3
2,2Sim
ilartou
nknown
protein
sYtxG
HJYtxH
sH,R
elA,s
B5,5
4,94,3
4,96,4
7,46,4
5,60,7
2,95,6
1,11,5
2,03,9
2,12,6
1,81,2
6,18,6
6,8Sim
ilartog
eneralstr
essp
rotein
YuxI-
yukJ
YuxI*
*sH
27,9
25,2
21,1
28,5
2,32,1
2,72,8
0,80,5
2,73,1
2,116,5
52,0
38,8
Unknow
nYvyD
sH,R
elA,s
B46,6
13,0
3,22,5
76,0
62,7
50,5
36,2
0,65,5
30,5
2,78,1
22,2
21,3
2,93,6
––
16,8
1,14,0
2,26,5
9,0Sim
ilartos
54mo
dulating
factor
YwfBCD
EFG
YwfC
sH4,8
2,92,6
2,71,8
1,82,5
3,2Sim
ilartob
acilysin
biosynthesis
protein
bacA
sFRe
gulon
KatX*
sF,s
B–
––
2,6Majo
rcatala
seinspores
RsfA**
sF3,0
4,59,9
10,8
0,82,2
2,33,1
0,53,0
6,26,0
Regulator
oftra
nscription
ofsF-de-
pendentg
enes
SpoIIQ**
sF0,5
2,817,6
11,6
Require
dfor
comp
letion
ofengulfm
ent
SpoV
T**
sFcoo
Positive
andn
egative
regulator
ofsG
-dependent
genes
sERe
gulon
AsnO
**sE
coo
Asparagin
esynthetase
GlgB
CDAP
GlgA
**sE,s
H2,2
3,15,3
6,4Starch
(bacteria
lglyc
ogen)synthase
KamA
**sE
coo
0,96,6
10,3
31,6
lysine
2,3-aminomu
tase
PrkA
sE1,0
1,912,7
70,7
1,02,8
1,95,7
serin
eproteinkin
ase
SafA**
sE2,1
4,412,0
53,4
0,84,4
1,67,4
Morphogeneticprotein
associa
tedw
ithspoV
ID
ª 2006 WILEY-VCH Verlag GmbH & Co. KGaA, Weinheim www.proteomics-journal.com
VCH Auftr.-Nr. 32745 Vers.: 6.06 1. Papierlauf Seite 9 – hg –S : / 3D / v c h / _ p ro t e om i c s / p r _ 0 6 _ 1 6 / p r _ 0 01 0 0 . 3 d Proteomics Montag, den 19. 06. 06, 12 Uhr 31
10 L. Thi Tam et al. Proteomics 2006, 6, 0000–0000
GALL
EYPR
OOF
Table
1.Continued
Gene
orop
eron
Protein
Regu
lonAm
moniu
mTryptophan
Glucose
Phosphate
Heat
Salt
H 2O 2
Paraquat
Function/sim
ilarityb
)
t010
3060
t010
3060
t010
3060
t010
3060
510
2010
2030
1020
3010
2030
SpoIVA
sE1,2
0,819,4
128,4
0,73,3
0,93,2
Require
dfor
sporec
ortexforma
tion
andc
oata
ssem
blySp
oVR**
sE2,1
0,92,2
6,1Involve
dins
pore
corte
xsynthesis
SpoV
ID-ysxE
SpoV
ID**
sE,TnrA1
0,30,6
0,614,2
Require
dfor
assemb
lyofthes
pore
coat
YaaH
**sE,s
B1,3
3,326,5
104,9
Similartoc
orticalfra
gment-lytic
enzyme
YhbH
**sE
0,91,1
3,820,4
Putatives
tress
response
protein
YjbX**
sE0,8
0,71,4
10,9
0,92,7
2,65,3
1,31,5
5,83,9
Glutam
icacid-
richp
rotein
YybI**
sE9,4
2,58,4
7,4Un
know
n
Other
starva
tionor
stress
indu
cedproteins
AckA
AckA
Glu-
1,00,5
3,04,7
Acetatek
inase
AdeC
AdeC
RelA
3,65,4
5,93,3
Adenine
deam
inase
Ald
Ald
RelA,TnrA2
3,73,8
5,88,1
1,11,8
4,03,3
L-alan
inedehydrogenase
AroD
AroD
3,03,6
19,2
36,5
Shikima
te5-dehydrogenase
Dat
Dat
3,53,2
4,03,3
2,62,3
3,42,9
1,23,4
3,11,9
Probable
D-ala
ninea
minotra
nsferase
DegS
UDe
gS*
DegS
U7,6
5,86,2
5,5Tw
o-comp
.sensork
inase
for
degradative
enzyme
sDe
gUDe
gSU
4,84,9
6,04,6
Two-comp
.responser
egula
torfor
de-
gradative
enzyme
sDh
aSDh
aS2,6
1,07,7
7,90,9
2,22,2
6,00,6
2,67,2
7,4Aldehyde
dehydrogenase
EtfA**
0,62,1
10,1
18,9
Electront
ransferflav
oprotein(alph
asubunit)
EtfB**
0,84,0
13,440,9
Electront
ransferflav
oprotein(beta
subunit)
FabF
2,62,1
1,5Be
ta-ketoacyl-a
cylcarrie
rprotein
synthase
IIFolD
FolD
0,80,9
1,813,1
5,44,3
2,75,4
1,23,6
1,44,8
Methylen
etetrahydrofola
tedehydro-
genase
/HtpG
HtpG
3,35,1
3,90,5
8,45,9
6,6Cla
ssIII
heat-shock
protein
(mole
cular
chaperone)
GcvT-gcvPA
BGc
vT–
––
6,4Am
inome
thyltransferase
GlmS
GlmS
Glu-
6,67,8
8,010,4
0,70,9
0,411,1
L-glutam
ine-D-fructose-6-phosphate
amido
transferase
Hom
Hom
3,13,4
3,92,5
Homo
serin
edehydrogenase
IspA*
*–
––
7,3Majo
rintracellular
serin
eprotease
Kbl*
Glu-
0,30,7
5,814,8
2-Am
ino-3-ketobutyrateC
oAligase
Men
BMen
B0,8
0,91,8
13,0
5,44,3
2,75,4
1,23,6
1,44,8
Dihydroxynapthoic
acidsynthetase
MurB
MurB
5,06,1
7,59,1
2,11,0
4,210,6
0,91,1
4,42,5
UDP-N-acetyle
nolpy
ruvoylg
lucosam
inereductase
PbpE
PbpE
wall
34,5
17,2
14,2
9,8Pe
nicillin-bin
dingp
rotein4
ª 2006 WILEY-VCH Verlag GmbH & Co. KGaA, Weinheim www.proteomics-journal.com
VCH Auftr.-Nr. 32745 Vers.: 6.06 1. Papierlauf Seite 10 – hg –S : / 3D / v c h / _ p ro t e om i c s / p r _ 0 6 _ 1 6 / p r _ 0 01 0 0 . 3 d Proteomics Montag, den 19. 06. 06, 12 Uhr 31

Proteomics 2006, 6, 0000–0000 Microbiology 11
GALL
EYPR
OOF
Table
1.Continued
Gene
orop
eron
Protein
Regu
lonAm
moniu
mTryptophan
Glucose
Phosphate
Heat
Salt
H 2O 2
Paraquat
Function/sim
ilarityb
)
t010
3060
t010
3060
t010
3060
t010
3060
510
2010
2030
1020
3010
2030
PksB
CDE-ac
pK-pksF
PksC**
1,65,0
9,57,3
Involve
inpolyk
etide
synthesis
PtsG
HIPtsH
Glu-
0,52,0
9,11,0
3,6–
–Ph
osphocarrie
rproteinof
theP
Ts(HPr
protein
)Ya
aQ1,4
1,02,7
0,2Un
know
nYb
aL5,6
1,52,7
SimilartoA
TP-bind
ingMrp-lik
eprotein
YcgN
YcgN
3,219,8
15,7
9,65,3
5,94,3
8,10,7
1,628,2
4,0Sim
ilarto1
-pyrroline-5-carboxyla
tedehydrogenase
YhfE
1,12,0
2,91,3
Similartog
lucanase
YhjL*
*3,7
5,525,6
216,7
Sensorytransduction
pleiotropic
regulatoryp
rotein
YjcLK
YjcK**
2,62,9
5,96,0
8,06,8
8,17,5
1,22,1
3,42,3
Similartor
ibosoma
l-protein-
alanin
eN-acetyltransferase
YkgB
5,14,4
2,6Sim
ilarto6
-phosphoglu
conolac
tonase
YpsC**
6,21,9
3,4Sim
ilartom
ethyltransfe
rase
YqeH
1,01,6
6,114,8
SimilartoG
TP-bind
ingprotein
YsnA
YsnA
0,70,4
1,15,5
0,72,9
3,86,6
Similartox
anthosine
triphosphate
pyrophosphatase
YurU
YurU
4,48,1
11,9
8,32,2
7,16,6
2,52,3
2,1Sim
ilartoF
eSclu
stera
ssem
blysyste
mYu
rYYu
rY28,3
29,1
35,2
30,5
2,22,9
3,4Sim
ilartoA
BCtra
nsporte
r(ATP
-bind
ingprotein
)Yu
sJYu
sJ*
3,25,4
2,21,5
1,41,8
5,42,5
0,73,9
40,2
78,4
Similartob
utyryl-Co
Adehydrogenase
YvaC
BYvaB
1,92,2
3,23,6
SimilartoN
AD(P)H
dehydrogenase
(quin
one)
YvcT
––
–12,2
0,71,5
3,31,7
Similartog
lycerated
ehydrogenase
LiaIHGF
SRLia
H*Lia
RS–
––
4,6Sim
ilartop
hage
shockp
rotein
YxiE
YxiE
6,25,6
10,9
6,61,1
1,92,3
0,5Sim
ilartou
niversalstre
ssprotein
YwfI
1,8–
–2,0
1,11,1
Similartoc
hlorited
ismutase
YwjH
Glu-
2,74,6
1,30,1
Similartot
ransald
olase
(pentose
phosphate)
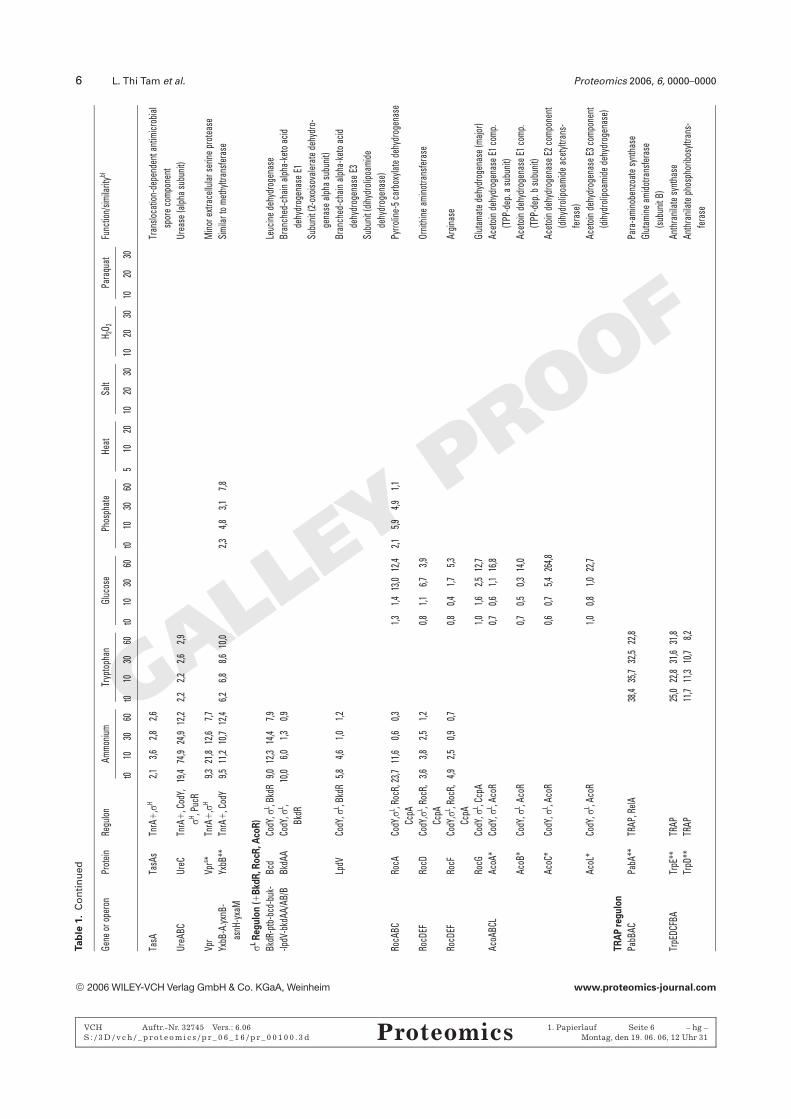
a)Allmarke
rproteinswith
induc
tionfactors
ofa
tlea
sttw
o-fold
intw
oindep
ende
ntly
repea
tedproteomeex
perimen
tswereclas
sified
acco
rdingto
thearraydataofp
reviouslydes
cribed
regulons(H
rcA,s
B,C
tsR,P
erR,F
ur,S
px,
Rec
A,C
ymR,S
-box,
TnrA
,sL ,Bkd
R,R
ocR,A
coR,T
RAP,Ccp
A,C
cpN,P
hoPR
,CodY
,sH,s
F ,sE)[11
,12,
21–2
6,29
–33,
35–3
8,41
,44,
45]a
ndthe
operonstructure
isindicated
.The
protein
synthes
isratios
corres
pond
totheinductionat
differenttim
esaftertheex
posu
reto
stress
(5,1
0,20
,or3
0min)a
ndin
resp
ons
eto
starva
tion
duringthetran
sition
phas
e(t0)
and10
,30,
and60
min
afterthetran
sitionto
stationaryphas
ein
onereprese
ntative
experim
ent.Theproteinsnotd
etec
tedin
thes
eex
perim
ents
but
iden
tifie
din
previousproteomean
alys
esorin
thealka
linepH
rang
eweremarke
dbyan
x.Proteinsonly
detec
tedin
coom
assie-stained
2-D
gelsbutnotin
thesy
nthes
isgelswere
marke
dwith
Coo.
Proteinsthat
areunder
gluco
serepressionac
cordingto
previousarraydataareindicated
with
“glu-”
[36,
37,4
3].P
roteinsthat
arese
creted
areindicated
by“s
”,lip
oproteinsaremarke
dwith
“lipo”,
andce
llwallp
roteinsareindicated
by“w
all”.P
roteinsthat
arenote
xpressed
intheve
getativeproteomemap
areindicated
by*[3].Allnew
lyiden
tifie
dproteinsthat
areab
sent
inve
getativeproteom
emap
andalso
notd
etec
tedin
previousproteomean
alys
esforstress
andstarva
tionareindicated
by**
[5–8
,10–
14].
b)Thefunctionisderived
from
theSubtiListd
atab
ase(http://gen
olist.fr/SubtiList/).T
hefunctionsoftheFu
r-regulated
gen
esarederived
from
gen
etican
dphys
iological
studiesreported
previously[23].
ª 2006 WILEY-VCH Verlag GmbH & Co. KGaA, Weinheim www.proteomics-journal.com
VCH Auftr.-Nr. 32745 Vers.: 6.06 1. Papierlauf Seite 11 – hg –S : / 3D / v c h / _ p ro t e om i c s / p r _ 0 6 _ 1 6 / p r _ 0 01 0 0 . 3 d Proteomics Montag, den 19. 06. 06, 12 Uhr 31

12 L. Thi Tam et al. Proteomics 2006, 6, 0000–0000
GALL
EYPR
OOF
generally by multiple stimuli are labeled in these fused pro-teome maps for stress and starvation by a defined color codeof 15 different colors that indicates the induction profile. InFig. 2 we show the fused proteome map combining fourstress conditions: heat, salt, hydrogen peroxide, and paraquatstress. In Fig. 4 we show the fused proteomemap combiningfour starvation conditions: ammonium, tryptophan, phos-
phate, and glucose starvation. These fused images and colorcodes for different stress or starvation conditions can be usedas a tool to define stress/starvation-specific proteins inducedby one single stimulus or more general stress/starvationproteins induced by multiple stimuli. According to theirspecific color codes, the proteins can be classified into speci-fically or generally induced regulons (Figs. 3, 5 and Table 1).
Figure 2. Color-coded fused proteome map of B. subtilis exposed to heat, salt, hydrogen peroxide, and paraquat stress. The protein syn-thesis patterns (autoradiograms) of B. subtilis exposed to heat, salt, hydrogen peroxide, and paraquat stress were combined to generate afused stress proteome map of B. subtilis using the union image fusion approach of the Delta2D software. The induced marker proteinswere color coded according to their expression profiles. All spots induced specifically after one stress or generally also by other stressesare labeled in the fused proteome map by a defined color code that indicates the induction profile.
ª 2006 WILEY-VCH Verlag GmbH & Co. KGaA, Weinheim www.proteomics-journal.com
VCH Auftr.-Nr. 32745 Vers.: 6.06 1. Papierlauf Seite 12 – hg –S : / 3D / v c h / _ p ro t e om i c s / p r _ 0 6 _ 1 6 / p r _ 0 01 0 0 . 3 d Proteomics Montag, den 19. 06. 06, 12 Uhr 31

Proteomics 2006, 6, 0000–0000 Microbiology 13
GALL
EYPR
OOF
Figure 3. The specific and general stress regulons in B. subtilis.Commonly shared (generally induced) and unique (specificallyinduced) stress regulons and proteins in the proteome of B. sub-tilis exposed to heat, salt, hydrogen peroxide, and paraquatstress according to the fused stress proteome map in Fig. 2. Thespecific and general stress regulons are underlined, and theencoded specific or general stress proteins are listed in paren-theses.
3.2 Stress proteome signatures
3.2.1 Proteome signature for heat shock (487C)
In total, 36 marker proteins are induced in the proteomemap after the temperature up-shift to 487C of which ClpEand GspA are not present in the vegetative proteome map(Fig. 2, Table 1). The heat shock response involves mainly theHrcA, sB, and CtsR regulons (Fig. 3) [20]. Since heat shockcauses protein damages, such as non-native disulfide bondformation, the Spx regulon that is required for thiol home-ostasis is induced [21].
The HrcA-dependent chaperones DnaK, GroEL, GroES,and GrpE are heat-specific marker proteins that are red-labeled in the fused stress proteome map (Fig. 2). Surpris-ingly, two proteins of the sB regulon (YceD and YvaA) arealso heat-specific marker proteins.
General marker proteins for heat and salt stress as well asstarvation for glucose and phosphate are 16 sB-dependentproteins (Ctc, Dps, GsiB, GspA, GtaB, NadE, RsbW, SigB,SodA, YcdF, YceH, YdaG, YfkM, YhdN, YkzA, YsnF) [22]. Inaddition, the CtsR-dependent chaperones and proteasesClpC, ClpP, and ClpE are general marker proteins for heatand salt stress. General Spx-dependent marker proteins forheat and oxidative stress include NfrA, IolS, YhfK, YjbG, andYqiG [21]. Finally, the class IV heat shock protein HtpG is ageneral marker protein for heat shock and phosphate starva-tion.
3.2.2 Proteome signature for salt stress (6% NaCl)
The response to salt stress provoked by the addition of6% NaCl is reflected by the induction of 33 marker proteinsof which ClpE, GspA, YocK, and YdaD are not present in thevegetative proteome map (Fig. 2, Table 1). These markerproteins can be classified according to the sB, CtsR, and Spxregulons (Fig. 3) [10, 21, 22].
Two pink-labeled marker proteins are specificallyinduced by salt stress, namely the sB-dependent telluriumresistance protein (YceC) and the fatty acid biosynthesis en-zyme (FabF). The general proteome signature for salt andheat stress includes the 16 above-mentioned sB-dependentmarker proteins. Other sB-dependent marker proteins YdaP,YdaD, KatE, YocK, and YfhM are induced generally by saltstress, phosphate, and glucose starvation [22]. The CtsR reg-ulon members ClpC, ClpE, and ClpP and the Spx-dependentproteins NfrA and YuaE are general marker proteins for saltand heat or oxidative stress. Finally, YurU involved in Fe-S-cluster assembly and the ABC-transporter ATP-binding pro-tein YurY belong to general marker proteins for salt stress,ammonium, or tryptophan starvation [10, 21, 22].
3.2.3 Proteome signature for oxidative stress(116 mMH2O2 and 100 mM paraquat)
The exposure of cells to 116 mM H2O2 or 100 mM paraquatresulted in the induction of 28 peroxide marker proteins or31 superoxide marker proteins including 14 proteins that areabsent in the vegetative proteome map (Fig. 2, Table 1).These marker proteins can be classified into the oxidativestress regulons PerR, Fur, and Spx as well as the oxygenradical specific SOS regulon and the sulfur limitation re-sponse (Fig. 3) [11, 21, 23, 24].
Marker proteins for peroxide and superoxide stress arethe light-orange labeled oxidative stress-specific PerR-de-pendent proteins KatA, AhpC, AhpF, and MrgA and sevenFur-dependent proteins including the siderophore bacilli-bactin biosynthesis enzymes (DhbA, DhbB, DhbC, andDhbE), the ferrioxamine ABC-transporter binding protein(YxeB), the Fe-transporter (YwbM), the thioredoxin reductase(YcgT), and three proteins belonging to Spx regulon (HemH,YfjR, YugJ) [21, 23]. These light-orange labeled oxidativestress-specific marker proteins are most strongly induced byboth reactive oxygen species and involved in specific adapta-tive functions to oxidative stress (Fig. 2). Surprisingly, threeorange-labeled ABC-transporter binding proteins of the Furregulon that are involved in the uptake of the siderophoresbacillibactin, enterobactin (FeuA), schizokinin, arthrobac-tin (YfiY), or unknown siderophores (YclQ) are specificallyinduced only after peroxides [23, 24].
The orange-labeled proteins UvrB and RecA of the DNAdamage inducible SOS regulon are induced specifically afterperoxide stress (Figs. 2, 3) [25]. In contrast, four yellow-labeled proteins involved in sulfur assimilation (YxeK, YxeP)and cysteine biosynthesis (CysK, YrhB) represent superoxide
ª 2006 WILEY-VCH Verlag GmbH & Co. KGaA, Weinheim www.proteomics-journal.com
VCH Auftr.-Nr. 32745 Vers.: 6.06 1. Papierlauf Seite 13 – hg –S : / 3D / v c h / _ p ro t e om i c s / p r _ 0 6 _ 1 6 / p r _ 0 01 0 0 . 3 d Proteomics Montag, den 19. 06. 06, 12 Uhr 31
14 L. Thi Tam et al. Proteomics 2006, 6, 0000–0000
GALL
EYPR
OOF
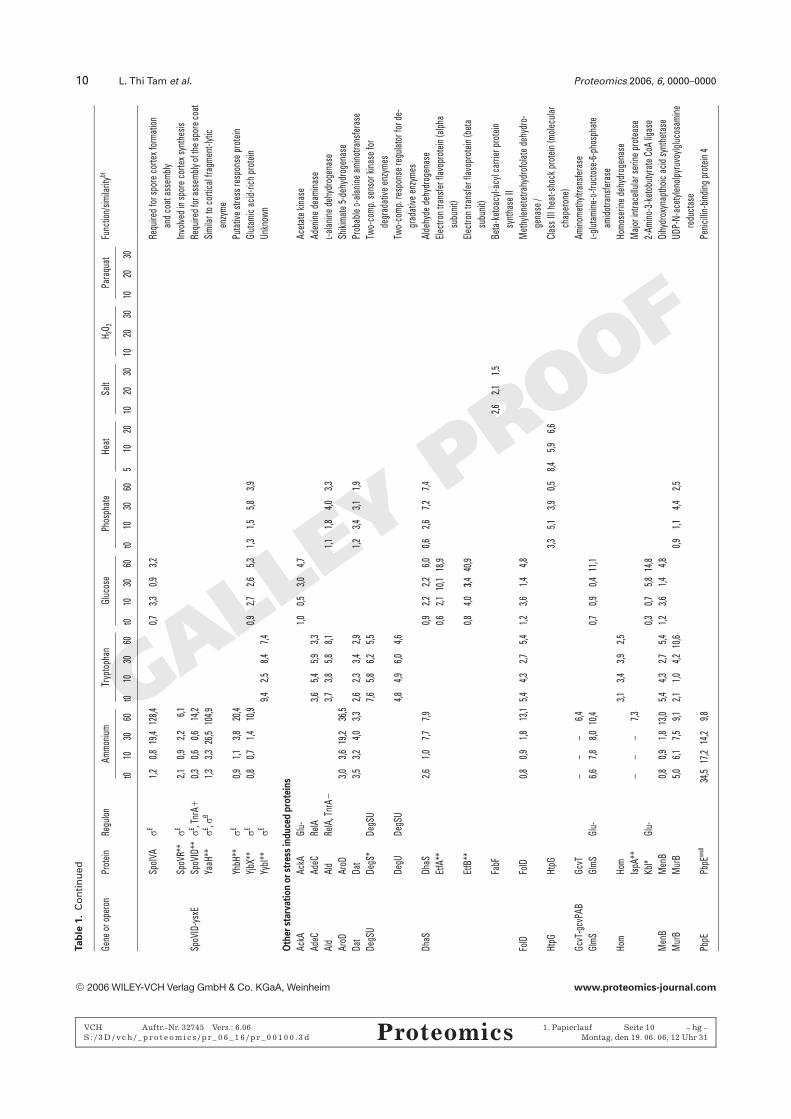
Figure 4. Color-coded fused proteome map of B. subtilis after ammonium, tryptophan, glucose and phosphate starvation. The proteinsynthesis patterns (autoradiograms) of B. subtilis in response to starvation for ammonium, tryptophan, glucose, and phosphate werecombined to generate a fused starvation proteome map of B. subtilis using the union image fusion approach of the Delta2D software. Theinduced marker proteins were color coded according to their expression profiles. All spots induced specifically after one starvation condi-tion or generally also by other starvation conditions are labeled in the fused proteome map by a defined color code that indicates theinduction profile.
specific marker proteins that are regulated by the cysteinemetabolism repressor CymR (YrzC). The superoxide specificmarker proteins MetE and YitJ are involved in methioninebiosynthesis and regulated by the S-box transcription anti-termination system (Figs. 2, 3) [11, 26]. Further superoxidespecific marker proteins are YbaL and YpsC.
General marker proteins for oxidative, heat or salt stressbelong to the Spx regulon including IolS, NfrA, Tpx, YhfK,YjbG, YqiG, and YuaE [21]. Of these the flavin mononucleo-tide-dependent NADPH oxidase NfrA was identified asglobal Spx-dependent protein induced by all four stress con-ditions.
ª 2006 WILEY-VCH Verlag GmbH & Co. KGaA, Weinheim www.proteomics-journal.com
VCH Auftr.-Nr. 32745 Vers.: 6.06 1. Papierlauf Seite 14 – hg –S : / 3D / v c h / _ p ro t e om i c s / p r _ 0 6 _ 1 6 / p r _ 0 01 0 0 . 3 d Proteomics Montag, den 19. 06. 06, 12 Uhr 31

Proteomics 2006, 6, 0000–0000 Microbiology 15
GALL
EYPR
OOF
3.3 Starvation proteome signatures
3.3.1 Proteome signature for ammonium starvation(0.7 mM (NH4)2SO4)
The ammonium starvation proteome showed 84 inducedmarker proteins including 31 proteins that are not present inthe vegetative proteome map (Fig. 4, Table 1). These can beclassified according to the TnrA, sL/BkdR, sL/RocR, CodY,sB, sH, sF, and sE regulons (Fig. 5). Of major importanceare the red-labeled specific marker proteins of the TnrA andsL/BkdR regulons, which are known to be induced by nitro-gen starvation and involved in the utilization of alternativenitrogen sources such as proteins, peptides, purines,branched chain amino acids, and asparagine [27–30].
The specific proteome signature for ammonium starva-tion is reflected by seven red-labeled TnrA-regulated proteinsincluding the asparaginase (AsnZ), the glutamine syntheta-se (GlnA), the uricase (PucL), the oligopeptide-transporters(OppA and OppD), the extracellular serine protease (Vpr),and the translocation-dependent antimicrobial spore com-ponent (TasA) (Figs. 4, 5 and Table 1) [28, 29]. In addition,the red-labeled sL/BkdR-dependent proteins (Bcd, LpdV, andBkdAA) represent specific marker proteins for ammoniumstarvation that are involved in the catabolism of branchedchain amino acids (isoleucine and valine) (Fig. 5) [30]. Otherspecific marker proteins are AroD, CitB, GcvT, IspA, YqeH,YvaB, and LiaH; the sF-dependent sporulation proteinsKatX, SpoIIQ, and SpoVT; and the sE-dependent sporulationproteins AsnO, SpoVR, SpoVID, YaaH, and YhbH [31, 32].
Figure 5. The specific and general starvation regulons in B. sub-tilis. Commonly shared (generally induced) and unique (specifi-cally induced) starvation regulons and proteins in the proteomeof B. subtilis after ammonium, tryptophan, phosphate, and glu-cose starvation according to the fused starvation proteome mapin Fig. 4. The specific and general starvation regulons are under-lined and the encoded specific or general starvation proteins arelisted in parentheses.
The general proteome signature for ammonium andtryptophan or phosphate starvation is represented by11 CodY-dependent proteins including the dipeptide- andoligopeptide-transporters (AppD, DppA), the urease (UreC),the acetyl-CoA synthetase (AcsA), the aminohy-drolase (AmhX), the sugar metabolism system (YurJ, YurO,YurP), the Spo0F,P aspartyl phosphatase (RapA), and theproteins of unknown functions (YxbB and YxbC) [33, 34]. Inaddition to AcsA, the sL/RocR-dependent arginine and orni-thine catabolic proteins (RocA, RocD, RocF), the citrate syn-thase (CitZ), and the 3-hydroxbutyryl-CoA dehydratase (YsiB)are also under CcpA-dependent glucose repression con-sistent with their general induction in response to ammo-nium and glucose starvation [5, 35–37]. Further generalmarker proteins for ammonium and glucose starvationinclude four sB-dependent proteins (Dps, SigB, YdaE, YfhM)[22] and six sE-dependent sporulation proteins (YuaE, KamA,PrkA, SafA, SpoIVA, YjbX) [31, 32].
In addition, 11 marker proteins of the transition phasesH regulon are generally induced by ammonium and tryp-tophan starvation including proteins involved in cell divi-sion (MinD), the sporulation response regulator (Spo0A),the response regulator aspartyl phosphatase (RapG), thesporulation protein (SpoVG), the sB- and sH-controlled pro-teins (YvyD and YtxH), the 5-oxo-1,2,5-tricarboxilic-3-pentenacid decarboxylase (YisK), the sF transcription factor, and theproteins of unknown functions (YpiB, YuxI, and YwfC) [38–40]. Interestingly, a subset of six sH-dependent proteins(Spo0A, YvyD, YtxH, YpiB, YisK, YuxI) and the CodY-de-pendent RapA are induced by all four starvation conditionsand these proteins are defined as general starvation proteins.
3.3.2 Proteome signature for tryptophan starvation(4 mM tryptophan)
In response to tryptophan starvation we identified 47 markerproteins including 20 proteins that are not present in thevegetative proteome map (Fig. 4, Table 1). These markerproteins can be classified according to the tryptophan-acti-vated RNA-binding attenuation protein (TRAP), CodY, sB,sE, and sH regulons (Fig. 5).
Specifically and most strongly induced are five pink-labeled tryptophan biosynthetic enzymes TrpA, TrpB,TrpD, TrpE, and PabA (TrpG) that are regulated by theTRAP (Fig. 5) [41, 42]. Further tryptophan starvation-spe-cific marker proteins include two CodY-dependent pro-teins (the dihydroxy-acid dehydratase IlvD and the riboki-nase YurL), the sE-dependent sporulation protein (YybI),and two sH-dependent proteins (FtsA and SpoVS); thehomoserine dehydrogenase (Hom), the adenine deamina-se (AdeC), and the two component system regulatingextracellular enzyme synthesis, competence, and motility(DegS and DegU).
General marker proteins for tryptophan and ammoniumstarvation belong to the CodY- and sH-regulons as written inSection 3.3.1. In addition, the sB-dependent proteins GsiB
ª 2006 WILEY-VCH Verlag GmbH & Co. KGaA, Weinheim www.proteomics-journal.com
VCH Auftr.-Nr. 32745 Vers.: 6.06 1. Papierlauf Seite 15 – hg –S : / 3D / v c h / _ p ro t e om i c s / p r _ 0 6 _ 1 6 / p r _ 0 01 0 0 . 3 d Proteomics Montag, den 19. 06. 06, 12 Uhr 32

16 L. Thi Tam et al. Proteomics 2006, 6, 0000–0000
GALL
EYPR
OOF
and YdaE as well as the sE-dependent catalase KatA are gen-eral marker proteins for tryptophan and other starvationconditions.
3.3.3 Proteome signatures for glucose starvation(0.05% glucose)
The glucose starvation proteome signature revealed theinduction of 65 marker proteins of which 26 proteins are notpresent in the vegetative proteome map (Fig. 4, Table 1).These include the most strongly induced 22 carbon catabo-lite-controlled proteins and members of the sB, sF, and sE
regulons (Fig. 5) [6, 36, 37, 43, 44].Specifically induced in response to glucose starvation are
nine orange-labeled CcpA-dependent carbon catabolite-con-trolled proteins involved in utilization of alternative carbonsources such as aryl-b-glucosides (BglH), lichenan (LicH),glycerol (GlpK), ribose (RbsA and RbsK), maltose (MalA,MalL, and YvdG), and glutamate (RocG). In addition, theorange-labeled sL/AcoR-dependent proteins for utilization ofacetoin (AcoA, AcoB, AcoC, and AcoL) are glucose starvation-specific marker proteins (Fig. 5) [6, 36, 37]. The CcpN-regu-lated proteins involved in gluconeogenesis including theglyceraldehyde-3-phosphate dehydrogenase (GapB) and thephosphoenolpyruvate carboxykinase (PckA) are also specifi-cally induced in response to glucose starvation (Fig. 5) [44].Finally, the acetate kinase (AckA), the 2-amino-3-ketobuty-rate CoA ligase (Kbl), and the electron transfer flavoproteinsubunits (EtfA and EtfB) were identified as glucose starva-tion-specific marker proteins [6, 37].
The general proteome signature for glucose and ammo-nium or tryptophan starvation includes six further CcpA-controlled proteins (AcsA, CitZ, RocA, RocD, RocF, andYsiB). In addition, 17 sB-dependent proteins (GsiB, GspA,GtaB, Dps, RsbW, SigB, YfkM, YsnF, Ctc, KatE, YdaE, YdaG,YflT, NadE, YfhM, YocK, YkzA) are induced in response toglucose and phosphate starvation as well as by heat and saltstress [22]. The six sH-dependent general starvation proteins(Spo0A, YisK, YpiB, YuxI, YvyD, and YtxH) and RapA aregeneral marker proteins for all starvation conditions [38–40].Finally, the sF-dependent RsfA and six sE-dependent spor-ulation proteins are general marker proteins for glucose andammonium starvation as referred in Section 3.3.4.ncheckchangen [31, 32].
3.3.4 Proteome signature for phosphate starvation(0.2 mM KH2PO4)
The proteome signature in response to phosphate starvationrevealed the induction of 62 marker proteins of which 27 areabsent in the vegetative proteome map (Fig. 4, Table 1).These marker proteins can be classified according to thephosphate starvation-specific PhoPR regulon as well as thegenerally induced sB, CodY, and sH regulons (Fig. 5).
Eight yellow-labeled PhoPR-dependent proteins arespecifically and most strongly induced in response to phos-phate starvation including the alkaline phosphatase (PhoB),the phosphodiesterase (PhoD), the response reg-ulator (PhoP), the phosphate-specific ABC-transporter bind-ing protein (PstS), the ATP binding protein of the phosphate-transporter (PstBB/BA), the lipoprotein YdhF, and the tei-churonic acid biosynthesis proteins TuaD and TuaH (Fig. 5)[5, 7, 45, 46]. In addition, PksC involved in polyketide syn-thesis, the putative regulator YhjL, the glucanase YhfE, thetransaldolase YwjH, the sH-dependent glycogen synthaseGlgA, the sD-dependent flagellin Hag, YaaQ and the sB-de-pendent proteins YdaT and YdbD can be regarded as phos-phate starvation-specific marker proteins [5].
General CodY-dependent marker proteins for phosphateand ammonium starvation include AcsA, YxbB, YxbC, andRapA [33, 34]. In addition, 17 sB-dependent proteins aregeneral marker proteins for phosphate and glucose starva-tion (GsiB, GspA, GtaB, Dps, RsbW, YfkM, YsnF, Ctc, KatE,YdaG, YflT, YocK, YkzA, YfhM, YdaE) or phosphate starva-tion and salt stress (YdaD, YdaP) [22]. Four sH-dependentproteins are induced by phosphate and ammonium starva-tion (MinD, RapG, SpoVG, SigF) in addition to the six sH-dependent general starvation proteins (Spo0A, YisK, YpiB,YuxI, YvyD, and YtxH) [38–40]. The sE-dependent YjbX andthe sF-dependent RsfA are general marker proteins forphosphate, glucose, and ammonium starvation and HtpGoverlaps between heat shock and phosphate starvation.
4 Discussion
4.1 The proteome of B. subtilis in response to stressand starvation
Soil-dwelling bacteria, such as B. subtilis have developed avery complex adaptational network to overcome changes intheir environment provoked by different stress and starva-tion conditions. Based on previous genome-wide expressionprofiling with mutants in the central regulatory genes (e.g.,alternative sigma factors, transcriptional activators, andrepressors) the stimulons that are induced by the specificstress or starvation conditions are classified in their respec-tive regulons. However, these analyses have not only definedspecifically induced regulons, but also enabled the globalanalysis to define generally induced regulons that respond todifferent stimuli. The proteome analysis is a powerful tool tovisualize the panorama view of the physiological state of thecell. A set of marker proteins is induced in response tochanges in the environment that was defined as proteomesignature indicative for specific stress or starvation condi-tions [1, 2].
In this study, the proteome signatures of B. subtilis fordifferent stress and starvation conditions could be completedby 45 new marker proteins not detected in the previousseparate proteome analyses for heat, salt, oxidative stress, or
ª 2006 WILEY-VCH Verlag GmbH & Co. KGaA, Weinheim www.proteomics-journal.com
VCH Auftr.-Nr. 32745 Vers.: 6.06 1. Papierlauf Seite 16 – hg –S : / 3D / v c h / _ p ro t e om i c s / p r _ 0 6 _ 1 6 / p r _ 0 01 0 0 . 3 d Proteomics Montag, den 19. 06. 06, 12 Uhr 32

Proteomics 2006, 6, 0000–0000 Microbiology 17
GALL
EYPR
OOF
Figure 6. The vegetative proteome map of B. subtilis including all newly induced marker proteins after stress and starvation The proteinsynthesis pattern (autoradiogram) of B. subtilis during vegetative growth conditions. All 83 red-labeled proteins are induced by stress orstarvation only and not present in the vegetative proteome map.
starvation for glucose and phosphate (Figs. 6–8) [2, 5–7, 10,12]. In total, 201 stress- or starvation-induced proteins havebeen identified, including 83 proteins that are absent in thevegetative proteomemap (Figs. 6–8). Heat, salt, and oxidativestress caused the induction of 79 marker proteins including18 new proteins not present in the vegetative proteome map.In response to ammonium, tryptophan, glucose, and phos-phate starvation 155 marker proteins are induced including68 new proteins not detected in the vegetative proteome map(Figs. 6–8). As novel proteome signatures for B. subtilis, theresponses to ammonium and tryptophan starvation were
defined including 32 newly identified marker proteins.There are 68 new starvation proteins compared to only18 new stress proteins. This indicates that the starvationproteins are not expressed during vegetative growth condi-tions in contrast to the stress proteins that show a basalexpression level in vegetative growing cells. The total num-ber of 83 new proteins seems probably low since in mostcases more than 100 genes are induced in response to onestress or starvation condition at the transcriptome level.However, we have to consider that some induced markerproteins could not be identified in coomassie-stained 2-D
ª 2006 WILEY-VCH Verlag GmbH & Co. KGaA, Weinheim www.proteomics-journal.com
VCH Auftr.-Nr. 32745 Vers.: 6.06 1. Papierlauf Seite 17 – hg –S : / 3D / v c h / _ p ro t e om i c s / p r _ 0 6 _ 1 6 / p r _ 0 01 0 0 . 3 d Proteomics Montag, den 19. 06. 06, 12 Uhr 32

18 L. Thi Tam et al. Proteomics 2006, 6, 0000–0000
GALL
EYPR
OOF
Figure 7. The fused proteome map of all stress and starvation conditions of B. subtilis including all induced marker proteins. The proteinsynthesis patterns (autoradiograms) of B. subtilis in response to heat, salt, hydrogen peroxide, and paraquat stress as well as after star-vation for ammonium, tryptophan, glucose, and phosphate were combined to generate a fused global proteome map of B. subtilis cellsafter stress and starvation using an image fusion approach of the Delta2D software. All 201 labeled proteins are induced by stress or star-vation. Among these the 83 proteins that are not present in the vegetative proteome map are marked with red labels. Some induced pro-teins which were identified in previous proteome analyses but not in the present study were marked with circles.
gels since these are synthesized at increased levels afterlabelling with 35S-methionine but do not accumulate in theproteome. Furthermore, the gene products for manyinduced genes that have been identified in the tran-scriptome analysis escape the 2-D gel based proteomeapproach since these are hydrophobic transmembrane pro-teins or alkaline proteins.
4.2 Functional characterization of stress proteins
The catalog of stress and starvation proteome signatures mayhelp to define the mode of action of unknown anti-microbials, antibiotics, and xenobiotics or to analyze thephysiological changes and kind of limitation in complexnondefined media, for example, during an industrial
ª 2006 WILEY-VCH Verlag GmbH & Co. KGaA, Weinheim www.proteomics-journal.com
VCH Auftr.-Nr. 32745 Vers.: 6.06 1. Papierlauf Seite 18 – hg –S : / 3D / v c h / _ p ro t e om i c s / p r _ 0 6 _ 1 6 / p r _ 0 01 0 0 . 3 d Proteomics Montag, den 19. 06. 06, 12 Uhr 32
Proteomics 2006, 6, 0000–0000 Microbiology 19
GALL
EYPR
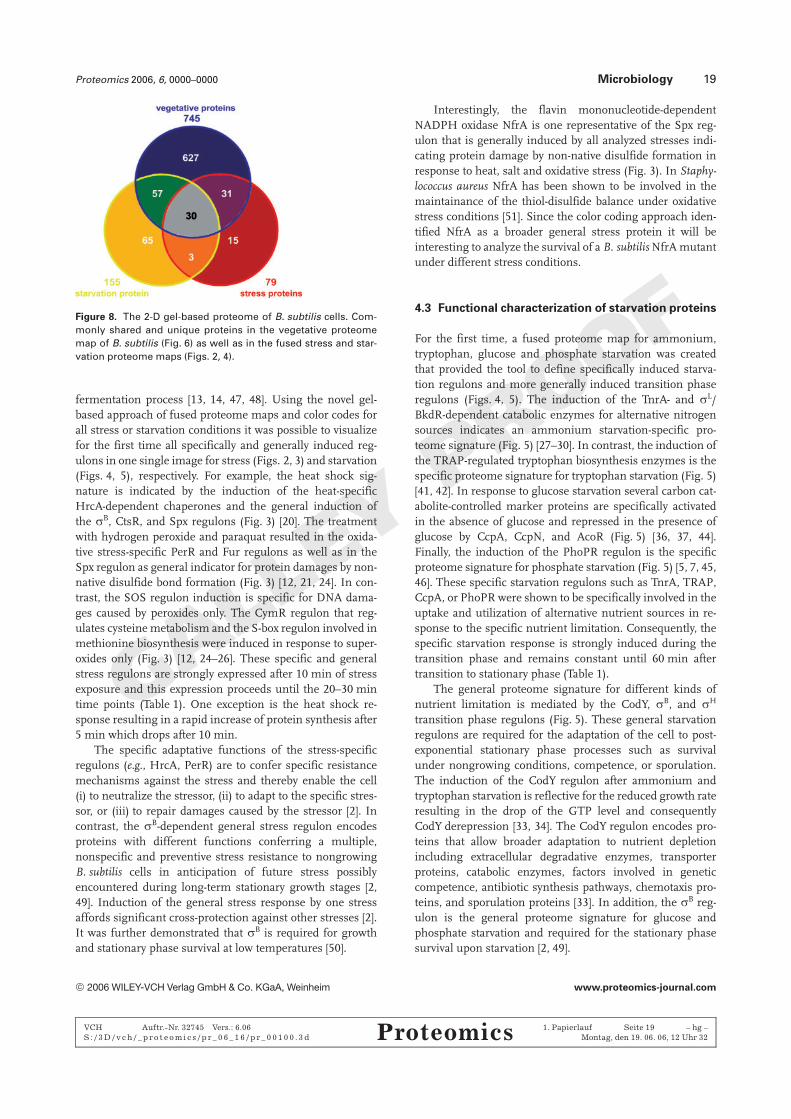
OOFFigure 8. The 2-D gel-based proteome of B. subtilis cells. Com-
monly shared and unique proteins in the vegetative proteomemap of B. subtilis (Fig. 6) as well as in the fused stress and star-vation proteome maps (Figs. 2, 4).
fermentation process [13, 14, 47, 48]. Using the novel gel-based approach of fused proteome maps and color codes forall stress or starvation conditions it was possible to visualizefor the first time all specifically and generally induced reg-ulons in one single image for stress (Figs. 2, 3) and starvation(Figs. 4, 5), respectively. For example, the heat shock sig-nature is indicated by the induction of the heat-specificHrcA-dependent chaperones and the general induction ofthe sB, CtsR, and Spx regulons (Fig. 3) [20]. The treatmentwith hydrogen peroxide and paraquat resulted in the oxida-tive stress-specific PerR and Fur regulons as well as in theSpx regulon as general indicator for protein damages by non-native disulfide bond formation (Fig. 3) [12, 21, 24]. In con-trast, the SOS regulon induction is specific for DNA dama-ges caused by peroxides only. The CymR regulon that reg-ulates cysteine metabolism and the S-box regulon involved inmethionine biosynthesis were induced in response to super-oxides only (Fig. 3) [12, 24–26]. These specific and generalstress regulons are strongly expressed after 10 min of stressexposure and this expression proceeds until the 20–30 mintime points (Table 1). One exception is the heat shock re-sponse resulting in a rapid increase of protein synthesis after5 min which drops after 10 min.
The specific adaptative functions of the stress-specificregulons (e.g., HrcA, PerR) are to confer specific resistancemechanisms against the stress and thereby enable the cell(i) to neutralize the stressor, (ii) to adapt to the specific stres-sor, or (iii) to repair damages caused by the stressor [2]. Incontrast, the sB-dependent general stress regulon encodesproteins with different functions conferring a multiple,nonspecific and preventive stress resistance to nongrowingB. subtilis cells in anticipation of future stress possiblyencountered during long-term stationary growth stages [2,49]. Induction of the general stress response by one stressaffords significant cross-protection against other stresses [2].It was further demonstrated that sB is required for growthand stationary phase survival at low temperatures [50].
Interestingly, the flavin mononucleotide-dependentNADPH oxidase NfrA is one representative of the Spx reg-ulon that is generally induced by all analyzed stresses indi-cating protein damage by non-native disulfide formation inresponse to heat, salt and oxidative stress (Fig. 3). In Staphy-lococcus aureus NfrA has been shown to be involved in themaintainance of the thiol-disulfide balance under oxidativestress conditions [51]. Since the color coding approach iden-tified NfrA as a broader general stress protein it will beinteresting to analyze the survival of a B. subtilisNfrAmutantunder different stress conditions.
4.3 Functional characterization of starvation proteins
For the first time, a fused proteome map for ammonium,tryptophan, glucose and phosphate starvation was createdthat provided the tool to define specifically induced starva-tion regulons and more generally induced transition phaseregulons (Figs. 4, 5). The induction of the TnrA- and sL/BkdR-dependent catabolic enzymes for alternative nitrogensources indicates an ammonium starvation-specific pro-teome signature (Fig. 5) [27–30]. In contrast, the induction ofthe TRAP-regulated tryptophan biosynthesis enzymes is thespecific proteome signature for tryptophan starvation (Fig. 5)[41, 42]. In response to glucose starvation several carbon cat-abolite-controlled marker proteins are specifically activatedin the absence of glucose and repressed in the presence ofglucose by CcpA, CcpN, and AcoR (Fig. 5) [36, 37, 44].Finally, the induction of the PhoPR regulon is the specificproteome signature for phosphate starvation (Fig. 5) [5, 7, 45,46]. These specific starvation regulons such as TnrA, TRAP,CcpA, or PhoPR were shown to be specifically involved in theuptake and utilization of alternative nutrient sources in re-sponse to the specific nutrient limitation. Consequently, thespecific starvation response is strongly induced during thetransition phase and remains constant until 60 min aftertransition to stationary phase (Table 1).
The general proteome signature for different kinds ofnutrient limitation is mediated by the CodY, sB, and sH
transition phase regulons (Fig. 5). These general starvationregulons are required for the adaptation of the cell to post-exponential stationary phase processes such as survivalunder nongrowing conditions, competence, or sporulation.The induction of the CodY regulon after ammonium andtryptophan starvation is reflective for the reduced growth rateresulting in the drop of the GTP level and consequentlyCodY derepression [33, 34]. The CodY regulon encodes pro-teins that allow broader adaptation to nutrient depletionincluding extracellular degradative enzymes, transporterproteins, catabolic enzymes, factors involved in geneticcompetence, antibiotic synthesis pathways, chemotaxis pro-teins, and sporulation proteins [33]. In addition, the sB reg-ulon is the general proteome signature for glucose andphosphate starvation and required for the stationary phasesurvival upon starvation [2, 49].
ª 2006 WILEY-VCH Verlag GmbH & Co. KGaA, Weinheim www.proteomics-journal.com
VCH Auftr.-Nr. 32745 Vers.: 6.06 1. Papierlauf Seite 19 – hg –S : / 3D / v c h / _ p ro t e om i c s / p r _ 0 6 _ 1 6 / p r _ 0 01 0 0 . 3 d Proteomics Montag, den 19. 06. 06, 12 Uhr 32

20 L. Thi Tam et al. Proteomics 2006, 6, 0000–0000
GALL
EYPR
OOF
As a novel finding, the color-coded fused proteome mapfor starvation defined six sH-dependent proteins YvyD, YtxH,YisK, YpiB, Spo0A, YuxI and the CodY-dependent RapA asgeneral starvation proteins indicating the transition phase inresponse to nutrient limitation (Fig. 5). SigmaH directs thetranscription of several genes that function in the transitionfrom exponential growth to stationary phase, including theinitiation of spore formation and genetic competence [38]. Inaddition, sH controls many genes that are required for gen-eral adaptation to nutrient depletion. These genes areinvolved in transport, generation of potential nutrientsources, cell wall metabolism, proteolysis and cytochromebiogenesis [38]. It has been shown that both sB and sH con-tribute to stationary phase survival under acidic and alkalineconditions and this effect was independent from the simpleloss of sporulation ability [49].
4.4 Regulatory mechanisms of specific and generalstress/starvation proteins
Since most of the proteome signatures can be explained byknown regulators,wehave classified the stress- and starvation-induced proteins into specific and general regulons. The spe-cific stress or starvation proteins are controlled by one singleregulator (e.g., HrcA, PerR, TnrA, TRAP, CcpA, or PhoP). Incontrast, general starvation proteins can be controlled by sin-gle general regulators (sB, sH, or CodY), by multiple generalregulators (e.g., YvyD and YtxH by sB/sH) or by overlappingspecific and general regulators (e.g., DppA and YxbB by TnrA/CodY; UreC by TnrA/CodY/sH; AcsA by CcpA/CodY; RocADFby CcpA/sL/RocR/CodY). In addition, not all sB-dependentproteins are induced generally by the known conditions forsB
activation (e.g., heat, salt stress; phosphate and glucose starva-tion) (Table 1, Figs. 3, 5). Surprisingly, the sB-dependent pro-teins YceD and YvaA are induced specifically after heat shock,YceC specifically after salt stress, and YdbD and YdaT specifi-cally after phosphate starvation (Fig. 3). These differences inthe induction of individual sB regulon members might beexplained by additional promoters (e.g.,sW for YceC), differentpromoter strength, RNAor protein stability. In addition, somesB-dependent proteins might not be detected since theseoverlap with other proteins in the 2-D gel.
4.5 Functional characterization of the sH-dependentgeneral starvation proteins
Among the general starvation proteins Spo0A and RapAcounteract in the initiation of sporulation as last resort re-sponse to starvation. The process of sporulation is governedby a multicomponent phosphorelay that results in phospho-rylation of the key Spo0A [52, 53]. A certain threshold level ofSpo0A,P is necessary to initiate sporulation which is deter-mined by the phosphorelay [54]. The RapA phosphatasedephosphorylates the phosphorelay response regulatorSpo0F,P and consequently reduces the level of Spo0A,P[52, 53]. The coincidental induction of the counteracting
Spo0A and RapA proteins as general proteome signature forstarvation indicates that sporulation is a process with a bi-stable outcome, some cells initiate sporulation while othersdo not [54, 55]. It was demonstrated that the main function ofRapA is to maintain the bistable sporulation gene expres-sion, RapA is repressed in sporulating cells and still accu-mulated in nonsporulating cells [55]. The induction of the sF
and sE early sporulation regulons during the stationaryphase in response to nitrogen and glucose starvation reflectsthat some cells have initiated the sporulation process sincethey could not overcome the nutrient limitation.
Another interesting general starvation protein is the YvyDprotein that is similar to s54 modulation factors. It has beenshown inE. coli that theYvyD-homologousYfiAproteinbinds tothe 30S subunits of the ribosomes, inhibits the 100S ribosomeformation and reduces translation errors [56]. The B. subtilisYtxH protein shares some similarities to plant desiccation-related proteins [39]. The functions of the sB/sH-dependentproteins YvyD and YtxH during the starvation response inB. subtilis remains to be elucidated [39, 40]. In addition, thegeneral starvation proteins YvyD, YtxH, Spo0A, YpiB, andRapAproteins are under positive stringent control [8]. Thus, it mightbe that also YuxI and YisK are controlled by RelA in addition tosH. It is currently unknown whether these sH-dependent gen-eral starvation proteins contribute to the stationary phase survi-val which has been demonstrated previously forsB andsH [49].Thus, the fused starvation proteome map and color codeapproachprovide important leads for future research onproteinfunctions of the novel identified general starvation proteinsduring stationary phase survival inB. subtilis.
4.6 Outlook
In summary, this study can be regarded as one step towardsthe description of the complete cytoplasmic proteome ofB. subtilis, which includes a physiological approach by thedescription of proteome signatures in response to stress andstarvation. In total, 1301 cytoplasmic proteins are currentlyidentified in the proteome of B. subtilis during the growthand in response to stress and starvation using gel-based andgel-free proteome approaches [3, 4]. In addition, proteinquantification in response to heat shock revealed that heatshock proteins were up-regulated at similar levels using thegel-based approach and the gel-free ITRAQ� labelling tech-nology [4]. Future studies will be aimed on the definition ofthe complete proteome of B. subtilis cells after stress andstarvation using gel-free proteome approaches to identifyand quantify those stress- and starvation-induced proteinsthat escaped the gel-based proteome approach.
We thank the Decodon company for support with the DecodonDelta2D software. This work was supported by a scholarship of the“Ministry of Education and Training of Viet Nam” (MOET) toL.T.T., and grants from the Deutsche Forschungsgemeinschaft, theBundesministerium f�r Bildung und Forschung, the Fonds derChemischen Industrie, the Bildungsministerium of the country
ª 2006 WILEY-VCH Verlag GmbH & Co. KGaA, Weinheim www.proteomics-journal.com
VCH Auftr.-Nr. 32745 Vers.: 6.06 1. Papierlauf Seite 20 – hg –S : / 3D / v c h / _ p ro t e om i c s / p r _ 0 6 _ 1 6 / p r _ 0 01 0 0 . 3 d Proteomics Montag, den 19. 06. 06, 12 Uhr 32

Proteomics 2006, 6, 0000–0000 Microbiology 21
GALL
EYPR
OOF
Mecklenburg-Vorpommern (EMAU 0202120), European Uniongrants (LSHG-CT-2004-503468), and Genencor International(Palo Alto, California, USA) to M.H.
5 References
[1] VanBogelen, R. A., Schiller, E. E., Thomas, J. D., Neidhardt, F.C., Electrophoresis 1999, 20, 2149–2159.
[2] Hecker, M., V�lker, U., Proteomics 2004, 4, 3727–3750.
[3] Eymann, C., Dreisbach, A., Albrecht, D., Bernhardt, J. et al.,Proteomics 2004, 4, 2849–2876.
[4] Wolff, S., Otto, A., Albrecht, D., Stahl Zeng, J. et al.,Mol. Cell.Proteomics 2006 (in press)nupdaten.
[5] Antelmann, H., Scharf, C., Hecker, M., J. Bacteriol. 2000, 182,4478–4490.
[6] Bernhardt, J., Weibezahn, J., Scharf, C., Hecker, M., GenomeRes. 2003, 13, 224–237.
[7] Eymann, C., Mach, H., Harwood, C. R., Hecker, M., Micro-biology 1996, 142, 3163–3170.
[8] Eymann, C., Homuth, G., Scharf, C., Hecker, M., J. Bacteriol.2002, 184, 2500–2520.
[9] Graumann, P. L., Marahiel, M. A., Arch. Microbiol. 1999, 171,135–138.
[10] H�per, D., Bernhardt, J., Hecker, M., Proteomics 2006, 6,1550–1562.
[11] Leichert, L. I., Scharf, C., Hecker, M., J. Bacteriol. 2003, 185,1967–1975.
[12] Mostertz, J., Scharf, C., Hecker, M., Homuth, G., Micro-biology 2004, 150, 497–512.
[13] Bandow, J. E., Br�tz, H., Leichert, L. I., Labischinski, H.,Hecker, M., Antimicrob. Agents Chemother. 2003, 47, 948–955.
[14] Sender, U., Bandow, J., Engelmann, S., Lindequist, U.,Hecker, M., Pharmazie 2004, 59, 65–70.
[15] Anagnostopoulos, C., Spizizen, J., J. Bacteriol. 1961, 81,741–746.
[16] St�lke, J., Hanschke, R., Hecker, M., J. Gen. Microbiol. 1993,139, 2041–2045.
[17] Bernhardt, J., B�ttner, K., Scharf, C., Hecker, M., Electropho-resis 1999, 20, 2225–2240.
[18] Bradford, M. M., Anal. Biochem. 1976, 72, 248–254.
[19] Luhn, S., Berth, M., Hecker, M., Bernhardt, J., Proteomics2003, 3, 1117–1127.
[20] Hecker, M., V�lker, U., Adv. Microb. Physiol. 2001, 44, 35–91.
[21] Nakano, S., Kuster-Schock, E., Grossman, A. D., Zuber, P.,Proc. Natl. Acad. Sci. USA 2003, 100, 13603–13608.
[22] Petersohn, A., Brigulla, M., Haas, S., Hoheisel, J. D. et al., J.Bacteriol. 2001, 183, 5617–5631.
[23] Ollinger, J., Song, K.-B., Antelmann, H., Hecker, M., Hel-mann, J. D., J. Bacteriol. 2006, 188, 3664–3673.
[24] Helmann, J. D., Wu, M. F., Gaballa, A., Kobel, P. A. et al., J.Bacteriol. 2003, 185, 243–253.
[25] Fernandez, S., Ayora, S., Alonso, J. C., Res. Microbiol. 2000,151, 481–486.
[26] Even, S., Burguiere, P., Auger, S., Soutourina, O. et al., J.Bacteriol. 2006, 188, 2184–2197.
[27] Fisher, S. H., Mol. Microbiol. 1999, 32, 223–232.
[28] Wray, L. V., Jr., Ferson, A. E., Rohrer, K., Fisher, S. H., Proc.Natl. Acad. Sci. USA 1996, 93, 8841–8845.
[29] Yoshida, K., Yamaguchi, H., Kinehara, M., Ohki, Y. H. et al.,Mol. Microbiol. 2003, 49, 157–165.
[30] Debarbouille, M., Gardan, R., Arnaud, M., Rapoport, G., J.Bacteriol. 1999, 181, 2059–2066.
[31] Eichenberger, P., Jensen, S. T., Conlon, E. M., Van Ooij, C. etal., J. Mol. Biol. 2003, 327, 945–972.
[32] Feucht, A., Evans, L., Errington, J., Microbiology 2003, 149,3023–3034.
[33] Molle, V., Nakaura, Y., Shivers, R. P., Yamaguchi, H. et al., J.Bacteriol. 2003, 185, 1911–1922.
[34] Ratnayake-Lecamwasam, M., Serror, P., Wong, K. W.,Sonenshein, A. L., Genes Dev. 2001, 15, 1093–103.
[35] Gardan, R., Rapoport, G., Debarbouille, M., Mol. Microbiol.1997, 24, 825–837.
[36] Yoshida, K., Kobayashi, K., Miwa, Y., Kang, C. M. et al.,Nucleic Acids Res. 2001, 29, 683–692.
[37] Koburger, T., Weibezahn, J., Bernhardt, J., Homuth, G. et al.,Mol. Genet Genomics. 2005, 274, 1–12.
[38] Britton, R. A., Eichenberger, P., Gonzalez-Pastor, J. E., Faw-cett, P. et al., J. Bacteriol. 2002, 184, 4881–4890.
[39] Var�n, D., Brody, M. S., Price, C. W.,Mol. Microbiol. 1996, 20,339–350.
[40] Drzewiecki, K., Eymann, C., Mittenhuber, G., Hecker, M., J.Bacteriol. 1998, 180, 6674–6680.
[41] Babitzke, P., Gollnick, P., J. Bacteriol. 2001, 183, 5795–5802.
[42] Gollnick, P., Babitzke, P., Antson, A., Yanofsky, C., Annu. Rev.Genet. 2005, 39, 47–68.
[43] Blencke, H. M., Homuth, G., Ludwig, H., M�der, U. et al.,Metab. Eng. 2003, 5, 133–149.
[44] Servant, P., Le Coq, D., Aymerich, S., Mol. Microbiol. 2005,55, 1435–1451.
[45] Allenby, N. E., O’Connor, N., Pragai, Z., Ward, A. C. et al., J.Bacteriol. 2005, 187, 8063–8080.
[46] Hulett, F. M., in: Sonenshein, A. L., Hoch, J. A., Losick, R.(Eds.), Bacillus Subtilis and its Closest Relatives: FromGenes to Cells, ASM press, Washington DC 2002, pp. 193–201.
[47] Antelmann, H., Sapolsky, R., Miller, B., Ferrari, E. et al., Pro-teomics 2004, 4, 2408–2424.
[48] Voigt, B., Schweder, T., Becher, D., Ehrenreich, A. et al., Pro-teomics 2004, 4, 1465–90.
[49] Gaidenko, T. A., Price, C. W., J. Bacteriol. 1998, 180, 3730–3733.
[50] Mendez, M. B., Orsaria, L. M., Philippe, V., Pedrido, M. E.,Grau, R. R., J. Bacteriol. 2004, 186, 989–1000.
[51] Streker, K., Freiberg, C., Labischinski, H., Hacker, J., Ohlsen,K., J. Bacteriol. 2005, 187, 2249–2256.
[52] Perego, M., Hoch, J. A., in: Sonenshein, A. L., Hoch, J. A.,Losick, R. (Eds.), Bacillus Subtilis and its Closest Relatives:From Genes to Cells, ASM press, Washington DC 2002,pp. 473–481.
[53] Sonenshein, L., Curr. Opin. Microbiol. 2000, 3, 561–566.
[54] Fujita, M., Gonzalez-Pastor, J. E., Losick, R., J. Bacteriol.2005, 187, 1357–1368.
[55] Veening, J.-W., Harmon, L.W., Kuipers, O. P.,Mol. Microbiol.2005, 56, 1481–1494.
[56] Ueta, M., Yoshida, H., Wada, C., Baba, T. et al., Genes Cells.2005, 10, 1103–1112.
ª 2006 WILEY-VCH Verlag GmbH & Co. KGaA, Weinheim www.proteomics-journal.com
VCH Auftr.-Nr. 32745 Vers.: 6.06 1. Papierlauf Seite 21 – hg –S : / 3D / v c h / _ p ro t e om i c s / p r _ 0 6 _ 1 6 / p r _ 0 01 0 0 . 3 d Proteomics Montag, den 19. 06. 06, 12 Uhr 32
Copyright © 2022 FDOKUMEN