Bayesian Joint Prediction of Associated Transcription Factors in Bacillus subtilis
12
September 22, 2004 17:46 Proceedings Trim Size: 9in x 6in makita BAYESIAN JOINT PREDICTION OF ASSOCIATED TRANSCRIPTION FACTORS IN BACILLUS SUBTILIS Y. MAKITA 1,2 , M.J.L. DE HOON 1 , N. OGASAWARA 3 , S. MIYANO 1 , AND K. NAKAI 1 1 Human Genome Center, Institute of Medical Science, University of Tokyo 4-6-1 Shirokanedai, Minato-ku, Tokyo 108-8639, Japan 2 School of Technology, Nagoya University Furocho Chikusa-ku Nagoya, Aichi 464-8603, Japan 3 Graduate School of Biological Science, Nara Institute of Science and Technology, 8916-5 Takayama, Ikoma, Nara 630-0101, Japan Sigma factors, often in conjunction with other transcription factors, regulate gene expression in prokaryotes at the transcriptional level. Specific transcription factors tend to co-occur with specific sigma factors. To predict new members of the tran- scription factor regulon, we applied Bayes rule to combine the Bayesian probability of sigma factor prediction calculated from microarray data and the sigma factor binding sequence motif, the motif score of the transcription factor associated with the sigma factor, the empirically determined distance between the transcription start site to the cis-regulatory region, and the tendency for specific sigma factors and transcription factors to co-occur. By combining these information sources, we improve the accuracy of predicting regulation by transcription factors, and also confirm the sigma factor prediction. We applied our proposed method to all genes in Bacillus subtilis to find currently unknown gene regulations by transcription factors and sigma factors. 1. Introduction In recent years, the genomes of more than one hundred bacteria have been sequenced and the respective coding regions have been found. Inferring the regulatory mechanism of those genes remains a difficult problem. For un- derstanding the regulatory system on a genome-wide scale, gene expression data have been accumulated in microarray experiments for several organ- isms under various experimental conditions. Due to the complexity of the regulatory network and limits on the experimental accuracy, it is difficult to predict reliably which transcription factor (TF) regulates which genes. One of the promising methods to predict regulation is supervised learn- ing. However, it is powerful only if a sufficiently large training set is avail- 1
-
Upload
independent -
Category
Documents
-
view
0 -
download
0
Transcript of Bayesian Joint Prediction of Associated Transcription Factors in Bacillus subtilis

September 22, 2004 17:46 Proceedings Trim Size: 9in x 6in makita
BAYESIAN JOINT PREDICTION OF ASSOCIATEDTRANSCRIPTION FACTORS IN BACILLUS SUBTILIS
Y. MAKITA1,2, M.J.L. DE HOON1, N. OGASAWARA3, S. MIYANO1, AND
K. NAKAI1
1Human Genome Center, Institute of Medical Science, University of Tokyo4-6-1 Shirokanedai, Minato-ku, Tokyo 108-8639, Japan
2School of Technology, Nagoya University Furocho Chikusa-ku Nagoya, Aichi464-8603, Japan
3Graduate School of Biological Science, Nara Institute of Science andTechnology, 8916-5 Takayama, Ikoma, Nara 630-0101, Japan
Sigma factors, often in conjunction with other transcription factors, regulate gene
expression in prokaryotes at the transcriptional level. Specific transcription factors
tend to co-occur with specific sigma factors. To predict new members of the tran-scription factor regulon, we applied Bayes rule to combine the Bayesian probability
of sigma factor prediction calculated from microarray data and the sigma factor
binding sequence motif, the motif score of the transcription factor associated withthe sigma factor, the empirically determined distance between the transcription
start site to the cis-regulatory region, and the tendency for specific sigma factors
and transcription factors to co-occur. By combining these information sources, weimprove the accuracy of predicting regulation by transcription factors, and also
confirm the sigma factor prediction. We applied our proposed method to all genes
in Bacillus subtilis to find currently unknown gene regulations by transcriptionfactors and sigma factors.
1. Introduction
In recent years, the genomes of more than one hundred bacteria have beensequenced and the respective coding regions have been found. Inferring theregulatory mechanism of those genes remains a difficult problem. For un-derstanding the regulatory system on a genome-wide scale, gene expressiondata have been accumulated in microarray experiments for several organ-isms under various experimental conditions. Due to the complexity of theregulatory network and limits on the experimental accuracy, it is difficultto predict reliably which transcription factor (TF) regulates which genes.
One of the promising methods to predict regulation is supervised learn-ing. However, it is powerful only if a sufficiently large training set is avail-
1
September 22, 2004 17:46 Proceedings Trim Size: 9in x 6in makita
able, which is often not the case. Even in one of the best-studied bacteria,B. subtilis, only 20% of known TFs have more than 10 known bindingsequences.1 To address this problem, we consider combining other data un-der the biological context. In this paper, we focus on the joint predictionof sigma factors and associated TFs.
Sigma factors, which bind to the RNA polymerase complex, recognizespecific DNA motifs that are located -35/-10 or -24/-12 basepairs from thetranscription start site. For B. subtilis, 18 sigma factors are known. SigA isthe primary sigma factor and regulates most genes, while secondary sigmafactors activate specific groups of genes depending on cellular conditions.For example, the sigma factors SigE, SigF, SigG, SigK, and SigH are relatedto sporulation, while SigB is involved in stress response, and SigD regulatesgenes related to flagellar motion and chemotaxis. Similarly, other (non-sigma) TFs are involved in particular cellular processes. As a result, somecombinations of sigma factors and TFs are often found to jointly regulate agene, while other combinations do not occur often. As an extreme example,SigL, which belongs to the sigma54 family of enhancer-dependent sigmafactors, can only direct transcription if one of the activating TFs AcoR,BkdR, LevR, RocR, or YplP is present.
Joint prediction of sigma factors and TFs is particulary important forSigA, which regulates about 90% of the B. subtilis genes. For differentialregulation of these genes, additional TFs are therefore needed.
Previously, our group predicted which sigma factor regulates each genein B. subtilis using 174 microarray data as well as experimentally knownsigma factor binding motifs.2 TF binding sites are typically located nearthe transcription start site, which can be found from the predicted sigmafactor binding site. For example, in Escherichia coli, it is known that almostall activators have upstream binding sites near the transcription start site,whereas more than two third of repressors have at least one downstreambinding site.3
Here, we aim to predict gene regulation by TFs by combining predictedsigma factor binding sites with the biological information of joint regulationby associated TFs, as well as the distribution of TF binding sites near thesigma factor binding site. Additionally, we consider TFs with more thanone binding site for a specific gene, which can be used to improve theprediction accuracy.4,5,6
September 22, 2004 17:46 Proceedings Trim Size: 9in x 6in makita
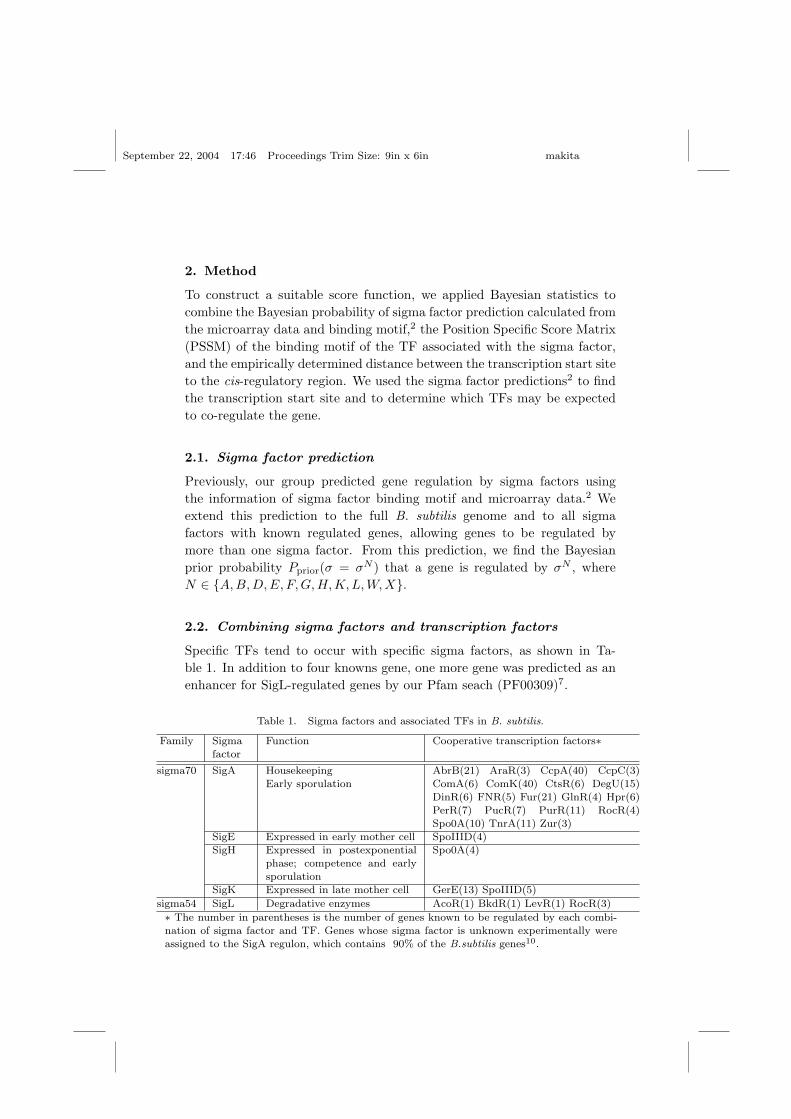
2. Method
To construct a suitable score function, we applied Bayesian statistics tocombine the Bayesian probability of sigma factor prediction calculated fromthe microarray data and binding motif,2 the Position Specific Score Matrix(PSSM) of the binding motif of the TF associated with the sigma factor,and the empirically determined distance between the transcription start siteto the cis-regulatory region. We used the sigma factor predictions2 to findthe transcription start site and to determine which TFs may be expectedto co-regulate the gene.
2.1. Sigma factor prediction
Previously, our group predicted gene regulation by sigma factors usingthe information of sigma factor binding motif and microarray data.2 Weextend this prediction to the full B. subtilis genome and to all sigmafactors with known regulated genes, allowing genes to be regulated bymore than one sigma factor. From this prediction, we find the Bayesianprior probability Pprior(σ = σN ) that a gene is regulated by σN , whereN ∈ {A,B, D,E, F,G, H,K, L, W,X}.
2.2. Combining sigma factors and transcription factors
Specific TFs tend to occur with specific sigma factors, as shown in Ta-ble 1. In addition to four knowns gene, one more gene was predicted as anenhancer for SigL-regulated genes by our Pfam seach (PF00309)7.
Table 1. Sigma factors and associated TFs in B. subtilis.
Family Sigmafactor
Function Cooperative transcription factors∗
sigma70 SigA Housekeeping
Early sporulation
AbrB(21) AraR(3) CcpA(40) CcpC(3)
ComA(6) ComK(40) CtsR(6) DegU(15)DinR(6) FNR(5) Fur(21) GlnR(4) Hpr(6)
PerR(7) PucR(7) PurR(11) RocR(4)
Spo0A(10) TnrA(11) Zur(3)SigE Expressed in early mother cell SpoIIID(4)
SigH Expressed in postexponentialphase; competence and early
sporulation
Spo0A(4)
SigK Expressed in late mother cell GerE(13) SpoIIID(5)
sigma54 SigL Degradative enzymes AcoR(1) BkdR(1) LevR(1) RocR(3)
∗ The number in parentheses is the number of genes known to be regulated by each combi-
nation of sigma factor and TF. Genes whose sigma factor is unknown experimentally wereassigned to the SigA regulon, which contains 90% of the B.subtilis genes10.
September 22, 2004 17:46 Proceedings Trim Size: 9in x 6in makita
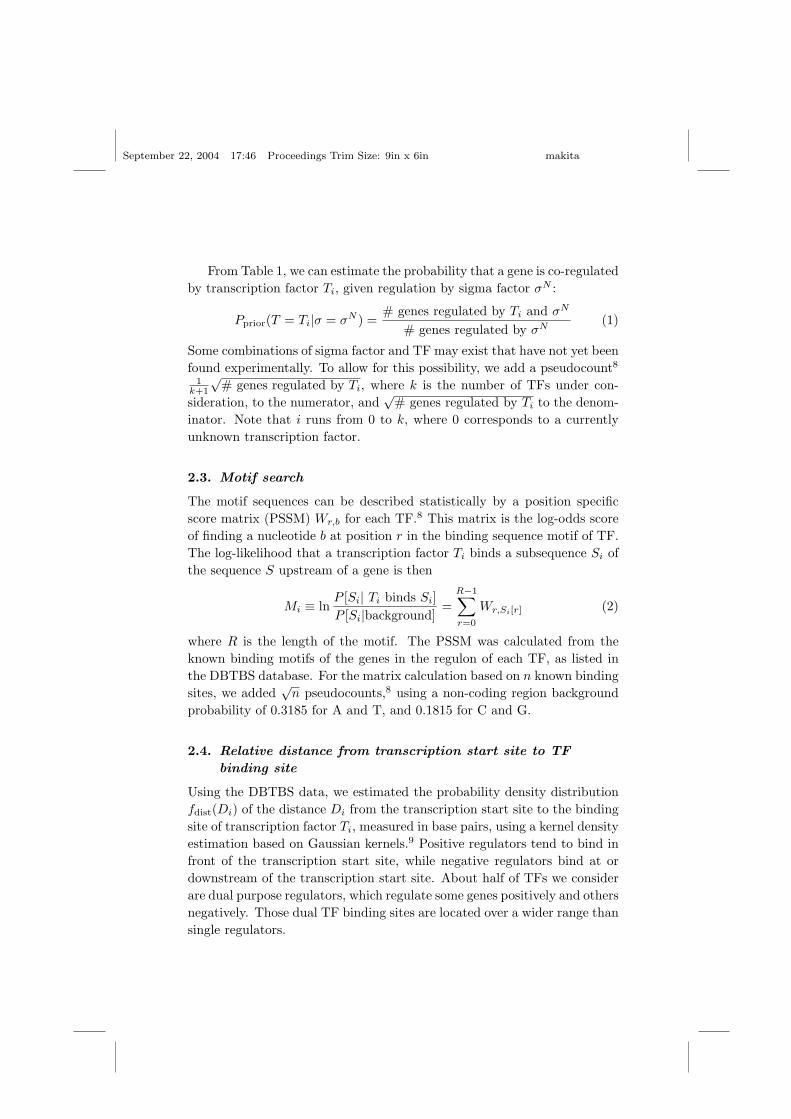
From Table 1, we can estimate the probability that a gene is co-regulatedby transcription factor Ti, given regulation by sigma factor σN :
Pprior(T = Ti|σ = σN ) =# genes regulated by Ti and σN
# genes regulated by σN(1)
Some combinations of sigma factor and TF may exist that have not yet beenfound experimentally. To allow for this possibility, we add a pseudocount8
1k+1
√# genes regulated by Ti, where k is the number of TFs under con-
sideration, to the numerator, and√
# genes regulated by Ti to the denom-inator. Note that i runs from 0 to k, where 0 corresponds to a currentlyunknown transcription factor.
2.3. Motif search
The motif sequences can be described statistically by a position specificscore matrix (PSSM) Wr,b for each TF.8 This matrix is the log-odds scoreof finding a nucleotide b at position r in the binding sequence motif of TF.The log-likelihood that a transcription factor Ti binds a subsequence Si ofthe sequence S upstream of a gene is then
Mi ≡ lnP [Si| Ti binds Si]P [Si|background]
=R−1∑r=0
Wr,Si[r] (2)
where R is the length of the motif. The PSSM was calculated from theknown binding motifs of the genes in the regulon of each TF, as listed inthe DBTBS database. For the matrix calculation based on n known bindingsites, we added
√n pseudocounts,8 using a non-coding region background
probability of 0.3185 for A and T, and 0.1815 for C and G.
2.4. Relative distance from transcription start site to TF
binding site
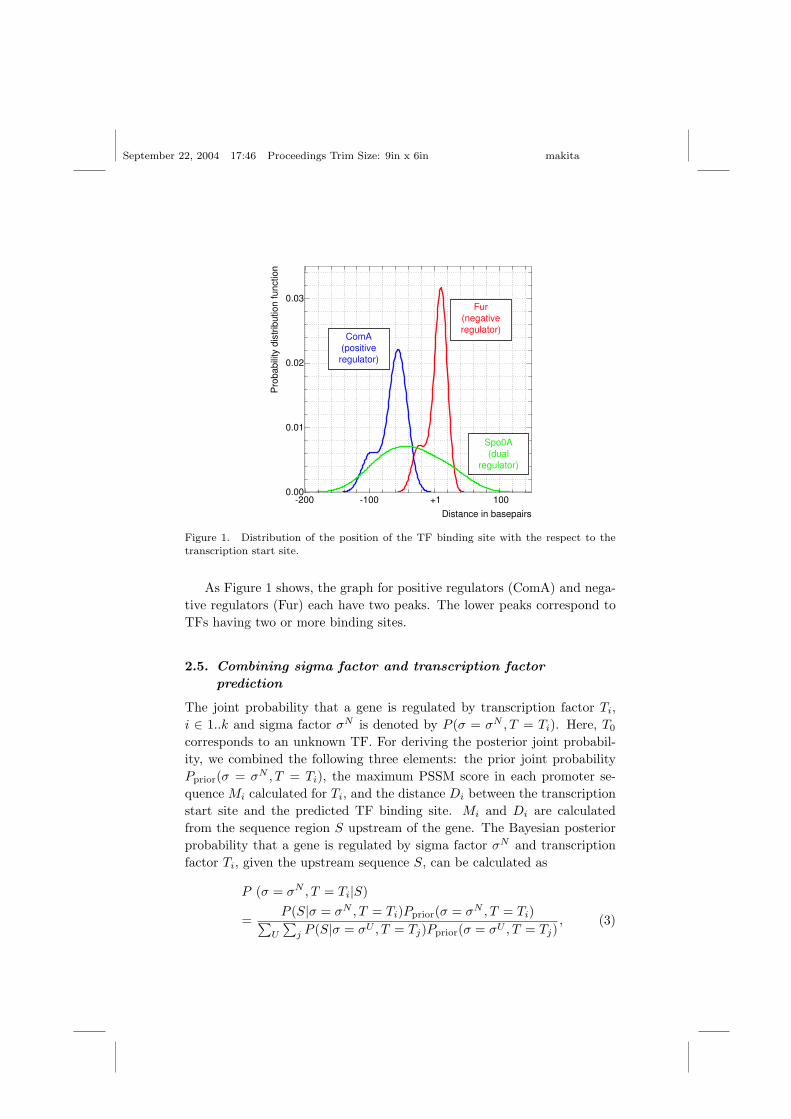
Using the DBTBS data, we estimated the probability density distributionfdist(Di) of the distance Di from the transcription start site to the bindingsite of transcription factor Ti, measured in base pairs, using a kernel densityestimation based on Gaussian kernels.9 Positive regulators tend to bind infront of the transcription start site, while negative regulators bind at ordownstream of the transcription start site. About half of TFs we considerare dual purpose regulators, which regulate some genes positively and othersnegatively. Those dual TF binding sites are located over a wider range thansingle regulators.
September 22, 2004 17:46 Proceedings Trim Size: 9in x 6in makita
-200 -100 1000.00
0.01
0.02
0.03
+1
Fur (negative regulator)
Spo0A (dual
regulator)
Distance in basepairs
Pro
babi
lity
dist
ribut
ion
func
tion
ComA (positive regulator)
Figure 1. Distribution of the position of the TF binding site with the respect to the
transcription start site.
As Figure 1 shows, the graph for positive regulators (ComA) and nega-tive regulators (Fur) each have two peaks. The lower peaks correspond toTFs having two or more binding sites.
2.5. Combining sigma factor and transcription factor
prediction
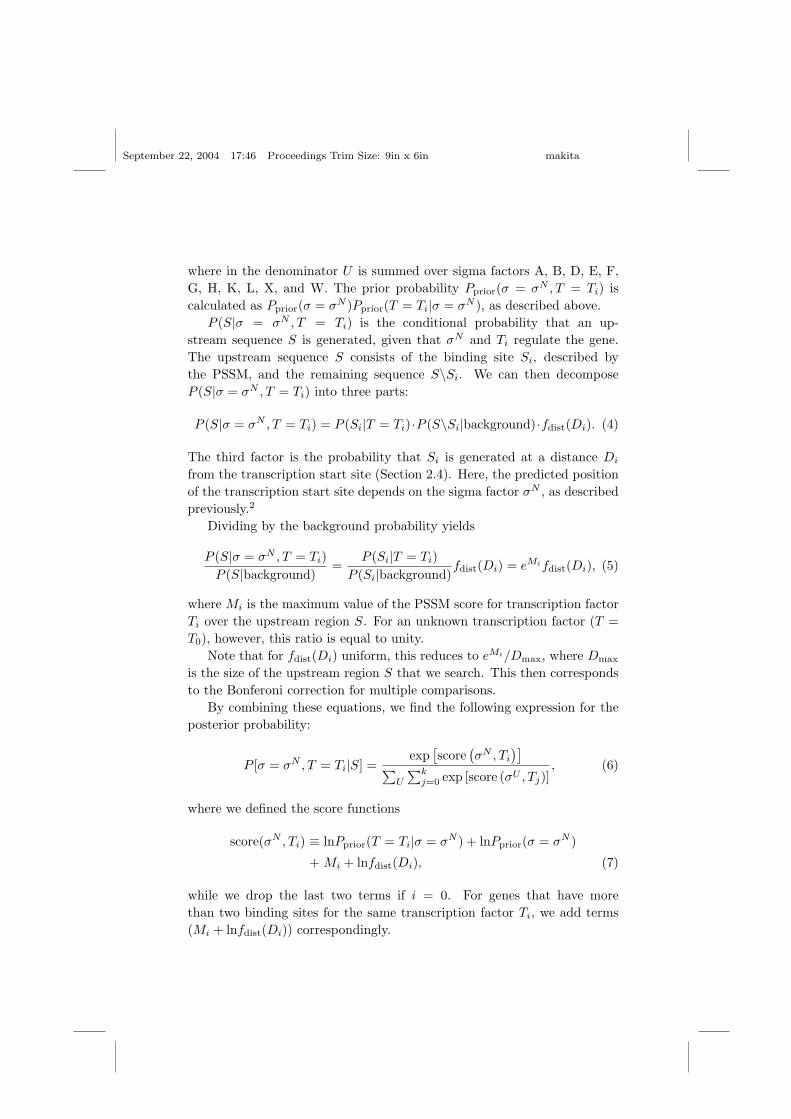
The joint probability that a gene is regulated by transcription factor Ti,i ∈ 1..k and sigma factor σN is denoted by P (σ = σN , T = Ti). Here, T0
corresponds to an unknown TF. For deriving the posterior joint probabil-ity, we combined the following three elements: the prior joint probabilityPprior(σ = σN , T = Ti), the maximum PSSM score in each promoter se-quence Mi calculated for Ti, and the distance Di between the transcriptionstart site and the predicted TF binding site. Mi and Di are calculatedfrom the sequence region S upstream of the gene. The Bayesian posteriorprobability that a gene is regulated by sigma factor σN and transcriptionfactor Ti, given the upstream sequence S, can be calculated as
P (σ = σN , T = Ti|S)
=P (S|σ = σN , T = Ti)Pprior(σ = σN , T = Ti)∑
U
∑j P (S|σ = σU , T = Tj)Pprior(σ = σU , T = Tj)
, (3)
September 22, 2004 17:46 Proceedings Trim Size: 9in x 6in makita
where in the denominator U is summed over sigma factors A, B, D, E, F,G, H, K, L, X, and W. The prior probability Pprior(σ = σN , T = Ti) iscalculated as Pprior(σ = σN )Pprior(T = Ti|σ = σN ), as described above.
P (S|σ = σN , T = Ti) is the conditional probability that an up-stream sequence S is generated, given that σN and Ti regulate the gene.The upstream sequence S consists of the binding site Si, described bythe PSSM, and the remaining sequence S\Si. We can then decomposeP (S|σ = σN , T = Ti) into three parts:
P (S|σ = σN , T = Ti) = P (Si|T = Ti)·P (S\Si|background)·fdist(Di). (4)
The third factor is the probability that Si is generated at a distance Di
from the transcription start site (Section 2.4). Here, the predicted positionof the transcription start site depends on the sigma factor σN , as describedpreviously.2
Dividing by the background probability yields
P (S|σ = σN , T = Ti)P (S|background)
=P (Si|T = Ti)
P (Si|background)fdist(Di) = eMifdist(Di), (5)
where Mi is the maximum value of the PSSM score for transcription factorTi over the upstream region S. For an unknown transcription factor (T =T0), however, this ratio is equal to unity.
Note that for fdist(Di) uniform, this reduces to eMi/Dmax, where Dmax
is the size of the upstream region S that we search. This then correspondsto the Bonferoni correction for multiple comparisons.
By combining these equations, we find the following expression for theposterior probability:
P [σ = σN , T = Ti|S] =exp
[score
(σN , Ti
)]∑
U
∑kj=0 exp [score (σU , Tj)]
, (6)
where we defined the score functions
score(σN , Ti) ≡ lnPprior(T = Ti|σ = σN ) + lnPprior(σ = σN )
+ Mi + lnfdist(Di), (7)
while we drop the last two terms if i = 0. For genes that have morethan two binding sites for the same transcription factor Ti, we add terms(Mi + lnfdist(Di)) correspondingly.

September 22, 2004 17:46 Proceedings Trim Size: 9in x 6in makita
2.6. Example calculation
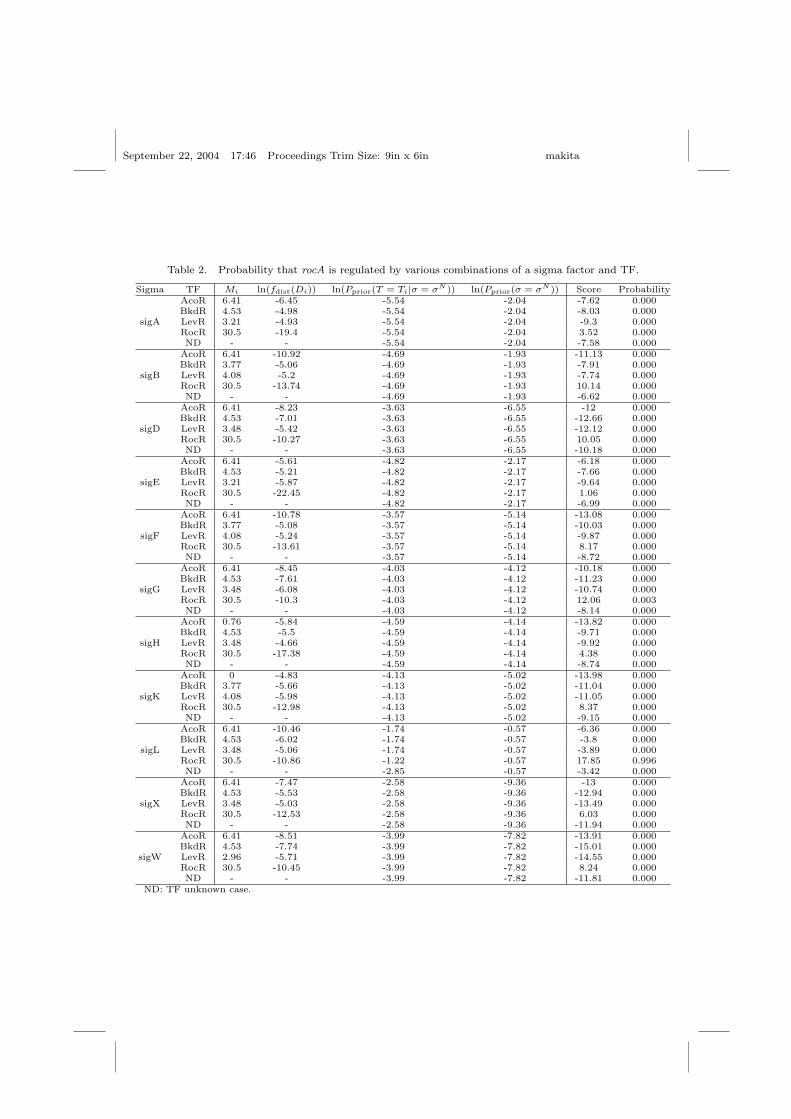
We calculated the Bayesian posterior probability in Eq. (6) that the generocA is regulated by each sigma factor and by one of the TFs AcoR, BkdR,LevR, RocR, or on unknown TF. Table 2 shows that the (SigL, RocR)combination is by far the most likely. From biological experiments, rocA isknown to be regulated by SigL and RocR, which serves as the transcrip-tional activator of arginine utilization operons.
3. Validation
3.1. The sigma factor prediction aids in the TF prediction
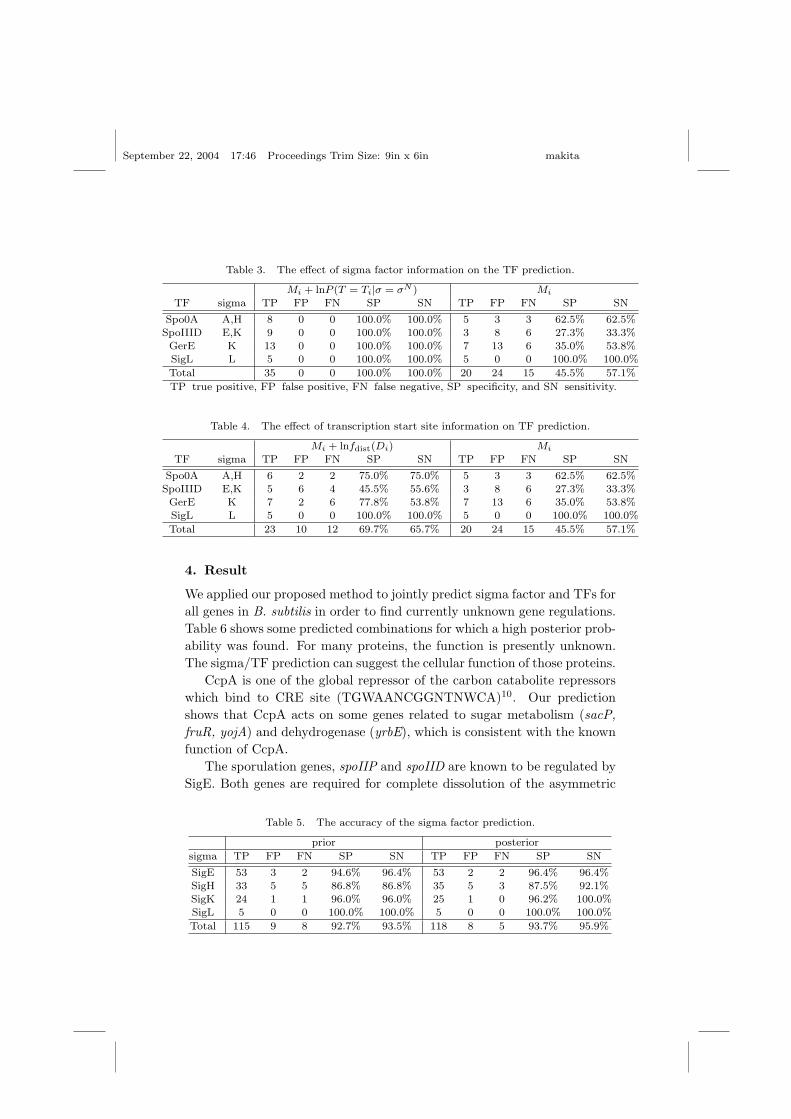
To verify the validity of combining the TF prediction with the sigma factorprediction, we examined the contribution of each term in Eq. (7). To assessthe effect of using the sigma factor prediction for the TF prediction, wecompare the two scores Mi + lnP (T = Ti|σ = σN ) and Mi (Table 3).
The negative dataset consists of genes regulated by sigma factors whoseregulons do not contain any genes that are known to be regulated by theTF. The positive dataset are the genes known to be regulated by the TF.The specificity is given by TP/(TP + FP ) and the sensitivity is given byTP/(TP + FN), where TP is true positive, FP is false positive, and FN isfalse negative.
Furthermore, the predicted sigma factor binding site Pprior(σ = σN )in Eq. (7) allows us to search for the TF motif nearby on the genome,as represented by the term in fdist(Di) in Eq. (7). We show the effect ofincluding this term in Table 4.
As shown in these tables, both the sigma factor information and thetranscription start sites greatly improve the specificity and the sensitivityof the TF prediction. The biological knowledge that specific sigma factorsand TFs tend to co-occur is particularly informative, as shown in Table 3.
3.2. The TF prediction aids in the sigma factor prediction
We calculate the posterior probability that a gene is regulated by a specificsigma factor by summing Eq. (6) over Ti. As shown in Table 5, this posteriorprobability is more accurate than the prior probability in predicting sigmafactors. While the prior probability already gives a very accurate predictionof sigma factor regulation, the accuracy of the posterior probability is evenhigher. We note that for unknown genes, the sigma factor prediction maybe less accurate due to uncertainties in the operon structure.2,11
September 22, 2004 17:46 Proceedings Trim Size: 9in x 6in makita
Table 2. Probability that rocA is regulated by various combinations of a sigma factor and TF.
Sigma TF Mi ln(fdist(Di)) ln(Pprior(T = Ti|σ = σN )) ln(Pprior(σ = σN )) Score ProbabilityAcoR 6.41 -6.45 -5.54 -2.04 -7.62 0.000BkdR 4.53 -4.98 -5.54 -2.04 -8.03 0.000
sigA LevR 3.21 -4.93 -5.54 -2.04 -9.3 0.000RocR 30.5 -19.4 -5.54 -2.04 3.52 0.000ND - - -5.54 -2.04 -7.58 0.000
AcoR 6.41 -10.92 -4.69 -1.93 -11.13 0.000BkdR 3.77 -5.06 -4.69 -1.93 -7.91 0.000
sigB LevR 4.08 -5.2 -4.69 -1.93 -7.74 0.000RocR 30.5 -13.74 -4.69 -1.93 10.14 0.000ND - - -4.69 -1.93 -6.62 0.000
AcoR 6.41 -8.23 -3.63 -6.55 -12 0.000BkdR 4.53 -7.01 -3.63 -6.55 -12.66 0.000
sigD LevR 3.48 -5.42 -3.63 -6.55 -12.12 0.000RocR 30.5 -10.27 -3.63 -6.55 10.05 0.000ND - - -3.63 -6.55 -10.18 0.000
AcoR 6.41 -5.61 -4.82 -2.17 -6.18 0.000BkdR 4.53 -5.21 -4.82 -2.17 -7.66 0.000
sigE LevR 3.21 -5.87 -4.82 -2.17 -9.64 0.000RocR 30.5 -22.45 -4.82 -2.17 1.06 0.000ND - - -4.82 -2.17 -6.99 0.000
AcoR 6.41 -10.78 -3.57 -5.14 -13.08 0.000BkdR 3.77 -5.08 -3.57 -5.14 -10.03 0.000
sigF LevR 4.08 -5.24 -3.57 -5.14 -9.87 0.000RocR 30.5 -13.61 -3.57 -5.14 8.17 0.000ND - - -3.57 -5.14 -8.72 0.000
AcoR 6.41 -8.45 -4.03 -4.12 -10.18 0.000BkdR 4.53 -7.61 -4.03 -4.12 -11.23 0.000
sigG LevR 3.48 -6.08 -4.03 -4.12 -10.74 0.000RocR 30.5 -10.3 -4.03 -4.12 12.06 0.003ND - - -4.03 -4.12 -8.14 0.000
AcoR 0.76 -5.84 -4.59 -4.14 -13.82 0.000BkdR 4.53 -5.5 -4.59 -4.14 -9.71 0.000
sigH LevR 3.48 -4.66 -4.59 -4.14 -9.92 0.000RocR 30.5 -17.38 -4.59 -4.14 4.38 0.000ND - - -4.59 -4.14 -8.74 0.000
AcoR 0 -4.83 -4.13 -5.02 -13.98 0.000BkdR 3.77 -5.66 -4.13 -5.02 -11.04 0.000
sigK LevR 4.08 -5.98 -4.13 -5.02 -11.05 0.000RocR 30.5 -12.98 -4.13 -5.02 8.37 0.000ND - - -4.13 -5.02 -9.15 0.000
AcoR 6.41 -10.46 -1.74 -0.57 -6.36 0.000BkdR 4.53 -6.02 -1.74 -0.57 -3.8 0.000
sigL LevR 3.48 -5.06 -1.74 -0.57 -3.89 0.000RocR 30.5 -10.86 -1.22 -0.57 17.85 0.996ND - - -2.85 -0.57 -3.42 0.000
AcoR 6.41 -7.47 -2.58 -9.36 -13 0.000BkdR 4.53 -5.53 -2.58 -9.36 -12.94 0.000
sigX LevR 3.48 -5.03 -2.58 -9.36 -13.49 0.000RocR 30.5 -12.53 -2.58 -9.36 6.03 0.000ND - - -2.58 -9.36 -11.94 0.000
AcoR 6.41 -8.51 -3.99 -7.82 -13.91 0.000BkdR 4.53 -7.74 -3.99 -7.82 -15.01 0.000
sigW LevR 2.96 -5.71 -3.99 -7.82 -14.55 0.000RocR 30.5 -10.45 -3.99 -7.82 8.24 0.000ND - - -3.99 -7.82 -11.81 0.000
ND: TF unknown case.
September 22, 2004 17:46 Proceedings Trim Size: 9in x 6in makita
Table 3. The effect of sigma factor information on the TF prediction.
Mi + lnP (T = Ti|σ = σN ) Mi
TF sigma TP FP FN SP SN TP FP FN SP SN
Spo0A A,H 8 0 0 100.0% 100.0% 5 3 3 62.5% 62.5%
SpoIIID E,K 9 0 0 100.0% 100.0% 3 8 6 27.3% 33.3%GerE K 13 0 0 100.0% 100.0% 7 13 6 35.0% 53.8%
SigL L 5 0 0 100.0% 100.0% 5 0 0 100.0% 100.0%
Total 35 0 0 100.0% 100.0% 20 24 15 45.5% 57.1%
TP true positive, FP false positive, FN false negative, SP specificity, and SN sensitivity.
Table 4. The effect of transcription start site information on TF prediction.
Mi + lnfdist(Di) Mi
TF sigma TP FP FN SP SN TP FP FN SP SN
Spo0A A,H 6 2 2 75.0% 75.0% 5 3 3 62.5% 62.5%
SpoIIID E,K 5 6 4 45.5% 55.6% 3 8 6 27.3% 33.3%
GerE K 7 2 6 77.8% 53.8% 7 13 6 35.0% 53.8%SigL L 5 0 0 100.0% 100.0% 5 0 0 100.0% 100.0%
Total 23 10 12 69.7% 65.7% 20 24 15 45.5% 57.1%
4. Result
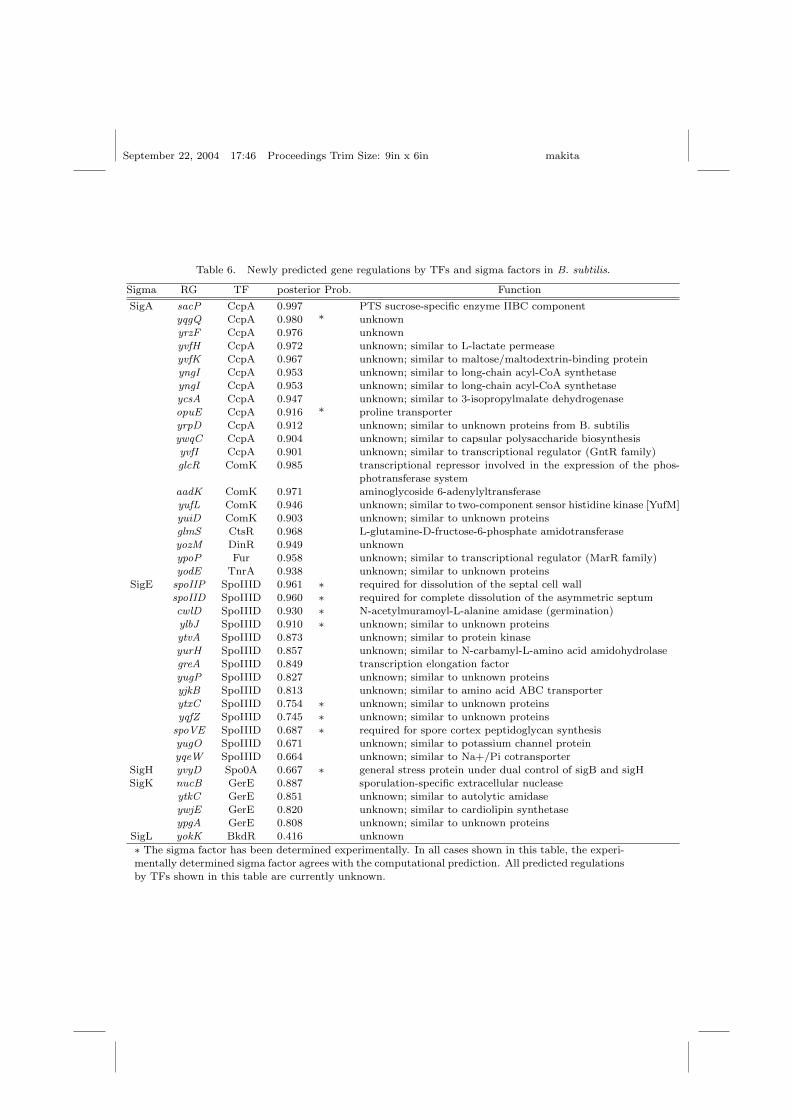
We applied our proposed method to jointly predict sigma factor and TFs forall genes in B. subtilis in order to find currently unknown gene regulations.Table 6 shows some predicted combinations for which a high posterior prob-ability was found. For many proteins, the function is presently unknown.The sigma/TF prediction can suggest the cellular function of those proteins.
CcpA is one of the global repressor of the carbon catabolite repressorswhich bind to CRE site (TGWAANCGGNTNWCA)10. Our predictionshows that CcpA acts on some genes related to sugar metabolism (sacP,fruR, yojA) and dehydrogenase (yrbE), which is consistent with the knownfunction of CcpA.
The sporulation genes, spoIIP and spoIID are known to be regulated bySigE. Both genes are required for complete dissolution of the asymmetric
Table 5. The accuracy of the sigma factor prediction.
prior posterior
sigma TP FP FN SP SN TP FP FN SP SN
SigE 53 3 2 94.6% 96.4% 53 2 2 96.4% 96.4%
SigH 33 5 5 86.8% 86.8% 35 5 3 87.5% 92.1%
SigK 24 1 1 96.0% 96.0% 25 1 0 96.2% 100.0%SigL 5 0 0 100.0% 100.0% 5 0 0 100.0% 100.0%
Total 115 9 8 92.7% 93.5% 118 8 5 93.7% 95.9%
September 22, 2004 17:46 Proceedings Trim Size: 9in x 6in makita
Table 6. Newly predicted gene regulations by TFs and sigma factors in B. subtilis.
Sigma RG TF posterior Prob. Function
SigA sacP CcpA 0.997 PTS sucrose-specific enzyme IIBC component
yqgQ CcpA 0.980 * unknown
yrzF CcpA 0.976 unknownyvfH CcpA 0.972 unknown; similar to L-lactate permease
yvfK CcpA 0.967 unknown; similar to maltose/maltodextrin-binding protein
yngI CcpA 0.953 unknown; similar to long-chain acyl-CoA synthetaseyngI CcpA 0.953 unknown; similar to long-chain acyl-CoA synthetase
ycsA CcpA 0.947 unknown; similar to 3-isopropylmalate dehydrogenase
opuE CcpA 0.916 * proline transporteryrpD CcpA 0.912 unknown; similar to unknown proteins from B. subtilis
ywqC CcpA 0.904 unknown; similar to capsular polysaccharide biosynthesis
yvfI CcpA 0.901 unknown; similar to transcriptional regulator (GntR family)glcR ComK 0.985 transcriptional repressor involved in the expression of the phos-
photransferase system
aadK ComK 0.971 aminoglycoside 6-adenylyltransferaseyufL ComK 0.946 unknown; similar to two-component sensor histidine kinase [YufM]
yuiD ComK 0.903 unknown; similar to unknown proteinsglmS CtsR 0.968 L-glutamine-D-fructose-6-phosphate amidotransferase
yozM DinR 0.949 unknown
ypoP Fur 0.958 unknown; similar to transcriptional regulator (MarR family)yodE TnrA 0.938 unknown; similar to unknown proteins
SigE spoIIP SpoIIID 0.961 ∗ required for dissolution of the septal cell wall
spoIID SpoIIID 0.960 ∗ required for complete dissolution of the asymmetric septumcwlD SpoIIID 0.930 ∗ N-acetylmuramoyl-L-alanine amidase (germination)
ylbJ SpoIIID 0.910 ∗ unknown; similar to unknown proteins
ytvA SpoIIID 0.873 unknown; similar to protein kinaseyurH SpoIIID 0.857 unknown; similar to N-carbamyl-L-amino acid amidohydrolase
greA SpoIIID 0.849 transcription elongation factor
yugP SpoIIID 0.827 unknown; similar to unknown proteinsyjkB SpoIIID 0.813 unknown; similar to amino acid ABC transporter
ytxC SpoIIID 0.754 ∗ unknown; similar to unknown proteinsyqfZ SpoIIID 0.745 ∗ unknown; similar to unknown proteins
spoVE SpoIIID 0.687 ∗ required for spore cortex peptidoglycan synthesis
yugO SpoIIID 0.671 unknown; similar to potassium channel proteinyqeW SpoIIID 0.664 unknown; similar to Na+/Pi cotransporter
SigH yvyD Spo0A 0.667 ∗ general stress protein under dual control of sigB and sigHSigK nucB GerE 0.887 sporulation-specific extracellular nuclease
ytkC GerE 0.851 unknown; similar to autolytic amidase
ywjE GerE 0.820 unknown; similar to cardiolipin synthetase
ypgA GerE 0.808 unknown; similar to unknown proteinsSigL yokK BkdR 0.416 unknown
∗ The sigma factor has been determined experimentally. In all cases shown in this table, the experi-
mentally determined sigma factor agrees with the computational prediction. All predicted regulations
by TFs shown in this table are currently unknown.
September 22, 2004 17:46 Proceedings Trim Size: 9in x 6in makita
septum cell wall. We found the SpoIIID binding motif at +18 and +3 forspoIIP and at +24 for spoIID. From the location of the binding site, we inferthat those genes might be negatively regulated. For the SigE-dependentasparagine synthetase gene yisO, we found three SpoIIID binding sites inthe promoter region.
GerE is a transcriptional regulator required for the expression of latespore coat genes. It is predicted to regulate membrane phospholipid cardi-olipin (ywjE) and permease (yecA). Since in addition it is known that GerEregulates N-acetylmuramoyl-L-alanine amidase, we expect the predictionfor ytkC, which is similar to autolytic amidase, to be correct.
In E.coli, 17 operons are known to be regulated by SigL12. In B. subtilis,only six operons are known to be regulated by SigL. Whereas we may expectcurrently unknown SigL-regulated genes to exist in B. subtilis, our resultsuggests that there are few additional SigL regulated genes in the B. subtilisgenome.
5. Discussion
Our result shows that the joint prediction of TFs is a powerful way bothto confirm the sigma prediction and to predict new members of the TFregulon. As the joint prediction of sigma factors and TFs is a supervisedlearning method, it can make better use of known biological facts thanunsupervised methods. This method can also detect genes regulated bytwo or more different sigma factors. For example, spoIVCB is initiallytranscribed under the direction of SigE acting in conjunction with SpoIIID.Later in sporulation, SigK-mediated transcription of spoIVCB is repressedby GerE. In our method, we can calculate the probability that spoIVCB isregulated by SigK with GerE and by SigE with SpoIIID separately. Thismethod can also be applied to other organisms such as E.coli, cyanobacteriaand yeast, for which some regulatory relations are known.
Acknowledgments
We thank Seiya Imoto for his kind advice on the statistical analysis. Thisresearch was supported by Grant-in-Aid for Scientific Research on PriorityAreas and JSPS Fellow ship of the Ministry of Education, Science, Sportsand Culture.
September 22, 2004 17:46 Proceedings Trim Size: 9in x 6in makita
References
1. Y. Makita, M. Nakao, N. Ogasawara, and K. Nakai. DBTBS: Database oftranscriptional regulation in Bacillus subtilis and its contribution to com-parative genomics. Nucleic Acids Res., 1:32 Database issue:D75-7, 2004.http://dbtbs.hgc.jp.
2. M.J.L. de Hoon, Y. Makita, S. Imoto, K. Kobayashi, N. Ogasawara, K. Nakaiand S. Miyano, Predicting gene regulation by sigma factors in Bacillus subtilisfrom genome-wide data. Bioinformatics, 20 Suppl 1:I102-I108, 2004.
3. M.M. Babu and S.A. Teichmann, Functional determinants of transcriptionfactors in Escherichia coli: protein families and binding sites. TRENDS inGenetics, 19(2):75-79, 2003.
4. M.L. Bulyk, A.M. McGuire, N. Masuda, and G.M. Church. A motifco-occurrence approach for genome-wide prediction of transcription-factor-binding sites in Escherichia coli. Genome Res., 14(2):201-8, 2004
5. S. Sinha, M. Tompa. Discovery of novel transcription factor binding sites bystatistical overrepresentation. Nucleic Acids Res. 30(24):5549-60, 2002.
6. E. Segal and S. Sharan. A Discriminative Model for Identifying Sparial cis-Regulatory Modules. In Proc. 8th Inter. Conf. on Research in ComputationalMolecular Biology (RECOMB), 2004.
7. A. Bateman, L. Coin, R. Durbin, R.D. Finn, V. Hollich, S. Griffiths-Jones,A. Khanna, M. Marshall, S. Moxon, E.L.L. Sonnhammer, D.J. Stud holme,C. Yeats, and S.R. Eddy. The Pfam Protein Families Database. Nucleic AcidsRes., 1:32 Database Issue:D138-141 2004.
8. R. Durbin, S. Eddy, A. Krogh, G. Mitchison. Biological Sequence Analysis:Probabilistic Models of Proteins and Nucleic Acids, Cambridge UniversityPress, Cambridge, UK. 1998.
9. B.W. Silverman. Density Estimation for Statistics and Data Analysis. Chap-man and Hill, London, 1986.
10. A.L. Sonenshein, J.A. Hoch, and R. Losick. Bacillus subtilis and its closestrelatives: From genes to cells. ASM Press, Washington, DC, 2001.
11. M.J.L. de Hoon, S. Imoto, K. Kobayashi, N. Ogasawara, and S. Miyano. Pre-dicting the operon structure of Bacillus subtilis using operon length, intergenedistance, and gene expression information. PSB 2004:276-87.
12. L. Reitzer and B.L. Schneider. Metabolic context and possible physiologicalthemes of sigma(54)-dependent genes in Escherichia coli. Microbiol Mol BiolRev., 65(3):422-44, 2001.