Energetics of protein thermodynamic cooperativity: contributions of local and nonlocal interactions
31
arXiv:cond-mat/0307006v1 [cond-mat.stat-mech] 30 Jun 2003 ∗ α *
Transcript of Energetics of protein thermodynamic cooperativity: contributions of local and nonlocal interactions

arX
iv:c
ond-
mat
/030
7006
v1 [
cond
-mat
.sta
t-m
ech]
30
Jun
2003 Energeti s of Protein Thermodynami Cooperativity: Contributions of Lo aland Nonlo al Intera tionsMi hael Knott, Hüseyin Kaya and Hue Sun Chan∗Protein Engineering Network of Centres of Ex ellen e (PENCE),Department of Bio hemistry, andDepartment of Medi al Geneti s & Mi robiology,Fa ulty of Medi ine, University of Toronto,Toronto, Ontario M5S 1A8, Canada2nd February 2008Keywords: alorimetry / Go models / two-state ooperativity/single-domain proteins / radius of gyrationAbstra tThe respe tive roles of lo al and nonlo al intera tions in the thermody-nami ooperativity of proteins are investigated using ontinuum (o�-latti e)native- entri Go-like models with a oarse-grained Cα hain representation.We study a series of models in whi h the (lo al) bond- and torsion-angleterms have di�erent strengths relative to the (nonlo al) pairwise onta t en-ergy terms. Conformational distributions in these models are sampled byLangevin dynami s. Thermodynami ooperativity is hara terized by theexperimental riteria requiring the van't Ho� to alorimetri enthalpy ratio
∗E-mail: han�arrhenius.med.toronto.edu; Tel: +1 416 978 2697; Fax:+1 416 978 8548; Mailing address: Department of Bio hemistry, University of Toronto,Medi al S ien es Building, 1 King's College Cir le, Toronto, Ontario M5S 1A8, Canada.1

∆HvH/∆Hcal ≈ 1 (the alorimetri riterion), as well as a two-state-like vari-ation of the average radius of gyration upon denaturation. We �nd that bothlo al and nonlo al intera tions are riti al for thermodynami ooperativity.Chain models with either mu h weakened lo al onformational propensitiesor mu h weakened favorable nonlo al intera tions are signi� antly less oop-erative than hain models with both strong lo al propensities and strong fa-vorable nonlo al intera tions. These �ndings are ompared with results froma re ently proposed latti e model with a lo al-nonlo al oupling me hanism;their relationship with experimental measurements of protein ooperativityand hain ompa tness is dis ussed.
2

1 Introdu tionHow a globular protein an fold reliably into a parti ular three dimensional onformation in vitro, without the parti ipation of mole ular haperones, isa entral puzzle in biophysi s. If we wish not only to predi t the folded stateof a protein, but also to understand the folding phenomenon in terms ofphysi al pro esses, we need to use physi s-based methods: we run omputersimulations of self- ontained polymer models [1℄ that attempt to mimi thebehavior of real protein mole ules. A omplete quantum me hani al simula-tion, whi h would in lude the solvent mole ules in addition to all the atomsin the protein mole ule, is not yet possible. But in attempting to design sim-pli�ed models, we fa e the problem of how to simplify: whi h hara teristi sare essential and whi h an be negle ted? What e�e tive energy fun tionsdoes this imply for the simpli�ed system?Part of this general question is addressed in this arti le. Folding experi-ments on small globular proteins have long shown eviden e of thermodynami and kineti ooperativity [2, 3℄, whi h indi ates a phenomenon similar to a�rst order phase transition between native and denatured states. As ourgroup has argued re ently [4, 5, 6, 7, 8℄, this observation an be exploited to onstrain the set of possible simpli�ed models and intera tion s hemes: fora parti ular simpli�ed model to be a quantitatively a urate representationof protein thermodynami s and kineti s, it is essential that, when appropri-ately applied to a small globular protein, it an produ e the experimentallyobserved generi ooperative behavior.Su h onstraints turn out to be rather stringent. It is nontrivial to on-stru t model intera tion s hemes that an produ e proteinlike ooperativi-ties [4,5,6,7,8℄. A ase in point is a lass of ommon Go-like [9℄ models [8,10℄.Their potential fun tions are native- entri , in that they are expli itly biasedto favor a given native stru ture. Go-like modeling of proteins has providedimportant physi al insights [10,11,12,13℄. These in lude an in reasing num-ber of elegant elu idations of fun tional protein dynami s under native on-ditions [14, 15, 16, 17, 18℄. As for global folding and unfolding of proteins (in ontrast to their near-native dynami s), a detailed dis ussion of the meritsand limitations of Go-like approa hes an be found in Ref. [8℄. Notably, ommon Go-like models do not appear apable of produ ing simple two-state folding/unfolding kineti s. Instead, their hevron plots exhibit severerollovers, whi h are typi al of the lass of folding kineti s that is ustomarilyreferred to as non-two-state [8, 19℄. Nonetheless, ommon three-dimensional3

Go-like protein models seem su� ient to produ e apparent two-state ther-modynami behavior [5, 8℄, although their two-dimensional ounterparts failto do so [4℄.In the present investigation, we limit our s ope to thermodynami oop-erativity. Spe i� ally, we aim to explore how protein thermodynami two-state-like behavior is a�e ted by the relative strengths of lo al intera tions(between residues lose together along the hain sequen e) and nonlo al inter-a tions (between residues far apart along the hain sequen e). The respe tiveroles of lo al and nonlo al intera tions are an issue of long standing interestin the study of protein energeti s [20,21,22,23,24,25℄, and the e�e t of anal-ogous intera tions on the phase diagram of latti e polymers has also beeninvestigated [26, 27, 28, 29℄. Here the issue is addressed by varying the po-tential fun tion in a series of oarse-grained Go-like models, whi h representthe protein as a string of Cα positions in ontinuum spa e and whi h aresimulated using Langevin dynami s. In view of the limitations of ommonGo models [8℄, the present study should be viewed as a �rst step in ta klingthe issue of lo al vs. nonlo al intera tions in ooperative ontinuum proteinmodels. To assess the robustness of our on lusions, results from the on-tinuum Langevin models are also ompared with results from latti e modelsimulations.We begin in se tion 2 by providing details of the models. An outline ofthe thermodynami s involved in interpreting the simulations is given in se -tion 3. Our �ndings are presented in se tion 4, and we on lude in se tion 5with a dis ussion of the impli ations of our results.2 Models and simulation details2.1 Continuum modelsFor the present ontinuumGo-like models we use a representation, introdu edby Clementi et al. [10℄, of the 64-residue trun ated form of hymotrypsininhibitor 2 (CI2). The native onta t set orresponds to NCS2 in Ref. [8℄.We use an energy fun tion that is similar to one used previously [8,10,30℄.The potential energy fun tion V , from whi h the onformational for e isderived, is given byV = Vstretching + Vbending + Vtorsion + Vnative + Vnonnative, (1)4

whereVstretching =
N−1∑
i=1
kl
(
li − li0)2 (2) ontains a summation over the virtual bonds between pairs of residues,
Vbending =N−2∑
i=1
εθ(θi − θi
0)2 (3)involves a summation over the virtual bond angles between triplets of residues,and
Vtorsion =N−3∑
i=1
{
ε(1)φ
[
1 − cos(
φi − φi0
)]
+ ε(3)φ
[
1 − cos 3(
φi − φi0
)]} (4)represents the virtual torsional potential between quadruplets of residues.The latter ontains a term with a single minimum as well as the traditionalthree-minimum term [31℄. [We note that there is an apparent typographi alerror in the orresponding Vtorsion in [10℄, whi h e�e tively lists these termsas 1 + cos (φi − φi0) and 1 + cos 3 (φi − φi
0). But su h terms would fold the hain into the mirror image of the PDB stru ture.℄ Vstretching, Vbending andVtorsion together a ount for the lo al intera tions (between residues that areseparated by no more than three pla es along the hain), whi h in lude lo al onformational propensities for the native stru ture. The lo al intera tionsare expressed in this way be ause it biases the lo al geometry of the hain.The fourth term,
Vnative =∑
|i−j|≥4
εnative
5
(
rij0
rij
)12
− 6
(
rij0
rij
)10
, (5)sums over the pairwise intera tions between residues that are regarded asbeing in onta t in the native stru ture; this a ounts for the nonlo al in-tera tions (between residues that are separated by four or more pla es alongthe hain). Finally,Vnonnative =
∑
|i−j|≥q
ε(
rrep
rij
)12 (6) ontains repulsive pairwise intera tions between other pairs of residues, inorder to ensure the self-avoidan e of the hain.5

The hain ontains N residues. li is the length of virtual bond i, θi is abond angle, φi is a dihedral angle and rij is the distan e between two residuesi and j. The orresponding values in the native stru ture are li0, θi
0, φi0 and
rij0 . The range rrep of the repulsive potential between pairs of residues thatare not bonded and do not intera t via a native onta t intera tion is set to4 Å. Length is expressed in units of Å, and energy in units of ε, the energyparameter of the nonnative repulsive intera tion, so that ε itself is unity. kl,
εθ, ε(1)φ , ε
(3)φ and εnative are also parameters of the potential energy fun tion.
kl is �xed at 100ε/Å, but the other parameters an be varied; εθ = 20ε(1)φand ε
(3)φ = 0.5ε
(1)φ are de�ned in terms of ε
(1)φ , whi h an be varied to testthe e�e t of hanging the strength of the lo al intera tions, while εnative analso be varied (see below) in order to test the e�e t of hanging the strengthof the non-lo al intera tions. The energy of the system is thus ontrolled bythree parameters ε, εnative and ε
(1)φ . All intera tion parameters are taken tobe temperature independent in the present study.Apart from the variable parameters, this energy fun tion di�ers from thesimilar fun tion used in [8, 10, 30℄ in two further important ways, as follows.(1) For rij/rij
0 <√
5/6, we set εnative = ε, while for rij/rij0 ≥
√
5/6, weset εnative = εa. Then we an vary the native intera tion parameter εa, inorder to test the e�e t of hanging the strength of the non-bonded attra tiveintera tions between residues, while the short-range repulsive part of Vnativemaintains the self-avoidan e of the hain. (2) The value q, whi h is thesmallest number of pla es along the hain by whi h two residues an beseparated if they are to intera t by Vnonnative, an be set either to q = 4 (inorder to eliminate any double ounting of lo al intera tions, in situationswhere ε(1)φ is not being varied) or to q = 2 (in order to allow ε
(1)φ to de reasewithout ompromising the self-avoidan e of the hain).The equation of motion of ea h residue is
m∂vi(t)
∂t= F i
conf(t) − mγvi(t) + ηi(t), (7)where m is the mass of a residue (set to unity), γ is the oe� ient of fri tion,t is time, and vi(t), F i
conf(t) and ηi(t) represent ea h of the three omponentsof the velo ity, onformational for e and random for e, respe tively [32℄. Therandom for e is given byηi(t) =
√
2mγkBT
δtξi, (8)6

where δt is the integration time step and ξi is a random variable taken froma Gaussian distribution with zero mean and unit varian e. The most appro-priate time s ale an be estimated [32℄ by τ =√
m0a20/ε0, where m0, a0 and
ε0 are the mass, length and energy s ales, respe tively. We set m0 = m = 1,ε0 = ε = 1 and a0 = 4 Å(the latter is approximately the length of a virtualbond between two residues and is also the range rrep of the repulsive intera -tion), and so τ = 4. We de�ne the integration time step δt = 0.005τ and the oe� ient of fri tion γ = 0.05τ−1 in terms of this time s ale. The velo ity-verlet algorithm [8, 32, 33℄ is used to integrate the equations of motion.2.2 Latti e modelsThe latti e models onsidered here are 27mers with a maximally ompa t na-tive (ground-state) onformation. Details of the models have been des ribedelsewhere [34, 35℄. We ompare three native- entri intera tion s enarioswhi h have varying degrees, and di�erent me hanisms, of thermodynami ooperativity. As an example of a parti ular native onformation to whi hthese three s enarios an be applied, we hoose the one in Ref. [35℄ with rel-ative onta t order 0.410. In s enario (i), whi h orresponds to the ommonGo model, the native onta t intera tions are pairwise additive. In s enario(ii), we add an extra favorable energy Egs for the native stru ture as a whole(as de�ned by equation 5 in Ref. [34℄). S enario (iii) introdu es, in pla eof the extra favorable energy, a oupling between the strength of the on-ta t intera tion and the lo al geometry: two residues whi h are in onta t inthe native state will intera t strongly only when the lo al geometries of theprotein hain around the residues are the same as those in the native state,as des ribed in Ref. [35℄. We hara terize this me hanism as lo al-nonlo al oupling or �a ooperative interplay between favorable nonlo al intera tionsand lo al onformational preferen es� [35℄. In this s enario, the strength ofthe native onta t intera tion is redu ed by an attenuation fa tor a when thelo al geometry is nonnative. The ommon (un oupled) Go model is equiva-lent to a = 1 (no attenuation), while a = 0 implies omplete oupling; a = 0is used here. Under s enarios (i) and (iii), the native state has an energy of−28 units, while the extra favorable native energy in s enario (ii) hangesthe energy of the native state to −42 units. Standard Monte Carlo methodsare used for onformational sampling [34,35℄. The permitted hain moves areend �ips, orner �ips, rankshafts and rigid rotations. Ea h attempted moveis ounted as one simulation time step, irrespe tive of whether the move is7

a epted by the Metropolis riterion.3 Thermodynami sAll simulations are performed at onstant temperature, with no expli it on-sideration of pressure. This is be ause the fo us of the present study isprotein behavior under atmospheri pressure, and the ontribution of a PVterm to protein energeti s is small under these onditions [4℄. Therefore, forour present purposes, we an onsider the Helmholtz and Gibbs free energiesto be equivalent.3.1 Cal ulation of the heat apa ityThe spe i� heat apa ity CV (T ) of the model protein is given by the stan-dard relationCV (T ) =
1
kBT 2
[⟨
E2(T )⟩
− 〈E(T )〉2]
, (9)where kBT is the Boltzmann onstant multiplied by the absolute tempera-ture, 〈X(T )〉 denotes the Boltzmann average of quantity X at temperatureT , and the total energy E is the sum V +EK of potential and kineti energies.We ompute the averages by standard histogram sampling te hniques [8,10℄.In latti e studies, the kineti energy EK is not treated. Therefore, E inEq. (9) has traditionally been taken, in protein modeling, to be the potentialenergy term V . This pro edure has often been extended to ontinuum modelstudies, in Ref. [8℄ for example, although EK is a essible and well-de�nedin o�-latti e models. However, 〈E2〉 − 〈E〉2 6= 〈V 2〉 − 〈V 〉2 in general. Thetwo quantities would be equal if EK were a onstant, but that would beunphysi al. In this study, we have al ulated CV (T ) using Eq. (9) both withE = V +EK and with the substitution E → V . The results are not identi al:an example is given in Fig. 1.Fig. 1 shows that the di�eren e between heat apa ity values obtainedusing the two methods is small around the transition midpoint Tm. Thisis be ause any energy added to the system during the unfolding transition ontributes mostly to the potential rather than to the kineti energy. The dif-feren e is less negligible for the �shoulders� on either side of the heat apa itypeak. At very low temperatures, in luding the kineti energy ontribution8

an lead to a smaller heat apa ity, be ause the mole ule at this tempera-ture is in a relatively �xed state: nearly all of the kineti energy is a ountedfor by the os illation of pairs of residues about the minima of their mutual(bonded or non-bonded) intera tion energies. The potential energy and thekineti energy asso iated with these os illations both �u tuate, but their sum�u tuates mu h less, and so the �u tuations in total energy are smaller thanthe �u tuations in potential energy, with the result that the al ulated heat apa ity is smaller when EK is taken into a ount. Overall, Fig. 1 indi atesthat while the di�eren e between the heat apa ities al ulated using thetwo di�erent methods is not negligible, it is not drasti . Probably this isbe ause EK , while not invariant, �u tuates mu h less than V . For this rea-son, we do not expe t on lusions drawn from previous al ulations of heat apa ities [8℄, whi h used V , to be hanged greatly by al ulations usingE. Nonetheless, we do expe t a proper a ount of the kineti ontributionsto protein heat apa ities to be important in addressing the ontribution ofbond ve tor motions to the heat apa ity [36℄.Sin e the PV term is negle ted in the present formulation, CV (T ) ise�e tively equal to CP (T ), whi h is generally measured by alorimetry (andwhi h an be expressed in a form similar to Eq. (9), but with the enthalpyH taking the pla e of the energy E [4, 5℄). Therefore, we may refer to thequantity omputed using Eq. (9) simply as heat apa ity. All subsequent heat apa ity urves shown in this arti le for the ontinuum models are obtainedusing the total energy E = V + EK .3.2 The free energyThe Helmholtz free energy of the model system is F (T ) = −kBT ln Z(T ),where Z(T ) is the partition fun tion at temperature T . It follows that, inthe vi inity of the simulation temperature Tsim, the Helmholtz free energy ofthe model system at temperature T , relative to its value at the simulationtemperature, may be approximated using the formula:∆F (T )
kBT=
F (T )
kBT−
F (Tsim)
kBTsim= − ln
{
∑
i
p(Ei; Tsim) exp(
Ei
[
1
kBTsim−
1
kBT
])
}
,(10)where the sum is performed over sets of mi rostates in di�erent energy rangesEi. p(Ei; Tsim) is the probability density at the simulation temperature, andis estimated dire tly from the Langevin dynami s simulations.9

The inset of Fig. 1 provides an example of ∆F (T ), showing that the gra-dient of the free energy with respe t to T hanges rather abruptly aroundthe transition temperature Tm (verti al dotted lines). The transition tem-perature Tm orresponds to the temperature at the peak of the heat apa ity urve, whi h was denoted by Tmax in Ref. [5℄. Apparently, below Tm, thesystem spends most time in states in the vi inity of the bottom of the nativebasin, and so the hanges in F with respe t to temperature are dominatedby the behavior of these states. However, as the temperature in reases pastTm, the system, and therefore the rate of hange of F (T ), starts to be dom-inated by states near the bottom of the denatured basin. As a result, thegradient of F (T ) hanges rather suddenly at Tm. While the F (T ) gradient ould never be dis ontinuous be ause the model system is �nite, the kink atTm does indi ate that the transition is two-state-like, and therefore that it issimilar to a �rst order phase transition.3.3 Thermodynami ooperativityThe presen e of a peak in the heat apa ity at a transition temperatureTm, as in Fig. 1, indi ates that the folding/unfolding transition possessesa degree of thermodynami ooperativity. As our group has argued, thedegree of thermodynami ooperativity in protein models an be quanti�edby the ratio κ2 = ∆HvH/∆Hcal of the van't Ho� enthalpy ∆HvH to the alorimetri enthalpy ∆Hcal of the transition. This ratio is losely related tothat determined experimentally by di�erential s anning alorimetry [37℄. Inmodel studies, the alorimetri enthalpy ∆Hcal may be determined from anintegral of the heat apa ity a ross the transition region,
∆Hcal =∫
dTCP (T ), (11)while the van't Ho� enthalpy is equal to twi e the maximum standard devi-ation of the enthalpy distribution at the transition midpoint,∆HvH = 2
√
kBT 2mCmax
P , (12)where CmaxP is the peak value of the heat apa ity. We have followed standardusage in this se tion by expressing κ2 in terms of H and CP . However, asmentioned in the previous se tion, simulations produ e values for E and CV ,whi h for the present appli ation are essentially equivalent to H and CP .10

As has been pointed out [5℄, omparison of simulation heat apa ity s ansto experiment is often ompli ated by the fa t that the heat apa ity tailswhi h we observe in simulations would, if they o urred in a real system, beswamped by the solvent ontribution and ignored by the ommon pro edureof using empiri al baseline subtra tion to al ulate ∆HvH/∆Hcal. In otherwords, tail ontributions that arise from onformational transitions may bemasked by solvent ontributions in real data analysis [5, 7℄. Therefore, for ompleteness, we also perform empiri al baseline subtra tions on our simu-lated heat apa ity s ans, produ ing a revised ratio κ(s)2 (de�ned in Ref. [5℄)to fa ilitate omparison with experiment.3.4 Radius of gyrationThe radius of gyration Rg of a parti ular onformation of the protein is anindi ator of its ompa tness. It is de�ned by
R2g =
1
N
N∑
i=1
|ri − 〈r〉|2 , (13)where N is the number of residues, ri is the position of the ith residue,and 〈r〉 is the average position ( entroid) of the given onformation. TheBoltzmann average 〈Rg〉 =⟨√
R2g
⟩ over a given onformational ensemble isobtained by standard histogram te hniques. Two-state-like behavior requiresa steplike sigmoidal hange in 〈Rg〉 upon denaturation at Tm, with littlepostdenaturational expansion of the hain [5℄.4 Results and dis ussionTo study the e�e t of lo al vs. nonlo al intera tions, we �rst vary the strengthε(1)φ of the lo al intera tions while keeping the strength of the nonlo al in-tera tions �xed in the ontinuum CI2 onstru t (Figs. 2, 3). The heat a-pa ity s ans, for four s enarios (four models) with di�erent values for ε
(1)φ ,are shown in Fig. 2. They all exhibit a fairly sharp peak ex ept for themodel with ε
(1)φ = 0.25. The heat apa ity peak signi�es substantial heatabsorption within a narrow temperature range at the folding/unfolding tran-sition. The absorbed energy propels the hain from its low-energy folded onformations (native ensemble) to its high-energy unfolded onformations11
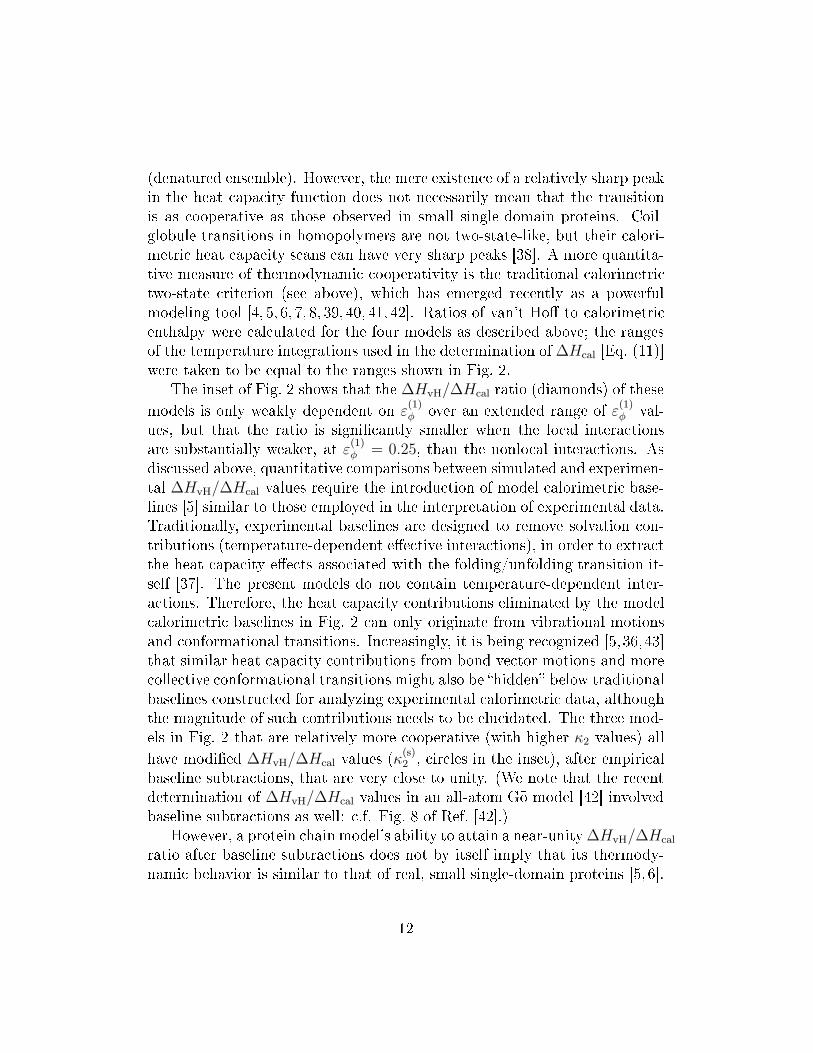
(denatured ensemble). However, the mere existen e of a relatively sharp peakin the heat apa ity fun tion does not ne essarily mean that the transitionis as ooperative as those observed in small single-domain proteins. Coil-globule transitions in homopolymers are not two-state-like, but their alori-metri heat apa ity s ans an have very sharp peaks [38℄. A more quantita-tive measure of thermodynami ooperativity is the traditional alorimetri two-state riterion (see above), whi h has emerged re ently as a powerfulmodeling tool [4, 5, 6, 7, 8, 39, 40, 41, 42℄. Ratios of van't Ho� to alorimetri enthalpy were al ulated for the four models as des ribed above; the rangesof the temperature integrations used in the determination of ∆Hcal [Eq. (11)℄were taken to be equal to the ranges shown in Fig. 2.The inset of Fig. 2 shows that the ∆HvH/∆Hcal ratio (diamonds) of thesemodels is only weakly dependent on ε(1)φ over an extended range of ε
(1)φ val-ues, but that the ratio is signi� antly smaller when the lo al intera tionsare substantially weaker, at ε
(1)φ = 0.25, than the nonlo al intera tions. Asdis ussed above, quantitative omparisons between simulated and experimen-tal ∆HvH/∆Hcal values require the introdu tion of model alorimetri base-lines [5℄ similar to those employed in the interpretation of experimental data.Traditionally, experimental baselines are designed to remove solvation on-tributions (temperature-dependent e�e tive intera tions), in order to extra tthe heat apa ity e�e ts asso iated with the folding/unfolding transition it-self [37℄. The present models do not ontain temperature-dependent inter-a tions. Therefore, the heat apa ity ontributions eliminated by the model alorimetri baselines in Fig. 2 an only originate from vibrational motionsand onformational transitions. In reasingly, it is being re ognized [5,36,43℄that similar heat apa ity ontributions from bond ve tor motions and more olle tive onformational transitions might also be �hidden� below traditionalbaselines onstru ted for analyzing experimental alorimetri data, althoughthe magnitude of su h ontributions needs to be elu idated. The three mod-els in Fig. 2 that are relatively more ooperative (with higher κ2 values) allhave modi�ed ∆HvH/∆Hcal values (κ(s)
2 , ir les in the inset), after empiri albaseline subtra tions, that are very lose to unity. (We note that the re entdetermination of ∆HvH/∆Hcal values in an all-atom Go model [42℄ involvedbaseline subtra tions as well: .f. Fig. 8 of Ref. [42℄.)However, a protein hain model's ability to attain a near-unity∆HvH/∆Hcalratio after baseline subtra tions does not by itself imply that its thermody-nami behavior is similar to that of real, small single-domain proteins [5, 6℄.12

This is be ause the heat apa ity ontributions dis arded by ertain baselines an a tually be symptoms of signi� ant deviations from two-state-like behav-ior. It has been re ognized [5℄ that, to larify this situation, we an use thebehavior of the average radius of gyration 〈Rg〉 of a protein hain model as anadditional evaluation riterion for the model's thermodynami ooperativity.Small angle X-ray s attering (SAXS) experiments have demonstrated thatthe average radius of gyration 〈Rg〉 of several small single-domain proteinsbehaves in an apparently two-state manner [44, 45, 46℄, showing very littlepostdenaturational (T > Tm) expansion of the hain outside the transitionregime that orresponds to the region of the heat apa ity peak. We require hain models of small single-domain proteins to exhibit similar behavior [5℄.Now, to further assess the four models in Fig. 2 with di�erent lo al intera -tion strengths, we al ulate their average radii of gyration as a fun tion oftemperature (Fig. 3). To ensure adequate sampling, 〈Rg〉 for ea h model isobtained from three di�erent simulation temperatures; the results are thusdisplayed as three dis ontinuous urves. Despite some minor dis repan ies(owing to sampling un ertainties) between parts of the 〈Rg〉 fun tion dedu edfrom di�erent simulation temperatures for the ε(1)φ = 0.25 ase, the generaltrend in Fig. 3 is very lear. Models with weaker lo al intera tions are less ooperative in that their 〈Rg〉 urves show more postdenaturational in reasethan do those of models having stronger lo al intera tions. For instan e,the 〈Rg〉 of the ε
(1)φ = 0.25 model in reases by ≈ 3.0 Å between T ≈ 0.82(the end of the transition region) and T ≈ 1.11. In ontrast, a similar tem-perature in rease for the ε
(1)φ = 1.00 model from T ≈ 1.11 (the end of thetransition region) to T ≈ 1.40 leads to an in rease of only ≈ 1.6 Å in 〈Rg〉.These observations indi ate that two-state-like thermodynami ooperativ-ity annot be a hieved if the lo al onformational propensities of a proteinare mu h weaker than the favorable nonlo al intera tions. This on�rms asimilar on lusion whi h was derived re ently from a more limited study ofa � onta t dominant model� [8℄.We next extend our analysis by applying the same omputational pro e-dure to varying the strength εa of the favorable nonlo al intera tions whilekeeping the strength of the lo al intera tions �xed. Consistent with the sem-inal study of Go and Taketomi [20℄, Figs. 4 and 5 show that variations innonlo al εa have a more prominent e�e t on thermodynami ooperativitythan variations in lo al ε(1)
φ . While the peak heat apa ity values for the threemodels in Fig. 2 with ε(1)φ ≥ 0.5 are similar, the peak heat apa ity values for13

the three models in Fig. 4 with εa ≥ 0.5 show a signi� ant monotoni in reasewith εa. In addition, for the εa = 0.5 model in Fig. 4, the di�eren e betweenunity and the ∆HvH/∆Hcal ratio after baseline subtra tion is not negligible(κ(s)2 = 0.91). Despite these di�eren es, the trends in Figs. 4, 5 are in largemeasure similar to those in Figs. 2, 3. In parti ular, Fig. 4 shows that themodel with εa = 0.25, like the ε
(1)φ = 0.25 ase in Fig. 2, has a signi� antlylower ∆HvH/∆Hcal ratio than the other three models onsidered in the same�gure. The 〈Rg〉 data in Fig. 5 shows that thermodynami ooperativityin reases with εa, as manifested in a smaller amount of postdenaturational onformational expansion with in reasing εa; this is omparable to the e�e tof in reasing ε
(1)φ in Fig. 3. Taken together, the results in Figs. 2�5 suggestthat a high degree of thermodynami ooperativity, similar to that in real,small single-domain proteins, requires both strong lo al and strong nonlo alintera tions. Apparently, a high degree of thermodynami ooperativity isin ompatible with either a mu h weakened lo al onformational preferen erelative to the favorable nonlo al intera tions (ε(1)
φ ≪ εa) or mu h weakenedfavorable nonlo al intera tions relative to the lo al onformational preferen e(εa ≪ ε(1)φ ).Although three-dimensional Go-like models with strong lo al and nonlo- al intera tions appear to satisfy the thermodynami riterion of alorimetri two-state ooperativity, it has re ently been noted that they are unable toprodu e simple two-state folding/unfolding kineti s [7,8℄. This is be ause thethermodynami ooperativity of these models is not su� iently high. As a re-sult, and in spite of the native- entri nature of the ommon pairwise additiveGo-like intera tions, kineti trapping be omes signi� ant under strongly na-tive onditions, leading to folding rate slow-downs and hevron rollovers [19℄.More re ent latti e model investigations indi ate that simple two-state fold-ing/unfolding kineti s require a high degree of thermodynami ooperativitythat may be hara terized as �near-Levinthal� [34℄, ne essitating many-bodyintera tions beyond those postulated by the ommon Go model [34, 35℄.In view of this re ent development, and to fa ilitate the onstru tion andinvestigation of ontinuum models that in orporate these new ideas, it is in-stru tive to ompare in more detail the thermodynami behavior of the om-mon latti e Go onstru t (with only pairwise additive onta t energies) withthe behavior of models whi h have many-body intera tions and enhan ed ooperativity. We also wish to investigate whether results obtained fromlatti e models supply additional support for the on lusions whi h we have14

derived from our ontinuum model results. To this end, Figs. 6�8 omparethree 27mer latti e models.Be ause of their intrinsi restri tions on onformational possibilities, itis more straightforward to onstru t ooperative latti e models than to on-stru t o�-latti e ontinuum models that are similarly ooperative. Re ently,using eviden e from kineti simulations of hevron plots, our group has pro-posed that a ∆HvH/∆Hcal ratio of κ2 > 0.9 before baseline subtra tions [asfor models (ii) and (iii) in Fig. 6a℄ is likely to be required in order for a latti eprotein hain model to produ e hevron plots with linear regimes similar inextent to those observed for real, small single-domain proteins [34℄. However,this numeri al riterion is not readily generalizable to o�-latti e ontinuummodels. This is be ause the heat apa ity e�e ts of bond vibrations andkineti energy have to be taken into a ount in ontinuum models, whereasthese e�e ts are absent in latti e models. Thus, in the hara terization ofa model's thermodynami ooperativity, more detailed information on ern-ing, for example, the behavior of the average radius of gyration, has to berelied upon more heavily for ontinuous models (see above) than for latti emodels.For the three latti e models studied here, the 〈Rg〉 plots in Fig. 6b showthat, while the postdenaturational onformational expansion of the ommonlatti e Go onstru t (solid urve in Fig. 6b) is onsiderably milder than thatof its ontinuum ounterpart (solid urves in Figs. 3, 5), the more ooper-ative latti e models with many-body intera tions exhibit mu h less (dotted urve in Fig. 6b) or nearly non-existent (dashed urve in Fig. 6b) postdenat-urational onformational expansion. The �u tuations in E and Rg near thetransition midpoint, shown in Figs. 7 and 8, indi ate further that the tran-sitions between the native and denatured ensembles are sharper and moretwo-state-like for the more ooperative models (ii) and (iii) with many-bodyintera tions [parts (b) and ( ) of Figs. 7, 8℄ than for the ommon Go model[parts (a) of Figs. 7, 8℄. The orresponding �u tuations in the fra tionalnumber of native onta ts Q [34, 35℄ (data not shown) were also found toexhibit a trend very similar to that of the energy �u tuations in Fig. 7.The latti e model results, shown in Figs. 6�8, are ompatible with the on- lusion, rea hed above on the basis of ontinuum model results, that bothlo al and nonlo al intera tions are important for thermodynami oopera-tivity. The ommon latti e Go model of s enario (i) in ludes only nonlo alintera tions, analogous to the intera tions en oded by Vnative in the o�-latti emodel. S enario (iii), whi h takes a ount also of the lo al geometry of the15
hain, displays greater ooperativity than s enario (i).Higher resolution data su h as that in Figs. 7 and 8 opens up future av-enues for the assessment of di�erent me hanisms of ooperativity using om-parisons between model predi tions and experimental measurements of, forexample, onformational sizes and �u tuations [47, 48, 49℄. It is noteworthythat in the model (ii) s enario, with an extra favorable energy for the nativestru ture as a whole, the native ensemble does not exhibit mu h energeti or onformational variation (horizontal line segments at low E and low Rg val-ues in Figs. 7b and 8b). On the other hand, in the model (iii) s enario withlo al-nonlo al oupling, there is onsiderable variation in the native ensemble( .f. low E and low Rg �u tuations in Figs. 7 and 8 ). Yet the variation inthe denatured ensemble is smaller in model (iii) than in model (ii) ( .f. highE and high Rg �u tuations in parts (b) and ( ) of Figs. 7, 8), resulting ina more two-state-like average 〈Rg〉 transition for model (iii) than for model(ii), manifested in a near-immediate postdenaturational (T > Tm) saturationof the dashed urve for model (iii) in Fig. 6b ompared to a more gradualpostdenaturational saturation of the dotted urve for model (ii) in the same�gure. All these di�eren es in onformational properties are in prin iple de-te table through experiments on real proteins. Hen e, future experimentale�orts along the lines suggested here would help to verify or falsify di�erentproposed s enarios and intera tion me hanisms [34,35,50,51℄ in the endeavorto de ipher the physi al origins of ooperativity in real proteins.5 Con lusionsThe present study suggests strongly that both lo al onformational prefer-en es and favorable nonlo al intera tions are ru ial to protein thermody-nami ooperativity. This result points to a useful onstraint on simpli�edmodels of protein mole ules: they should take a ount both of lo al and ofnonlo al intera tions.As emphasized above, the s ope of the present study is limited. Onlynative- entri intera tion s hemes are onsidered; and here we have ele tedonly one parti ular physi ally plausible way to lassify energy ontributionsinto �lo al� and �nonlo al� terms in the ontinuum models. In addition,by using a native- entri intera tion s heme both for lo al and for nonlo alintera tions, we have avoided the possibility of energeti frustration, whi hmight be signi� ant if a more realisti intera tion s heme were used [52,16

53℄. To further elu idate the answers to the questions we have posed, mu hremains to be investigated.Nonetheless, our results show learly that a high degree of thermodynami ooperativity is ompatible neither with a mu h weakened lo al intera tionnor with a mu h weakened nonlo al intera tion, indi ating that both lo aland nonlo al intera tions are important omponents in protein energeti s[54℄. This �nding is onsistent with the notion that a ooperative interplaybetween lo al and nonlo al intera tions [4, 6, 7, 34, 35℄ is a riti al ingredientunderlying the apparent simple two-state ooperativity of real, small single-domain proteins.With regard to Go-like native- entri modeling (see, e.g., dis ussion inRefs. [8, 10, 11, 55, 56, 57℄), we observe that signi� ant di�eren es in modelpredi tions an result from di�erent Go-like intera tion s hemes, even thoughall of the s hemes are designed to bias the hain towards the same nativestru ture. This unders ores our point that requiring a onsistent a ountof ooperativity an be a more produ tive approa h to protein modelingthan simply designing a model heteropolymer to fold to a target stru ture[8℄. In this ontext, the present oarse-grained representations onstituteonly a �rst step in the understanding of protein ooperativity. Ultimately,atomisti origins of lo al and nonlo al intera tions su h as side hain pa king[58,59,60,61℄ must be taken into a ount in an e�ort to provide the ne essaryphysi al underpinning for the ooperative me hanisms proposed here.A knowledgmentsThe resear h reported here was partially supported by the Canadian Insti-tutes of Health Resear h (CIHR grant no. MOP-15323), PENCE, a Premier'sResear h Ex ellen e Award from the Provin e of Ontario, and the OntarioCentre for Genomi Computing at the Hospital for Si k Children in Toronto.H. S. C. holds a Canada Resear h Chair in Bio hemistry.17

Referen es[1℄ Chan HS, Kaya H, Shimizu S. In: Jiang T, Xu Y, Zhang MQ, editors.Current Topi s in Computational Mole ular Biology. Cambridge, MA:The MIT Press; 2002. p 403�447.[2℄ Ja kson SE, Fersht AR. Bio hemistry 1991;30:10428�10435.[3℄ Baker D. Nature 2000;405:39�42.[4℄ Chan HS. Proteins 2000;40:543�571.[5℄ Kaya H, Chan HS. Proteins 2000;40:637�661 [Erratum: Proteins2001;43:523℄.[6℄ Kaya H, Chan HS. Phys Rev Lett 2000;85:4823�4826.[7℄ Kaya H, Chan HS. J Mol Biol 2002;315:899�909.[8℄ Kaya H, Chan HS. J Mol Biol 2003;326:911�931.[9℄ Taketomi H, Ueda Y, Go N. Int J Pept Protein Res 1975;7:445�459.[10℄ Clementi C, Nymeyer H, Onu hi JN. J Mol Biol 2000;298:937�953.[11℄ Mi heletti C, Banavar JR, Maritan A, Seno F. Phys Rev Lett1999;82:3372�3375.[12℄ Zhou Y, Karplus M. Nature 1999;401:400�403.[13℄ Portman JJ, Takada S, Wolynes PG. J Chem Phys 2001;114:5082�5096.[14℄ Haliloglu T, Bahar I, Erman B. Phys Rev Lett 1997;79:3090�3093.[15℄ Keskin O, Bahar I, Flatow D, Covell DG, Jernigan RL. Bio hemistry2002;41:491�501.[16℄ Isin B, Doruker P, Bahar I. Biophys J 2002;82:569�581.[17℄ Mi heletti C, Lattanzi G, Maritan A. J Mol Biol 2002;321:909�921.[18℄ Ja obs DJ, Radar AJ, Kuhn LA, Thorpe MF. Proteins 2001;44:150�165.[19℄ Kaya H, Chan HS. Phys Rev Lett 2003;90:258104.18

[20℄ Go N, Taketomi H. Pro Natl A ad S i USA 1978;75:559�563.[21℄ Dill KA. Bio hemistry 1990;29:7133�7155.[22℄ Abkevi h VI, Gutin AM, Shakhnovi h EI. J Mol Biol 1995:252:460�471.[23℄ Chan HS. Nature 1998;392:761�763.[24℄ Baldwin RL, Rose GD. Trends Bio hem S i 1999;24:26�33.[25℄ Portman JJ, Takada S, Wolynes PG. J Chem Phys 2001;114:5069�5081.[26℄ de Gennes PG. J Phys Lett (Paris) 1975;36:L55�L57.[27℄ Donia h S, Garel T, Orland H. J Chem Phys 1996;105:1601�1608.[28℄ Bastolla U, Grassberger P. J Stat Phys 1997;89:1061�1078.[29℄ Doye JPK, Sear RP, Frenkel D. J Chem Phys 1998;108:2134�2142.[30℄ Koga N, Takada S. J Mol Biol 2001;313:171�180.[31℄ Brant DA, Miller WG, Flory PJ. J Mol Biol 1967;23:47�65.[32℄ Veitshans T, Klimov D, Thirumalai D. Fold Des 1997:2:1�22.[33℄ Allen MP, Tildesley DJ. Computer Simulation of Liquids. Oxford: TheOxford University Press; 1987.[34℄ Kaya H, Chan HS, Proteins 2003; in press.[35℄ Kaya H, Chan HS, Proteins 2003; in press.[36℄ Yang D, Mok YK, Forman-Kay JD, Farrow NA, Kay LE. J Mol Biol1997;272:790�804.[37℄ Privalov PL, Khe hinashvili NN. J Mol Biol 1974;86:665�684.[38℄ Tiktopulo EI, By hkova VE, Ri£ka J, Ptitsyn OB. Ma romole ules1994;27:2879�2882.[39℄ Crippen GM, Chhadjer M. J Chem Phys 2002;116:2261�2268.[40℄ Jang H, Hall, CK, Zhou Y. Biophys J 2002;82:646�659.19

[41℄ Pokarowski P, Kolinski A, Skolni k J. Biophys J 2003;84:1518�1526.[42℄ Clementi C, Gar ia AE, Onu hi JN. J Mol Biol 2003;326:933�954.[43℄ Dragan AI, Privalov PL. J Mol Biol 2002;321:891�908.[44℄ Sosni k TR, Trewhella J. Bio hemistry 1992;31:8329�8335.[45℄ Hagihara Y, Hoshino M, Hamada D, Kataoka M, Goto Y. Fold Des1998;3:195�201.[46℄ Millet IS, Townsley LE, Chiti F, Donia h S, Plax o KW. Bio hemistry2002;41:321�325.[47℄ Choy WY, Mulder FAA, Crowhurst KA, Muhandiram DR, Millett IS,Donia h S, Forman-Kay JD, Kay LE. J Mol Biol 2002;316:101�112.[48℄ Shimizu S, Chan HS. Proteins 2002;49:560�566.[49℄ Goldenberg DP. J Mol Biol 2003;326:1615�1633.[50℄ Jewett AI, Pande VS, Plax o KW. J Mol Biol 2003;326:247�253.[51℄ Chan HS, Shimizu S, Kaya H. Methods Enzymol 2003: in press.[52℄ Vendrus olo M, Pa i E. Curr Opin Stru t Biol 2003;13:82�87.[53℄ Head-Gordon T, Brown S. Curr Opin Stru t Biol 2003;13:160�167.[54℄ Uversky VN, Fink AL. FEBS Lett 2002;515:79�83.[55℄ Plotkin SS. Proteins 2001;45:337�345.[56℄ Cieplak M, Hoang TX. Int J Mod Phys C 2002;13:1231�1242.[57℄ Cieplak M, Hoang TX. Biophys J 2003;84:475�488.[58℄ Klimov DK, Thirumalai D. Fold Des 1998;3:127�139.[59℄ Li L, Shakhnovi h EI. Pro Natl A ad S i USA 2001;98:13014�13018.[60℄ Favrin G, Irbä k A, Wallin S. Proteins 2002;47:99�105.[61℄ Zhou Y, Linhananta A. J Chem Phys 2002;117:8983�8995.20

Figure CaptionsFIGURE 1Heat apa ity as a fun tion of temperature, for one parti ular set of in-tera tion parameters. Solid urve: heat apa ity al ulated using the totalenergy; dashed urve: heat apa ity al ulated using only the potential en-ergy. Parameters are ε(1)φ = 1.00, εa = 1.00, q = 4; simulation temperature
Tsim = 1.02. Inset: free energy as a fun tion of temperature, for the samemodel, showing a sharp hange in gradient around Tm. The verti al dottedlines in the �gure and the inset mark the transition midpoint temperature Tm.FIGURE 2Heat apa ity as a fun tion of temperature, for varying lo al intera -tion energy ε(1)φ . Other parameters εa = 1.00 and q = 2 are �xed. (Fromleft to right) dotted urve: ε
(1)φ = 0.25, Tm = 0.74; short dashed urve:
ε(1)φ = 0.50, Tm = 0.84; long dashed urve: ε
(1)φ = 0.75, Tm = 0.94; solid urve: ε
(1)φ = 1.00, Tm = 1.03. These s ans are obtained by histogramte hniques from simulations performed at Tsim = 0.73, 0.84, 0.94, and 1.03respe tively. The ∆HvH/∆Hcal ooperativity oe� ients κ2 without baselinesubtra tions are 0.33, 0.43, 0.44, and 0.44 respe tively. Modi�ed ooperativ-ity oe� ients κ
(s)2 after subtra tion of the baselines (indi ated by thin linesin the �gure) for ε
(1)φ = 0.50, 0.75, and 1.00 are 0.97, 0.98, and 0.99 respe -tively. No value for κ
(s)2 was al ulated for ε
(1)φ = 0.25 be ause the shape ofits heat apa ity urve does not suggest any lear hoi e of baselines that areintuitively more reasonable than others. The inset shows κ2 (diamonds) and
κ(s)2 ( ir les) as fun tions of ε
(1)φ .FIGURE 3Average radius of gyration as a fun tion of temperature, for varying lo alintera tion energy ε
(1)φ ; other parameters εa = 1.00 and q = 2 are �xed, asin Fig. 2. The orresponden e between line styles and ε
(1)φ values is identi alto that in Fig. 2. For ea h value of ε
(1)φ , simulations were performed at threedi�erent values of Tsim to ensure adequate sampling a ross the entire tem-perature range shown. (From left to right) for ε
(1)φ = 0.25 (dotted urves),
Tsim = 0.73, 0.93, 1.13; for ε(1)φ = 0.50 (short dashed urves), Tsim = 0.84,
1.04, 1.24; for ε(1)φ = 0.75 (long dashed urves), Tsim = 0.94, 1.14, 1.34; and21

for ε(1)φ = 1.00 (solid urves), Tsim = 1.03, 1.23, and 1.43.FIGURE 4Heat apa ity as a fun tion of temperature, for varying nonlo al intera -tion energy εa. Other parameters ε
(1)φ = 1.00 and q = 4 are �xed. (From leftto right) dotted urve: εa = 0.25, Tm = 0.43; short dashed urve: εa = 0.50,
Tm = 0.65; long dashed urve: εa = 0.75, Tm = 0.84; solid urve: εa = 1.00,Tm = 1.02. These s ans are obtained by histogram te hniques from sim-ulations performed at Tsim = 0.42, 0.64, 0.84, and 1.02 respe tively. The∆HvH/∆Hcal ooperativity oe� ients κ2 without baseline subtra tions are0.28, 0.40, 0.44, and 0.46 respe tively. Modi�ed ooperativity oe� ientsκ
(s)2 after subtra tion of the baselines (indi ated by thin lines in the �gure)for εa = 0.50, 0.75, and 1.00 are 0.91, 1.00, and 0.99 respe tively. No valuefor κ
(s)2 was al ulated for εa = 0.25 for the same reason that no κ
(s)2 wasprovided for ε
(1)φ = 0.25 in Fig. 2. The inset shows κ2 (diamonds) and κ
(s)2( ir les) as fun tions of εa.FIGURE 5Average radius of gyration as a fun tion of temperature, for varying non-lo al intera tion energy εa. Other parameters ε
(1)φ = 1.00 and q = 4 are�xed, as in Fig. 4. The orresponden e between line styles and εa values isidenti al to that in Fig. 4. For ea h value of εa, simulations were performedat three di�erent values of Tsim to ensure adequate sampling a ross the wholerange shown. (From left to right) for εa = 0.25 (dotted urves), Tsim = 0.42,
0.62, 0.82; for εa = 0.50 (short dashed urves), Tsim = 0.64, 0.84, 1.04; forεa = 0.75 (long dashed urves), Tsim = 0.84, 1.04, 1.24; and for εa = 1.00(solid urves), Tsim = 1.02, 1.22, and 1.42.FIGURE 6Thermodynami ooperativities of the three representative 27mer latti emodels des ribed in the text. Model de�nitions and simulation details aregiven in Refs. [29,30℄. Heat apa ity (a) and average radius of gyration (b)are determined by histogram te hniques based upon Monte Carlo samplingperformed at Tsim = Tm. (a) Heat apa ity of (i) the ommon Go modelwith pairwise additive onta t energy (solid urve, left); (ii) the model thatassigns an extra favorable energy to the native stru ture as a whole (dotted urve, right); and (iii) the model with lo al-nonlo al oupling (dashed urve,22

middle). The transition temperatures for the models are Tm = 0.701 (i),1.13 (ii), and 0.755 (iii). Their ∆HvH/∆Hcal without baseline subtra tionsare κ2 = 0.86, 0.98, and 0.99, and the orresponding ratios after subtra tingthe baselines shown are κ
(s)2 = 1.00, 1.00, and 1.00 respe tively. (b) Averageradius of gyration as a fun tion of model temperature for the three models[represented by the same line styles as in (a)℄.FIGURE 7Representative traje tories of the three models in Fig. 6 at their respe -tive transition temperatures. Variations in the potential energy of models(i)�(iii) are shown in (a)�( ) respe tively.FIGURE 8Same as Fig. 7, ex ept that variations in the radius of gyration are shownhere.
23

0.5 1.0 1.5T
0
1000
2000
3000
4000
heat
cap
acity
0.5 1.0 1.5T
−80
−40
0
40∆F
/kBT
Kno
tt et
al.,
Fig
. 1

0.5 1.0 1.5T
0
1000
2000
3000
4000
heat
cap
acity
0.5 1.0εφ
(1)
0.0
0.5
1.0
κ2
Kno
tt et
al.,
Fig
. 2

0.5 1.0 1.5T
10
15
20
<R
g>
Kno
tt et
al.,
Fig
. 3

0.5 1.0 1.5T
0
1000
2000
3000
4000
heat
cap
acity
0.5 1.0εa
0.0
0.5
1.0
κ2
Kno
tt et
al.,
Fig
. 4

0.0 0.5 1.0 1.5T
10
15
20
<R
g>
Kno
tt et
al.,
Fig
. 5

0.3 0.5 0.7 0.9 1.1 1.3 1.5T
1
1.5
2
2.5
<R
g>
0
100
200
300
400
heat
cap
acity
(a)
(b)
Knott et.al., Fig. 6

0 1e+09 2e+09t
−45
−30
−15
0
E
0 1e+09 2e+09−45
−30
−15
0
E
0 1e+07 2e+07 3e+07 4e+07 5e+07−45
−30
−15
0
E
(c)
(b)
(a)
Knott et al., Fig.7

0 1e+09 2e+09t
1
3
5
7
Rg
0 1e+09 2e+091
3
5
7
Rg
0 1e+07 2e+07 3e+07 4e+07 5e+071
3
5
7
Rg
(c)
(b)
(a)
Knott et al., Fig.8